Article

Spatiotemporal Evolution and Market Dynamics of the International Liquefied Natural Gas Trade: A Multilevel Network Analysis

1
School of Geography, Nanjing Normal University, Nanjing 210023, China
2
Jiangsu Center for Collaborative Innovation in Geographical Information Resource Development and Application, Nanjing 210023, China
3
Key Laboratory of Virtual Geographic Environment, Ministry of Education, Nanjing Normal University, Nanjing 210023, China
4
Institute of Geographic Sciences and Natural Resources Research, Chinese Academy of Sciences, Beijing 100101, China
5
College of Resource and Environment, University of Chinese Academy of Sciences, Beijing 100049, China
*
Author to whom correspondence should be addressed.
Energies 2024, 17(1), 228; https://doi.org/10.3390/en17010228
Submission received: 7 November 2023 / Revised: 23 December 2023 / Accepted: 28 December 2023 / Published: 31 December 2023
(This article belongs to the Section C: Energy Economics and Policy)

Abstract

:
Natural gas is considered a transitional energy source in the transition to clean energy owing to its clean, efficient, and ecologically beneficial properties. The trade of liquefied natural gas (LNG) serves as the backbone of the global natural gas trade and significantly influences the dynamics of the global energy trade system. This paper constructs long-term global LNG trade networks, and explores the spatiotemporal evolution and topological structures of the international LNG trade by utilizing multilevel network analysis methods, to provide insights for comprehensively understanding the market dynamics of the global LNG trade system. The findings indicate the following: (1) The global LNG trade volume shows an overall upward trend, and the global LNG trade network exhibits uneven spatial distribution, clear hierarchical differentiation, and an increasingly complicated structure. Global LNG trade is gradually changing from regionalization to globalization, and the international LNG market is undergoing structural reshaping. (2) The global LNG trade network continues to expand in size and density, and the rapidly growing LNG supply and trade relations are driving the formation of the global natural gas market. (3) Global LNG trade is still in a phase of rapid change, with the global efficiency of the network increasing and then decreasing. The trade network has traditionally been centered on ten countries, including Japan, South Korea, the United States, and Qatar. (4) The global LNG trade network exhibits clear core-periphery structures with considerable polarization effects, and the trade network structure is continuously evolving and is growing unbalanced. Finally, we put forward relevant policy suggestions to promote global LNG trade interconnectivity and enhance environmental protection and respond to global climate change.

1. Introduction

The “Paris Climate Agreement” and the global new energy revolution are changing the world’s energy structure, and the creation of a low-carbon society has been made the goal of all humankind [1]. Natural gas is frequently recognized as a transitional energy source in the shift from conventional energy to clean energy since it is a clean, efficient, and ecologically beneficial energy source [2,3]. Natural gas use is aggressively encouraged in developed nations as a strategy to lessen reliance on fossil fuels and as a key component of the policy to reduce carbon emissions. The natural gas trade has long been a significant component of the global energy trade system because of the unequal distribution and scarcity of resources. Liquefied natural gas (LNG) and pipeline natural gas (PNG) are currently the two main ways that natural gas is traded [4]. The increasing volume of global natural gas commerce has led to the growing popularity of LNG due to its advantages in flexibility, convenience, safety, stability, and investment savings, appealing to both the supply and demand sides of the natural gas market. While the trade market is more regional, the installation of pipeline infrastructure constrains PNG.
During the critical period when the world is facing the challenges of climate change and energy transformation, natural gas has a special role in the contemporary energy system, and the patterns of the global LNG trade networks continue to change. The global LNG market is undergoing significant changes, driven by the US shale gas revolution and a surpassing of the total PNG trade in 2020 [5,6]. This shift highlights the growing importance of LNG in the global natural gas market, necessitating a systematic understanding of its spatiotemporal evolution. The uneven distribution of natural gas and diverse transit options in the LNG market makes it vulnerable to pricing games, supply–demand fluctuations, and geopolitical concerns [7]. As a complex system involving numerous nations, the LNG trade market forms an intricate global network, with studies analyzing industry structure and influential factors providing valuable insights. The application of complex network analysis methods further enhances our understanding of energy trade flows and network structures, contributing to the comprehension of evolving energy trade patterns. However, gaps still exist in current research employing integrated multilevel network analysis methods to explore the spatiotemporal evolution, market dynamics, and structural connectivity of the global Liquified Natural Gas (LNG) trade system.
Based on the complex network theory, this study constructs the global LNG trade networks since 2000 and reveals the topological features of the global LNG trade network at macro, meso, and micro scales, to analyze the market dynamics of the global LNG trade deeply. The potential contributions can be summarized as follows: (1) We employ geovisualization techniques to depict and analyze the spatiotemporal patterns and evolutionary trends of the global LNG trade. (2) We comprehensively examine the connectivity of the global LNG trade networks from macro, meso, and micro perspectives, delving into network topological features. (3) This study provides a novel perspective for scientifically understanding the competition pattern and market dynamics of international LNG trade, offering useful references for countries worldwide to adjust and improve energy trade policies and energy security.

2. Literature Review

Along with the US shale gas revolution, the global LNG market landscape is undergoing significant spatial reconfiguration [5]. The global LNG trade scale surpassed the total PNG trade for the first time in 2020, which laterally demonstrates LNG’s growing significance in the global natural gas trade market [6] and breaks the natural gas market’s historical trend. Natural gas consumption and population have a long-running relationship with CO2 emissions [7] and there is a positive relationship between CO2 emissions and natural gas consumption, GDP, and population. According to the experience of G20 countries, renewable energy consumption and improved environmental quality enhance subjective wellbeing, while non-renewable energy consumption has a degrading effect [8]. For Asia, with cleaner properties than oil and coal, natural gas can be seen as an important bridge in the transition energy process towards a low-carbon economy in Asia [9]. Similarly, some studies suggest that natural gas is not entirely clean energy. Natural gas consumption will have a negative impact on CO2 emissions in the beginning, but will have only a modest impact on carbon emission reductions in the long run [10]. Therefore, revealing the spatiotemporal evolution and market pattern of the international LNG trade is significant for countries worldwide to integrate energy security and stable supply and promote green and low-carbon development methodically and systematically.
The increasing demand for the natural gas trade, coupled with its uneven geographical distribution, has propelled the development of the global natural gas market. Due to variable transit options, the LNG market is more vulnerable to the combined effects of pricing games, supply and demand, and geopolitical concerns [11,12]. The LNG trade market has developed into a complex system involving numerous nations and is interconnected [13]. The trade flows created by international trade cooperation, which spatially entwine to create an ever-expanding global trade network for LNG, are undoubtedly the most comprehensible structural manifestation of the market’s dynamic evolution. In this context, some studies have attempted to analyze the potential pattern and future development trend of the LNG trade market from the perspectives of industry structure, influencing factors, and trade prediction simulation, and the findings of these studies have been useful in understanding the dynamics of the LNG trade market [14,15,16].
As an emerging methodological system, complex network analysis methods provide an effective tool for portraying energy trade flows, and energy trade network research has gradually become an important research area. Some scholars depict the overall characteristics of LNG trade networks at the macro level, and analyze the overall structure of LNG trade networks using network metrics such as network density, centrality, and clustering coefficient [17,18]. Geng et al. analyzed the topological structures of the global natural gas trade and identified that the network has the characteristics of power law and cluster [19], speculating that LNG may become the mainstream form of the natural gas trade [19]. Similarly, it has been proved that LNG occupies more natural gas market share [20]. Li et al. investigated the evolution characteristics of the natural gas trade network along the “Belt and Road” (BRI) by using the network indicators and showed that there is an increasingly significant polarization effect in the BRI LNG trade network, and that the level of market monopoly is increasing [21]. Subsequently, scholars are no longer limited to a single portrayal of the overall LNG trade network, and network analysis methods such as community detection [22,23], core-periphery division [24,25], and link prediction [26] have also been used to explore the topological structure [27], the market competition pattern [28], and the prediction of the potential trade relations [29] of the LNG trade network, to deeply explore the pattern evolution of the trade network. Filimonova et al. constructed directed network diagrams of the LNG trade, where the global LNG trade network was divided into six subgroups, with Qatar having the richest potential links [27]. Chen et al. explored the competition pattern of the global LNG market and pointed out that the current competitive relationships in the LNG trade are increasing and tend to be globalized [28]. Jin et al. used an improved link prediction algorithm to predict the likelihood of potential relationships among trading countries in the global LNG trade network [30]. In addition, to express the global LNG trade flow more precisely, multisource data such as vessel movement and ports are beginning to be applied in the empirical analysis of LNG imports and exports by trading countries [31]. For example, Peng et al. revealed that the global LNG trade network is gradually centralized and has evolved into three trade zones dominated by Asia–Pacific, Europe, and the Americas [32].
In conclusion, research on the global natural gas trade network has grown popular, and related studies have examined the structural features, evolutionary trends, and potential patterns of the natural gas trade. However, relatively few studies focus on LNG trade flow data and analyzing the spatiotemporal evolution and development trend of the global LNG trade network over long time series scales. In addition, although complex network analysis methods are gradually being employed to analyze the changes in the global LNG trade market, most of the studies only stay at a single scale, and there is a relative lack of systematic research that comprehensively explores the spatiotemporal pat-terns and structural connectivity of the global LNG trade network by integrating multilevel network analysis perspectives. Therefore, to fill the gaps in the existing studies, this paper comprehensively integrates multilevel network analysis methods to examine the spatiotemporal evolution and market dynamics of the global LNG trade from the spatial and network perspectives and enrich overall knowledge and understanding of the global LNG trade system.

3. Materials and Methods

3.1. Data Processing

Trade data on bilateral liquefied natural gas flows are sourced from the World Integrated Trade Solution (WITS) database, for which the UN Comtrade Database is the original data source. The LNG trade flow’s Harmonized System (HS) code is 271111, encompassing petroleum gases and other gaseous hydrocarbons. Because import data are often more constrained than export data, import data were chosen for this investigation [33]. Given the volatility of LNG market prices, we chose to use trade weight as an indicator to characterize the size of trade relationships among countries. Finally, we constructed the global LNG trade networks between 215 countries and regions from 2000 to 2021. The removal of a minor amount of trade data that cannot be located or are missing will not impact the results.

3.2. Methods

3.2.1. Network Density

Network density stands as the most widely employed network indicator, quantifying the proximity of vertex relationships by comparing the number of edges to the theoretical maximum. It takes values in the range of 0 to 1. In a trade network, more trade linkages generally result in a higher total network density and, as a result, greater trade sizes. Conversely, a lower network density results in smaller trade sizes. The formula is defined as follows [34]:
D = 2 E N N 1  
where E is the number of edges connecting two vertices in the network, and N is the total number of network vertices.

3.2.2. Transitivity

Transitivity, known as the clustering coefficient, quantifies the likelihood of interconnected adjacent vertices. It can assess the presence of clusters in the overall network and applies to both undirected and directed networks. The calculation of transitivity is based on the triplets, and the formula is as follows [35]:
T = i ,   j , k = 1 N A i j A i k A j k i = 1 N k i k i 1
where k i is the vertex degree of vertex i in the network with the values of i as 1, …, N , and A i j are corresponding elements in the adjacency matrix.

3.2.3. Global Efficiency

Since disconnected nodes in the network result in infinitely long shortest paths between them, the shortest route length must typically be calculated in a specific connectivity graph. To solve this problem, global efficiency is proposed [36]. In a network, the global efficiency is quantified as the average of the inverse distances between all pairs of vertices, determined by the shortest path length. A shorter shortest path length indicates higher global efficiency and stronger network connectivity, as follows:
E g l o b = i , j N i j 1 d i j N N 1
where d i j is the number of edges of the shortest path between vertex i and vertex j in the network.

3.2.4. Weighted Degree Centrality

An unweighted network’s degree centrality does not take edge weights into account; however, a node that has several connections to another node should have higher edge weights and be more closely related. Later, the concept of centrality was expanded to weighted networks, and a node’s weighted node degree centrality was established as the total of all connected edges’ weights connected to that node [37], as follows:
W D C i = j N i W i , j
where N i is the set of neighbors of vertex i ; W i , j refers to the node strength, i.e., the sum of the weights of the linkages connected to that node, which in a trade network means the amount of trade between nodes i and j .

3.2.5. PageRank Centrality

As a variant of eigenvector centrality, PageRank centrality is based on a random walk model, specifically a first-order Markov chain, which simulates the behavior of a random walker navigating the nodes of a directed graph [38]. This model characterizes the random walker’s visits to each node within the directed graph. In the random walk process, when a node is transferred to all nodes connected by directed edges with equal probability, the transfer matrix is M , and this first-order Markov chain has a smooth distribution R [39]. The so-called smooth distribution also means that the transfer probability between the final nodes tends to be smooth, and the smooth distribution can be considered as a probability matrix obtained after the final convergence.
M R = R
At this point, the smooth distribution R is the PageRank value of the directed graph, and each component of R is the PageRank value of each vertex i :
R = P R 1 P R 2 P R i
where
P R i 0 , i = 1 , 2 , , N i = 1 N P R i = 1
The PageRank value of vertex i is the sum of the PageRank values of its connected edge vertexes:
P R i = d j M i P R j N j + 1 d N
where d is the damping factor to avoid the case of a final probability of zero, which generally takes the value of 0.85.

3.2.6. Core-Periphery Profile

The concept of a core-periphery structure, which delineates a network into a dense core and a sparse periphery, has garnered significant attention and expanded beyond its original scope [40]. While various algorithms have been proposed for identifying core-periphery structures in networks, many of them lack the capability to handle weighted networks and require robustness validation. In response to this limitation, Della Rossa et al. [41] introduced the core-periphery profile algorithm, which elucidates both the overarching network structures and the distinct roles played by specific nodes.
The largest subnetwork, designated as S, exhibiting the persistence probability α S α , aligns with an ideal core-periphery structure. To establish the core-periphery profile α k , k = 1, 2, …, n, we employ the following approach:
α k = min h N \ P k 1 i , j P k 1 h π i m i j i P k 1 h π i = min h N \ P k 1 i , j P k 1 π i m i j + i , j P k 1 ( π i m i h + π h m h i ) i P k 1 π i + π h
We initiate the selection process by choosing the node with the fewest connections, denoted as i, and subsequently establish a sequence of sets {1} = P1 ⊂ P2 ⊂ …⊂ Pn = N, where N = {1, 2, …, n} is all the nodes in the network. And k is the number of simulations; p i > 0 is the asymptotic probability of visiting node i, i.e., the fraction of time steps spent at that node; and m i j = w i j / h w i h is the value of the probability that node i randomly wanders to node j in each (discrete) time step. During this progression, we include the node that leads to the minimal increase in persistence probability. If it is not unique, a node h is randomly selected among the nodes with the minimum weight and the node with the strongest connection is added last. This iterative procedure culminates in the formation of the core-periphery profile, denoted by the sequence 0 = α 1 α 2 α n = 1 , which signifies the persistence probabilities of the sets Pk.
Furthermore, the algorithm outlined above provides two fundamental analytical tools: the centralization coefficient and coreness. Specifically, the centralization C for a core-periphery profile α k is defined as the complement to 1 of the normalized area.
C = 1 2 n 2 k = 1 n 1 α k
As a result, we may calculate the area between a network’s α k -curve and that of the star network and then normalize it to measure how similar the two networks are. With the help of this normalization, we may give the star network the value C = 1 (signifying maximum centralization) and the entire network the value C = 0 (signifying no centralization).

4. Results and Analysis

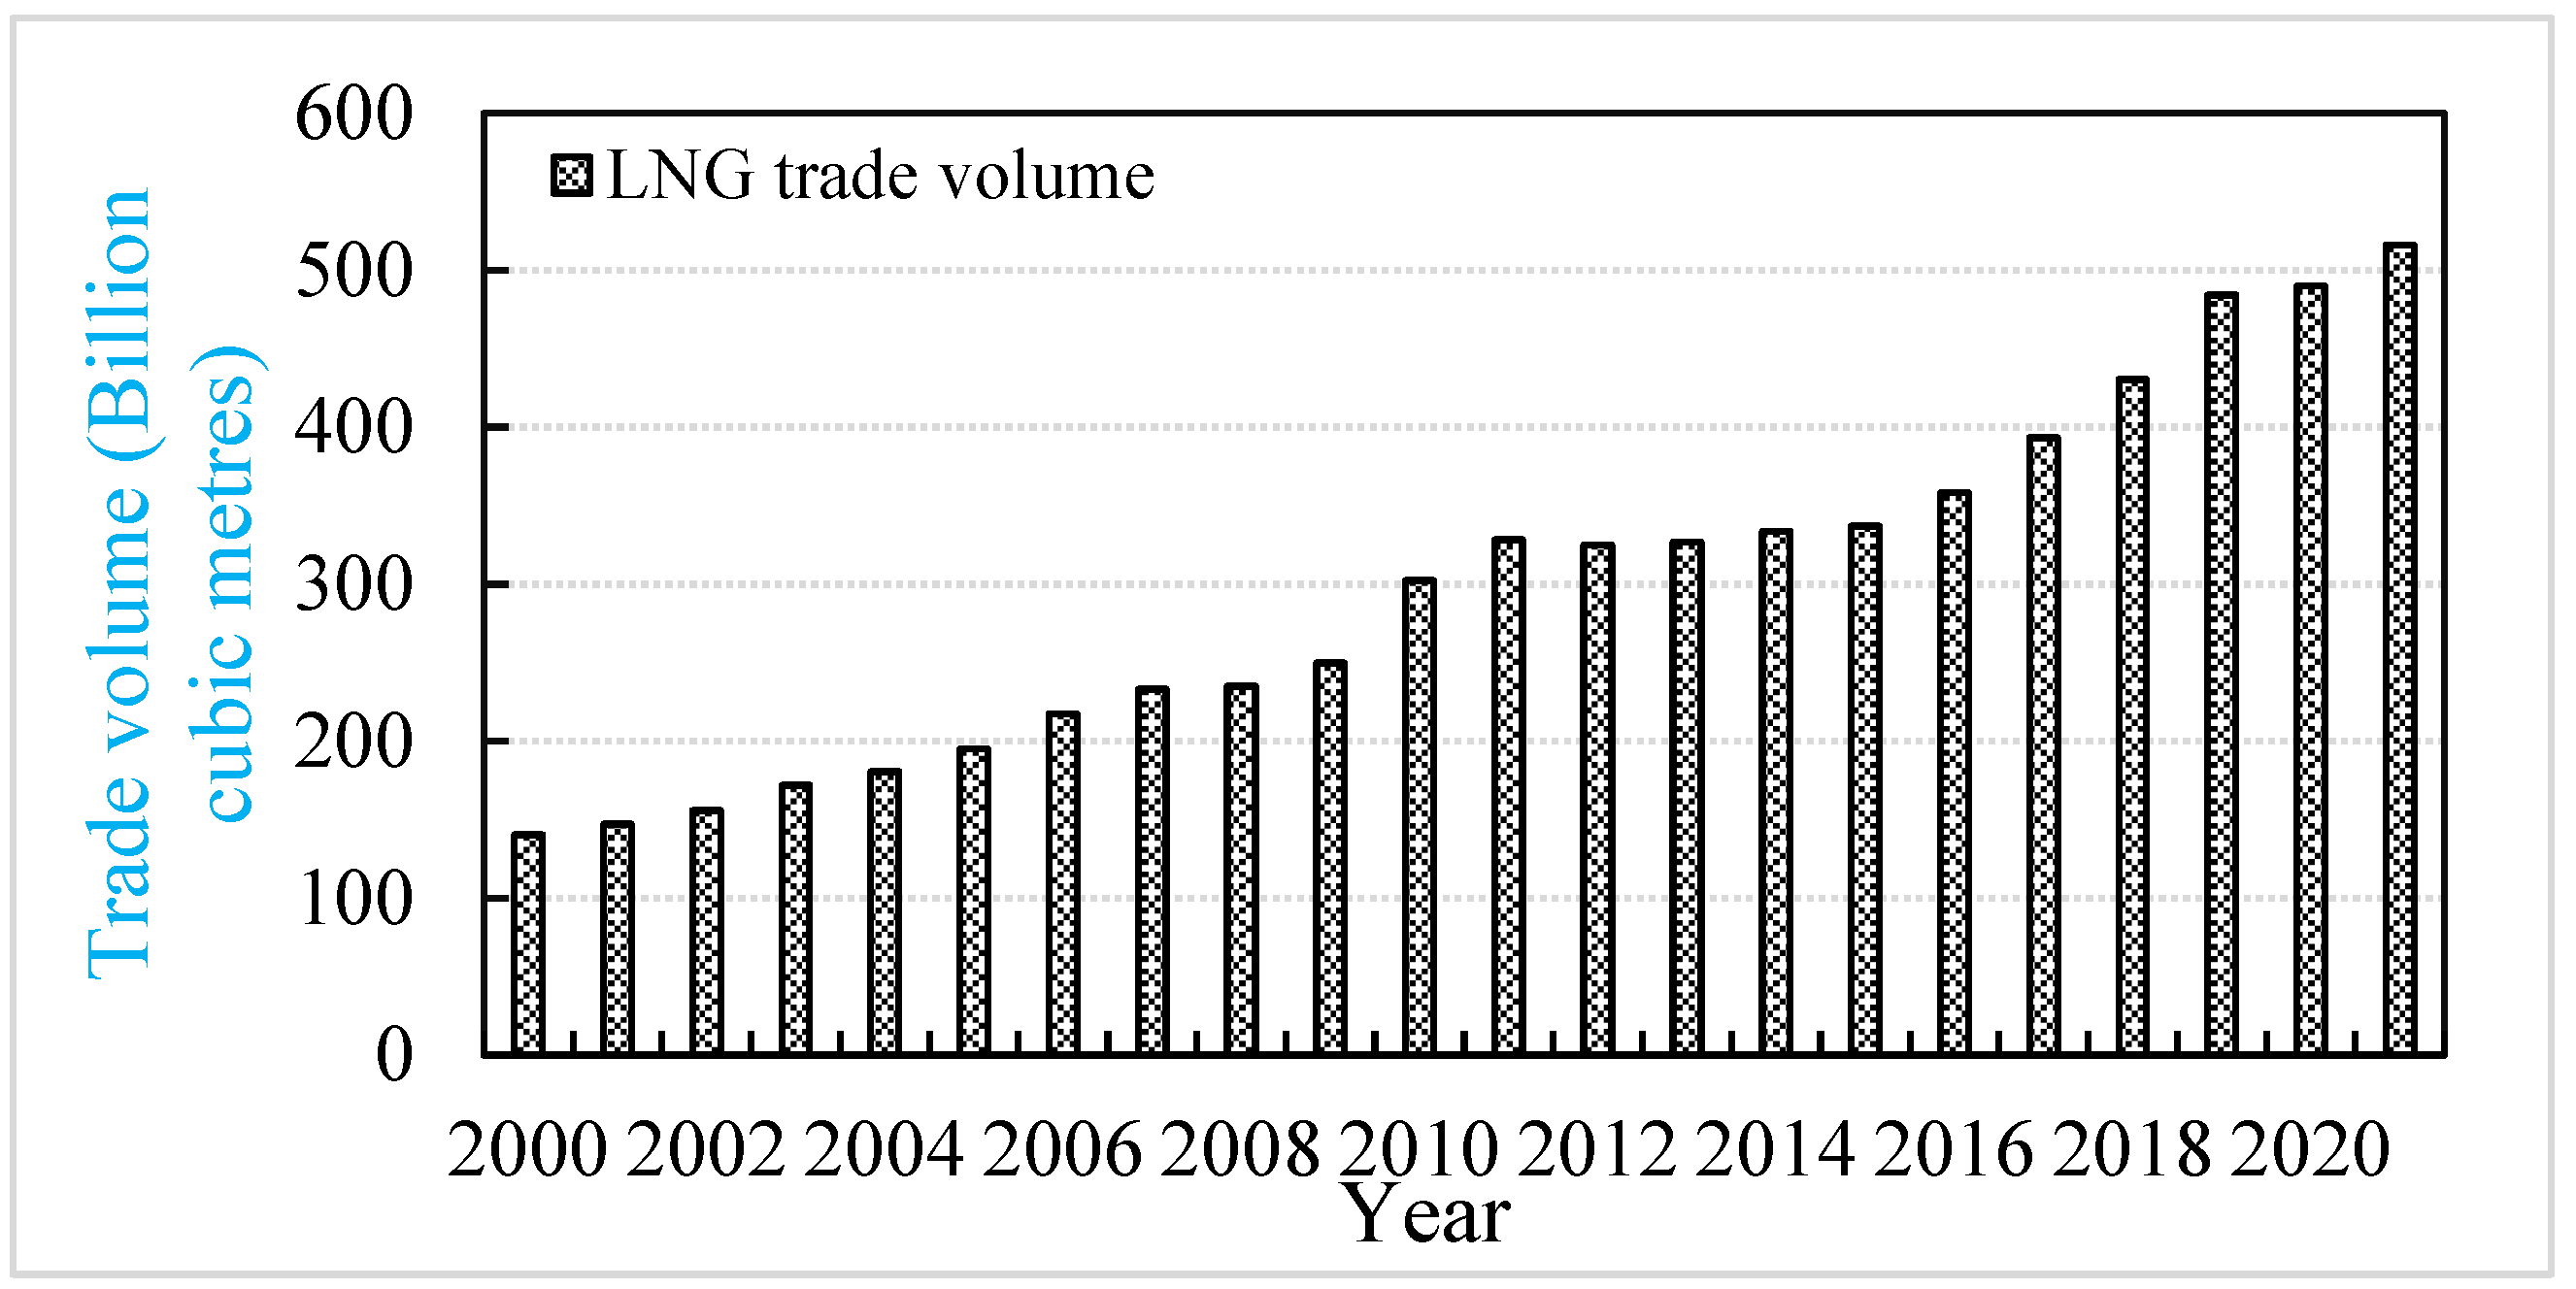
4.1. Dynamics in Global LNG Trade Volume

As the cleanest fossil fuel, liquefied natural gas is crucial in supplying the world’s energy and contributing to net-zero emission targets. With increasing environmental awareness, the world’s demand for LNG has grown dramatically, and the LNG trade market has become increasingly dynamic. Figure 1 describes the global LNG trade trend from 2000 to 2021. Over the past 20 years, the global LNG trade scale has exhibited a consistent upward trend, rising from 14.048 billion cubic meters in 2000 to 51.623 billion cubic meters in 2021, representing a remarkable 3.6-fold expansion. As a result, LNG trade has gained an increasingly significant position in the global energy trade market.
In particular, the global LNG trade volume increased by more than 10.00% per year in all four years of 2003, 2006, 2010, and 2019, and by as much as 21.08% in 2010. The LNG trade market was relatively fixed in the early days, with supply and demand sides trading on long-term contracts. After entering the twenty-first century, the surplus of production capacity, the expanding supply and demand market, and the iterative innovation of vessel technology have allowed LNG to carry out a new mode of short-term spot trading [42]. By 2003, the global short-term spot trading volume of LNG developed rapidly, which vigorously explored the potential cooperation market of LNG, and the total trade volume quickly grew. In 2006, the supply and demand scale expanded further, and more countries joined the global LNG import and export trade. Subsequently, the global economy experienced a cyclical weakness, resulting in a slowdown in the growth rate of LNG trade volume. As the global economy recovered, the global LNG trade volume also continued to grow, of which the increase in 2010 reached 21.08%, which is among the highest ever. In 2012, the global trade volume of LNG was 32.488 billion cubic meters, a decrease of 1.03% compared with the same period of the previous year, which was the first decline in nearly 30 years. After three years of slow growth, annual growth in global LNG trade volumes began to return to average. Benefitting from the breakthrough of the US shale gas revolution, upgraded export infrastructure, and demand from Asian markets, 2019 was another breakout year for significant growth in global LNG trade volumes. Despite the double blow to the energy market from the COVID-19 pandemic and the international economic downturn, the global LNG trade retained a low growth rate.

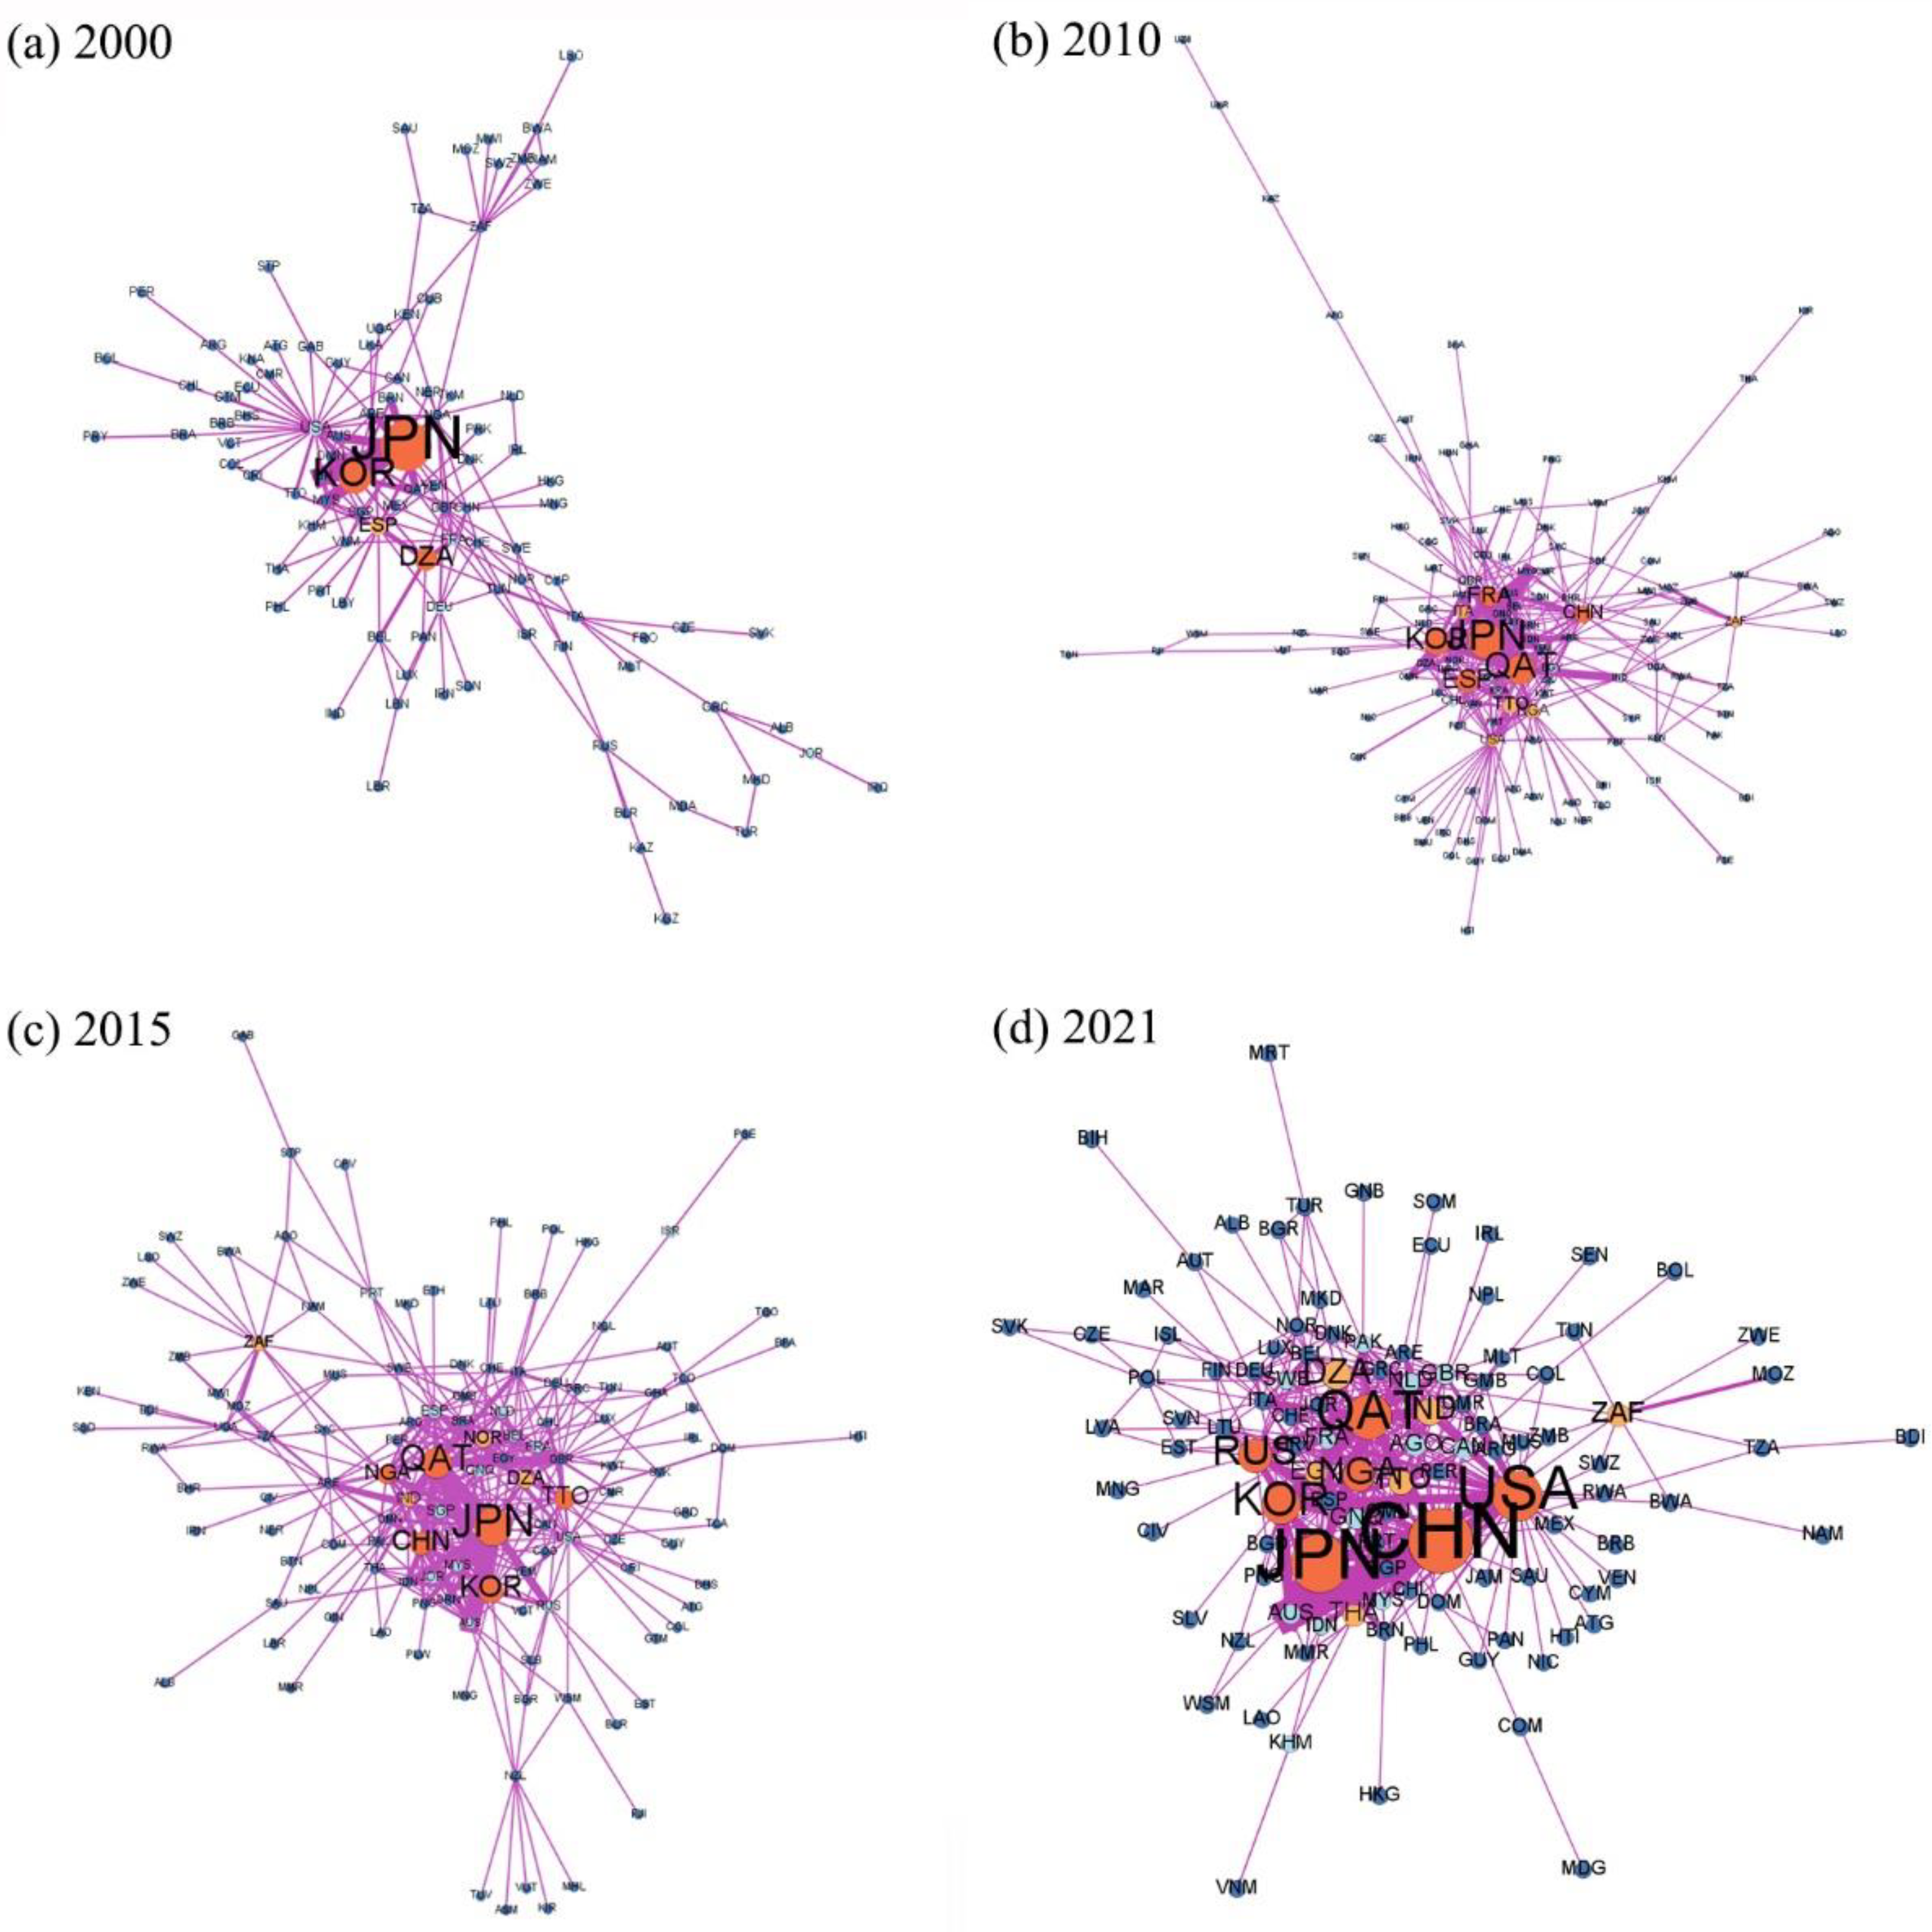
4.2. Evolution of Global LNG Trade Patterns

To portray the dynamic evolution of the global LNG trade, we selected four representative years, 2000, 2010, 2015, and 2021, and spatially visualized the global LNG trade network pattern based on the trade adjacency matrices (Figure 2). The edges show the trade relations between countries, the thickness of the edges indicates the trade volume of LNG, and the LNG trade volume between countries is further divided into five levels for comparison. Since 2000, the global LNG trade patterns have been undergoing profound adjustments, gradually forming LNG trade networks characterized by unbalanced spatial distribution, obvious hierarchical differentiation, and an increasingly complex structure. The interaction between limited capacity supply and strong trade demand has pushed the international LNG trade from regionalization to globalization, and the global LNG market is undergoing structural reshaping.
Since entering the twenty-first century, LNG has become the “sweet pastry” of the energy trade market, and the trade scale has maintained a “fast-steady-fast” growth trend. In the first phase, the global LNG trade scale achieved a 1.35 times expansion, from 84.97 million tons in 2000 to 199.86 million tons in 2010, with more production of LNG in the global energy trade market. Since the “Ukraine crisis” in 2013, the supply and demand of the LNG market have been in a long-term tight balance, and the traditional trade pattern has been impacted. After international events like the global financial crisis and the Ukraine crisis, the global LNG trade entered a stable development phase, growing by 13.04 million tons in the five years from 2010 to 2015, with an average annual growth rate of 1.27%. After entering 2015, global LNG trade volume climbed year by year, and the size of the trade network returned to the rapid growth stage, with the average annual growth rate recovering to 7.84%. Since 2020, when the outbreak of COVID-19 sent the trade market into a cooling period, the economy has nonetheless gradually recovered in the latter years, under the joint stimulation of climate change, international environment and environmental protection pressure, and other factors; among the world’s countries in this phase, especially Europe, China, Japan, South Korea, and other Asian countries, the enthusiasm for LNG imports is unabated. In 2021, the global LNG trade volume was 334.79 million tons, and the natural gas market pattern is changing profoundly.
From the perspective of trade flows, LNG trade links among countries worldwide have increased steadily over time, the overall density of the network has been rising, the expansion trend of the network at all levels is obvious, and the evolution of the network has gradually accelerated. The regionalization of the global natural gas trade was obvious in the early days. Pipeline natural gas, mainly supplied within the region, was still the main form of international trade in natural gas. The scale of the LNG trade network was relatively small. In 2000, only two sets of node pairs, Japan–Indonesia and Japan–Malaysia, belonged to the first tier, with a trade volume of more than 10 million tons. As a large natural gas importing country, Japan had a trade volume in that year which accounted for 31.60% of the global total, and it has a pivotal position in the trade network. Indonesia was the largest LNG exporter in 2000, followed by Malaysia, and the above two (Indonesia 21.26%, Malaysia 12.97%), together with Australia (8.60%) and Qatar (6.90%), were responsible for almost half of Japan’s LNG imports. At that stage, large-scale LNG trade was dominated by developed countries in Europe and the Asia–Pacific region, with little participation from North American and African countries, most of which traded in volumes of less than 2 million tons. Subsequently, LNG has been increasingly favored by energy trading countries due to its commodity characteristics, such as diversified trade forms, cheap long-distance transportation, and flexible transportation routes. At the same time, the accelerated process of economic globalization has pushed LNG from a regional commodity to a global bulk commodity. Specifically, in 2010, there were 136 countries/regions and 321 node pairs in the global LNG trade network, with the number of node pairs in each of the five levels of the network doubling and the overall scale of the trade network expanding exponentially, with obvious hierarchical differentiation, showing more complex network connection characteristics. The supply and demand contradiction in the global LNG trade market has existed for a long time, and the energy competition has intensified. In 2015, the node pairs in the trade network grew to 364 groups, and the node pairs with a trade size of more than 10 million tons stayed at four pairs. The newly added trade links mainly occurred between trading countries with a trade volume of less than 5 million tons, and the scale of the middle- and low-tier trade network has been further developed. By 2021, China–Australia overtook Japan–Australia as the node pair with the largest trade volume in the network. Japan–Australia, South Korea–Qatar, and Japan–Malaysia are the other three node pairs with more than 10 million tons of trade volumes. Japan and South Korea have long imported large quantities of LNG, making them the most active global natural gas market importers.
Regarding trade scale, the global LNG trade volume shows regional distribution, primarily concentrated in the trade markets of Europe, Asia–Pacific, and North America. During the study period, the number of nodes with a trade size of more than 50 million tons was only one in 2000, and then grew to five in 2021, with the growth mainly occurring in 2021; and the two countries that have maintained this trade volume for a long time are Japan and Qatar. Japan’s unique geographic location makes it difficult to advance natural gas interconnections with other countries through pipelines, and LNG is one of its main energy options for power supply. To deal with energy supply pitfalls and ensure energy security, Japan has actively engaged in long-term cooperation in LNG trade with countries such as Australia, Russia, Nigeria, Papua New Guinea, and Oman. Qatar’s LNG export capacity reached 50.92 million tons in 2010, more than double that of Indonesia, which once topped the list and accounted for as much as 40% of the total global LNG trade exports in that year. Australia’s trade volume has been rising yearly, and is a strong competitor to Qatar in the LNG market. In 2021, Australia surpassed Qatar to become the largest exporter of LNG globally, with 71.43 million tons of exports. Whereas Australia’s largest trading partner is relatively static, with Japan as its main exporter, Qatar’s trading partners are more diverse. The United States, which has seen its natural gas production rise dramatically after the shale gas revolution, has completely transformed itself from an importer to an exporter in the global LNG market by commissioning several production lines of LNG export facilities. As a newcomer to the global LNG market, the US LNG export trade has diversified. In 2021, the US had partners in 42 countries, and the volume of LNG exports surged to 59.19 million tons, ranking third in the world after Australia and Qatar, and accelerated the process of the globalization of the LNG trade to a certain extent. The same year, China surpassed Japan as the largest global LNG trading network importer, with 78.79 million tons of imports. In addition to being located in China, Japan, and South Korea, Asian economies such as India, Pakistan, Thailand, and Singapore have long been active in the natural gas trade market, and the demand and enthusiasm for LNG in Asian countries continue to grow. On the other hand, Europe has long relied on pipeline gas, and although it has yet to show significant growth in 2021, with the disruption of the “Nord Stream Gas Pipeline”, Europe has become the largest buyer in the global gas market.

4.3. Topological Properties of Global LNG Trade Networks

To investigate the potential patterns of the global LNG trade networks, we selected four complex network indicators, graph size, network density, transitivity, and global efficiency, to deeply portray the multi-year trend of the topological properties of the global LNG trade networks since 2000 (Table 1).
By 2021, the graph size of the global LNG trade network grew from 174 edges in 2000 to 404, which means that more and more countries have established LNG trade links between them, that LNG trade cooperation between countries tends to be diversified, and that the size of the global LNG market is growing. The network density increased from 0.0076 to 0.0176 between 2000 and 2021, and the global LNG trade networks are in the stage of development of increasing density. The network density nearly tripled between 2000 and 2010, and Qatar injected vitality into the growth of the LNG trade market in that period. The graph size and network density show a similar incremental trend, with the former growing at an average annual rate of 4.09% and the latter at 4.08%. This also indicates that the overall global LNG trade market scale is expanding, and LNG accounts for an increasing proportion of the world’s natural gas consumption.
As a classical variable of clustering coefficients, transitivity serves as a valuable metric for gauging the degree of trade cooperation within the network. It stands as a significant indicator for quantifying the globalization attributes of the LNG trade network. Conversely, global efficiency is employed to assess the network’s efficiency and its overall connectivity. As depicted in Table 1, the transitivity value of the global LNG trade network exhibits continuous growth, ascending from 0.1389 in 2000 to 0.2519 in 2021. Notably, the most rapid increase occurs between 2010 and 2015, surging from 0.1441 in 2010 to 0.2514. This period highlights a conspicuous enhancement in network clustering effects. Compared with the other three indicators, the numerical change of global efficiency shows a trend of rising and then dropping, with 2000–2010 as the growth period, and then it has been decreasing, falling from 0.00021 in 2010 to 0.00008 in 2021, which is lower than that of 0.00014 in 2000. Under the impacts of international environmental turbulence, trade motivation and transportation convenience among countries have declined significantly, which to a certain extent affects the trade network connectivity, and indicates that the development of the global LNG trade is still in an unstable state.
Overall, since 2000, the size and density of the global LNG trade network have been increasing steadily, trade ties between nodes have become stronger, and the quickly expanding LNG supply and trade contacts are propelling the development of the global natural gas market. Global LNG trade patterns are experiencing fundamental change due to the combined effects of the global COVID-19 pandemic, geopolitics, and the state of the world economy, and the worldwide LNG trade system will go through another cycle of reconstruction.
Table 2 lists the top ten countries with specific centrality values in the four selected years. The comparison finds that Japan, South Korea, Malaysia, Australia, and Spain have been ranked consistently high in terms of weighted degree centrality and have pivotal positions in the trade networks. Japan, South Korea, and Spain have a high demand for natural gas and, as traditional LNG-importing countries, have established trade relationships with several exporting countries to ensure domestic energy security. Australia and Malaysia are the world’s largest and most major LNG exporters, respectively, and the Asia–Pacific region is the main consumer of their LNG trade. Correspondingly, the United States, South Africa, Trinidad and Tobago, and Mozambique have consistently ranked high in PageRank centrality, and these countries typically have closer trade ties with major trading countries. In recent years, Trinidad and Tobago and Mozambique have seen a significant increase in proven LNG reserves and rapid growth in the LNG export trade, making them emerging exporters in the LNG trade sector. While South Africa’s PageRank centrality ranking is consistently high, its weighted degree centrality is not due to its long history of importing large amounts of LNG from Mozambique. The LNG production capacity of the United States has exploded after the shale gas revolution, transforming its “import-to-export” status. Its export volume is comparable to that of Qatar, the world’s largest gas supplier, and has become the world’s largest natural gas supplier. The United States has become the new global natural gas supply fulcrum, rivalling Qatar as a major LNG exporter. In the global LNG trading network, Qatar has consistently ranked high in the two centrality indicators, occupying an absolute core trading position and playing a leading role in the international LNG market by virtue of its abundant production capacity and trade relations.
Russia, China, India, and the Netherlands have risen significantly in importance in the global LNG trade networks, all ranking among the top ten in 2015 and beyond. Influenced by geopolitical relations and political factors, Russia, as a major pipeline natural gas exporting country, has started to enter the LNG industry and explore the Eastern market vigorously. LNG is undoubtedly an important means for commercializing Russian natural gas resources. Meanwhile, with the energy consumption structure biased towards cleaner and low-carbon energy, the emerging markets like China and India in Asia are becoming the main driving forces to pull the global LNG consumption demand. By 2021, China’s weighted degree centrality ranking jumped from forty-fifth in 2000 to first, and Japan, for the first time, retired to second; China plays an increasingly crucial role in the trade network. In addition, as Europe’s largest gas hub, the Netherlands’ weighted degree centrality and PageRank centrality rankings have been rising year by year, indicating that the Netherlands is not only playing a more prominent role as a “bridge” in the network but also increasing the total volume of natural gas trade it is responsible for, and diversifying its trade links.
In contrast, Indonesia, Algeria, and Germany are on a downward trend in the global LNG trade networks, especially Germany. Over the study period, Germany’s PageRank centrality ranking fell by 20 places, while its weighted degree centrality decreased from 19th to 57th. For a long time, Germany’s overdependence on Russian pipeline gas and its unique geopolitical position has led it to face a severe energy crisis rooted in its energy system’s vulnerability under the eager energy transition. As a traditional LNG exporting country, Indonesia has a serious imbalance between natural gas supply and demand. Due to a combination of factors, including a significant fall in LNG output and the expansion of Indonesia’s domestic LNG market as a result of the country’s rapid socioeconomic growth, there is currently a trade deficit in the global LNG market. Algeria and Spain have long been trading partners in the global LNG trading networks, but with the rise of Qatar and the United States in the LNG sector and their capture of part of the European market, Algeria’s importance in the trade network has been declining.

4.4. Core-Periphery Evolution of Global LNG Trade Networks

For the global LNG trade networks from 2000 to 2021, we use the core-periphery profile algorithm to identify the core and peripheral structures and calculate the concentration coefficients and coreness. The concentration coefficients of the four years are all greater than 0.95, which are 0.9891, 0.9628, 0.9644, and 0.9534, respectively, which indicates that, although the global LNG trade networks show significant core-periphery structures, the concentration coefficients decrease from year to year, which proves that as the dominant roles of the core nodes in the trade network begin to weaken, more countries participate in the LNG trade and the activity of the LNG trade market continues to increase. According to the related literature [43], this paper divides each country into four types based on their coreness, with 0.3, 0.1, and 0.01 as the threshold values (Figure 3).
Specifically, the number of core/sub-core countries grew from four countries in 2000 to thirteen countries in 2021, increasing the number of core nodes in the network. The number of sub-peripheral countries also grew and exhibited the same growth rate as the core/sub-core countries. The decreasing number of peripheral countries complements the development of the above three types of structures in the global LNG trade networks, and the earlier unbalanced “pyramid” trade structure of the LNG market is transformed into a relatively balanced new trade structure. At this stage, there are obvious core and peripheral structures in the global LNG trade networks, with a significant polarization effect, and the trade network structure is in an unbalanced state of continuous evolution and growth.
To some extent, the centrality and periphery of each country emerge from the competition for natural gas resources, and changes in the centrality will affect the reshaping of the market structure for natural gas, which will drive profound adjustments in the global LNG trade landscape. Based on the changes in the coreness of countries between 2000 and 2021, the core/sub-core countries in 2021 can be categorized into three categories. By analyzing the development trend of the LNG trade among core/sub-core countries, we can not only reveal the development characteristics of the LNG trade market in the past 22 years, but also, in a sense, see the further evolution trend of the global LNG market pattern in the future. The first category includes Japan and South Korea, core/sub-core countries that have long occupied stable core positions in the global LNG trade networks. Japan and South Korea have been the most active buyers in the global LNG market due to their domestic energy endowment. Six countries, Qatar, China, Nigeria, Trinidad and Tobago, and South Africa, have exhibited high core values since 2010 and thus have been categorized in the second category. The significant growth in Qatar’s LNG production and the entry of new importing countries represented by China has shifted the global LNG trade market. The third category refers to the countries that will leapfrog to the core/sub-core in 2021. Five countries in this category, namely the United States, Russia, India, Thailand, and Egypt, have injected new vitality into the traditional global LNG trade market. The US has succeeded in becoming a major LNG exporter due to the shale gas revolution and has become a major source of LNG supply for North America. Russia, another traditional gas exporting power, has gradually expanded its LNG trade export scale and partners due to geopolitical and other influences. The rising core degree of India, Thailand, and Egypt is the current stage of “Asian demand” to lead the global LNG trade market.
In contrast, Algeria, Spain, Germany, France, and Jordan exhibit significant hierarchical fluctuations and downward trends in the core-periphery structures of the global LNG trade networks. The single LNG trade cooperation linkage has made Algeria, Spain, and Jordan less shock-resistant in the global LNG trade networks and highly vulnerable to the external environment and competing countries. Germany, France, and other European countries have long relied on pipeline gas from Russia. Bad extreme weather and tense Russian–European relations have created a cyclical shortage of natural gas resources in Europe. The problem of Europe’s energy crisis has gradually come to the forefront. The globalization trend of the LNG trade is also manifested at the level of the peripheral nodes, and, as shown in Figure 3, the number of peripheral countries is decreasing year by year, constantly decreasing from 207 in 2000 to 189 in 2021. Although Angola, Equatorial Guinea, Australia, Pakistan, Cambodia, Palestine, Indonesia, and Lithuania are still peripheral/sub-peripheral countries, their coreness indices in the global LNG trade networks show a positive development, and the peripheral character of the nodes is gradually weakening.

5. Discussion

In this article, we construct a multilevel network analysis framework, integrate various network analysis methods, and empirically analyze the global LNG trade networks and market dynamics from macro, meso, and micro perspectives. As a result, we present some new findings and general conclusions, which are effective additions to the existing studies on the LNG trade networks. For example, Geng et al. constructed the global LNG and PNG import and export trade networks for 2000–2011, respectively. They found that both types of natural gas trade networks are consistent with scale-free distributions. The natural gas market still exhibits strong regionalism, without truly realizing a unified global trade market environment [19]. Given the continued expansion of the global LNG trade industry and the growing accessibility of LNG trade data, this article extends its investigation until 2021. This analysis reveals how the global LNG trade networks have changed over the past 22 years in a dynamic manner. Although worldwide LNG supply and demand are growing, there is a growing demand for LNG trade, particularly in the Asia–Pacific area. The trend of globalization of the LNG trade pattern is evident. However, due to the influence of transportation conditions, geographic factors, market dynamics, and other factors, there are still regional characteristics of the LNG trade market at this stage. Chen et al. [44] emphasized the significance of the node level in the LNG trade network, while Filimonova et al. [27] developed unweighted LNG trade networks with degree centrality assigned to nodes. Nevertheless, due to the complexity of trade networks, relying solely on a single topological indicator poses challenges in thoroughly characterizing the connectivity of LNG trade networks [45]. For this reason, in this paper, we employ network metrics and algorithms such as network density, transitivity, global efficiency, weighted degree centrality, PageRank centrality, and the core-periphery algorithm to investigate the global LNG trade networks, and to explore the global LNG trade networks in a multilevel way. The core-periphery profile algorithm is noteworthy as it can be extended to weighted networks, thereby overcoming the limitation of traditional core-periphery structure algorithms, like the K-Core algorithm, which is solely applicable to unweighted networks. Additionally, the study reveals the ongoing growth of the global LNG trade market and its highly dynamic trade pattern. The United States has emerged as a prominent LNG exporter, significantly altering the global LNG trade market pattern. Moreover, major demand countries including the European Union, China, Japan, South Korea, and India have stepped up to play key roles in the growth of the LNG market worldwide.

6. Conclusions

As the cleanest fossil fuel, natural gas is becoming more and more prevalent in the world’s primary energy usage. A rising portion of the worldwide LNG trade is a part of the broader natural gas and energy sector, which is expanding gradually. Based on the complex network theory, this paper constructs long time series global LNG trade networks, and comprehensively utilizes the multilevel network analysis method to deeply explore the spatiotemporal evolution and market dynamics of the global LNG trade networks, to provide insights for thoroughly understanding the market dynamics of the global LNG trade system. The study highlights the evolving patterns of global LNG trade networks amidst climate change and energy transformation challenges.
The results reveal a consistent growth in the global LNG trade from 2000 to 2021, despite recent challenges such as the COVID-19 pandemic. This expansion reflects a shift from regional to international trade, with a clear spatial, hierarchical differentiation in the trading network. The network’s overall efficiency has fluctuated, initially increasing before dropping, indicating a period of rapid transition. Key players in the LNG trade include Japan, South Korea, Malaysia, Australia, Spain, the United States, South Africa, Trinidad and Tobago, Mozambique, and Qatar. The market demonstrates a trend towards cleaner energy, propelled by growing markets like China and India, and an expanding Russian LNG trade. Conversely, Indonesia, Algeria, and Germany have declined in influence. The network structure, moving from an initial core and periphery setup towards a balanced structure, shows continuous evolution and growth. Future research should incorporate pipeline natural gas trade for a more comprehensive analysis, explore the resilience of LNG trade networks, and examine global natural gas trade markets from robustness, vulnerability, and resilience perspectives.

Author Contributions

Conceptualization, Z.H.; methodology, W.C.; software, X.N.; validation, X.N.; resources, Z.Y.; data curation, W.C.; writing—original draft preparation, Z.Y.; writing—review and editing, Z.H.; visualization, X.N.; supervision, W.C.; project administration, Z.H.; funding acquisition, Z.Y. All authors have read and agreed to the published version of the manuscript.

Funding

This research was funded by National Natural Science Foundation of China, grant number 42230406.

Data Availability Statement

The data presented in this study are available on request from the corresponding author. The data are not publicly available due to Complex administrative approvals and compliance checks.

Conflicts of Interest

The authors confirm that we have read, understand, and agreed to the submission guidelines of the journal. The authors declare that they have no competing interests.

References

  1. Kober, T.; Schiffer, H.-W.; Densing, M.; Panos, E. Global energy perspectives to 2060—WEC’s World Energy Scenarios 2019. Energy Strat. Rev. 2020, 31, 100523. [Google Scholar] [CrossRef]
  2. Zou, C.; Zhao, Q.; Zhang, G.; Xiong, B. Energy revolution: From a fossil energy era to a new energy era. Nat. Gas Ind. B 2016, 3, 1–11. [Google Scholar] [CrossRef]
  3. Raza, M.Y.; Lin, B. Renewable energy substitution and energy technology impact in a transitional economy: A perspective from Pakistan. J. Clean. Prod. 2022, 360, 132163. [Google Scholar] [CrossRef]
  4. Vivoda, V. Natural gas in Asia: Trade, markets and regional institutions. Energy Policy 2014, 74, 80–90. [Google Scholar] [CrossRef]
  5. Haddadian, G.; Shahidehpour, M. Ripple Effects of the Shale Gas Boom in the U.S.: Shift in the Balance of Energy Resources, Technology Deployment, Climate Policies, Energy Markets, Geopolitics and Policy Development. Electr. J. 2015, 28, 17–38. [Google Scholar] [CrossRef]
  6. British Petroleum. Statistical Review of World Energy 2022; British Petroleum: London, UK, 2022. [Google Scholar]
  7. Thalassinos, E.; Kadłubek, M.; Thong, L.M.; Van Hiep, T.; Ugurlu, E. Managerial Issues Regarding the Role of Natural Gas in the Transition of Energy and the Impact of Natural Gas Consumption on the GDP of Selected Countries. Resources 2022, 11, 42. [Google Scholar] [CrossRef]
  8. Kumari, N.; Kumar, P.; Sahu, N.C. Do energy consumption and environmental quality enhance subjective wellbeing in G20 countries? Environ. Sci. Pollut. Res. 2021, 28, 60246–60267. [Google Scholar] [CrossRef]
  9. Le, M.T.; Nguyen, T.T.; Tran, V.H.; Nguyen, T.K.N.; Do, H.T. Can Natural Gas Play an Important Role in the Energy Transition in Asia in the Future? Eurasian J. Bus. Manag. 2019, 7, 28–36. [Google Scholar] [CrossRef]
  10. Li, R.; Su, M. The Role of Natural Gas and Renewable Energy in Curbing Carbon Emission: Case Study of the United States. Sustainability 2017, 9, 600. [Google Scholar] [CrossRef]
  11. Shaikh, F.; Ji, Q.; Fan, Y. Assessing the stability of the LNG supply in the Asia Pacific region. J. Nat. Gas Sci. Eng. 2016, 34, 376–386. [Google Scholar] [CrossRef]
  12. Guo, Y.; Hawkes, A. Simulating the game-theoretic market equilibrium and contract-driven investment in global gas trade using an agent-based method. Energy 2018, 160, 820–834. [Google Scholar] [CrossRef]
  13. Meza, A.; Ari, I.; Al Sada, M.; Koç, M. Disruption of maritime trade chokepoints and the global LNG trade: An agent-based modeling approach. Marit. Transp. Res. 2022, 3, 100071. [Google Scholar] [CrossRef]
  14. Meza, A.; Ari, I.; Al-Sada, M.S.; Koç, M. Future LNG competition and trade using an agent-based predictive model. Energy Strat. Rev. 2021, 38, 100734. [Google Scholar] [CrossRef]
  15. Nikhalat-Jahromi, H.; Fontes, D.B.; Cochrane, R.A. Future liquefied natural gas business structure: A review and comparison of oil and liquefied natural gas sectors. WIREs Energy Environ. 2017, 6, e240. [Google Scholar] [CrossRef]
  16. Zhang, H.-Y.; Xi, W.-W.; Ji, Q.; Zhang, Q. Exploring the driving factors of global LNG trade flows using gravity modelling. J. Clean. Prod. 2018, 172, 508–515. [Google Scholar] [CrossRef]
  17. Dashtban Farooji, S.; Dargahi, H. Position of Iran in the International Natural Gas Trade Network: Graph Theory Approach. Iran. J. Energy 2021, 24, 7–42. [Google Scholar]
  18. Zhong, W.; An, H.; Fang, W.; Gao, X.; Dong, D. Features and evolution of international fossil fuel trade network based on value of emergy. Appl. Energy 2016, 165, 868–877. [Google Scholar] [CrossRef]
  19. Geng, J.-B.; Ji, Q.; Fan, Y. A dynamic analysis on global natural gas trade network. Appl. Energy 2014, 132, 23–33. [Google Scholar] [CrossRef]
  20. Barnes, R.; Bosworth, R. LNG is linking regional natural gas markets: Evidence from the gravity model. Energy Econ. 2015, 47, 11–17. [Google Scholar] [CrossRef]
  21. Li, J.; Dong, X.; Jiang, Q.; Dong, K.; Liu, G. Natural gas trade network of countries and regions along the belt and road: Where to go in the future? Resour. Policy 2021, 71, 101981. [Google Scholar] [CrossRef]
  22. Yang, Y.; Poon, J.P.; Liu, Y.; Bagchi-Sen, S. Small and flat worlds: A complex network analysis of international trade in crude oil. Energy 2015, 93, 534–543. [Google Scholar] [CrossRef]
  23. Chen, W.; Zhang, H.; Tang, Z.; Yu, Z. Assessing the structural connectivity of international trade networks along the “Belt and Road”. PLoS ONE 2023, 18, e0282596. [Google Scholar] [CrossRef]
  24. Wu, G.; Pu, Y.; Shu, T. Features and evolution of global energy trade network based on domestic value-added decomposition of export. Energy 2021, 228, 120486. [Google Scholar] [CrossRef]
  25. Niu, X.; Chen, W.; Wang, N. Spatiotemporal Dynamics and Topological Evolution of the Global Crude Oil Trade Network. Energies 2023, 16, 1728. [Google Scholar] [CrossRef]
  26. Mafakheri, A.; Sulaimany, S.; Mohammadi, S. Predicting the establishment and removal of global trade relations for import and export of petrochemical products. Energy 2023, 269, 126850. [Google Scholar] [CrossRef]
  27. Filimonova, I.V.; Komarova, A.V.; Sharma, R.; Novikov, A.Y. Transformation of international liquefied natural gas markets: New trade routes. Energy Rep. 2022, 8, 675–682. [Google Scholar] [CrossRef]
  28. Chen, Z.; An, H.; Gao, X.; Li, H.; Hao, X. Competition pattern of the global liquefied natural gas (LNG) trade by network analysis. J. Nat. Gas Sci. Eng. 2016, 33, 769–776. [Google Scholar] [CrossRef]
  29. Feng, S.; Li, H.; Qi, Y.; Guan, Q.; Wen, S. Who will build new trade relations? Finding potential relations in international liquefied natural gas trade. Energy 2017, 141, 1226–1238. [Google Scholar] [CrossRef]
  30. Jin, Y.; Yang, Y.; Liu, W. Finding Global Liquefied Natural Gas Potential Trade Relations Based on Improved Link Prediction. Sustainability 2022, 14, 12403. [Google Scholar] [CrossRef]
  31. Shibasaki, R.; Kanamoto, K.; Suzuki, T. Estimating global pattern of LNG supply chain: A port-based approach by vessel movement database. Marit. Policy Manag. 2020, 47, 143–171. [Google Scholar] [CrossRef]
  32. Peng, P.; Lu, F.; Cheng, S.; Yang, Y. Mapping the global liquefied natural gas trade network: A perspective of maritime transportation. J. Clean. Prod. 2021, 283, 124640. [Google Scholar] [CrossRef]
  33. Yan, Z.; He, R.; Yang, H. The small world of global marine crude oil trade based on crude oil tanker flows. Reg. Stud. Mar. Sci. 2022, 51, 102215. [Google Scholar] [CrossRef]
  34. Fischer, C.S.; Shavit, Y. National differences in network density: Israel and the United States. Soc. Netw. 1995, 17, 129–145. [Google Scholar] [CrossRef]
  35. Watts, D.J.; Strogatz, S.H. Collective dynamics of ‘small-world’ networks. Nature 1998, 393, 440–442. [Google Scholar] [CrossRef] [PubMed]
  36. Latora, V.; Marchiori, M. Efficient Behavior of Small-World Networks. Phys. Rev. Lett. 2001, 87, 198701. [Google Scholar] [CrossRef] [PubMed]
  37. Opsahl, T.; Agneessens, F.; Skvoretz, J. Node centrality in weighted networks: Generalizing degree and shortest paths. Soc. Netw. 2010, 32, 245–251. [Google Scholar] [CrossRef]
  38. Kiyota, K. The COVID-19 pandemic and the world trade network. J. Asian Econ. 2022, 78, 101419. [Google Scholar] [CrossRef]
  39. Sajedianfard, N.; Hadian, E.; Samadi, A.H.; Shabani, Z.D.; Sarkar, S.; Robinson, P.A. Quantitative analysis of trade networks: Data and robustness. Appl. Netw. Sci. 2021, 6, 46. [Google Scholar] [CrossRef]
  40. Chen, W. Delineating the Spatial Boundaries of Megaregions in China: A City Network Perspective. Complexity 2021, 2021, 2574025. [Google Scholar] [CrossRef]
  41. Della Rossa, F.; Dercole, F.; Piccardi, C. Profiling core-periphery network structure by random walkers. Sci. Rep. 2013, 3, srep01467. [Google Scholar] [CrossRef]
  42. Ritz, R.A. Price discrimination and limits to arbitrage: An analysis of global LNG markets. Energy Econ. 2014, 45, 324–332. [Google Scholar] [CrossRef]
  43. Chen, W.; Zhang, H. Characterizing the Structural Evolution of Cereal Trade Networks in the Belt and Road Regions: A Network Analysis Approach. Foods 2022, 11, 1468. [Google Scholar] [CrossRef] [PubMed]
  44. Chen, Z.; An, H.; An, F.; Guan, Q.; Hao, X. Structural risk evaluation of global gas trade by a network-based dynamics simulation model. Energy 2018, 159, 457–471. [Google Scholar] [CrossRef]
  45. Kadlubek, M. Supply chain in the strategic approach with the aspects of quality. Int. J. Qual. Res. 2022, 16, 1255–1268. [Google Scholar] [CrossRef]
Figure 1. Changes in the global LNG trade volume. (Data from: World Integrated Trade Solution (WITS) database).
Energies 17 00228 g001
Figure 2. Evolution of the global LNG trade patterns. (a) 2000; (b) 2010; (c) 2015; (d) 2021. (Data from: World Integrated Trade Solution (WITS) database).
Energies 17 00228 g002
Figure 3. Medium features: core-periphery evolution of global LNG trade networks. (Data from: World Integrated Trade Solution (WITS) database).
Energies 17 00228 g003
Table 1. Macro features of global LNG trade networks.
Network Description2000201020152021
Graph size174321364404
Network density0.00760.01400.01580.0176
Transitivity0.13890.14410.25140.2519
Global efficiency0.000140.000210.000200.00008
Table 2. Micro features: centrality measurement of global LNG trade networks.
20002010
CountryWDCCountryPRCCountryWDCCountryPRC
Japan53.69USA0.0650Japan70.01USA0.0881
Indonesia24.62Italy0.0495Qatar50.92Qatar0.0880
South Korea15.24Trinidad and Tobago0.0363South Korea32.67United Kingdom0.0780
Malaysia13.55Algeria0.0310Indonesia20.60Trinidad and Tobago0.0500
Qatar9.78Germany0.0241Malaysia19.94South Africa0.0367
Algeria9.20South Africa0.0233Spain19.27Mozambique0.0329
Australia7.36Mozambique0.0227Australia18.23Nigeria0.0228
Spain7.09UAE0.0160Nigeria13.91Egypt0.0215
Brunei6.56Qatar0.0145United Kingdom13.57Algeria0.0166
UAE5.17Kazakhstan0.0127Algeria11.91Italy0.0164
20152021
CountryWDCCountryPRCCountryWDCCountryPRC
Japan85.04South Africa0.0657China78.79USA0.1690
Qatar64.37Mozambique0.0608Japan74.36Trinidad and Tobago0.1384
South Korea33.43Qatar0.0479Australia71.43South Africa0.0352
Australia28.22Trinidad and Tobago0.0404Qatar63.20Mozambique0.0318
Malaysia24.16USA0.0329United States61.51Netherlands0.0297
China19.62Norway0.0312South Korea45.97Russia0.0275
Nigeria14.50Netherlands0.0293Russia28.70Qatar0.0257
India13.36France0.0286India24.54China0.0231
Indonesia13.21China0.0272Malaysia24.50Australia0.0195
Spain11.29Indonesia0.0270Spain16.11Nigeria0.0152
WDC stands for weighted degree centrality; PRC stands for PageRank centrality.
Disclaimer/Publisher’s Note: The statements, opinions and data contained in all publications are solely those of the individual author(s) and contributor(s) and not of MDPI and/or the editor(s). MDPI and/or the editor(s) disclaim responsibility for any injury to people or property resulting from any ideas, methods, instructions or products referred to in the content.

