Proposed Extension of the U.S.–Caribbean Super Grid to South America for Resilience during Hurricanes
Abstract
1. Introduction
1.1. Background
1.2. Literature Review
1.3. Research Gap and Motivation
1.4. Challenge
1.5. Contribution
1.6. Paper Organization
2. Materials and Spatiotemporal Method
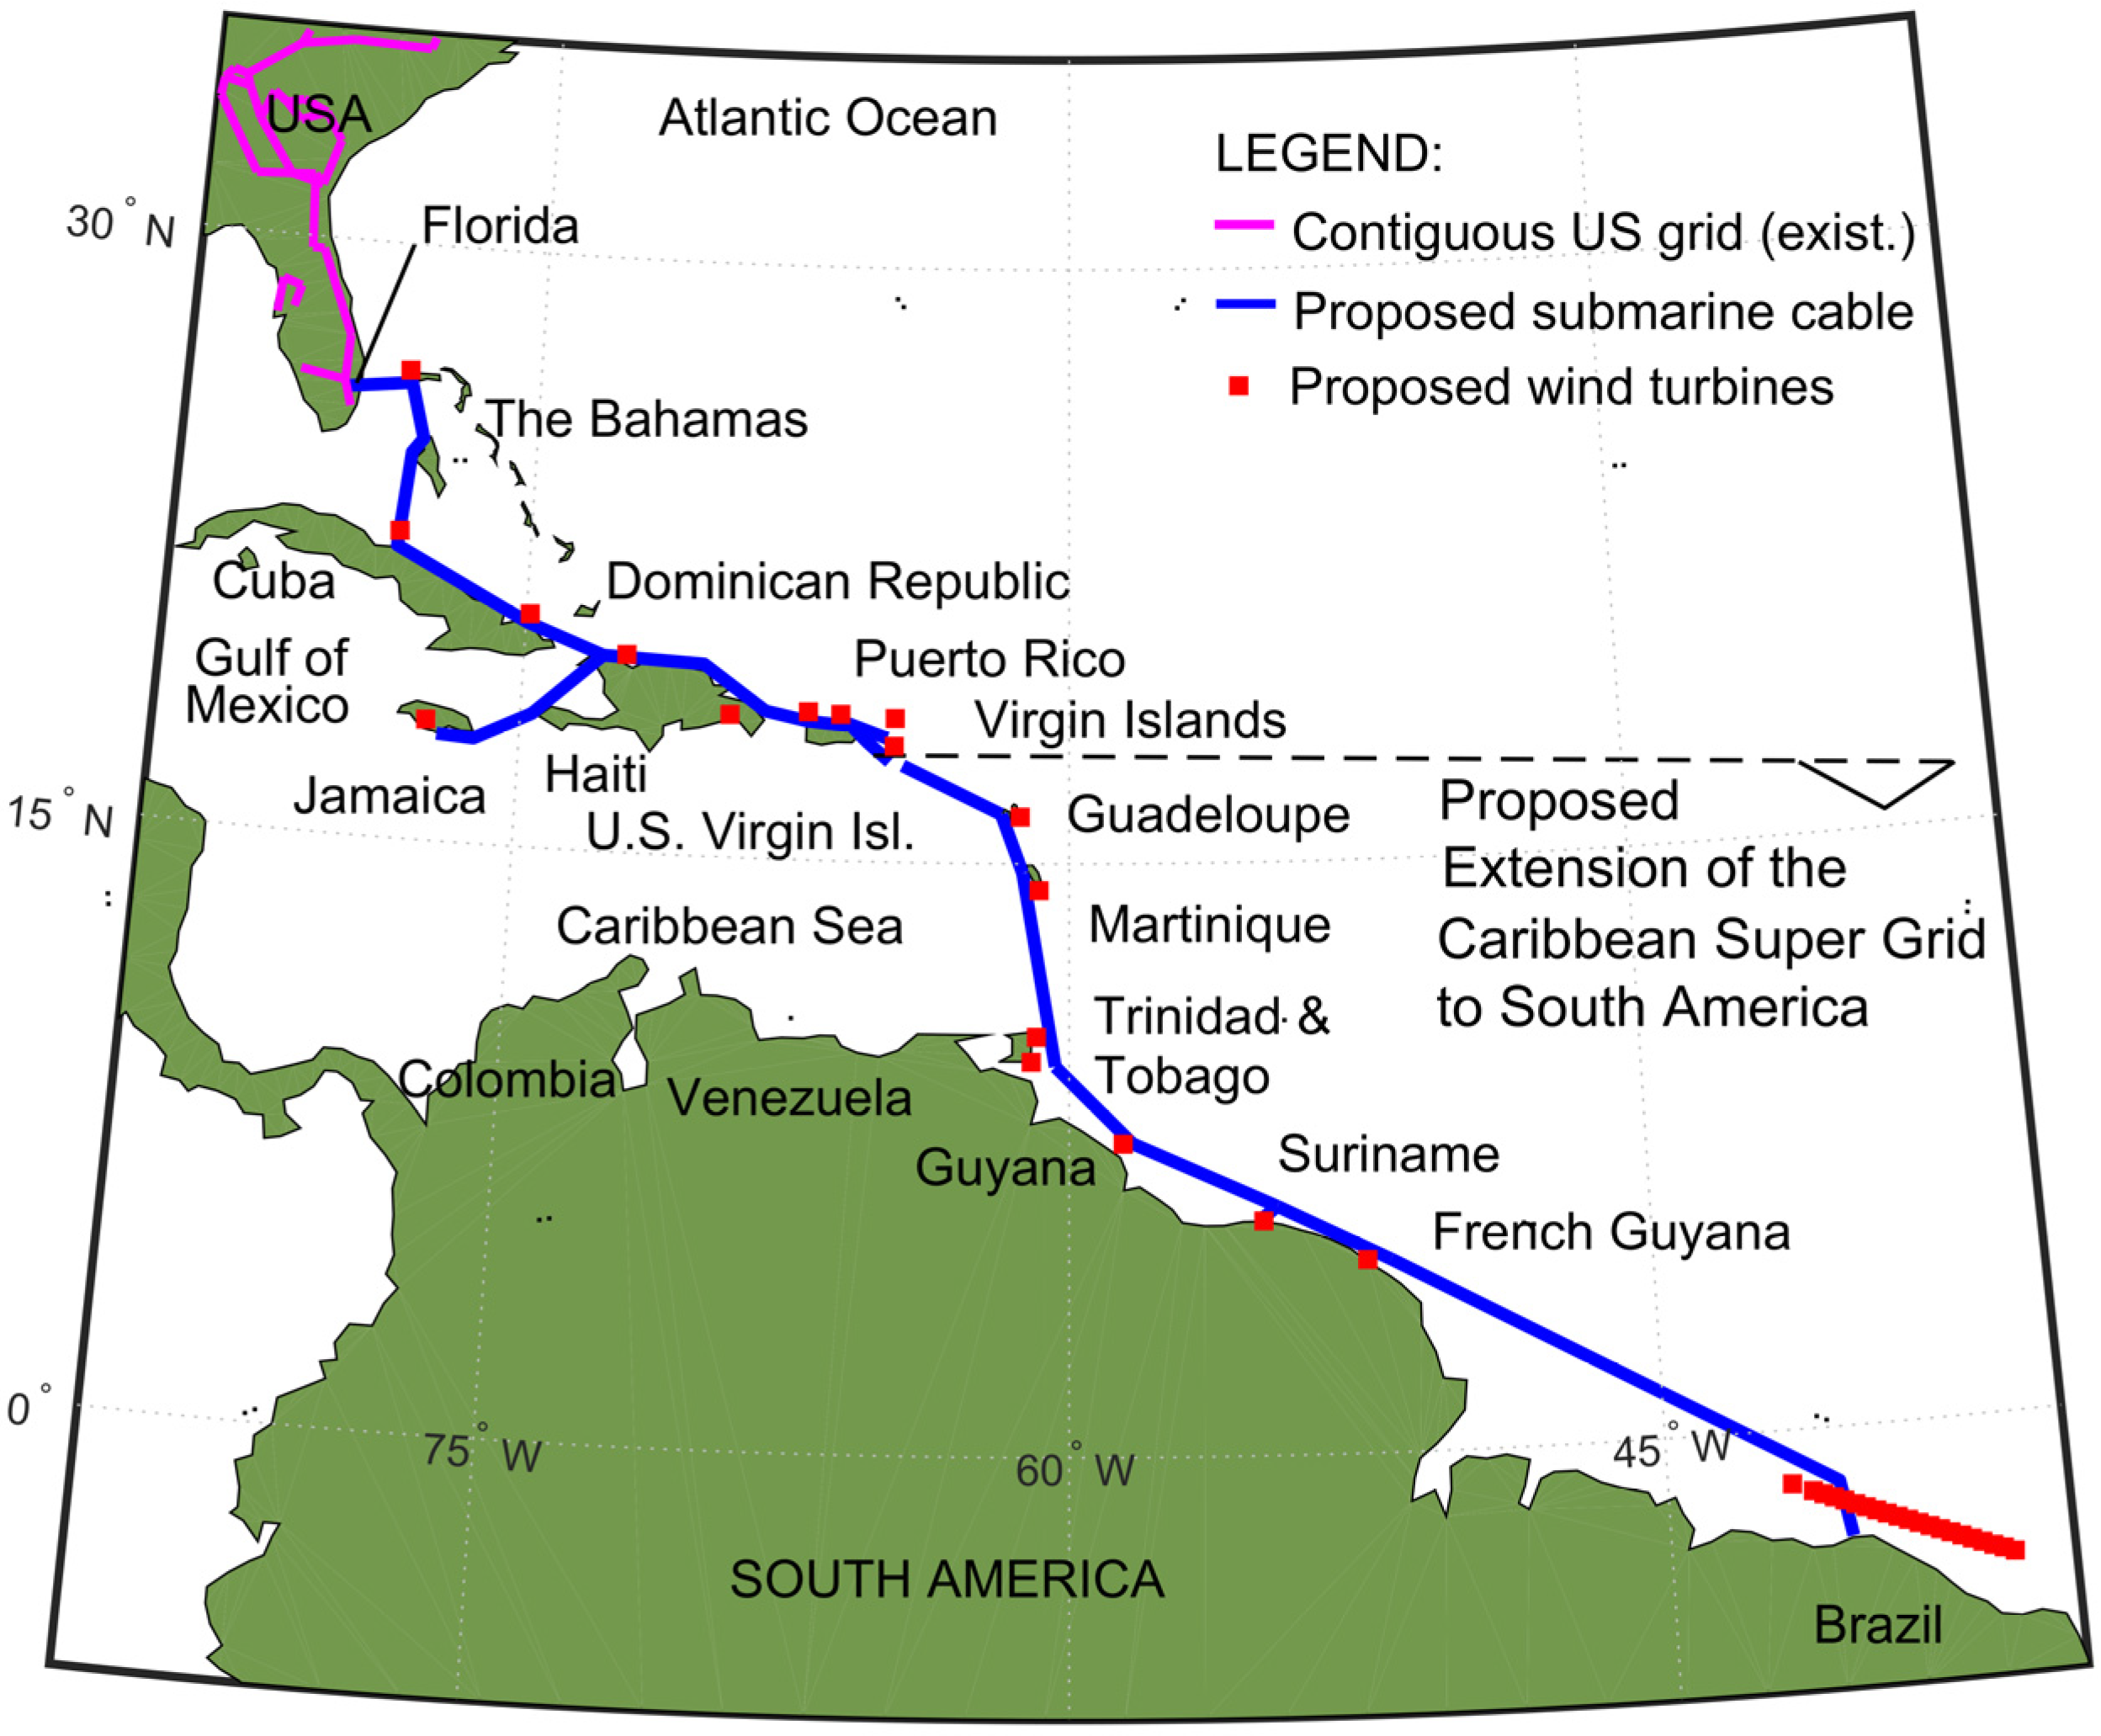
2.1. Technical Feasibility of the Proposed Extension
2.2. Method for Estimation of Wind Power under Hurricanes
2.3. Modeling of Hurricane Wind Speed and Shape
2.4. Modeling of Hurricane Trajectory
- (step 1)
- (step 2)
- By visual inspection of the map, locate the two coordinates of the most western and eastern trajectories of a hurricane initiating over the North Atlantic. The western coordinate point will be assigned to synthetic trajectory #1 and the eastern coordinate point to trajectory #10;
- (step 3)
- Divide the latitudes of points #1 and #10 by 9 to obtain the latitude angle step. This latitude angle step should be added to the latitude of point #1 to estimate the latitudes of trajectory #2 to #9 by successive increments of the latitude angle step. Similarly, calculate the longitude of trajectories #2 to #9 by successive increments of longitude steps. This procedure defines the origin coordinates of the hurricane trajectories in the North Atlantic;
- (step 4)
- By visual inspection of the same map, most of the hurricane’s trajectories have a parabola vertex between Texas and Florida at latitude 30 degrees. Locate the most western and eastern points of historical hurricane trajectories and assign them to vertex points #1 and #10. Calculate the longitude angle step by dividing the angle difference by 9. Obtain the vertex coordinates of parabolic trajectory #2 to #9 by successive increments of the same longitude angle step. This procedure determines the destination vertex coordinates of all ten trajectories;
- (step 5)
- Having the origin and vertex coordinates of parabolic trajectories #1 to #10, using Equation (3) and the equations relating the parabola vertex indicated in (4)–(6), it is possible to find the coefficients a, b, and c of the parabola indicated in Equation (3). These coefficients are indicated in Table 3.
2.5. Modeling of Wind Turbines
2.6. Assessment of Sustainable Hurricane Energy
2.7. Algorithm for Estimation of Wind Power Profile in Super Grids
| Algorithm 1 Pseudocode for Wind Power Profile |
| Set all input data for modeling of: |
| • Hurricanes speed and shape (central pressure, and maximum radius) |
| • Hurricane trajectories (origin and vertex of parabola) |
| • Turbines (rated power, power vs wind curve) |
| Select case-study scenario: |
| • Hurricane category (category 5) |
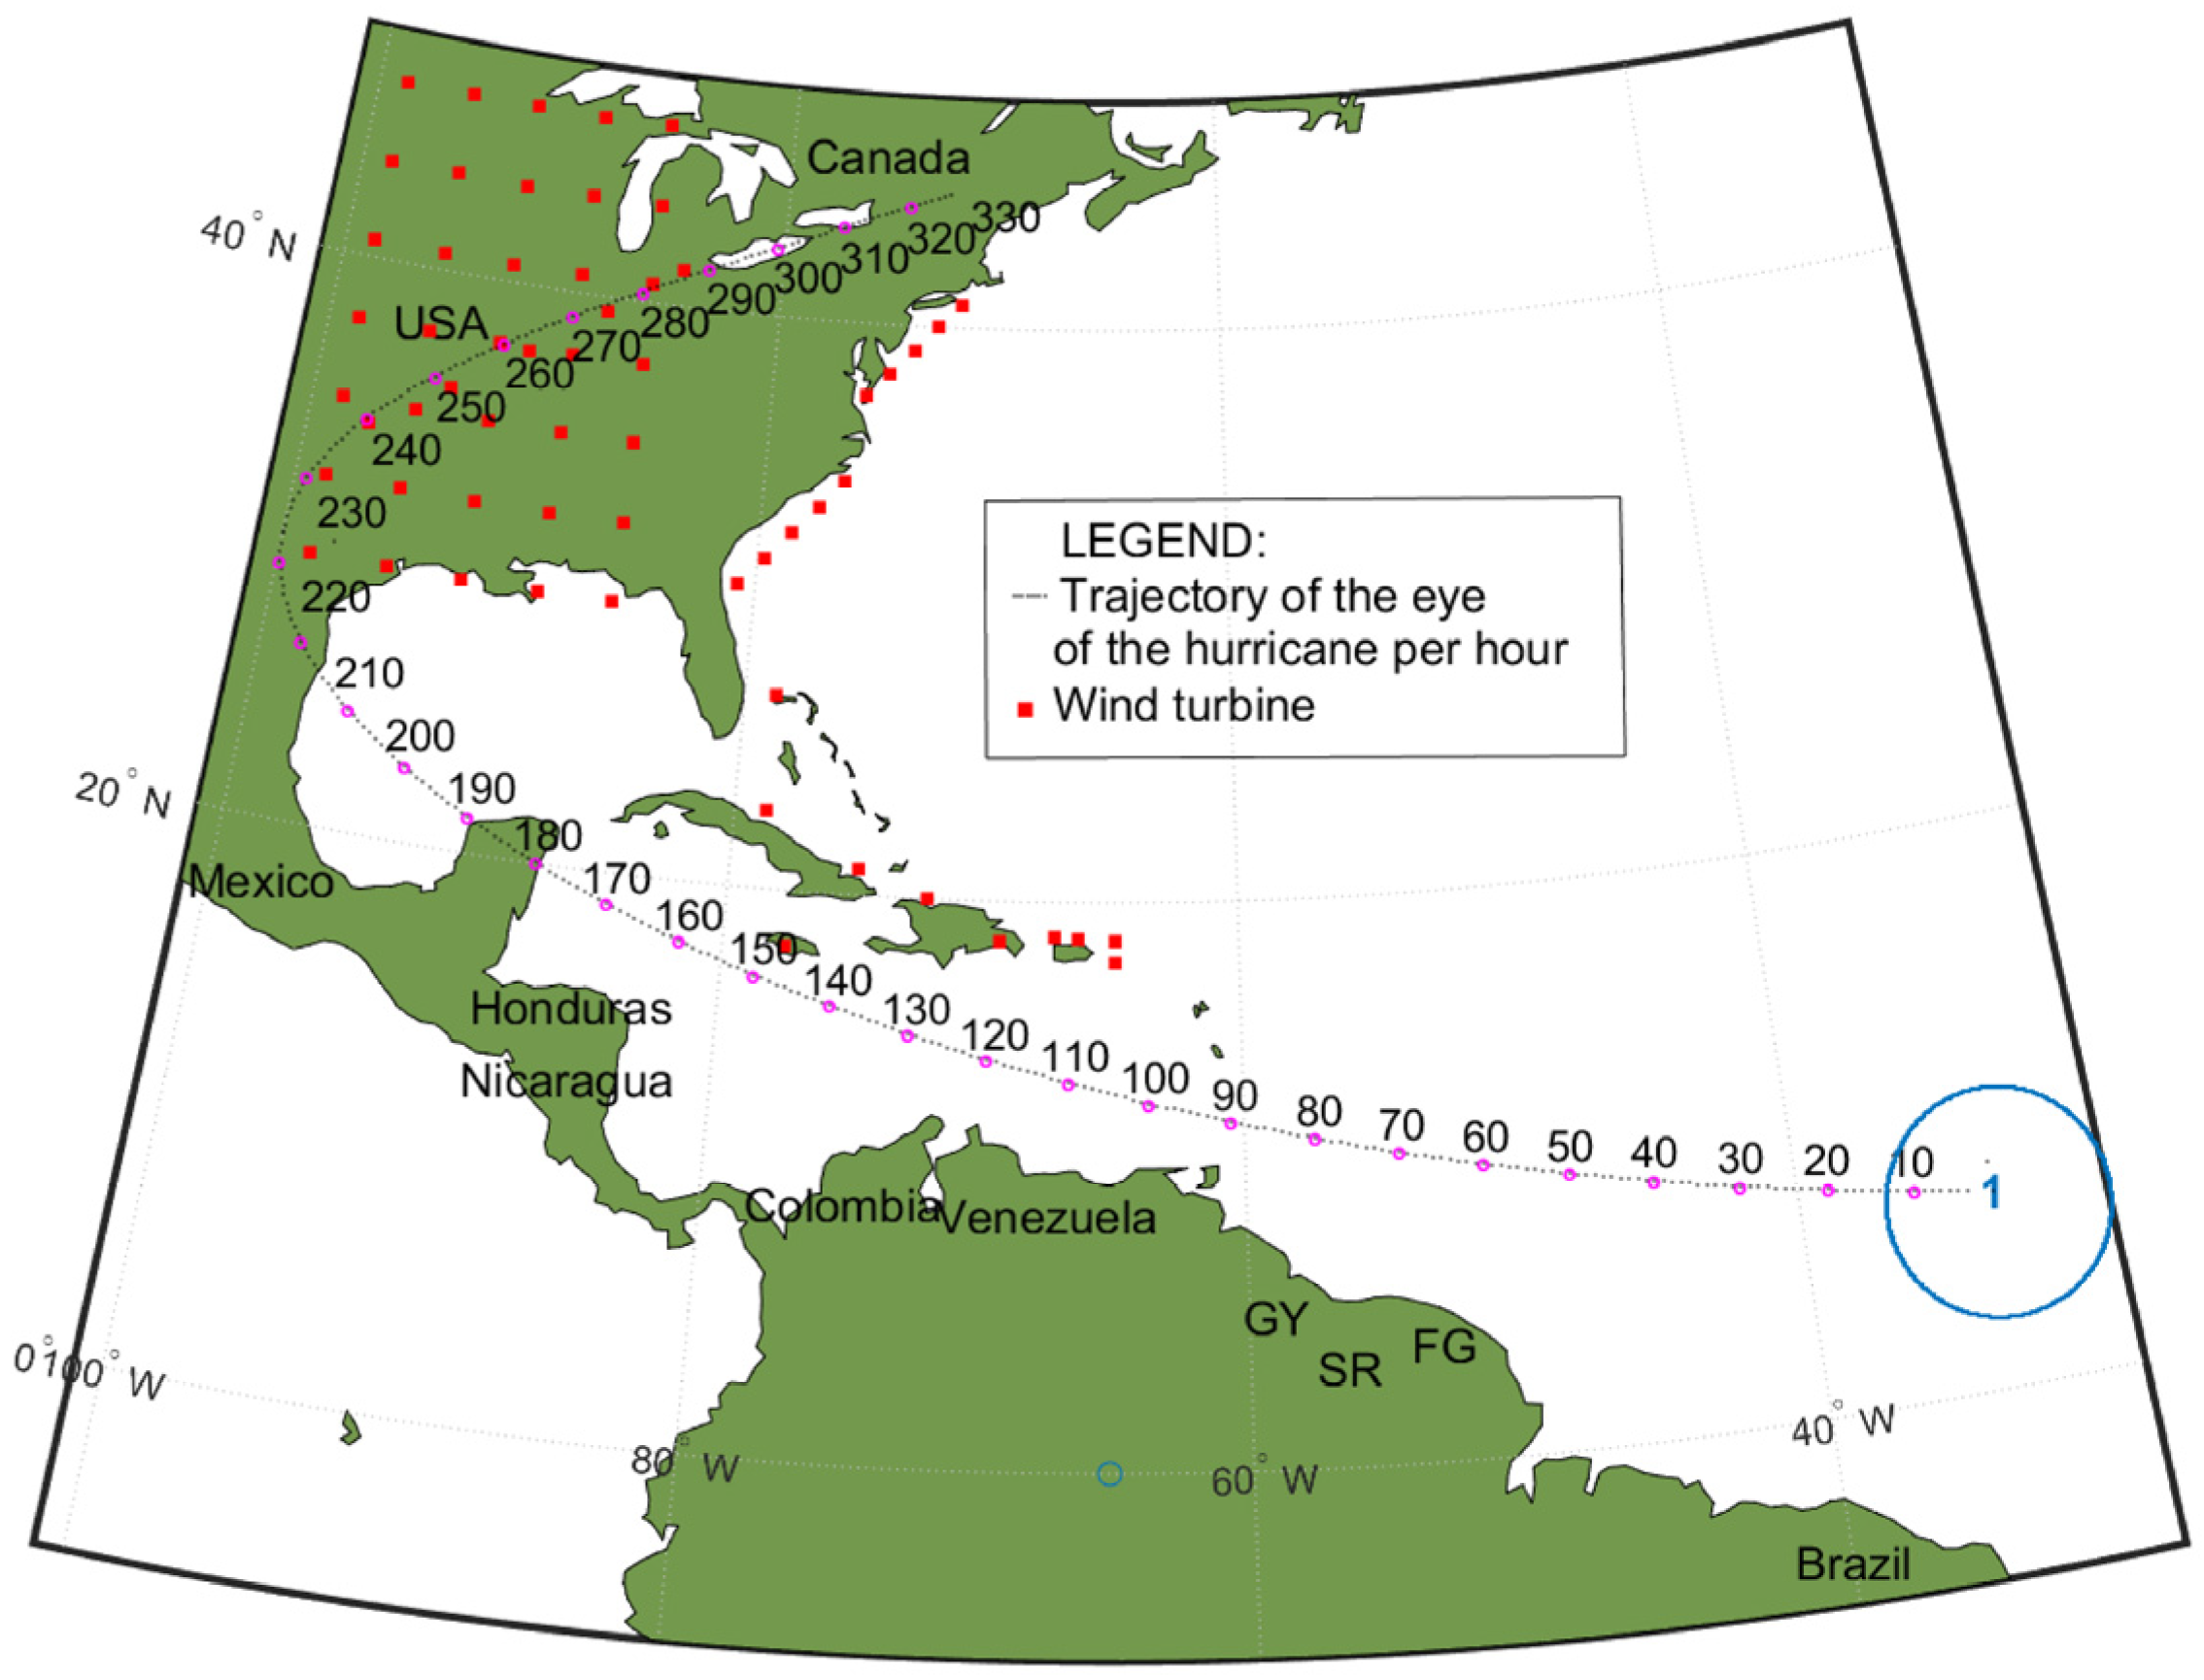
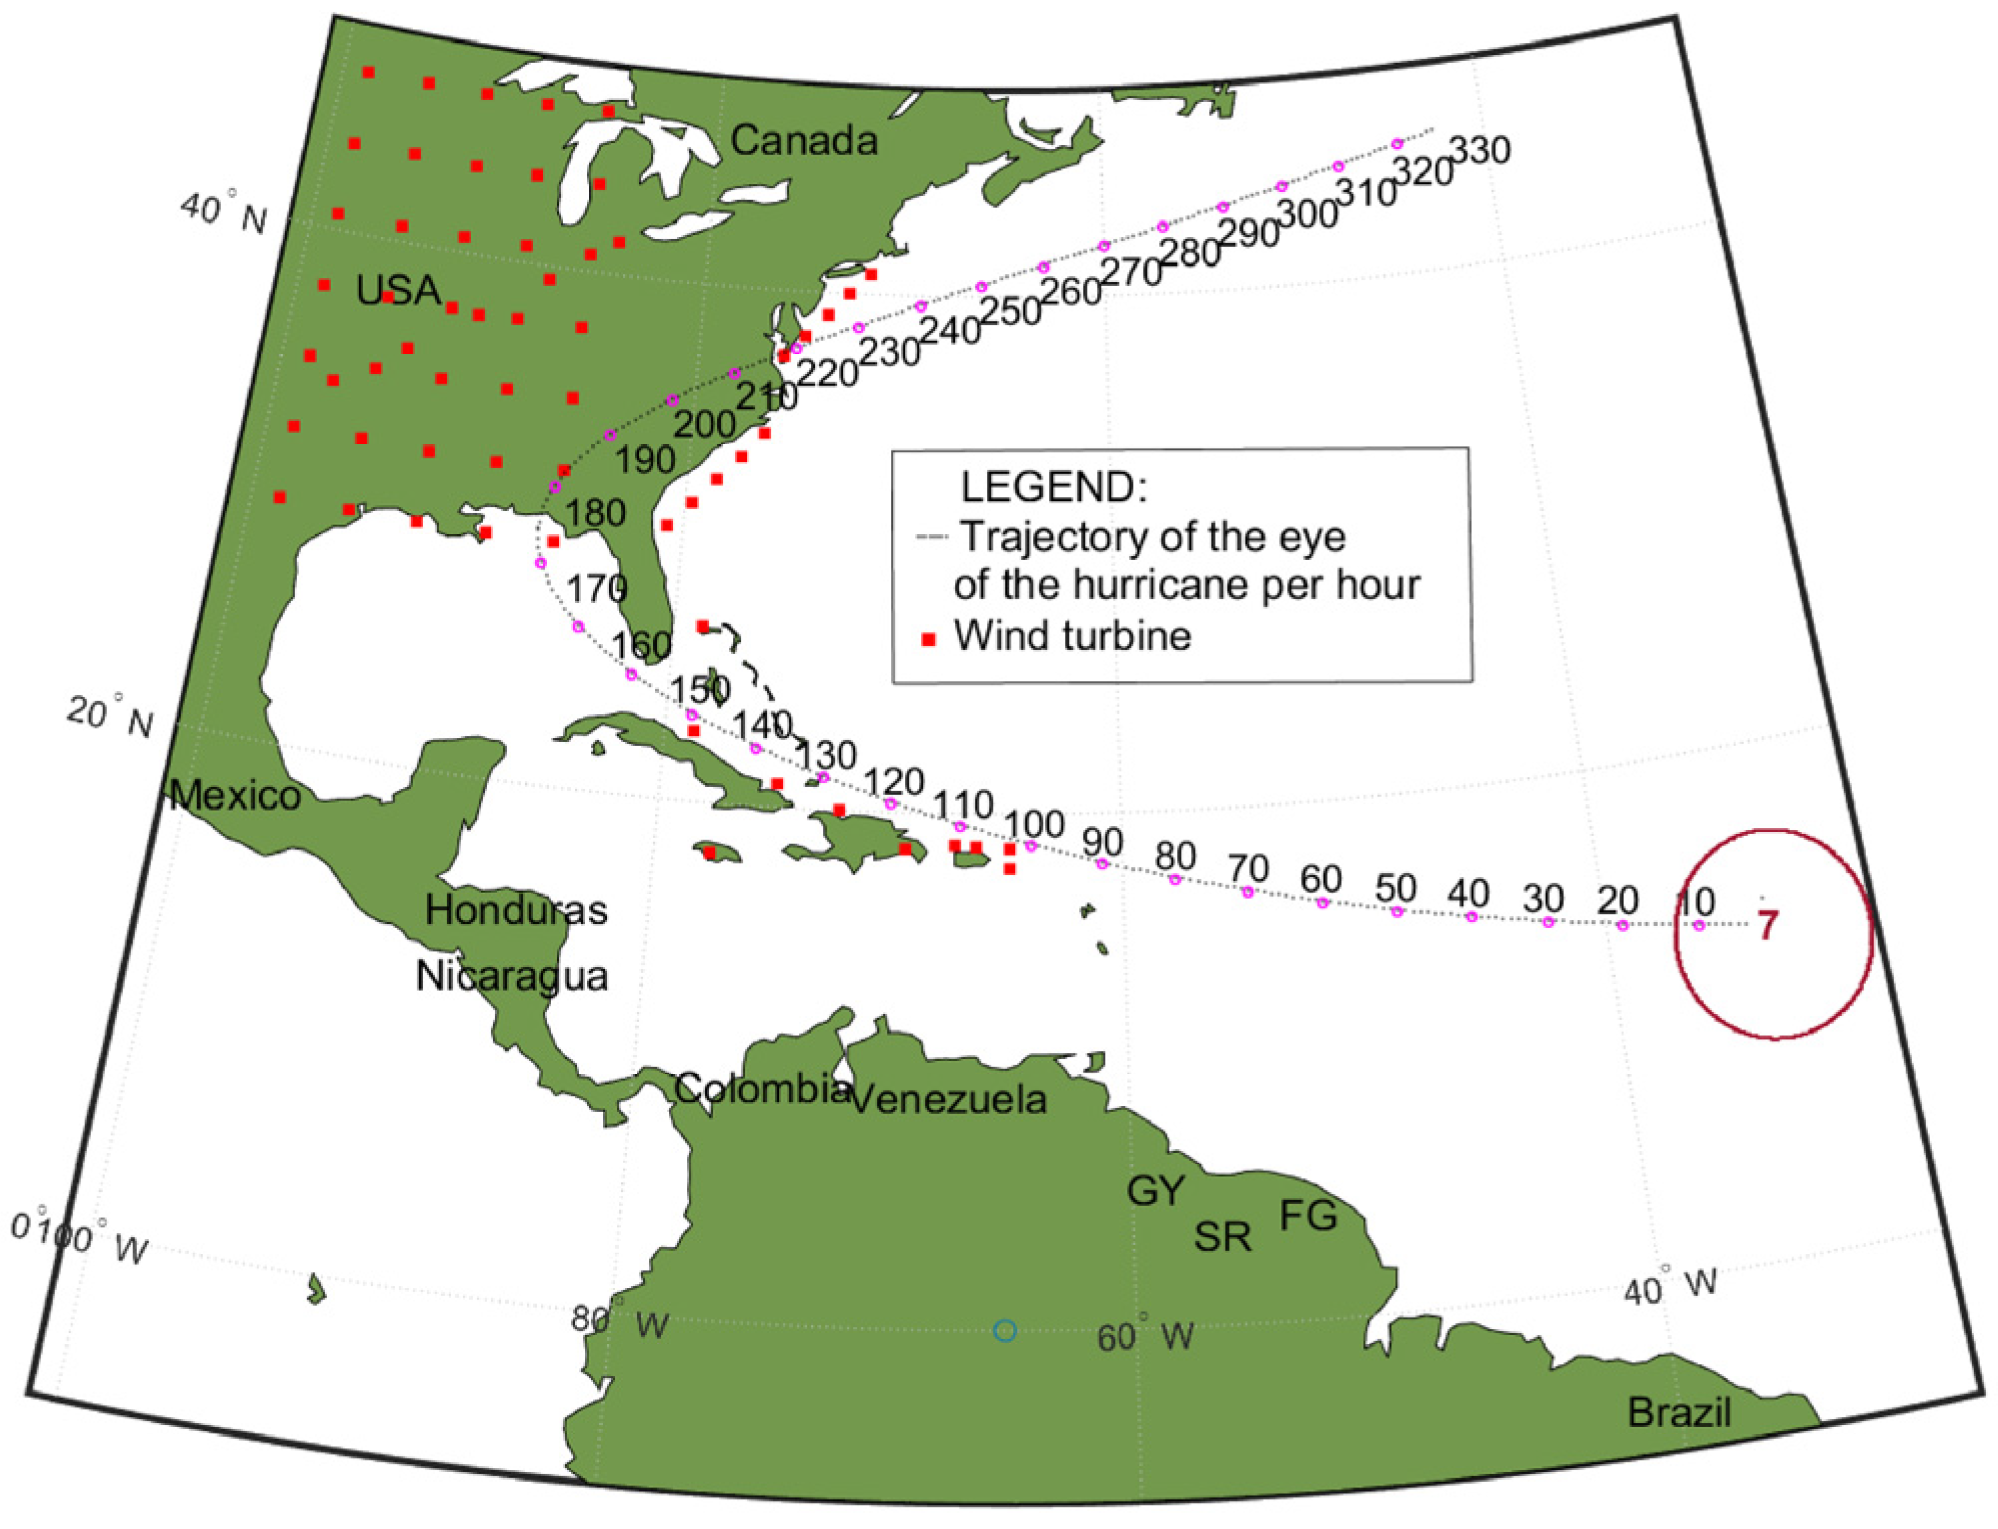
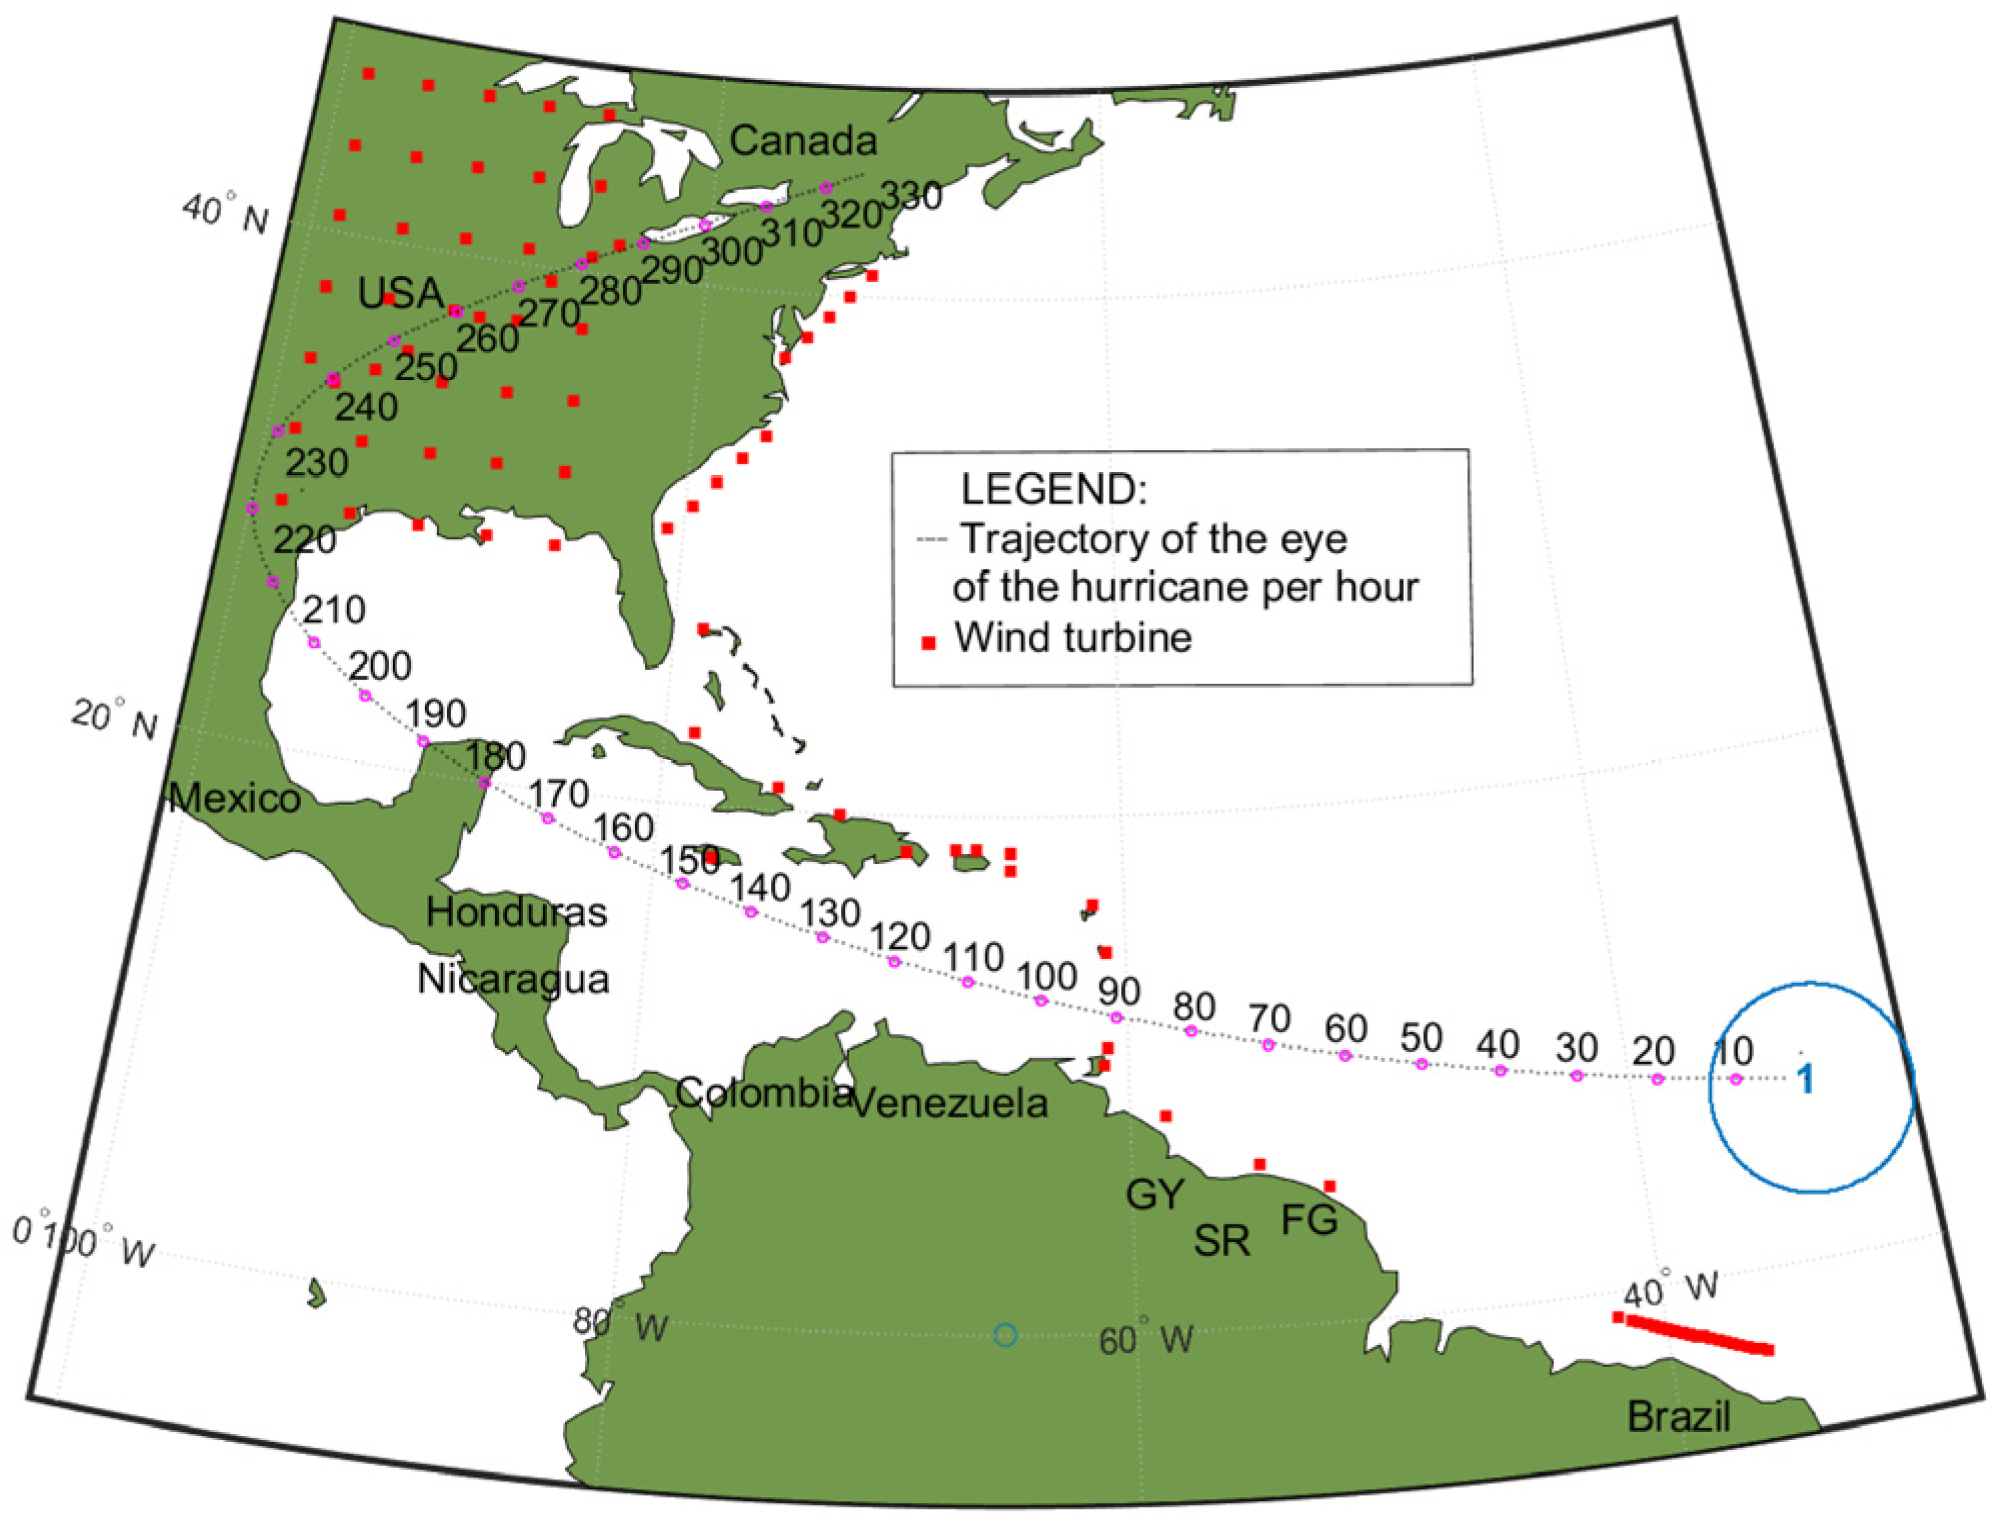
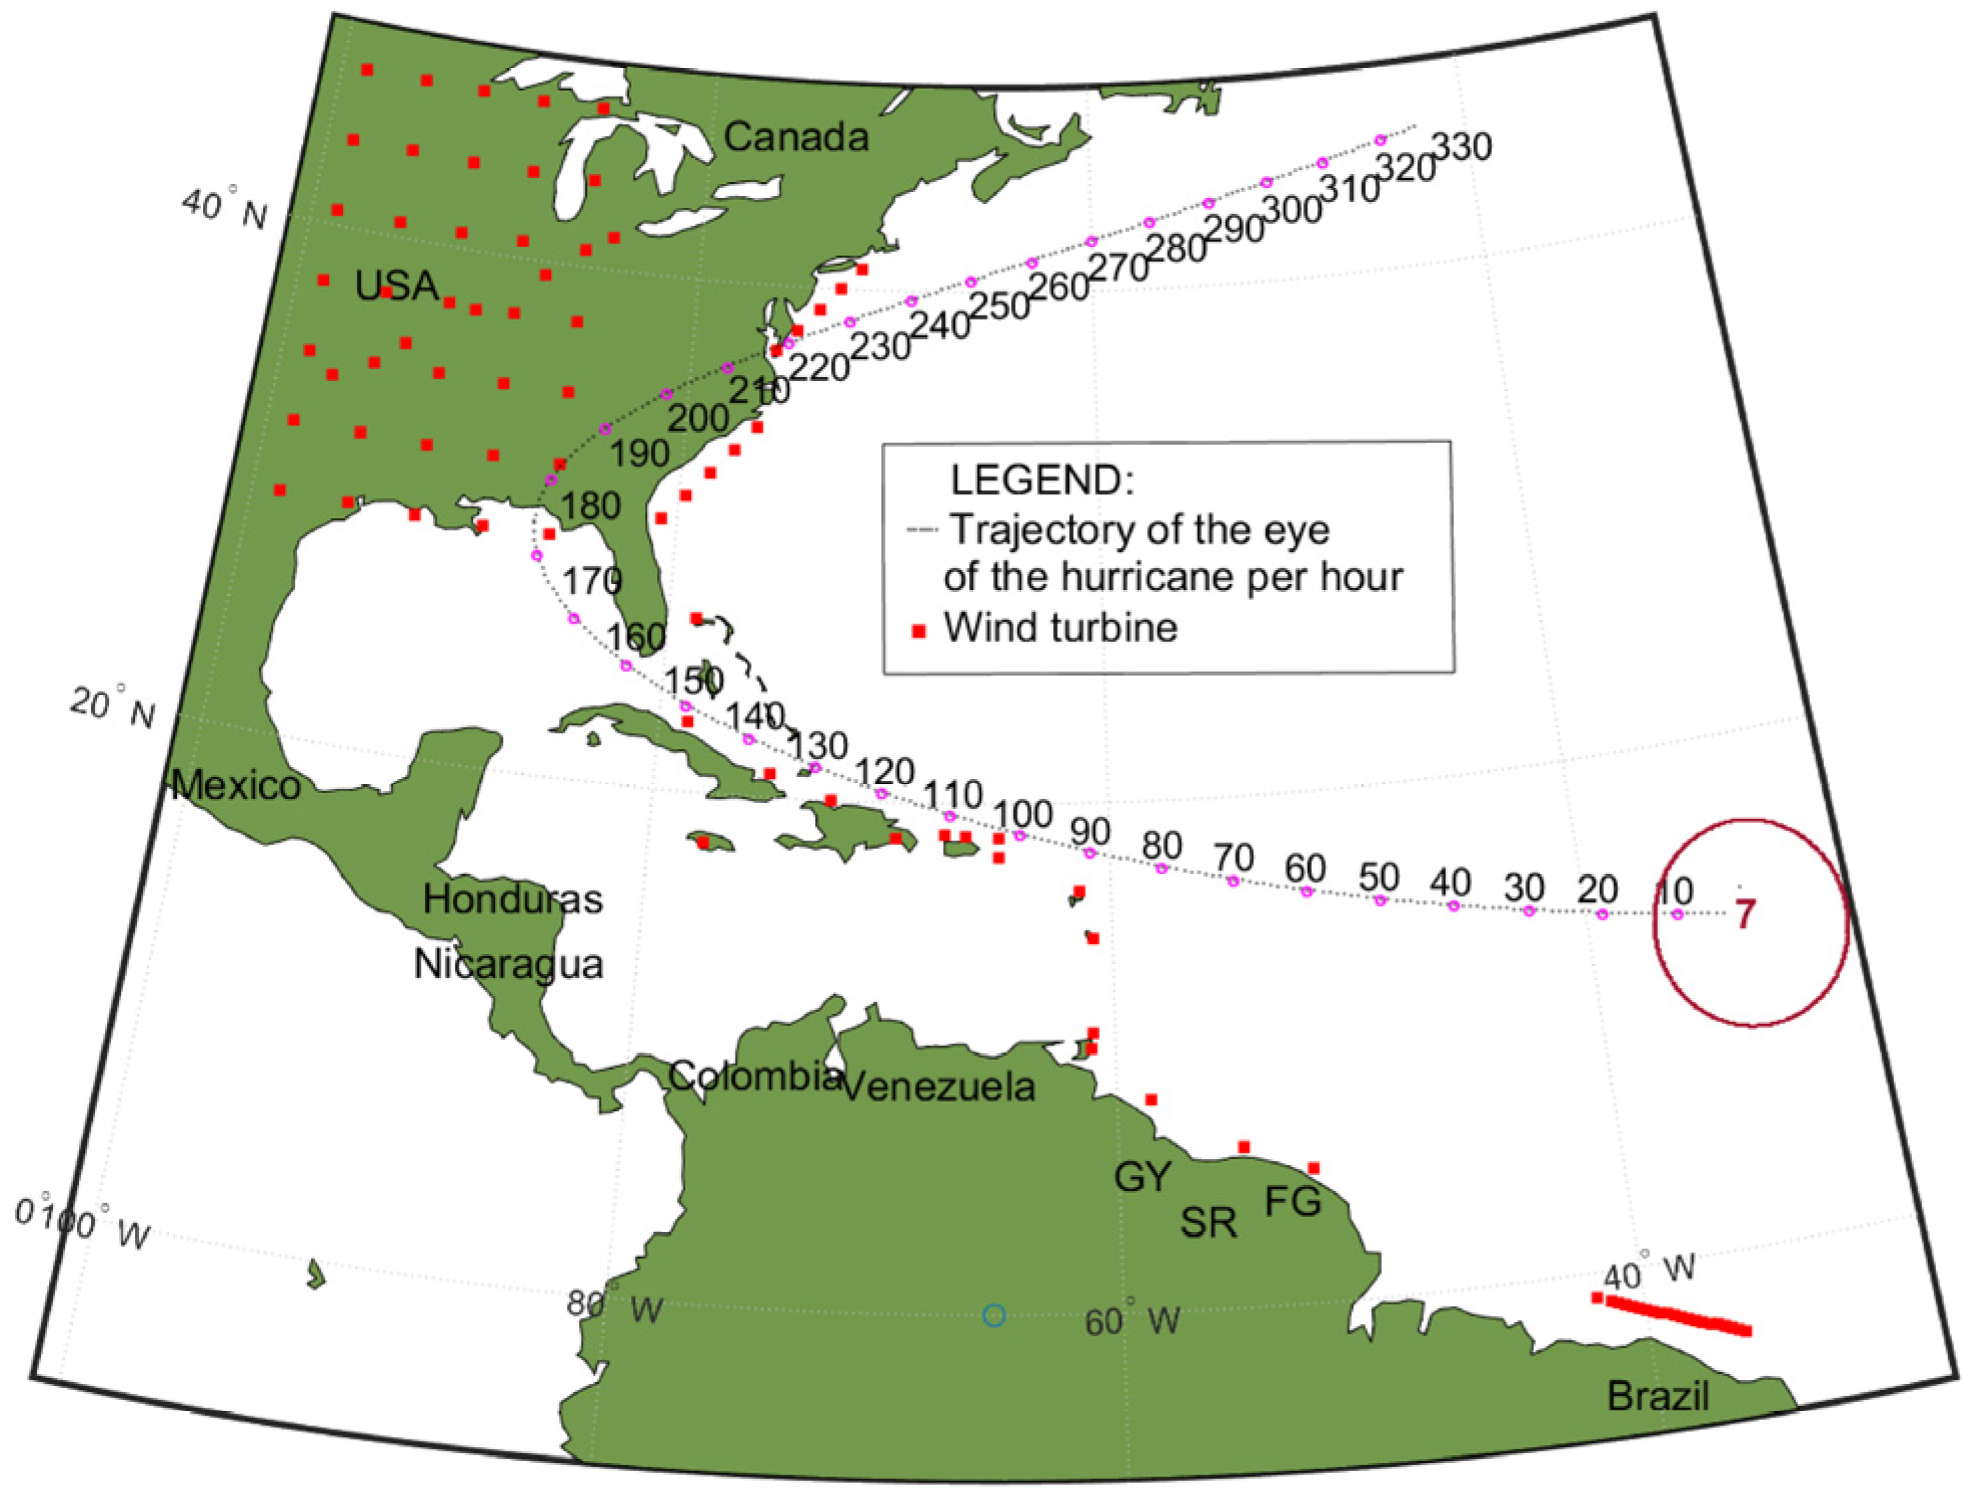
| • Hurricane trajectory (#1 and 7) |
| • Interconnection of Caribbean with South America (with or without) |
| Loop 1: Move hurricane each hour over Caribbeans |
| For i: = 1 to 336 hours (14 days) |
| Loop 2: Track all turbines for each hurricane-step |
| For j: = 1 to number_of_turbines |
| • Move hurricane’s eye 1-hour step on parabola trajectory. |
| • Calculate distance d between hurricane eye and turbine j. |
| • Calculate angle between hurricane front and turbine location. |
| • Obtain the wind speed on turbine location. |
| • Store the sum of wind speed of all turbines in each hour. |
| • Obtain and store the instantaneous turbine power profile. |
| • Store the sum of power profile of all turbines in each hour. |
| End of Loop 2 |
| End of Loop 1 |
| Calculate Energy of Hurricane [MWh] |
| Calculate reduction of cost of fossil energy [$] |
| Calculate CO2 emissions [tons] |
| Plot results: |
| • map of hurricane trajectory |
| • power profile of all turbines. |
3. Results
3.1. Scenario 1
3.2. Scenario 2
3.3. Scenario 3
3.4. Scenario 4
3.5. Comparative Analysis between Scenarios
4. Discussion
4.1. Contributions of This Work
4.2. Limitations and Topics for Future Research
5. Conclusions
Author Contributions
Funding
Data Availability Statement
Conflicts of Interest
References
- Hua, H.; Qin, Z.; Dong, N.; Qin, Y.; Ye, M.; Wang, Z.; Chen, X.; Cao, J. Data-Driven Dynamical Control for Bottom-up Energy Internet System. IEEE Trans. Sustain. Energy 2022, 13, 315–327. [Google Scholar] [CrossRef]
- Relva, S.G.; da Silva, V.O.; Gimenes, A.L.V.; Udaeta, M.E.M.; Ashworth, P.; Peyerl, D. Enhancing developing countries’ transition to a low-carbon electricity sector. Energy 2021, 220, 119659. [Google Scholar] [CrossRef]
- Muhs, J.W.; Parvania, M. Stochastic Spatio-Temporal Hurricane Impact Analysis for Power Grid Resilience Studies. In Proceedings of the 2019 IEEE Power & Energy Society Innovative Smart Grid Technologies Conference (ISGT), Washington, DC, USA, 18–21 February 2019; pp. 1–5. [Google Scholar] [CrossRef]
- Watson, E.B.; Etemadi, A.H. Modeling Electrical Grid Resilience Under Hurricane Wind Conditions With Increased Solar and Wind Power Generation. IEEE Trans. Power Syst. 2020, 35, 929–937. [Google Scholar] [CrossRef]
- Kwasinski, A. Effects of Hurricane Maria on Renewable Energy Systems in Puerto Rico. In Proceedings of the 2018 7th International Conference on Renewable Energy Research and Applications (ICRERA), Paris, France, 14–17 October 2018; pp. 383–390. [Google Scholar] [CrossRef]
- Papari, B.; Edrington, C.S.; Ghadamyari, M.; Ansari, M.; Ozkan, G.; Chowdhury, B. Metrics Analysis Framework of Control and Management System for Resilient Connected Community Microgrids. IEEE Trans. Sustain. Energy 2022, 13, 704–714. [Google Scholar] [CrossRef]
- Itiki, R.; Manjrekar, M.; Di Santo, S.G.; Itiki, C. Method for spatiotemporal wind power generation profile under hurricanes: U.S.-Caribbean super grid proposition. Renew. Sustain. Energy Rev. 2023, 173, 113082. [Google Scholar] [CrossRef]
- Chen, Y.T.; Knüpfer, K.; Esteban, M.; Shibayama, T. Analysis of the impact of offshore wind power on the Japanese energy grid. AIMS Energy 2023, 11, 110–134. [Google Scholar] [CrossRef]
- Silva, A.R.; Pimenta, F.M.; Assireu, A.T.; Spyrides, M.H.C. Complementarity of Brazil’s hydro and offshore wind power. Renew. Sustain. Energy Rev. 2016, 56, 413–427. [Google Scholar] [CrossRef]
- Paula, M.; Marilaine, C.; Nuno, F.J.; Wallace, C. Predicting Long-Term Wind Speed in Wind Farms of Northeast Brazil: A Comparative Analysis Through Machine Learning Models. IEEE Lat. Am. Trans. 2020, 18, 2011–2018. [Google Scholar] [CrossRef]
- U.S. Department of Commerce. National Weather Service, North Atlantic Hurricane Tracking Chart 2020. Available online: https://www.nhc.noaa.gov/data/tracks/tracks-at-2020.png (accessed on 8 October 2023).
- Fan, R.; Zeng, W.; Ming, Z.; Zhang, W.; Huang, R.; Liu, J. Risk Reliability Assessment of Transmission Lines under Multiple Natural Disasters in Modern Power Systems. Energies 2023, 16, 6548. [Google Scholar] [CrossRef]
- Ghorbanzadeh, M.; Koloushani, M.; Ulak, M.B.; Ozguven, E.E.; Jouneghani, R.A. Statistical and Spatial Analysis of Hurricane-induced Roadway Closures and Power Outages. Energies 2020, 13, 1098. [Google Scholar] [CrossRef]
- Zhu, Q.; Chen, J.; Shi, D.; Zhu, L.; Bai, X.; Duan, X.; Liu, Y. Learning Temporal and Spatial Correlations Jointly: A Unified Framework for Wind Speed Prediction. IEEE Trans. Sustain. Energy 2020, 11, 509–523. [Google Scholar] [CrossRef]
- Yang, M.; Zhang, L.; Cui, Y.; Zhou, Y.; Chen, Y.; Yan, G. Investigating the Wind Power Smoothing Effect Using Set Pair Analysis. IEEE Trans. Sustain. Energy 2020, 11, 1161–1172. [Google Scholar] [CrossRef]
- Wu, C.; Zhang, X.-P.; Sterling, M.J.H. Global Electricity Interconnection With 100% Renewable Energy Generation. IEEE Access 2021, 9, 113169–113186. [Google Scholar] [CrossRef]
- Chacón-Barrantes, S.; López-Venegas, A.; Sánchez-Escobar, R.; Luque-Vergara, N. A Collaborative Effort Between Caribbean States for Tsunami Numerical Modeling: Case Study CaribeWave15. Pure Appl. Geophys. 2018, 175, 1405–1428. [Google Scholar] [CrossRef]
- Holland, G.J. An Analytic Model of the Wind and Pressure Profiles in Hurricanes. Mon. Weather. Rev. 1980, 108, 1212–1218. [Google Scholar] [CrossRef]
- Naderi, E.; Pourakbari-Kasmaei, M.; Lehtonen, M. Transmission expansion planning integrated with wind farms: A review, comparative study, and a novel profound search approach. Int. J. Electr. Power Energy Syst. 2020, 115, 105460. [Google Scholar] [CrossRef]
- U.S. Department of Energy. Anguilla Energy Snapshot, National Renewable Energy Laboratory. May 2020. Available online: https://www.energy.gov/eere/articles/anguilla-island-energy-snapshot-2020 (accessed on 8 October 2023).
- Central Intelligence Agency. The World Factbook—Explore All Countries. Available online: https://www.cia.gov/the-world-factbook/countries/ (accessed on 8 October 2023).
- Rakotoson, V.; Praene, J.P. A life cycle assessment approach to the electricity generation of French overseas territories. J. Clean. Prod. 2017, 168, 755–763. [Google Scholar] [CrossRef]
- Sterl, S.; Donk, P.; Willems, P.; Thiery, W. Turbines of the Caribbean: Decarbonising Suriname’s electricity mix through hydro-supported integration of wind power. Renew. Sustain. Energy Rev. 2020, 134, 110352. [Google Scholar] [CrossRef]
- Agencia National de Energia Eletrica, Matrix Eletrica Brasileira (Brazilian Energy Matrix). Available online: https://app.powerbi.com/view?r=eyJrIjoiNjc4OGYyYjQtYWM2ZC00YjllLWJlYmEtYzdkNTQ1MTc1NjM2IiwidCI6IjQwZDZmOWI4LWVjYTctNDZhMi05MmQ0LWVhNGU5YzAxNzBlMSIsImMiOjR9 (accessed on 24 November 2023).
- Chapman, S.J. Electric Machinery Fundamentals; McGraw-Hill: New York, NY, USA, 2004. [Google Scholar]
- Aldersey-Williams, J.; Rubert, T. Levelised cost of energy—A theoretical justification and critical assessment. Energy Policy 2019, 124, 169–179. [Google Scholar] [CrossRef]
- Shafiullah, M.; Ahmed, S.D.; Al-Sulaiman, F.A. Grid Integration Challenges and Solution Strategies for Solar PV Systems: A Review. IEEE Access 2022, 10, 52233–52257. [Google Scholar] [CrossRef]
- Mletzko, J.; Ehlers, S.; Kather, A. Comparison of Natural Gas Combined Cycle Power Plants with Post Combustion and Oxyfuel Technology at Different CO2 Capture Rates. Energy Procedia 2016, 86, 2–11. [Google Scholar] [CrossRef]
- Kaloti, S.; Kamal, F.; Al Mamun, A.; Chowdhury, B. Is Achieving Net-Zero Carbon Emissions Possible for Electric Utilities with Current Technology? In Proceedings of the 2021 North American Power Symposium (NAPS), College Station, TX, USA, 14–16 November 2021; pp. 1–6. [Google Scholar] [CrossRef]
- Zhang, Y.; Cheng, V.; Mallapragada, D.S.; Song, J.; He, G. A Model-Adaptive Clustering-Based Time Aggregation Method for Low-Carbon Energy System Optimization. IEEE Trans. Sustain. Energy 2023, 14, 55–64. [Google Scholar] [CrossRef]




| Var. | Abbrevation | Unit | Description | Value |
|---|---|---|---|---|
| degree | Latitude of the eye | Moving on the map | ||
| degree | Longitude of the eye | Moving on the map | ||
| t | days | Time from origin | 14 days | |
| cat | - | Category (3, 4, or 5) | 5 | |
| km | Radius of max speed | 27.78 | ||
| - | Holland parameter | 1.34 (offshore), 1.22 (onshore) | ||
| Air density | 1.225 | |||
| km | Distance from the eye of the hurricane | Moving on the map | ||
| mbar | Ambient pressure | 1008 | ||
| mbar | Central pressure | 919 | ||
| m/s | Hurricane translation speed | 9.722 | ||
| rad | Angle between the hurricane front and turbine | Moving on the map | ||
| - | Coriolis parameter | Dependent on latitude |
| Var. | Abbreviation | Unit | Description |
|---|---|---|---|
| - | Trajectory number | ||
| degree | Latitude of the parabola at time k | ||
| degree | Longitude of the parabola at time k | ||
| degree | Latitude of the parabola vertex | ||
| degree | Longitude of the parabola vertex | ||
| h | One hour angle step | ||
| - | Parabola coefficient | ||
| - | Parabola coefficient | ||
| - | Parabola coefficient |
| 1 | 0.1270 | −1.9157 | −25.6145 |
| 2 | 0.1342 | −2.2922 | −23.0637 |
| 3 | 0.1423 | −2.7131 | −19.9252 |
| 4 | 0.1513 | −3.1866 | −16.0901 |
| 5 | 0.1614 | −3.7227 | −11.4218 |
| 6 | 0.1730 | −4.3341 | −5.7472 |
| 7 | 0.1862 | −5.0370 | 1.1560 |
| 8 | 0.2015 | −5.8525 | 9.5775 |
| 9 | 0.2193 | −6.8082 | 19.9013 |
| 10 | 0.2403 | −7.8513 | 31.2000 |
| Var. | Abbreviation | Unit | Value | Description |
|---|---|---|---|---|
| degree | User-defined | Latitude of the turbine | ||
| degree | User-defined | Longitude of the turbine | ||
| h | m | 90 | Hub height above the floor or sea level [7] | |
| MW | 10 | Rated power [7] | ||
| m/s | 14 | Rated speed [7] | ||
| m/s | 40 | High cutout speed [7] (2050 estimated) | ||
| m/s | 3 | Cut-in speed (minimum speed) [7] |
| Country or Territory | Population (million) | Installed Power Capacity (Estimated in 2016) [MW] | Installed Capacity Driven by Fossil Fuel |
|---|---|---|---|
| The Bahamas | 0.089 | 129 | 100% |
| Cuba | 11.3 | 6998 | 91% |
| Haiti | 11.5 | 332 | 82% |
| Dominican Republic | 11 | 3839 | 77% |
| Jamaica | 3 | 1078 | 83% |
| Puerto Rico | 2.8 | 6294 | 94% |
| U.S. Virgin Islands (St. Thomas and St. John) | 0.0557 | 172 | 98% |
| U.S. Virgin Islands (Saint Croix) | 0.0506 | 153 | 98% |
| The British Virgin Islands | 0.030 | 45 | 97% |
| Total | 39.825 | 19,040 | - |
| Country or Territory | Population | Installed Capacity [MW] | Installed Capacity Driven by Fossil Fuel |
|---|---|---|---|
| Anguilla | 19,079 | 26 | 96.2% |
| Montserrat | 5440 | 5 | 91% |
| Guadeloupe | 411,507 | 551.2 | 68.9% |
| Dominica | 74,629 | 42 | 74.8% |
| Martinique | 361,225 | 438.1 | 85.1% |
| St. Lucia | 167,122 | 92 | 99.1% |
| St. Vincent and the Grenadines | 100,969 | 49 | 73.5% |
| Grenada | 113,949 | 55 | 98.3% |
| Trinidad and Tobago | 1,405,646 | 2123 | 99.9% |
| Guyana | 789,683 | 380 | 97.4% |
| Suriname | 632,638 | 542 | 40.5% |
| French Guyana | 327,000 | 281.2 | 45.3% |
| Brazil | 217,240,060 | 199,037 | 11.8% |
| Total | 221,648,947 | 203,621 | 13.4% |
| U.S.–Caribbean Super Grid | Without Extension to South America | With Extension to South America |
|---|---|---|
| Number of turbines | 75 (U.S.) and 10 (North Caribbean) | 75 (U.S.), 10 (North Caribbean), 4 (South Caribbean), and 24 (South America) |
| Onshore/offshore turbines | 62/23 | 62/51 |
| Scenarios | Scenario #1 and Scenario #2 | Scenario #3 and Scenario #4 |
| Power profiles | Figure 3 and Figure 5 (trajectory 1 and 7) | Figure 7 and Figure 9 (trajectory 1 and 7) |
| Location of peak: | Caribbean | Caribbean |
| Pmax [MW] | 240 and 245 | 400 and 370 |
| Pmin [MW] | 198 and 198 | 335 and 335 |
| 17.50% and 19.18% | 16.25% and 9.46% | |
| Location of peak: | U.S. Midwest | U.S. Midwest |
| Pmax [MW] | 557 and 456 | 693 and 590 |
| Pmin [MW] | 198 and 198 | 335 and 335 |
| 64.45% and 56.58% | 51.66% and 43.22% |
| U.S.–Caribbean Super Grid | Without Extension to South America | With Extension to South America |
|---|---|---|
| Number of turbines | 85 | 113 |
| Scenarios | Scenario #1 and Scenario #2 | Scenario #3 and Scenario #4 |
| Trajectory | #1 and 7 | #1 and 7 |
| Wind energy [GWh] | 27.0 and 14.6 | 28.9 and 15.40 |
| Natural gas savings [USD millions] | 4.7 and 2.5 | 5.1 and 2.7 |
| CO2 reduction [tons] | 22,471 and 12,169 | 24,107 and 12,821 |
Disclaimer/Publisher’s Note: The statements, opinions and data contained in all publications are solely those of the individual author(s) and contributor(s) and not of MDPI and/or the editor(s). MDPI and/or the editor(s) disclaim responsibility for any injury to people or property resulting from any ideas, methods, instructions or products referred to in the content. |
© 2024 by the authors. Licensee MDPI, Basel, Switzerland. This article is an open access article distributed under the terms and conditions of the Creative Commons Attribution (CC BY) license (https://creativecommons.org/licenses/by/4.0/).
Share and Cite
Itiki, R.; Manjrekar, M.; Di Santo, S.G. Proposed Extension of the U.S.–Caribbean Super Grid to South America for Resilience during Hurricanes. Energies 2024, 17, 233. https://doi.org/10.3390/en17010233
Itiki R, Manjrekar M, Di Santo SG. Proposed Extension of the U.S.–Caribbean Super Grid to South America for Resilience during Hurricanes. Energies. 2024; 17(1):233. https://doi.org/10.3390/en17010233
Chicago/Turabian StyleItiki, Rodney, Madhav Manjrekar, and Silvio Giuseppe Di Santo. 2024. "Proposed Extension of the U.S.–Caribbean Super Grid to South America for Resilience during Hurricanes" Energies 17, no. 1: 233. https://doi.org/10.3390/en17010233
APA StyleItiki, R., Manjrekar, M., & Di Santo, S. G. (2024). Proposed Extension of the U.S.–Caribbean Super Grid to South America for Resilience during Hurricanes. Energies, 17(1), 233. https://doi.org/10.3390/en17010233


