Article

Study on the Effect of High-Concentration Oxygen Enrichment on Engine Performance and Exhaust Emissions Using Diesel Fuel and Palm Biodiesel Substitute Fuel

1
Faculty of Mechanical and Aerospace Engineering, Institut Teknologi Bandung, Bandung 40132, Indonesia
2
Research Center for Smart Mechatronics, National Research and Innovation Agency, KST Samaun Samadikun Jl. Sangkuriang, Dago, Coblong, Bandung 40135, Indonesia
*
Author to whom correspondence should be addressed.
Energies 2024, 17(1), 244; https://doi.org/10.3390/en17010244
Submission received: 30 November 2023 / Revised: 26 December 2023 / Accepted: 28 December 2023 / Published: 3 January 2024
(This article belongs to the Section A4: Bio-Energy)

Abstract

:
Air pollution remains a big issue in many countries. One form of air pollution comes from the use of fossil fuels as the primary fuel in the power generating and transportation sectors. Diesel engines are employed in a variety of industries due to their dependability, durability, and efficiency. Enhancing the availability of oxygen within the combustion chamber is one technique for reducing exhaust gas emissions and optimizing diesel engine combustion. The aim of this study is to investigate how oxygen enrichment in diesel engines with diesel fuel and biodiesel affects their performance and emissions. The modeling in this research was carried out using AVL BOOST version 2011 software based on experimental results of the YANMAR TF 155 R-DI diesel engine at 1200 rpm with and without oxygen enrichment. Modeling was performed based on the baseline parameter of a diesel engine with gradual loads at 50%, 75%, and 100%. The oxygen concentration was increased to 30.6%, 37.8%, 45%, and 54% by mass. The results show an increase in the maximum heat release rate (HRR) and the mass fraction burned (MFB) up to 90% for both fuels. The peak heat release rate of biodiesel shifts around 6 J/degree and the brake-specific fuel consumption (BSFC) is up to 0.0035 kg/kWh higher than that of diesel fuel. When compared to diesel fuel, the thermal efficiency and BSFC of biodiesel usage are around 0.3% and 0.028 kg/kWh, respectively. NOx emissions increase due to higher combustion temperatures and more oxygen availability. Biodiesel emits 50% less NOx than diesel fuel, presumably due to a lower combustion temperature. As a result, while high-concentration oxygen enrichment improves combustion and lowers soot emissions, it raises NOx emissions. Soot emissions were reduced as a result of the enhanced combustion process, while NOx emissions rose due to higher combustion temperatures and increased oxygen availability.

1. Introduction

Today, air pollution and climate change have become major issues in the world. These problems occur due to the uncontrollable utilization of fossil fuels in many sectors to support human life. One of the air pollution sources is the utilization of fossil fuel as the primary fuel in the power generation and transportation sectors. Government, researchers, and engine manufacturers are working together via regulation, innovation, and new technology application in that sector. One of the most reliable and durable energy conversion systems is a diesel engine. Diesel engines have advantages over other source power generation systems regarding their thermal effectiveness [1,2]. Much research and innovation has been conducted to comply with the increasingly strict environmental requirements that are the largest problem for diesel engine producers due to significant sources of pollution from diesel engines, particularly particulate matter emissions [3,4,5,6]. Fossil-based fuel contains carbon and hydrogen elements and, when completely burned, produces CO2 and H2O. Due to insufficient oxygen (O2), complete combustion will not occur to form CO2 and H2O, resulting in higher quantities of tiny particles (PM) and carbon monoxide (CO) in exhaust gases. Increasing the amount of oxygen content at the combustion chamber is one method that researchers have developed for enhancing diesel engine performance and lowering emissions. An increase in the amount of oxygen in the combustion chamber will cause the hydrocarbon components to be oxidized and lead to a more thorough burning [7]. There are two ways to supply oxygen to the combustion chamber: one is to mix it in with the intake air, and the other is to use oxygenated fuel.
Numerous investigations have been conducted to ascertain the impact of oxygen enrichment in conjunction with cylinder intake air on the effectiveness of and pollutants generated by diesel engines. According to Chin [8], adding more oxygen will shorten the ignition delay time and lessen noise generated by burning inside the combustion chamber. Combustion with oxygen-enriched air produces greater and more constant power, reduces ignition delay, reduces knocking, and allows for the use of lower-quality fuel [9]. According to Wai et al. [10], the combustion period is shortened when there is a higher oxygen content in the intake air or oxygenated fuel because it reduces pyrolysis and increases oxidation. Furthermore, oxygen enrichment will increase the combustion temperature and pace, resulting in rapid combustion [11]. This will increase the diesel engine’s thermal efficiency and specific power output. According to a study conducted by Kapusuz et al. [12], oxygen enrichment in the air reduces particulate matter, HC, and CO emissions.
Oxygen enrichment can also be carried out by using fuel containing oxygen [3,7,8,9,11,12], one of which is biodiesel [13,14,15]. The long-chain fatty acids found in vegetable oils and animal fats are the source of biodiesel [16]. Fatty acid methyl ester is the byproduct of a transesterification event that yields biodiesel [17,18]. The increasing need for fuel has encouraged a lot of research on biodiesel as a solution to replace or be used in conjunction with fossil fuels and reduce harmful exhaust emissions [19]. The use of biodiesel fuel at a concentration of 20% in Indonesia started commercially in 2018 and the concentration continues to be increased to this day. According to [20], the use of oxygenated fuel reduced soot and carbon dioxide emissions due to carbon atoms (C) bound to oxygen atoms. Furthermore, according to [13], the use of biodiesel lowers thermal efficiency because of the fuel’s reduced calorific value, yet the amount of CO and HC emissions produced is far less than when using diesel fuel.
Several studies have been conducted to ascertain the impact of oxygen enrichment on diesel engine performance and emissions using fuel [3,13] and air with oxygen concentrations less than 30% [7,8,9,11,12]. Aside from that, a number of studies have been performed on the application of biodiesel in diesel engines [13]. However, there is still a lack of research conducted by researchers regarding high-concentration oxygen enrichment in diesel engines using oxygenated fuel. This research was conducted to fulfill this deficiency.
The objective of this research is to figure out the effect of oxygen enrichment on diesel engines using oxygenated fuel that affects the combustion process and its emissions. This research was carried out via modeling using one-dimensional combustion software by AVL BOOST and experiments at the Internal Combustion Engine Laboratory of the National Research and Innovation Agency (BRIN). Moreover, the purpose of this research is to determine the critical point of oxygenated fuel added to diesel engines synchronized with the latest diesel engine technology.

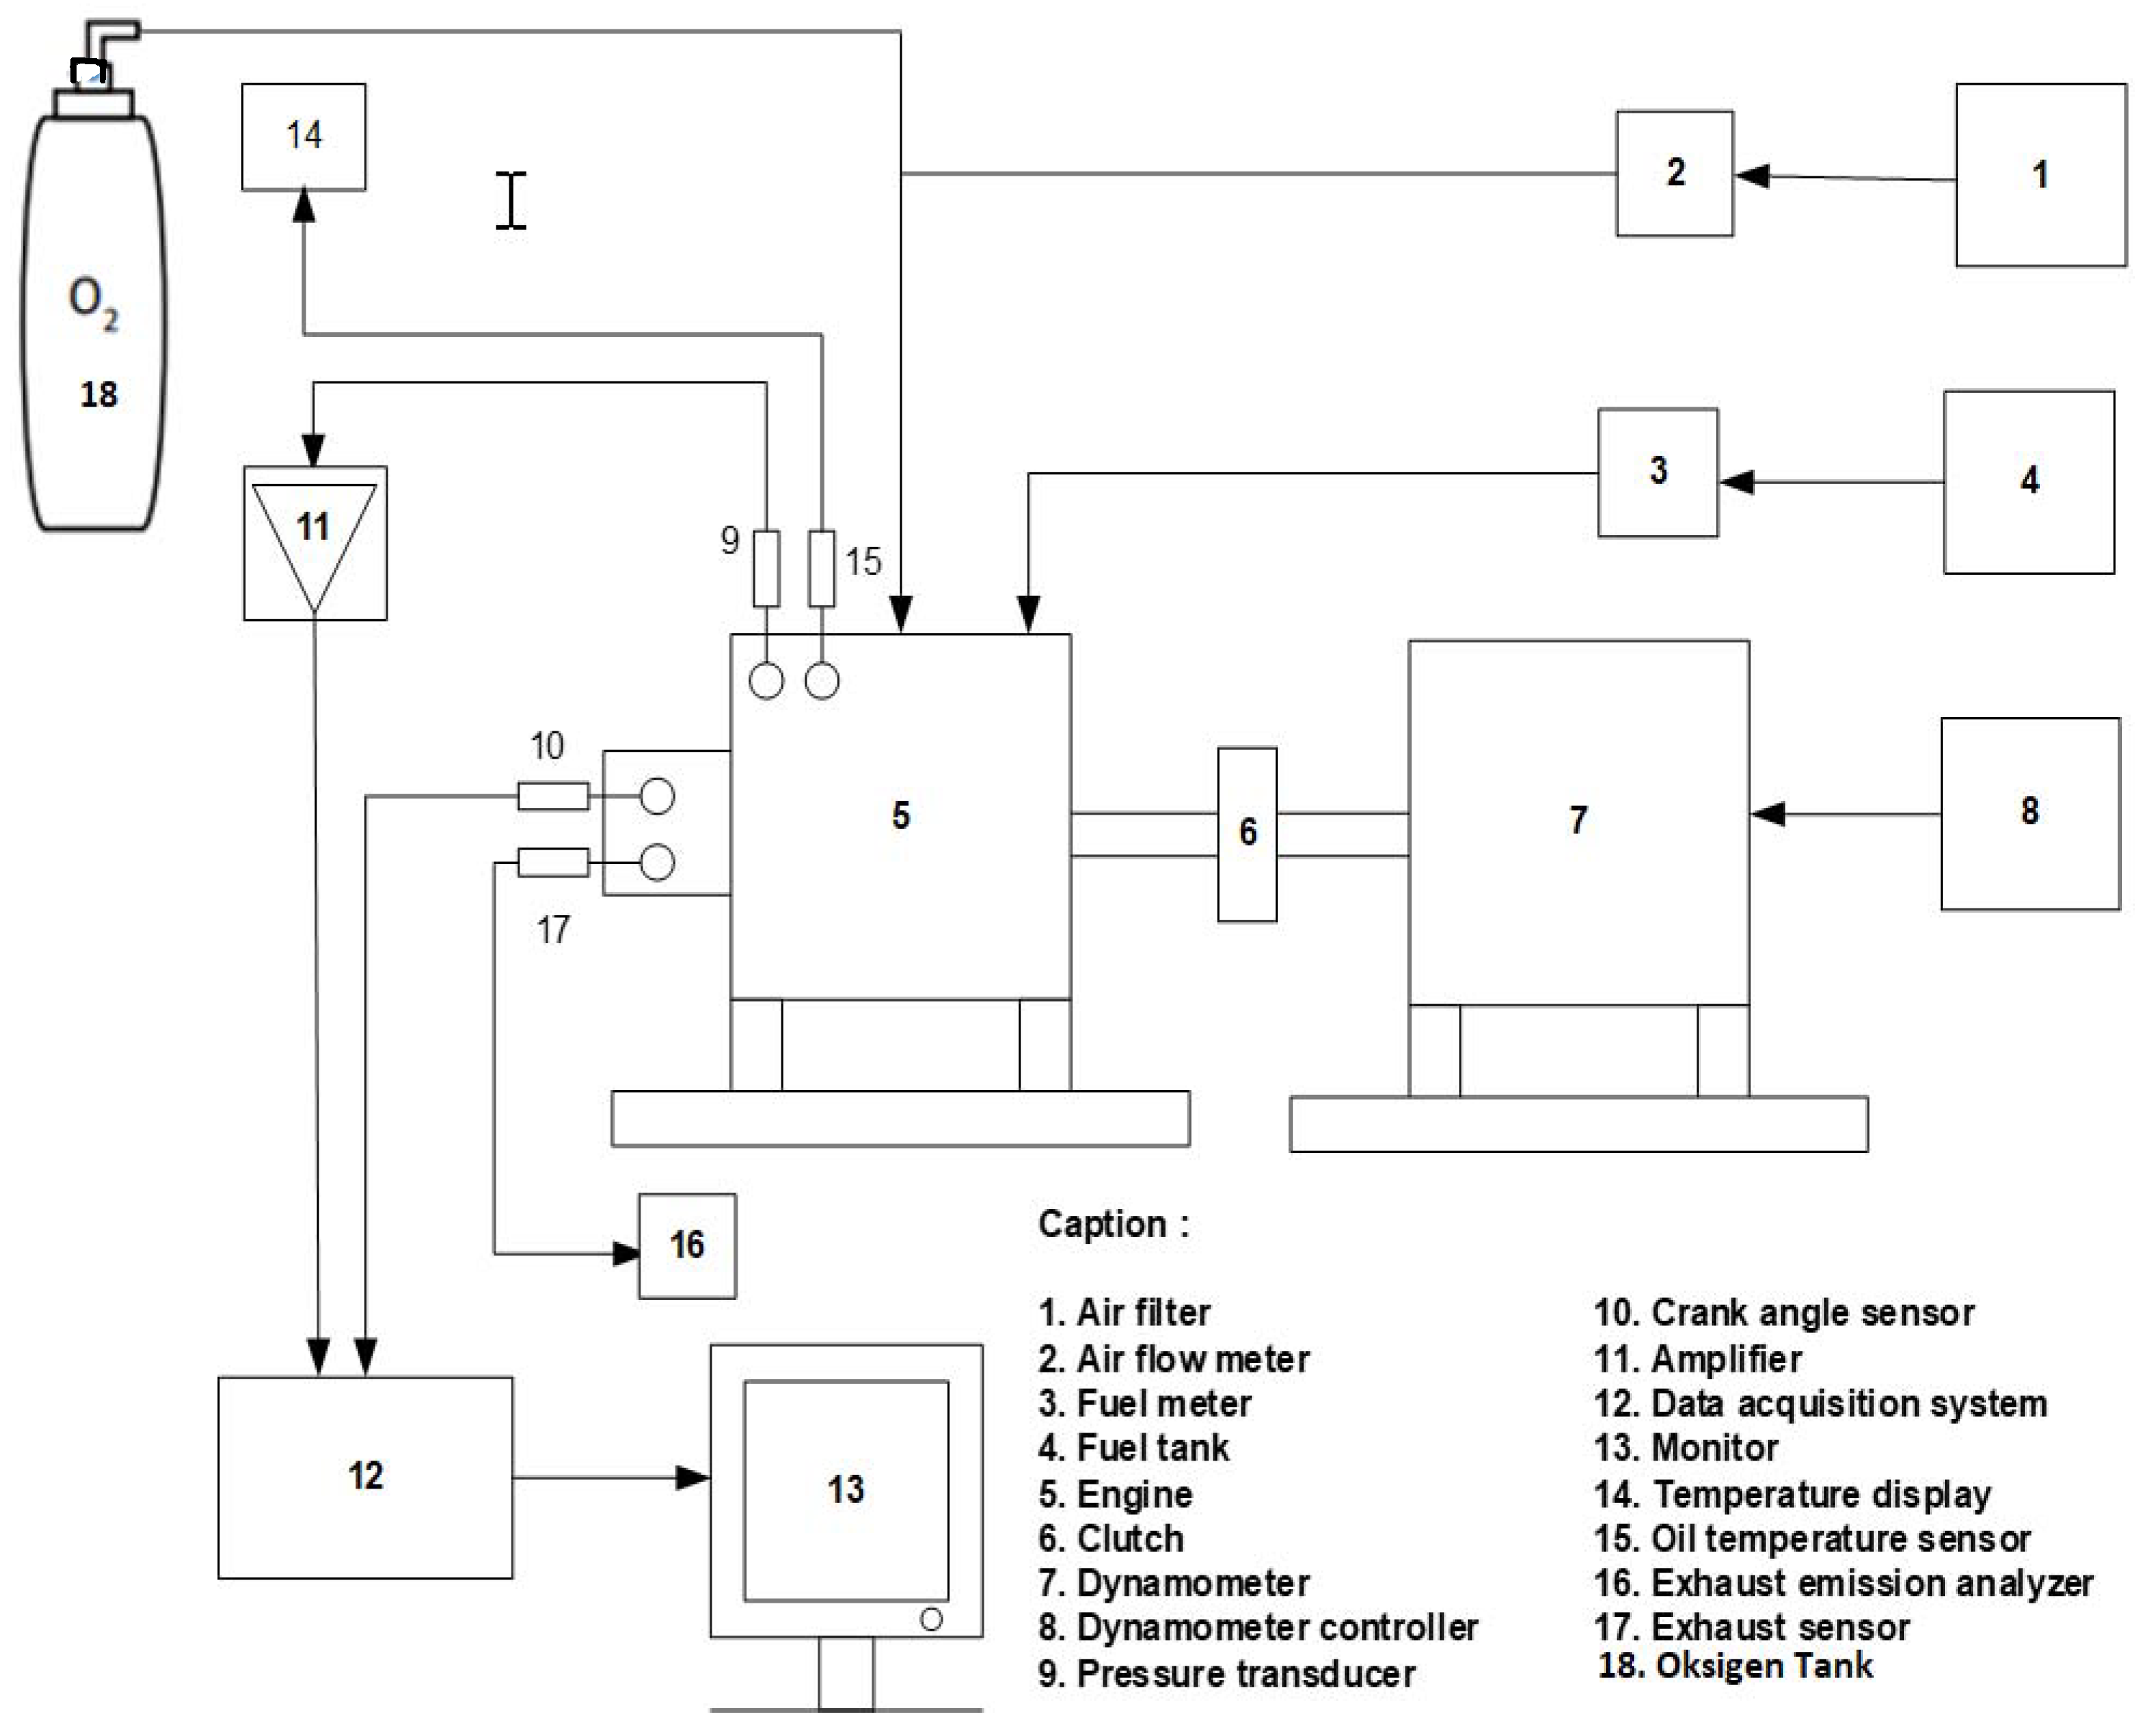
2. Experimental Setup

This research was carried out by conducting experiments and simulations using AVL BOOST version 2011 software at the Combustion Engine Laboratory, National Research and Innovation Agency. The experiment was carried out referring to the ISO/IEC 17025 laboratory quality management system [21] and the ISO 15550 testing standard which was adopted as the (SNI) Indonesian National Standard Number 09-7118 3-2005 for engine performance test procedures [22]. Based on this rule, the engine is run at certain revolutions using test fuel with varying loads. Then, the parameters are measured for each machine condition during operation including pressure, fuel consumption, air consumption, oil temperature, intake and exhaust air temperatures, cooling water temperature both entering and leaving the radiator, emissions, and other parameters. Data collection is carried out repeatedly in each test for data accuracy. Each measuring instrument and sensor has been properly calibrated and each has a measurement accuracy and uncertainty in accordance with its specifications. Test results were reported in accordance with the existing format and measurement uncertainty calculations were carried out guided by the ISO “Guide to Expression of Uncertainty in Measurement 1995” method. The experiment began by testing a YANMAR TF 155 R-DI diesel engine using an engine dynamometer SCHENK W-70 for collecting combustion, fuel consumption, and emission data. Combustion chamber pressure data was collected using a Kistler 6061B that was installed on the combustion chamber of the diesel engine. The temperatures at the inlet, exhaust, lubrication, and radiator were measured using a Type K thermocouple. Inlet and exhaust pressures were measured using a Kistler 4075A pressure transducer. The fuel mass flow rate was measured using an AVL 733. The air’s mass flow rate via the entrance was measured using a hot wire anemometer by TGS. The emission concentration was measured using a Horiba MEXA 720NOx. Additional pipe was put into the intake manifold hose of the YANMAR TF 155 R-DI diesel engine to serve additional oxygen from an oxygen gas container with a purity level of up to 96%, while a mass flow controller controlled the oxygen mass flow rate in the oxygen line at a pressure of 1.2 bar. Three distinct load circumstances were tested for each oxygen percentage: 2.89 kW (50% of full load), 4.33 kW (75% of full load), and 5.78 kW (100% full load) at a constant speed of 1200 rpm. Figure 1 shows several pieces of measurement equipment used to determine the state of the combustion engine and exhaust gas during the experiment.
In this experiment, a YANMAR TF 155 R-DI diesel engine was utilized; Table 1 displays the engine’s specifications.

2.1. Specifications of the Fuel

The diesel fuel tested in this study was Pertamina Dex produced by PT Pertamina. Table 2 lists the fuel’s characteristics.

2.2. Calculation of Oxygen Concentration
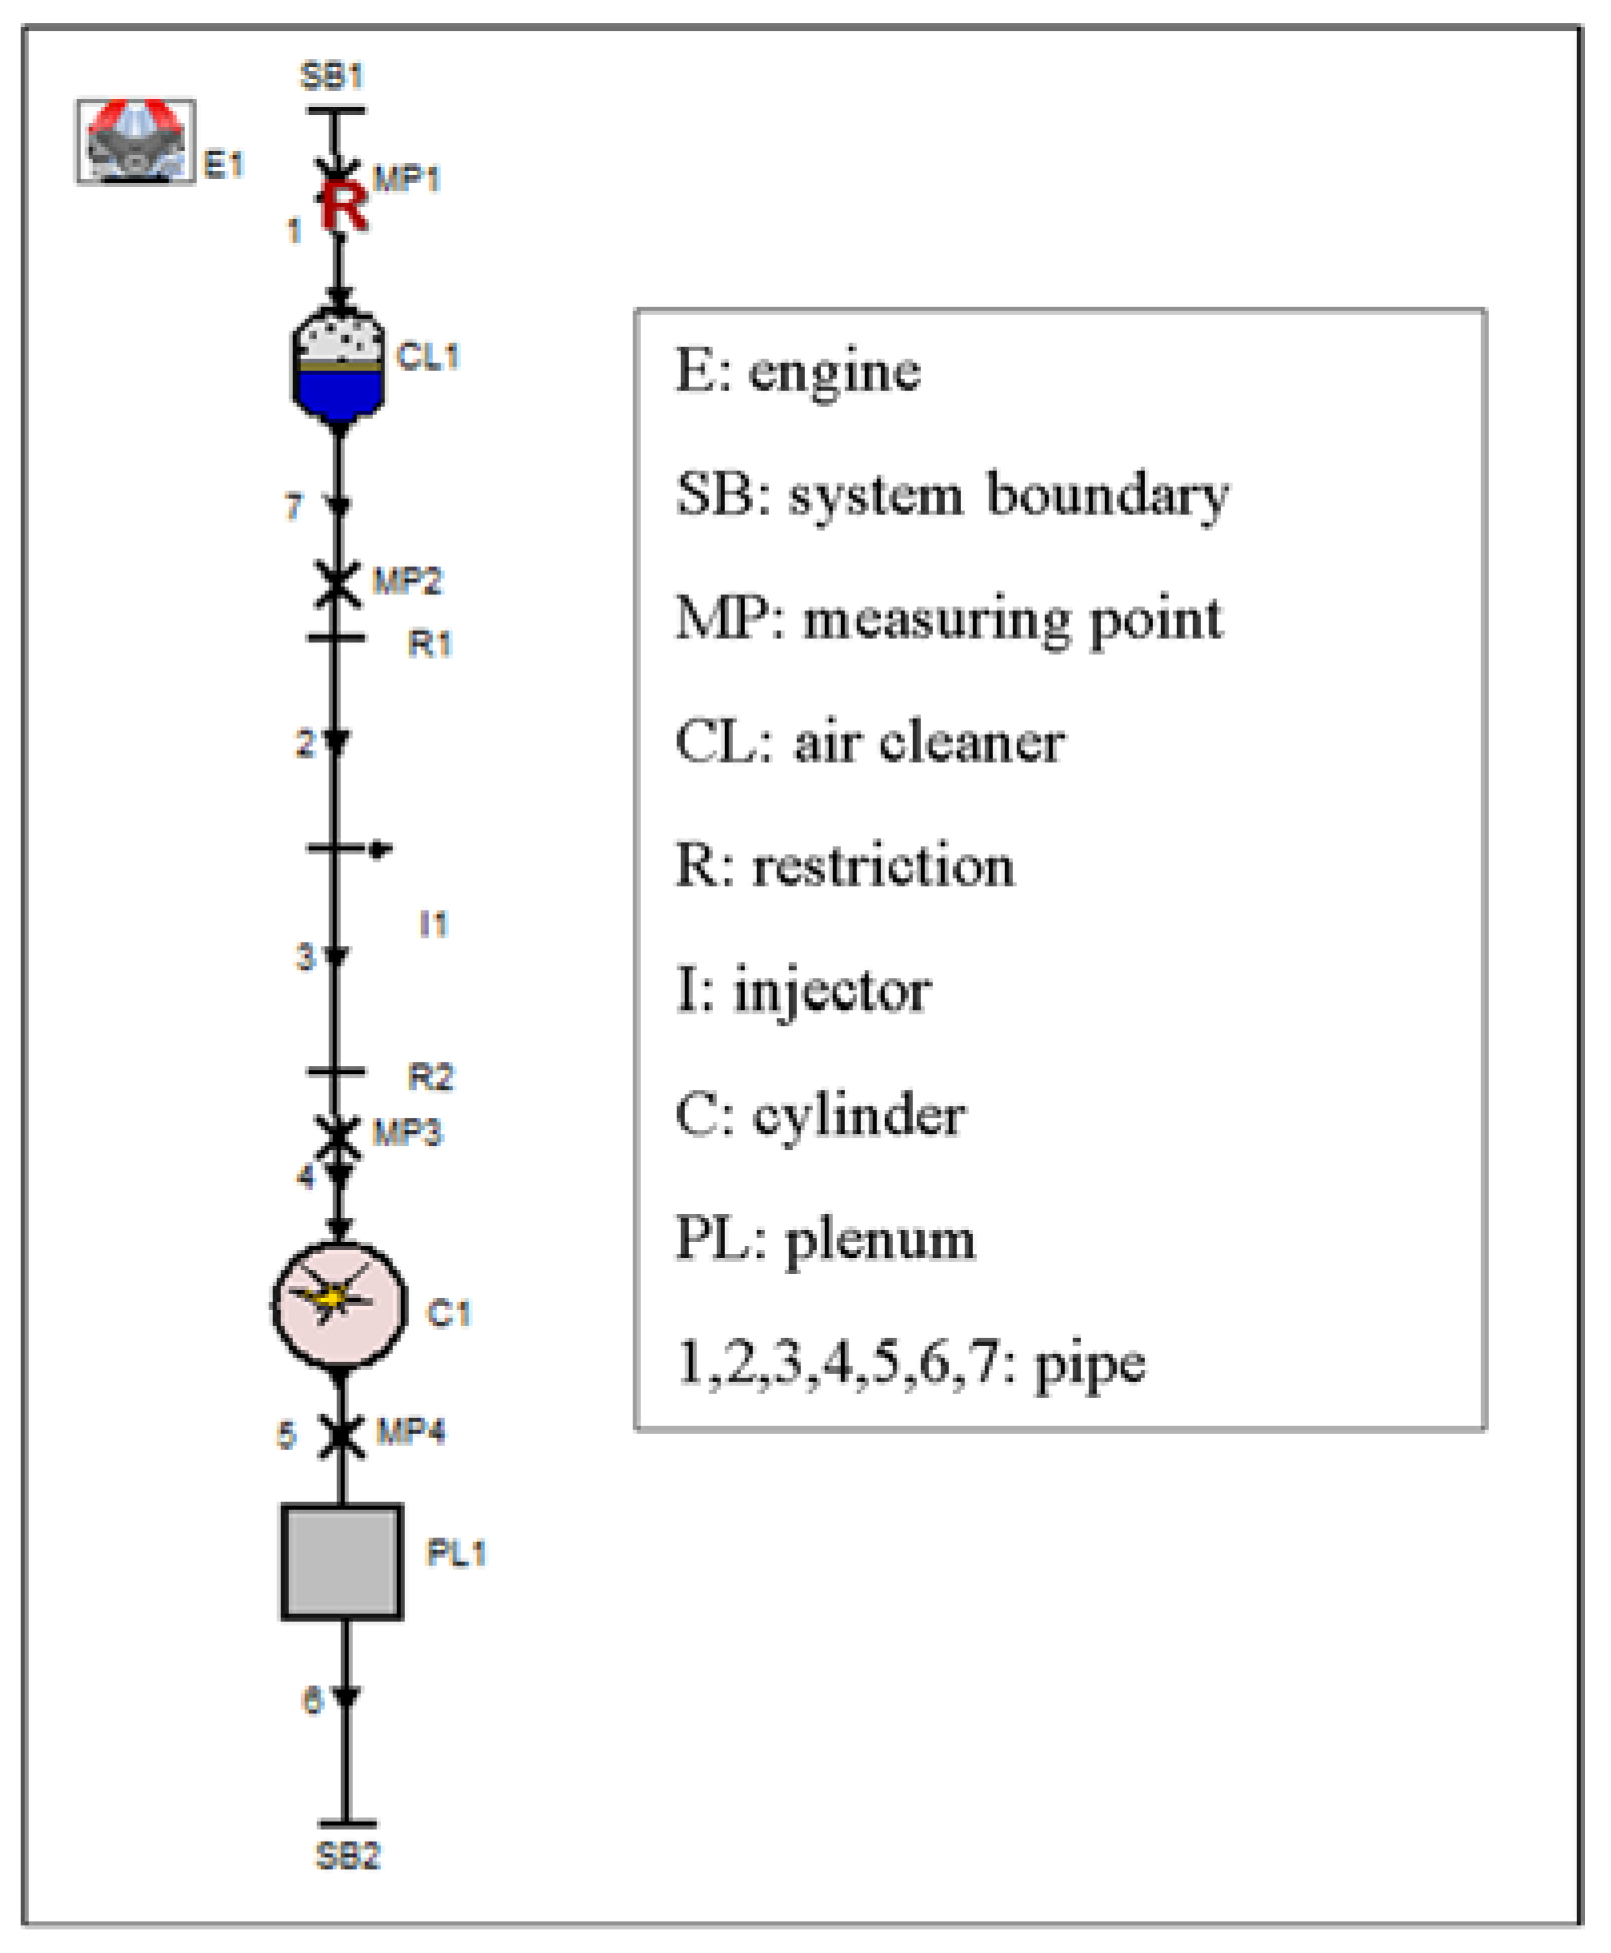
According to [23], air is made up of 78.09% nitrogen, 0.93% argon, and 20.95% oxygen. The remaining portion is made up of a variety of various gaseous substances. The calculation of the percentage of oxygen that enters the combustion chamber is shown in Equation (1) below:
% O 2 = m ˙ O 2 ( a i r ) + m ˙ O 2 m ˙ a i r ( t o t a l ) + m ˙ O 2 × 100 %
where m ˙ O 2 ( a i r ) is the oxygen mass flow rate in the intake air, m ˙ O 2 is the supplementary oxygen mass flow rate (3 kg/h, 5 kg/h, 7 kg/h, and 10 kg/h), and m ˙ a i r ( t o t a l ) is the total mass flow rate of the incoming air and oxygen. The YANMAR TF 155 R-DI diesel engine has an intake air capacity of ±20 kg/h at a motor speed of 1200 rpm. Moreover, the oxygen enrichment percentages were selected based on the maximum oxygen percentages that can be accepted so that the engine kept running smoothly on the load given and the rpm of the engine did not decrease. In this case, the rpm and the load are dependent variables for setting the maximum point of the experiment. Up to 30% oxygen enrichment has been shown in much research, but the point of the maximum point is not clear. The gradual step of oxygen enrichment is determined after the maximum point of excess oxygen is added (liter/minute), and then the value of the maximum point is divided into three steps for gradual percentage levels. The gradual step of oxygen enrichment is taken to show the performance and emission trends of diesel engines fueled with diesel fuel and biodiesel. Based on this information, the results of calculating the percentage of oxygen supplied to the combustion chamber are shown in Table 3 below.

3. Simulation Model

Modeling in this work was performed using AVL BOOST. The methods used in this study comprise the performing of a simulation using AVL BOOST that involves multiple phases, including establishing which variables are relevant to the simulation, modeling on the AVL BOOST preprocessor, and entering data for each modeled component. The first step in utilizing AVL BOOST to simulate a process was to model all the components representing the process as closely as feasible. The modeling was performed on the pre-processor page of AVL BOOST and was based on the test scheme presented in Figure 2. This simulation’s variables are separated into three categories. The engine speed (rpm) is the first fixed variable. Second, the intake oxygen concentration (%) and load (%) are independent variables. Finally, the exhaust gas temperature (°C), BSFC, maximum combustion temperature (°C), thermal efficiency, soot emission, and NOx emission are the dependent variables (ppm). Table 4 shows the simulation model’s important input and output data.
The biodiesel substitute used for the simulation in this study refers to the research conducted by [24]. In this study, substitute Palm Methyl Ester (PME) was used, which was derived from a mixture of methyl decanoate (C11H22O2), methyl-9-decanoate (C11H20O2), and n-heptane (C7H16), with the composition as shown in Table 5. The total energy between the combustion of diesel fuel and the combustion product of the biodiesel substitute is used to compute the amount of biodiesel substitute to be used in the simulation. Equation (2) calculates the total energy produced by the fuel, which provides the input for the diesel engine.
Pi = LHV   ×   m bb
where Pi is the diesel engine input power (MJ), LHV is Lower Heating Value (MJ/kg), and mbb is the mass of fuel injected in each cycle (kg). The LHV value of each substitute biodiesel compound is shown in Table 5 so that the calculation of the total biodiesel substitute mass is obtained using Equation (3).
m b = E i , D 0.24   ×   LHV MD + 0.26   ×   LHV MD 9 D + 0.5   ×   LHV C 7 H 16
where mb is the mass of biodiesel injected in each cycle (kg), Ei,D is the diesel engine input energy from diesel fuel combustion (MJ), LHVMD is the Lower Heating Value of methyl decanoate (MJ/kg), LHVMD9D is the Lower Heating Value of methyl 9 decanoate (MJ/kg), and LHVC7H16 is the Lower Heating Value of n-heptane (MJ/kg).
Under combustion with oxygen enrichment conditions, the oxygen mass fraction in the combustion chamber will increase. Equation (4) shows the calculation of the mass fraction in the combustion chamber.
x O 2 = m ˙ O 2 , i + m ˙ O 2 , air + m ˙ O 2 , bb m ˙ O 2 , i + m ˙ air + m ˙ bb
where x O 2   is the oxygen mass fraction in the combustion chamber, m ˙ O 2 , i   is the oxygen mass fraction from the injector (kg/s), m ˙ O 2 , air   is the oxygen mass fraction in the air (kg/s), m ˙ O 2 , bb is the oxygen mass fraction in the fuel (kg/s), m ˙ bb is the mass flow rate of incoming fuel (kg/s), and m ˙ air is the mass flow rate of incoming air (kg/s). In the use of biodiesel, the oxygen fraction in the combustion chamber is equated with the value of the oxygen fraction in the use of diesel fuel, so the equation is shown in Equation (5).
x O 2 , D = x O 2 , B = m ˙ O 2 , i + m ˙ O 2 , air m ˙ O 2 , B m ˙ O 2 , i + m ˙ air + m ˙ B
m O 2 , i = X O 2 , D ( mair + mB ) m O 2 , air + m O 2 , B 1 X O 2 , D
where, x O 2 , D is the oxygen mass fraction of diesel fuel use, x O 2 , B is the oxygen mass fraction in the use of biodiesel fuel, m ˙ O 2 , B is the oxygen mass fraction in biodiesel (kg/s), and m ˙ B is the mass flow rate of incoming biodiesel fuel (kg/s). Based on Equation (5), to calculate the amount of oxygen mass injected through the input line, Equation (6) is used.

4. Results and Discussion

4.1. Validation of Simulation and Experimental Results

Validation of the simulation model was carried out by comparing cylinder pressure data from the experimental and simulation results. The simulation model is declared valid when it has the same pressure line tendency as the experimental cylinder pressure data. The simulated pressure results are mainly influenced by combustion parameters determined based on experimental data. Some of the combustion parameters in question are the start of combustion (SOC), the duration of combustion, and other parameters whose values are entered into the cylinder components. Figure 3(a-i,a-ii) shows cylinder pressure data against crank angle at 50% load from test results and simulation results, with oxygen concentrations of 20.95%, 32.23%, 39.72%, 47.39%, and 56.32%, respectively. It can be seen that the simulation results have been adjusted to the test results, where the SOC values from the simulation and test results at the same oxygen concentration have the same point. The peak height trend under oxygen enrichment conditions from the simulation results has the same trend as that from the test results, namely the peak height increases along with increasing oxygen concentration (starting from an oxygen percentage of 32.23%). The difference in Figure 3(a-i,a-ii) is clearly visible, with the test results without oxygen enrichment (oxygen percentage 20.95%) showing a higher peak than those under enrichment conditions. However, when compared between the test results and the simulation results in Figure 3a, they appear to have almost the same trend, as can be seen in more detail in Figure 4a. Figure 4a itself shows a comparison of test and simulation pressure results with a load of 50% with an input oxygen percentage of 20.95%. The difference between the simulated pressure and the oxygen concentration can be seen in the input oxygen percentage ranging from 32.23% to 56.32%, namely with an average difference of 5 bar. Overall, from Figure 3a, it can be concluded that this result is valid with a linear regression R square value of 0.99118 (20.95%), 0.99348 (32.23%), 0.99521 (39.72%), 0.99025 (47.39%), and 0.99168 (56.32%), respectively.
Figure 3(b-i,b-ii) shows cylinder pressure data against crank angle at 75% load from test results and simulation results, respectively. When viewed from the peak, as shown in Figure 3b, the pressure line from the test results shows a tendency to be more fluctuating when compared to that of the simulation results. The incomplete mixing of air and fuel in the combustion chamber is a possible cause of this phenomenon. Meanwhile, the pressure lines from simulation results with oxygen enrichment conditions of 3 kg/h (32.23%), 5 kg/h (39.72%), 7 kg/h (47.39%), and 10 kg/h (56.32%) have a tendency to always increase. However, in general, the experimental results and simulation results have the same trend, as can be seen in more detail in Figure 4b. Figure 4b shows a comparison of test and simulation pressure results with a load of 75% with an input oxygen percentage of 20.95%. Overall, from Figure 3b, it can be concluded that this result is valid with a linear regression R square value of 0.99523 (20.95%), 0.99455 (32.23%), 0.99521 (39.72%), 0.98898 (47.39%), and 0.98986 (56.32%), respectively.
Figure 3(c-i,c-ii) shows cylinder pressure data against crank angle at 100% load from test results and simulation results, respectively. When viewed from the peak, as shown in Figure 3c, the pressure line from the test results shows the same trend as that from the simulation results where the pressure line under oxygen enrichment conditions of 3 kg/h (32.23%), 5 kg/h (39.72%), 7 kg/h (47.39%), and 10 kg/h (56.32%) tends to always increase. However, there are differences in the peak values between the experimental results and the simulation results as can be seen in more detail in Figure 4c. Figure 4c shows a comparison of test and simulation pressure results with a load of 100% with an input oxygen percentage of 20.95%. Although the difference is not that big, this difference occurs because many assumptions are used in processing the simulation using software, so that the peak of the simulation results graph is higher when compared to that of the test results. Overall, from Figure 3c, it can be concluded that this result is valid with a linear regression R square value of 0.98740 (20.95%), 0.99531 (32.23%), 0.99531 (39.72%), and 0.98840 (47.39%), respectively. Based on the results shown in Figure 3 and Figure 4, where the pressure lines from the simulation results and test results show the same trend as well as pressure values that are close to each other with the linear regression R square value approaching 1, the simulation model can be declared valid.

4.2. Analysis of the Oxygen Enrichment Effect on Diesel Engines Using Diesel Fuel and Substitute Biodiesel

This section addresses how oxygen enrichment affects diesel engine performance, combustion, and exhaust emissions. The simulation results and analysis of using diesel fuel in comparison to biodiesel alternatives made from palm oil are discussed for each topic.

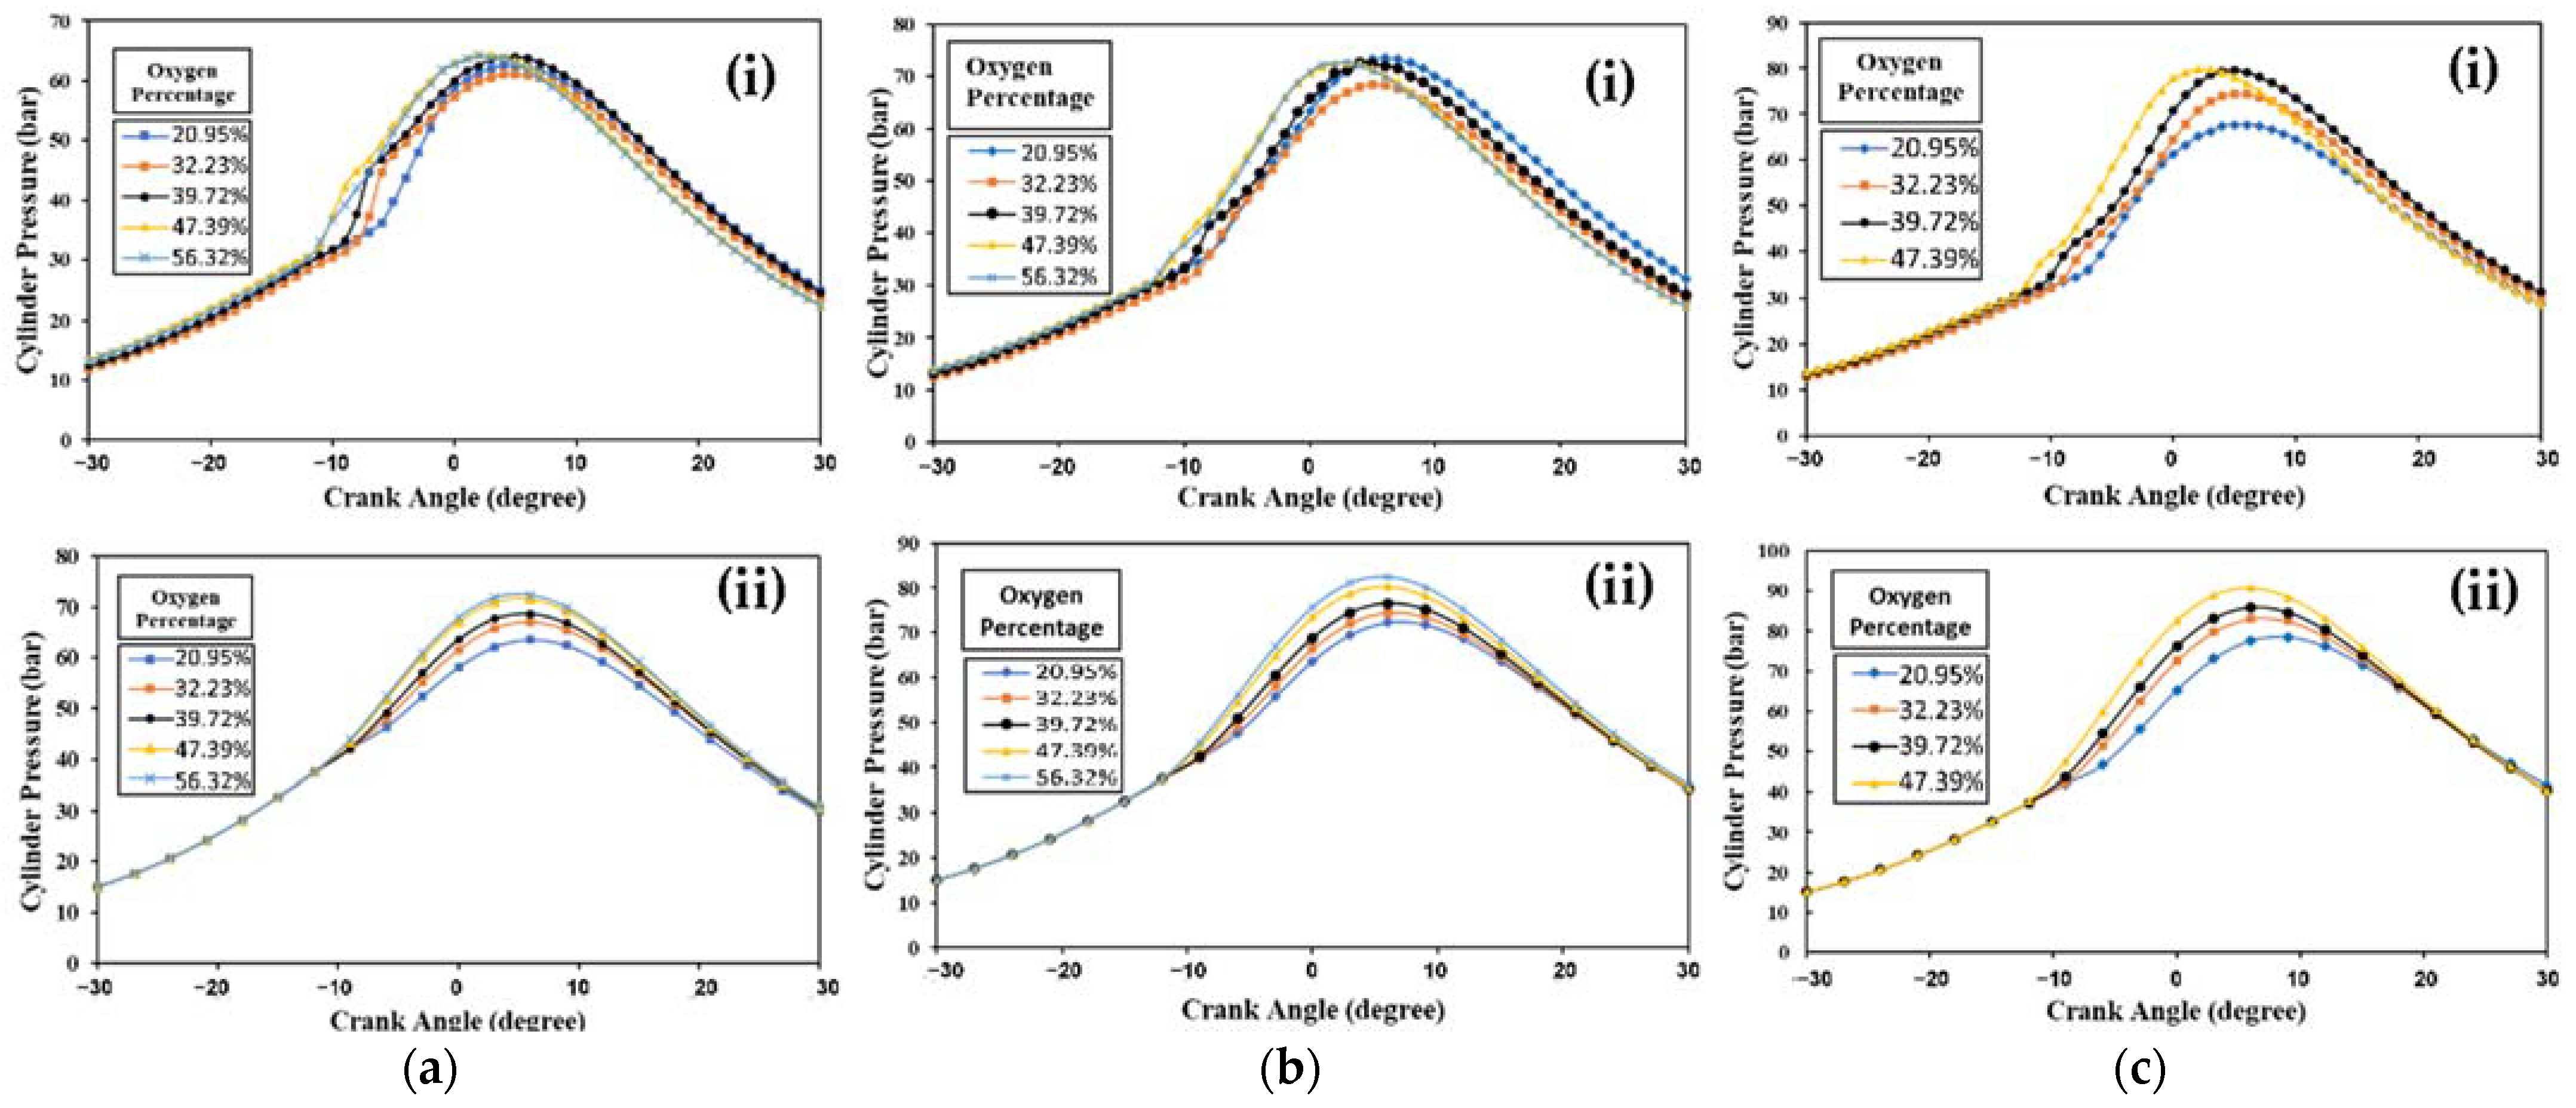
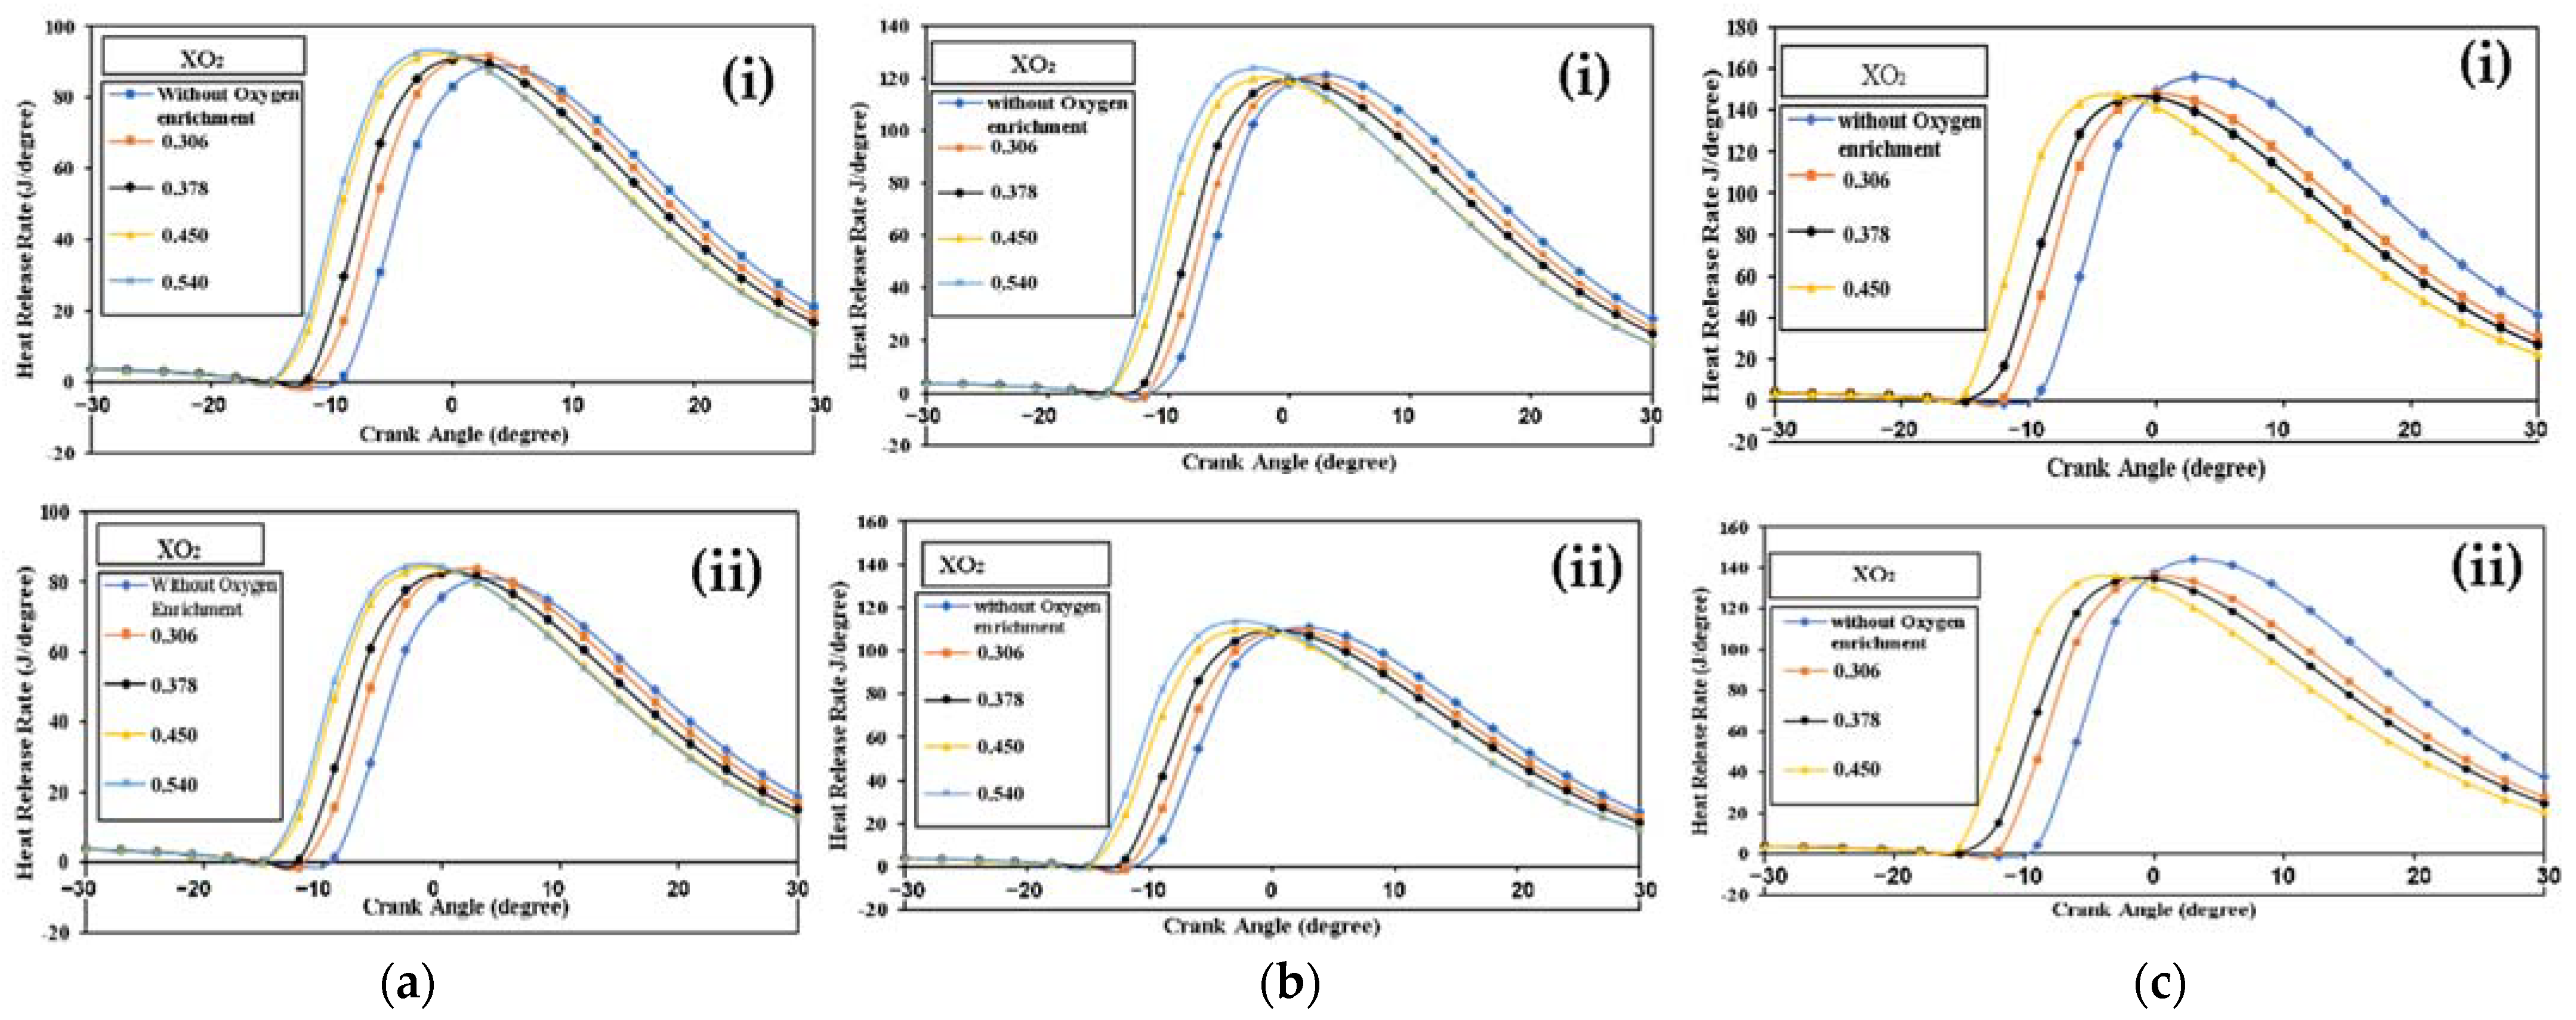
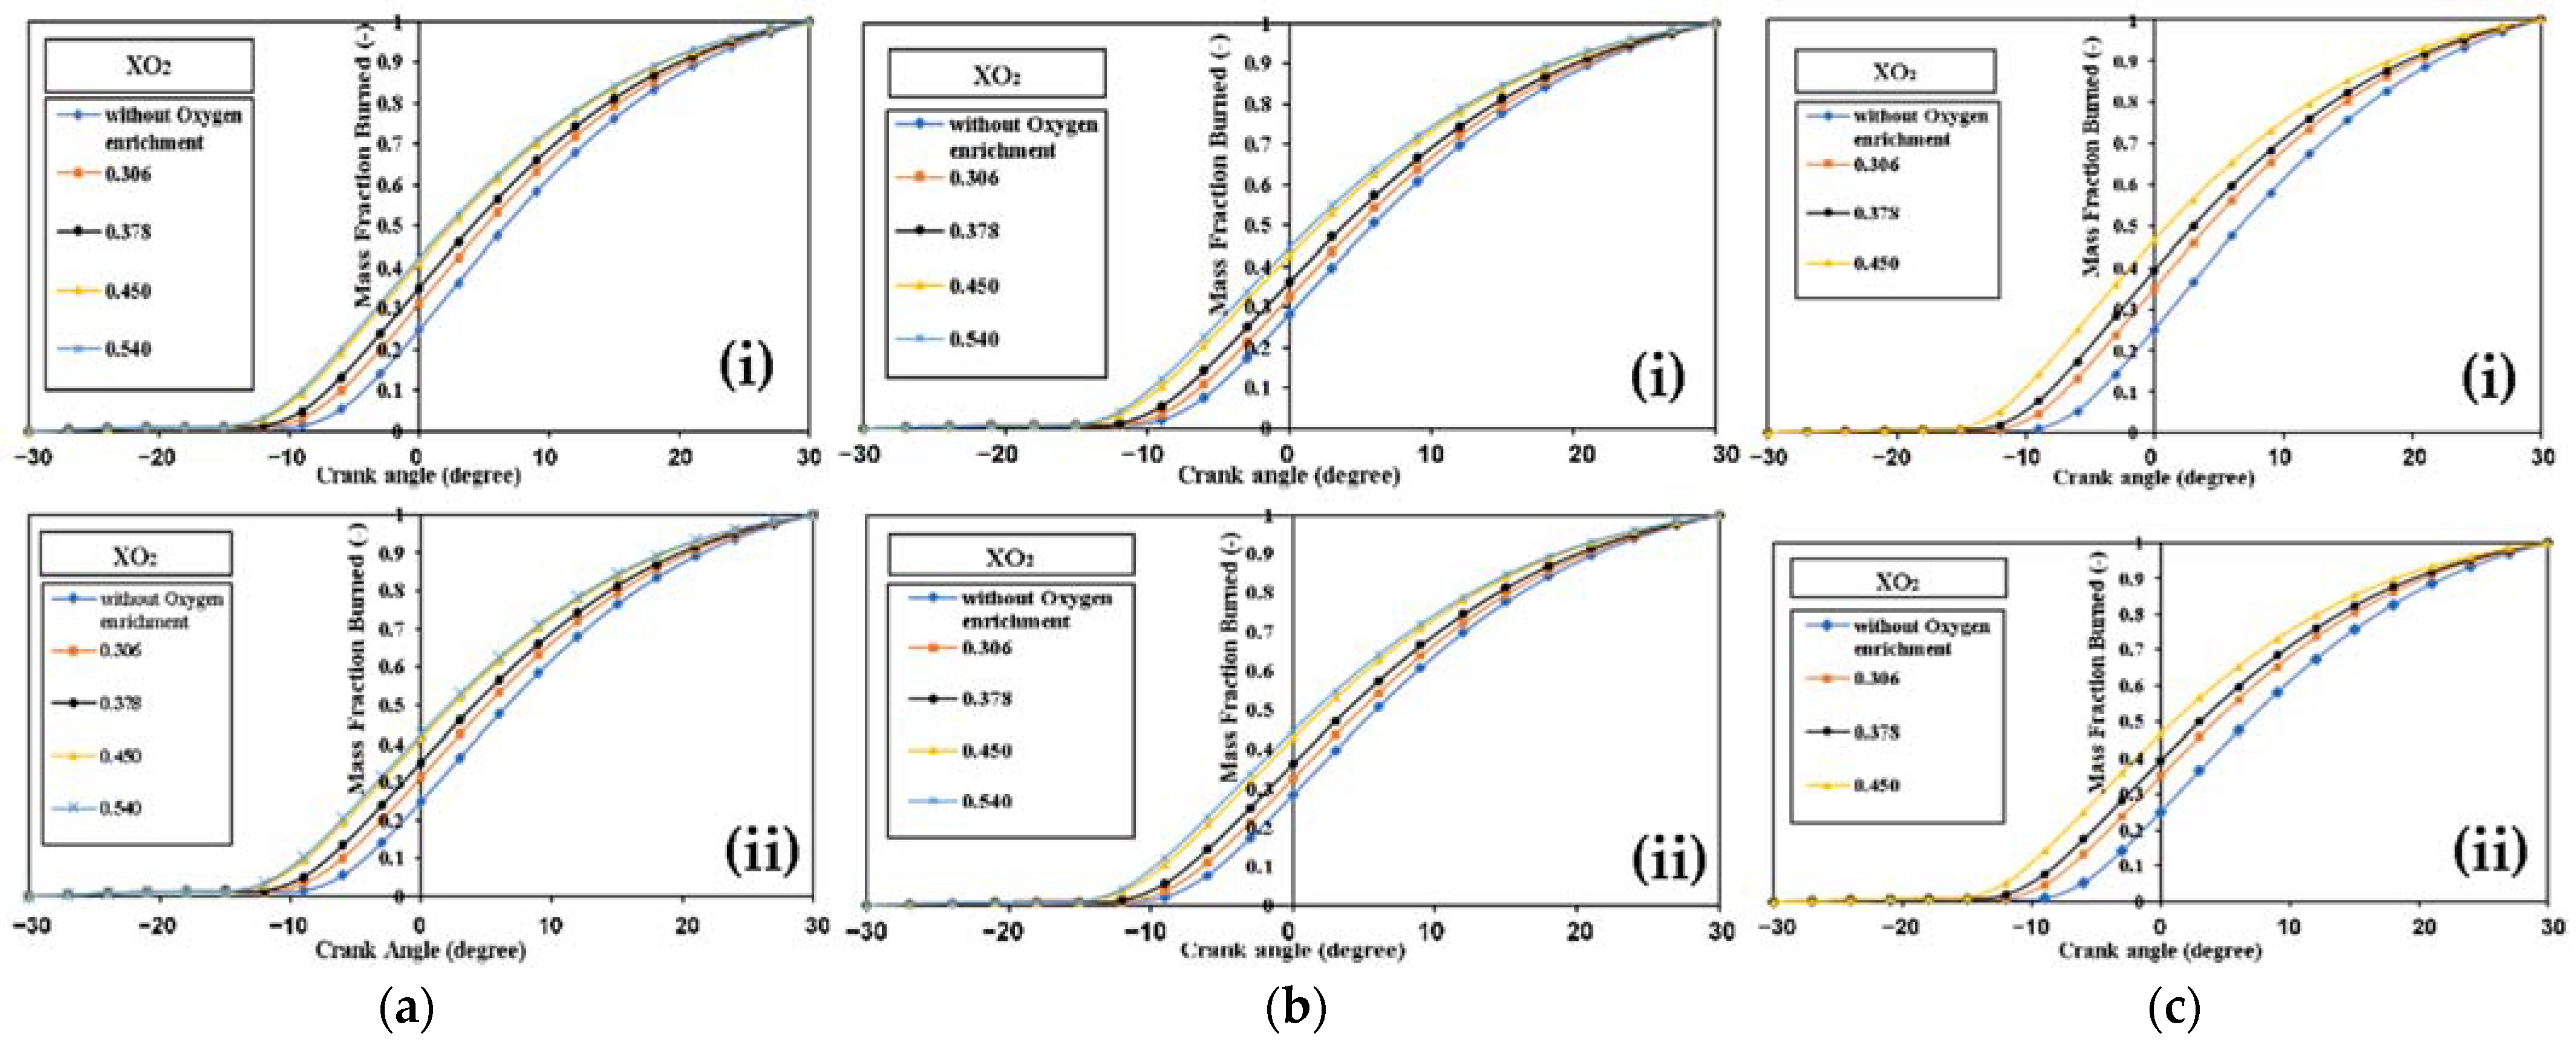
4.2.1. Diesel Engine Combustion

Combustion in diesel engines is initiated by automatic fuel ignition at high temperature and pressure. The rate of heat release (RoHR) is an important combustion parameter obtained from applying the first law of thermodynamics to cylinder pressure. Based on the graph of the rate of heat release, the different combustion phases are known. Based on a graph showing the mass fraction burned (MFB) and the heat release rate at 50%, 75%, and 100% load, this section explains the combustion characteristics of a diesel engine.

Diesel Engine Combustion with 50% Load

Figure 5(a-i) shows a graph of the relationship between the RoHR of a diesel engine and the crank angle with the use of diesel fuel. The analysis is only performed at a crank angle of −30 to 30 degrees, during which the RoHR increases together with the increase in oxygen concentration and the time interval from the beginning of fuel injection to the completion of combustion, as determined by the test results. This happens because the SOC is set earlier so that the combustion peak occurs further before TDC and leads to a reduction in the combustion portion after TDC. Perfect combustion usually occurs right at TDC, where combustion occurs after TDC and continues until the expansion step reduces the power produced by the diesel engine [24]. According to a study conducted by Song et al. [6], a rise in oxygen concentration also leads to an increase in the rate of fuel oxidation, which can raise the peak height of the RoHR. A graph illustrating the link between the crank angle and the heat release rate while using biodiesel fuel is presented in Figure 5(a-ii). When compared to Figure 5(a-i), the overall peak height of the RoHR is lower. The biodiesel alternative made from palm oil has a lower calorific value, which accounts for the lower peak RoHR.
Figure 6a shows the relationship between the normalized cumulative rate of heat release and the crank angle in the use of diesel and biodiesel fuels at a load of 50%. This normalized cumulative heat release rate shows the mass of fuel burned in the cylinder or Mass Fraction Burned (MFB). The graph in Figure 6a corresponds to the graph in Figure 5a, where the shorter ignition delay leads to an increase in the fuel mass burned in the combustion chamber; as a result, the MFB curve shifts to the left. Under the 90% MFB condition in Figure 6a, the higher the oxygen concentration that enters, the faster the MFB condition is achieved. This was caused by an increase in the oxidation reaction of the fuel by oxygen, in accordance with the results of the increase in the peak HRR described previously.

Diesel Engine Combustion with 75% Load

Figure 5(b-i) illustrates how the crank angle and heat release rate relate to each other at 75% load and using diesel fuel. As in the case with 50% load, the higher oxygen concentration injected through the diesel engine inlet, the higher the peak of the RoHR curve. This shows that the oxygen content in the combustion chamber has increased, accelerating the rate of fuel oxidation. As a result, the HRR peak comes before TDC and raises the latter’s peak. A graph of the biodiesel heat release rate versus crank angle is displayed in Figure 5(b-ii). The peak value is smaller in comparison to Figure 5(b-ii) because of the reduced calorific value. The graph of the relationship between MFB and crank angle with a load of 75% can be seen in Figure 6b. According to the graphs shown in Figure 5(b-i,b-ii), the time to reach 90% MFB conditions is faster at higher intake oxygen concentrations, the same as that shown on the graph of the 50% load MFB.

Diesel Engine Combustion with 100% Load

The relationship between a diesel engine running on diesel fuel and its crank angle with 100% load is depicted in Figure 5(c-i). In the case of this 100% load, it is different compared to the 50% and 75% loads, where the peak height decreases as the intake oxygen concentration increases. This peak decrease can be caused by a shorter ignition delay compared to the 50% and 75% loads, thereby reducing fuel and oxygen mixing time. As is known, a higher load requires a better mixture of fuel and air; if the mixing time of fuel and oxygen is shorter, incomplete combustion will occur and leads to a decrease in the heat release rate. The same is true for the use of biodiesel fuel, as shown in Figure 5(c-ii).
Figure 6c shows the results that have the same trend as the SOC shown in the graph of the heat release rate in Figure 5c. To reach 90% MFB conditions, an increase in the oxygen concentration that enters can cause an increase in the combustion rate. Although the peak point of the heat release rate is lower when compared to combustion without oxygen enrichment, the results show no decrease in the fuel oxidation reaction rate, as shown in Figure 6c.
Based on Figure 5, it can be seen that the higher the engine load, the higher the heat release rate produced. An understanding of the relationship between engine load and heat release rate is essential for understanding engine efficiency. The pace at which fuel burns and heat is emitted inside engine cylinders is referred to as the heat release rate. It has a direct bearing on engine load, which is a gauge of the amount of work the engine is producing. Higher engine loads usually result in higher heat release rates because more fuel is burned per cycle. More energy is produced by this enhanced combustion, which powers the engine. In order to improve performance, reduce emissions, and optimize fuel consumption, efficient engines try to strike a balance between this heat release and engine load. The goal of various engine designs and technologies is to efficiently manage this connection for increased efficiency under various load scenarios.

4.2.2. Diesel Engine Performance

Thermal efficiency, exhaust gas temperature, and specific brake fuel consumption (BSFC) are a few indicators of a diesel engine’s performance. The effects of oxygen enrichment on the operation of diesel engines running on diesel and biodiesel fuel are demonstrated in this part using the simulation results of these variables.

Brake Specific Fuel Consumption (BSFC)
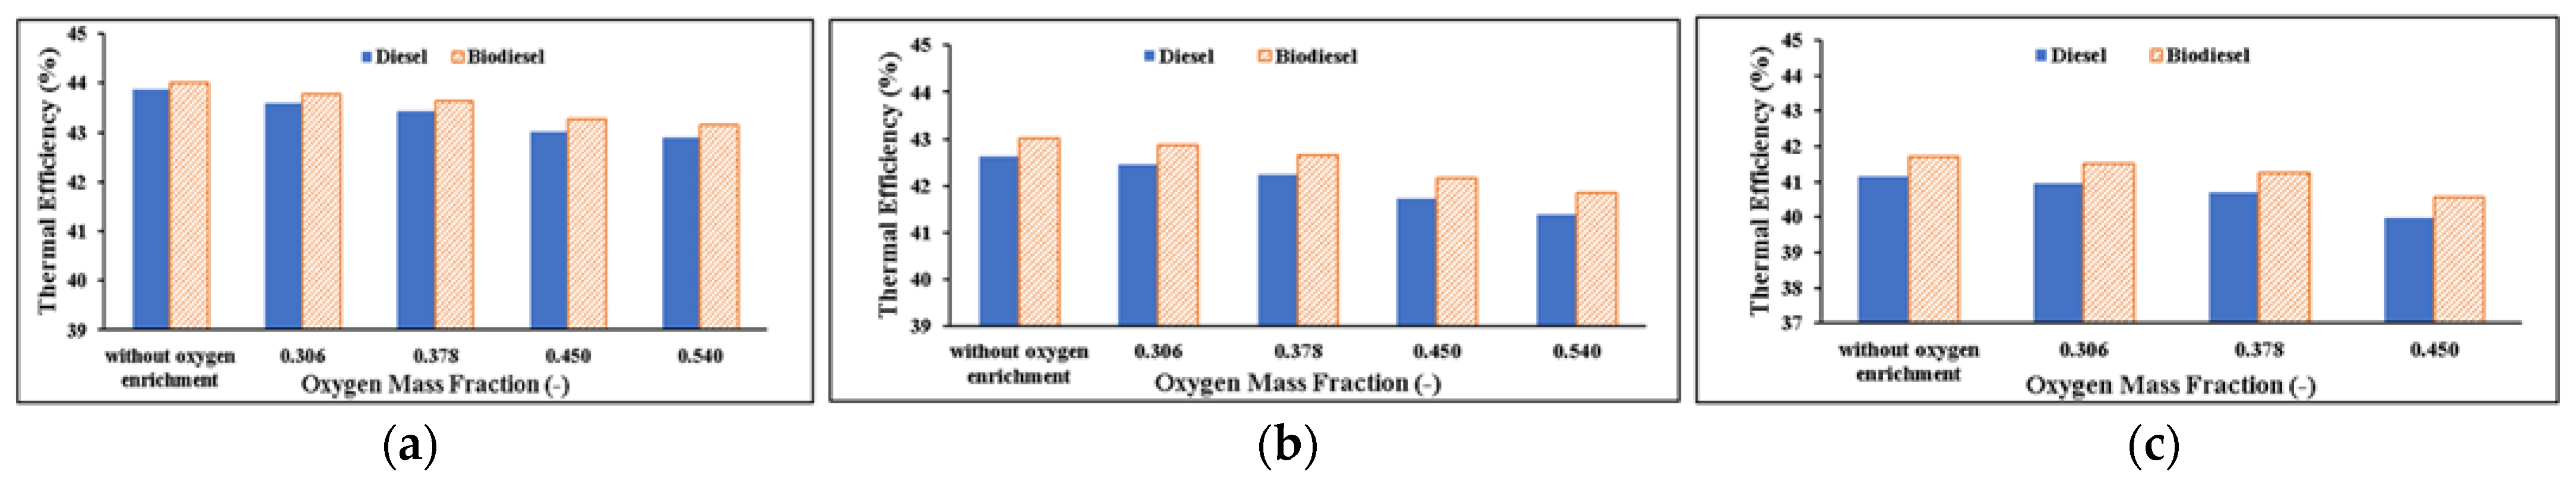
Figure 7 shows a BSFC diagram of the oxygen mass fraction, where the mass fraction shows the oxygen concentration against the mass in the combustion chamber. The comparison between the amount of fuel consumed and the power produced by the diesel engine is called the BSFC. In Figure 7, the BSFC increases with an increase in the load on the engine. At the same time, based on Figure 7, the BSFC increases with the increase in the mass fraction of oxygen in the combustion chamber. This is thought to be due to a decrease in the ignition delay, which causes the fuel and air mixing time to be shorter so that more fuel is needed so that the fuel and air mixture can be thoroughly mixed in a shorter ignition delay. Moreover, the occurrence of BSFC, which increases along with the increase in the mass fraction of oxygen in the combustion chamber, is the occurrence of incomplete combustion. Sometimes, excess oxygen can disrupt the balance needed for complete combustion, causing inefficiency and higher fuel consumption. Another reason this occurs is a change in the air–fuel ratio. Changes in oxygen levels may affect the ideal air–fuel ratio required for efficient combustion. Too much oxygen can adversely alter this ratio, impacting efficiency. Apart from that is heat loss. Higher oxygen levels can cause increased heat loss due to a hotter combustion chamber, thereby affecting overall engine efficiency. The interval between the fuel injection time (Start of Injection, or SOI) and the ignition start time (SOC), as previously mentioned, is known as the ignition delay. The increase in BSFC at each load has an average of about 0.0013 kg/kWh or 0.13%. This is also seen in the simulation results of this study which are shown in Figure 7. This increase in the BSFC is related to the presence of oxygen in the chemical bonds of biodiesel fuel which cause a decrease in the calorific value of the fuel. The lower calorific value encourages an increase in the quantity of biodiesel used to produce a stable rotational speed and is equivalent to the use of diesel fuel [9]. Along with the increase in the mass fraction of oxygen in the combustion chamber, the BSFC value also increases, which is in accordance with the case of using diesel fuel; the BSFC will increase due to a shorter ignition delay and causes the use of more fuel to produce a better mixture. The increase in BSFC at each load for biodiesel use has an average of 0.0015 kg/kWh or 0.15%, which is close to that of using diesel fuel alone.

Thermal Efficiency

Figure 8 illustrates the thermal efficiency of an oxygen-enriched diesel engine using intake air when running on both diesel and biodiesel fuel. Thermal efficiency is a measure of how much energy a diesel engine produces in relation to the energy the engine receives from fuel. Figure 8 shows that the value of thermal efficiency decreases with increasing load and increasing oxygen concentration entering the combustion chamber. This is due to the higher BSFC value along with the increase in oxygen concentration and increase in load. Thermal efficiency is affected by fuel consumption with an inversely proportional value. This decrease in thermal efficiency is also related to the angle of emergence of the HRR peak. As it relates to Figure 5, it is known that the HRR peak is earlier and away from TDC at a higher percentage of oxygen intake. The peak of the HRR describes the highest energy release from the fuel combustion process. If the peak occurs further away from TDC, the power produced will decrease and the thermal efficiency of the diesel engine also decreases. Although Figure 5 shows lower peaks at the lowest intake oxygen concentration, the power generated is greater because the peaks are concentrated near TDC and make thermal efficiency higher when compared to higher intake oxygen concentrations. Figure 8 also shows that the thermal efficiency value from the use of biodiesel is higher when compared to that using diesel fuel. Although the BSFC value for diesel engines is higher with the use of biodiesel fuel, the thermal efficiency value is higher when compared to that using diesel fuel. Since the thermal efficiency is influenced by BSFC and the fuel’s calorific value is inversely correlated, the fuel’s significantly lower calorific value may be the reason for the higher thermal efficiency.

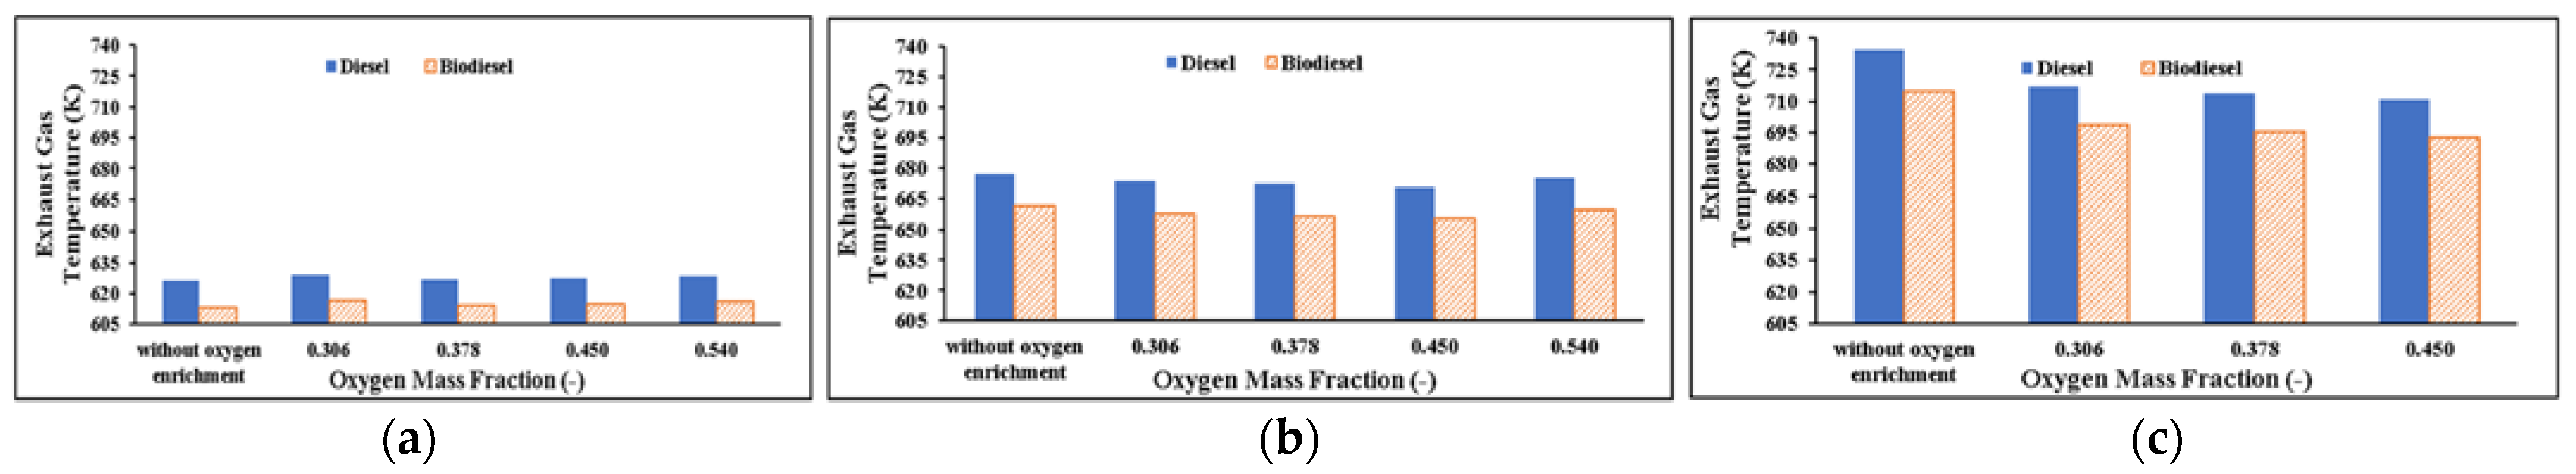
Exhaust Gas Temperature

An illustration of the exhaust gas temperature in a diesel engine using both diesel and biodiesel fuel is presented in Figure 9, tracing the temperature from the combustion results to the oxygen mass fraction. The exhaust gas temperature increases with increasing load; this is due to an increase in the reaction rate and the speed of fire propagation which is also shown in the increase in the heat release rate, as can be seen in Figure 5. The increase in oxygen concentration entering the combustion chamber can reduce the exhaust gas temperature, which is influenced by heat absorption by excess oxygen compounds in the combustion chamber. In addition, the faster SOC also affects the temperature of the flue gas produced. When the SOC occurs faster, the ignition delay time will be shorter; this will cause combustion to occur earlier before the expansion step, so the possibility of further combustion exceeding TDC will decrease and lower the exhaust gas temperature.
Based on Figure 9, the exhaust gas temperature value resulting from biodiesel use is lower than that of diesel fuels. This is related to the HRR graph of each different load, where the peak HRR from the use of biodiesel is lower when compared to that of diesel fuel, resulting in less energy release and lower exhaust gas temperatures.

4.2.3. Diesel Engine Emissions
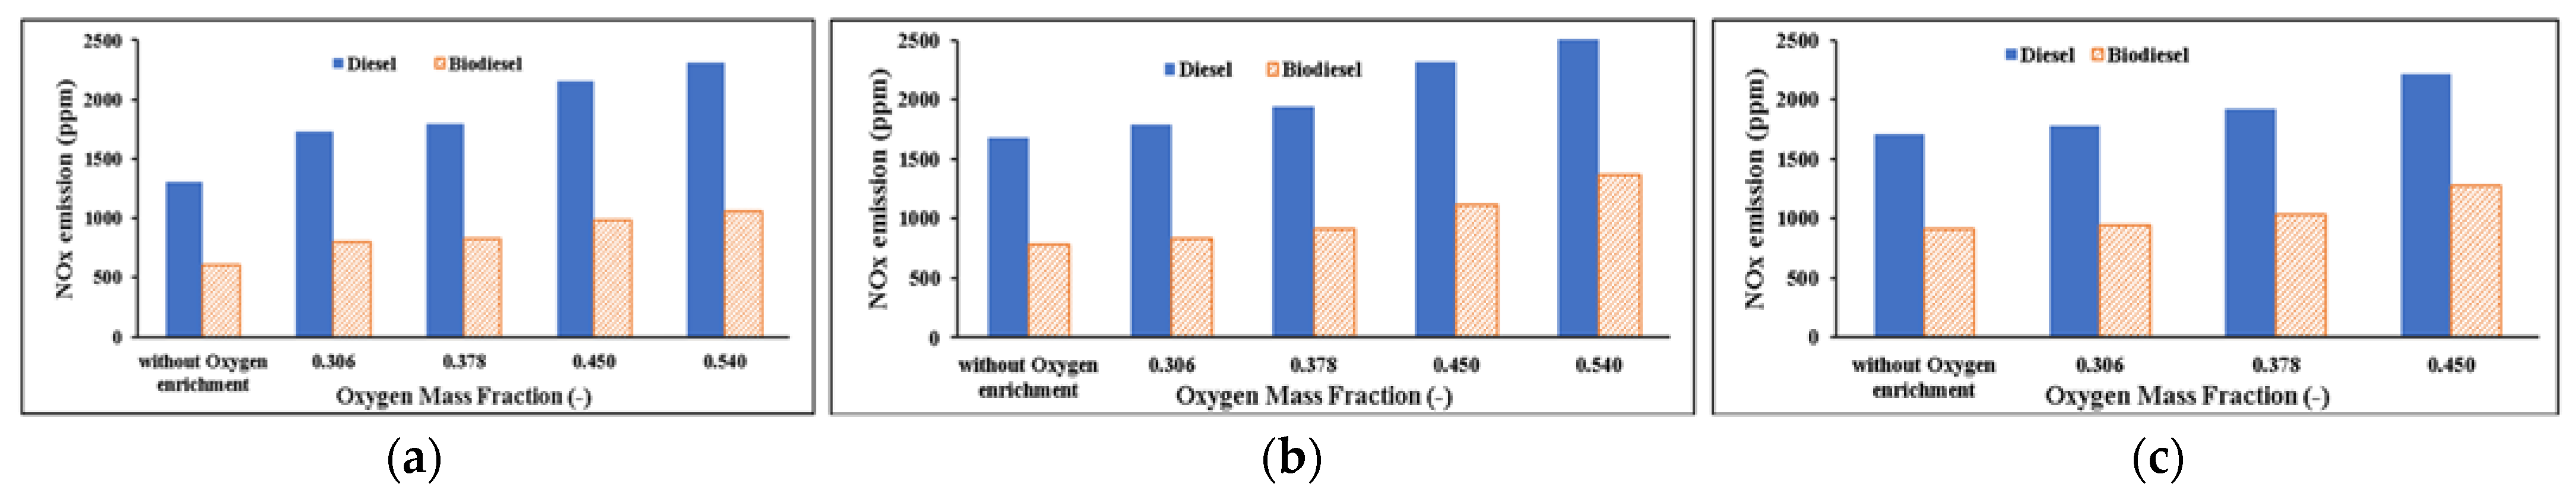
Emissions that can be seen from the diesel engine simulation results using AVL BOOST software are NOx and soot. The following describes the emissions produced by diesel engines and their relationship to using two different fuels, namely diesel fuel and biodiesel.

NOx Emissions

In the case of this research, the fuel used does not contain nitrogen, so NOx is impossible to generate from the oxidation of the fuel. Thermal NO is formed due to the presence of oxygen and high temperatures, while NO prompt is formed in areas with fuel-rich conditions or at the tip of fire propagation. Figure 10 shows a diagram of the relationship between a diesel engine’s NOx emissions and the combustion chamber’s mass fraction of oxygen. The higher the oxygen concentration and load that enters the combustion chamber, the higher the NOx emissions. The simulation results show the same trend as that obtained in previous research [2,3,5]. The increase in NOx emissions is caused by the increasing number of oxygens in the combustion chamber that increase the combustion temperature, as shown in Figure 11. When the SOC occurs faster and the ignition delay is shorter, the fuel and oxygen mixture becomes more imperfect; it can cause local burning of the already well-mixed part, which triggers a temperature spike only at a certain point. In addition, the lower equivalent ratio due to the addition of oxygen in the combustion chamber and the high combustion temperature also trigger the formation of NOx. These reasons cause the value of NOx emissions produced by diesel engines with oxygen enrichment and diesel fuel to increase. According to Figure 10, the amount of NOx emissions from using biodiesel is significantly less than the amount from using diesel fuel, however, the amount rises when oxygen concentration also does. The use of diesel fuel is consistent with the trend of rising NOx emissions and rising incoming oxygen concentrations. The presence of oxygen bonds in the biodiesel chain, which prevent the fuel component that is already bonded to oxygen from needing time to mix with the oxygen in the combustion chamber, may be the reason for the decrease in NOx emissions when using biodiesel. The effect of a higher density of biodiesel substitute fuel can also cause a decrease in combustion temperature, which is influenced by poorer fuel atomization and leads to a slightly lower maximum combustion temperature due to poor combustion when compared to the use of diesel fuel, such as is shown in Figure 11. The simulation’s overall findings indicate that when the oxygen mass fraction rises, so does the amount of NOx emissions, but previous research [25] shows that this increase in NOx emissions could be overcome by using a water–fuel emulsion, injection timing, EGR, and various other methods.

Soot Emissions

Soot is basically an unburned hydrocarbon. Soot will form due to the high equivalence ratio due to the lack of oxygen availability in the combustion chamber.
Figure 12 shows the soot emissions produced by a diesel engine with the use of two types of fuel. The value of the soot emissions that are formed decreases with the increase in the concentration of oxygen entering the combustion chamber, which indicates a decrease in the equivalence ratio; this confirms the theory of soot formation, where soot is formed under conditions of rich fuel or a high equivalence ratio. In addition, as previously explained, soot is formed due to incomplete combustion; when viewed from the HRR graph shown in Figure 5, it is known that the quality of combustion increases with the mass fraction of oxygen in the combustion chamber. The big difference in soot emissions between combustion with oxygen enrichment and without oxygen enrichment is seen at higher loads. Figure 12 also shows the relationship between the resulting soot emissions and the load of a diesel engine using biodiesel fuel. The results show that biodiesel increases the emission of soot; this is probably due to its worse combustion when compared to diesel fuel alone, which is characterized by a lower peak HRR, as discussed in the Diesel Engine Combustion section. When viewed as a whole, the simulation results from combustion with oxygen-enriched air and using an oxygenated fuel show a lower soot emission value when compared to combustion without oxygen enrichment.

5. Conclusions

Based on the simulation results of oxygen enrichment with concentrations above 30% in the YANMAR TF 155 R-DI engine, which were carried out using AVL BOOST software, four main conclusions were obtained as follows:
  • Based on the diesel engine’s combustion parameters:
    • While the peak HRR rises when the mass fraction of oxygen increases when using both fuels, the peak falls when using biodiesel substitution because of the lower heating value.
    • The 90% condition of the fuel MFB is earlier due to an increase in combustion quality.
  • Considering the diesel engine’s performance parameters:
    • BSFC increases as the oxygen mass fraction increases because the ignition delay is shorter. Due to its lower calorific value, the biodiesel substitute has a greater BSFC than that of diesel fuel.
    • When using both fuels, efficiency drops as the oxygen mass percentage rises because of the rise in BSFC. Due to its reduced calorific value compared to diesel fuel, biodiesel can be used more efficiently.
  • Exhaust gas temperature (EGT) decreases as increased oxygen reduces combustion after TDC. EGT in the use of biodiesel substitute is lower. Based on the diesel engine emission parameters:
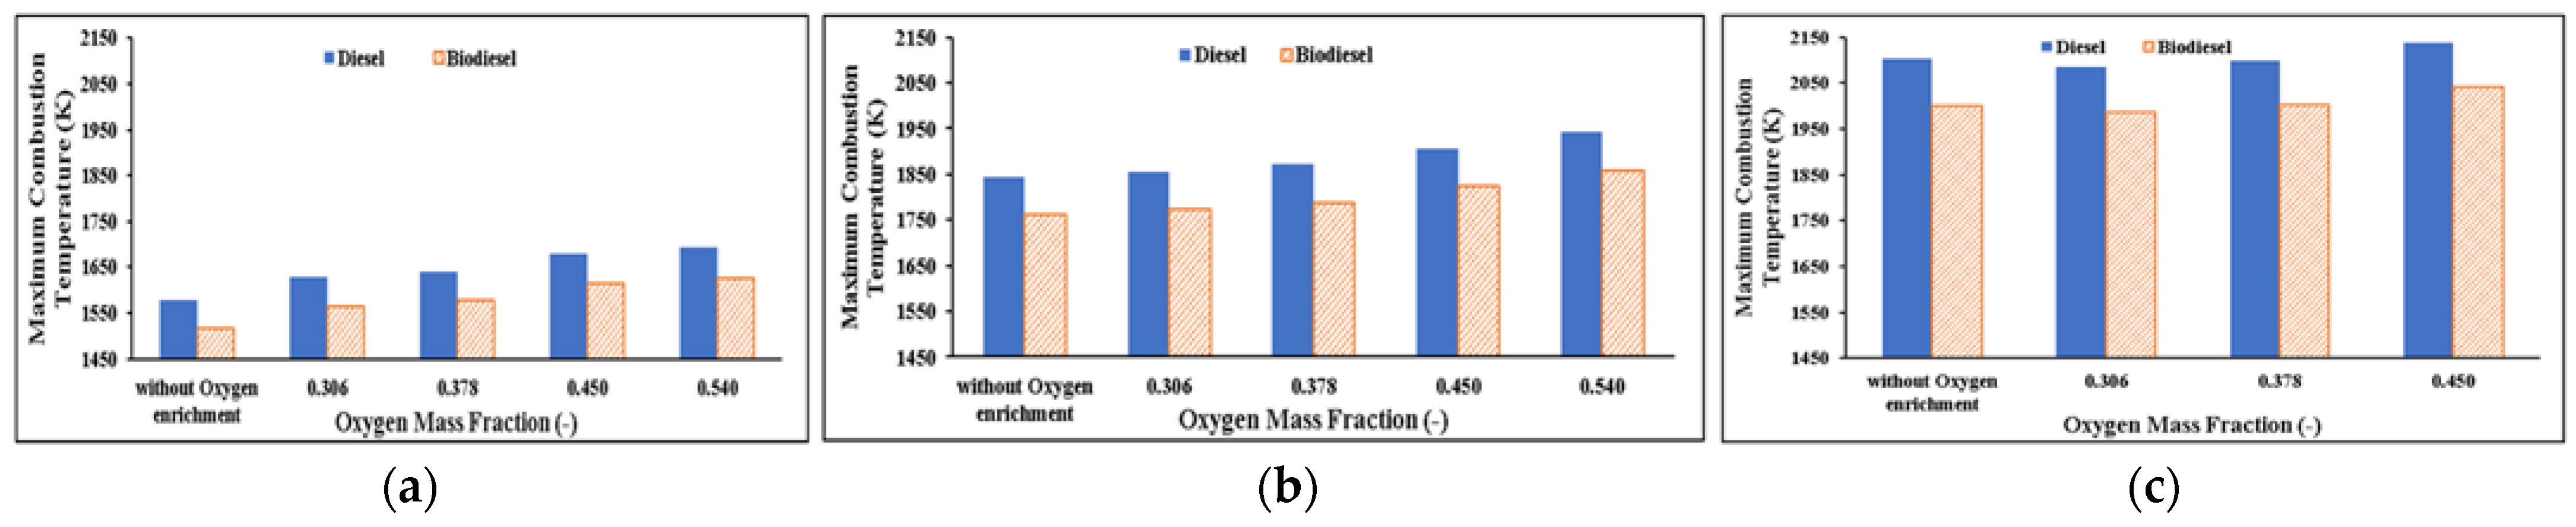
    • NOx emissions increase as the oxygen mass fraction increases due to an increase in the maximum combustion temperature due to increased fuel oxidation, resulting in thermal NOx formation. In the use of biodiesel substitutes, NOx emissions are lower because the maximum combustion temperature is also lower.
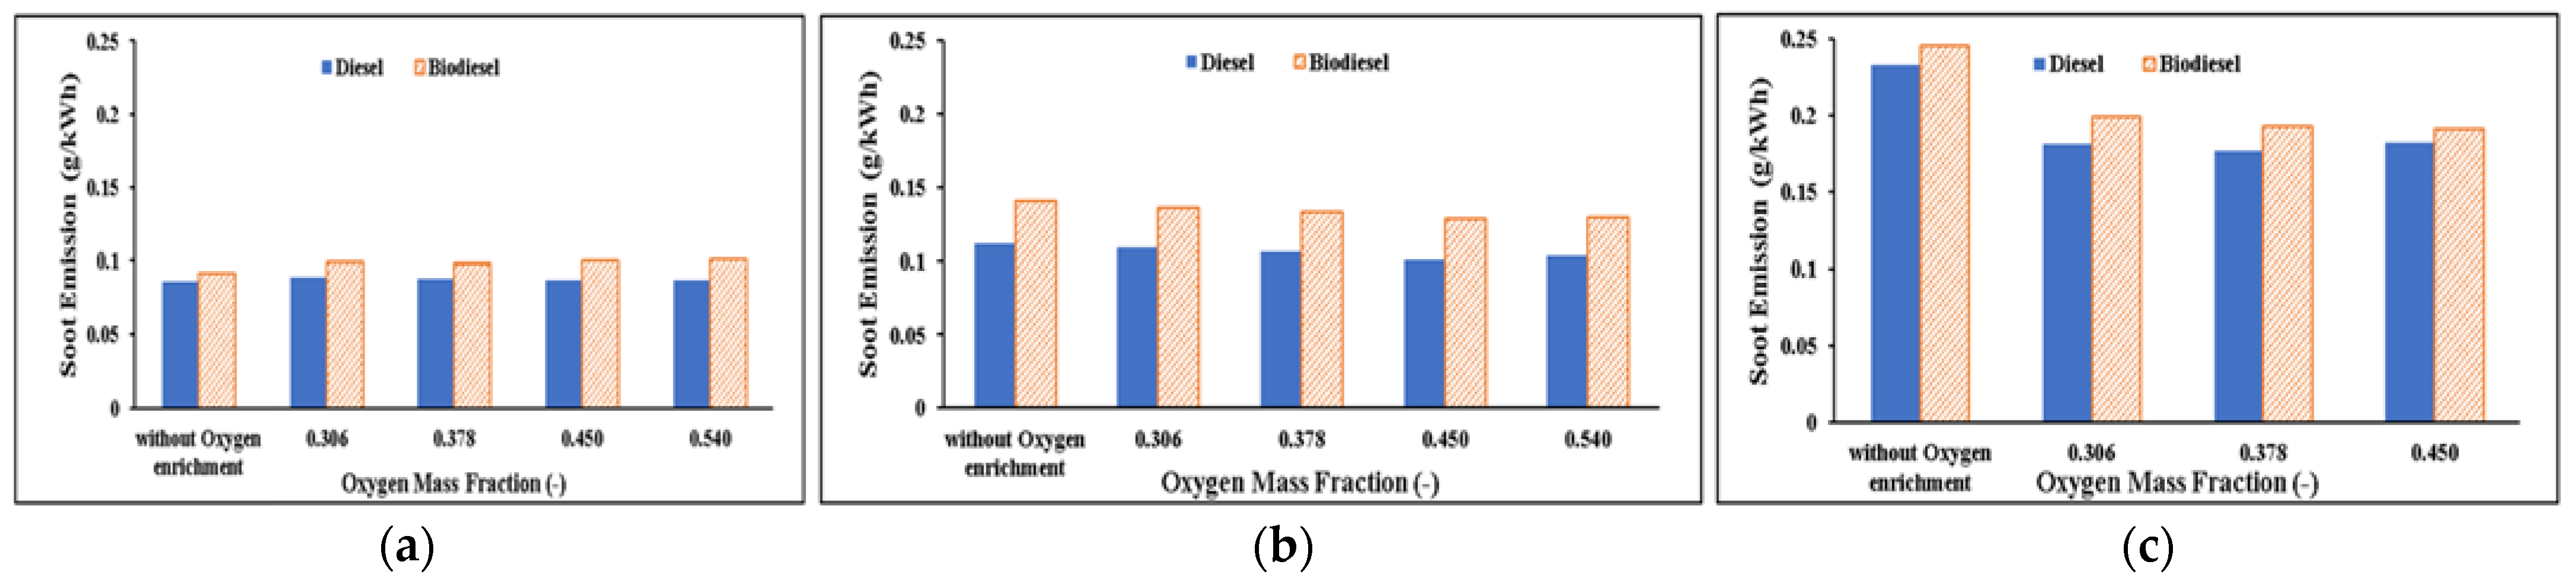
    • As the mass percentage of oxygen increases, soot production is reduced because there is more oxygen available for fuel oxidation. As the lower peak HRR indicates, using biodiesel results in more soot emissions than using diesel because of poorer combustion.
  • The BSFC value and soot emissions from the use of diesel fuel are lower than those with the use of biodiesel substitutes. Diesel fuel is used less frequently than biodiesel fuel when it comes to thermal efficiency and NOx emissions.
A suggestion for further research that can improve this research is to conduct tests using oxygen concentrations below 30% and above 57% with a more diverse load and diesel engine speed to see the effects of various oxygen concentrations on other loads and rotations.

Author Contributions

Conceptualization, F.A.G. and B.W.; Writing—Original Draft, F.A.G. and B.W.; Methodology, F.A.G., A.P., Y.P., A.D., A.N., S. and M.P.; Software, F.A.G., A.P. and Y.P.; Formal analysis, F.A.G., B.W., A.P., Y.P., A.D., A.N., S. and M.P.; Visualization, F.A.G., B.W. and M.K.A.W.; Validation, B.W., A.P., Y.P., A.D., A.N., S., M.P. and M.K.A.W.; Investigation, F.A.G., A.P., Y.P., A.D., A.N., S., M.P. and M.K.A.W.; Resources, A.P., Y.P., A.D., A.N., S. and M.P.; Data Curation, B.W., A.D., A.N., S., M.P. and M.K.A.W.; Writing—Reviewing and Editing, B.W., A.P., M.K.A.W. and A.N.; Supervision, B.W. and M.K.A.W.; Funding acquisition, B.W.; Project administration, A.P. and Y.P. All authors contributed equally as the main contributors of this paper. All authors have read and agreed to the published version of the manuscript.

Funding

This research received no external funding.

Data Availability Statement

Data is contained within the article.

Acknowledgments

A great thank you to the late Widodo Budi Santoso and Naili Huda for their great support and contribution during the research until the writing of this paper.

Conflicts of Interest

All authors declare no conflicts of interest.

References

  1. Mustayen, A.G.M.B.; Rasul, M.G.; Wang, X.; Negnevitsky, M.; Hamilton, J.M. Remote areas and islands power generation: A review on diesel engine performance and emission improvement techniques. Energy Convers. Manag. 2022, 260, 115614. [Google Scholar] [CrossRef]
  2. Dahham, R.Y.; Wei, H.; Pan, J. Improving Thermal Efficiency of Internal Combustion Engines: Recent Progress and Remaining Challenges. Energies 2022, 15, 6222. [Google Scholar] [CrossRef]
  3. Dhahad, H.A.; Hasan, A.M.; Chaichan, M.T.; Kazem, H.A. Prognostic of diesel engine emissions and performance based on an intelligent technique for nanoparticle additives. Energy 2022, 238, 121855. [Google Scholar] [CrossRef]
  4. Kozina, A.; Radica, G.; Nižetić, S. Emission analysis of diesel vehicles in circumstances of emission regulation system failure: A case study. J. Energy Resour. Technol. 2022, 144, 082307. [Google Scholar] [CrossRef]
  5. Fayyazbakhsh, A.; Bell, M.L.; Zhu, X.; Mei, X.; Koutný, M.; Hajinajaf, N.; Zhang, Y. Engine emissions with air pollutants and greenhouse gases and their control technologies. J. Clean. Prod. 2022, 376, 134260. [Google Scholar] [CrossRef]
  6. Palani, Y.; Devarajan, C.; Manickam, D.; Thanikodi, S. Performance and emission characteristics of biodiesel-blend in diesel engine: A review. Environ. Eng. Res. 2022, 27, 200338. [Google Scholar] [CrossRef]
  7. Baskar, P.; dan Senthilkumar, A. Effects of oxygen enriched combustion on pollution and performance characteristics of a diesel engine. Eng. Sci. Technol. Int. J. 2016, 19, 438–443. [Google Scholar] [CrossRef]
  8. Chin, J.-S. Analysis of the Effect of Oxygen Addition on Minimum Ignition Energy. J. Energy 1983, 7, 710–715. [Google Scholar] [CrossRef]
  9. Donahue, R.J.; dan Foster, D.E. Effects of oxygen enhancement on the emissions from a di diesel via manipulation of fuels and combustion chamber 75 gas composition. SAE Tech. Pap. 2000, 109, 334–350. [Google Scholar] [CrossRef]
  10. Wai, P.; Kanokkhanarat, P.; Oh, B.S.; Wongpattharaworakul, V.; Depaiwa, N.; Po-ngaen, W.; Chollacoop, N.; Srisurangkul, C.; Kosaka, H.; Yamakita, M.; et al. Experimental investigation of the influence of ethanol and biodiesel on common rail direct injection diesel Engine’s combustion and emission characteristics. Case Stud. Therm. Eng. 2022, 39, 102430. [Google Scholar] [CrossRef]
  11. Zhang, X.; Duan, Y.; Zhang, R.; Wei, H.; Chen, L. Optical study of oxygen enrichment on methane combustion characteristics under high compression-ratio conditions. Fuel 2022, 328, 125251. [Google Scholar] [CrossRef]
  12. Kapusuz, M.; Çakmak, A.; Özcan, H. Application of oxygen enrichment and adiabatic humidification to suction air for reducing exhaust emissions in a gasoline engine. Energy Sources Part A Recovery Util. Environ. Eff. 2023, 45, 194–211. [Google Scholar] [CrossRef]
  13. Gad, M.S.; El-Araby, R.; Abed, K.A.; El-Ibiari, N.N.; El Morsi, A.K.; dan ElDiwani, G.I. Performance and emissions characteristics of C.I. engine fueled with palm oil/palm oil methyl ester blended with diesel fuel. Egypt. J. Pet. 2018, 27, 215–219. [Google Scholar] [CrossRef]
  14. Al Qubeissi, M.; Mahmoud, A.; Al-Damook, M.; Almshahy, A.; Khatir, Z.; Soyhan, H.S.; Raja Ahsan Shah, R.M. Comparative analysis of battery thermal management system using biodiesel fuels. Energies 2023, 16, 565. [Google Scholar] [CrossRef]
  15. Kesharvani, S.; Dwivedi, G.; Verma, T.N.; Verma, P. The experimental investigation of a diesel engine using ternary blends of algae biodiesel, ethanol and diesel fuels. Energies 2023, 16, 229. [Google Scholar] [CrossRef]
  16. Giakoumis, E.G. Analysis of 22 vegetable oils’ physico-chemical properties and fatty acid composition on a statistical basis, and correlation with the degree of unsaturation. Renew. Energy 2018, 126, 403–419. [Google Scholar] [CrossRef]
  17. Belousov, A.S.; Esipovich, A.L.; Kanakov, E.A.; Otopkova, K.V. Recent advances in sustainable production and catalytic transformations of fatty acid methyl esters. Sustain. Energy Fuels 2021, 5, 4512–4545. [Google Scholar] [CrossRef]
  18. Abdelbasset, W.K.; Alrawaili, S.M.; Elsayed, S.H.; Diana, T.; Ghazali, S.; Felemban, B.F.; Zwawi, M.; Algarni, M.; Su, C.H.; Nguyen, H.C.; et al. Optimization of heterogeneous Catalyst-assisted fatty acid methyl esters biodiesel production from Soybean oil with different Machine learning methods. Arab. J. Chem. 2022, 15, 103915. [Google Scholar] [CrossRef]
  19. Ramos, M.; Dias, A.P.S.; Puna, J.F.; Gomes, J.; Bordado, J.C. Biodiesel production processes and sustainable raw materials. Energies 2019, 12, 4408. [Google Scholar] [CrossRef]
  20. Khalid, A.; Osman, S.A.; Jaat, M.N.M.; Mustaffa, N.; Basharie, S.M.; dan Manshoor, B. Performance and emissions characteristics of diesel engine fuelled by biodiesel derived from palm oil. Appl. Mech. Mater. 2013, 315, 517–522. [Google Scholar] [CrossRef]
  21. ISO/IEC 17025:2017; General Requirements for the Competence of Testing and Calibration Laboratories. Available online: https://www.iso.org/standard/66912.html (accessed on 27 December 2023).
  22. ISO 15550:2016; Internal Combustion Engines Determination and Method for the Measurement of Engine Power. Available online: https://www.iso.org/standard/70030.html (accessed on 27 December 2023).
  23. Heywood, J.B. Internal Combustion Engine Fundamentals, 2nd ed.; McGraw-Hill Education: New York, NY, USA, 2018; p. 1056. [Google Scholar]
  24. Poon, H.M.; Ng, H.K.; Gan, S.; dan Chong, W.T. Development of a Reduced Biodiesel Surrogate Fuel Model for Multi-Dimensional Computational Fluid Dynamic Simulations. IOP Conf. Ser. Earth Environ. Sci. 2019, 268, 012080. [Google Scholar] [CrossRef]
  25. Baskar, P.; dan Senthil Kumar, A. Experimental investigation on performance characteristics of a diesel engine using diesel-water emulsion with oxygen enriched air. Alex. Eng. J. 2017, 56, 137–146. [Google Scholar] [CrossRef]
Figure 1. The experimental setup.
Energies 17 00244 g001
Figure 2. Model using AVL BOOST software.
Energies 17 00244 g002
Figure 3. Graph of cylinder pressure at (a) 50%, (b) 75%, and (c) 100% load against crank angle from (i) experiment results and (ii) simulation results.
Energies 17 00244 g003
Figure 4. Graph of cylinder pressure at (a) 50%, (b) 75%, and (c) 100% load with input oxygen concentration 20.95%.
Energies 17 00244 g004
Figure 5. The rate of heat release (RoHR) against crank angle in (a) 50%, (b) 75%, and (c) 100% load diesel engine using (i) diesel and (ii) biodiesel fuel.
Energies 17 00244 g005
Figure 6. The relationship between MFB and crank angle in the use of (i) diesel and (ii) biodiesel fuels, with a load of (a) 50%, (b) 75%, and (c) 100%.
Energies 17 00244 g006
Figure 7. Brake specific fuel consumption (BSFC) to oxygen mass fraction at (a) 50%, (b) 75%, and (c) 100% loads.
Energies 17 00244 g007
Figure 8. Thermal efficiency of oxygen mass fraction at (a) 50%, (b) 75%, and (c) 100% loads.
Energies 17 00244 g008
Figure 9. Exhaust gas temperature to oxygen mass fraction at loads of (a) 50%, (b) 75%, and (c) 100%.
Energies 17 00244 g009
Figure 10. NOx emissions to oxygen mass fraction at (a) 50%, (b) 75%, and (c) 100% loads.
Energies 17 00244 g010
Figure 11. The relationship between maximum combustion temperature and oxygen mass fraction at (a) 50%, (b) 75%, and (c) 100% loads.
Energies 17 00244 g011
Figure 12. Emissions of soot to oxygen mass fraction at (a) 50%, (b) 75%, and (c) 100% loads.
Energies 17 00244 g012
Table 1. Specifications of the YANMAR TF 155 R-DI engine.
ParameterSpecification
Bore × stroke102 mm × 105 mm
Displacement857 cc
Maximum power15.5 (PS)/2400 rpm
Compression ratio17.8
Number of cylinders1
Injection systemdirect injection
Table 2. Fuel characteristics.
ParameterValue
Density (kg/m3)820
Viscosity (mm2/s)4.5
Cetane Number53
Flash point (°C)55
Boiling point (°C)370
Calorific value (kJ/kg)47,314
Pour point18
Carbon residue (% m/m)0.3
Table 3. Oxygen concentration entering the combustion chamber.
m ˙ o x y g e n (kg/h)Oxygen Percentage (%)
020.95%
332.23%
539.72%
747.39%
1056.32%
Table 4. The simulation model’s main input and output data.
Input DataUnitOutput DataUnit
Bore, Stroke, and Connecting rod lengthMmEngine powerkW
Fuel type-IMEP, BMEP, FMEPbar
Diameter of the intake and exhaust ports MmEngine brake torqueNm
Input dataUnitOutput dataUnit
Lifting the intake and exhaust valvesMmPeak pressure risebar/deg
Exhaust pipes’ length and diameter MmPeak pressurebar
The diameter and length of intake pipesMmPeak temperatureK
Diameter of the throttleMmHeat losses kJ
Air-fuel ratio, CR, Air flow coefficient-Volumetric efficiency-
Engine frictionBarExhaust gas pressurebar
Ignition timingDegNOx emissiong/kWh
Surface area of the cylinder head, piston, and linermm2HC emissiong/kWh
Ambient temperature and pressuredegCCO emissiong/kWh
Air cleaner volumeLiterExhaust gas pressurebar
Throttle angleDegExhaust gas temperatureK
Table 5. Composition of chemical compounds in biodiesel substitute for simulation.
CompoundsComposition of Substitute BiodieselLHV (MJ/kg)Density (kg/mm3)
C11H22O2 (MD)0.2434.46887 ± 100
C11H20O2 (MD9D)0.2634.20900 ± 100
C7H160.544.95700 ± 100
Disclaimer/Publisher’s Note: The statements, opinions and data contained in all publications are solely those of the individual author(s) and contributor(s) and not of MDPI and/or the editor(s). MDPI and/or the editor(s) disclaim responsibility for any injury to people or property resulting from any ideas, methods, instructions or products referred to in the content.

