Article

Thermal Properties of TiO2 Nanoparticle-Treated Transformer Oil and Coconut Oil

by
Ashan Induranga
1,2,3,
Chanaka Galpaya
1,3,
Vimukthi Vithanage
1,2,3 and
Kaveenga Rasika Koswattage
2,3,*
1
Faculty of Graduate Studies, Sabaragamuwa University of Sri Lanka, Belihuloya 70140, Sri Lanka
2
Department of Engineering Technology, Faculty of Technology, Sabaragamuwa University of Sri Lanka, Belihuloya 70140, Sri Lanka
3
Center for Nano Device Fabrication and Characterization (CNFC), Faculty of Technology, Sabaragamuwa University of Sri Lanka, Belihuloya 70140, Sri Lanka
*
Author to whom correspondence should be addressed.
Energies 2024, 17(1), 49; https://doi.org/10.3390/en17010049
Submission received: 24 September 2023 / Revised: 8 October 2023 / Accepted: 9 October 2023 / Published: 21 December 2023
(This article belongs to the Section J: Thermal Management)

Abstract

:
This study investigates the impact of incorporating TiO2 nanoparticles into two types of oils at different temperatures and with varying volume fractions: transformer oil (NYTRO LIBRA) and virgin coconut oil (manufactured by Govi Aruna Pvt. Ltd., Gampaha, Sri Lanka). The nanofluids were prepared using a two-step method by adding CTAB (cetyltrimethylammonium bromide) surfactant. To minimize nanoparticle agglomeration, this study employed relatively low-volume fractions. Thermal properties by means of thermal conductivity, thermal diffusivity, and volumetric heat capacity were measured in accordance with ASTM (American Society for Testing and Materials) standard methods using a multifunctional thermal conductivity meter (LAMBDA thermal conductivity meter). The measured thermal conductivity values were compared with theoretical models and previous research findings. It was confirmed that the modification of thermal properties was enhanced by doping TiO2 nanoparticles with different volume fractions.

1. Introduction

‘Nanofluid’ has been a developing topic in the engineering and scientific community since the beginning of the 21st century for various applications in engineering fields ever since its initial introduction by Choi in 1995 [1,2]. The term nanofluid is used to describe a solid–liquid mixture containing nanoscale particles with an average size of less than 100 nm with any kind of a base fluid.
Numerous productive research efforts have been carried out using nanoparticles, particularly in the context of thermal conductivity across various fields. These nanoparticle-based fluids, termed nanofluids, have various applications in industrial areas. A rapid increase in the amount of research efforts related to nanofluids over the past two decades can be observed. This literature has investigated several factors that influence the thermal properties of nanofluids, such as nanoparticle concentration, particle size, particle shape, the thermal resistivity of interfacial layers, and Brownian motion [3,4,5].
It has been reported that nanofluids can be applied in various industrial cooling applications, such as electrical power systems, electronic cooling applications, biomedical systems, and the automobile industry [6,7,8]. Apart from experimental works, several studies have been carried out to model the thermal conductivity of nanofluids, considering both macroscopic and microscopic properties. However, widening the scope of empirical studies to apply nanofluids in real-time applications and build theoretical models is essential for advancing future heat transfer studies.
Researchers have explained numerous mechanisms related to nanofluids that explain the enhancement in the thermal properties of nanofluids, such as Brownian motion, nanoparticle clustering, and thermal liquid layering. Brownian motion is the random movement of nanoparticles within the fluid. This movement helps to improve the thermal conductivity of the nanofluid through thermal contact between the base fluid and the particles. Nanoparticle clustering is the aggregation of the nanoparticles that form thermal bridges within the fluid to enhance thermal conductivity. However, even though this clustering helps to improve thermal conductivity, it may reduce the stability of some nanofluids while lowering the positive effect that can be created by the Brownian motion. Thermal liquid layering is the formation of liquid molecules around the nanoparticles. This layer helps to transfer the heat between the solid and liquid phases of the nanofluid. However, the properties of this layer are different between nanofluid types. According to researchers, these mechanisms are yet to be studied further, and in the future, there will be other mechanisms to explain the behavior of the nanofluids. There are several thermal conductivity models that have been proposed, including the effect of these mechanisms. However, these models are not often used in research since these microscopic properties are complicated to analyze compared to macroscopic properties.
Nanofluids are generally developed by doping nanoparticles such as metal nanoparticles (Au, Ag, Cu), metal oxides (TiO2, Al2O3, CuO, Fe2O3), and carbon-based nanoparticles (Graphene, Fullerene, Carbon Nano Tubes) into liquids such as water, mineral oils, vegetable oils, and synthetic and natural esters. Surfactants are used to improve the nanoparticle suspension in liquids where necessary. Consequently, these efforts have enhanced the dielectric and thermal properties of base fluids. Some of the related productive research works carried out to enhance the thermal properties of fluids are mentioned below.
Sohel et al. [9] discovered the thermal properties (such as thermal conductivity, thermal diffusivity, and specific heat capacity) of Al, Al2O3, and TiO2 nanoparticles suspended in ethyl glycol and engine oils and compared their results with several theoretical implementations concerning different volume fractions. Another study validated the advantage of using Al2O3 and Fe2O3 nanoparticles in engine oils for different mass fractions, considering temperature as another variable. Their primary measurement was thermal conductivity; the measurement method was the transient hot-wire method [10]. Eric et al. [11] investigated the thermal performance of Al2O3 and Al2O3–Fe hybrid-based nanofluids by comparing theoretical models of dynamic viscosity and thermal conductivity. The CeO2–water nanofluid also enhanced thermal conductivity and dynamic viscosity compared to pure water [12].
Sunil et al [13]. dispersed CaO nanoparticles in rice bran oil, both of which are rarely used nanoparticle and base oil types compared to other research studies. Both materials also have biodegradable quality. This effort also enhanced the thermal properties of base oils by a recognizable level. Using exfoliated hexagonal boron nitride (h-BN) nanoparticles with vegetable oil is another successful effort to develop a biodegradable nanofluid [14]. Zbigniew et al. [15] used TiO2 and C60 nanoparticles with natural ester as an electro-insulative liquid in power transformers. Replacing petroleum-based products with bio-based solutions is becoming a promising research area in the effort to move towards green technology.
The thermophysical properties of carbon-based nanofluids such as graphene, amorphous graphene, graphene quantum dots, controlled reduced graphene oxide, carbon nanotubes, and fullerene are critically discussed in several research papers that consider their unique characteristics compared to other metallics and metal oxide nanoparticles [16]. Almeida et al. [17] dispersed graphene nanoparticle transformer oils and investigated thermophysical properties such as kinematic viscosity, surface tension, density, and specific resistance. It has been reported that amorphous graphene is also a good candidate to enhance the electrical and thermophysical properties of transformer oils due to their interaction between nanosheets and the clustering of nanostructures [18]. Zhang et al. [19] dispersed controlled reduced graphene oxide in water for different concentrations, which also represented the advantage of applying them in industrial cooling applications. Primarily, this study demonstrated that controlled reduced graphene oxide can enhance the thermal conductivity of water more than other graphene nanoparticles. Amiri et al. [20] showed that amine-treated graphene dots can produce enormously stable nanofluids with superior thermal conductivity and higher breakdown voltage, confirming their potential.
Researchers have developed several theoretical models to predict the thermal conductivity of nanofluids throughout the past few decades. Maxwell’s model was the first thermal conductivity empirical model [21]. Most researchers have followed Maxwell’s model and developed some advanced models, such as the Hamilton crosser model and Bruggeman model. However, recent research articles show that developing a common thermal conductivity model for all nanofluids is challenging, considering microscopic parameters such as nanolayer thermal conductivity, nanolayer thickness, particle size, particle shape, and particle interaction between different materials. As a result, researchers started to develop specific models for specific nanoparticles and base fluids.
In this research work, TiO2 (titanium dioxide) was selected as the nanoparticle, and the base fluids used were transformer oil and coconut oil. Several research studies have verified that TiO2 can enhance the electro-insulation properties of transformer oils [22,23]. Even though some previous studies combined TiO2 and transformer oils, there are very few research articles for TiO2-based coconut oils to the best of our knowledge [24,25]. This study compares the thermal conductivity, thermal diffusivity, and volumetric heat capacity of TiO2-based nanofluids. In addition, the experimental values of thermal conductivity are compared with three theoretical models, namely the Maxwell model [21], the Maxwell–Garnett model [21], and the Pak and Cho model [26], as well as alongside several other experimental studies.

2. Materials and Methods
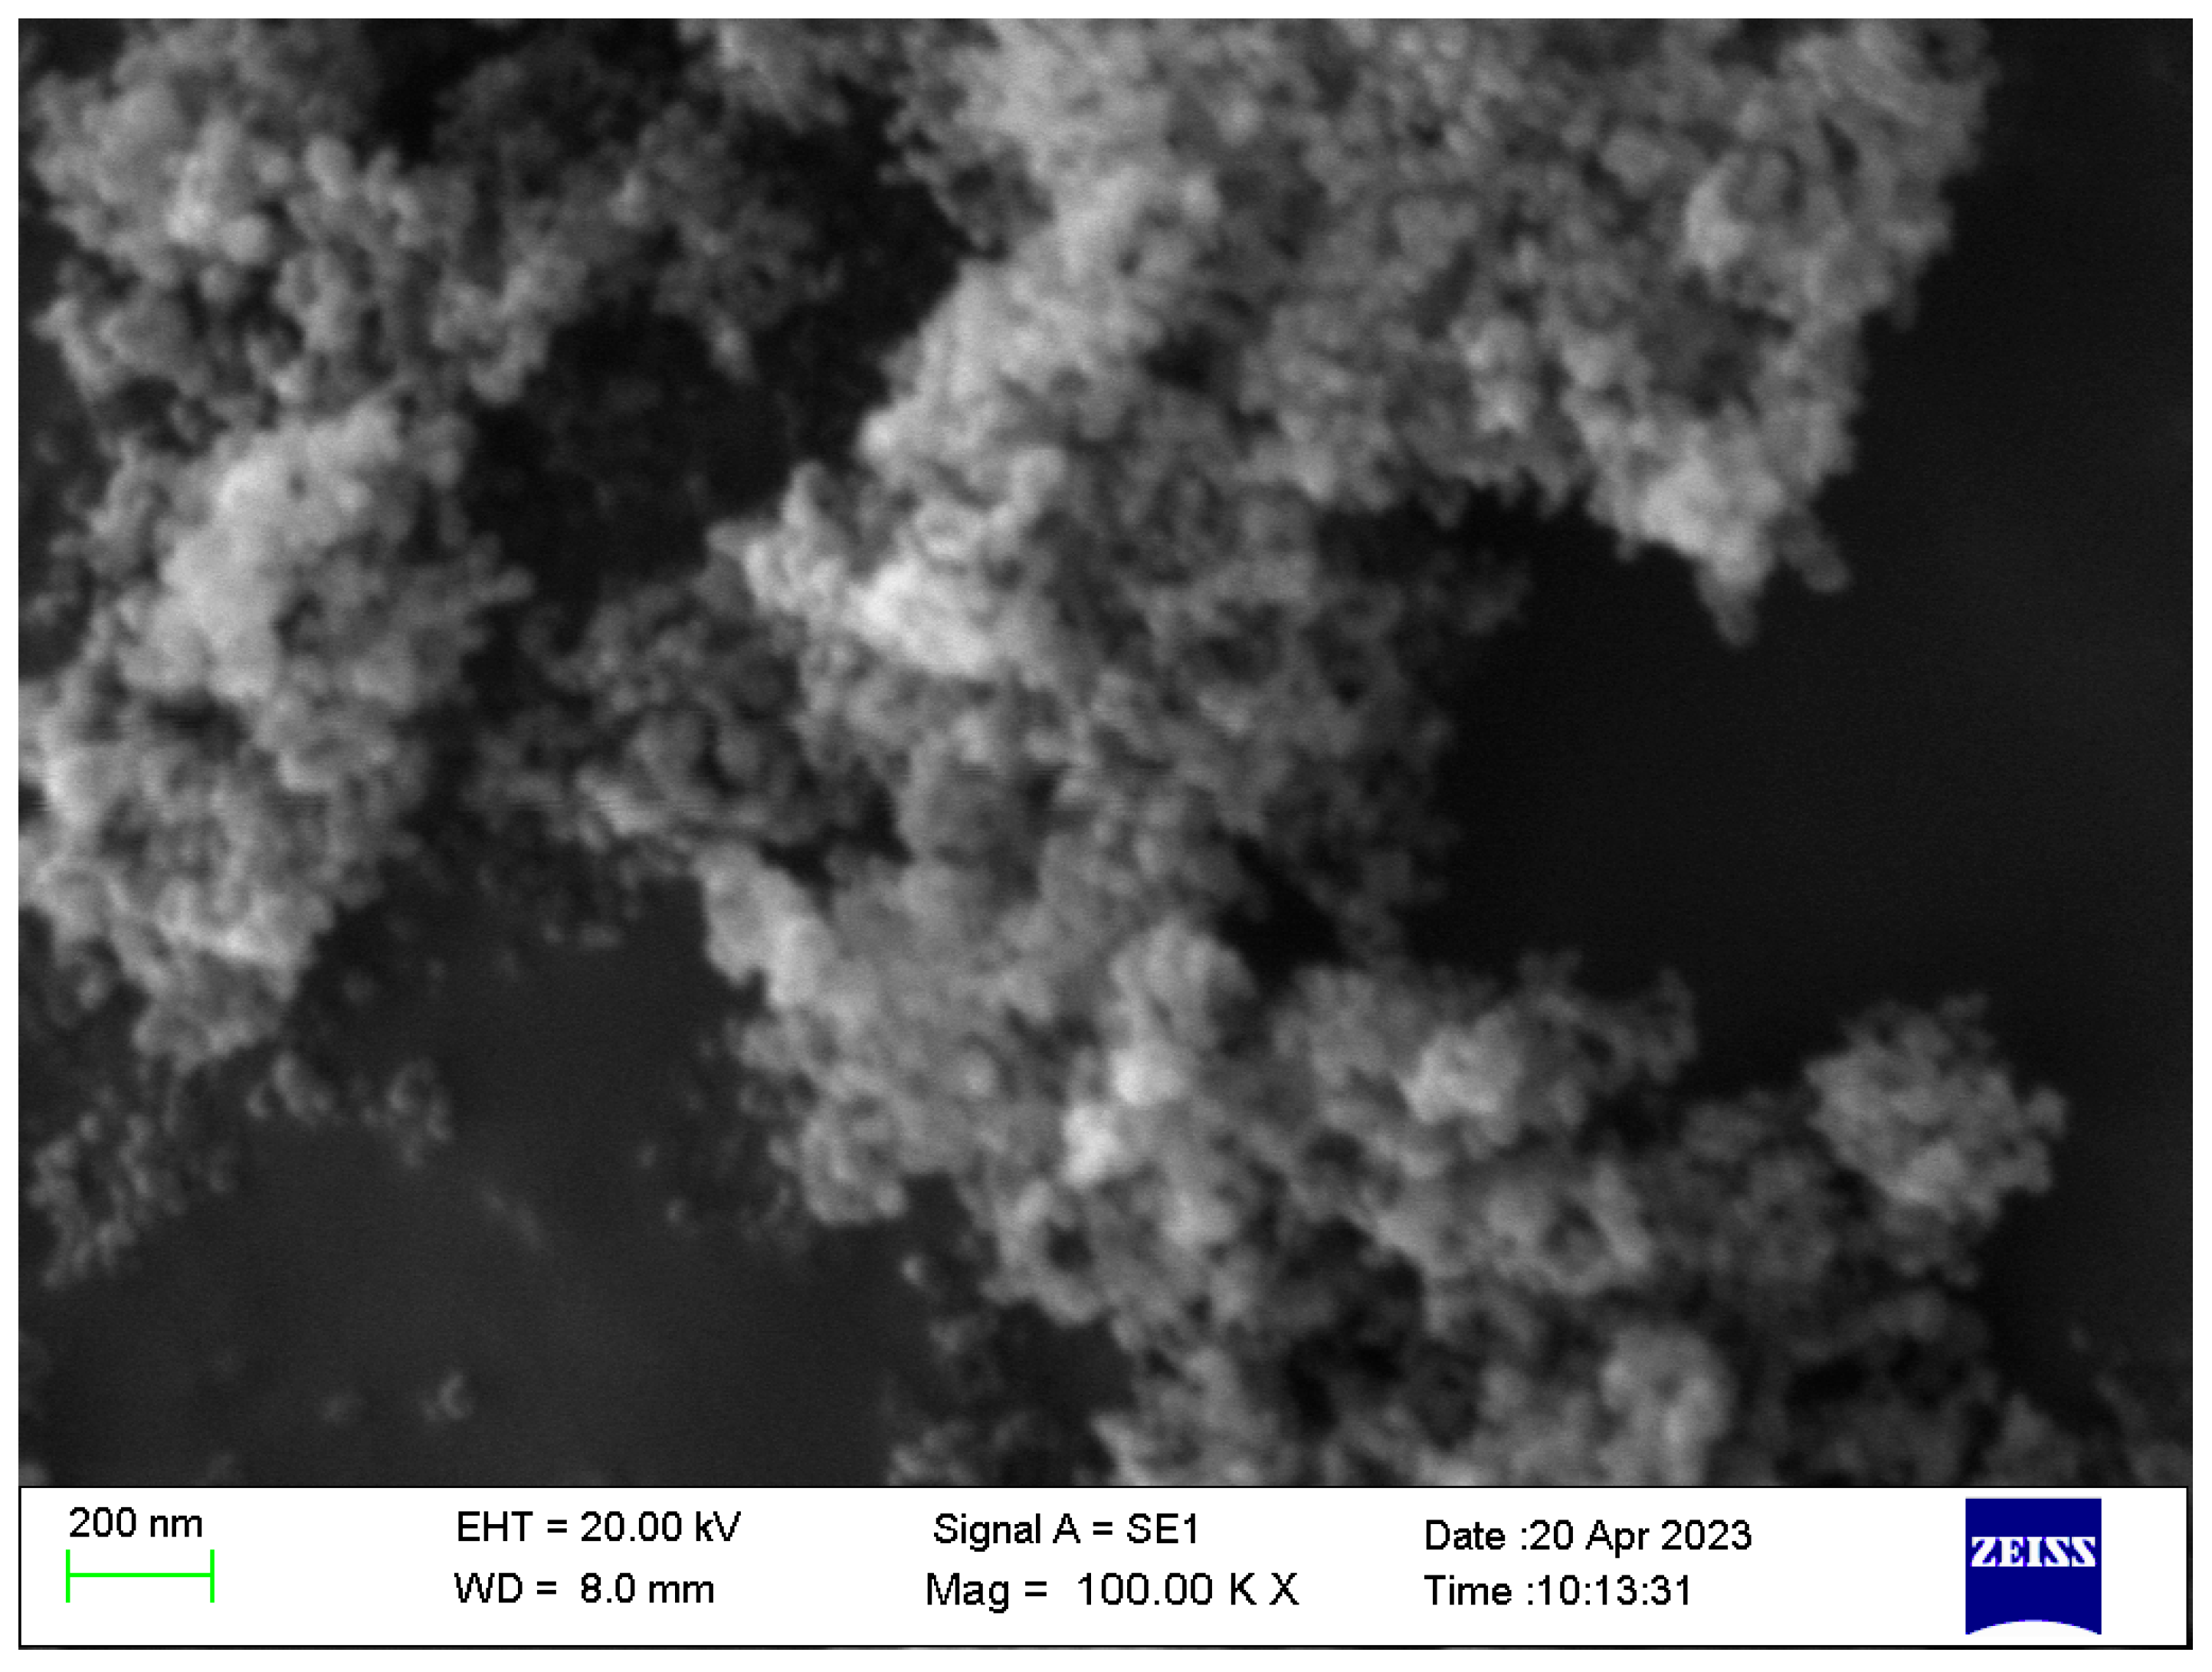
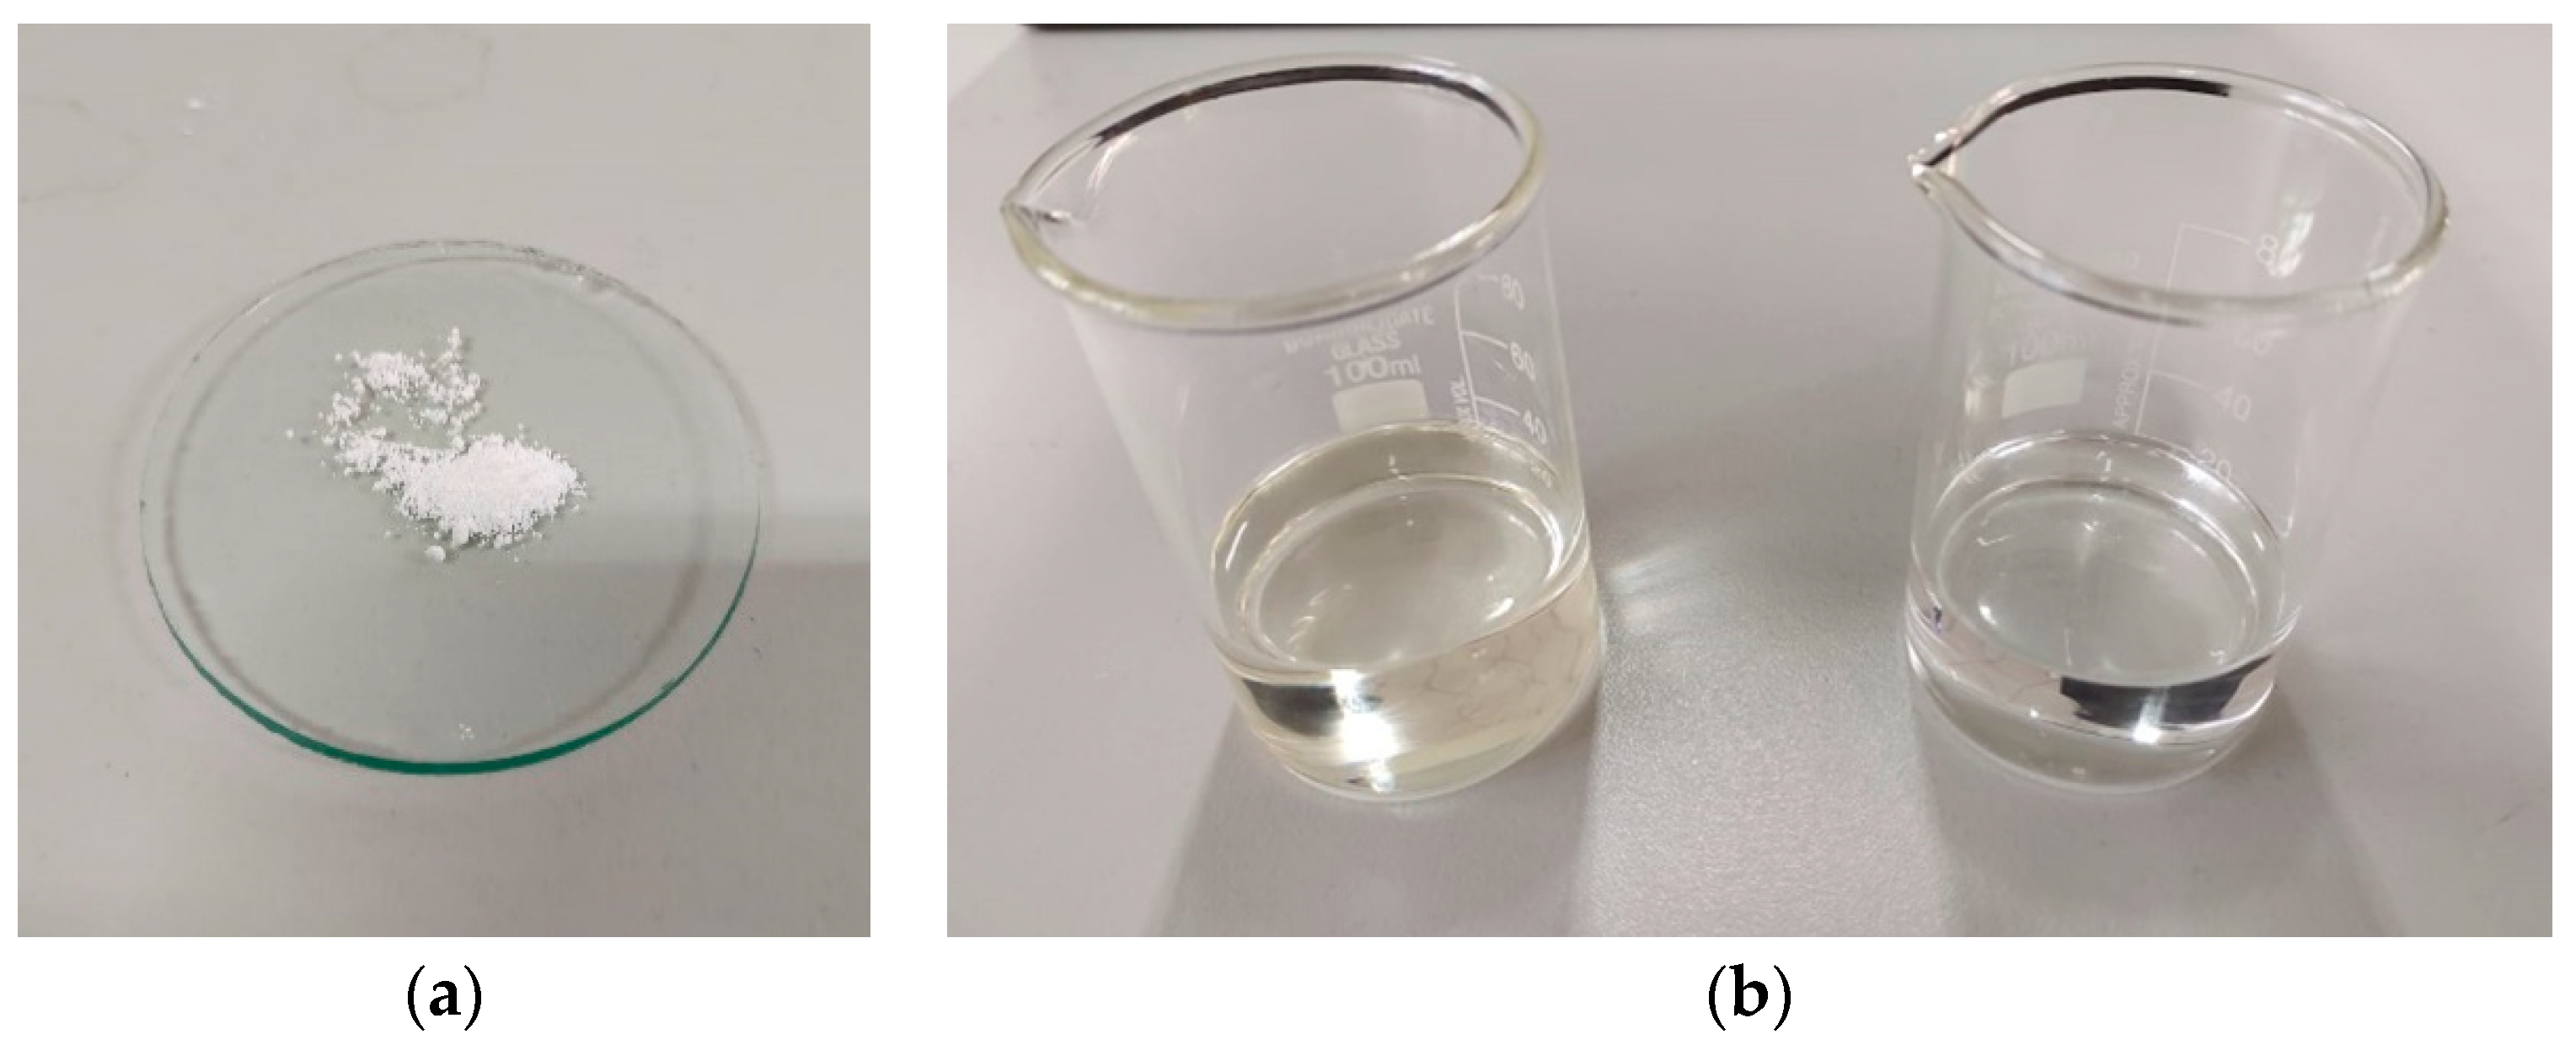
2.1. Materials

TiO2 anatase-type nanopowder was purchased from Ningbo Jiweina New Material Technology Co., Ltd., Beijing, China. Two base fluids were used to prepare nanofluids. The transformer oil was NYTRO LIBRA [27,28], and the organic virgin coconut oil was manufactured by Govi Aruna (Pvt.) Ltd. [29,30]. The properties of the TiO2 nanoparticles are provided in Table 1, and the SEM image is shown in Figure 1. Table 2 represents the details of the two base fluids. Figure 2 represents the appearances of the nanoparticle and the two base fluids.

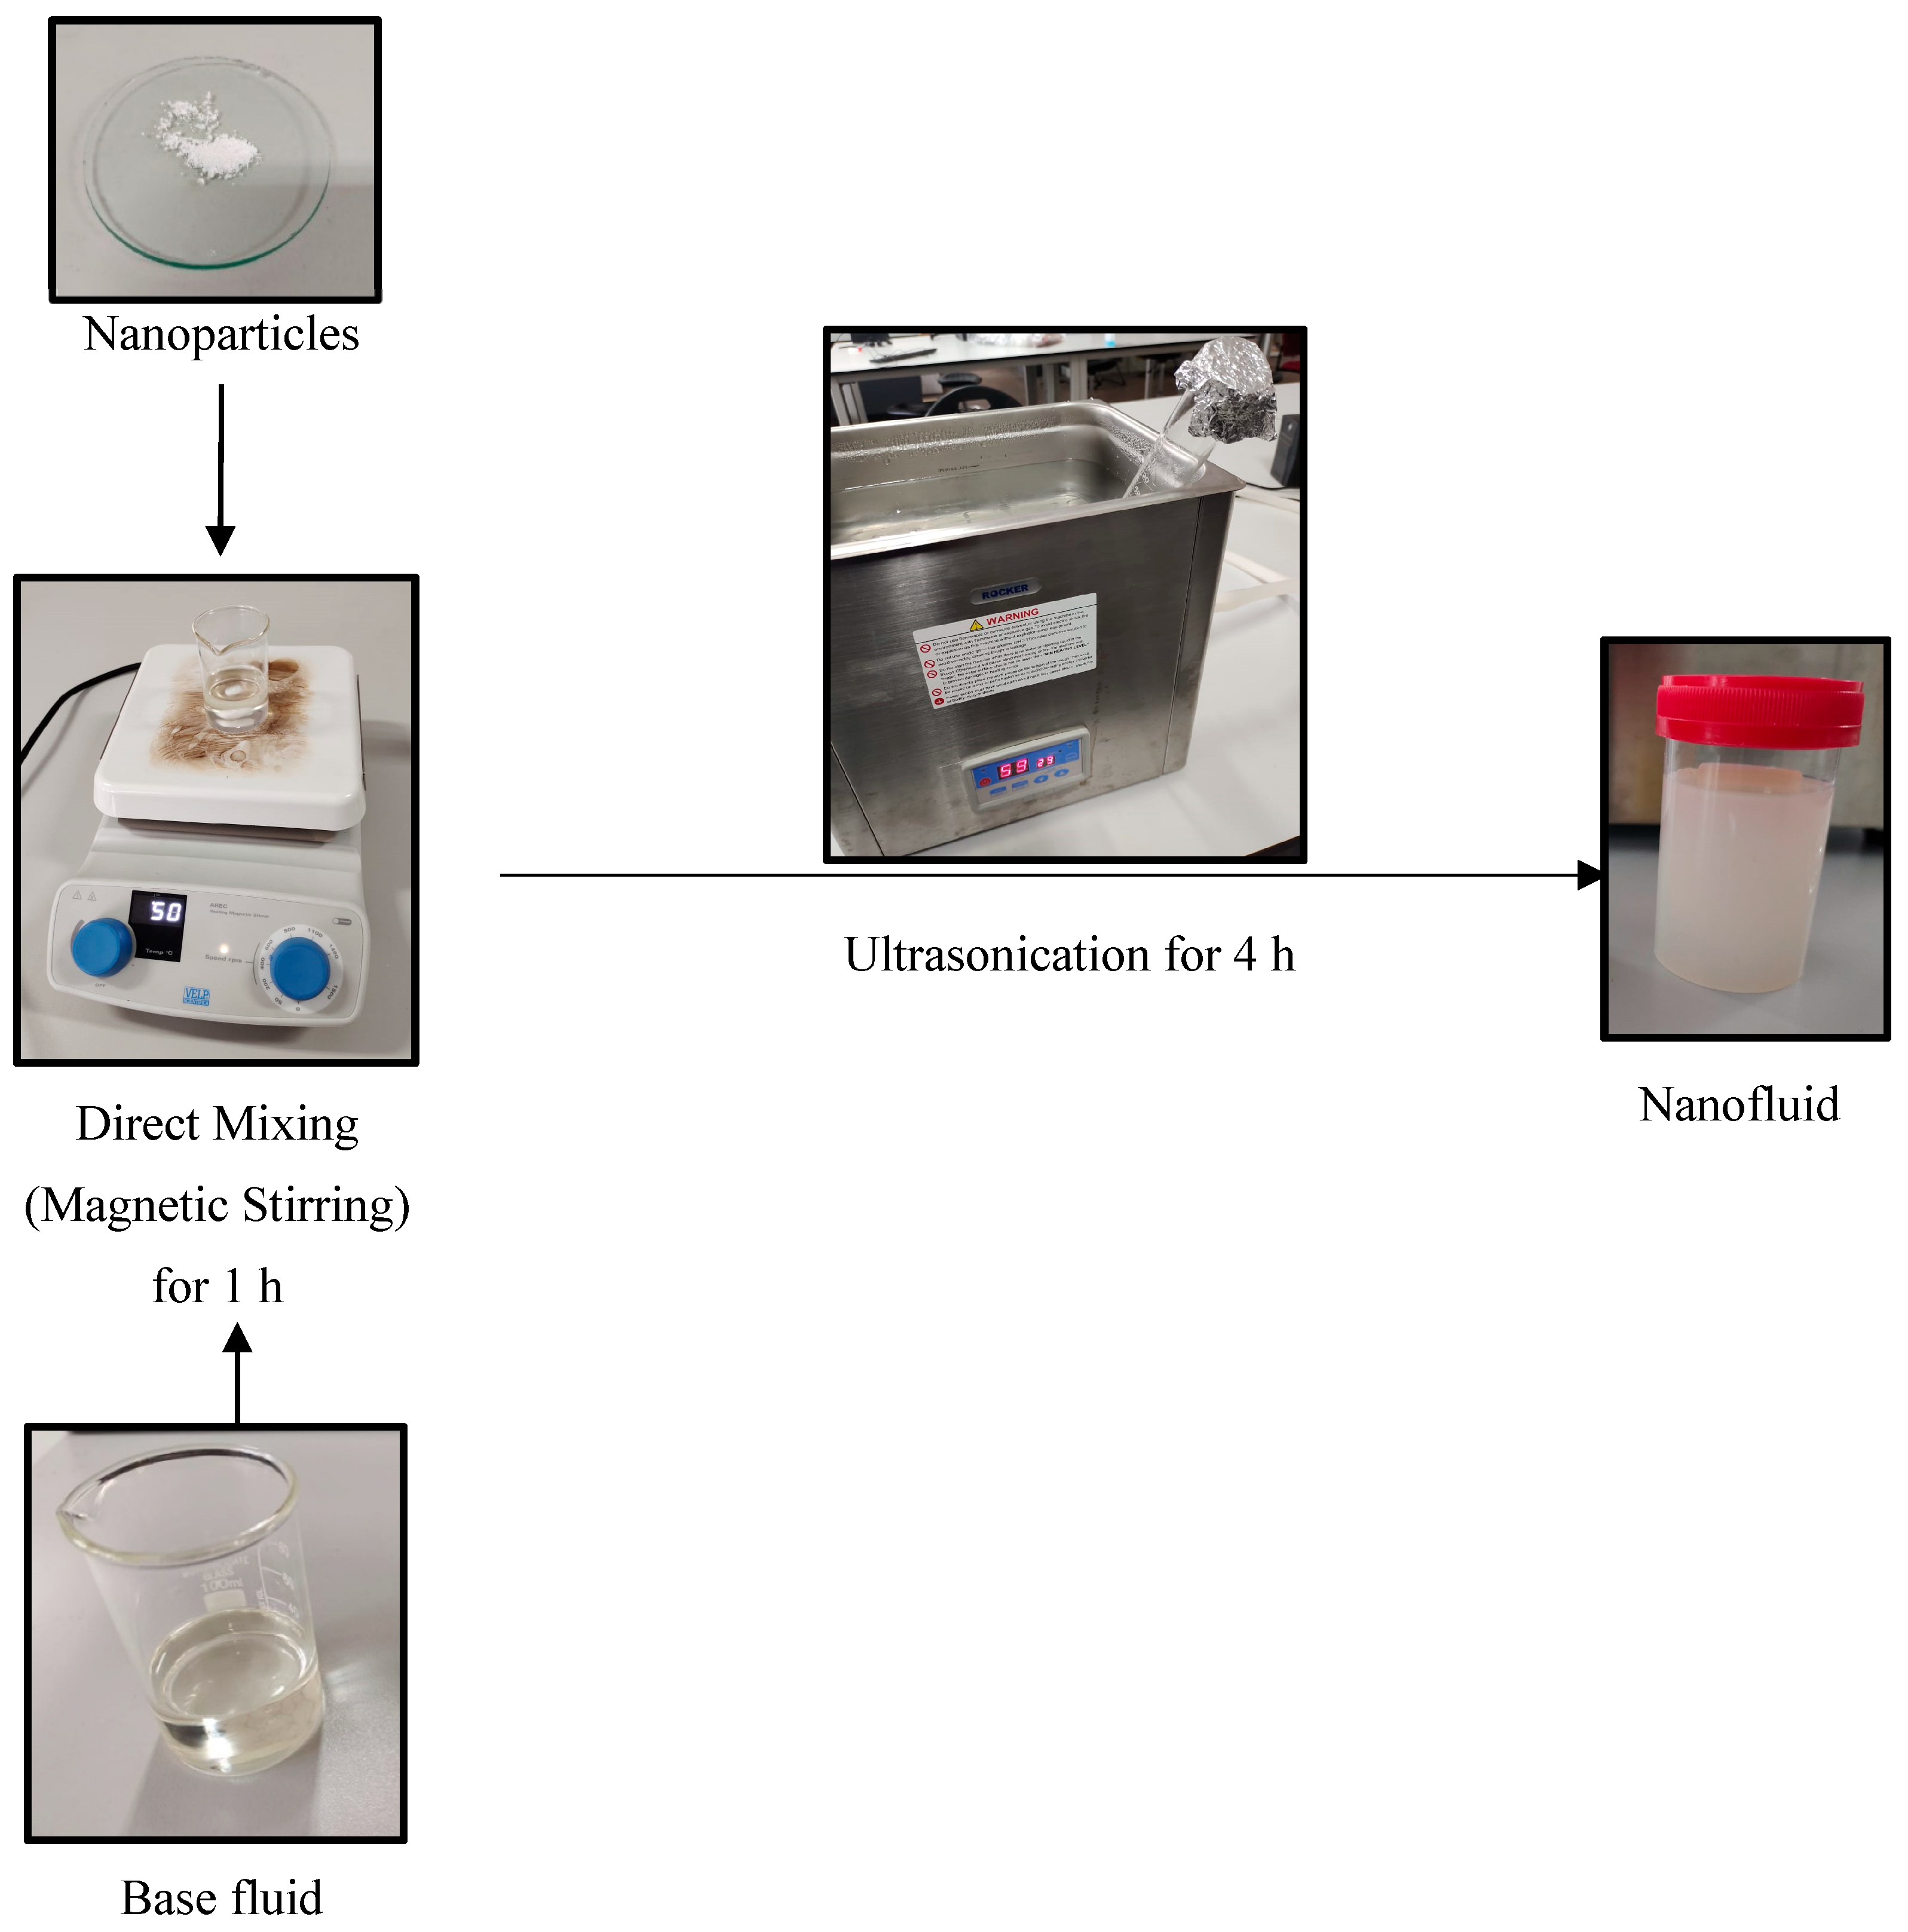
2.2. Preparation of Nanofluids

A two-step preparation method was used to utilize the base fluids with the nanoparticles. It was decided that the TiO2 nanoparticles be dispersed in the base fluid with different volume fractions from 0.002 vol.% to 0.012 vol.%.
V o l u m e   P e r c e n t a g e = V n p V n p + V b f   ×   100 % = m n p ρ n p m n p ρ n p + m n p ρ n p   ×   100
The volume percentage of the nanofluid was calculated from Equation (1) using the data from Table 1 and Table 2. The weights were measured with an accuracy of 0.1 mg using a BSA224S-CW precision balance, Sartorius AG, Goettingen, Germany. After measuring the weights, the base oil beaker was placed on a magnetic stirrer and the temperature increased to 60 °C. The nanopowder was then added to the oil with CTAB (cetyl trimethyl ammonium bromide) at a 1:0.5 ratio. Magnetic stirring was carried out for 1 h at a temperature of 60 °C at 500 rpm. The nanofluid samples were then sonicated for 4 h in the bath-type ultrasonicator at 60 °C to eliminate particle agglomeration. The physical appearance of base oils, nanoparticles, surfactants, and nanofluids is shown in Figure 3. Each prepared sample was left undistributed and observed by visual inspection for five days.

2.3. Thermal Conductivity Measurement

A LAMBDA Thermal Conductivity Meter is shown in Figure 4, was used to measure thermal conductivity, thermal diffusivity, and volumetric heat capacity according to ASTM D7896-19 standardization [31]. This instrument uses a stationary hot-wire resistance method to measure the liquids’ thermal conductivity and diffusivity. The required liquid volume was 40 mL, and the selected temperature range was 40 to 120 °C. The selected range is significantly broader compared to previous studies. This instrument is capable of measuring values from 10 to 2000 mWm−1 K−1. A PT-100 temperature sensor was included in the sample cup, which had ±0.1 °C accuracy. A dry block calibrator from the same manufacturer was used to reduce the vibrations and maintain a constant temperature during measurement. Table 3 represents the parameters of the LAMBDA Thermal Conductivity Meter.
The functional core of the stationary hot-wire method is a long cylindrical heat source. The theory of hot-wire instruments produces a constant heat stream input, q, into the surrounding liquid. This will cause a time-dependent temperature field in the liquid, as represented. The temperature rise is influenced by the changing electrical resistance of the hot wire. The following equation can be used to measure the thermal conductivity of the liquid.
λ = q 4 π ( ϑ 1 ϑ 2 ) l n t 2 t 1
where λ is thermal conductivity (Wm−1 K−1), q is a constant heat stream (Wm−1), and ϑ is temperature at time t.
When a constant voltage is supplied to the circuit, the platinum wire’s electric resistance rises with the wire’s temperature. Measured data for rising temperature are linear against logarithmic time intervals. The thermal conductivity is calculated from the slope of the rise in the wire’s temperature against the logarithmic time interval obtained by Equation (1).
Temperature regulation of the instruments is ensured by a standard PI (proportional and integral) controller with pre-calibrated controller constant values.

2.4. Thermal Diffusivity Measurement

Thermal diffusivity is a measurable thermal property according to the ASTM D7896-19 standard method and a critical factor in heat transfer fluids [31]. Thermal diffusivity measures how quickly the temperature will change when it is cooled and heated. It is the thermal inertia of a material. Thermal diffusivity and kinematic viscosity both play similar roles in heat transfer.
Thermal   Diffusivity ,   a T = K ρ C p
Here, K is the thermal conductivity, ρ is the density of the liquid, and Cp is heat capacity at a constant pressure.

2.5. Volumetric Heat Capacity Calculation

Volumetric heat capacity can be calculated using thermal conductivity and thermal diffusivity.
C v o l = λ a T
Here, λ is the thermal conductivity and aT is the thermal diffusivity. This study calculated volumetric heat capacity using the measured values of thermal conductivity and thermal diffusivity.

3. Results and Discussion

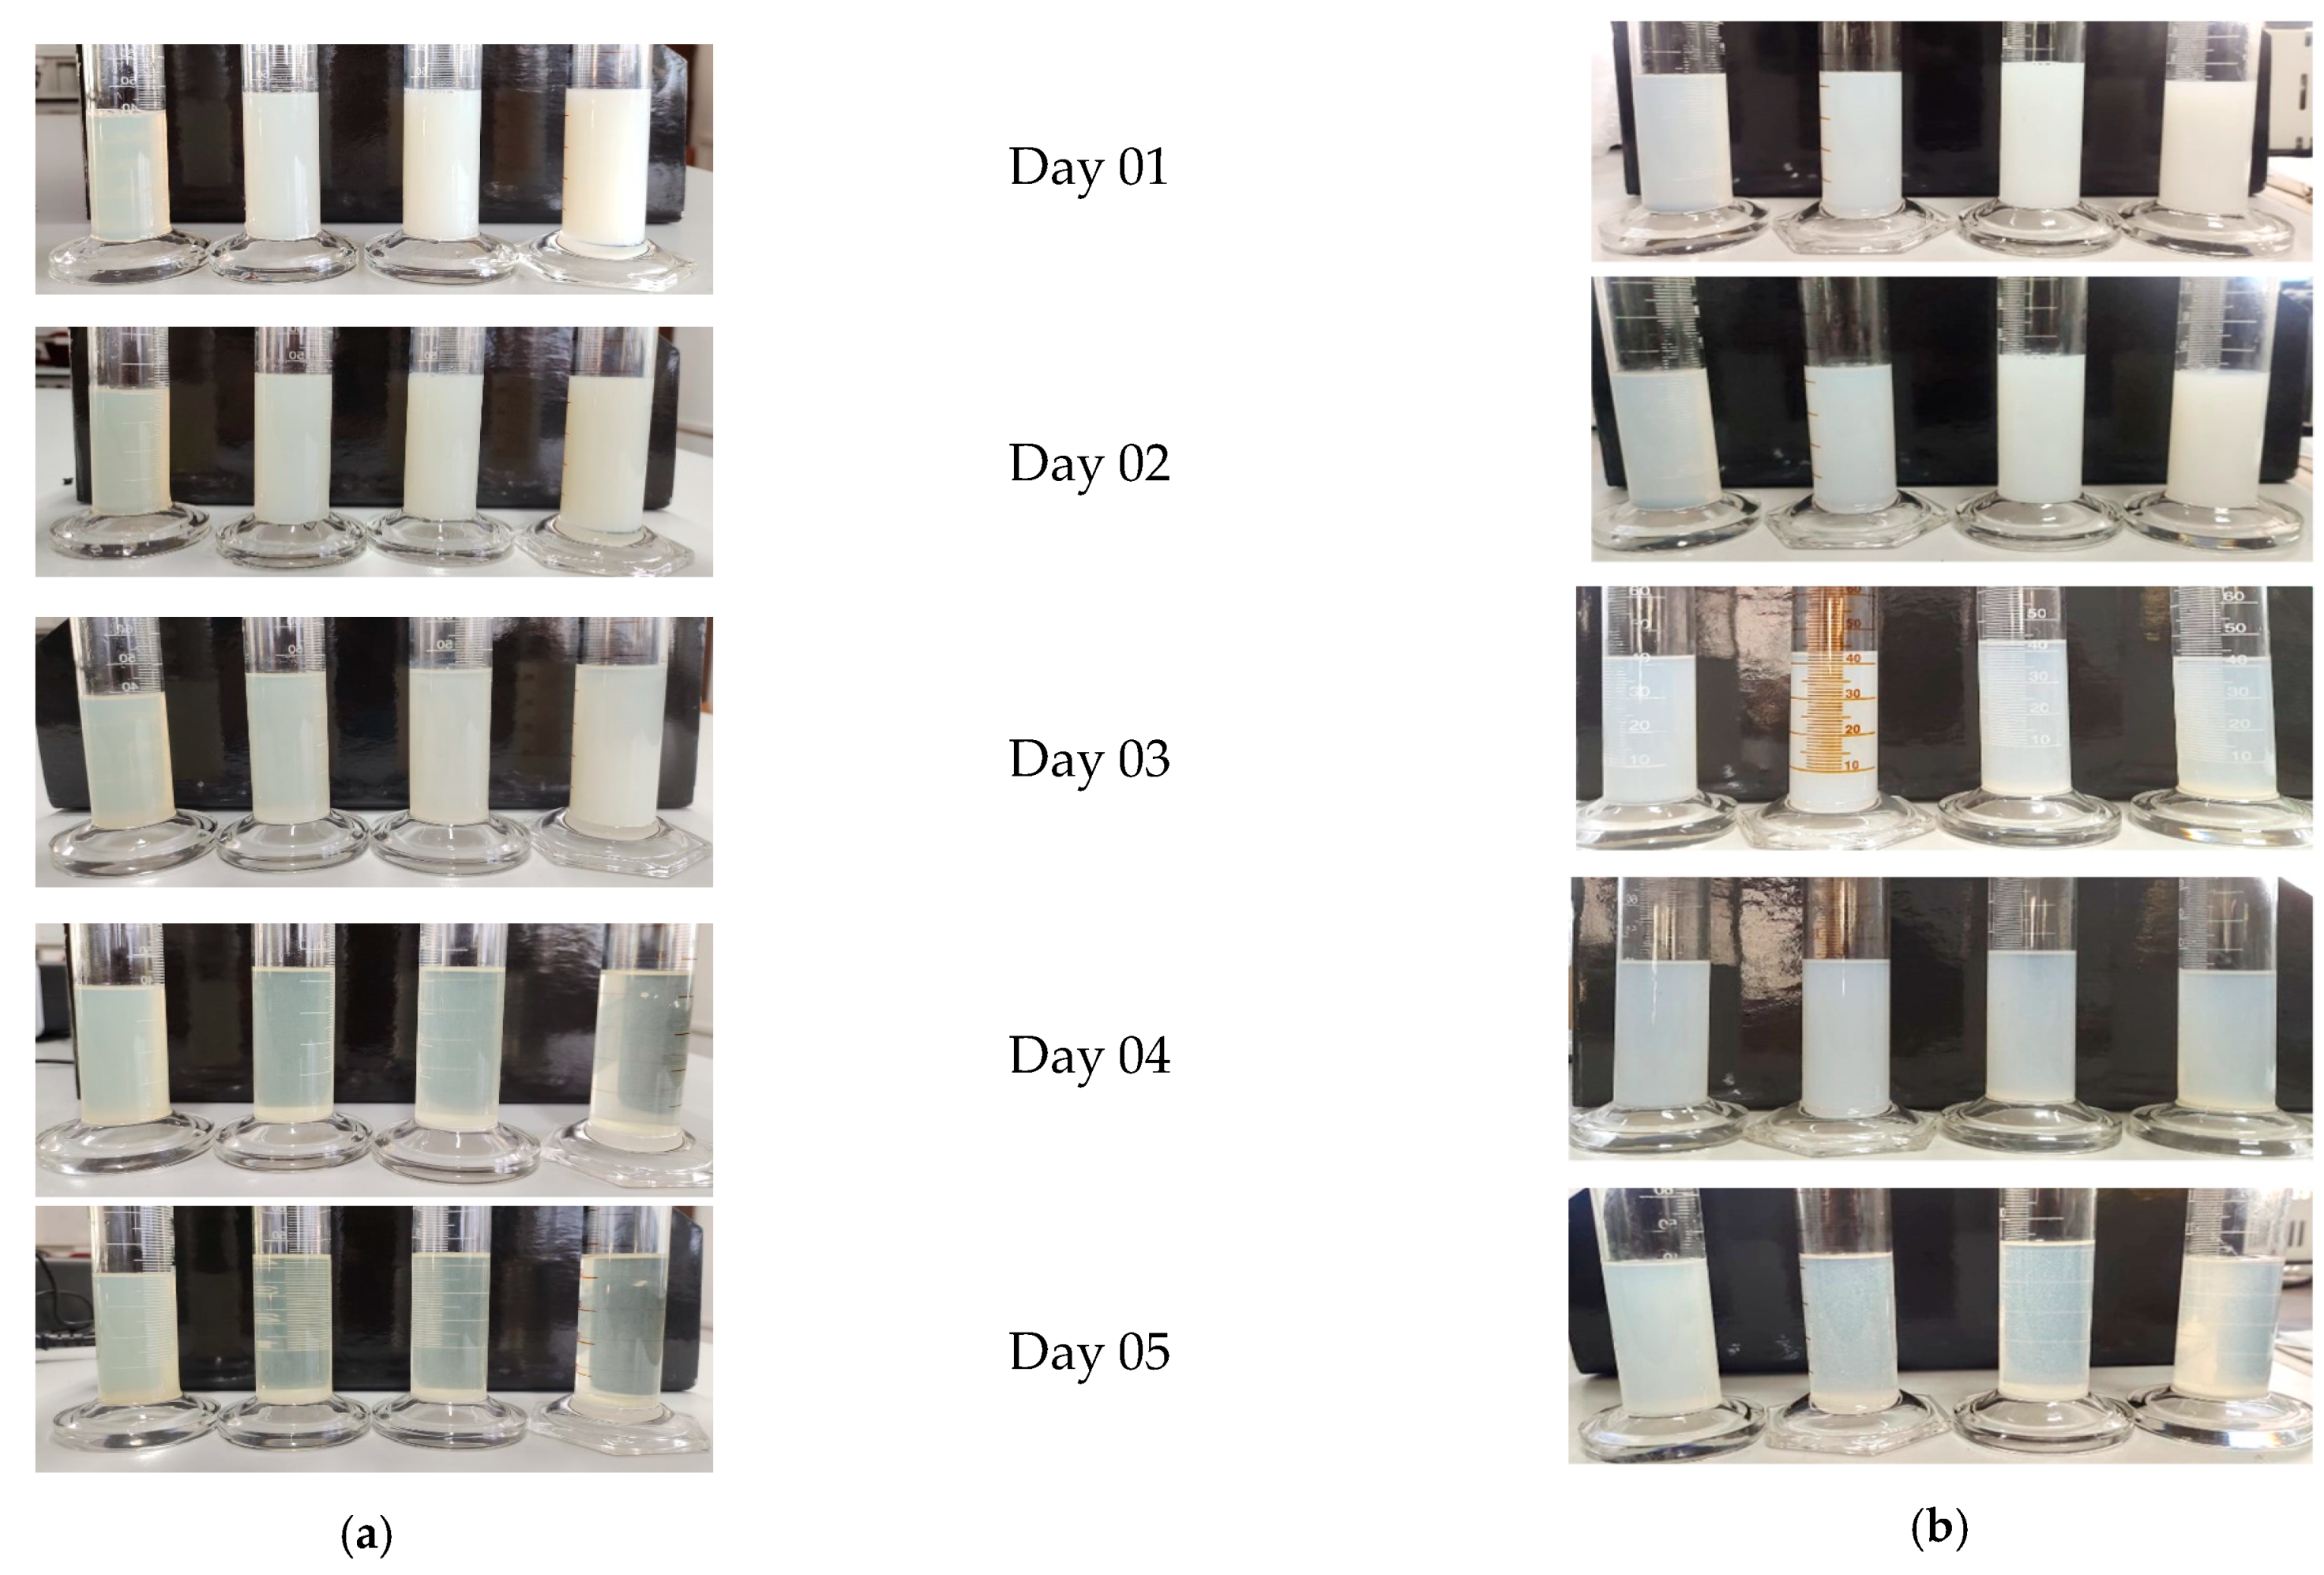
3.1. Stability of Nanofluid with Time

The stability of the transformer and coconut oil with TiO2 nanoparticles was analyzed over five days. Both oil samples with 0.002 vol.% concentration displayed the highest stability compared to other higher volume concentrations. On day 4, a thick layer of TiO2 in the 0.012 vol.% samples became observable, with other samples exhibiting the same kind of layer on day 5 as it is shown in Figure 5.
Highly concentrated nanofluids have more nanoparticles that can increase the chance of colliding with each other than lower-concentrated nanofluids. Since these higher-concentrated nanofluids tend to create larger aggregates within the fluids than lower-concentrated nanofluids, this process is called particle agglomeration. This happens due to particle–particle interaction that tends to create larger aggregates, making higher-concentrated nanofluids less stable than lower-concentrated nanofluids. This phenomenon can be easily observed in oil-based nanofluids rather than water or ethylene-glycol-based nanofluids because water and ethylene glycol base fluids are polarized materials, such as TiO2 nanoparticles, that can create strong bonds with the solid particles.

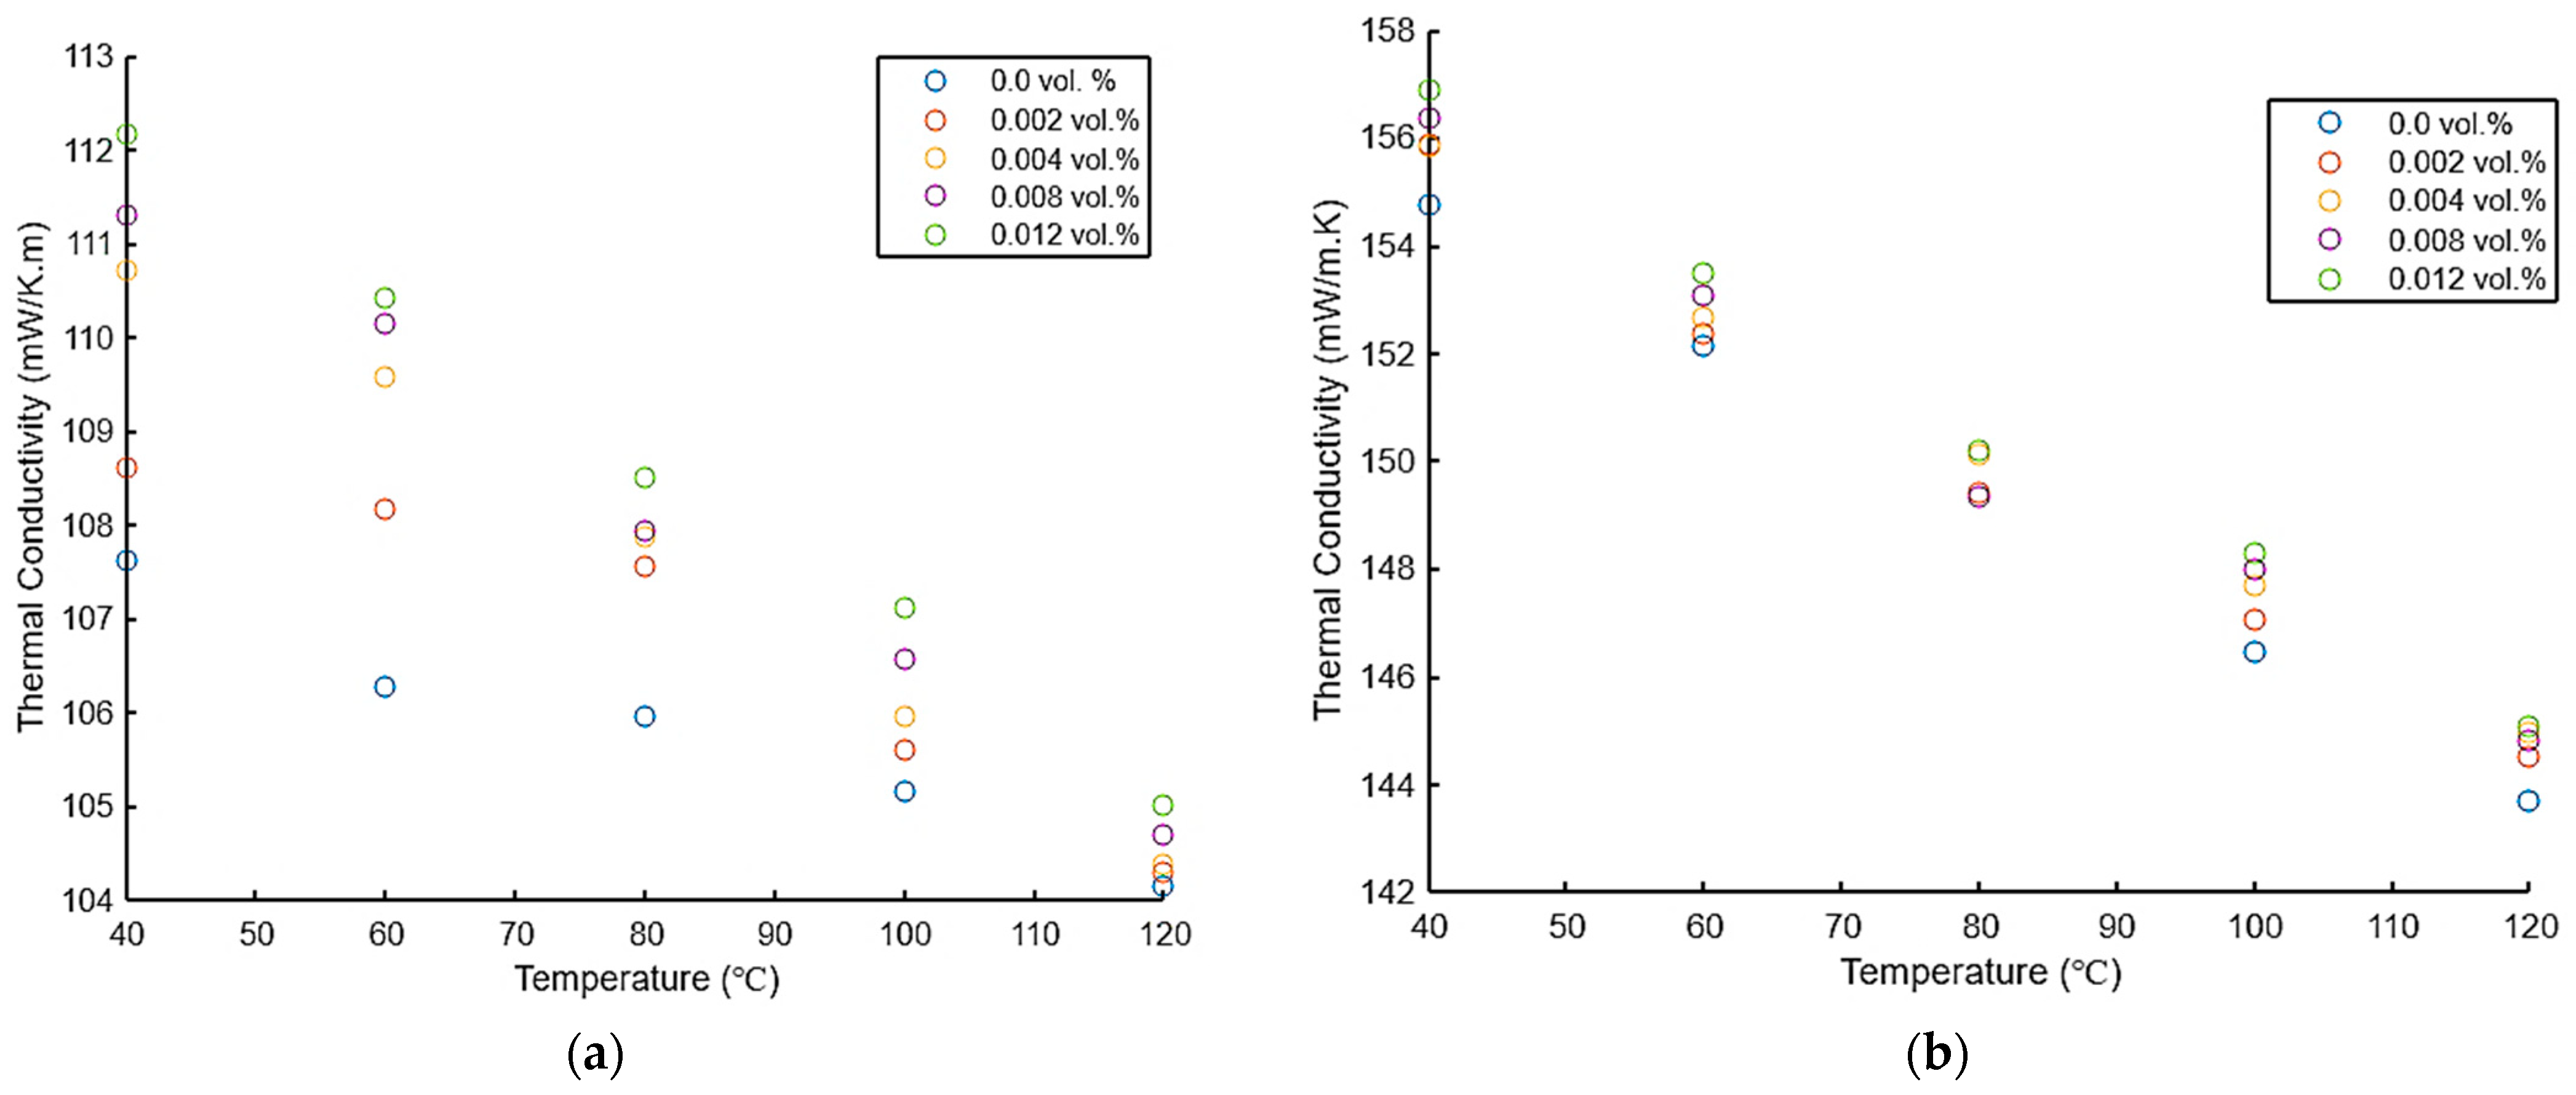
3.2. Effect of Temperature on Thermal Conductivity

Variation in the thermal conductivity of nanofluid as a function of temperature at different volumetric fractions is shown in Figure 6. The thermal conductivity of base oils and nanofluids was evaluated over the temperature range of 40 to 120 °C. The findings indicate that coconut oil has significantly higher thermal conductivity than transformer oil, making it a potential alternative for future heat transfer applications. Both oils exhibit a decrease in thermal conductivity with increasing temperature, which is consistent with most oil types [32].
Even though there is some previous research related to TiO2-based transformer oils, further research is needed on TiO2-based coconut oils. It can be observed that the impact of nanoparticles on increasing thermal conductivity has a more significant effect on transformer oils rather than coconut oils. Furthermore, TiO2 nanoparticles have a more substantial effect on enhancing the thermal conductivity of water and ethylene glycol fluids [33,34]. This observation can be justified because water or ethylene glycol base fluids can allow nanoparticles to perform Brownian motion throughout the nanofluid, which is a critical factor in increasing the thermal conductivity of nanofluids.

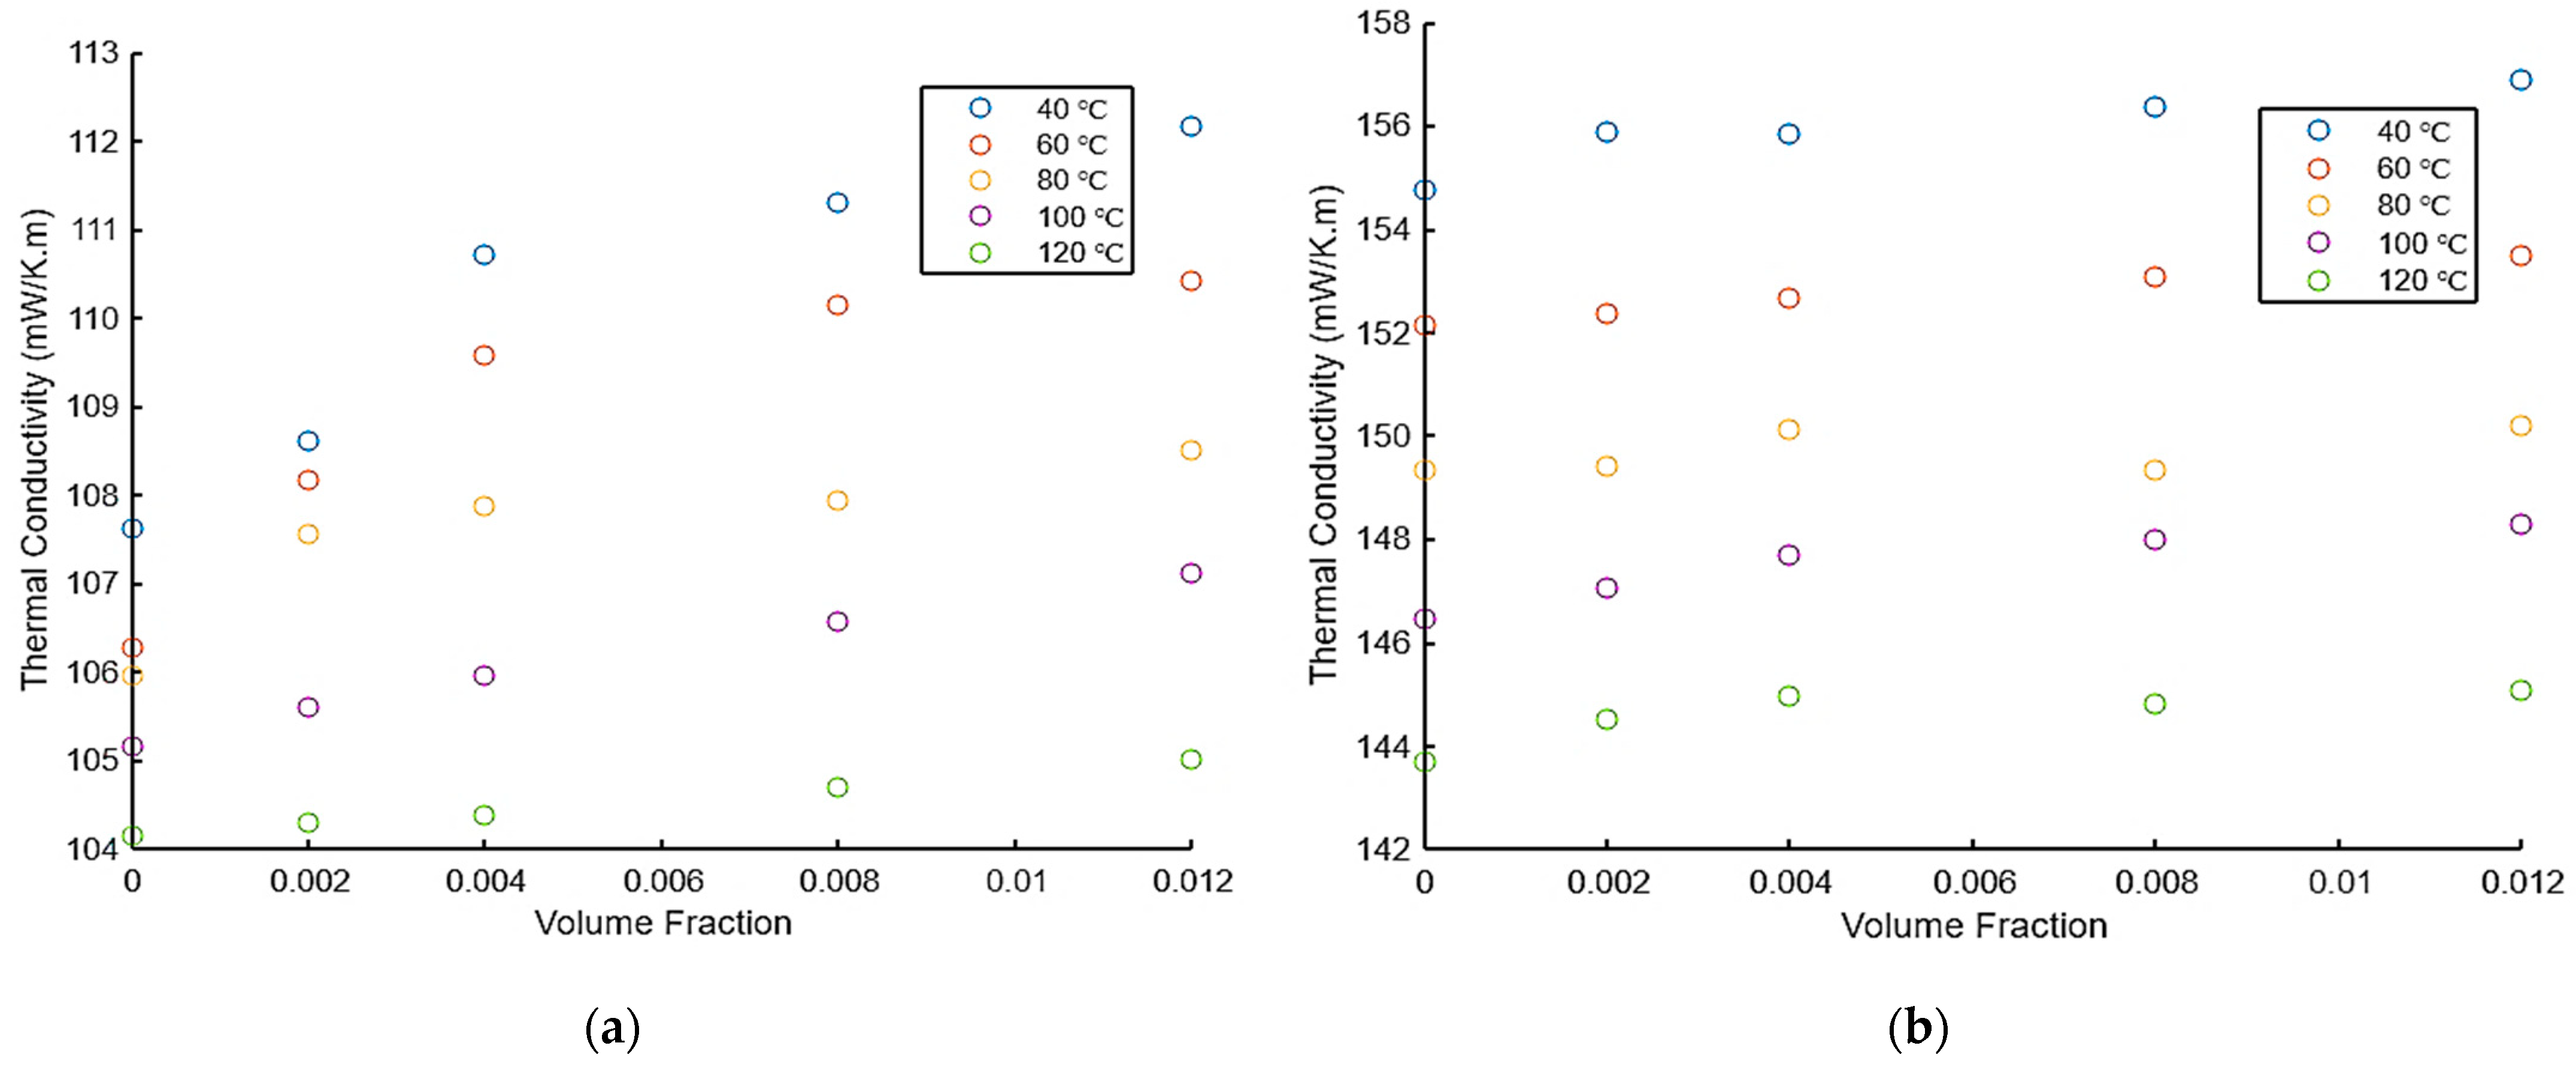
3.3. Effect of NanoparticleVolume Fraction on Thermal Conductivity

Variation in the thermal conductivity of nanofluid as a function of different volume fractions at different temperatures is shown in Figure 7. As the results indicate, thermal conductivity decreases with increasing temperature. However, increments in thermal conductivity alongside nanoparticle volume fractions can be discovered. Adding nanoparticles to the oil also alters the behavior of the base oil in terms of thermal conductivity, which leads to an increasing trend for thermal conductivity at all concentrations under any temperature conditions.

3.4. Comparison of Thermal Conductivity Enhancement with Experimental Values from Theoretical Model Values at 40 °C

According to the experimental results as given in Table 4 and Table 5, TiO2 nanoparticles considerably enhance the thermal conductivity of transformer oils more than coconut oils, which may be attributed to the higher viscosity of coconut oils.
When comparing the different thermal conductivity models, it can be observed that the Maxwell–Garnett model is more suitable for predicting TiO2–oil-based nanofluids, especially in the case of coconut oil-based nanofluids.

3.5. Comparison of Thermal Conductivity Results with Previous Research on TiO2-Nanofluids

When comparing previous research results with oil-based nanofluids, it can be observed that the contribution of TiO2 nanoparticles is much less compared to water or ethylene glycol-based nanofluids. This phenomenon might be caused by nanoparticles’ difficulty in performing Brownian motion in oils rather than fluids like water and ethylene-glycol according to Table 6.
The TiO2 nanoparticles are more likely to be dispersed in liquids like water and ethylene glycol because of the common polarized properties of the particles and the liquids. This strong dispersion within these types of fluids does not create aggregates. Since there is no agglomeration of particles, individual nanoparticles move freely and randomly within these liquids (Brownian motion) more so than they do in oils. This phenomenon causes more collisions with the liquid molecules. This behavior of the particles helps the migration of nanoparticles from warmer to colder regions and makes for more effective heat transfer within the fluid.

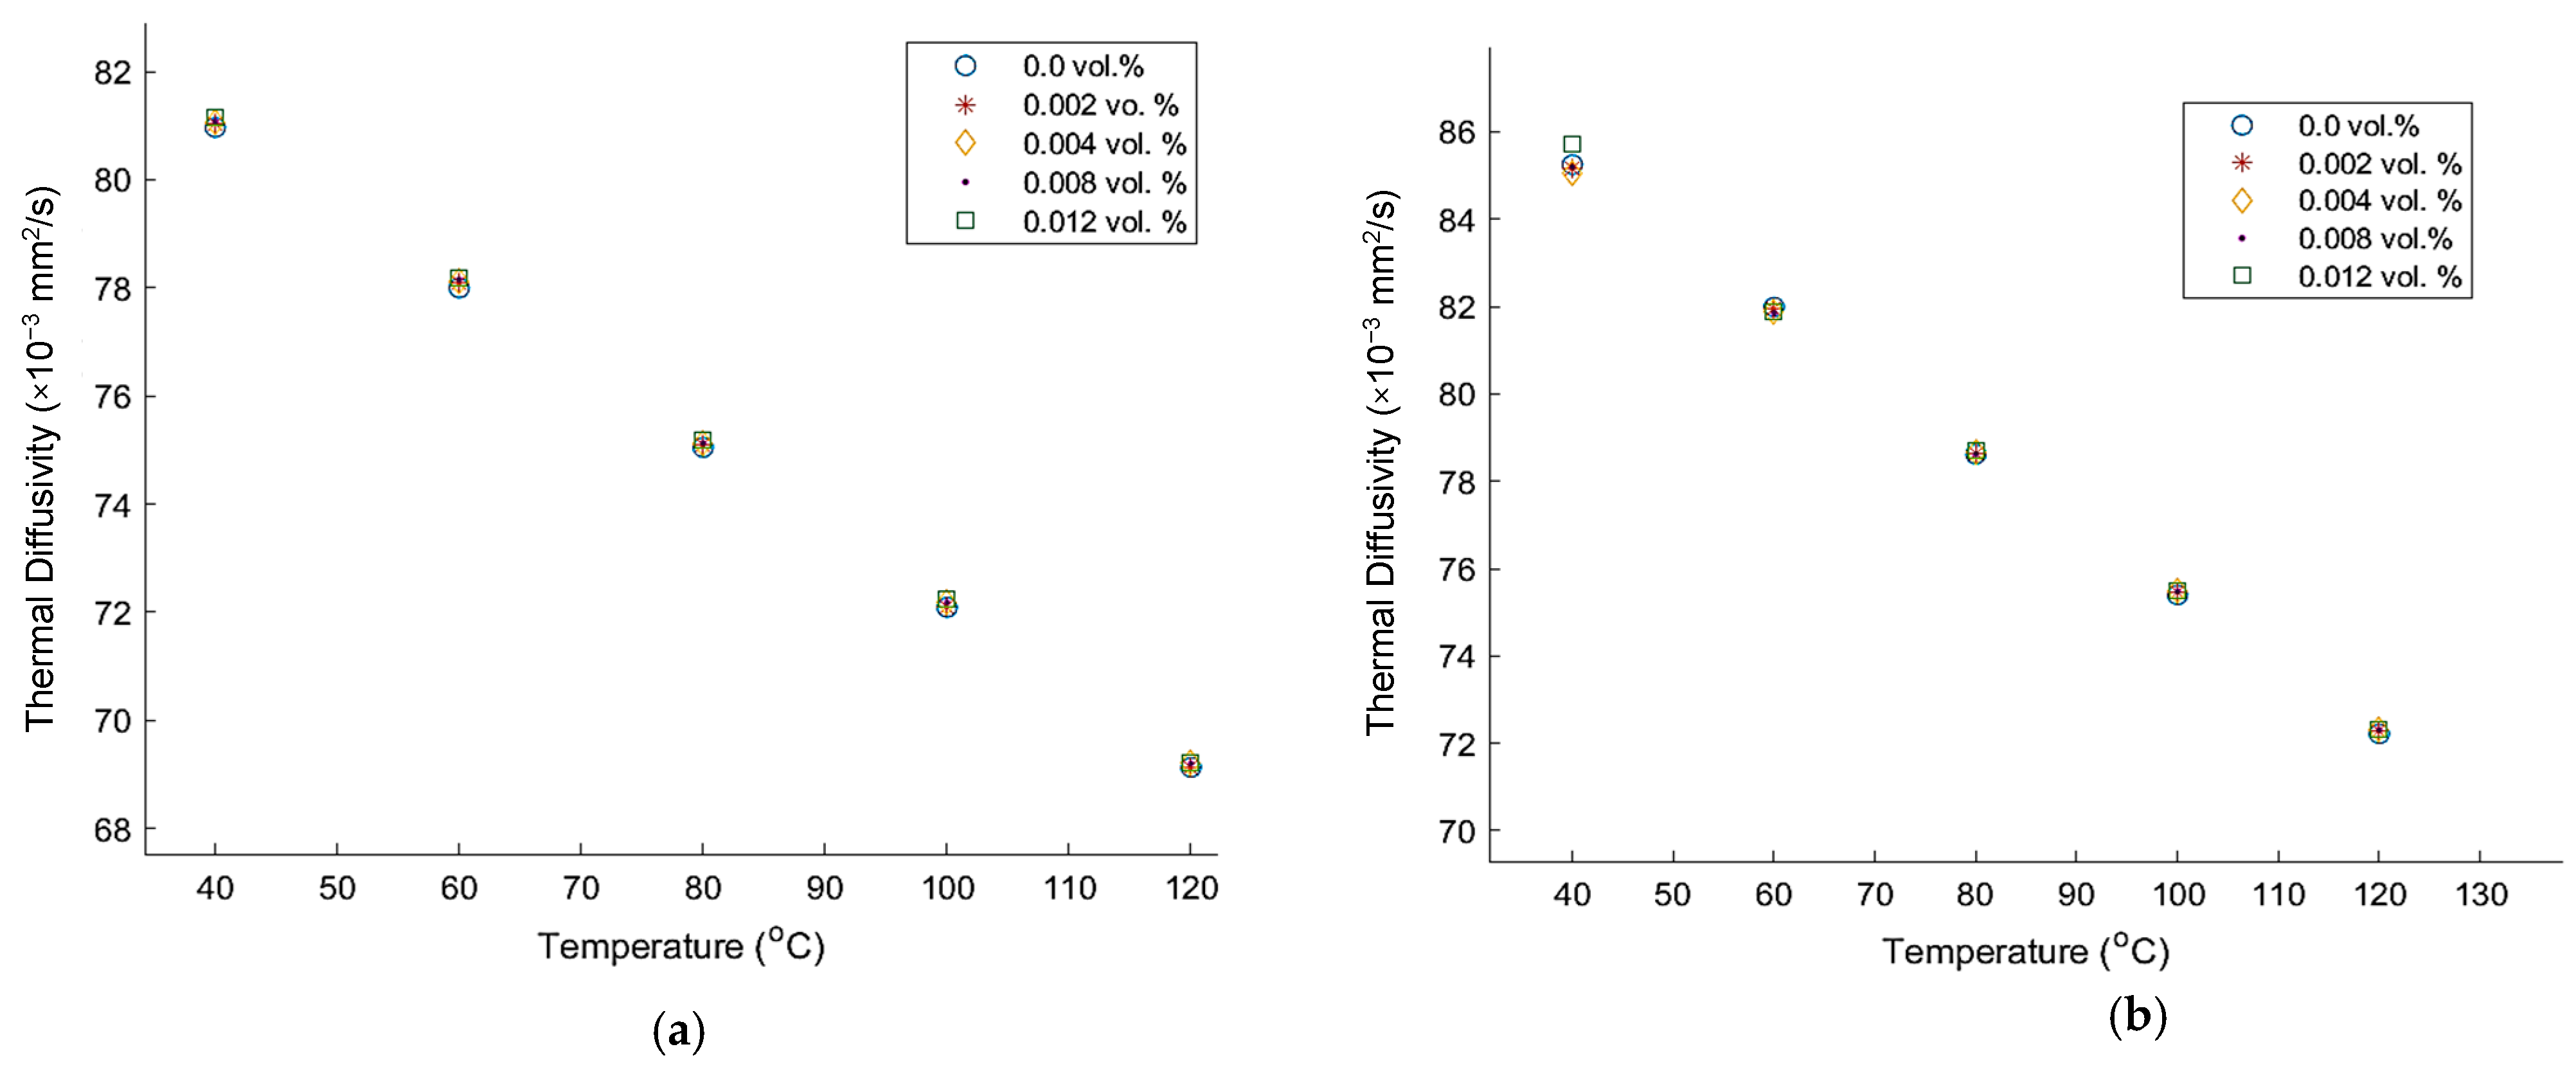
3.6. Effect of Temperature and Volume Fraction on Thermal Diffusivity

According to Figure 8, it can be identified that the dispersed nanoparticles have no significant impact on both base oils. This may be partly due to the slight variation in thermal conductivity since the specific heat capacity has a negligible variation due to there being no phase change in the material. However, it can be identified that the thermal diffusivity of coconut oil is slightly higher than that of transformer oil, which again confirms that coconut oil can be identified as a potential candidate for industrial cooling applications. Also, the thermal diffusivity of both oil types decreases with temperature.

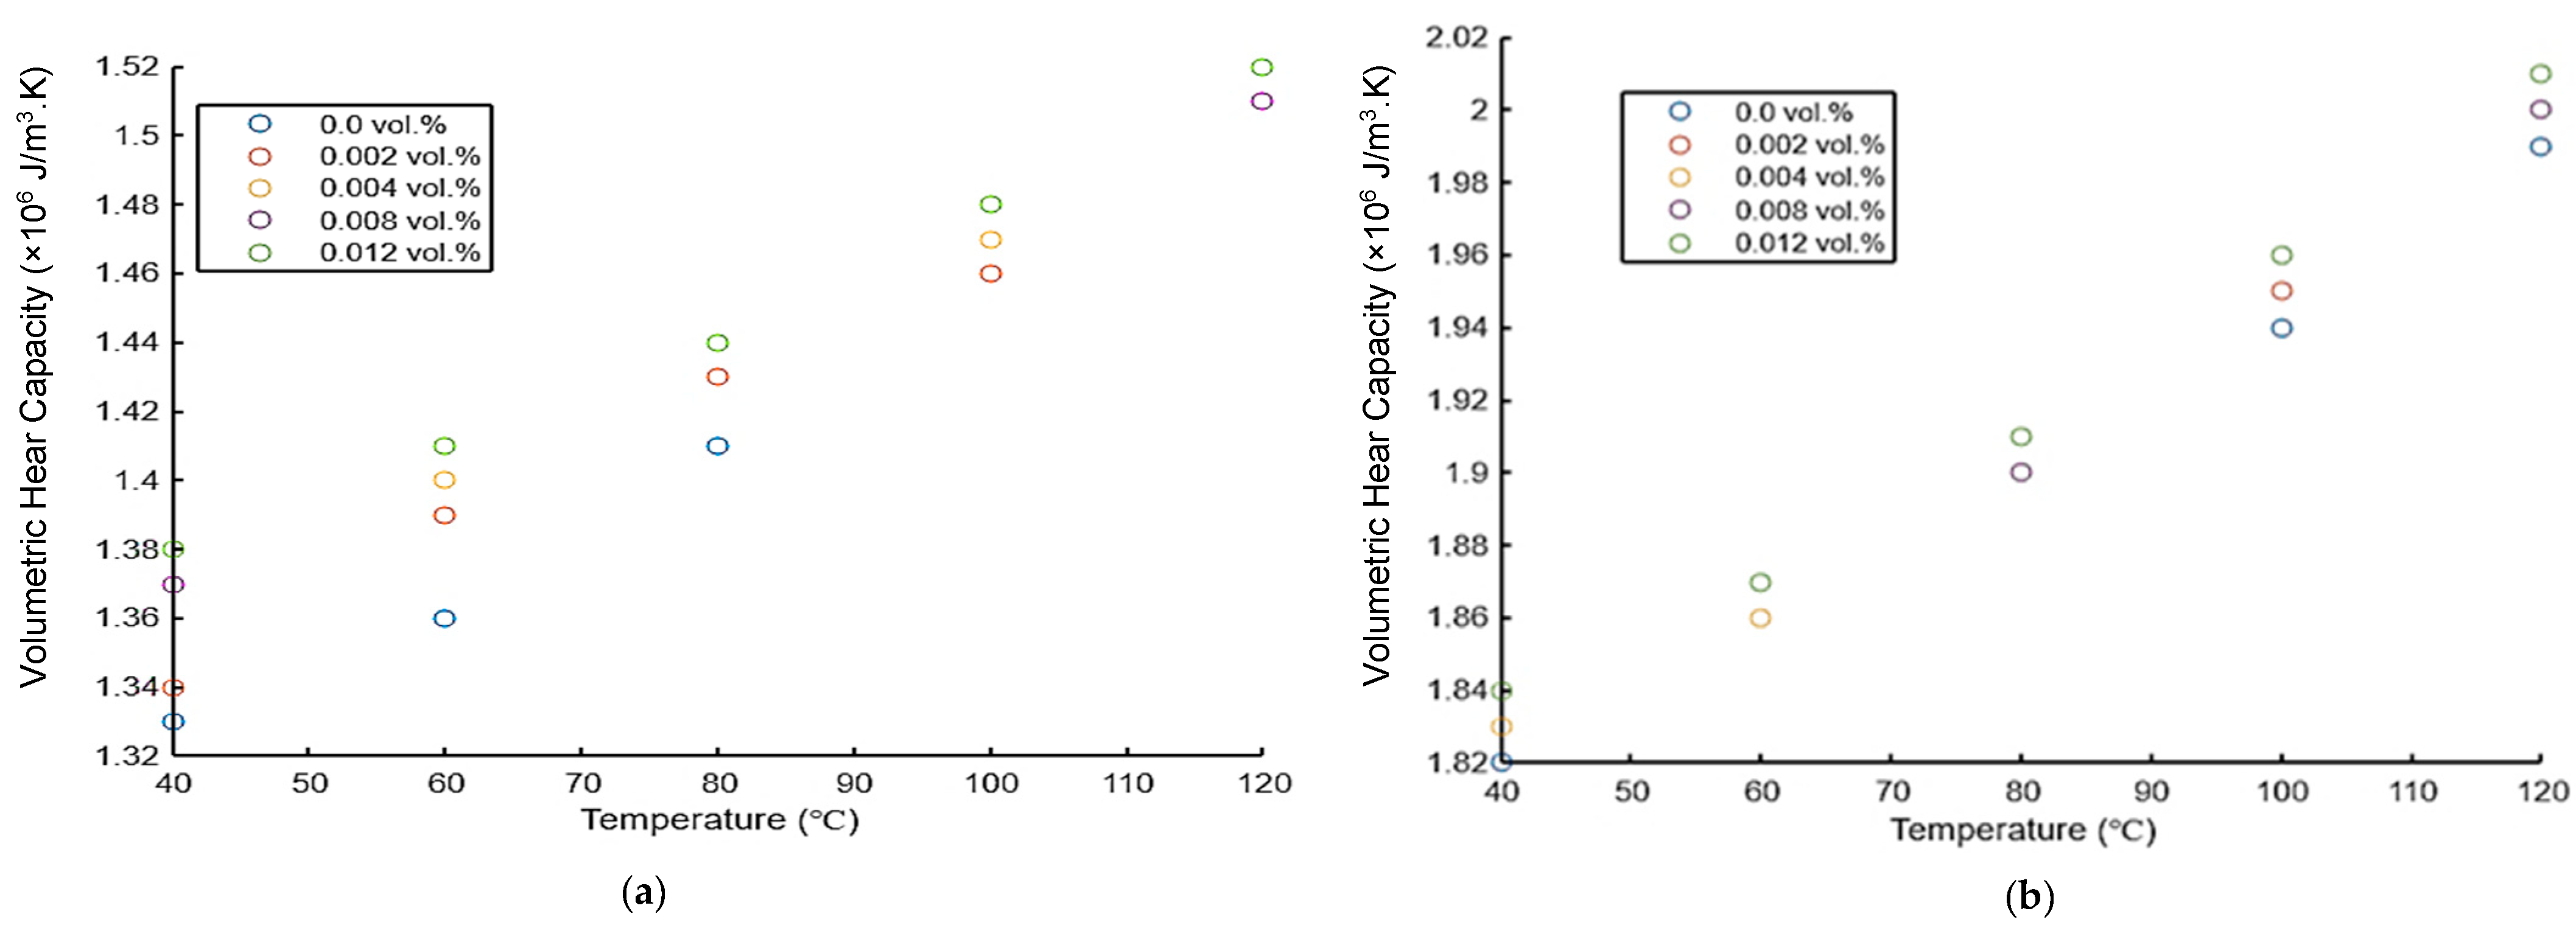
3.7. Effect of Temperature and Volume Fraction on Volumetric Heat Capacity

The volumetric heat capacity of a nanofluid can be identified as follows:
Volumetric   Heat   Capacity = ρ n f c n f = ϕ n p ρ n p c n p + ϕ b f ρ b f c b f
Here, ϕ is the volume ratio of nanoparticles and the base fluid, ρ is the density, c is the specific heat capacity, and a substance’s specific volumetric heat capacity is given by ρc.
Volumetric heat capacity is the amount of heat required to change the temperature of a unit volume of the substance by one Kelvin, and ρ is the density or mass per unit volume. Volumetric heat capacity also describes the ability of a unit volume of a substance to store internal energy while undergoing a given temperature change but without a phase change of the material. Comparing the two base fluids implies the advantage of using coconut oil according to Figure 9. However, the data for volumetric heat capacity are calculated according to Equation (4).

4. Conclusions

In this study, two nanofluids, TiO2/transformer oil and TiO2/coconut oil, were prepared following the methods described to observe the behavior of thermal properties with temperature. The following conclusions can be made based on the observations of each analysis conducted.
  • Observation of thermal conductivity at different temperatures of TiO2/transformer oil and TiO2/coconut oil nanofluids for different volume fractions.
The thermal conductivity of the nanofluid decreased with the temperature and increased with the volume fraction of TiO2 nanoparticles in both TiO2/transformer oil and TiO2/coconut oil nanofluids. The highest thermal conductivity enhancements at 0.012 vol.% at 40 °C were 4.2% and 1.4% for transformer and coconut oil, respectively. Better thermal conductivity was observed in the TiO2/coconut oil nanofluid throughout the 40–120 °C temperature range. However, the contribution of TiO2 to increasing thermal conductivity is less in coconut oil than in transformer oil.
b.
Observation of thermal diffusivity at different temperatures of TiO2/transformer oil and TiO2/coconut oil nanofluids for different volume fractions
The thermal diffusivity of both nanofluids decreased with the temperature increase. However, there was no significant impact on thermal diffusivity by volume fractions of TiO2 nanoparticles in both TiO2/transformer oil and TiO2/coconut oil nanofluids throughout the temperature range of 40–120 °C.
c.
Observation of volumetric heat capacity at different temperatures of TiO2/transformer oil and TiO2/coconut oil nanofluids for different volume fractions.
The volumetric heat capacity of both the nanofluids was increased with the temperature increase. Comparatively higher volumetric heat capacity values were observed in TiO2/coconut oil throughout the 40–120 °C temperature range.
d.
Comparison of practical results obtained with the theoretical models for thermal conductivity enhancement.
The theoretical values of the thermal conductivity of TiO2/transformer oil and TiO2/coconut nanofluid were close to the practical values, with less than a 5% difference for each measurement. The TiO2/coconut oil nanofluid’s practical results were very similar to the theoretical results of the Maxwell–Garnett model. Considering the percentage difference between experimental and theoretical model values of thermal conductivity, the Maxwell–Garnett model generates much more accurate predictions than other theoretical models.
e.
Stability of the nanofluid samples.
It can be observed that both types of nanofluids show higher stability at the lower concentrations. This is an important observation since even though higher concentrations enhance the thermal properties of the fluid samples, researchers have to maintain the nanoparticle concentration at some level to avoid nanoparticle agglomeration. Due to this behavior, even though higher-concentrated nanofluid samples exhibit higher thermal properties, their thermal properties will deteriorate with time.
Regarding the base oil properties, coconut oil exhibits superior thermal properties compared to transformer oil. However, the addition of nanoparticles enhances the thermal properties of transformer oil rather than coconut oil.
The findings of this study provide a significant dataset for future experiments on nanofluids, which can be highly applicable in designing heat transfer and electrical insulation systems for various industrial applications.

Author Contributions

Conceptualization, A.I., C.G., V.V. and K.R.K.; methodology, A.I., C.G., V.V. and K.R.K.; validation., C.G. and V.V.; formal analysis, V.V. and K.R.K.; investigation, A.I.; resources, K.R.K.; data curation, A.I., C.G. and V.V.; writing—original draft preparation, A.I., C.G. and V.V.; writing—review and editing, A.I., V.V. and K.R.K.; visualization, A.I. and C.G.; supervision, K.R.K.; project administration, K.R.K.; funding acquisition, K.R.K. All authors have read and agreed to the published version of the manuscript.

Funding

This research was supported by the Science and Technology Human Resource Development Project, Ministry of Education, Sri Lanka, funded by the Asian Development Bank (Grant No CRG-R2-SB-1).

Data Availability Statement

Not applicable.

Acknowledgments

The authors gratefully acknowledge the support provided by the Research Grant: Competitive Research Grant Round 2, Science and Technology Human Resource Development Project (STHRDP) (Grant No CRG-R2-SB-1)).

Conflicts of Interest

The authors declare no conflict of interest.

References

  1. Stephan, U.S.; Eastman, J.A. Enhancing Thermal Conductivity of Fluids with Nanoparticles; Argonne National Lab. (ANL): Argonne, IL, USA, 1995.
  2. Choi, S.U.S. Nanofluids: A New Field of Scientific Research and Innovative Applications. Heat Transf. Eng. 2008, 29, 429–431. [Google Scholar] [CrossRef]
  3. Yu, W.; Xie, H. A Review on Nanofluids: Preparation, Stability Mechanisms, and Applications. J. Nanomater. 2012, 2012, 435873. [Google Scholar] [CrossRef]
  4. Eggers, J.R.; Kabelac, S. Nanofluids Revisited. Appl. Therm. Eng. 2016, 106, 1114–1126. [Google Scholar] [CrossRef]
  5. Rafiq, M.; Lv, Y.; Li, C. A Review on Properties, Opportunities, and Challenges of Transformer Oil-Based Nanofluids. J. Nanomater. 2016, 2016, 8371560. [Google Scholar] [CrossRef]
  6. Shah, T.R.; Ali, H.M. Applications of Hybrid Nanofluids in Solar Energy, Practical Limitations and Challenges: A Critical Review. Sol. Energy 2019, 183, 173–203. [Google Scholar] [CrossRef]
  7. Rafiq, M.; Shafique, M.; Azam, A.; Ateeq, M. Transformer Oil-Based Nanofluid: The Application of Nanomaterials on Thermal, Electrical and Physicochemical Properties of Liquid Insulation—A Review. Ain Shams Eng. J. 2021, 12, 555–576. [Google Scholar] [CrossRef]
  8. Wong, K.V.; De Leon, O. Applications of Nanofluids: Current and Future. Adv. Mech. Eng. 2010, 2010, 519659. [Google Scholar] [CrossRef]
  9. Murshed, S.M.S. Simultaneous Measurement of Thermal Conductivity, Thermal Diffusivity, and Specific Heat of Nanofluids. Heat Transf. Eng. 2012, 33, 722–731. [Google Scholar] [CrossRef]
  10. Tahmasebi Sulgani, M.; Karimipour, A. Improve the Thermal Conductivity of 10w40-Engine Oil at Various Temperature by Addition of Al2O3/Fe2O3 Nanoparticles. J. Mol. Liq. 2019, 283, 660–666. [Google Scholar] [CrossRef]
  11. Okonkwo, E.C.; Wole-Osho, I.; Kavaz, D.; Abid, M. Comparison of Experimental and Theoretical Methods of Obtaining the Thermal Properties of Alumina/Iron Mono and Hybrid Nanofluids. J. Mol. Liq. 2019, 292, 111377. [Google Scholar] [CrossRef]
  12. Michael Joseph Stalin, P.; Arjunan, T.V.; Matheswaran, M.M.; Manoj Kumar, P.; Sadanandam, N. Investigations on Thermal Properties of CeO2/Water Nanofluids for Heat Transfer Applications. Mater. Today Proc. 2021, 47, 6815–6820. [Google Scholar] [CrossRef]
  13. Sunil, J.; Vignesh, J.; Vettumperumal, R.; Maheswaran, R.; Raja, R.A.A. The Thermal Properties of CaO-Nanofluids. Vacuum 2019, 161, 383–388. [Google Scholar] [CrossRef]
  14. Yao, W.; Huang, Z.; Li, J.; Wu, L.; Xiang, C. Enhanced Electrical Insulation and Heat Transfer Performance of Vegetable Oil Based Nanofluids. J. Nanomater. 2018, 2018, 4504208. [Google Scholar] [CrossRef]
  15. Nadolny, Z.; Dombek, G. Electro-Insulating Nanofluids Based on Synthetic Ester and TiO2 or C60 Nanoparticles in Power Transformer. Energies 2018, 11, 1953. [Google Scholar] [CrossRef]
  16. Elsaid, K.; Abdelkareem, M.A.; Maghrabie, H.M.; Sayed, E.T.; Wilberforce, T.; Baroutaji, A.; Olabi, A.G. Thermophysical Properties of Graphene-Based Nanofluids. Int. J. Thermofluids 2021, 10, 100073. [Google Scholar] [CrossRef]
  17. Almeida, C.; Paul, S.; Asirvatham, L.G.; Manova, S.; Nimmagadda, R.; Bose, J.R.; Wongwises, S. Experimental Studies on Thermophysical and Electrical Properties of Graphene-Transformer Oil Nanofluid. Fluids 2020, 5, 172. [Google Scholar] [CrossRef]
  18. Bhunia, M.M.; Panigrahi, K.; Das, S.; Chattopadhyay, K.K.; Chattopadhyay, P. Amorphous Graphene—Transformer Oil Nanofluids with Superior Thermal and Insulating Properties. Carbon 2018, 139, 1010–1019. [Google Scholar] [CrossRef]
  19. Zhang, H.; Wang, S.; Lin, Y.; Feng, M.; Wu, Q. Stability, Thermal Conductivity, and Rheological Properties of Controlled Reduced Graphene Oxide Dispersed Nanofluids. Appl. Therm. Eng. 2017, 119, 132–139. [Google Scholar] [CrossRef]
  20. Amiri, A.; Shanbedi, M.; Ahmadi, G.; Rozali, S. Transformer Oils-Based Graphene Quantum Dots Nanofluid as a New Generation of Highly Conductive and Stable Coolant. Int. Commun. Heat Mass Transf. 2017, 83, 40–47. [Google Scholar] [CrossRef]
  21. Maxwell, J.C. A Treatise on Electricity and Magnetism I–II; Clarendon: Oxford, UK, 1881. [Google Scholar]
  22. Zhou, Y.; Sui, S.Y.; Li, J.; Wang, Z.Y.; Cui, W.; Lv, Y.Z.; Li, C.R. Statistical Analysis of Moisture’s Effect on AC Breakdown Strength of TiO2 Nanofluids. J. Mol. Liq. 2018, 249, 420–428. [Google Scholar] [CrossRef]
  23. Bhunia, M.M.; Panigrahi, K.; Naskar, C.B.; Bhattacharjee, S.; Chattopadhyay, K.K.; Chattopadhyay, P. 2D Square Nanosheets of Anatase TiO2: A Surfactant Free Nanofiller for Transformer Oil Nanofluids. J. Mol. Liq. 2021, 325, 115000. [Google Scholar] [CrossRef]
  24. Neha Deepak, S.; Nathi Ram, C. Physio-Chemical Study of Traditional Lubricant SAE 20 W40 and Virgin Coconut Oil Using TiO2 nano-Additives. Mater. Today Proc. 2021, 42, 1024–1029. [Google Scholar] [CrossRef]
  25. Nor, S.F.M.; Azis, N.; Jasni, J.; Ab Kadir, M.Z.A.; Yunus, R.; Yaakub, Z. Investigation on the Electrical Properties of Palm Oil and Coconut Oil Based TiO2 Nanofluids. IEEE Trans. Dielectr. Electr. Insul. 2017, 24, 3432–3442. [Google Scholar] [CrossRef]
  26. Pak, B.C.; Cho, Y.I. Choi Hydraulic and Heat Transfer Study of Dispersed Fluids with Submicron Metallic Oxide Particles. Exp. Heat Transf. 1998, 11, 151–170. [Google Scholar] [CrossRef]
  27. Nazari, M.; Rasoulifard, M.H.; Hosseini, H. Dielectric Breakdown Strength of Magnetic Nanofluid Based on Insulation Oil after Impulse Test. J. Magn. Magn. Mater. 2016, 399, 1–4. [Google Scholar] [CrossRef]
  28. NYNAS AB Nytro Libra (IEC 60296, Ed. 5)—Standard Grade. Available online: https://www.nyas.com/en/products/transformer-oils/products/nytro-libra (accessed on 10 September 2023).
  29. Marina, A.M.; Che Man, Y.B.; Nazimah, S.A.H.; Amin, I. Chemical Properties of Virgin Coconut Oil. JAOCS J. Am. Oil Chem. Soc. 2009, 86, 301–307. [Google Scholar] [CrossRef]
  30. Mansor, T.S.T.; Man, C.; Afiq, A.; Nurul, K. Physicochemical Properties of Virgin Coconut Oil Extracted from Different Processing Methods. Int. Food Res. J. 2012, 19, 837–845. [Google Scholar] [CrossRef]
  31. ASTM D7896-19; Standard Test Method for Thermal Conductivity, Thermal Diffusivity, and Volumetric Heat Capacity of Engine Coolants and Related Fluids by Transient Hot Wire Liquid Thermal Conductivity Method. ASTM: West Conshohocken, PA, USA, 2019.
  32. Turgut, A.; Tavman, I.; Tavman, S. Measurement of Thermal Conductivity of Edible Oils Using Transient Hot Wire Method. Int. J. Food Prop. 2009, 12, 741–747. [Google Scholar] [CrossRef]
  33. Krishnakumar, T.S.; Sheeba, A.; Mahesh, V.; Jose Prakash, M. Heat Transfer Studies on Ethylene Glycol/Water Nanofluid Containing TiO2 Nanoparticles. Int. J. Refrig. 2019, 102, 55–61. [Google Scholar] [CrossRef]
  34. Ahmed, S.A.; Ozkaymak, M.; Sözen, A.; Menlik, T.; Fahed, A. Improving Car Radiator Performance by Using TiO2-Water Nanofluid. Eng. Sci. Technol. Int. J. 2018, 21, 996–1005. [Google Scholar] [CrossRef]
  35. Wei, B.; Zou, C.; Li, X. Experimental Investigation on Stability and Thermal Conductivity of Diathermic Oil Based TiO2 Nanofluids. Int. J. Heat Mass Transf. 2017, 104, 537–543. [Google Scholar] [CrossRef]
  36. Prasanth, R.T.A.R.; Mahato, S.N.; Roy, N.K. Dielectric and Thermal Conductivity Studies on Synthetic Ester Oil Based TiO2 Nanofluids. In Proceedings of the 3rd International Conference on Condition Assesment Techniques in Electrical Systems, Rupnagar, India, 16–18 November 2017; pp. 289–292. [Google Scholar] [CrossRef]
  37. Sukkar, K.A.; Karamalluh, A.A.; Jaber, T.N. Rheological and Thermal Properties of Lubricating Oil Enhanced by the Effect of CuO and TiO2 Nano-Additives. Al-Khwarizmi Eng. J. 2019, 15, 24–33. [Google Scholar] [CrossRef]
  38. Khedkar, R.S.; Shrivastava, N.; Sonawane, S.S.; Wasewar, K.L. Experimental Investigations and Theoretical Determination of Thermal Conductivity and Viscosity of TiO2-Ethylene Glycol Nanofluid. Int. Commun. Heat Mass Transf. 2016, 73, 54–61. [Google Scholar] [CrossRef]
  39. Abdolbaqi, M.K.; Sidik, N.A.C.; Aziz, A.; Mamat, R.; Azmi, W.H.; Yazid, M.N.A.W.M.; Najafi, G. An Experimental Determination of Thermal Conductivity and Viscosity of BioGlycol/Water Based TiO2 Nanofluids. Int. Commun. Heat Mass Transf. 2016, 77, 22–32. [Google Scholar] [CrossRef]
  40. Hamid, A.; Azmi, W.H.; Mamat, R.; Usri, N.A. Thermal Conductivity Enhancement of TiO2 Nanofluid in Water and Ethylene Glycol (EG) Mixture. Indian J. Pure Appl. Phys. 2016, 54, 651–655. [Google Scholar]
Figure 1. SEM image of TiO2 nanoparticles.
Energies 17 00049 g001
Figure 2. (a) TiO2 nanoparticles; (b) transformer oil and coconut oil.
Energies 17 00049 g002
Figure 3. Two-step method of nanofluid preparation.
Energies 17 00049 g003
Figure 4. LAMBDA Multifunctional Thermal Conductivity Meter.
Energies 17 00049 g004
Figure 5. Visual inspection of nanofluid samples with the time of observation: (a) 0.002 vol.%, 0.004 vol.%, 0.008 vol.%, 0.012 vol.% (top to bottom), showing TiO2/transformer oil nanofluid from day 01 to day 05; (b) 0.002 vol.%, 0.004 vol.%, 0.008 vol.%, 0.012 vol.% (top to bottom) , showing TiO2/coconut oil nanofluid from day 01 to day 05.
Energies 17 00049 g005
Figure 6. Thermal conductivity vs. temperature at different temperatures for (a) nanofluid/transformer oil and (b) nanofluid/coconut oil.
Energies 17 00049 g006
Figure 7. Thermal conductivity vs. volume fraction at different temperatures for (a) nanofluid/transformer oil and (b) nanofluid/coconut oil.
Energies 17 00049 g007
Figure 8. Thermal diffusivity vs. temperature at different volume fractions of (a) nanofluid/transformer oil and (b) nanofluid/coconut oil.
Energies 17 00049 g008
Figure 9. Volumetric heat capacity vs. temperature at different volume fractions of (a) nanofluid/transformer oil and (b) nanofluid/coconut oil.
Energies 17 00049 g009
Table 1. Properties and characteristics of nanoparticles.
Nanoparticle TypeTiO2 Anatase
Purity99.5%
ColorWhite powder
Particle size3–5 nm
BET value150–200 m2/g
Density3.89 g/cm3
PhaseAnatase
Table 2. Properties and characteristics of base fluids.
Base Oil TypeTransformer OilCoconut Oil
ColorTransparentTransparent
Density843.74 kg/m3880.40 kg/m3
Thermal Conductivity at 30 °C108.12 mW/K156.21 mW/K
Table 3. Parameters of the LAMBDA Thermal Conductivity Meter.
ParameterValue
Measuring Range10 to 2000 mW/(mK)
Reproducibility±1%
Temperature Range−50 to 300 °C
Temperature Accuracy±0.1 °C
Table 4. Comparison of measured values of thermal conductivity ratios with the values predicted by different thermal conductivity ratio models for transformer oil-based nanofluids at 40 °C.
Nanoparticle Volume Fraction0.0020.0040.0080.012
Experimental Values1.0091.0291.0341.042
Maxwell Model (% diff)1.003 (0.59%)1.007 (2.14%)1.014 (1.93%)1.021 (2.01%)
Maxwell–Garnett Model
(% diff)
1.004 (0.50%)1.007 (2.14%)1.014 (1.93%)1.022 (2.01%)
Pak and Cho Model (% diff)1.015 (0.59%)1.030 (0.10%)1.060 (2.51%)1.090 (4.61%)
Table 5. Comparison of measured values of thermal conductivity ratios with the values predicted by different thermal conductivity ratio models for coconut oil-based nanofluids at 40 °C.
Nanoparticle Volume Fraction0.0020.0040.0080.012
Experimental Values1.0071.0071.0101.014
Maxwell Model (% diff)1.003 (0.40%)1.006 (0.10%)1.012 (0.20%)1.018 (0.39%)
Maxwell–Garnett Model
(% diff)
1.003 (0.40%)1.007 (0.00%)1.009 (0.01%)1.018 (0.39%)
Pak and Cho Model (% diff)1.015 (0.79%) 1.030 (2.28%)1.060 (4.85%)1.090 (7.50%)
Table 6. Thermal conductivity results of previous TiO2-based nanofluids.
Nanoparticle Volume Fraction (%)Base FluidNanoparticleConcentrationMaximum Enhancement
[35]Diathermal oilTiO2—Anatase0.2–1.0 vol.%7.1%
[15]Synthetic ester oilTiO20.82 g·L−13.2%
[36]Synthetic ester oilTiO2—Rutile0.005–0.05 vol.%8.3%
[37]SAE 15W40 engine oilTiO20.1–1.0 wt. %4.54%
[38]Ethylene glycolTiO21.0–7.0 vol.%19.52%
[39]BioGlycol:water (20:80) mixtureTiO20.5–2.0 vol.%12.6%
[40]Water:ethylene glycol (60:40) mixtureTiO20.5–1.5 vol.%15.35%
Present StudyTransformer oilTiO2—Anatase0.002–0.012 vol.%4.2%
Coconut oilTiO2—Anatase0.002–0.012 vol.%1.4%
Disclaimer/Publisher’s Note: The statements, opinions and data contained in all publications are solely those of the individual author(s) and contributor(s) and not of MDPI and/or the editor(s). MDPI and/or the editor(s) disclaim responsibility for any injury to people or property resulting from any ideas, methods, instructions or products referred to in the content.

