Article

Exploring the Effects of Voltage Variation and Load on the Electrical and Thermal Performance of Permanent-Magnet Synchronous Motors

by
Jonathan Muñoz Tabora
1,2,*,
Lauro Correa dos Santos Júnior
1,
Edson Ortiz de Matos
1,
Thiago Mota Soares
1,
Allan Rodrigo Arrifano Manito
1,
Maria Emília de Lima Tostes
1 and
Ubiratan Holanda Bezerra
1
1
Amazon Energy Efficiency Center (CEAMAZON), Federal University of Pará, Belém 66075-110, Brazil
2
Electrical Engineering Department, National Autonomous University of Honduras (UNAH), Tegucigalpa 04001, Honduras
*
Author to whom correspondence should be addressed.
Energies 2024, 17(1), 8; https://doi.org/10.3390/en17010008
Submission received: 26 October 2023 / Revised: 28 November 2023 / Accepted: 4 December 2023 / Published: 19 December 2023
(This article belongs to the Section F: Electrical Engineering)

Abstract

:
Europe has initiated the transition process toward IE4 efficiency motor classes, setting an example for other regions to follow in adopting higher-efficiency motor standards. However, in some regions, the operating voltage may differ from the nominal voltage according to the IEC 60038-2009. Therefore, the performance of new technologies under conditions of voltage variations (VVs) must also be assessed. This study presents a comprehensive analysis of a 0.75 kW line-start permanent-magnet motor (LSPMM) under different VV magnitudes, including undervoltage and overvoltage, while considering different load conditions. The study incorporates technical, economic, statistical, and thermal analyses to obtain important indicators related to power consumption, efficiency, power factor, and temperature. This study provides valuable insights to specialists regarding the technical and economic impacts of voltage-magnitude variation on LSPMMs.

1. Introduction

1.1. General Considerations

The forthcoming global minimum energy performance standard (MEPS) regulations for electric motors will incorporate the IE4 efficiency class and cover a wider range of power outputs in rotating machines. To meet the efficiency requirements set by the IEC 60034-30-1 [1] for new efficiency classes, manufacturers have implemented new technologies such as permanent magnets and reluctance motors. These advancements have led to important benefits in terms of energy consumption, power factor, temperature, and noise reduction [2,3]. These benefits have allowed motors to achieve higher efficiencies, such as the IE4 class, which has become mandatory in Europe since July 2023 for motors with output powers between 75 and 200 kW [4]. Although many countries have implemented MEPS for electric motors, there are still regions where regulations on imported, manufactured, and/or commercialized electric motors do not exist. In these regions, factors such as initial cost or familiarity with well-established technologies often influence end users’ purchase decisions.
Furthermore, only a limited number of users in these regions have adopted new technologies, such as the line-start permanent-magnet motor (LSPMM). Manufacturer recommendations and the inclusion of LSPMM technologies in equipment used in industrial processes have primarily influenced these decisions. The introduction of these technologies in electric motors requires comprehensive performance evaluations under diverse operating conditions prevalent in global industries. Such evaluations aim to validate these emerging technologies as viable alternatives to the conventional squirrel-cage induction motors (SCIMs) that currently dominate the market.

1.2. Related Works

The literature on voltage-variation (VV) conditions disturbances and permanent-magnet synchronous motors is limited. Early studies assessing the effects of VV were documented in the late 1920s when the authors of [5] conducted a detailed evaluation of a 5-hp motor under VV conditions, revealing the detrimental effects of this disturbance on efficiency, power factor, and torque. The study [5] also found that core losses are directly proportional to voltage magnitude when assessing torque, efficiency, and power factor. However, Joule losses considerably increase under undervoltage conditions compared with those under overvoltage conditions, although both cases result in losses higher than those obtained under nominal conditions. Similar results regarding efficiency and losses were found in [6] using an SCIM model.
In [7], VV was analyzed based on a dynamic motor model constructed in Simulink. In this model, core losses varied with voltage magnitude and, to a lesser extent, with load variations. However, Joule losses decreased with the decreasing voltage magnitude. In [8], the efficiency in an SCIM model varied proportionally with the voltage magnitude up to values of 1.05 p.u., after which it began to decrease. Other studies analyzing this disturbance, including temperature assessment, have also been presented [8,9,10,11,12,13,14,15]. Furthermore, techniques for reducing losses and increasing efficiency in brushless DC (BLDC) motors have been reported in [16,17].
Electric motors play a crucial role in the global consumption matrix [18]. To minimize carbon emissions, considerable efforts have been devoted to increasing the efficiency of electric motors, with numerous studies and analyses exploring innovative technologies [19,20]. Despite the thermal evolution of magnets in recent years, different disturbances present in power electrical systems still affect the performance of LSPMMs by increasing losses and temperature [21,22]. When combined with magnitude variation, voltage imbalance intensifies its effects on electric motors in terms of efficiency and temperature. Furthermore, it even more adverselyaffects emerging technologies such as permanent-magnet synchronous motors [23,24]. These findings reveal that a voltage imbalance combined with overvoltage considerably increases power consumption, reduces the power factor, and elevates temperatures.

1.3. Motivation and Contribution

Based on a literature review of VV and LSPMMs, this study contributes considerably to the field by analyzing the impact of VV on permanent-magnet synchronous motors. The main goals and contributions of this study are as follows:
  • Technical and economic evaluation of VV impacts: A comprehensive evaluation of the effects of VV under different load conditions is conducted. This study identifies the voltage magnitudes that exert the most substantial influence on motor behavior depending on the type of application and load conditions by assessing different non-nominal voltages. This analysis provides valuable insights into decision-making processes and offers guidance to specialists in optimizing motor performance.
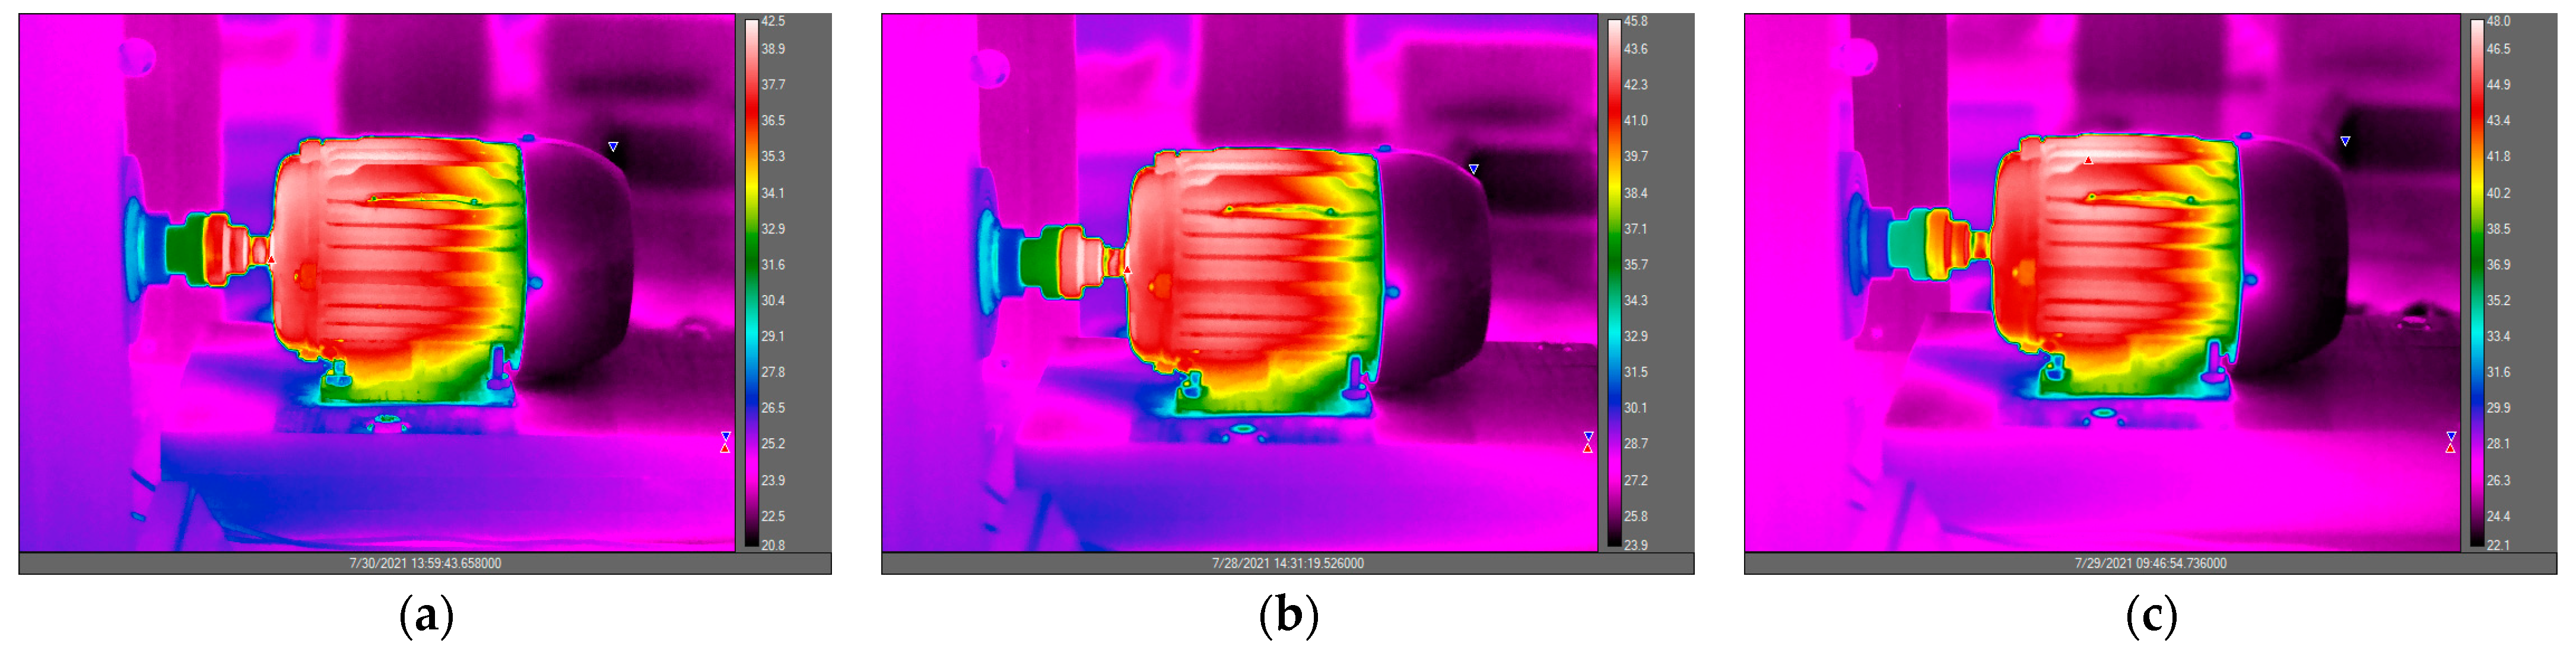
  • Investigation of thermal impacts: This study investigates the thermal consequences of VV in permanent-magnet synchronous motors. To accomplish this, thermographic images and temperature curves were used to visualize and analyze how voltage magnitudes affect the internal components of the motors.

2. Theoretical Foundation
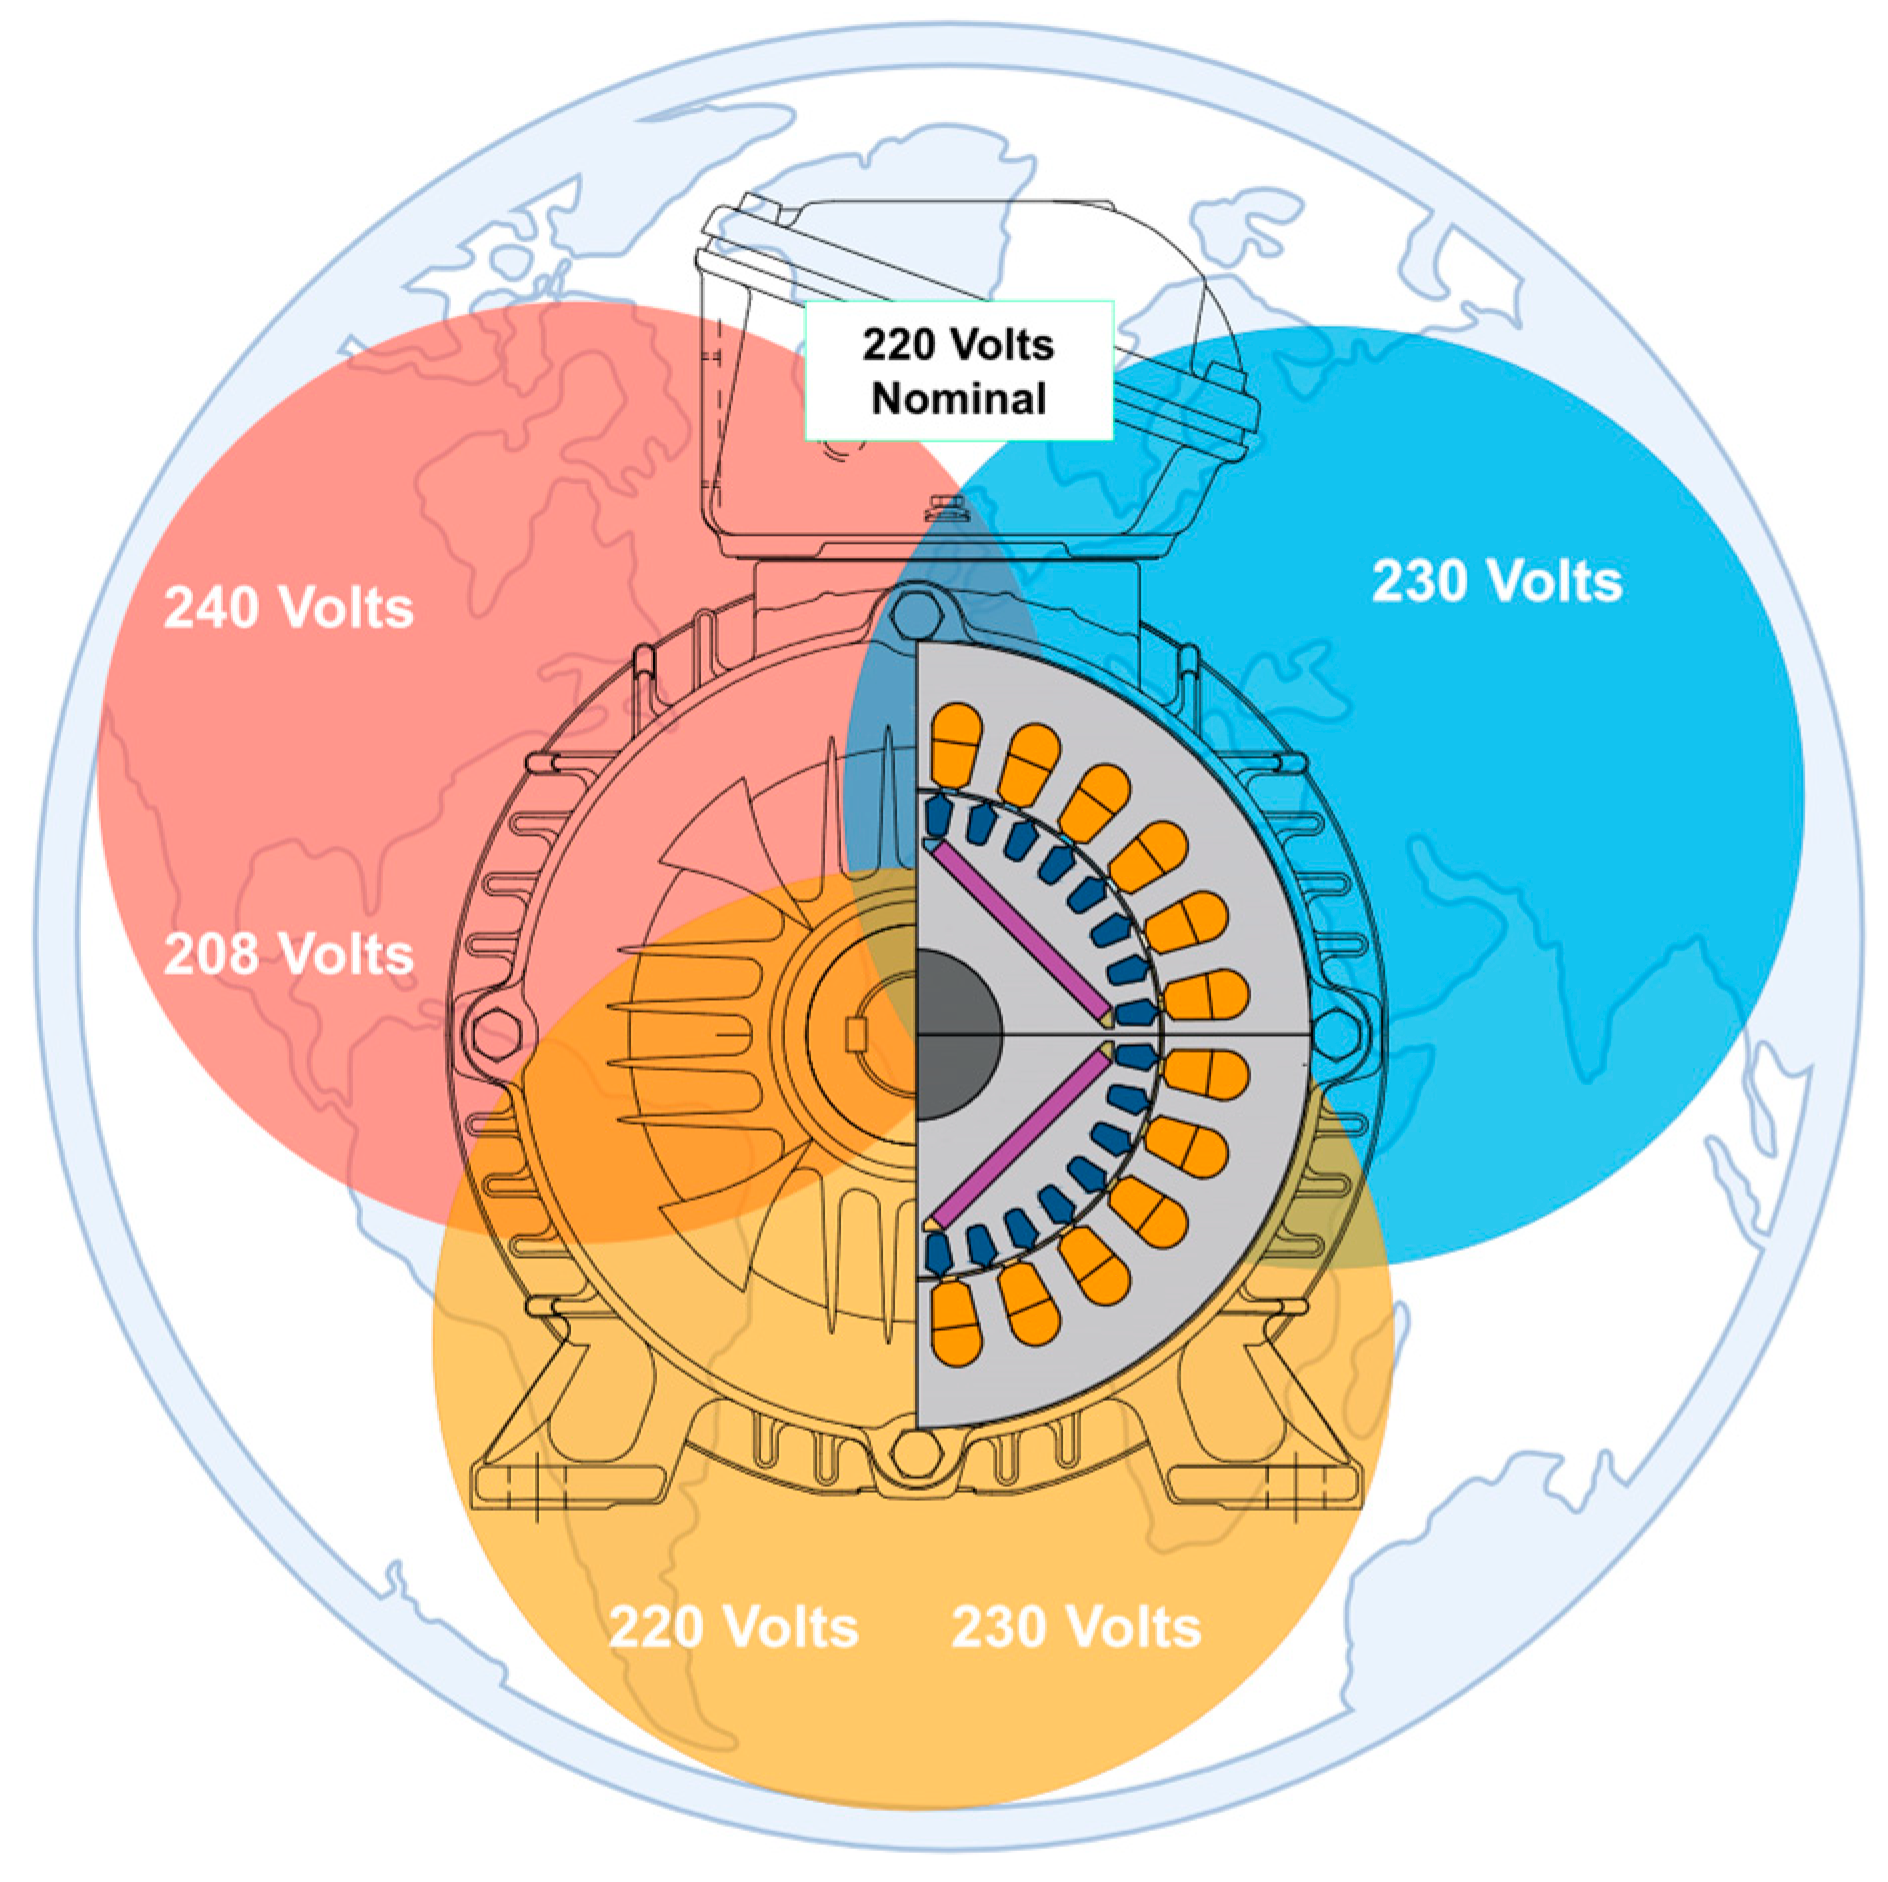
2.1. IEC 60038-2009

Table 1 of the IEC 60038-2009 standard [25] lists the voltage options for AC systems. For 60 Hz three-phase systems, more than seven voltage options, such as 208, 230, 240, 277, or 400–480 V, are available without considering the voltage drops within the consumer or the distribution system, which can further exacerbate this voltage-magnitude deviation. Internal changes in the industry, such as tap adjustments in transformers or low-load conditions in the electricity distribution system, can also cause VV. Thus, VV can be linked to the difference between the electrical system voltages in a particular country or region and the nominal manufacturing voltages of the motors (Figure 1). For example, an electric motor manufactured in Brazil with a nominal voltage of 220 V can operate in Central America at a voltage of 208 V (transformer secondary windings in Y) or 240 V (transformer secondary windings in a triangle).
Regarding electric motors, the National Electrical Manufacturers Association (NEMA MG1-2021) [26] standard stipulates that AC motors should operate successfully at a nominal load under voltage conditions of ±10% of the nominal voltage. However, the performance of the motors under these conditions will differ from that under the nominal voltage. The evaluation of the LSPMM under VV conditions, including undervoltage and overvoltage, for the analyzed 0.75 kW motor will allow the evaluation of the response of this technology to such disturbances. Furthermore, it will identify the non-nominal voltages that exert the most substantial impact on parameters of interest to end users, such as energy consumption and power factor.

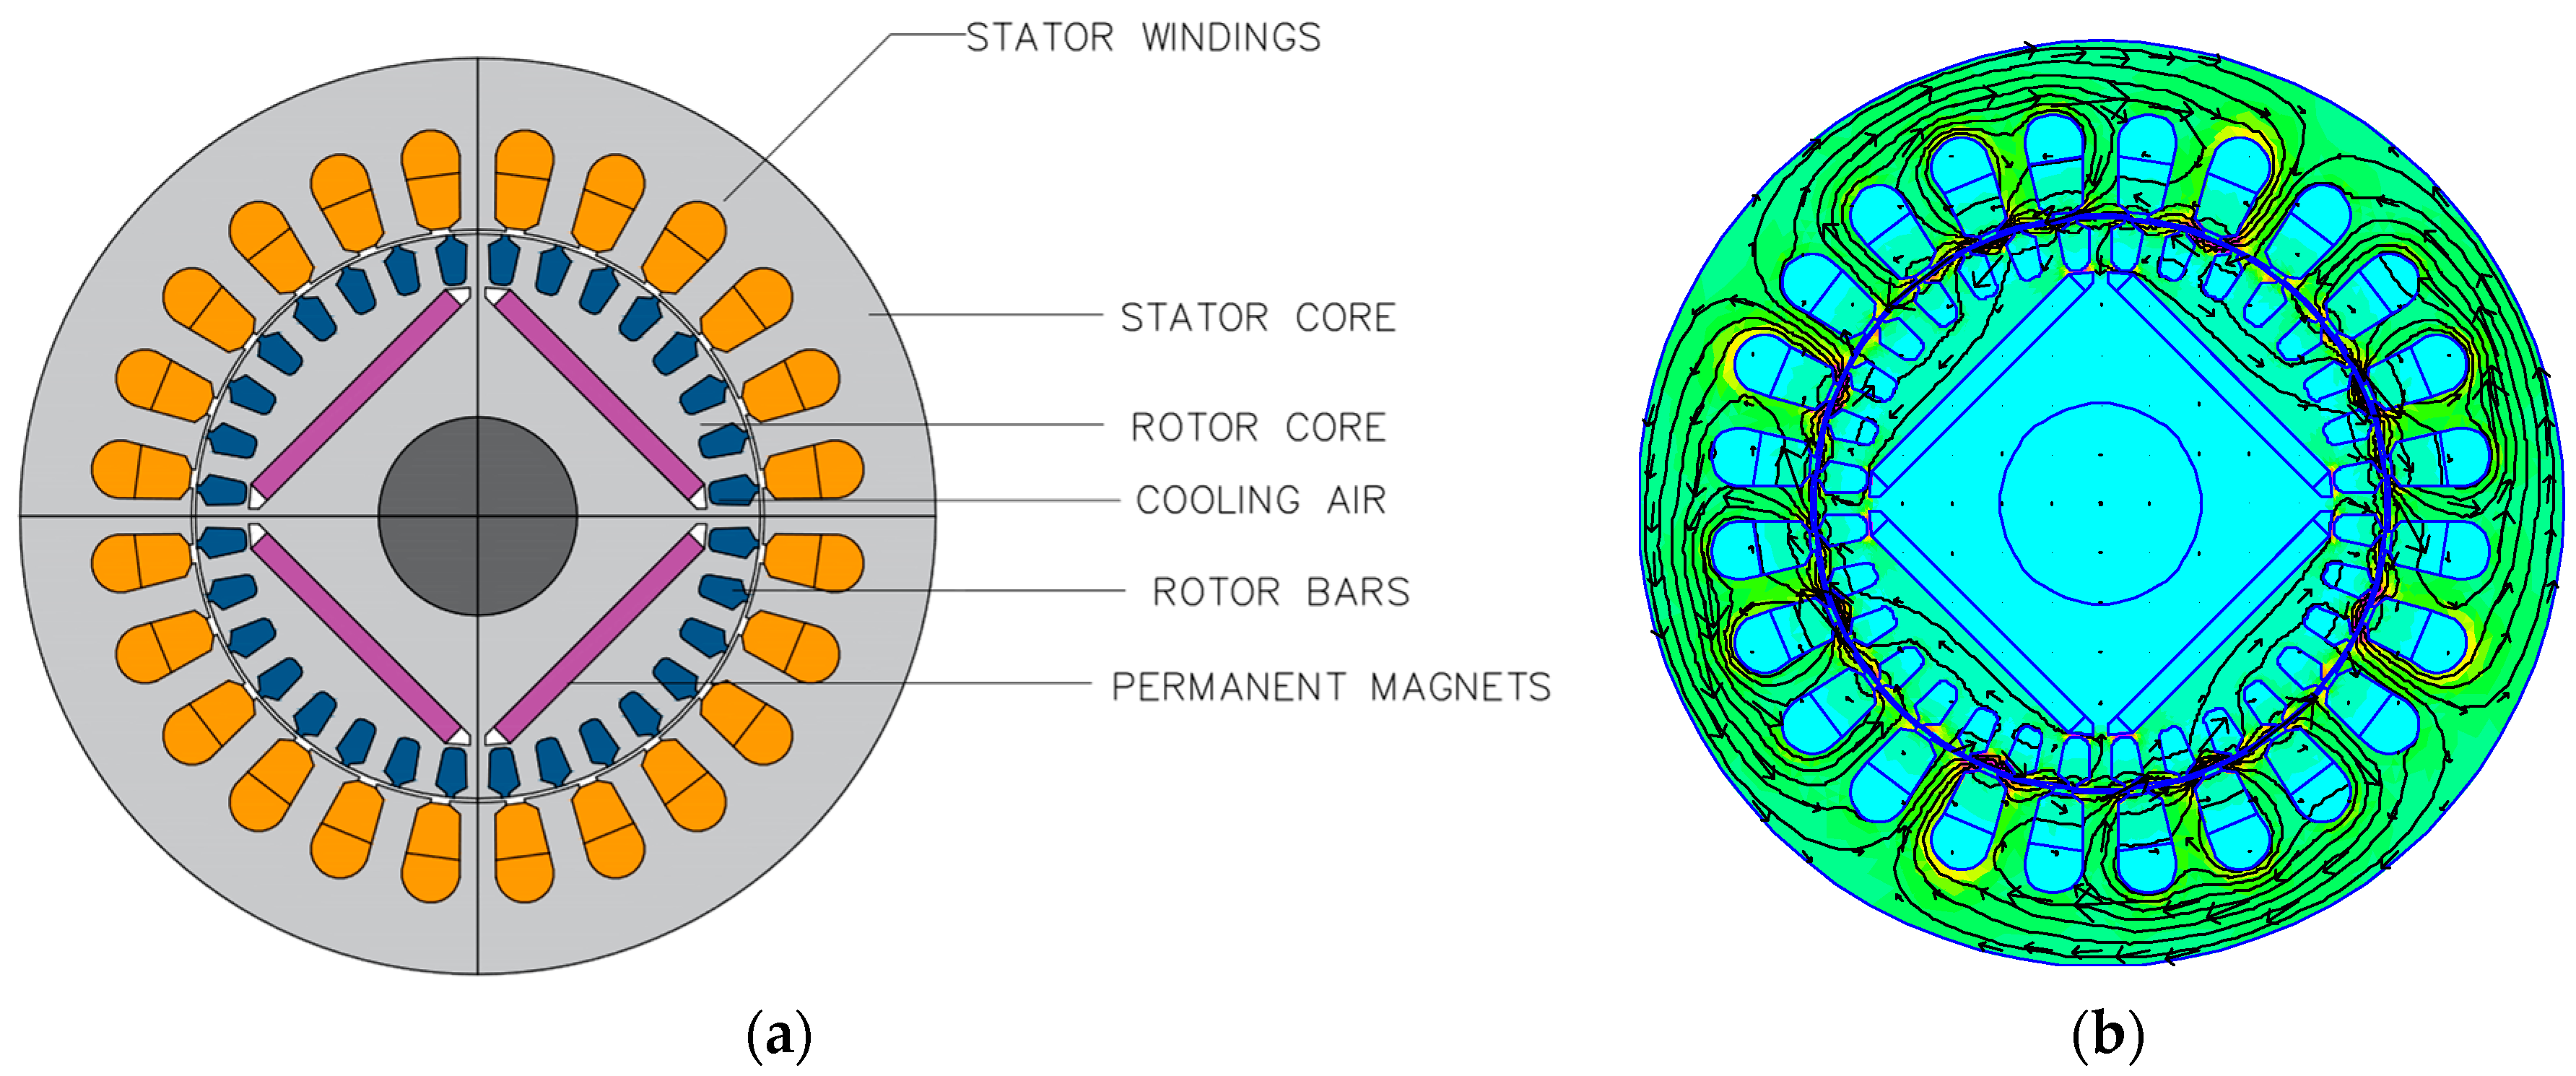
2.2. Permanent-Magnet Motors
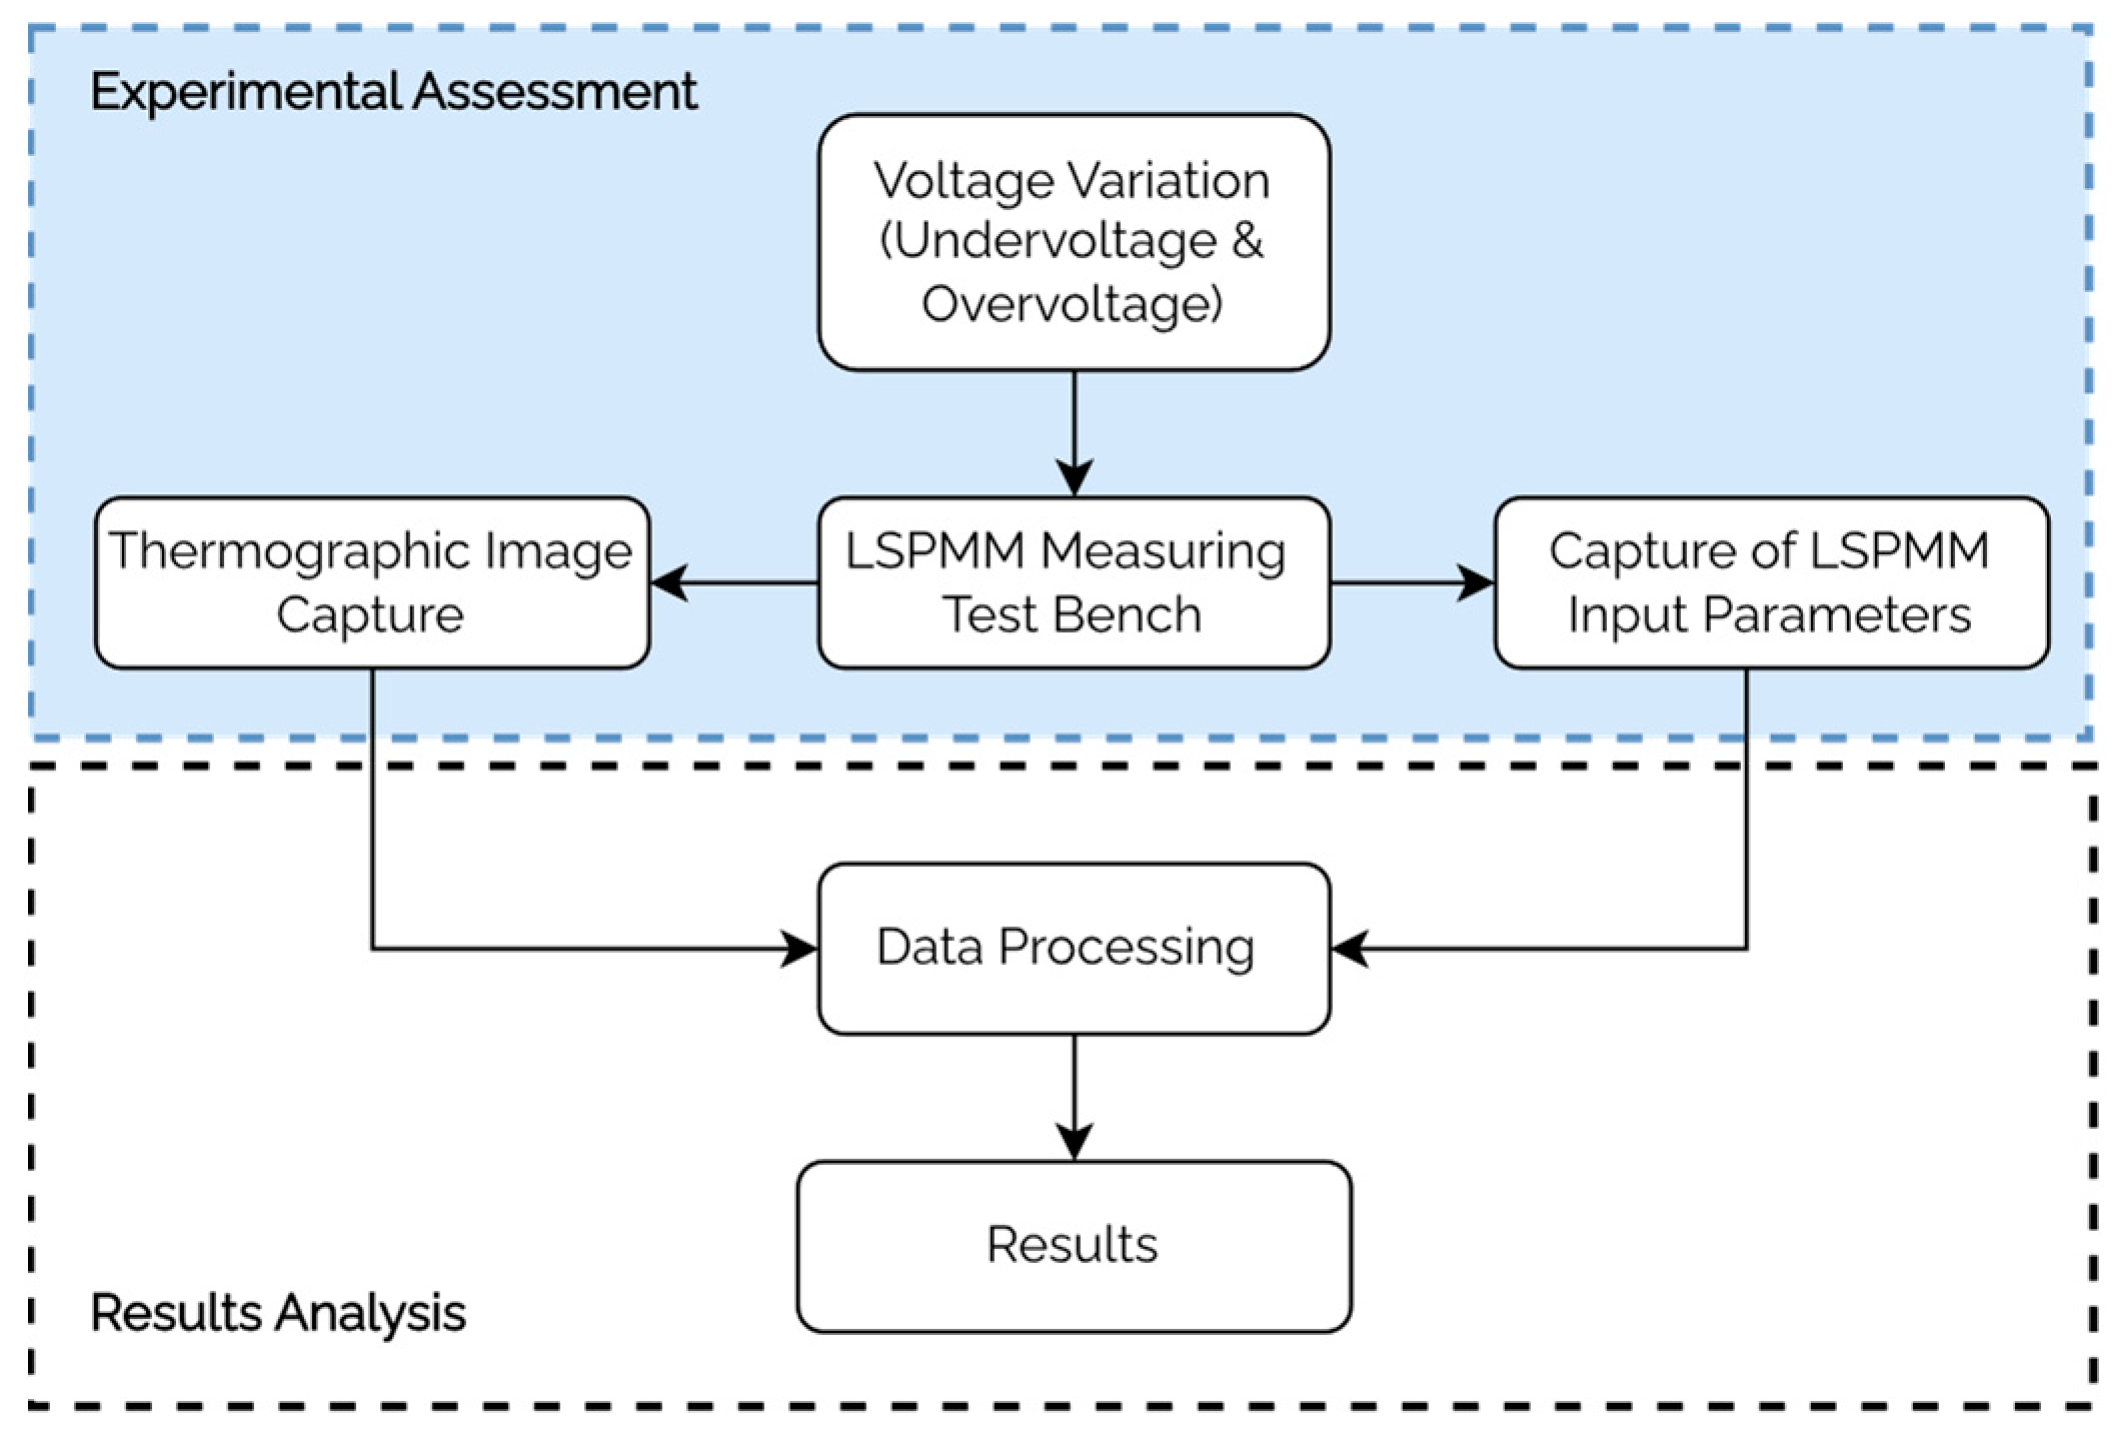
The incorporation of permanent magnets into motors represents an important advancement in the pursuit of improved efficiency. The magnetic field provided by these magnets not only reduces magnetization and total current but also allows the synchronism speed. This yields a constant speed under load and different disturbances. In addition, it leads to a notable reduction in rotor losses and consequently lowers operating temperatures, therefore contributing to the durability of the motor and its components.
Among rare-earth materials, neodymium–iron–boron (NdFeB) magnetic materials are widely used in electric motors because of their superior magnetic properties (coercivity and remanent magnetization) over those of other rare elements [27]. Figure 2 shows the magnetic flux lines in the LSPM and its internal components.
The presence of permanent magnets in the analyzed 0.75 kW IE4 Class motor (Figure 3a) results in a different current-versus-load curve compared with the SCIM (Figure 3b). The LSPMM has a squirrel cage, which provides self-starting capability and enables synchronous operation. In this state, no current flows through the rotor bars because the slip is zero, and there are no harmonic components in the airgap magnetomotive force. The LSPMM is a synchronous machine; however, because of the magnets inside the rotor, it produces magnetic fields without an external field current. Its no-load operation resembles that of a synchronous machine operating in an under-excited state. The current-versus-load curve of the LSPMM exhibits a V shape, particularly under low-load conditions; this curve demonstrates a small decrease in the case of the line current with the increasing load. From a 40% load, the current then increases with the load on the motor, as in the IE3 Class SCIM.

3. Methodology

The impacts of VV were evaluated using an experimental bench (Figure 4). The bench comprises a three-phase alternating current (AC) programmable source (1), in which different voltages applied to the LSPMM (4) were configured. The LSPMM input parameters were measured using a class “A” power-quality analyzer (2), and an electromagnetic brake (3) was used as the electric load. Table 1 presents the nominal data of the LSPMM.
Figure 5 shows the methodology used. The LSPMM was supplied with a delta connection at 220 V, which served as the base voltage for defining the undervoltage and overvoltage values per unit (1 p.u. = 220V). Subsequently, the LSPMM was subjected to VV conditions of 0.90, 0.95, 1.0, 1.05, and 1.10 p.u. while considering loads ranging from 0% to 125%. The LSPMM was powered with VV from the programmable source, and the input data were recorded for further processing and analysis. Simultaneously, thermographic images were captured using a thermographic camera under the nominal-load conditions for each VV condition until thermal equilibrium was reached.

4. Results and Discussion

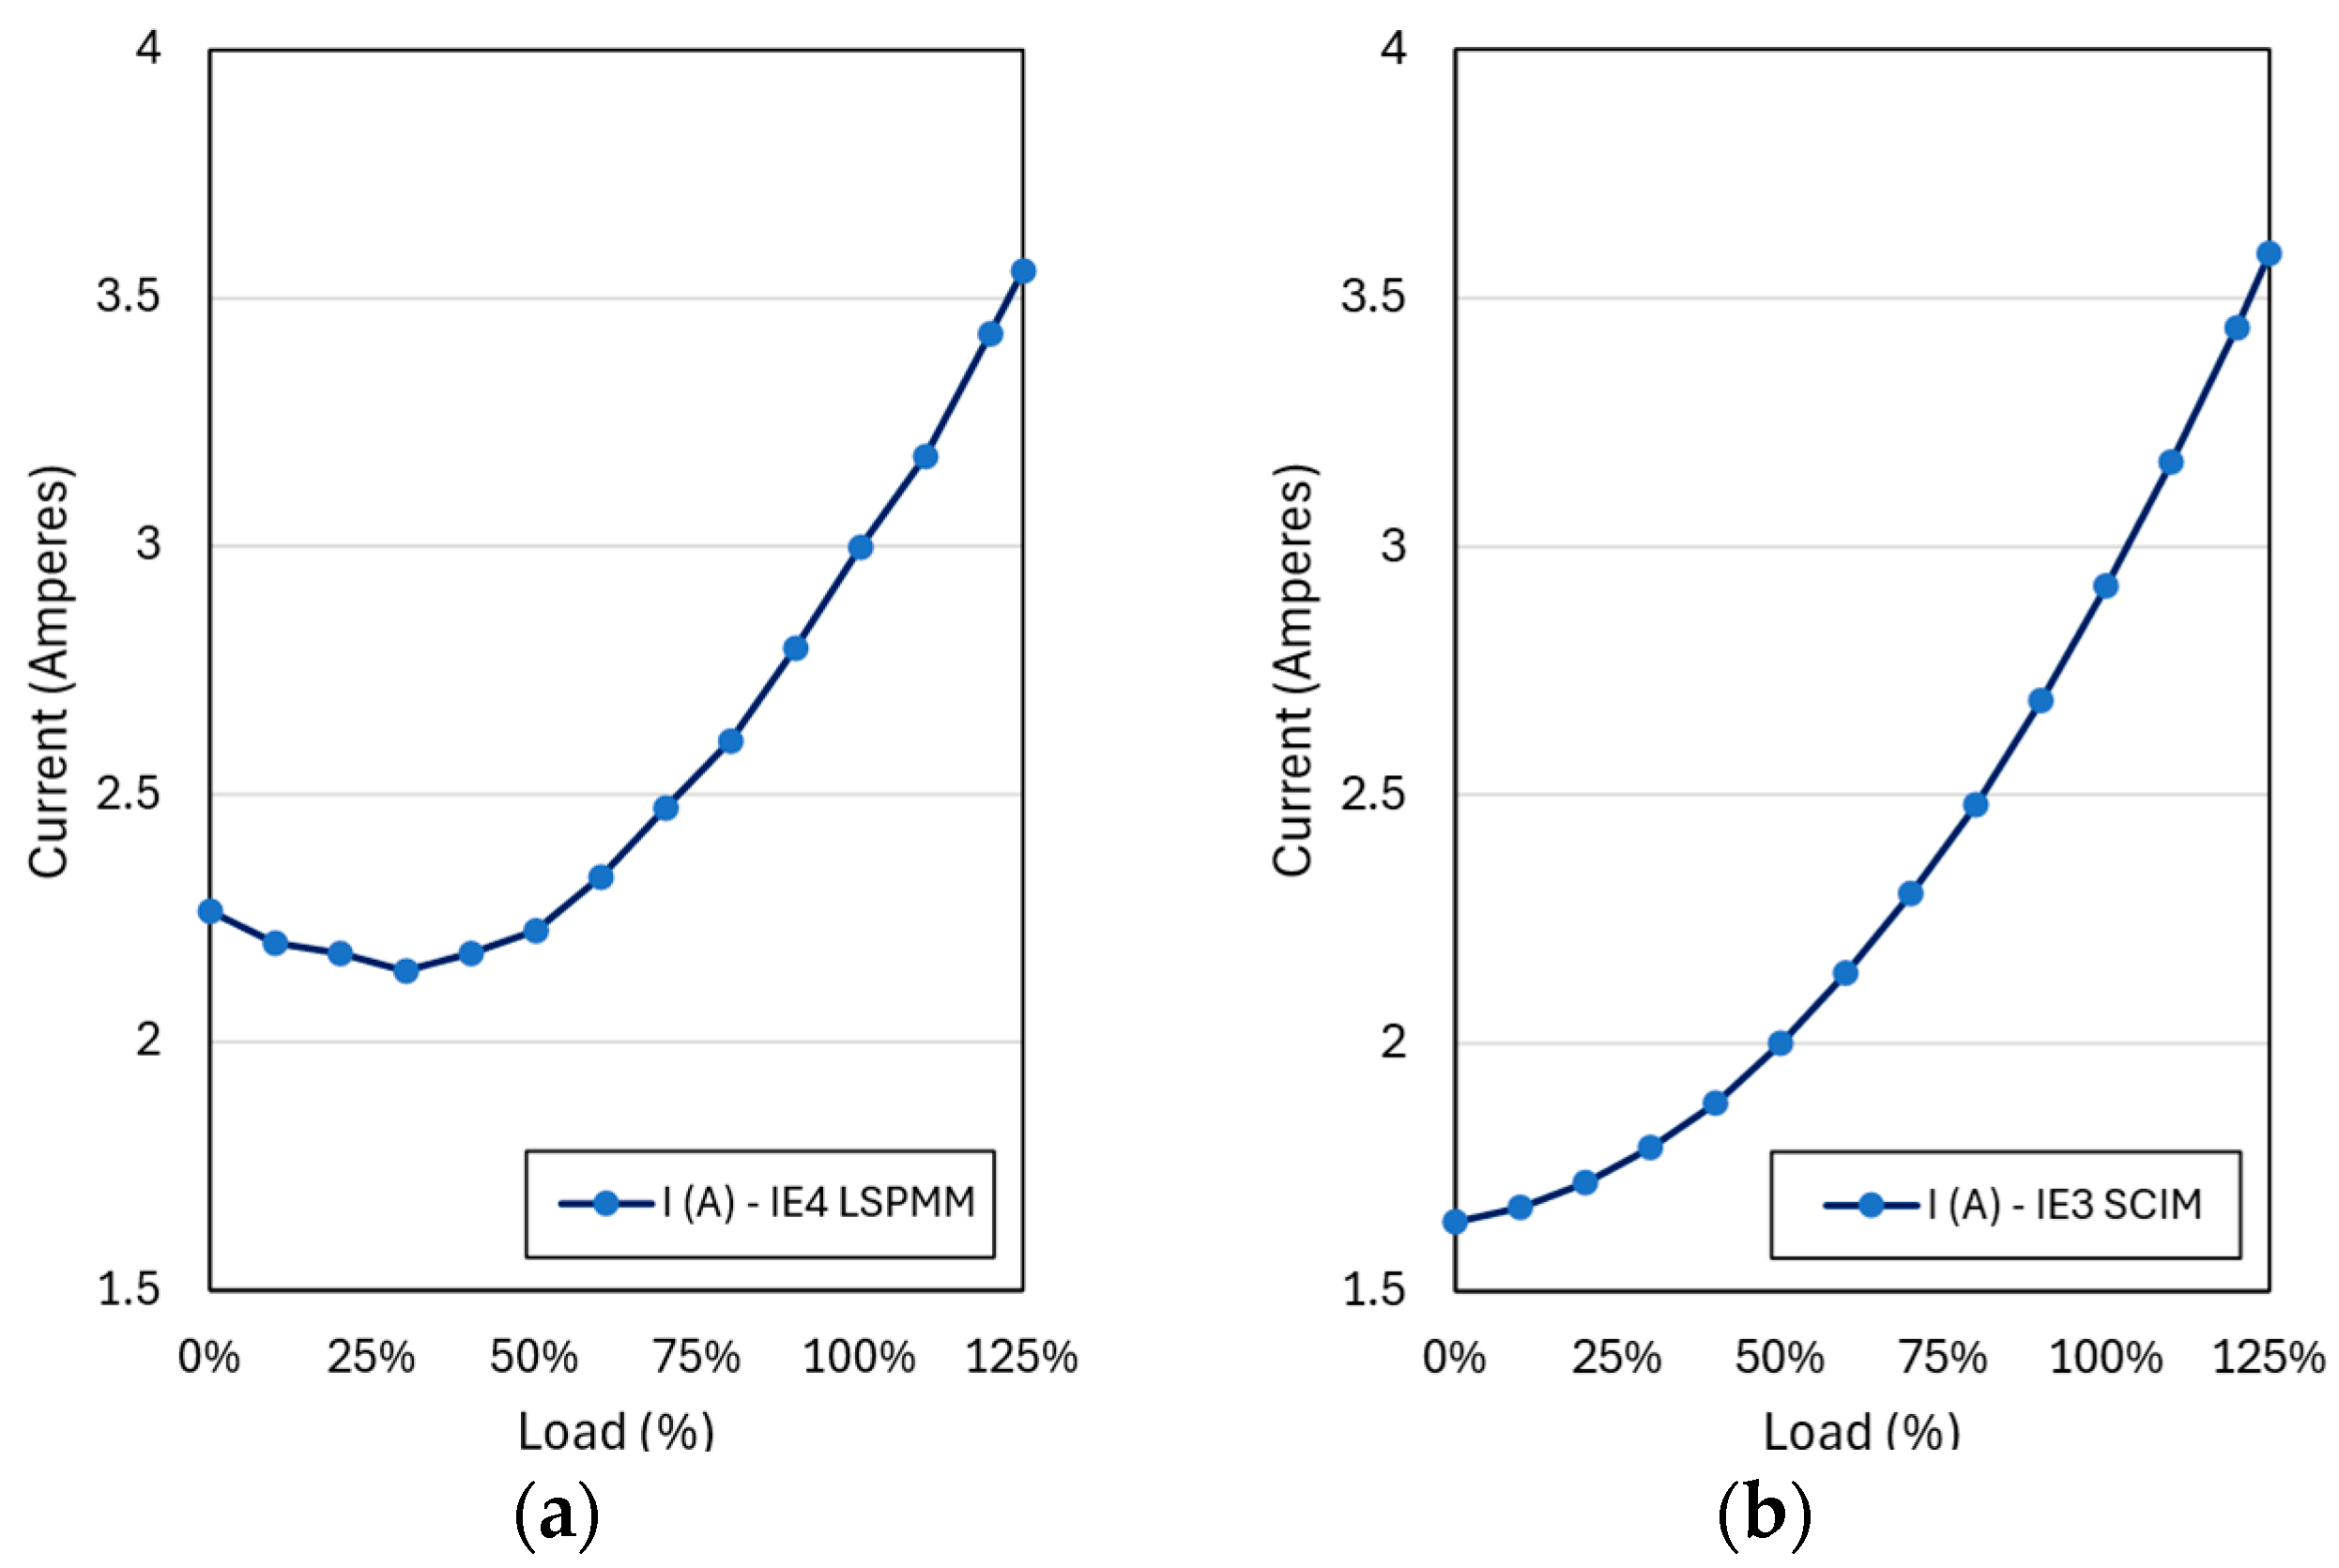
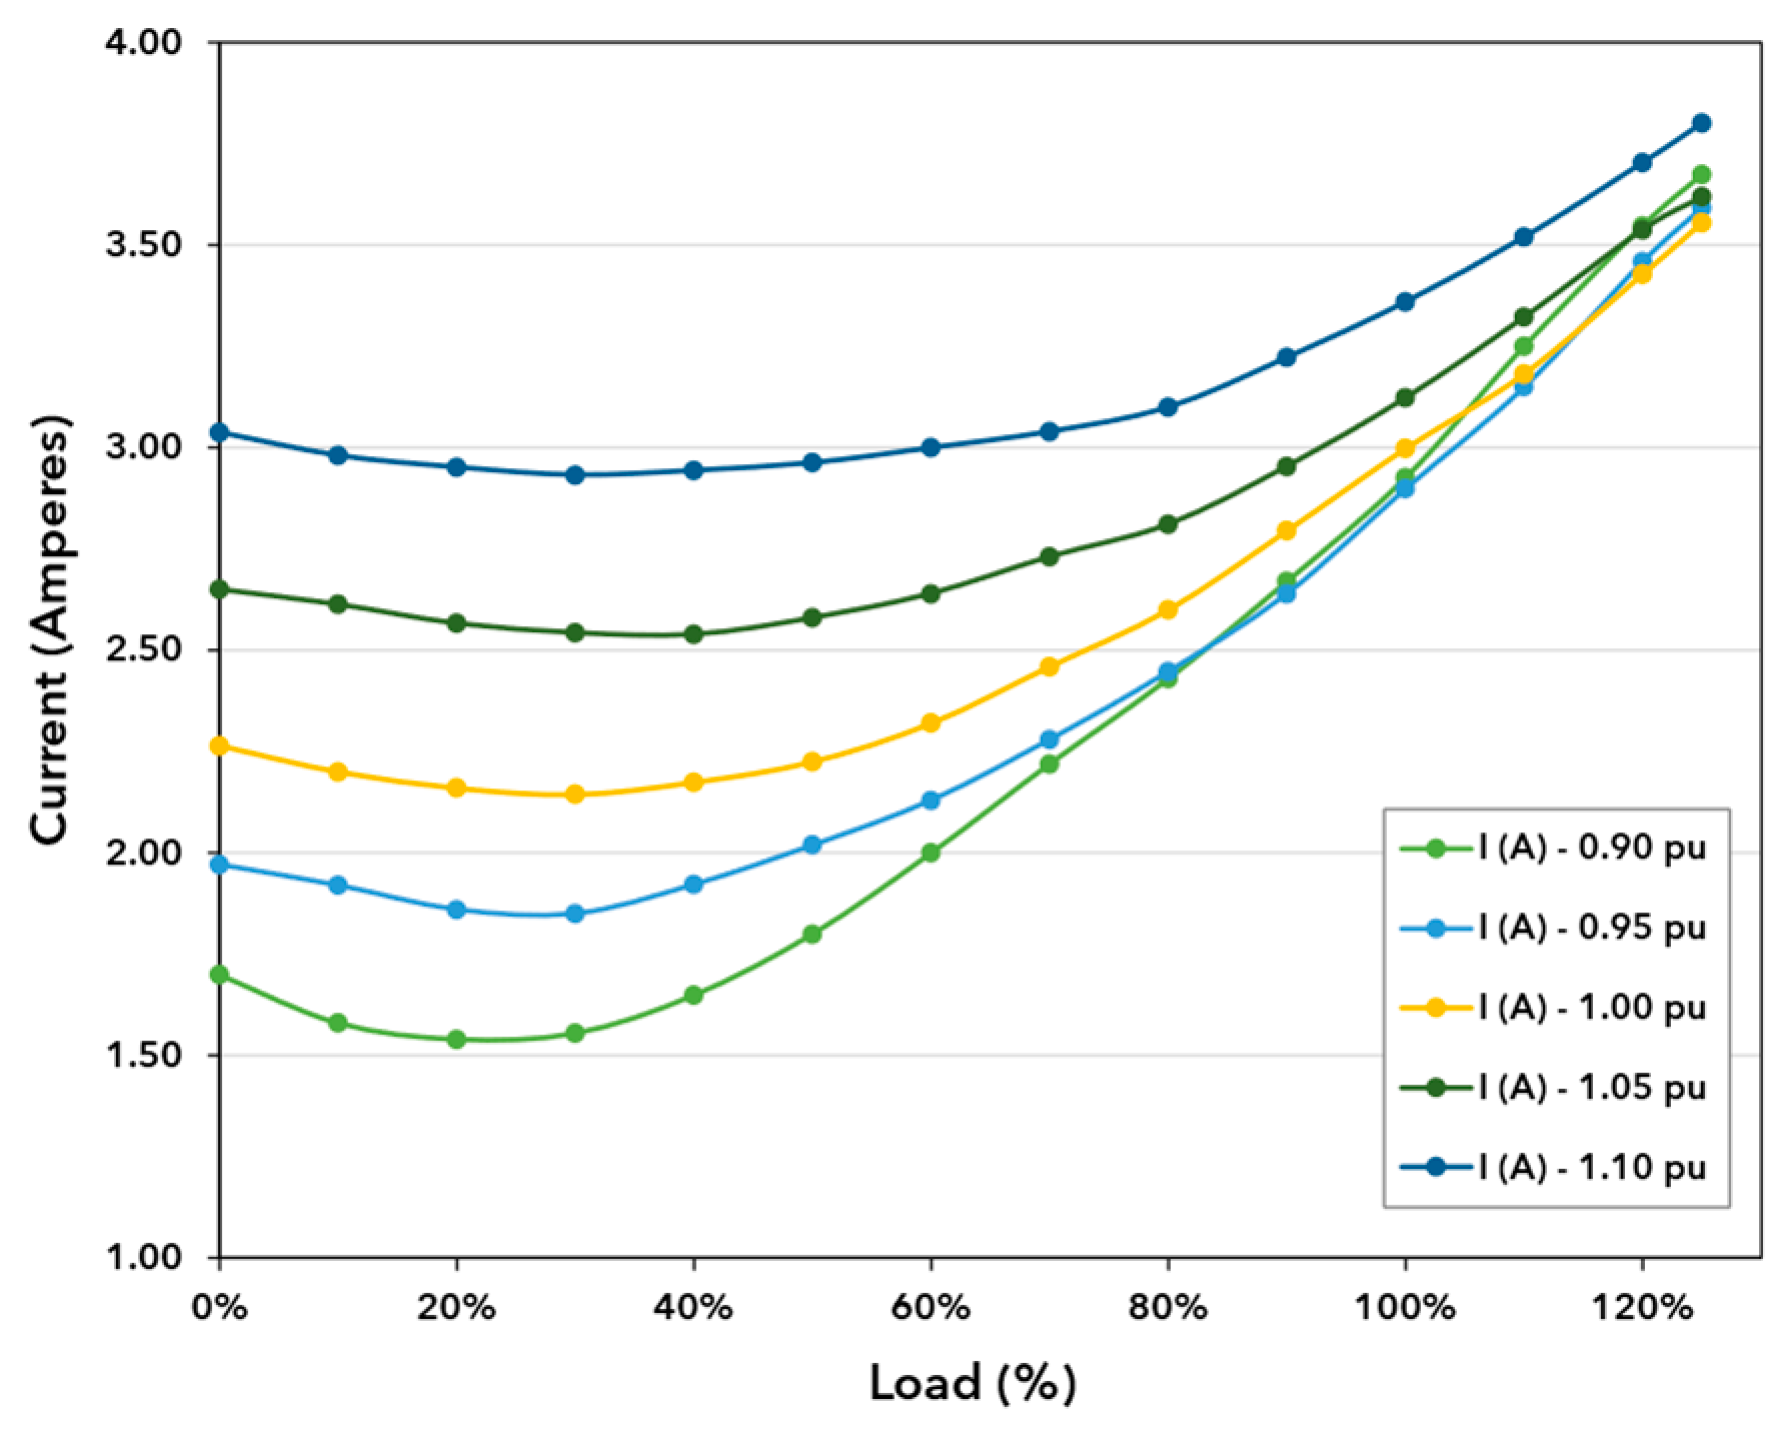
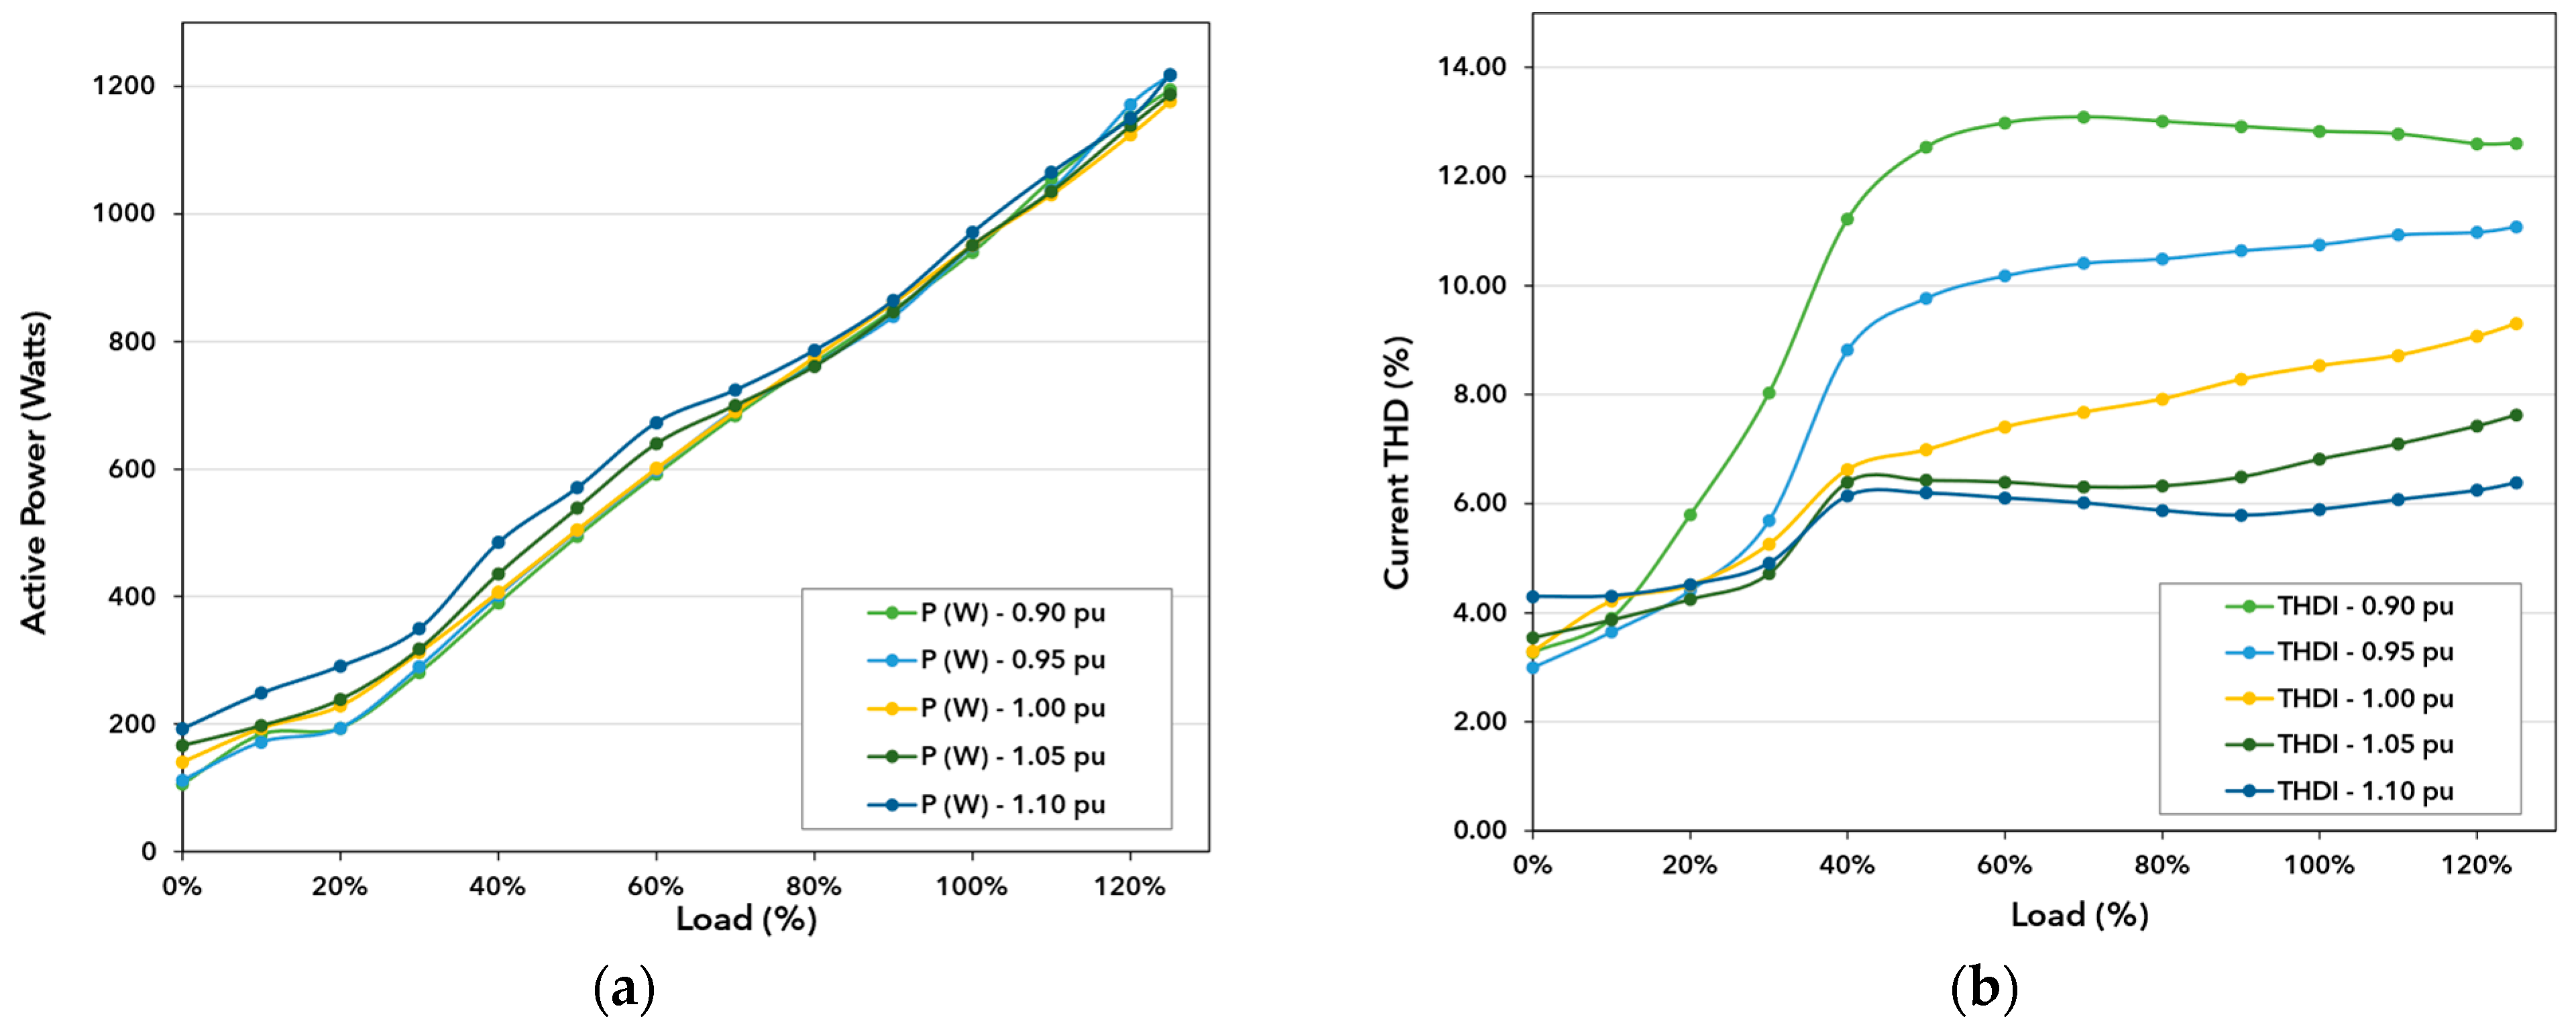
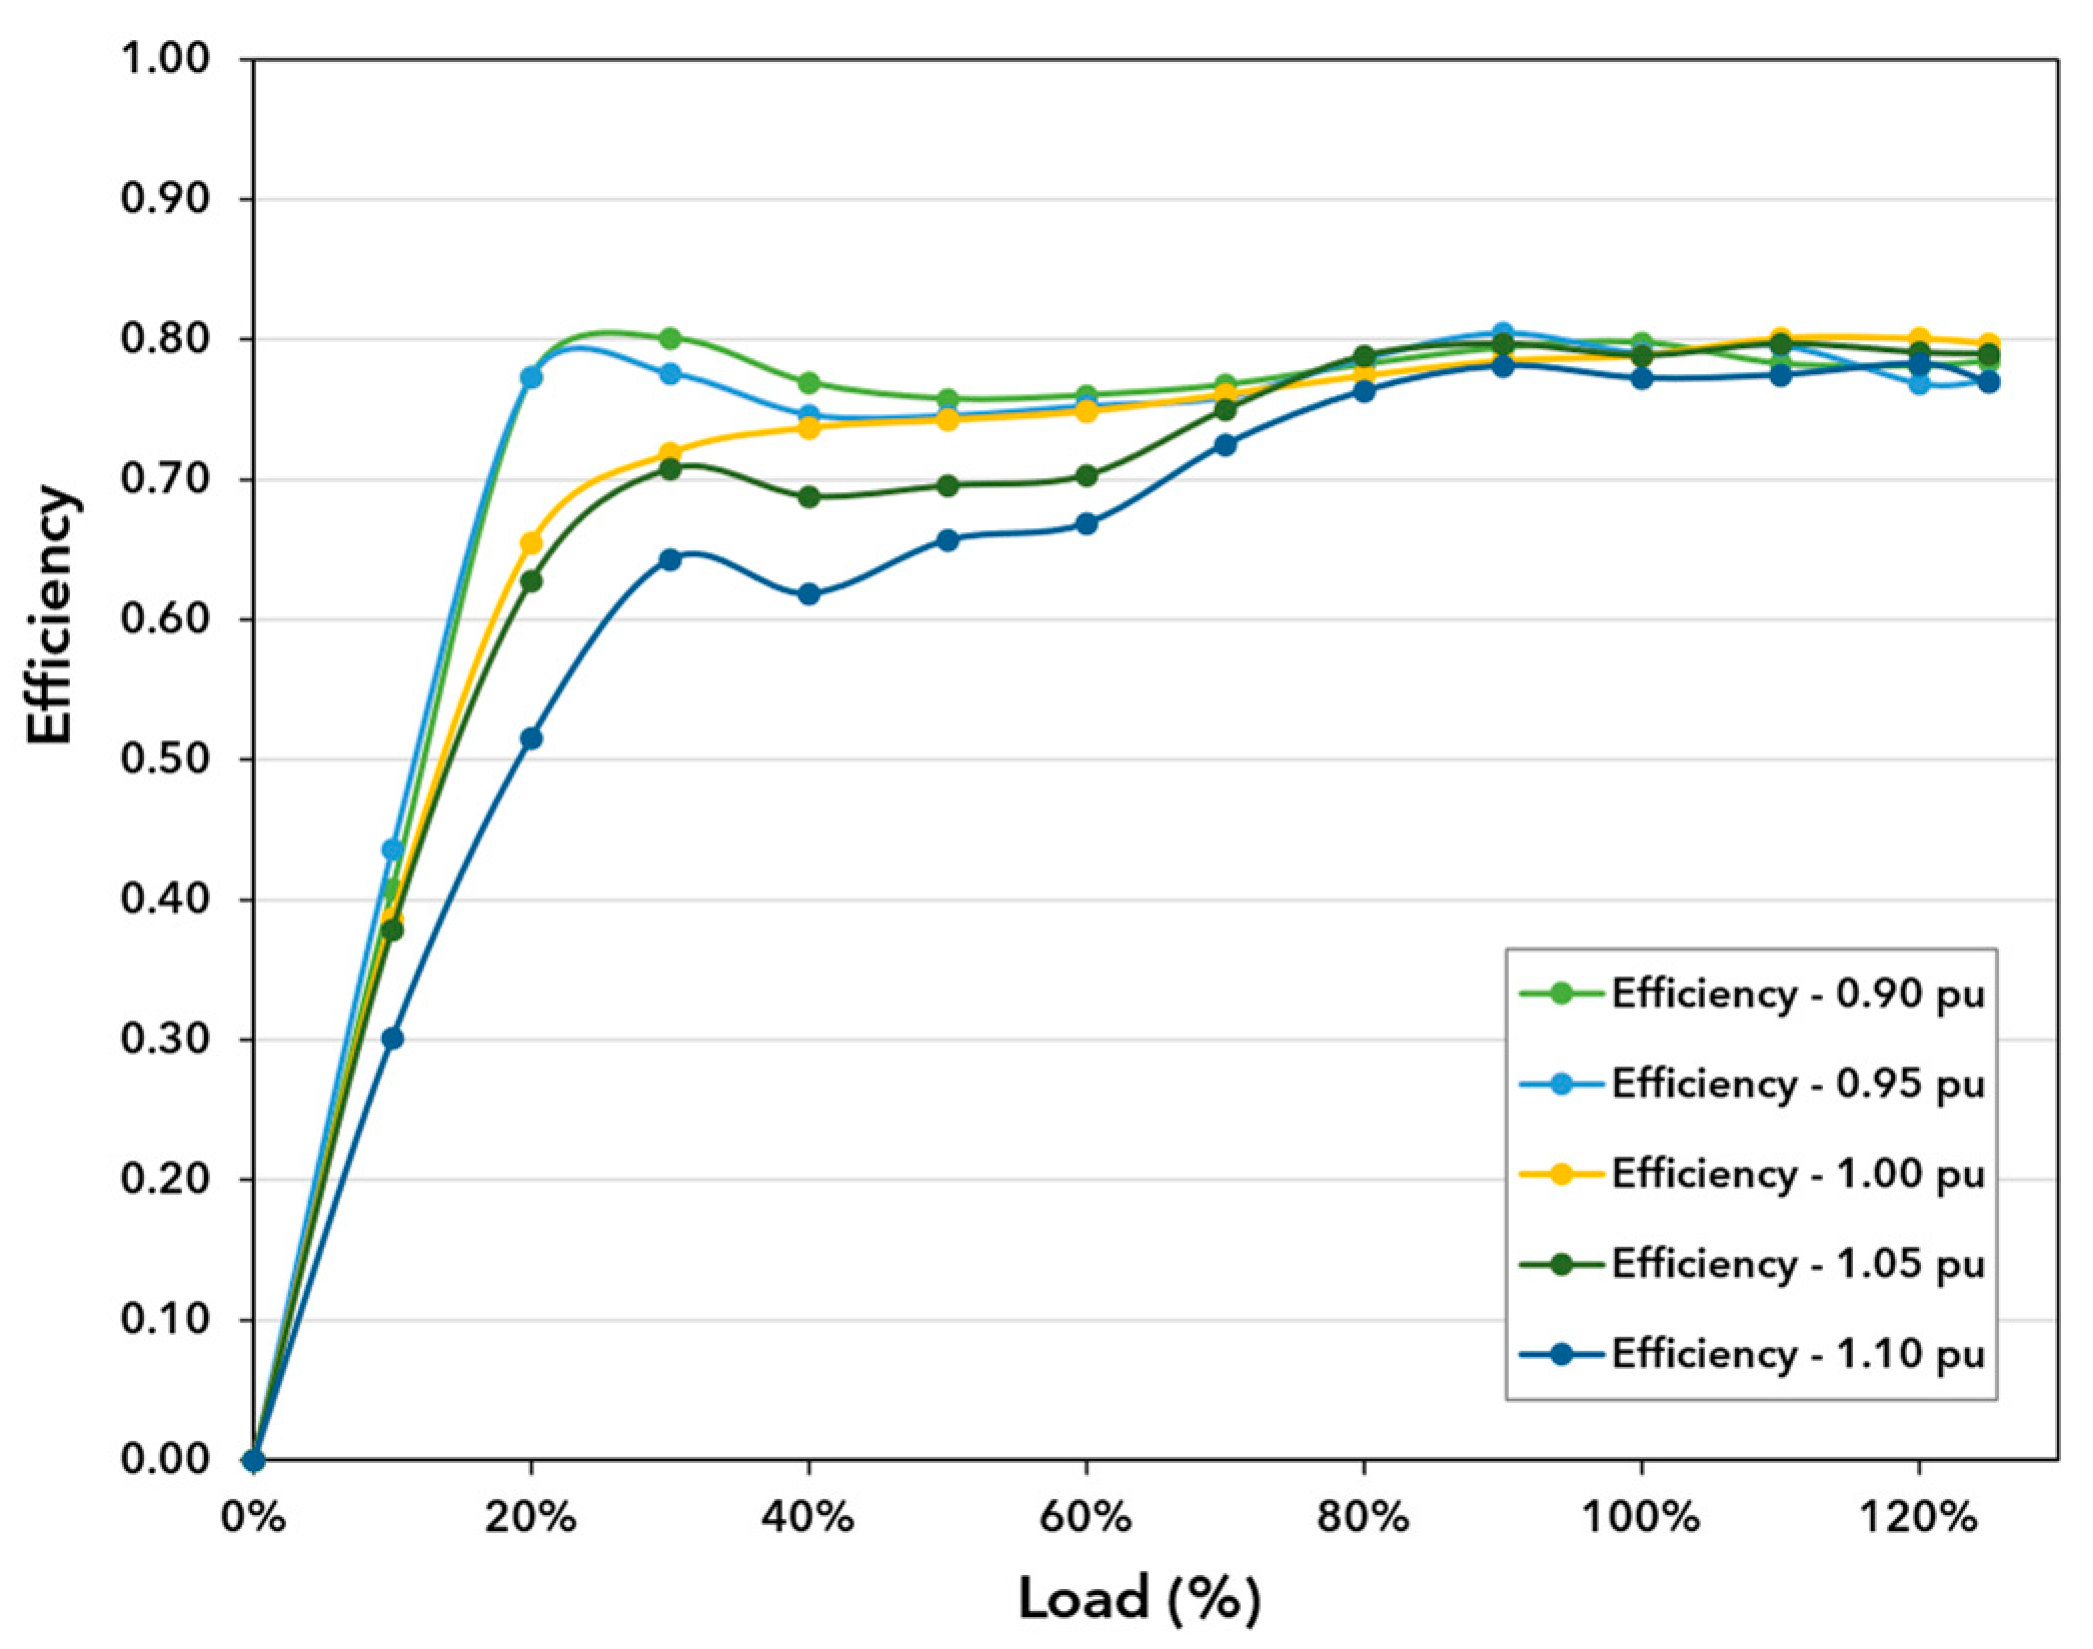
4.1. Technical Analysis

The voltage magnitude is related to the torque at motor start-up. It was noted specifically for this output power that the difficulty of reaching synchronism with nominal-load and nominal-voltage conditions was analyzed. Therefore, experiments considering load were conducted after synchronism was achieved. However, in industrial applications with “quadratic torque” characteristics, such as centrifugal pumps and fans, the starting load torque is lower. Therefore, LSPMMs should be capable of starting and achieving synchronism even if the supply voltage is lower than the nominal voltage.
Under VV conditions, the analyzed motor exhibits an input current that varies with the voltage magnitude, particularly below the nominal condition (Figure 6). Notably, the same load on the motor shaft was configured for each voltage condition. The undervoltage results in lower input currents for the LSPM motor at loads below the nominal motor power output. Furthermore, for loads exceeding the nominal motor power output, all four analyzed non-nominal-voltage magnitude conditions result in higher currents than that of the nominal-voltage condition, with the VV conditions of 1.05 and 1.10 p.u. with the highest input currents. The deviation in voltages causes a proportional variation in the reactive consumption of the motor, mainly owing to the induced VV in the parallel impedance of the LSPMM. This causes the reactive losses due to the leakage reactance to be greater than those under the nominal-voltage condition.
Voltage variation inevitably increases Joule and core losses (Figure 6), wherein an increase in current can be observed. This is further demonstrated by the active power shown in Figure 7a, wherein greater differences are observed for smaller loads, which decrease with the increasing motor load. The decrease in voltage magnitude weakens the main flux because of the lower induced voltage. Consequently, the current harmonic content of the LSPMM increases because of the magnets’ constant magnetic fields inside the rotor during the interaction with the stator magnetic fields to produce mechanical power (Figure 7b). The low active power demand on the shaft, combined with the higher reactive power demand, particularly at low loads, results in a considerably low power factor under light-load conditions. Therefore, it is not recommended that this motor operate with loads below 50% to avoid a low power factor. Figure 8 illustrates the inversely proportional variation of the power factor with the voltage magnitude below the nominal condition. For instance, the power factor under the 1.10 p.u. condition at the nominal load (100%) is lower than that under the 0.90 p.u. condition at 40% load. This highlights the benefits of undervoltage for the operation of this LSPMM technology under variable load conditions.
Ridgeline plots were plotted for the power factor at each voltage condition based on the measurements shown in Figure 9 to better visualize the power factor variation across the load spectrum. Ridgeline plots can be used to visualize data distribution through density plots. In this context, Figure 9 presents the power factor point values shown in Figure 8. The y-axis represents the five voltage magnitudes assessed in this study, and the x-axis represents the power factor values obtained for different load conditions.
The undervoltage condition mostly represents power factors between 0.60 and 1.0 for most of the motor load curve, while the overvoltage condition represents power values between 0.40 and 0.80. Therefore, in situations where the choice is limited to the undervoltage or overvoltage, the undervoltage remains a more favorable choice in terms of the power factor.
Another important parameter of interest is active power, which is related to motor load and affects both industry consumption and demand. To present a comparison of the active power with the power factor under VV conditions, contour plots that depict the relationship between the two parameters for the 0.90, 1.0, and 1.10 p.u. conditions as a function of load are presented in Figure 10. The contour lines connect points with the same power factor response value, and the colored bands represent the measured power factor values. Figure 10a shows the undervoltage positively deviates from the nominal condition at 0.90 p.u in the behavior of the LSPMM, indicating that higher power factor values can be achieved at lower loads on the motor shaft, where lower active powers contribute to a reduction in consumption and demand for end users. Furthermore, Figure 10c shows how the overvoltage negatively deviates from the nominal condition (Figure 10b), indicating that lower power factors can be obtained along the motor load curve with higher active powers. Therefore, undervoltage is beneficial in this technology because consumption, demand, and power factor are the parameters of interest to specialists.
Synchronism contributes to high efficiency, particularly at low loads. In the case of the LSPMM (Figure 11), high efficiency values are obtained first at low loads. This is mainly attributed to the motor current curve (Figure 6), in which the current tends to decrease as the load increases up to approximately 30–40%. Consequently, the electrical power decreases, whereas the mechanical power increases, resulting in high efficiencies at these loads. The impact of VV on the LSPMM efficiency is most pronounced at low loads, and similar values are obtained for loads close to nominal loads.

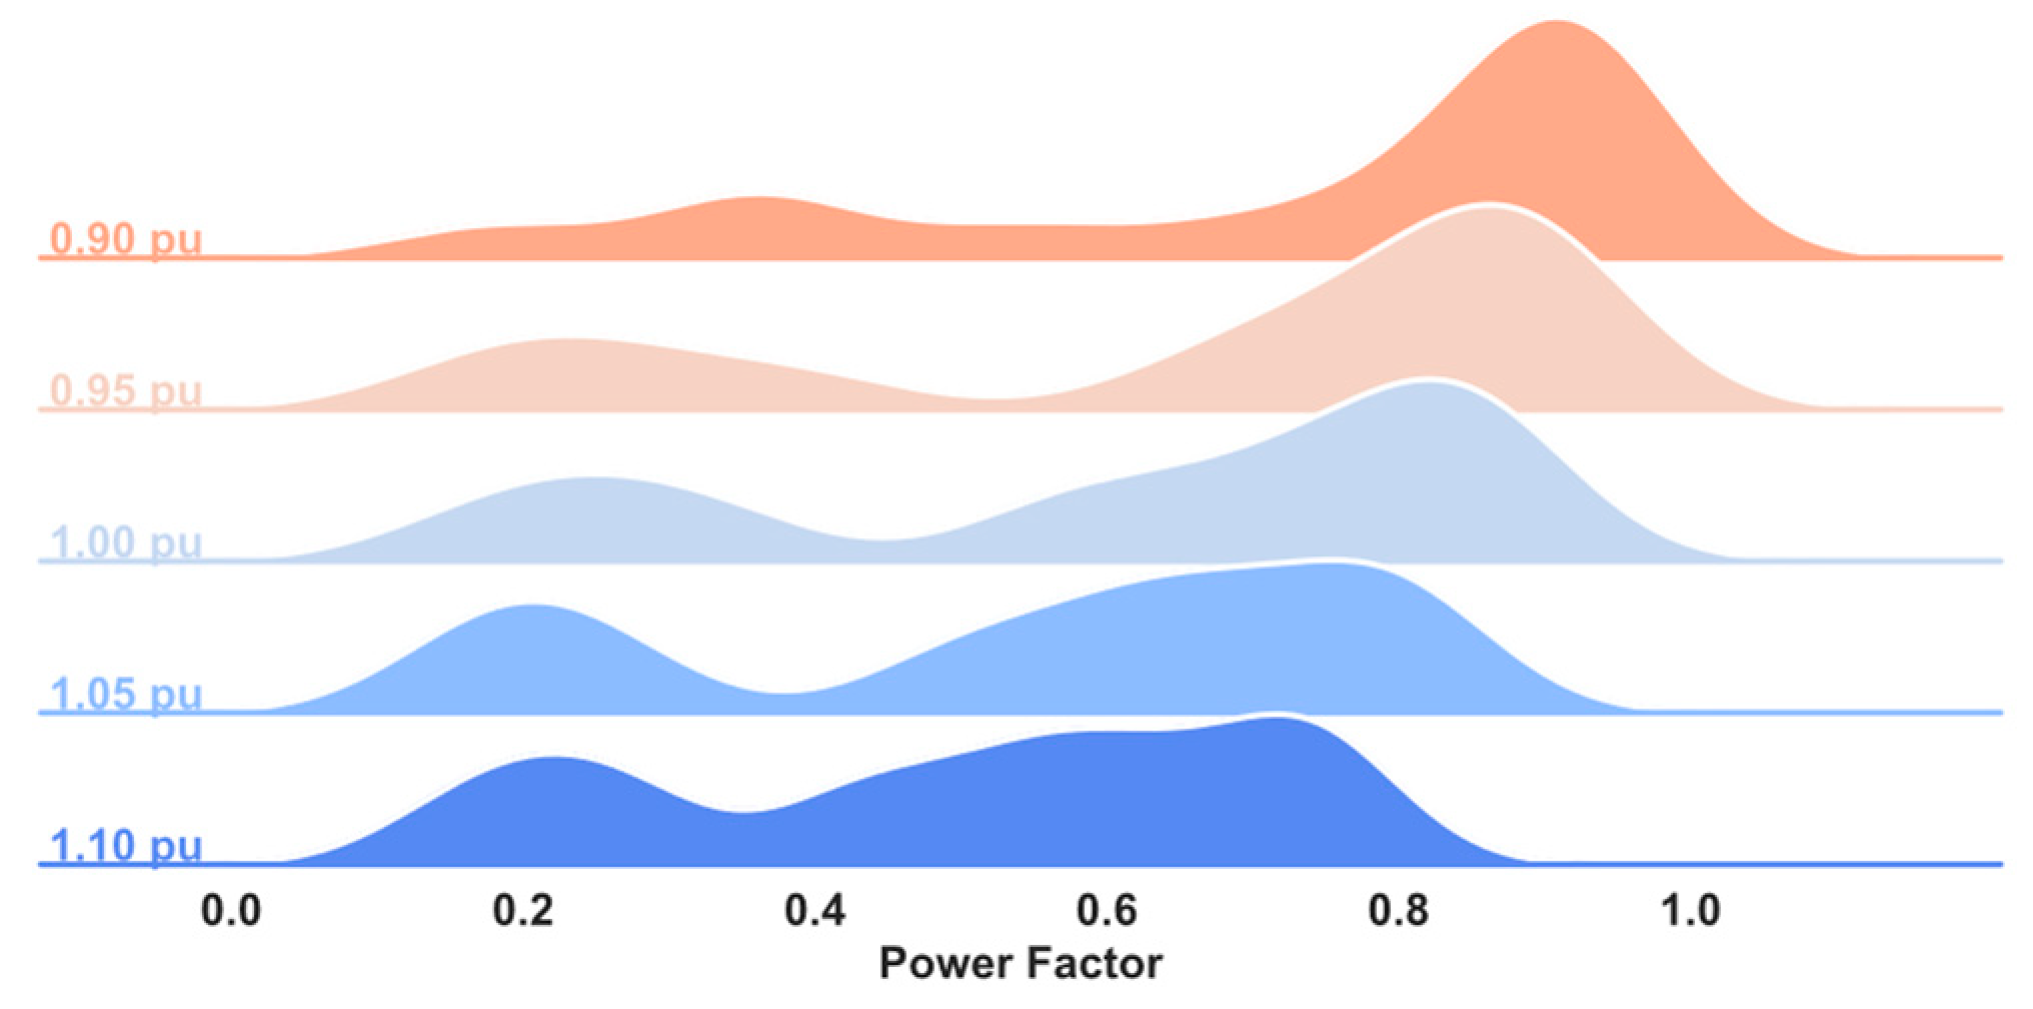
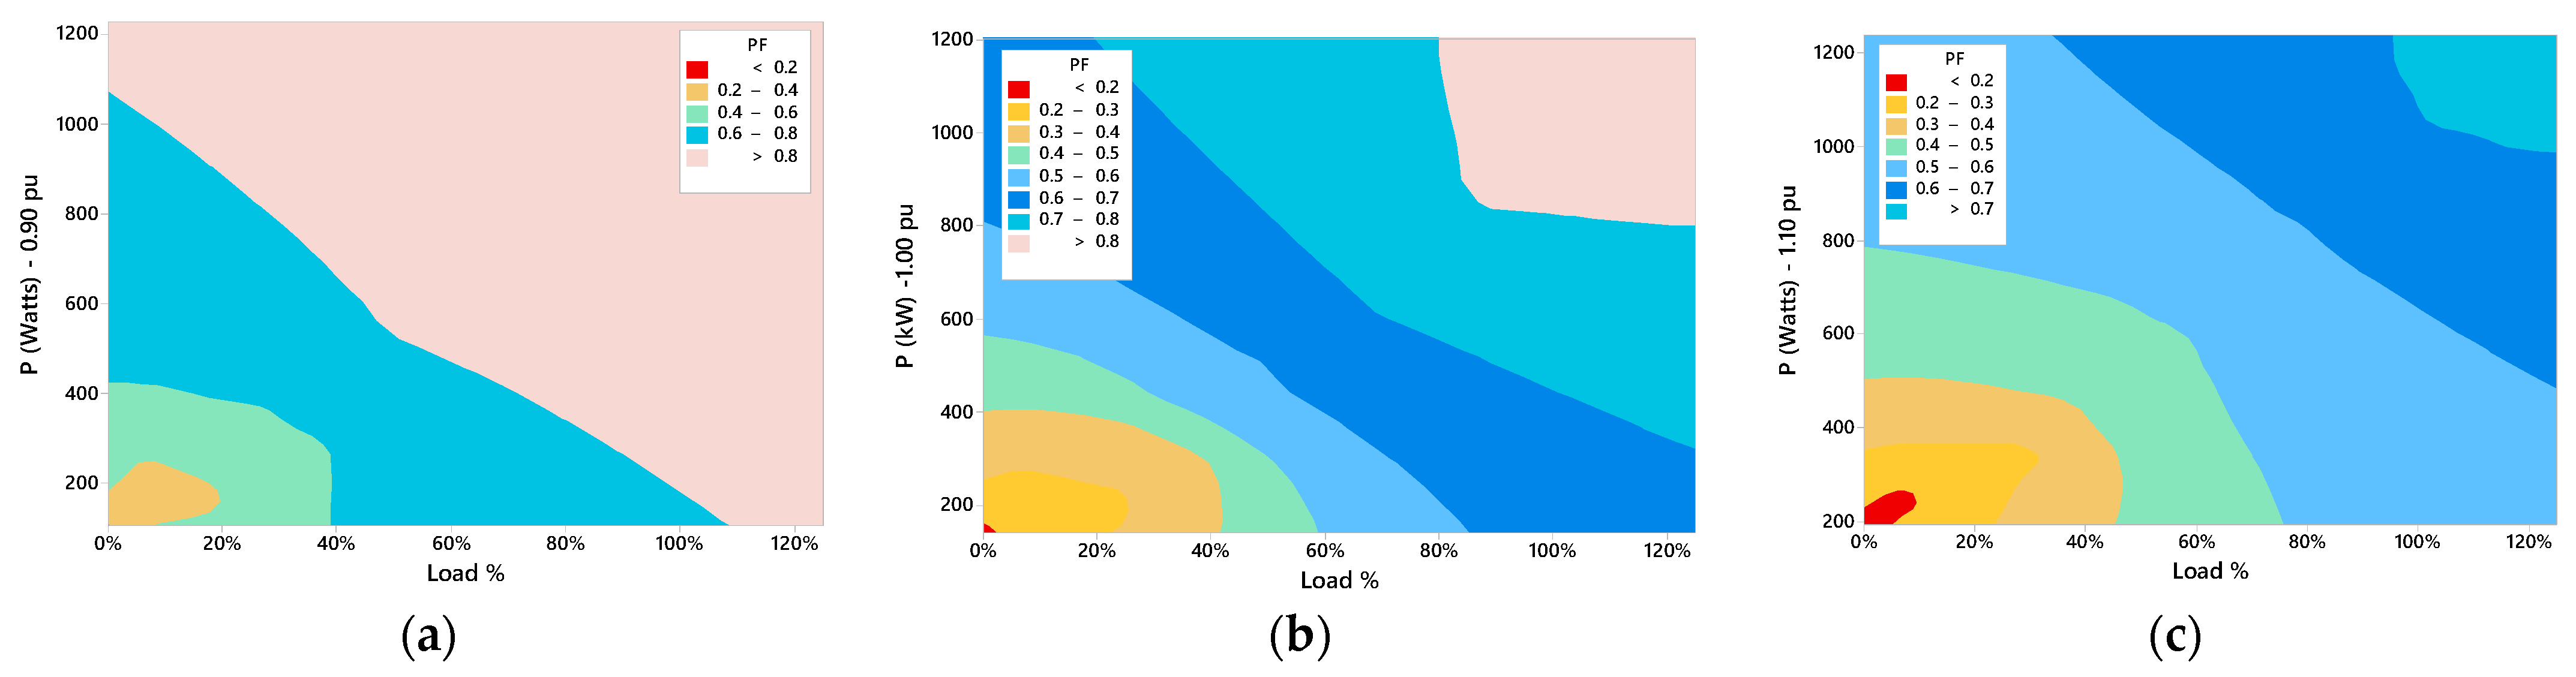
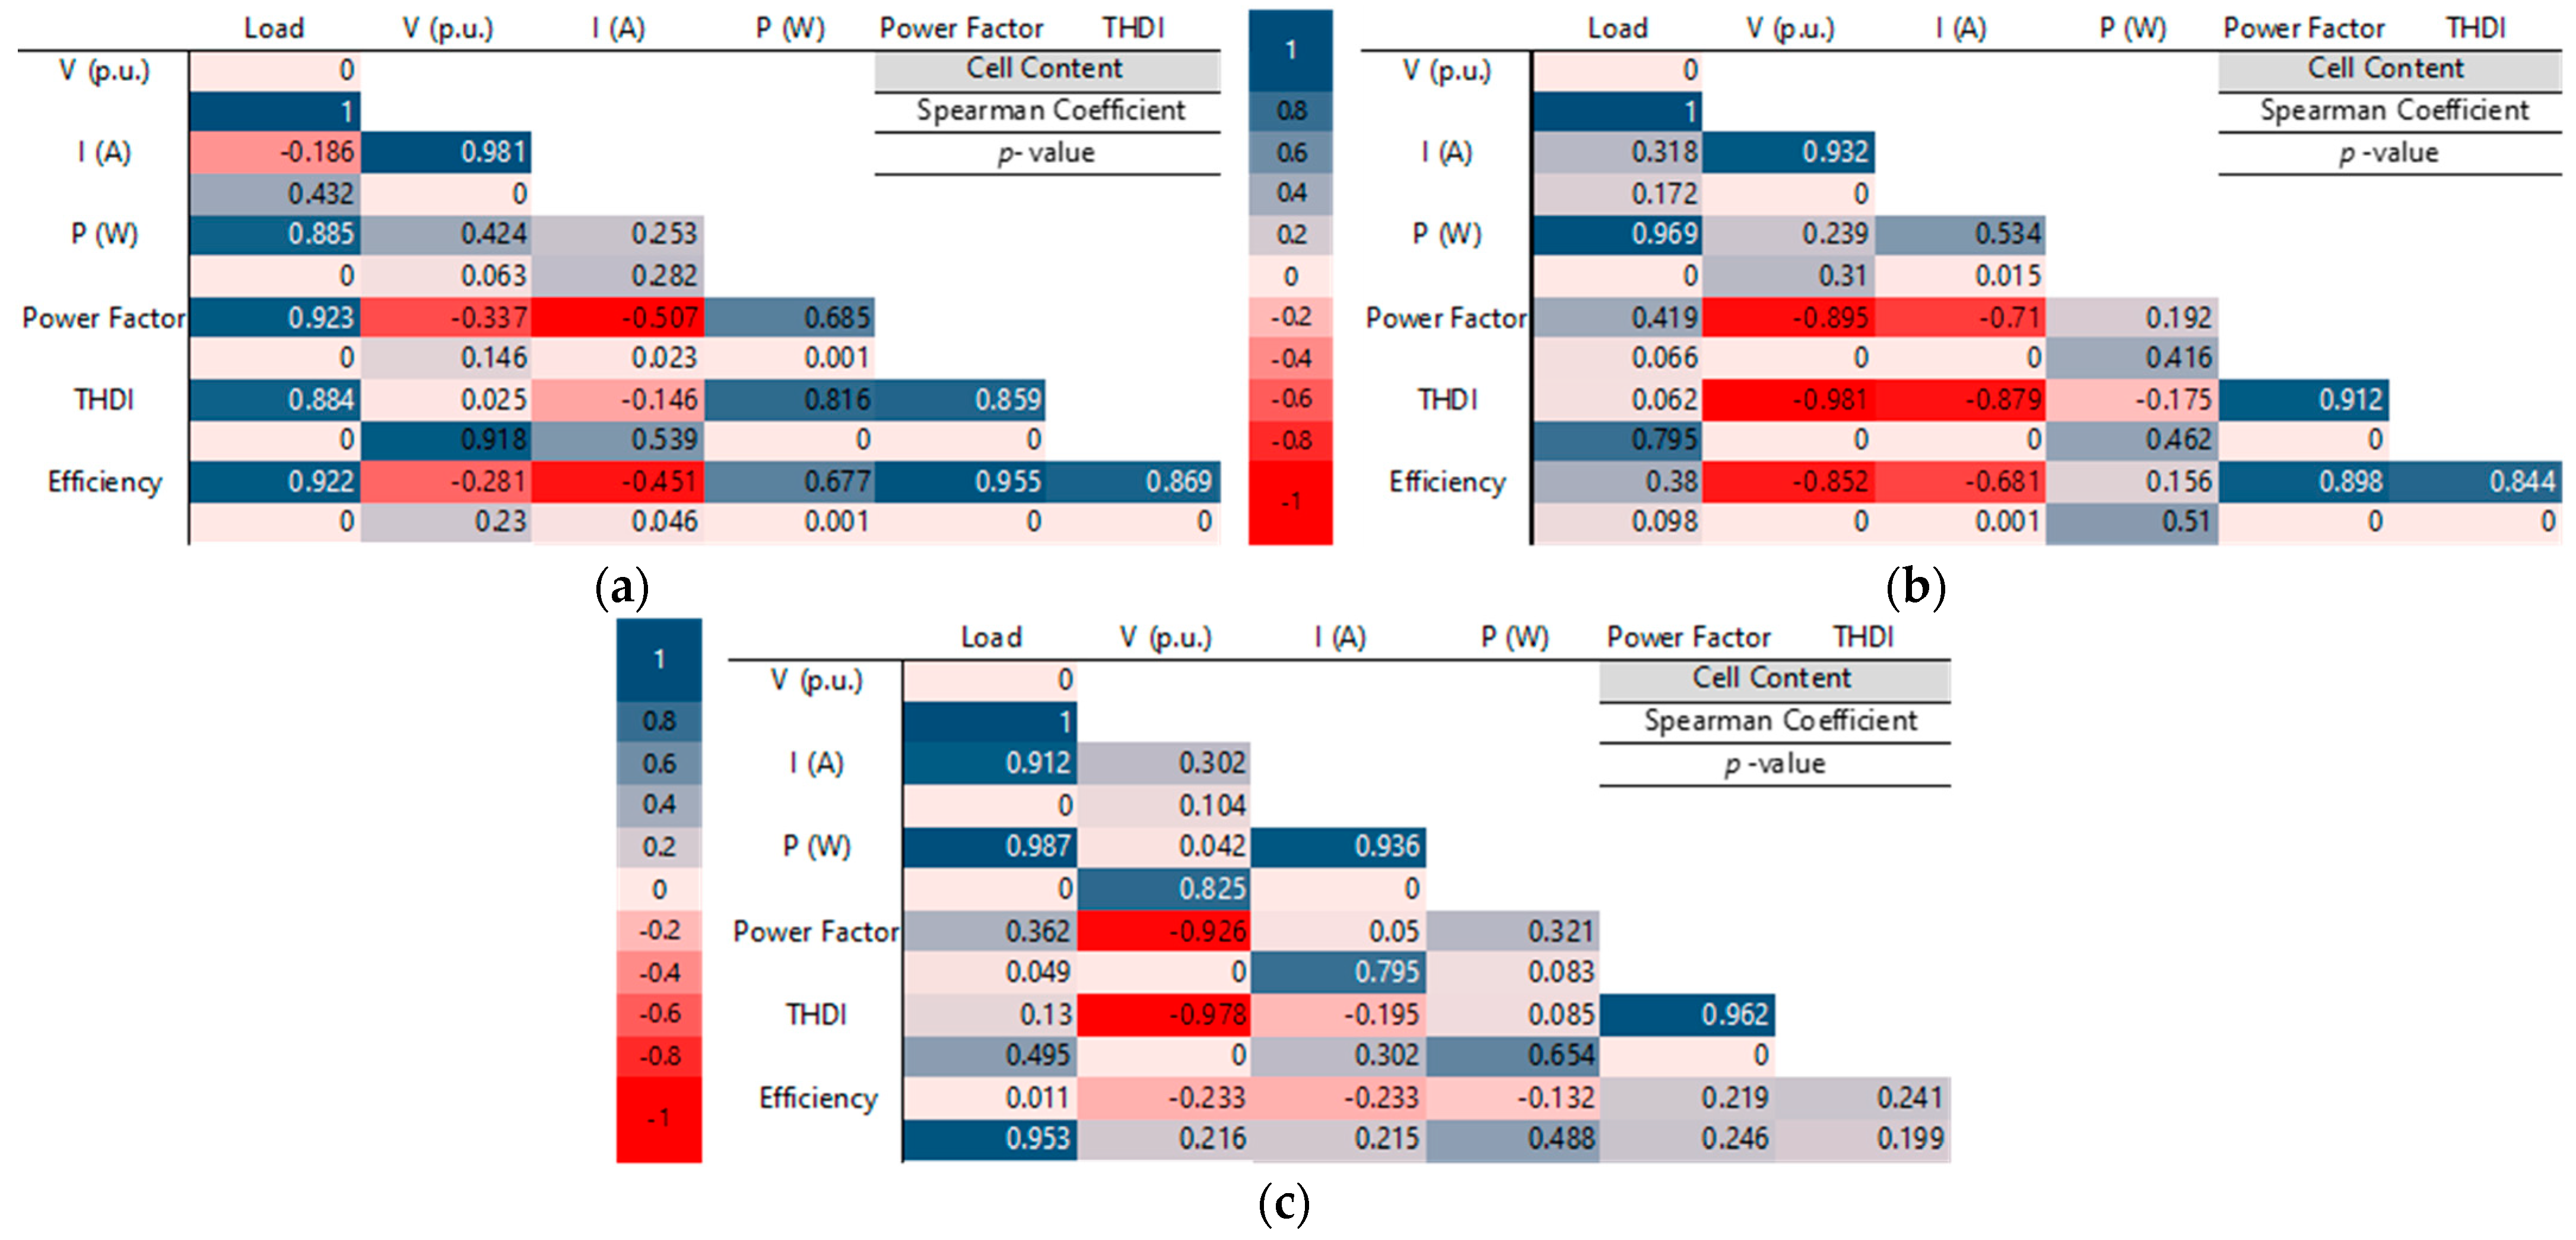
4.2. Statistical Analysis

To examine the impact of the voltage magnitude on the motor efficiency and power factor, an analysis based on Spearman’s correlation was conducted using Minitab version 18 [29]. The analysis assessed the monotonic relationship between the voltage magnitude and various motor input parameters. Spearman’s rank correlation coefficient, which is dependent on the ranks of values rather than the actual values themselves, is particularly suitable for ordinal and continuous variables. This method is valuable in situations where Pearson’s correlation is unsuitable because of normality violations, nonlinear relationships, or the involvement of ordinal variables [30,31,32]. Given the identification of a nonlinear relationship among certain variables in this specific case, Spearman’s correlation method was selected [33]. The formulation for calculating the Spearman’s rank correlation coefficient is presented in Equation (1).
r s = 1 6   i = 1 n D i 2 n ( n 2 1 ) ,
where n represents the number of value pairs and D i = X i Y i represents the difference between each corresponding X i and Y i value rank.
In general, the correlation coefficient resulting from the correlation analysis ranges from −1 to +1. A higher coefficient indicates a stronger relationship between the variables. To verify the influence of voltage magnitude variation on the efficiency and power factor, different load ranges were considered, and Spearman correlation coefficients were estimated for each range (Figure 12). The load ranges were divided into three blocks: the first block covers load percentages between 0% and 30% (Figure 12a), the second block includes loads between 40% and 70% (Figure 12b), and the last block comprises loads between 80% and 125% (Figure 12c). In these correlation matrices, the upper cell shows the Spearman coefficient, while the lower cell shows the p-value, which helps determine the rejection of the null hypothesis at the assumed significance level of 0.05.
For the first load block (Figure 12a), the results show that the input parameters, except for the voltage and current magnitudes, show high correlations with the load, indicating that the efficiency and power factor vary proportionally with the load. However, this relationship does not hold for the voltage magnitude, which exhibits low correlations and p-values of >0.05.
In the second load block (Figure 12b), which includes loads between 40% and 80%, the efficiency and power factor vary inversely with the voltage magnitude because they have negative correlation coefficients. Thus, the efficiency and power factor increase with the decreasing voltage magnitude, confirming the results presented in the previous section and indicating that voltage magnitude exerts a greater influence on permanent-magnet motors operating within this load range.
For the higher loads in the range between 80% and 125%, Figure 12c shows that load exerts a greater influence on the current and active power than the efficiency and power factor. A similar scenario is observed for the voltage magnitude, indicating that for loads close to the nominal load, the voltage magnitude exerts less influence on the efficiency and power factor of the LSPMM analyzed in this study. The correlation matrices show that the voltage magnitude influences the efficiency of the LSPMM at certain load percentages, with lesser influence at lower loads (below 40%) and higher loads (above 80%) analyzed in this study.

4.3. Economic Analysis

Differences in currents, active power, efficiency, and power factor resulting from VV in the LSPMM were observed. To quantify these impacts, an economic analysis was conducted considering users in regions where the supply voltage magnitude for electric motors is determined according to the transformer’s secondary connection. In this case, Honduras, located in Central America, was used as a reference, with three-phase nominal voltages of 208 and 240 V for star and delta connections, respectively.
For economic quantification with respect to each voltage level, the annual energy consumption for each load condition was estimated based on experimental power measurements and considering 6000 h of operation per year. Figure 13 shows the approximate energy consumption of the LSPMM under each voltage condition as a function of different voltage magnitudes and loads. Energy consumption increases with the increasing voltage magnitude.
Two scenarios were examined to evaluate the economic benefits of undervoltage. The scenarios involved time-of-use (TOU) pricing, where energy costs varied based on specific times of the day (Figure 14). The peak hours covered a 3-hour duration from 18:30 to 21:30, with the remaining hours classified as an off-peak period. During the peak period, a kilowatt-hour (kWh) cost equivalent to ten times (USD 0.8/kWh) that of the off-peak period (USD 0.08/kWh) was considered based on industry references. In the first scenario, the TOU pricing structure was not considered. In this case, the economic costs and benefits associated with the variation in the voltage magnitude were obtained by multiplying the reduced consumption by a single tariff of USD 0.08/kWh. In the second scenario, two different energy charge rates are implemented: one for off-peak hours with a value of USD 0.08/kWh and the other for peak hours, corresponding to USD 0.8/kWh (Figure 14).
By comparing the operating costs of the motor under different voltage conditions, the cost difference was determined. This calculation assumes a change in the motor supply from a delta connection with 240 V to a star connection with 208 V for a motor with a nominal voltage of 220 V. This corresponds to a change from 1.10 to 0.95 p.u. at the motor supply voltage (Equation (2)). The energy savings during peak and off-peak periods are determined by multiplying the difference in the active power obtained from Equation (2) by the annual operating time. For this analysis, 5500 yearly operating hours during off-peak periods and 500 yearly operating hours during peak periods were considered.
Equation (5) is used to calculate the total cost savings in USD by taking the sum of the energy consumption multiplied by the cost per kWh in each period (Figure 13). The first scenario considers only the first term of the sum, whereas the second scenario, which incorporates TOU pricing, considers all terms of the equation.
P 1.10   p . u .   k W P 0.95   p . u .   k W = P e c o n o m y ( k W ) ,
E o f f p e a k ( k W h ) = P e c o n o m y k W × Y e a r l y   h o u r s o f f p e a k ,
E p e a k k W h = P e c o n o m y k W × Y e a r l y   h o u r s p e a k ,
E c o n o m y   U S D = E o f f p e a k k W h × E C o f f p e a k U S D k W h + E p e a k k W h × E C p e a k U S D k W h ,
where P 1.10   p . u .   k W and P 0.95   p . u .   k W represent the active powers measured for each load condition with 1.10 and 0.95 p.u. voltage magnitudes, respectively; Y e a r l y   h o u r s p e a k and Y e a r l y   h o u r s o f f p e a k represent the sum of operation hours in the peak and off-peak periods, respectively; E p e a k ( k W h ) and E o f f p e a k ( k W h ) represent the energy consumption in the peak and off-peak periods, respectively, and E C o f f p e a k and E C p e a k represent the energy costs in U S D k W h for the off-peak and peak periods, respectively.
Equation (6) was used to estimate the payback period [34]. The analysis was based on the initial cost of an IE3-efficiency class motor with the same power output to assess the impact of altering the motor supply voltages under each load condition. Figure 15 shows the results for the two analyzed scenarios. For the first scenario (Figure 15a), the estimations indicate that for loads below 60%, decreasing the voltage magnitude from 1.10 to 0.95 p.u. can result in cost advantages that would enable the purchase of a new motor with the savings generated over its lifetime. This highlights the benefits of this analysis. For the second scenario (Figure 15b), where a peak time and a ten-fold higher energy cost are considered, the payback period is reduced to less than 10 years for any load percentage and less than 5 years for loads below 60%. Given that this is a widely used tariff in the industry, the study can be valuable for specialists and engineers aiming to reduce energy consumption through energy efficiency measures. However, the load percentage and power output must be verified because this study was limited to a motor with an output power of 0.75 kW.
P B P   ( y e a r s ) = P E c o n o m y   U S D ,
where P B P represents the payback period in years, P represents the total project investment and E c o n o m y   U S D   represents the annual cash flow in USD/year.

4.4. Temperature Assessment

Thermal load is an important indicator of the condition of an electric motor. To assess the impact of VV on temperature, thermographic images were captured every 2 min until thermal equilibrium was reached for each voltage-magnitude condition considering full load and capturing the lateral (stator) and front (rotor) angles of the motor. Figure 16 and Figure 17 show photographs of the LSPMM at thermal equilibrium under voltage conditions of 0.90, 1.0, and 1.10, with front and side views, respectively.
Each condition results in temperature variations for the same connected load, which can affect the lifespan and maintenance period of electric motors operating under these conditions. The lateral view of the stator and the front view of the rotor reveals a temperature difference ranging from 5.5 °C to 8 °C between voltage magnitudes of 0.90 and 1.10 p.u.
Figure 18 illustrates the temperature curve data measured for each voltage magnitude obtained by analyzing the small triangle points in the images using the thermographic camera software version 5.13. The temperature values closely align between the nominal-voltage and overvoltage conditions at 1.10 p.u. This similarity is attributed to the comparable currents observed at the load percentages shown in Figure 6. These results indicate that the undervoltage and overvoltage conditions exhibit higher temperatures than the nominal condition, with temperature differences of up to 8 °C higher than the nominal condition.
Although the new efficiency classes have higher temperature tolerances (insulation letters), usually letter F (maximum temperature of 155 °C), the temperature increase continues to be detrimental to the lifespan of the motor by reducing the time between maintenance services. Furthermore, environments with high concentrations of airborne particles, combined with inadequate maintenance, contribute to the degradation of the motor’s internal components, thus reducing its lifespan.

5. Conclusions

The adoption of new technologies requires technical evaluations of their performance under real operating conditions. This study provides a comprehensive evaluation of a 0.75-kW LSPMM in the presence of VVs under undervoltage and overvoltage conditions from 0.90 to 1.10 p.u. using various approaches.
Given that the LSPMM is a relatively new technology, an electrical assessment was conducted by considering the voltages found in different electrical systems as well as diverse load scenarios and analyzing the parameters of interest to end users. Findings indicate that operating a motor under undervoltage conditions (0.90 p.u.) results in higher efficiencies, an improved power factor, and lower operating temperatures. These outcomes translate into enhanced economic benefits and an extended motor lifespan. However, specialists should analyze the results presented to make optimal use of them according to the type and nature of the loads. The results show that the impact of voltage-magnitude variation is minimized under nominal-load and overload conditions. Undervoltage is not the best alternative under these conditions. Considering the type of application, because the starting torque depends on the input voltage, undervoltage may limit the starting torque with heavy motor-shaft loads. Therefore, undervoltage is mainly recommended for loads with quadratic torque characteristics, such as centrifugal pumps and fans, where the starting load torque is lower when compared to other loads’ torque characteristics.
Results of the statistical analysis based on Spearman correlation matrices revealed that the voltage magnitude exerts a greater influence on the efficiency and power factor for loads ranging between 40% and 80% of the motor output power.
Temperature is a critical parameter because it is related to the performance, lifespan, and maintenance frequency of permanent magnets and electric motors. Therefore, the impacts of different voltage magnitudes on temperature are presented and discussed. The results of the electrical analysis align with those of the thermal analysis, demonstrating that overvoltage leads to operating temperatures up to 7 °C higher than that in the case of undervoltage and 3 °C higher than that in the case of the nominal condition. This temperature difference can affect the lifespan of the LSPMM.
Notably, numerous motors operate at loads below their nominal capacity. An economic evaluation was conducted to assess the economic implications of VV in the LSPMM. The analysis considered consumers with a simple energy tariff and end users with a TOU pricing scheme. The evaluation quantifies the benefits and drawbacks of VV, with a particular emphasis on how undervoltage can generate cost savings. These savings may be substantial enough to cover the expenses of acquiring a new motor within the lifespan of the motor analyzed in this study, particularly for loads below 60%. Furthermore, the payback period is reduced when there is a differentiation in tariff costs.

Author Contributions

Conceptualization, J.M.T. and M.E.d.L.T.; methodology, J.M.T. and T.M.S.; software, L.C.d.S.J., A.R.A.M. and J.M.T.; validation, J.M.T., L.C.d.S.J. and E.O.d.M.; formal analysis, J.M.T., A.R.A.M. and U.H.B.; investigation, J.M.T., L.C.d.S.J. and E.O.d.M.; resources, M.E.d.L.T., U.H.B., T.M.S. and E.O.d.M.; data curation, J.M.T., A.R.A.M. and L.C.d.S.J.; writing—original draft preparation, J.M.T., L.C.d.S.J. and U.H.B.; writing—review and editing, U.H.B., M.E.d.L.T., E.O.d.M. and T.M.S.; supervision, U.H.B., A.R.A.M., M.E.d.L.T., E.O.d.M. and T.M.S.; funding acquisition, M.E.d.L.T. and E.O.d.M. All authors have read and agreed to the published version of the manuscript.

Funding

This research was funded by the Pro-Rectory of Research and Post-Graduate Studies-PROPESP/UFPA with call 01-2023 PAPQ-PROPESP.

Data Availability Statement

Data are contained within the article.

Acknowledgments

The authors are grateful for the support of The National Council for Scientific and Technological Development (CNPq), as well as thankful to the Paulo Freire+ program for the development of this study.

Conflicts of Interest

The authors declare no conflict of interest.

References

  1. IEC 60034-2-1:2014|IEC Webstore|Energy Efficiency, Smart City. Available online: https://webstore.iec.ch/publication/121 (accessed on 27 July 2022).
  2. de Almeida, A.T.; Fong, J.; Falkner, H.; Bertoldi, P. Policy Options to Promote Energy Efficient Electric Motors and Drives in the EU. Renew. Sustain. Energy Rev. 2017, 74, 1275–1286. [Google Scholar] [CrossRef]
  3. De Almeida, A.; Fong, J.; Brunner, C.U.; Werle, R.; Van Werkhoven, M. New Technology Trends and Policy Needs in Energy Efficient Motor Systems—A Major Opportunity for Energy and Carbon Savings. Renew. Sustain. Energy Rev. 2019, 115, 109384. [Google Scholar] [CrossRef]
  4. Electric Motors and Variable Speed Drives. Available online: https://ec.europa.eu/info/energy-climate-change-environment/standards-tools-and-labels/products-labelling-rules-and-requirements/energy-label-and-ecodesign/energy-efficient-products/electric-motors_en (accessed on 25 November 2022).
  5. Allan, J.T. The Effect of Voltage Variation on the Operation of Induction Motors. Trans. South Afr. Inst. Electr. Eng. 1929, 20, 137–155. [Google Scholar]
  6. Power Savings Obtained from Supply Voltage Variation on Squirrel Cage Induction Motors|IEEE Conference Publication|IEEE Xplore. Available online: https://ieeexplore.ieee.org/document/4763392 (accessed on 19 April 2023).
  7. Investigation of Voltage and Frequency Variation on Induction Motor Core and Copper Losses|IEEE Conference Publication|IEEE Xplore. Available online: https://ieeexplore.ieee.org/document/7934894 (accessed on 19 April 2023).
  8. Agamloh, E.B.; Peele, S.; Grappe, J. A Comparative Analysis of Voltage Magnitude Deviation and Unbalance on Standard and Premium Efficient Induction Motors. In Proceedings of the Conference Record of 2012 Annual IEEE Pulp and Paper Industry Technical Conference (PPIC), Portland, OR, USA, 17–21 June 2012; pp. 1–8. [Google Scholar]
  9. Bonnett, A.H. The Impact That Voltage and Frequency Variations Have on AC Induction Motor Performance and Life in Accordance with NEMA MG-1 Standards. In Proceedings of the Conference Record of 1999 Annual Pulp and Paper Industry Technical Conference (Cat. No.99CH36338), Seattle, WA, USA, 21–25 June 1999; pp. 16–26. [Google Scholar]
  10. Mendes, N.; Tabora, J.M.; de Lima Tostes, M.E.; Matos, E.O.d.; H.Bezerra, U.; Moura, P.; Mendes, J.; Ferreira, F.J.T.E.; de Almeida, A.T. ANN for Motor Loading Diagnosis under Voltage Variation Conditions. In Proceedings of the 2023 IEEE Kansas Power and Energy Conference (KPEC), Manhattan, KS, USA, 27–28 April 2023; pp. 1–6. [Google Scholar]
  11. Tabora, J.M.; Júnior, L.C.D.S.; Tostes, M.E.d.L.; Matos, E.O.d.; Bezerra, U.H. Efficient Electric Motors Performance Under Voltage Variation Conditions. In Proceedings of the 2023 IEEE Kansas Power and Energy Conference (KPEC), Manhattan, KS, USA, 27–28 April 2023; pp. 1–6. [Google Scholar]
  12. Kostic, M.; Ivanovic, M.; Minic, S. Reduction of Electric Energy Consumption in Induction Motor Drives by Setting Supply Voltage. In Proceedings of the 2012 2nd International Symposium On Environment Friendly Energies And Applications, Newcastle upon Tyne, UK, 25–27 June 2012; pp. 128–133. [Google Scholar]
  13. Zhao, K.; Cheng, L.; Zhang, C.; Nie, D.; Cai, W. Induction Motors Lifetime Expectancy Analysis Subject to Regular Voltage Fluctuations. In Proceedings of the 2017 IEEE Electrical Power and Energy Conference (EPEC), Saskatoon, SK, Canada, 22–25 October 2017; pp. 1–6. [Google Scholar]
  14. Wang, W.; Lu, Z. Analysis of Model Predictive Current-Controlled Permanent Magnet Synchronous Motor Drives with Inaccurate DC Bus Voltage Measurement. Energies 2020, 13, 353. [Google Scholar] [CrossRef]
  15. Lee, H.-J.; Shon, J.-G. Improved Voltage Flux-Weakening Strategy of Permanent Magnet Synchronous Motor in High-Speed Operation. Energies 2021, 14, 7464. [Google Scholar] [CrossRef]
  16. Sikora, A.; Zielonka, A.; Woźniak, M. Minimization of Energy Losses in the BLDC Motor for Improved Control and Power Supply of the System under Static Load. Sensors 2022, 22, 1058. [Google Scholar] [CrossRef] [PubMed]
  17. Sikora, A.; Woźniak, M. Impact of Current Pulsation on BLDC Motor Parameters. Sensors 2021, 21, 587. [Google Scholar] [CrossRef] [PubMed]
  18. World Energy Outlook 2019—Analysis. Available online: https://www.iea.org/reports/world-energy-outlook-2019 (accessed on 10 June 2022).
  19. de Almeida, A.T.; Ferreira, F.J.T.E.; Fong, J. Perspectives on Electric Motor Market Transformation for a Net Zero Carbon Economy. Energies 2023, 16, 1248. [Google Scholar] [CrossRef]
  20. de Souza, D.F.; Salotti, F.A.M.; Sauer, I.L.; Tatizawa, H.; de Almeida, A.T.; Kanashiro, A.G. An Assessment of the Impact of Brazilian Energy Efficiency Policies for Electric Motors. Energy Nexus 2022, 5, 100033. [Google Scholar] [CrossRef]
  21. Tabora, J.M.; Tshoombe, B.K.; Fonseca, W.d.S.; Tostes, M.E.d.L.; de Matos, E.O.; Bezerra, U.H.; Silva, M.d.O.e. Virtual Modeling and Experimental Validation of the Line-Start Permanent Magnet Motor in the Presence of Harmonics. Energies 2022, 15, 8603. [Google Scholar] [CrossRef]
  22. Ferreira, F.J.T.E.; Baoming, G.; de Almeida, A.T. Stator Winding Connection-Mode Management in Line-Start Permanent Magnet Motors to Improve Their Efficiency and Power Factor. IEEE Trans. Energy Convers. 2013, 28, 523–534. [Google Scholar] [CrossRef]
  23. Tabora, J.M.; de Lima Tostes, M.E.; de Matos, E.O.; Bezerra, U.H. Voltage Unbalance Amp; Variations Impacts on IE4 Class LSPMM. In Proceedings of the 2021 14th IEEE International Conference on Industry Applications (INDUSCON), São Paulo, Brazil, 15–18 August 2021; pp. 940–946. [Google Scholar]
  24. Tabora, J.M.; Vieira Bezerra, F.V.; Soares, T.M.; Ortiz de Matos, E.; de Lima Tostes, M.E.; Holanda Bezerra, U. Electric Motor Degradation Indicator in Non-Ideal Supply Conditions. In Proceedings of the 2023 IEEE Workshop on Power Electronics and Power Quality Applications (PEPQA), Cali, Colombia, 5–6 October 2023; pp. 1–5. [Google Scholar]
  25. IEC 60038:2009 | IEC Webstore | Rural Electrification, LVDC. Available online: https://webstore.iec.ch/publication/153 (accessed on 28 November 2022).
  26. Motors and Generators. Available online: https://www.nema.org/standards/view/motors-and-generators (accessed on 4 July 2022).
  27. Cui, J.; Kramer, M.; Zhou, L.; Liu, F.; Gabay, A.; Hadjipanayis, G.; Balasubramanian, B.; Sellmyer, D. Current Progress and Future Challenges in Rare-Earth-Free Permanent Magnets. Acta Mater. 2018, 158, 118–137. [Google Scholar] [CrossRef]
  28. Tshoombe, B.K.; Muñoz Tabora, J.; da Silva Fonseca, W.; Emília Lima Tostes, M.; de Matos, E.O. Voltage Harmonic Impacts on Line Start Permanent Magnet Motor. In Proceedings of the 2021 14th IEEE International Conference on Industry Applications (INDUSCON), São Paulo, Brazil, 16–18 August 2021; pp. 962–968. [Google Scholar]
  29. Minitab 18 Statistical Software; [Computer Software]; Minitab, Inc.: State College, PA, USA, 2010; Available online: https://www.minitab.com/ (accessed on 15 August 2019).
  30. Heumann, C. Introduction to Statistics and Data Analysis with Exercises, Solutions and Applications in R; Springer International Publishing: Berlin/Heidelberg, Germany, 2023. [Google Scholar]
  31. Farah, A. Livro—Curso de Probabilidades e Estatísticas Inferencial: Teoria e Prática; Instituto de Engenharia: São Paulo, Brazil, 2018. [Google Scholar]
  32. Spearman’s Rank-Order Correlation—A Guide to When to Use It, What It Does and What the Assumptions Are. Available online: https://statistics.laerd.com/statistical-guides/spearmans-rank-order-correlation-statistical-guide.php (accessed on 16 June 2020).
  33. Minitab. A Comparison of the Pearson and Spearman Correlation Methods; Minitab 18, Support; Minitab, Inc.: State College, PA, USA, 2018. [Google Scholar]
  34. Dincer, I.; Abu-Rayash, A. Chapter 6—Sustainability Modeling. In Energy Sustainability; Dincer, I., Abu-Rayash, A., Eds.; Academic Press: Cambridge, MA, USA, 2020; pp. 119–164. ISBN 978-0-12-819556-7. [Google Scholar]
Figure 1. Three-phase nominal voltage by region for a nominal 220 V LSPMM in a delta connection.
Energies 17 00008 g001
Figure 2. Line-start permanent magnet: (a) Component description in the first panel and (b) magnetic flux lines [28].
Energies 17 00008 g002
Figure 3. Experimental input current as a function of load for 0.75 kW: (a) IE4 Class LSPMM and (b) IE3 Class SCIM motor at nominal voltage and frequency conditions.
Energies 17 00008 g003
Figure 4. General test setup.
Energies 17 00008 g004
Figure 5. Methodology flowchart.
Energies 17 00008 g005
Figure 6. Experimental input current as a function of load at different voltage magnitudes.
Energies 17 00008 g006
Figure 7. LSPMM under VV conditions. (a) Active power and (b) current total harmonic distortion.
Energies 17 00008 g007
Figure 8. Experimental power factor as a function of load under VV conditions.
Energies 17 00008 g008
Figure 9. Ridgeline plot of power factor under VV conditions for the LSPMM.
Energies 17 00008 g009
Figure 10. Contour plots for power factor variation with power and load for IE4 Class motor with (a) 0.90 p.u., (b) 1.00 p.u., and (c) 1.05 p.u.
Energies 17 00008 g010
Figure 11. Experimental efficiency as a function of load under VV conditions.
Energies 17 00008 g011
Figure 12. Correlation matrix between voltage magnitude and input parameters in the LSPMM for (a) output load between 0% and 30%, (b) output load between 40% and 70%, and (c) output load between 80% and 125%.
Energies 17 00008 g012
Figure 13. Consumption as a function of voltage magnitude under different load conditions.
Energies 17 00008 g013
Figure 14. Representation of the time-of-use tariff pricing scheme considered in the economic analysis.
Energies 17 00008 g014
Figure 15. Payback for the initial cost of a new motor by changing the LSPMM voltage supply level: (a) without considering the TOU; (b) considering the TOU.
Energies 17 00008 g015
Figure 16. Frame temperature variation in the LSPMM under VV conditions. Frontal temperature with (a) 0.90 p.u., (b) 1.00 p.u., and (c) 1.10 p.u.
Energies 17 00008 g016
Figure 17. Frame temperature variation in the LSPMM under VV conditions. Lateral temperature with (a) 0.90 p.u., (b) 1.00 p.u., and (c) 1.10 p.u.
Energies 17 00008 g017
Figure 18. Measured absolute temperature under VV conditions: (a) lateral view; (b) frontal view.
Energies 17 00008 g018
Table 1. Line-start permanent-magnet motor parameters.
Induction Motor ClassIE4 Class LSPMM
Power0.75 kW
Voltage220/380 V
Speed (rpm)1800
Current (A)3.08/1.78
Efficiency (%)87.4
Power factor 0.73
Disclaimer/Publisher’s Note: The statements, opinions and data contained in all publications are solely those of the individual author(s) and contributor(s) and not of MDPI and/or the editor(s). MDPI and/or the editor(s) disclaim responsibility for any injury to people or property resulting from any ideas, methods, instructions or products referred to in the content.

