Review

A Reviewed Turn at of Methods for Determining the Type of Fault in Power Transformers Based on Dissolved Gas Analysis

by
Ancuța-Mihaela Aciu
1,
Sorin Enache
2 and
Maria-Cristina Nițu
1,*
1
Research and Development Department, National Institute for Research, Development and Testing in Electrical Engineering-ICMET Craiova, 200746 Craiova, Romania
2
Faculty of Electrical Engineering, University of Craiova, 200440 Craiova, Romania
*
Author to whom correspondence should be addressed.
Energies 2024, 17(10), 2331; https://doi.org/10.3390/en17102331
Submission received: 25 March 2024 / Revised: 26 April 2024 / Accepted: 9 May 2024 / Published: 12 May 2024
(This article belongs to the Section F: Electrical Engineering)

Abstract

:
Since power transformers are the most important pieces of equipment in electricity transmission and distribution systems, special attention must be paid to their maintenance in order to keep them in good condition for a long time. This paper reviews the main steps in the process of diagnosing the health of power transformer insulation, which involves the science of analysing the gases dissolved in power transformer oil for effective identification of faults. An accurate diagnosis of incipient faults is favourable to sustainable development and necessary to maintain a reliable supply of electricity. The methods presented for fault diagnosis in mineral-oil-immersed power transformers are divided into analytical and graphical methods and have been found to be simple, economical and effective. After describing the methods, both their strengths and weaknesses were identified, and over the years, the methods were complemented to provide highly accurate information, validated by field inspections. This paper focuses on practical information and applications to manage maintenance based on accurate and up-to-date data. The contents of this paper will be of particular use to engineers who manufacture, monitor and/or use high-power transformers in the energy sector, as well as to undergraduate, master’s and PhD students interested in such applications.

1. Introduction

In the structure of electricity transmission and distribution networks, the most economically important piece of equipment is the power transformer. Its failure will not only affect consumers in the form of a lack of electricity but also the grid itself in terms of huge financial costs due to disruption and costly repairs. It is therefore essential that special attention is paid to transformer maintenance to ensure a reliable power supply [1,2].
Good monitoring of the operating conditions of a power transformer can prevent possible power transformer failures by eliminating the causes that interfere with the operation of the transformer. Power transformer monitoring is an economically useful tool for both power distribution companies and power generation companies. Through the monitoring process and the application of proper maintenance management, the transformer can be maintained in the optimal operating conditions, with parameters that indicate its health being maintained in a viable state. It is therefore advisable to detect (early) faults in transformers, whether electrical or thermal, as early as possible in the operation and maintenance of electricity networks [3].
Over time, several techniques have been proposed to diagnose the condition of power transformers based on measurements and analysis of the insulating oil [4,5]. Of these, dissolved gas analysis (DGA) is the best known and the most commonly used method for detecting incipient faults in power transformers. This method was developed in the 1980s and is also used to diagnose other oil-filled equipment (instrument transformers, bushings, tap changers, shunt reactors, etc.) [6]. The popularity and widespread use of this method is due to the fact that it is non-invasive and can be used for real-time monitoring [7,8].
This method is based on periodic sampling of insulating oil from the transformer and identification and quantification of the gases dissolved in it using gas chromatography (discovered in the 1940s) [9]. The data obtained must be interpreted using a diagnostic criterion to identify the type of fault (electrical or thermal) on which the transformer condition assessment is based [10,11,12].
When the transformer begins to fail due to thermal and/or electrical stresses, various processes of degradation of the mixed (paper–oil) insulation system of the transformer occur through the generation of gases that dissolve in the transformer oil. The gases dissolved in the oil are hydrogen (H2), methane (CH4), ethane (C2H6), ethylene (C2H4) and acetylene (C2H2). Carbon monoxide (CO) and carbon dioxide (CO2) will also be present in significant quantities when the cellulose insulation is degraded or in small traces from the surrounding atmosphere when the oil itself is degraded [13,14,15].
Considering that gas production is favoured by the temperature level and/or the energy generated by the fault, several methods have been proposed in the literature to predict the occurrence of faults and to determine their type by interpreting the gas concentration detected in the transformer oil [16,17,18]. Therefore, several committees and organisations, such as the International Electrotechnical Commission (IEC) [19], the Institute of Electrical and Electronics Engineers (IEEE) [20] and the International Council on Large Electric Systems (CIGRE) [21], provide guidelines for the interpretation of DGA.
This paper reviews the main steps in the process of diagnosing the health of power transformer insulation, involving the DGA technique in diagnosing the condition of power transformers immersed in mineral oil, from oil sampling to analysis of the results obtained.
The paper describes the development of the main techniques/methods implemented in international standards, providing general information on the evolution of research in this field, including the development of AI techniques to reduce the diagnostic times and optimise the application of informed and timely decisions [22,23,24,25,26,27,28,29,30,31,32,33,34,35,36].
DGA-based methods for analysing the health of transformer mixed insulation systems are an important element in maintaining a sustainable energy system due to the fact that a precise diagnosis of incipient faults is appropriate for sustainable development and necessary in guaranteeing a supply of electrical energy to users and consumers [22]. Besides DGA-based methods are other techniques for identifying the defects that appear in power transformers, focused on frequency response analysis (FRA), acoustic fingerprinting, ultrasound, spectrofluorimetry and Fourier transform infrared spectroscopy (FTIR) [37,38,39,40,41,42].
The structure of this work is as follows: Section 2 presents the mechanism of fault gas formation in transformers immersed in mineral oil. Analytical and graphical methods for fault diagnosis in power transformers are described in Section 3 and Section 4, respectively. Section 5 presents the improved performance of DGA-based fault diagnosis methods, and Section 6 presents conclusions and future approaches.

2. Gas Formation Mechanism in Oil-Immersed Transformers

In power transformers, mineral oils are used, whose chemical composition is a mixture of hydrocarbon molecules with chemical groups as follows: a methyl radical (CH3•), a methylene radical (CH2•) and a methine group (=CH–) or methine bridge, linked by carbon–carbon (C–C) molecular bonds [15,19].
During operation, power transformers are subjected to a range of electrical, thermal, oxidative and mechanical stresses. Under the action of thermal and electrical stresses, a series of C–H and C–C bonds break (split), forming unstable fragments, either in ionic form (hydrogen and carbon ions) or in radial form, which react rapidly to form the gas molecules H2, CH4, C2H6, C2H4, C2H2, propane (C3H8), propylene (C3H6), etc., or they recombine to form new condensable molecules in the form of solid carbon particles and hydrocarbon polymers (such as X-wax). Small amounts of CO and CO2 are produced when the oil is oxidised.
Since gas production depends on temperature, the outgassing speed of each gas can be estimated at any temperature, so the relationships between gas production and temperature have been established for each hydrocarbon gas concentration as follows [12]:
  • H2 and CH4 concentrations start to form at temperatures around 150 °C;
  • H2 continues to increase with increasing temperature;
  • At ~250 °C, C2H6 starts to form;
  • At ~350 °C, C2H4 starts to form;
  • Between 200 °C and 300 °C, CH4 production exceeds H2 production;
  • At temperatures above ~275 °C, C2H6 production exceeds CH4 production;
  • At a temperature between 500 °C and 700 °C, C2H2 formation starts and continues to increase so that at a temperature of ~800 °C, it has the highest concentration compared to the other gases;
  • From ~455 °C to ~750–800 °C, H2 production exceeds other gases.
It should be noted that after the peaks are reached, the production of CH4, C2H6 and C2H4 decreases with increasing temperature [21].
Thermal stress also degrades the cellulose insulation, resulting in the formation of carbon oxides (CO and CO2), which are dissolved in the oil in large quantities.
Transformer oil also contains dissolved oxygen (O2) and nitrogen (N2). Their presence is either due to the oxidation of the oil as a result of overheating or contact with atmospheric air in the free-breathing transformer conservator or to air entering the equipment through leaks [19,20,21].
Additional sources of gas may be the result of other chemical side reactions, such as rusting of uncoated surfaces, steel or protective paints [20].
Following several studies on the different concentrations of dissolved gases in transformer oil, several methods have been developed to predict and define the type of transformer failure based on analysis of the composition and volume of gases dissolved in the oil.
The six most important types of major transformer faults have been defined and classified in the IEC and IEEE standards [19,20] as follows:
  • PD—Partial discharge;
  • D1—Low energy discharge;
  • D2—High energy discharge;
  • T1—Thermal failure at low temperature T < 300 °C;
  • T2—Thermal failure at medium temperature 300 °C < T < 700 °C;
  • T3—Thermal failure at high temperature T > 700 °C.
The methods presented in this paper are applicable only to transformers immersed in mineral oil.
Currently, all the diagnostic methods using dissolved gas analysis differ in terms of the type of diagnosis (analytical and/or graphical), the diagnostic criteria used and, not least, the number of defects detected.

3. Analytical Methods for Fault Diagnosis

Analytical diagnostic methods are based on correlating the values of ratios of fault gas concentrations to fault types based on fault type codes.
The IEC and IEEE standards [19,20] propose a few methods for DGA technique interpretation based on the ratios of gases dissolved in oil, which are briefly presented in this section.

3.1. Key Gas Method

This method is substantiated on the principle of signaling a fault when producing gases that exceed the value limits considered normal in the degradation of the insulation system; the gas that defines the fault is called the key gas and is predominant in relation to the rest of the dissolved gases in classic formations of faults.
The main gas faults that can be detected using this method are shown in Table 1 [4,6].
According to this method, a transformer can operate safely even if an imminent hazard has been identified, provided that the rate of generation of the associated key gas does not constantly increase. For these reasons, this method is not widely used for diagnosing a transformer’s condition [9,20].

3.2. The Doernenburg Ratio Method

This method was proposed in 1974 and used for the recognition of incipient faults using the technique of key gas ratios (H2, CH4, C2H6, C2H4 and C2H2) [9].
The principle of the method is that if one of the key gases exceeds double the reference value presented in Table 2, or if CO or C2H6 exceeds the reference value, a fault is established and then analysed according to Table 3.

3.3. Rogers and IEC Ratio Methods

Both the Rogers ratio method proposed by IEEE Std.C57.104 [20] and the IEC ratio method (IEC 60599 [19]) use the same gas ratios (C2H2/C2H4, CH4/H2 and C2H4/C2H6). Ranges of the reported values and related defect types for these two methods are shown in Table 4 and Table 5 [23].
The IEC 60599:2022 standard recommends that if the ranges of the reported values do not fall inside the limit ranges and do not correspond to the types of faults, a two- or three-dimensional plot of the quantities of the dissolved gases should be used, because the type of fault can be precisely the area close to the undiagnosed case. Using a Cartesian representation of the IEC ratio method, it can be seen that faults D1 and D2 overlap. Although these are both cases of energy discharge, misinterpretation of the intensity of the fault type can occur. In conclusion, one of the main disadvantages of these techniques consists of the fact that the gas proportion obtained does not fall within the specific domain of values, leading to an inconclusive diagnosis of the defect [23].

3.4. TRT (Three Ratio Technique)

In 2018, Gouda et al. [24] proposed a new diagnostic technique, the three ratio technique (TRT). This method uses three new combinations of gas ratios to more clearly classify fault types and severity (Table 6). These ratios are:
R 1 = C 2 H 6 + C 2 H 4 H 2 + C 2 H 2
R 2 = C 2 H 2 + C H 4 C 2 H 4
R 3 = C 2 H 2 C 2 H 4
Like the other gas ratio methods, this technique is used when the concentration of at least one gaseous hydrocarbon exceeds the normal limits given in Table 2.
Table 7 shows the corresponding fault types for the different code combinations of the TRT’s diagnosis.
According to [24], this TRT has an accuracy of 99.86%, compared to 85.67% for the Duval triangle 1 method, 75.08% for the Doernenburg method, 47.34% for the IEC method and 39% for the Rogers method, based on 688 cases analysed.

3.5. Other Methods Using Ratios for Diagnosis

3.5.1. Single Gas Ratio Method

The international standards [19,20] propose as complementary methods for the diagnosis of defects in transformers three single gas reports (CO2/CO, O2/N2 and C2H2/H2) to the previously presented methods [23].
The values of the carbon oxide concentration and the CO2/CO ratio indicate the involvement of cellulose insulation in a diagnosed transformer fault. However, according to the latest analysis by experts from the CIGRE, IEC and IEEE working groups, the involvement of cellulose insulation in faults will be confirmed not only on the basis of CO and CO2 but also through analysis of other gases or other types of oil analysis (e.g., analysis of furan compounds and analysis of low-molecular-weight alcohols such as methanol and ethanol).
A normal value of the O2/N2 ratio differs depending on the following factors: the type of transformer, the load and the conservation system used. The experts of the CIGRE have determined that all nitrogen blanket transformers and about 60% of the membrane-sealed types have an O2/N2 ratio < 0.2, and all free breathing transformers and the remaining 40% of the membrane-sealed types have an O2/N2 ratio > 0.2.
The C2H2/H2 ratio values for power transformers equipped with on-load tap-changers (OLTCs) give information on the possibility of the contamination of the oil in the main tank with oil or gas from the OLTC. In this situation, the interpretation of the DGA results of the oil in the main tank must be undertaken by subtracting the dissolved gas values from the OLTC, or the analysis is considered inconclusive.

3.5.2. C3 Hydrocarbon Method

The previously presented methods of interpretation for DGA only consider C1 and C2 hydrocarbons. More recently, some methods used in practice also use C3 hydrocarbons, which specialists in the field consider useful for a more accurate diagnosis.
CIGRE specialists have presented detailed fault identification methods using C3 hydrocarbons in [21]. Therefore, we can say that the additional C3H6/C3H8 and C2H4/C3H8 ratios are applied to confirm the temperature domains for thermal defects (Table 8).
In conclusion, ratio-based methods can only be used if the gases used in the ratio are of a significant quantity (above the limits imposed by the standards). Otherwise, these methods will result in “Fault not identified” because the values of the domain are not in the specific range and the type of failure cannot be determined [8]. These techniques also have the major disadvantage of not allowing a decision to be made in some cases that fall outside the specified codes.

4. Graphical Fault Diagnosis Methods

Graphical diagnostic methods are based on a graphical representation (triangle, square, pentagon, etc.), where the different types of defects are visualised using specific areas of a graph. Each side of these graphs represents the relative proportion of concentrations or combinations of key gases. Some graphical methods use gas ratio values as coordinates of the diagnosed object.
The following is a brief overview of graphical methods for fault diagnosis in power transformers.

4.1. Triangle-Based Graphical Diagnostic Methods

4.1.1. Duval Triangle

In 1974, to overcome the shortcomings of fault diagnosis methods based on gas ratios, Michel Duval, a researcher at Hydro Quebec, developed a triangular graphical representation to visualise the different types of faults in power transformers immersed in mineral oil, called the Duval triangle or triangle 1.
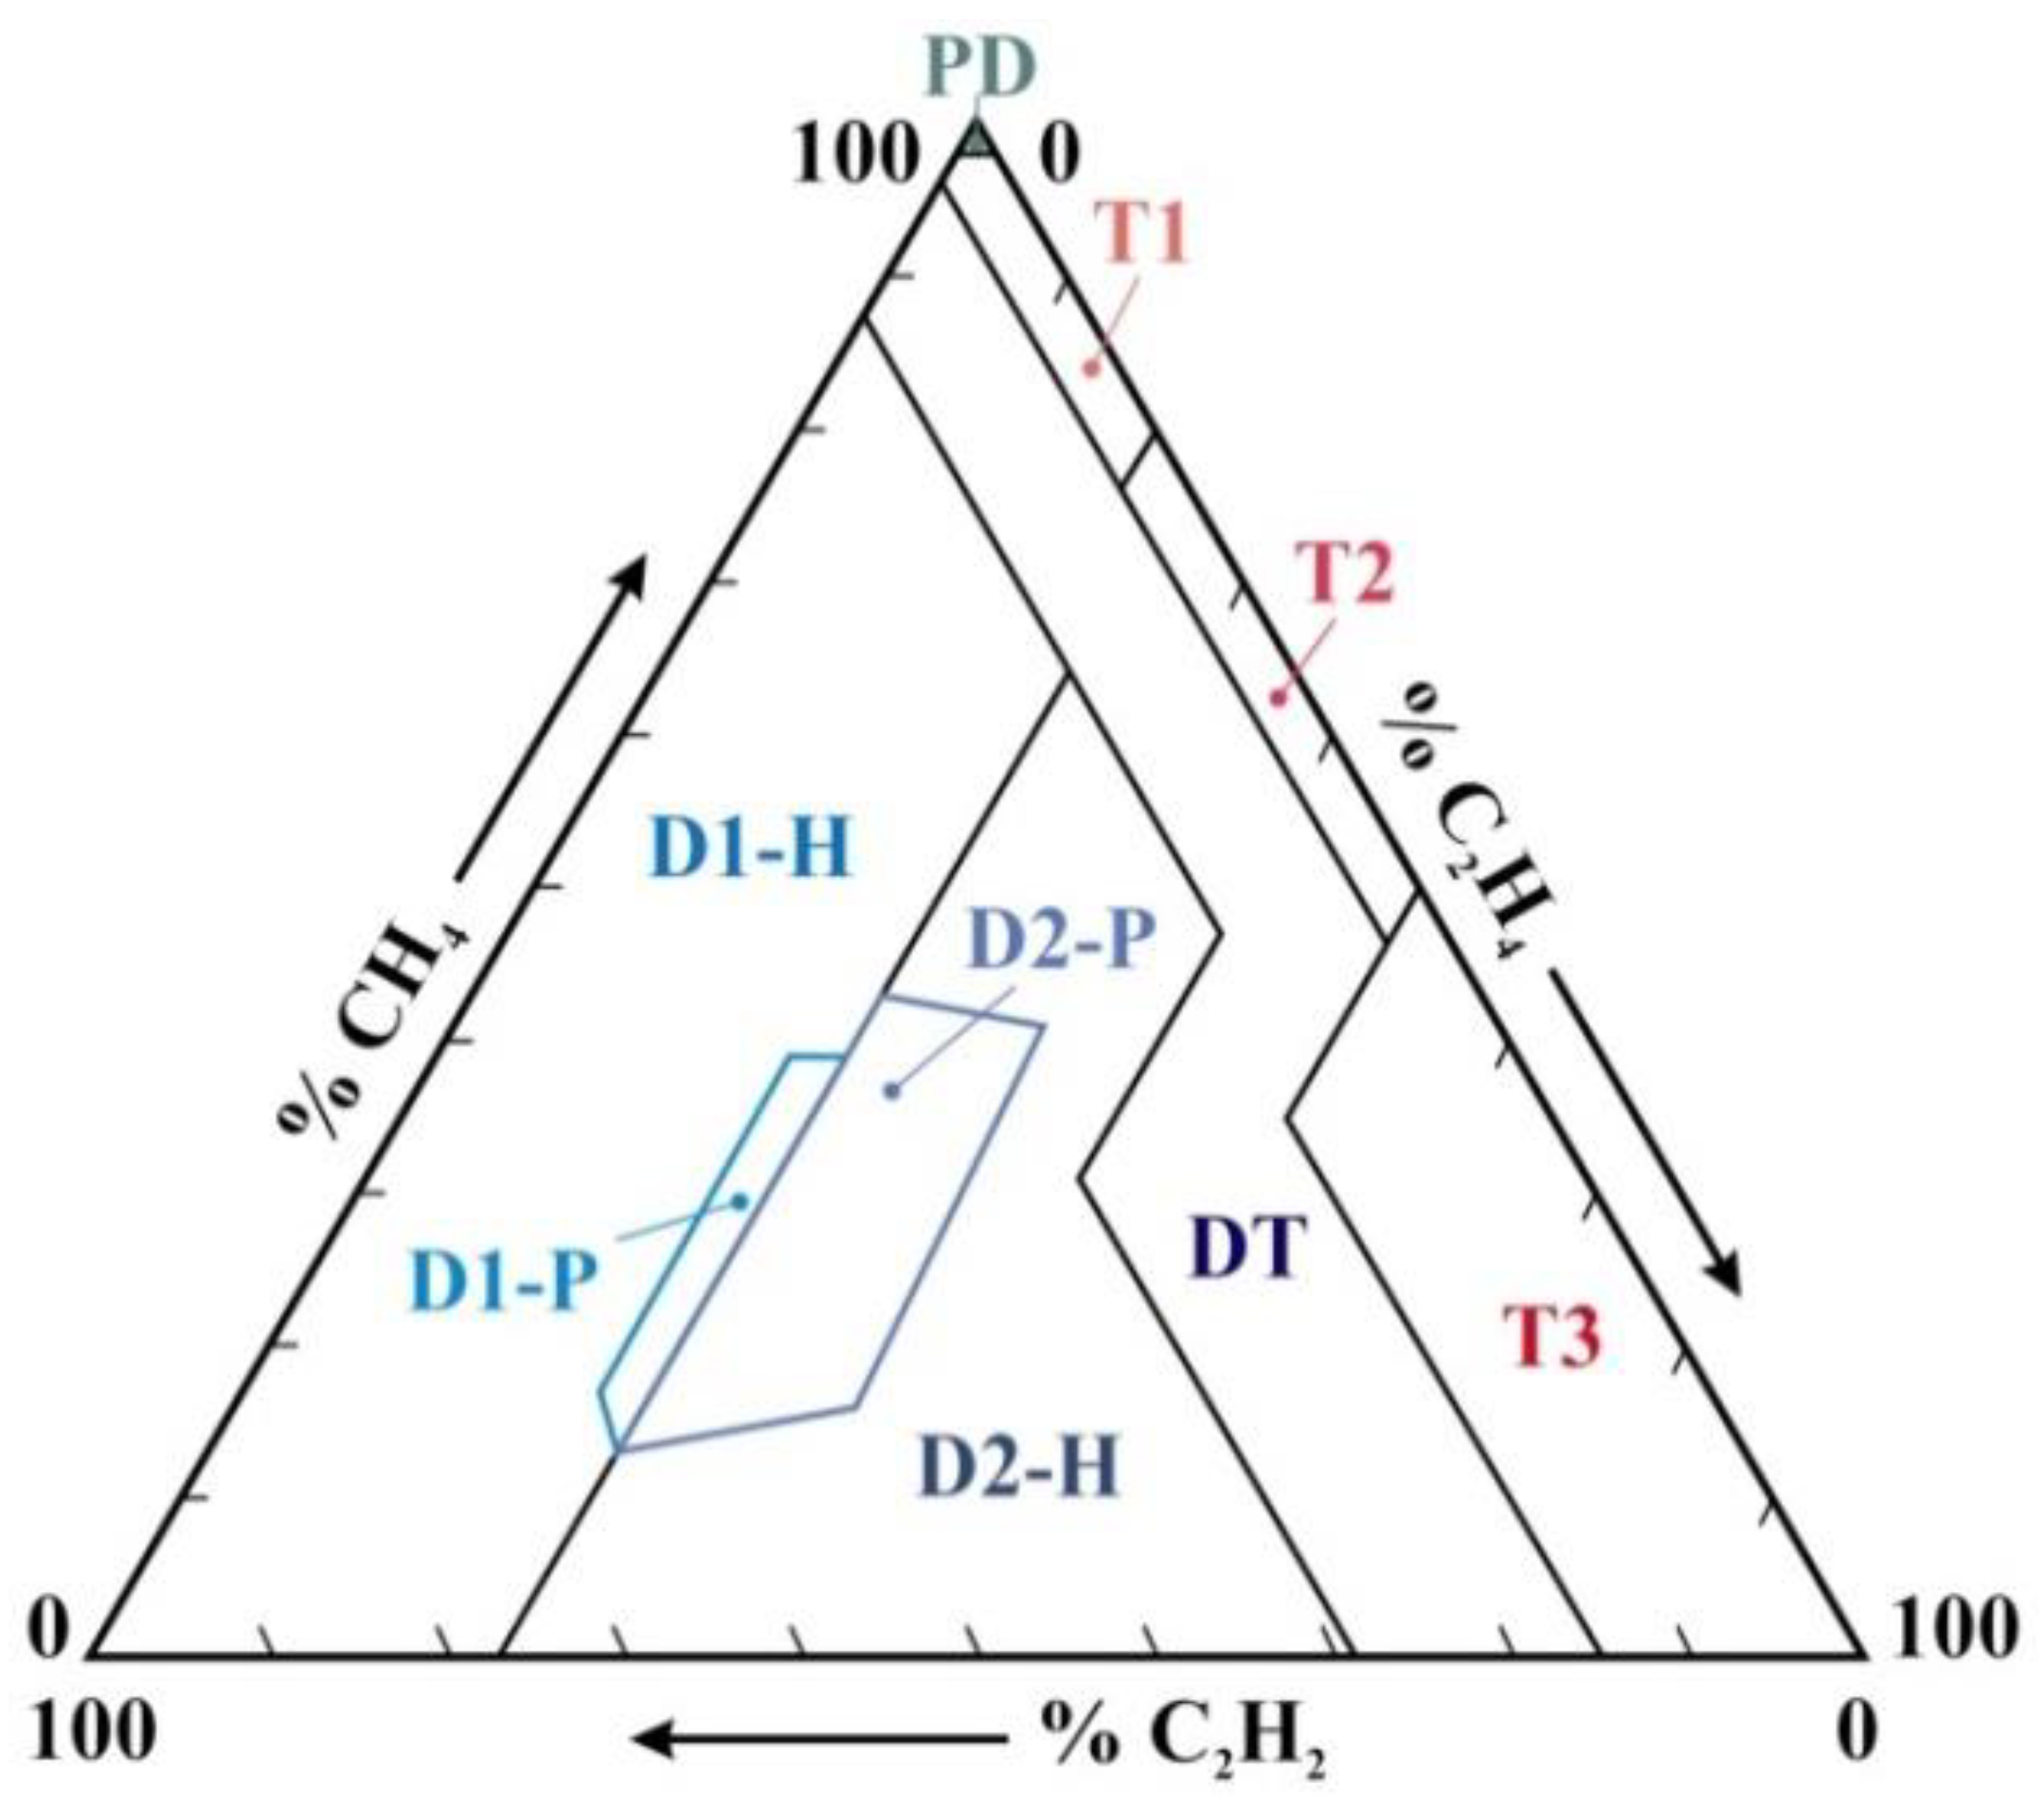
This method is based on the values of the concentrations of the three gases CH4, C2H4 and C2H2, which also correspond to increasing levels of their formation, expressed as percentages of their sum (each part of the triangle represents the corresponding percentage of the three gases from 0% to 100%). The intersection of these percentages determines the location of a point within the equilateral triangle, which is divided into areas of faults that may occur in transformers in service (Table 9), as shown in Figure 1 [23].
The simplicity and robustness of this method have led to its widespread use for dissolved gas analysis in mineral-oil-filled transformers and even its inclusion in the standards [19,20].
Although the Duval triangle 1 method is effective in determining the main faults occurring in transformers immersed in mineral oil, in operation, it has been supplemented by two further Duval triangles (triangles 4 and 5), which should not be used for the D1 and D2 faults identified using Duval triangle 1.
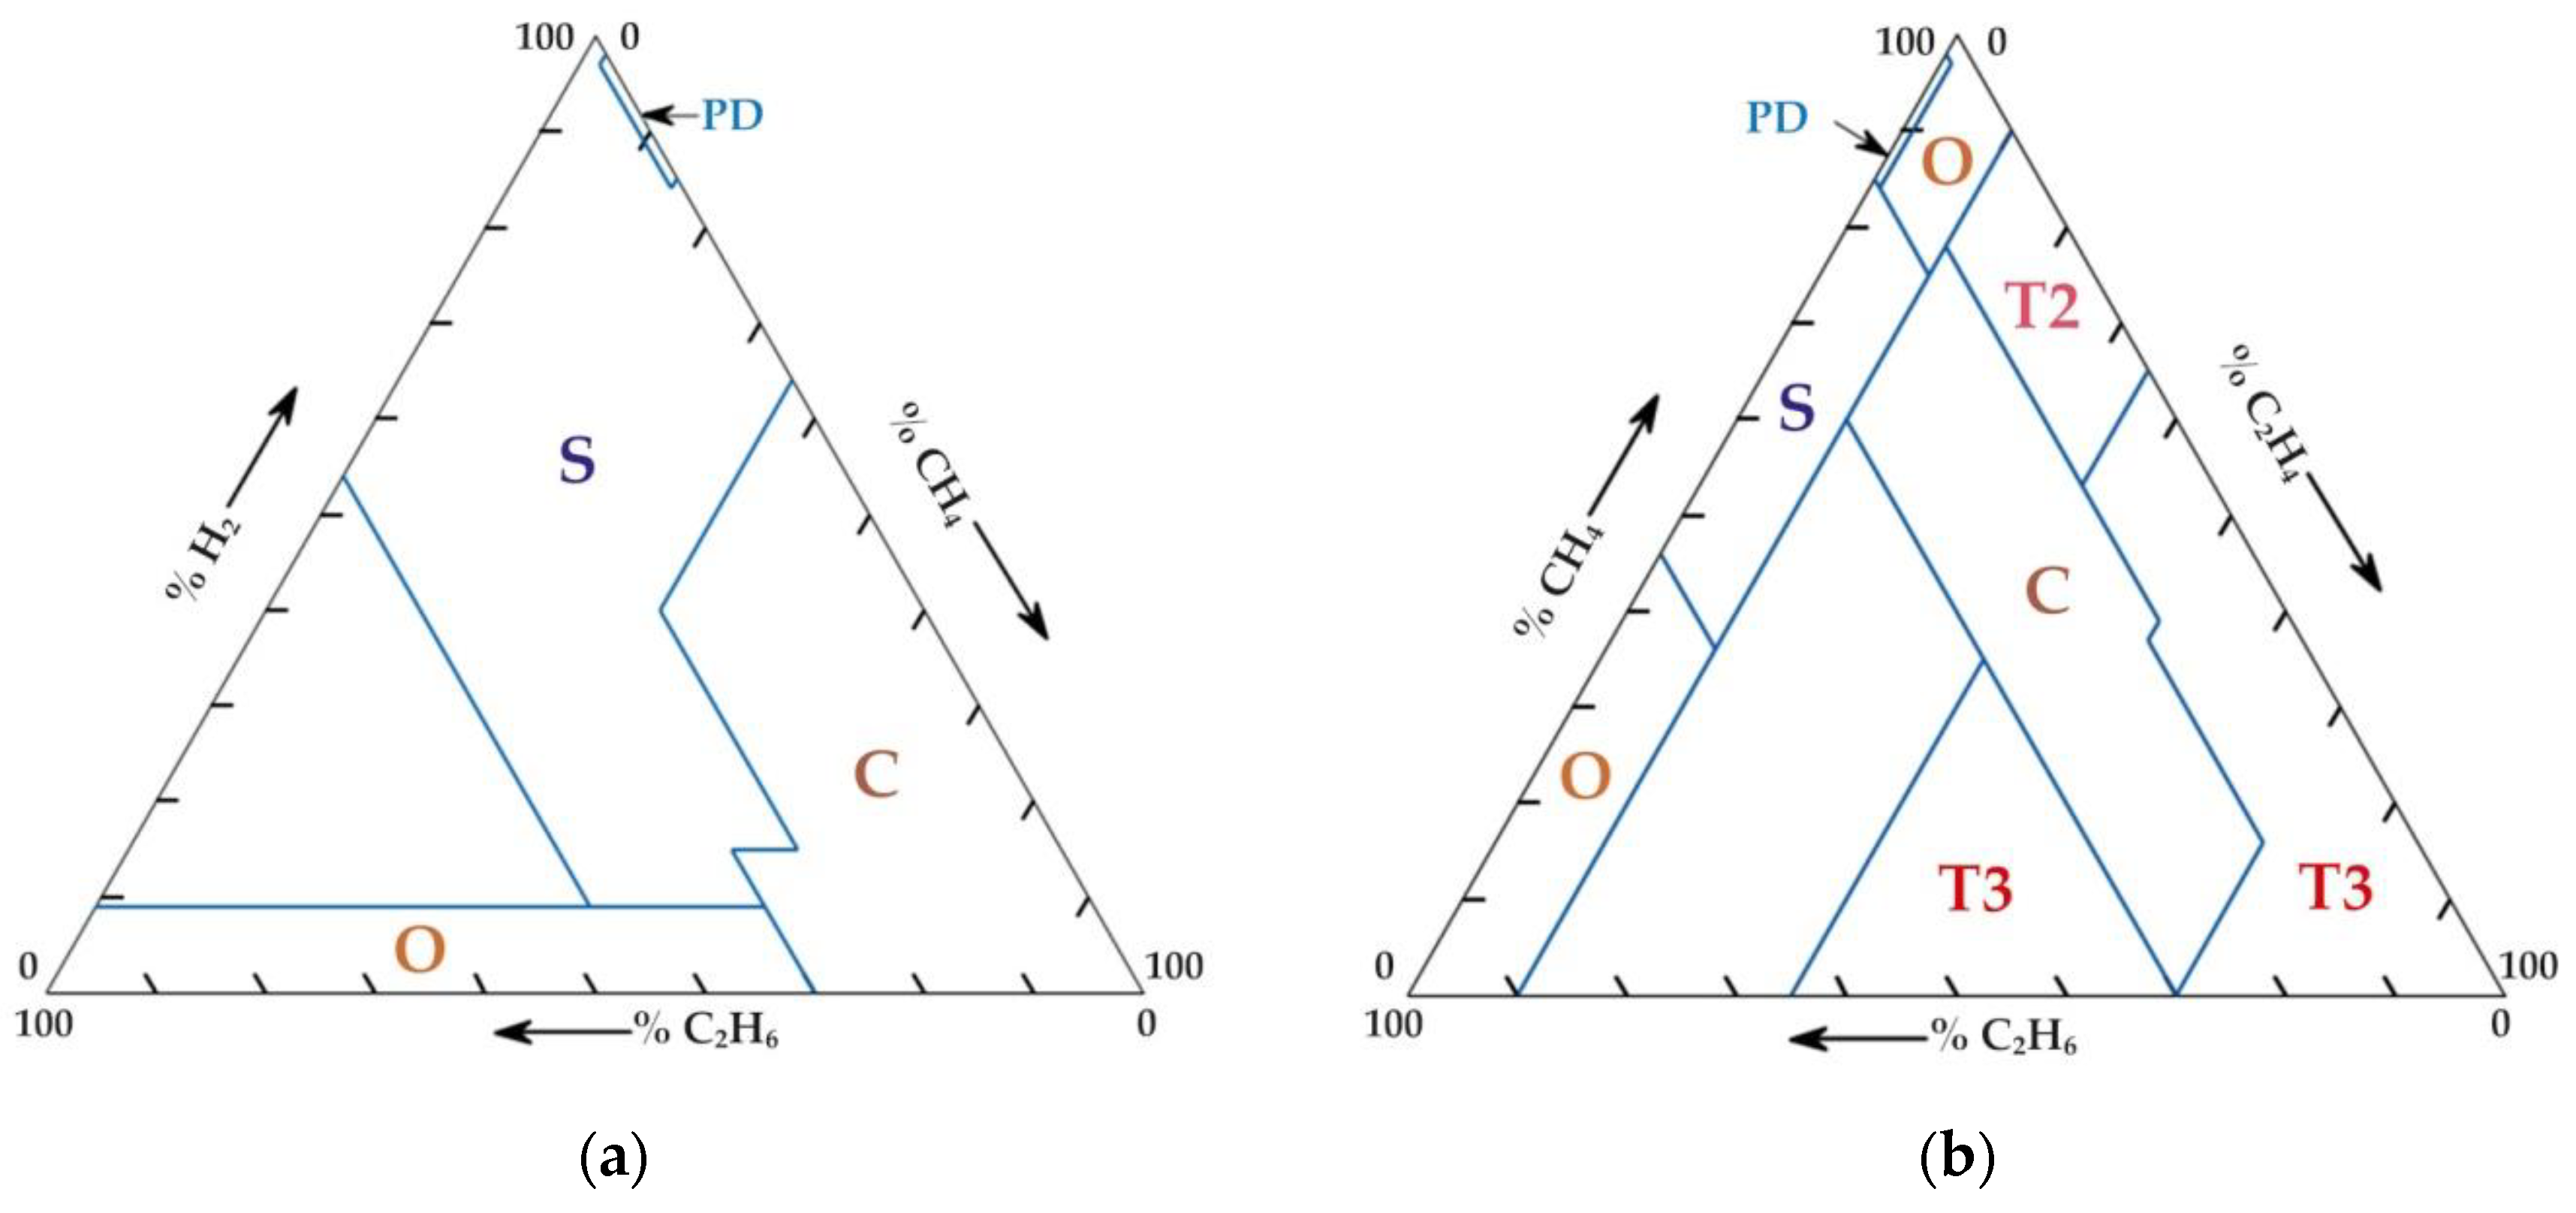
If low-energy and low-temperature faults such as PD, T1 or T2 are identified using Duval triangle 1, Duval triangle 4 is used to obtain more information, using the so-called “low-energy-consumption gases”: H2, CH4 and C2H6. And when Duval triangle 1 identifies high- and very high-temperature thermal faults, for more information, and to indicate faults with insecurity after using Duval triangle 4, Duval triangle 5 is used based on the “temperature gases”: C2H4, CH4 and C2H6.
Graphical representations of these two triangles are shown in Figure 2, and the definition of the fault areas in these triangles is shown in Table 10 [23].
In 2008, Michel Duval presented in his paper [25] Duval triangle 2 for mineral-oil-insulated on-load tap-changer compartments, where normal operation involves arcing in oil, and Duval triangle 3 for transformers filled with alternating oil (such as natural or synthetic esters and silicones), such as BIOTEMP, silicone, MIDEL and FR3. Subsequently, Duval triangle 3 for FR3 oils is complemented by Duval triangles 6 and 7, which are used to obtain additional information on faults identified using Duval triangle 3 as low-temperature faults (PD, T1 or T2) and thermal faults (T1, T2 or T3), respectively.
Considering that the most dangerous transformer failures are arcing in the cellulose insulation and thermal charring of the paper in the windings, as these can lead to catastrophic transformer failures, Duval identified new sub-areas in Duval triangle 1 [26], published in 2022, and Duval triangle 5 [27], published in 2023. They allow maintenance efforts to be focused on transformers by helping operators to establish whether the transformer necessitates urgent maintenance actions or repairs or being taken out of service.
The new sub-areas in Duval triangle 1 (Figure 3) make it possible to specify whether arc faults D1 and D2 in operating transformers are in paper or oil. These new sub-areas are as follows:
  • Faults caused by low-energy (D1-P) and high-energy (D2-P) arcs in the cellulose insulation of transformers;
  • Faults caused by low-energy (D1-H) and high-energy (D2-H) arcing in transformer insulating oil.
In general, oil arcing is considered to be much less harmful than paper arcing. However, some arcs in oil may be of concern and require further investigation, especially if the C2H2 concentrations are significant or high, until their exact location is found.
If, following the DGA, defects of a thermal nature involving cellulose insulation (and its carbonisation) are detected, determination of the location of the defect is indicated. This situation is signaled by the concentration levels of C2H4, which are defined as warning indicators in the production of thermal defects with paper carbonisation.
The new sub-areas in Duval triangle 5 (Figure 4) help to distinguish between paper carbonisation C faults in transformers, e.g., in cables, on the outside of windings and between winding turns or inner windings. This can also be carried out using acoustic tests, but these involve high costs and only apply to a limited number of transformers.
The sub-areas indicating paper carbonisation C faults are defined as follows in Table 11.
The typical and pre-fault ethylene (C2H4) concentration values for each type of paper carbonisation thermal fault are given in CIGRE Technical Bulletin 771:2019 [21]. These values can be used to determine whether there are still acceptable stresses (below 90% of the typical values) or confirmed, potentially more dangerous faults (above the typical and pre-fault values).
Duval triangles 1 and 5, updated as described above, provide additional information on the cause of gas formation and are both proposed for a new way of interpreting the position of points in certain areas of the triangles and an aid to users in managing the maintenance of oil-immersed power transformers.

4.1.2. Gouda Triangle

In the paper [12] published in 2019, Gouda et al. proposed a new technique consisting of a triangular graphic representation using three new gas concentration ratios converted into three percentage ratios, taking into account all five key gases (H2, CH4, C2H6, C2H4 and C2H2). The purpose of this new technique was to resolve the inconsistencies that occur in Duval triangle 1 (ethane and hydrogen were not included in the Duval triangle, despite their importance in diagnosing certain types of faults) and other traditional techniques.
The five hydrocarbon fuel gases are organised into the new three gas ratios according to the following formulae:
R 1 = C H 4 C H 4 + C 2 H 6 + C 2 H 4 + C 2 H 2
R 2 = C 2 H 2 H 2 + C H 4 + C 2 H 6 + C 2 H 4
R 3 = C 2 H 4 H 2 + C H 4 + C 2 H 6 + C 2 H 2
These gas ratios are converted into triangular coordinates before being plotted in a triangle. The relative proportions of these gas ratios can then be determined separately using the following equations:
P 1 = R 1 × 100 S
P 2 = R 2 × 100 S
P 3 = R 3 × 100 S
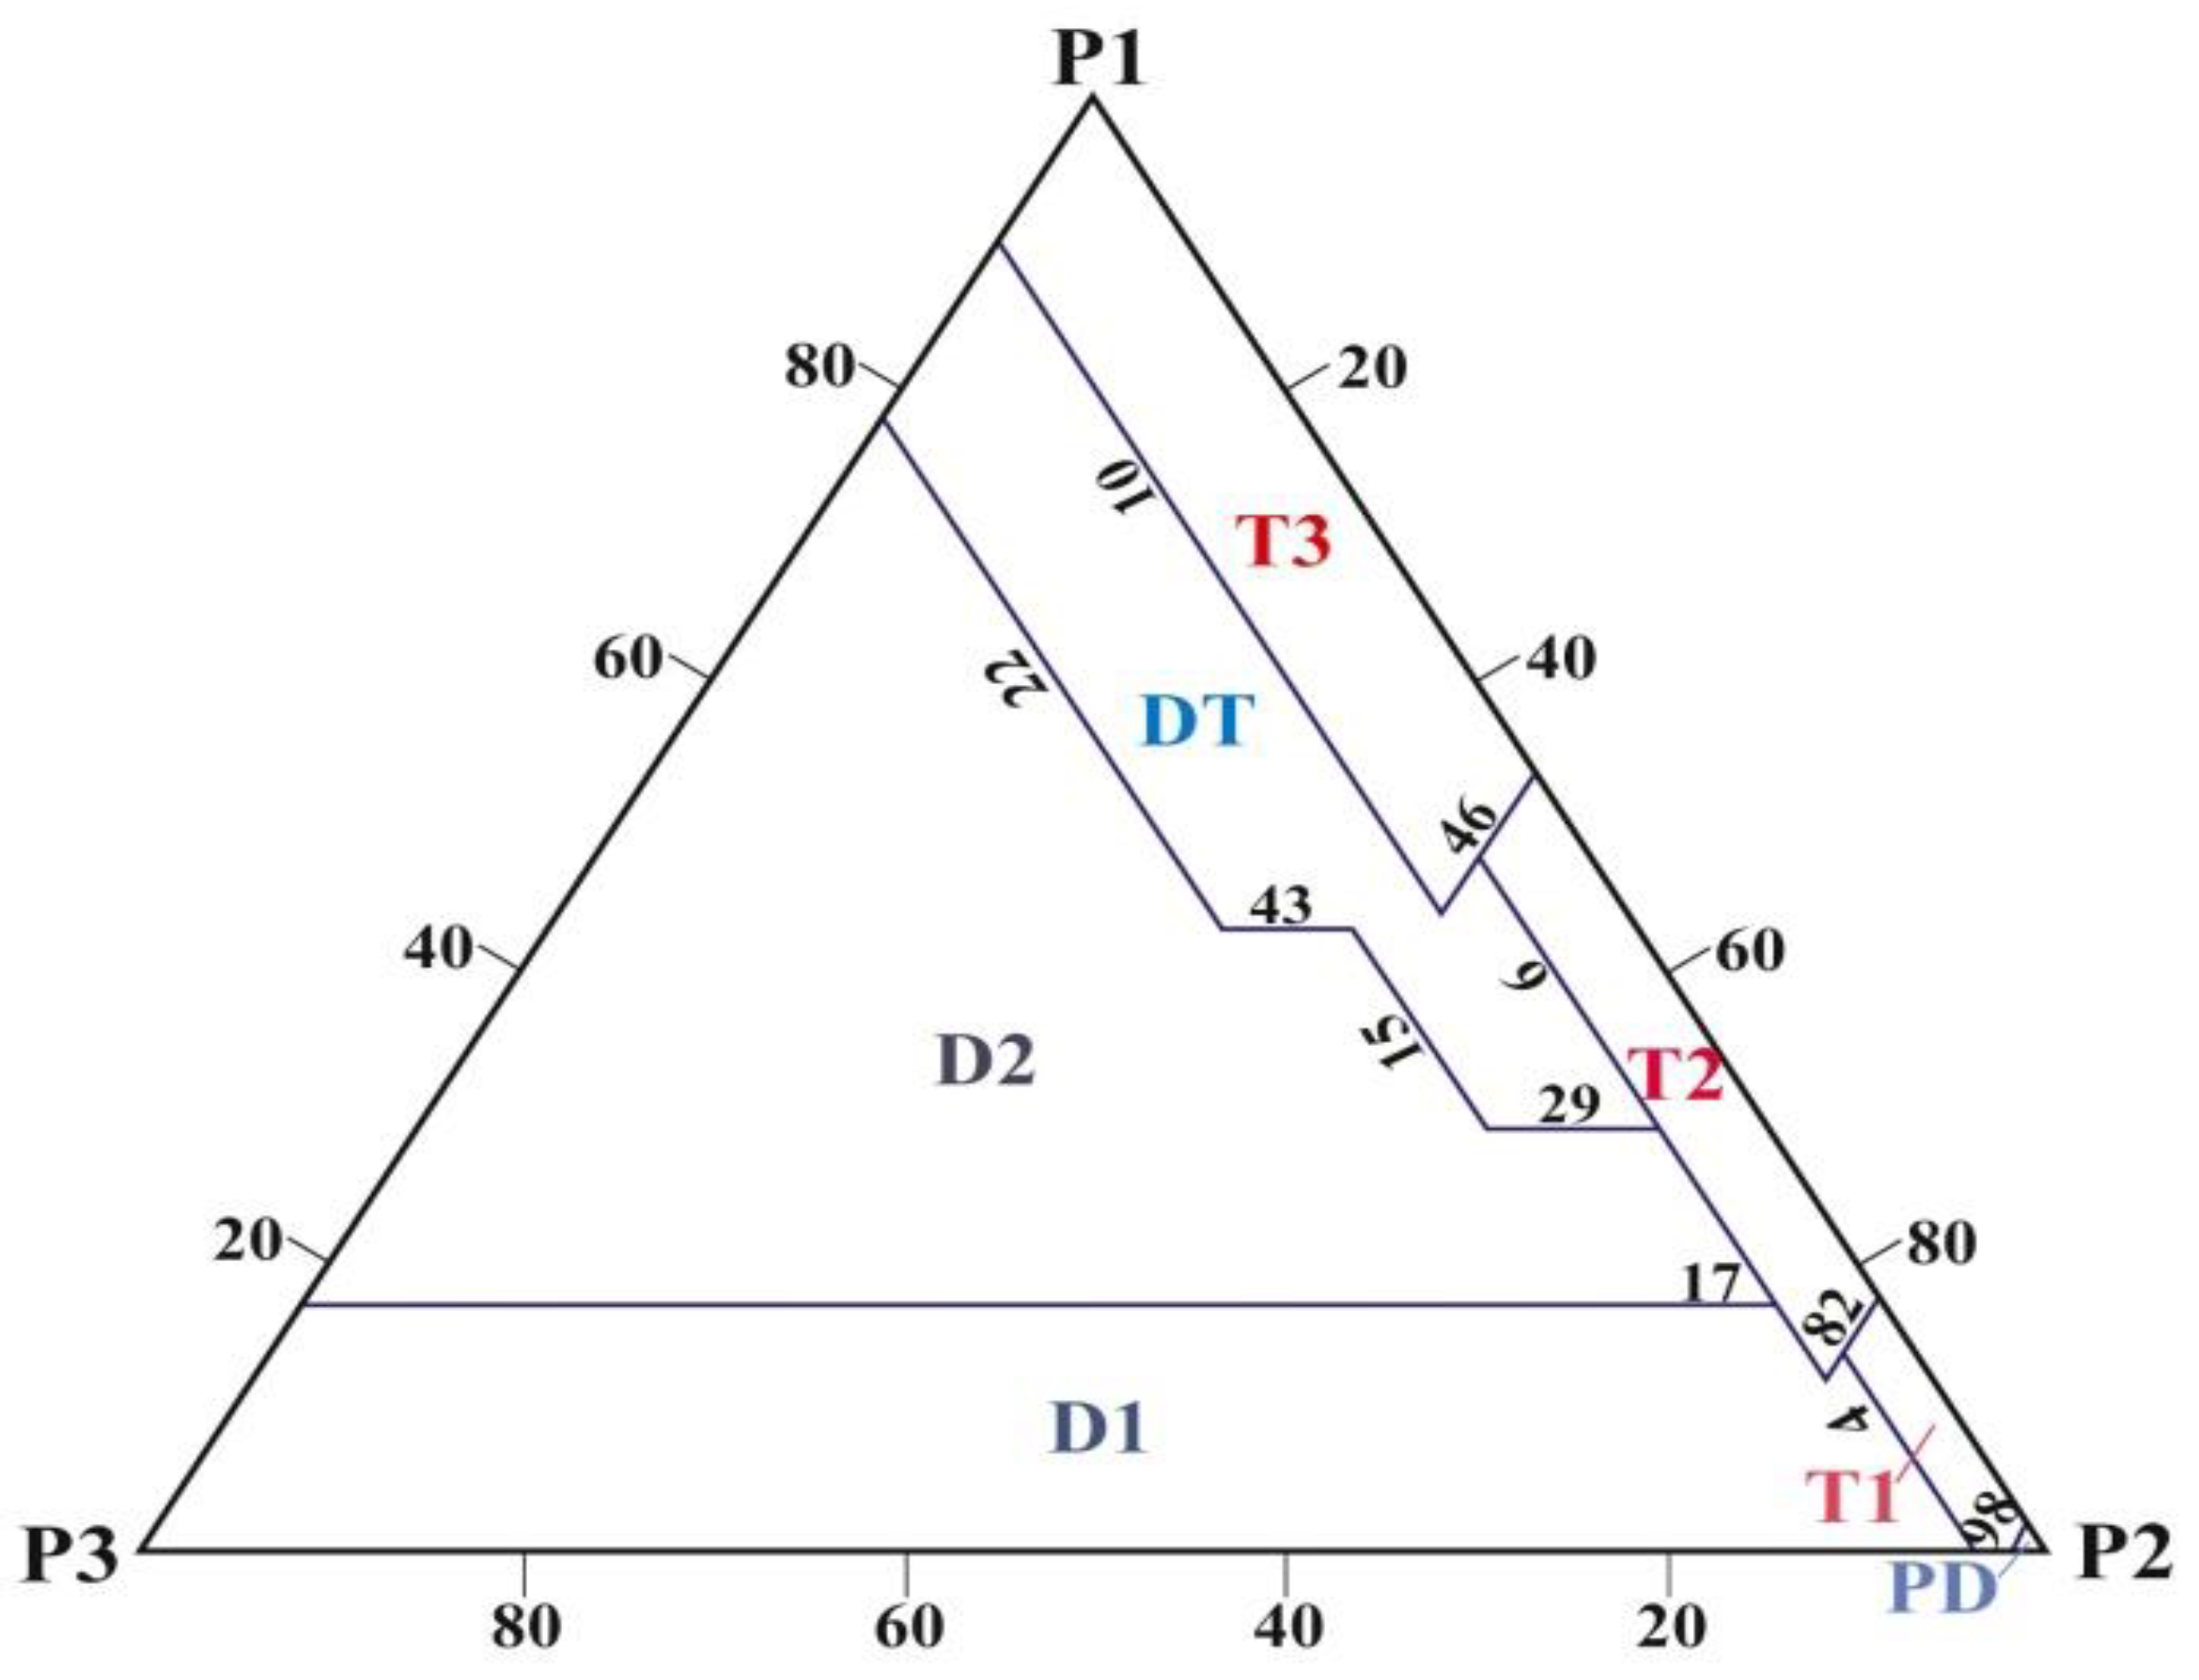
Gouda’s graphic technique consists of an equilateral triangle expressed according to triangular coordinates (P1, P2 and P3). The triangle vertices represent the relative proportions (from 0 to 100%) of each gas ratio (R1, R2 and R3) to the total of the three gas ratios (S = R1 + R2 + R3) in the clockwise direction, as shown in Figure 5, and a description of the types of faults detectable using the new triangle technique is given in Table 12.
This new triangular technique is applied by following these steps:
Step 1:
Determination of gas concentrations using gas chromatography.
Step 2:
Verification of gaseous hydrocarbon concentration limits. If at least one of the gas concentrations (in ppm) of the five key gases exceeds the limit given in Table 2, the transformer is considered faulty, and the next step is taken.
Step 3:
Determination of ratios R1, R2 and R3 and calculation of relative percentages P1, P2 and P3.
Step 4:
Sequential comparison of each percentage with the values obtained from the flowchart in the order P1, P2 and P3.
Step 5:
If all the calculated percentages for a particular type of fault are within the values contained in the table, then the fault diagnosis is valid.
According to [12], this technique is able to classify fault types in a clear, simple, highly reliable and more accurate way compared to other traditional techniques. It also has an accuracy of 85.42%, compared with 77.21% for the Duval triangle, 56.58% for the IEC method, 65.33% for the Doernenburg method and 55.15% for the Rogers method, using the same set of data.

4.1.3. Low Energy Degradation Triangle (LEDT)

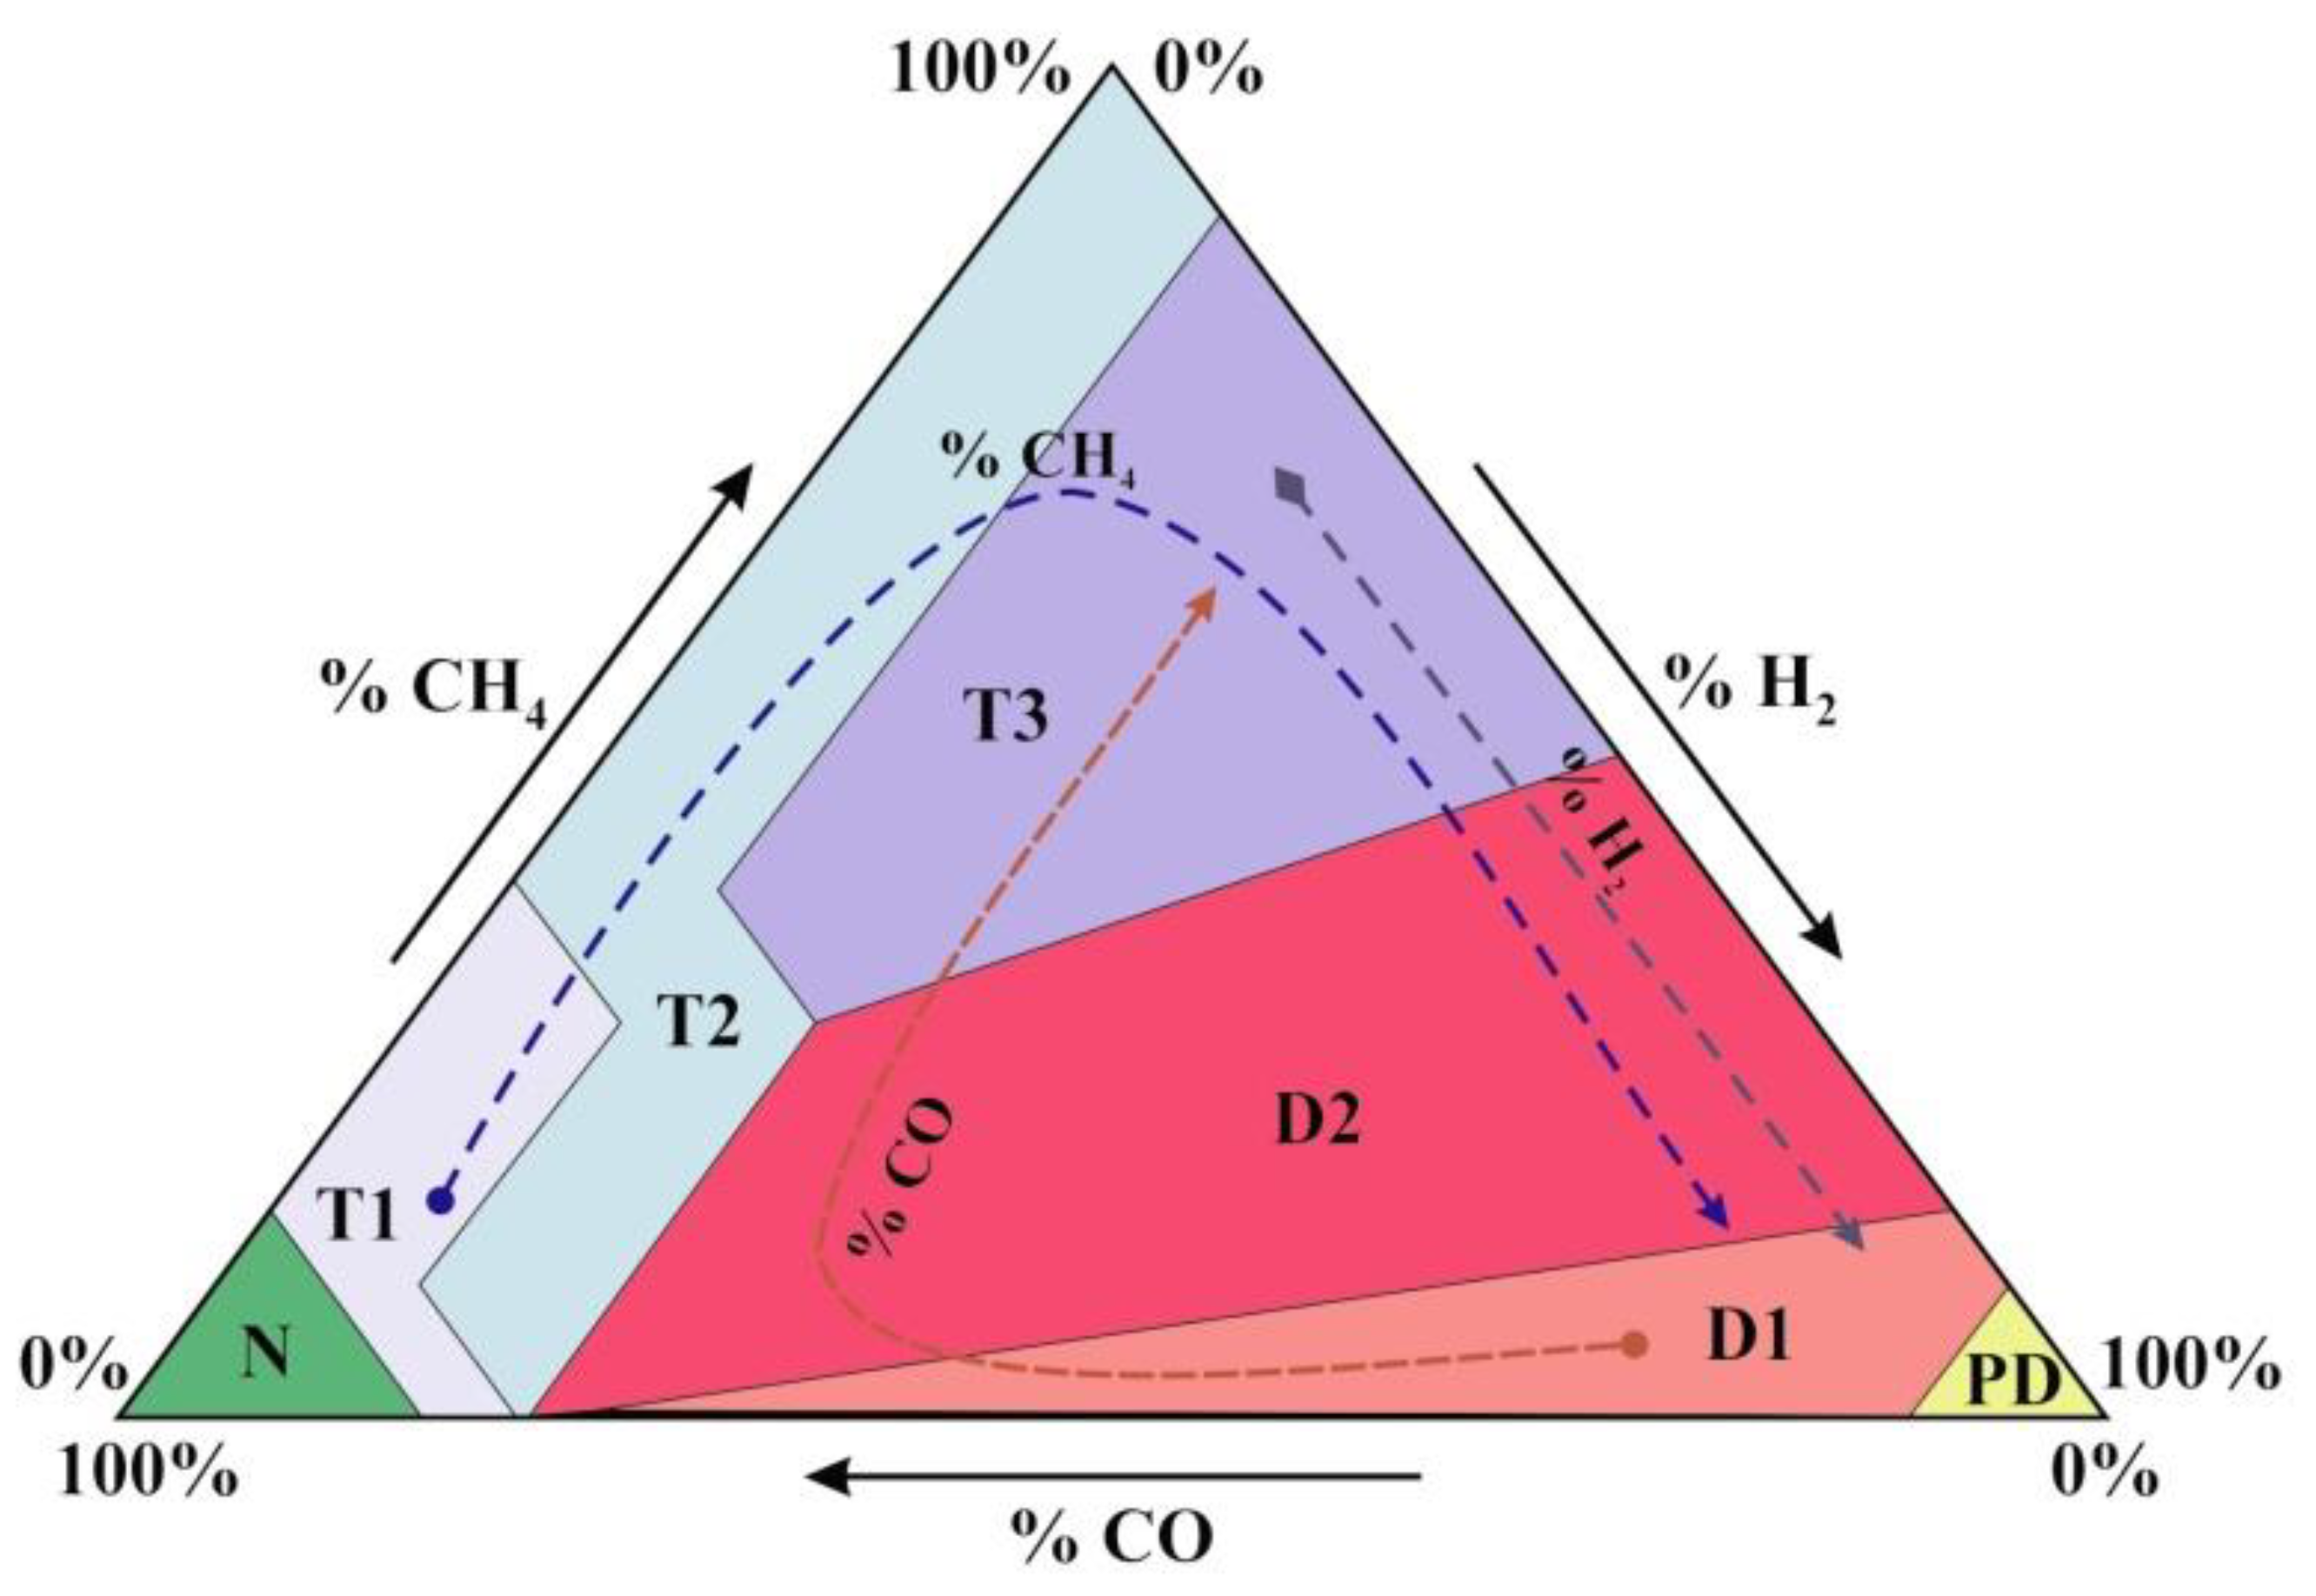
LEDT—the Low Energy Degradation Triangle (published in 2020)—is composed of H2, CH4 and CO, gases that generally start to form during low energy degradation processes in the operating power transformer [18]. This triangle is sensitive to both cellulose and oil insulation degradation and the amount of energy that may be present, ensuring early detection of transformer condition changes from normal to fault conditions.
The three proposed dissolved gases (H2, CH4 and CO) are plotted onto a triangular graph, similar to Duval triangle 1, with each side starting at zero and reaching 100% at the far end. There is clockwise movement along the triangular graph for each of the three parameters. Figure 6 shows the LEDT with the detectable fault areas.
Normal (N) is indicated by the green area at the lower-left vertex of the LEDT.
Upward movement along the % CH4 axis is characterised by thermal heating with a high % CH4 and a relatively constant % H2. This region consists of T1 (thermal fault, T < 300 °C) and T2 (thermal fault, 300 °C < T < 700 °C) faults and may vary accordingly.
Fault progression can fall into the regions D1 (low energy discharges), D2 (high energy discharges) and T3 (thermal faults, T > 700 °C). These regions are characterised by significant increases in the % H2 and % CH4 in varying proportions. Partial discharges (PDs) are in the yellow area at the lower-right vertex of the LEDT, which is for % H2 levels greater than 90%.
LEDT is effective when applied to on-line dissolved gas samples, where the tendencies of dissolved gas play a key role in detecting incipient changes in the level of insulation degradation. According to [18], LEDT has been successfully applied to the GSU transformer fleet of a large electric utility, where significant faulty transformer health conditions were identified and highlighted as a warning for intensive monitoring.

4.2. Pentagon-Based Graphical Diagnostic Techniques

4.2.1. Duval Pentagons

In 2014, Michel Duval presented in his paper [16] a new technique for interpreting DGA, described using Duval pentagons 1 and 2, using the five key gases (H2, CH4, C2H6, C2H4 and C2H2) arranged in the vertices of the pentagons, corresponding to the energy increase required to produce these gases in the oil of an operating transformer in a trigonometric sense. This arrangement of the gases was found to be the most suitable for signaling faults in transformers according to a pentagon representation.
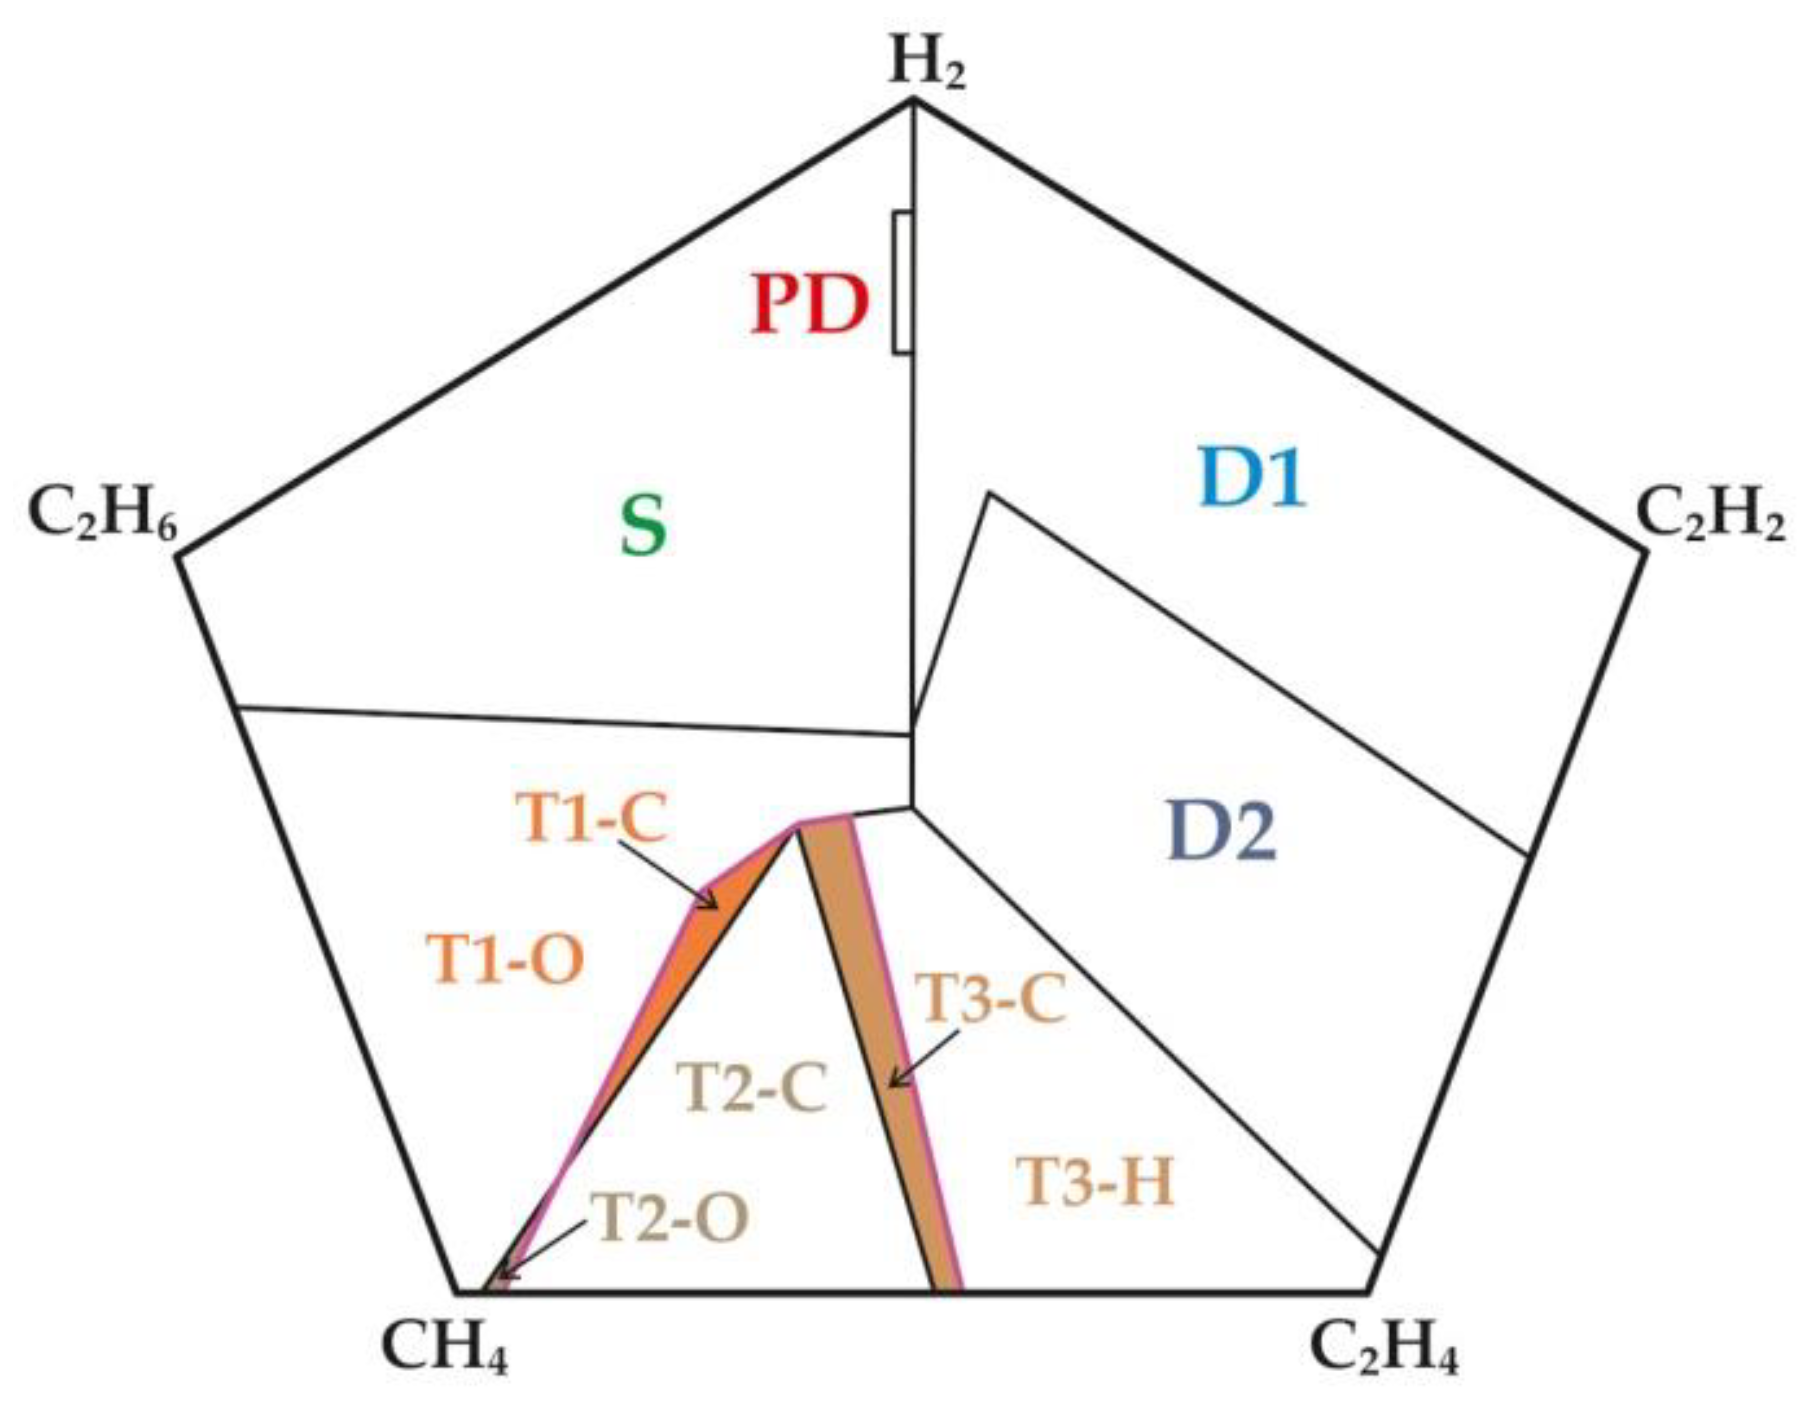
Duval pentagon 1 (Figure 7a) is designed for general analysis of fault types and, in addition to the main areas typically corresponding to the “basic” electrical/thermal faults used in the standards [19,20], also shows the stray gas “S” area corresponding to the production of gases during the normal ageing process of the paper–oil insulation system of power transformers.
Duval pentagon 2 (Figure 7b) is similar to Duval pentagon 1, and its method suggests refining the analysis if T1, T2 or T3 failures are identified in Duval pentagon 1, as it is important to know how much paper carbonisation is involved in the failure in order to make appropriate decisions to avoid disasters. The areas for thermal faults in this pentagon are defined in Table 13 [23].
It was found that the results of DGA carried out in area “C” of pentagon 2 indicated with 100% certainty the possibility of paper carbonisation, and therefore these transformers require further investigation (with carbon oxides, furan compounds and low-molecular-weight alcohols such as methanol and ethanol) to determine the level of solid insulation degradation [23].
The location in the pentagon of the point corresponding to a fault is determined by the centroid of the irregular polygon formed by the relative percentages of each gas, whose Cartesian coordinates (x, y) are given by the following equations:
C x = 1 6 A i = 1 5 x i + x i + 1 x i y i + 1 x i + 1 y i
C y = 1 6 A i = 1 5 y i + y i + 1 x i y i + 1 x i + 1 y i
where:
  • xi and yi are the coordinates of the five points;
  • Cx and Cy (x, y) are the coordinates of the centroid;
  • A is the area of the polygon given by the relation:
A = 1 2 i = 1 5 x i y i + 1 x i + 1 y i
In the paper [28] published in 2020, Luiz Cheim et al. describe the combined Duval pentagon method, which is obtained by overlapping Duval pentagons 1 and 2. The purpose of this overlap is to facilitate the automatic detection of faults in power transformers in service using specialised software and to take full advantage of the properties of the original pentagons, now reduced to a single geometry.
The combined Duval pentagon method results in fewer fault areas (10 areas) than if both pentagons were used separately (14 areas), thus eliminating the need to use two separate pentagons. Figure 8 shows the combined Duval pentagon with the ten fault areas, which are defined in Table 14 [23].
The combined Duval pentagon does not change the diagnostics generated by Duval pentagons 1 and 2, but it simplifies the calculations by using a single geometry to represent both pentagons. According to [28], in all cases, the diagnoses obtained using the pentagon method were in 100% agreement with the results of the internal inspections carried out by the experts.
In view of the importance of arc faults (D1 and D2) and paper carbonisation faults (C) in transformers and in order to determine their location, Duval defined new sub-areas in pentagon 2, similar to those in Duval triangles 1 and 5 presented in Section 4.1.1. The new sub-areas in Duval pentagon 2 make the following possible:
  • To determine whether D1 and D2 arc faults in transformers are in paper or oil (Figure 9a), [29], published in 2022;
  • To distinguish between paper carbonisation C faults in transformers, e.g., in cables, on the outside of windings and between winding turns or inner windings (Figure 9b), [27], published in 2023.

4.2.2. Mansour Pentagon

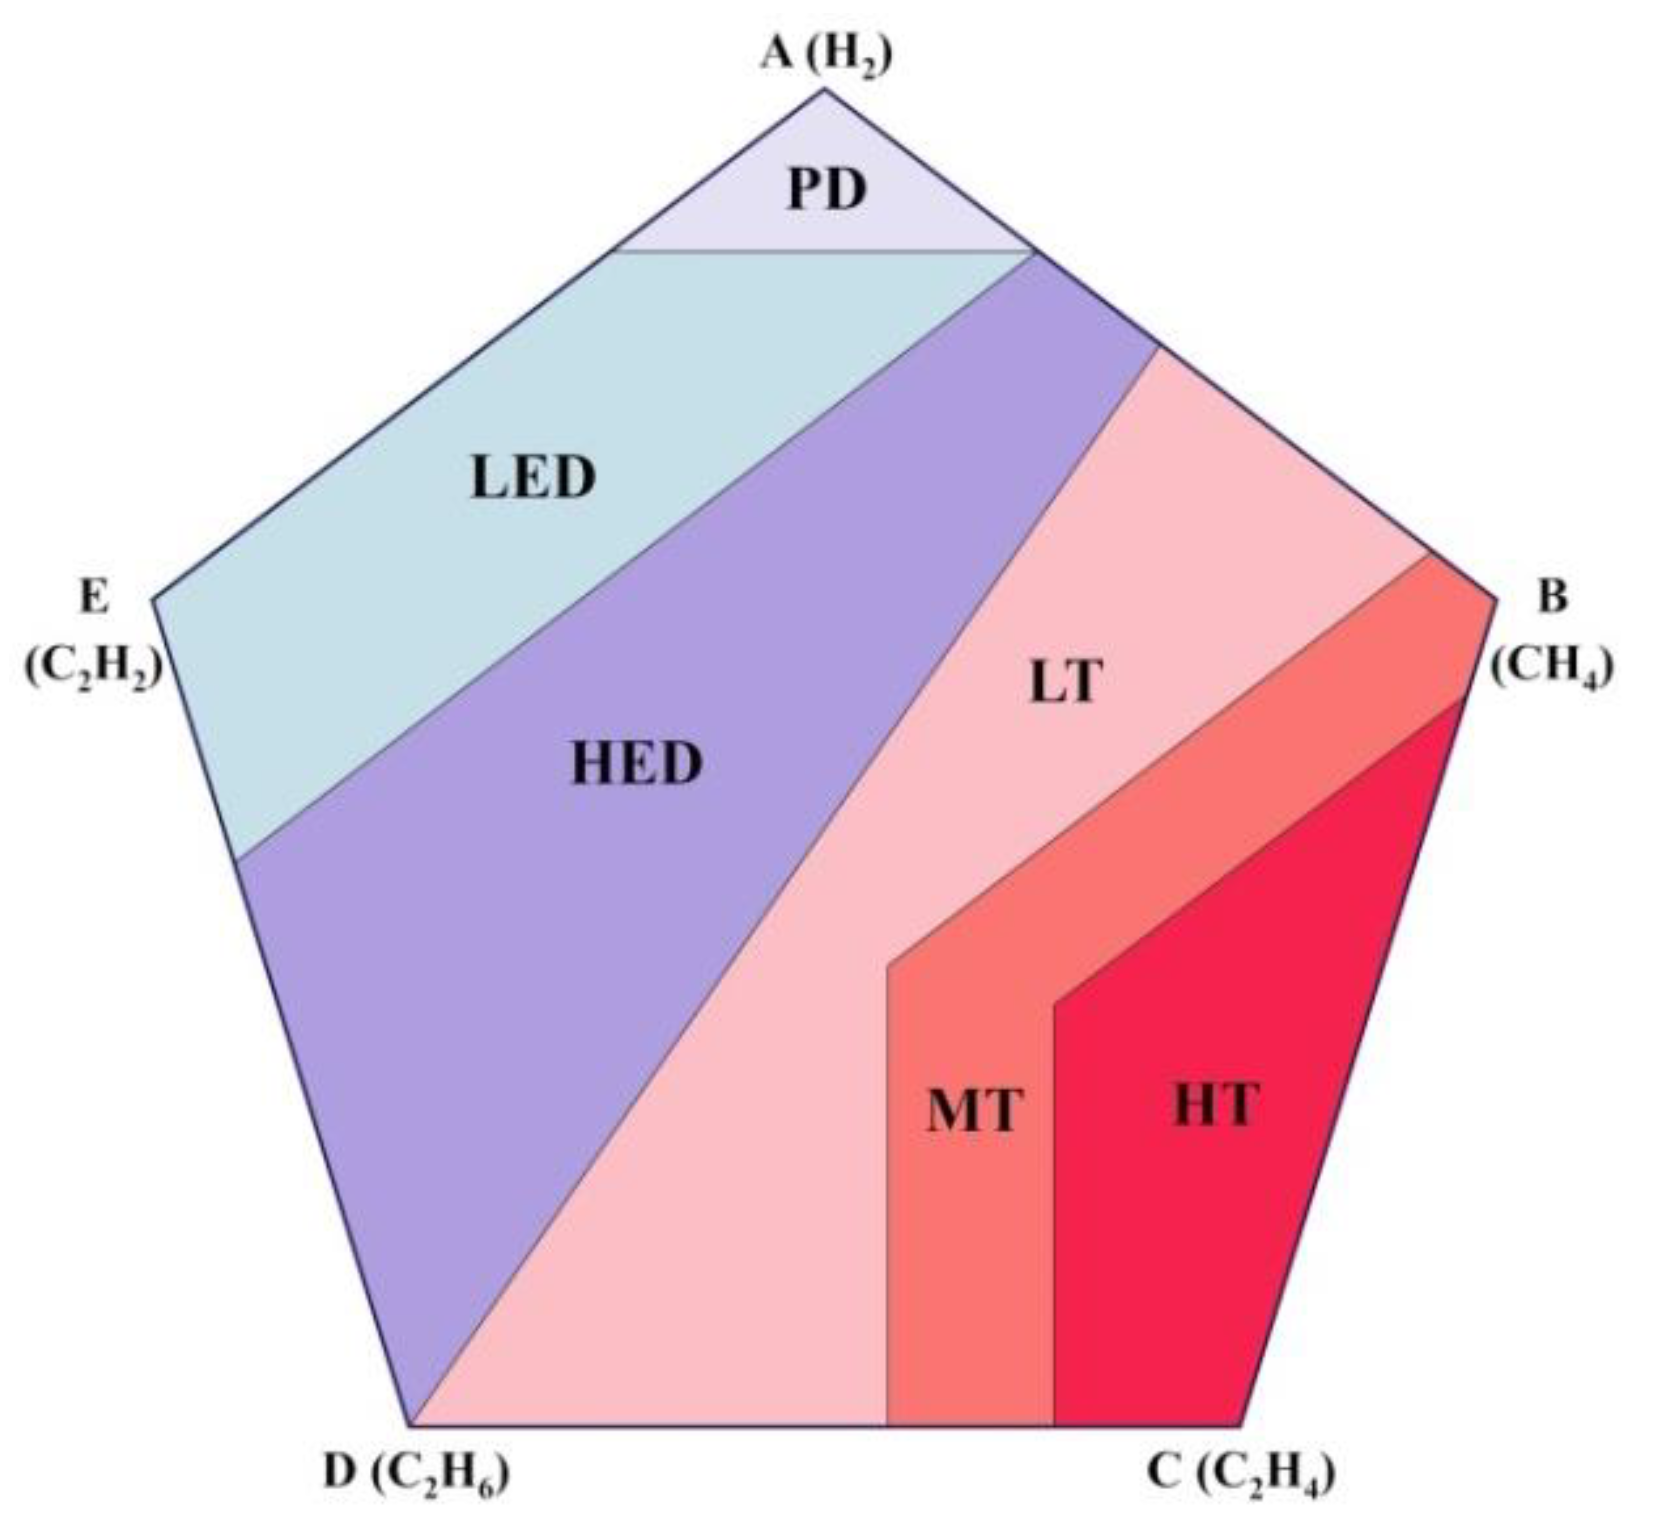
In 2015, Diaa-Eldin A. Mansour proposed a pentagon-shaped graphical analysis for fault diagnosis [13] to simultaneously analyse hydrocarbon fuel gases (H2, CH4, C2H6, C2H4 and C2H2), thus eliminating the shortcomings of the Duval triangle 1 method, which does not include C2H6 and H2 gases in its analysis, gases that are relevant to fault analysis due to overtemperature and low energy discharges.
The Mansour pentagon vertices are labelled A to E clockwise from the top (corresponding to the 100% ratio level for each of the gases) and represent the percentage concentration of each individual gas relative to the total combustible gas concentration.
The gas corresponding to each vertex of the pentagon was specified according to the correlation coefficient between each two gases, which was determined based on the principle that the data samples for each fault should not be spread over the entire pentagon but should be clustered in a particular region. He therefore identified the gases corresponding to each vertex of the pentagon (A to E) as H2, CH4, C2H4, C2H6, C2H2, as shown in Figure 10.
The fault areas in the Mansour pentagon were identified using information from both conventional DGA methods and actual DGA data, and their names are given in Table 15.
The location of the corresponding point for a given fault case in the Mansour pentagon is determined by the centre of mass of all the vertices of the pentagon. If the vertices of the pentagon are expressed as (x, y) coordinates, then the mathematical formula for the centre of mass (xm, ym) is given by the relations:
x m = 1 100 i = 1 n m i x i
y m = 1 100 i = 1 n m i y i
where:
  • (xi, yi) are the coordinates of each vertex of the pentagon;
  • mi is the percentage concentration of each gas at the vertices of the pentagon;
  • n is the number of peaks or combustible gases, in this case five.
The Mansour pentagon is inscribed in a circle and has superimposed XY axes with the origin (0, 0) in the centre of the circle with a radius of 1.00. The same applies to Duval pentagons 1 and 2, but the radius of the circle is 0.40.
According to [13], the Mansour pentagon method eliminates the shortcomings of Duval triangle 1 and also has a higher diagnostic accuracy compared to other methods, including Duval triangles and the IEC 60599 standard [19].

4.3. Diagnostic Methods Based on Other Types of Graphs

4.3.1. Heptagon Graph

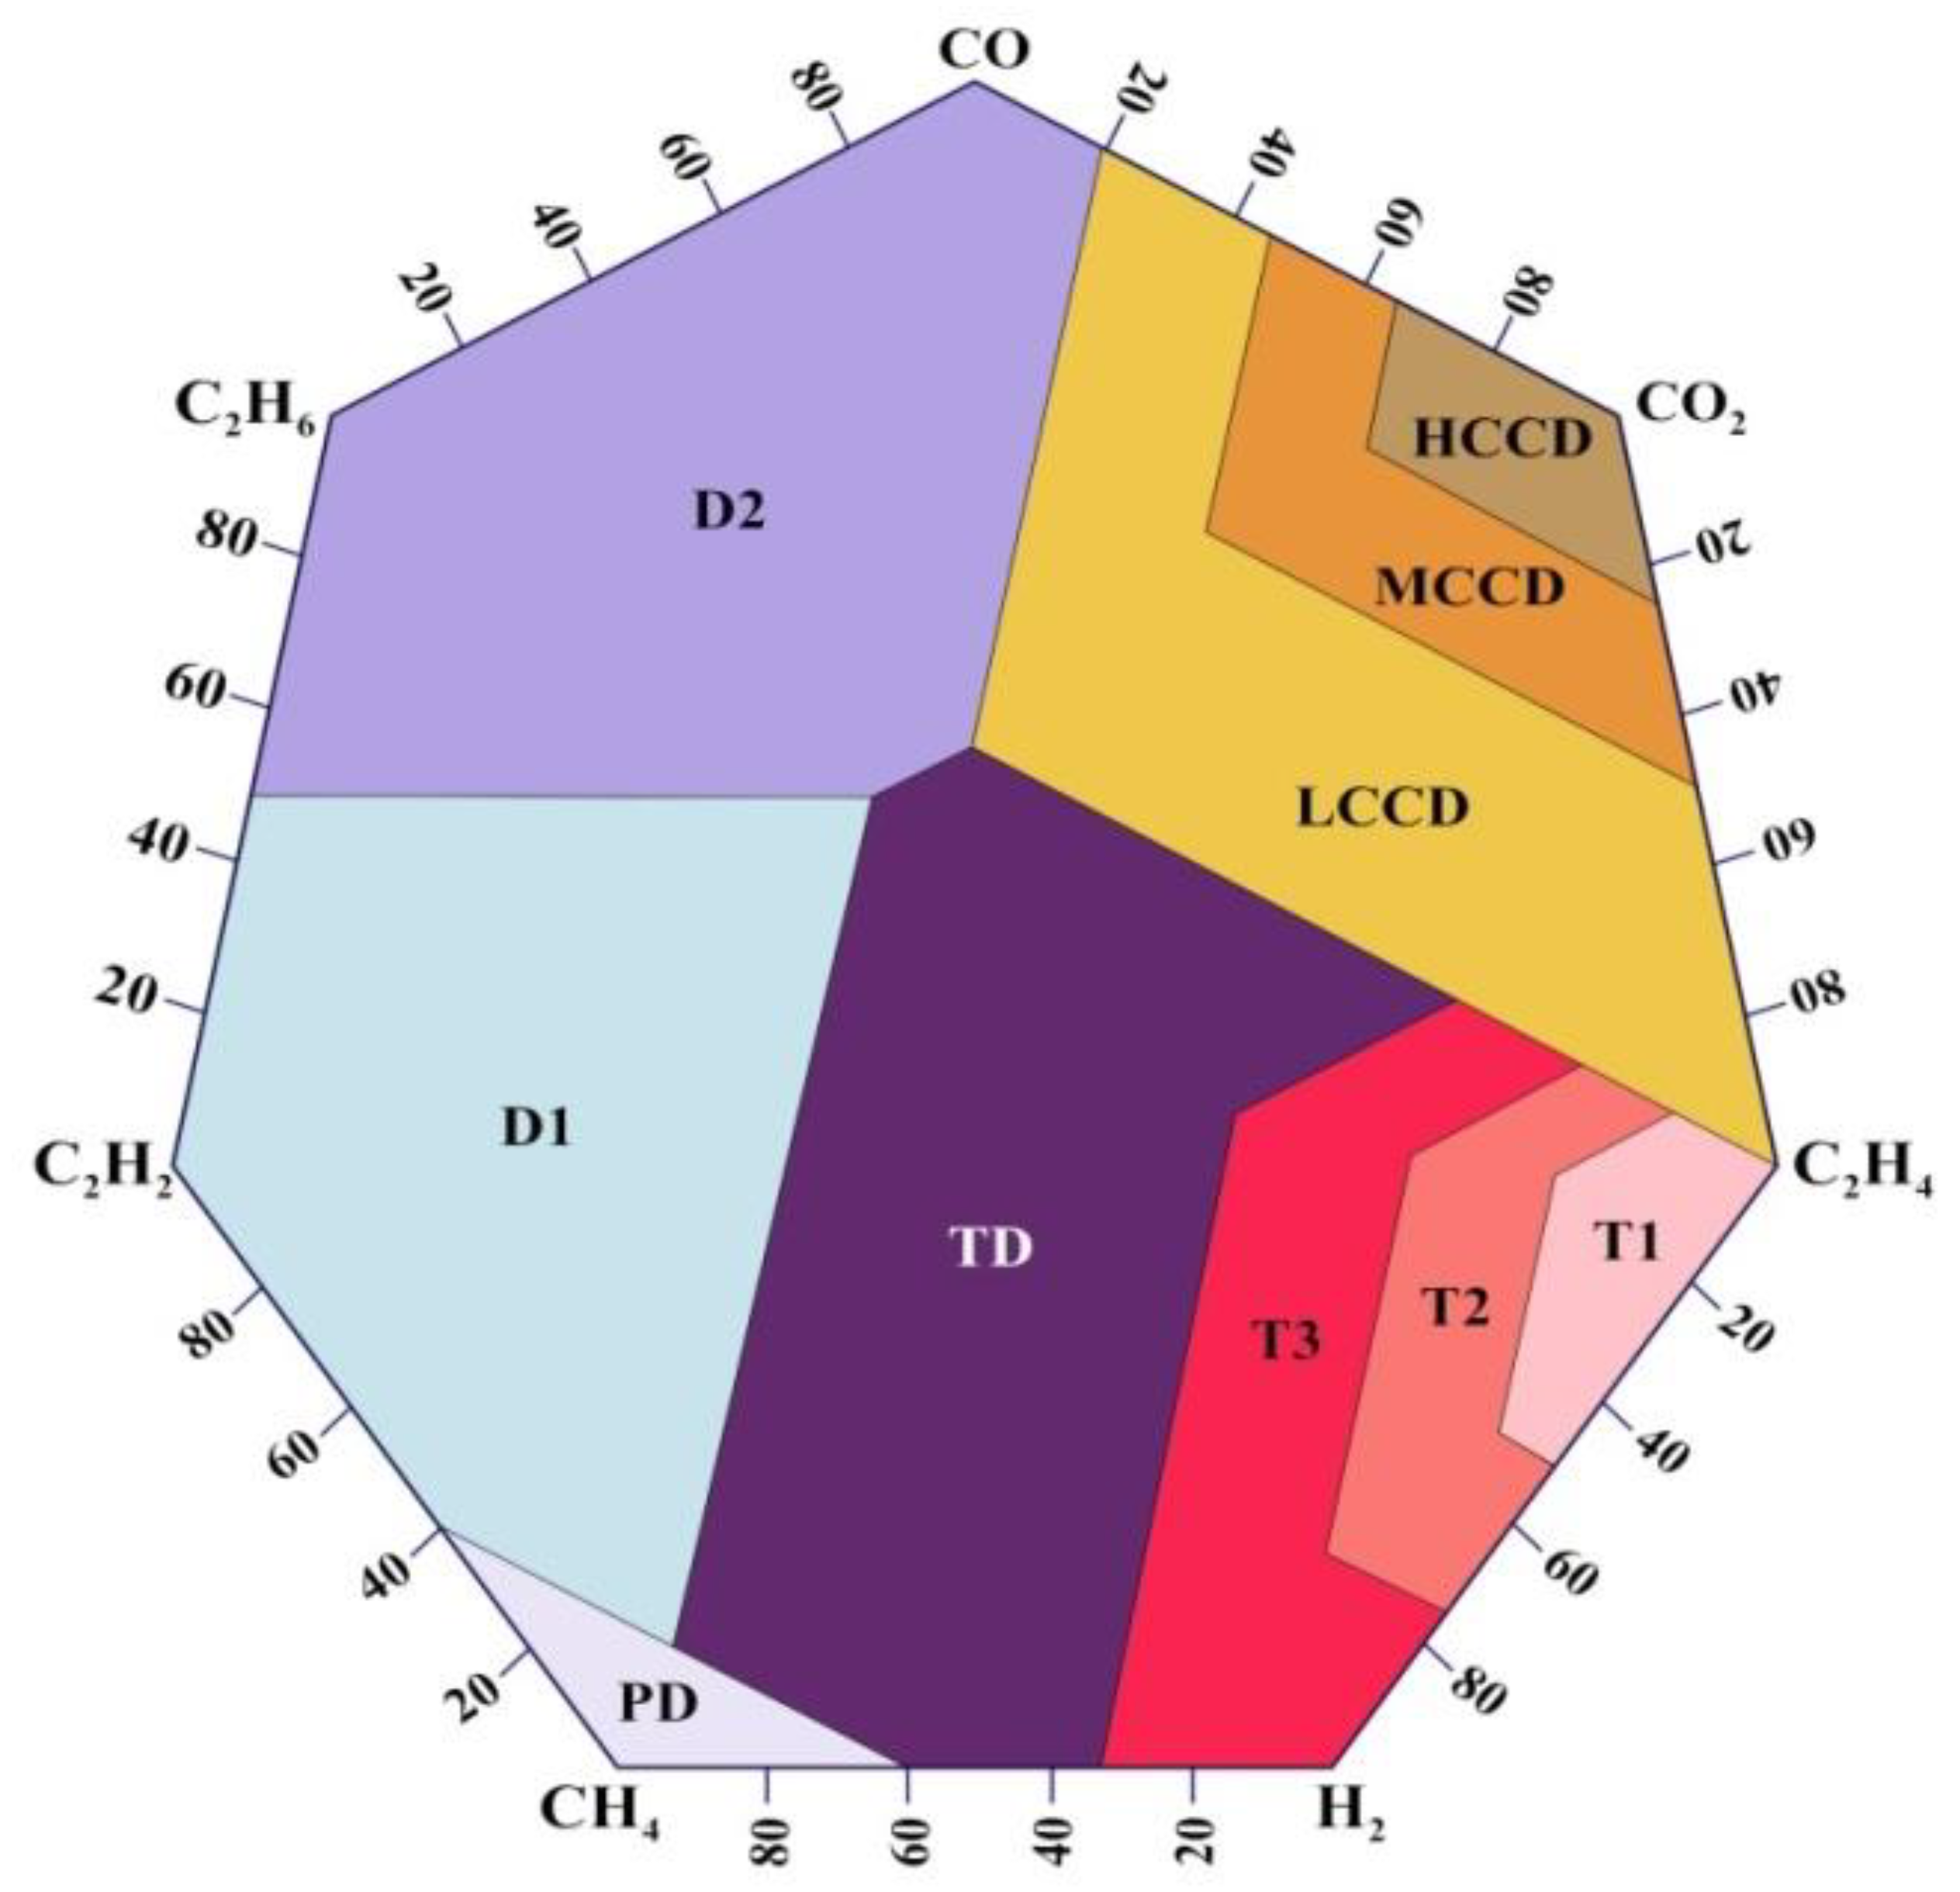
Since the Doernenburg, Rogers, IEC and Duval triangle 1 methods do not take into account the carbon oxide (CO and CO2) concentrations to assess cellulose insulation degradation, and some of them do not take into account the effect of C2H6 and H2 gases to assess failures caused by overtemperature and low energy discharges, Osama E. Gouda in 2017 [17] proposed the heptagon graph method.
This method consists of an equilateral regular heptagon whose vertices represent the relative proportions of the concentrations of seven gases (H2, CH4, C2H4, C2H6, C2H2, CO and CO2), defined as the percentage of each gas in the total concentration of the seven gases. The points specified on the sides of the heptagon are used to define its boundaries, which are expressed from 0 to 100 clockwise, as shown in Figure 11. Table 16 defines the fault areas in the heptagon.
Since CO2 is a non-combustible gas, Gouda specifies that in order to distinguish between the electrical and thermal faults required for the heptagon coordinates, the balance between combustible and non-combustible gases must first be achieved by calculating their relative percentages according to the following formulae:
H 2 = H 2 × 3.5 3.5 × H 2 + 2.9167 × C H 4 + 5.3846 × C 2 H 6 + 7 × C 2 H 4 + 350 × C 2 H 2 + C O + 0.14 × C O 2 × 100
C H 4 = C H 4 × 2.9167 3.5 × H 2 + 2.9167 × C H 4 + 5.3846 × C 2 H 6 + 7 × C 2 H 4 + 350 × C 2 H 2 + C O + 0.14 × C O 2 × 100
C 2 H 6 = C 2 H 6 × 5.3846 3.5 × H 2 + 2.9167 × C H 4 + 5.3846 × C 2 H 6 + 7 × C 2 H 4 + 350 × C 2 H 2 + C O + 0.14 × C O 2 × 100
C 2 H 4 = C 2 H 4 × 7 3.5 × H 2 + 2.9167 × C H 4 + 5.3846 × C 2 H 6 + 7 × C 2 H 4 + 350 × C 2 H 2 + C O + 0.14 × C O 2 × 100
C 2 H 2 = C 2 H 2 × 350 3.5 × H 2 + 2.9167 × C H 4 + 5.3846 × C 2 H 6 + 7 × C 2 H 4 + 350 × C 2 H 2 + C O + 0.14 × C O 2 × 100
C O 2 = C O 2 × 0.14 3.5 × H 2 + 2.9167 × C H 4 + 5.3846 × C 2 H 6 + 7 × C 2 H 4 + 350 × C 2 H 2 + C O + 0.14 × C O 2 × 100
C O = C O 3.5 × H 2 + 2.9167 × C H 4 + 5.3846 × C 2 H 6 + 7 × C 2 H 4 + 350 × C 2 H 2 + C O + 0.14 × C O 2 × 100
The weighting or multiplication factor of the above formulae is defined as the ratio of the normal CO concentration limit to the normal concentration limit of each gas. The above equations are adapted to the limits shown in Table 2, which are in accordance with the latest version of IEEE Std.C57.104:2019. The weighting factors used by Gouda were determined by the limits of IEEE Std.C57.104:2008 [43].
This new triangular technique is applied by following these steps:
Step 1:
Determination of gas concentrations using gas chromatography.
Step 2:
Verification of the concentration limits of the seven gases against the IEEE standard.
Step 3:
The transformer is considered faulty if at least one of the gas concentrations exceeds the limits in the standard.
Step 4:
Determination of the relative percentages for each gas using the equations given above.
Step 5:
Plotting the percentage of each gas on the heptagon graph, and the corresponding point for a given fault case is determined by the centre of mass of the percentage concentrations.
According to [17], the accuracy of this method reached 89.41% out of 452 samples tested, while the Doernenburg, Rogers, IEC and Duval triangle 1 methods have accuracy percentages of 38.48%, 46.43%, 54.67% and 64.67%, respectively, for the same number of samples.

4.3.2. ETRA Square

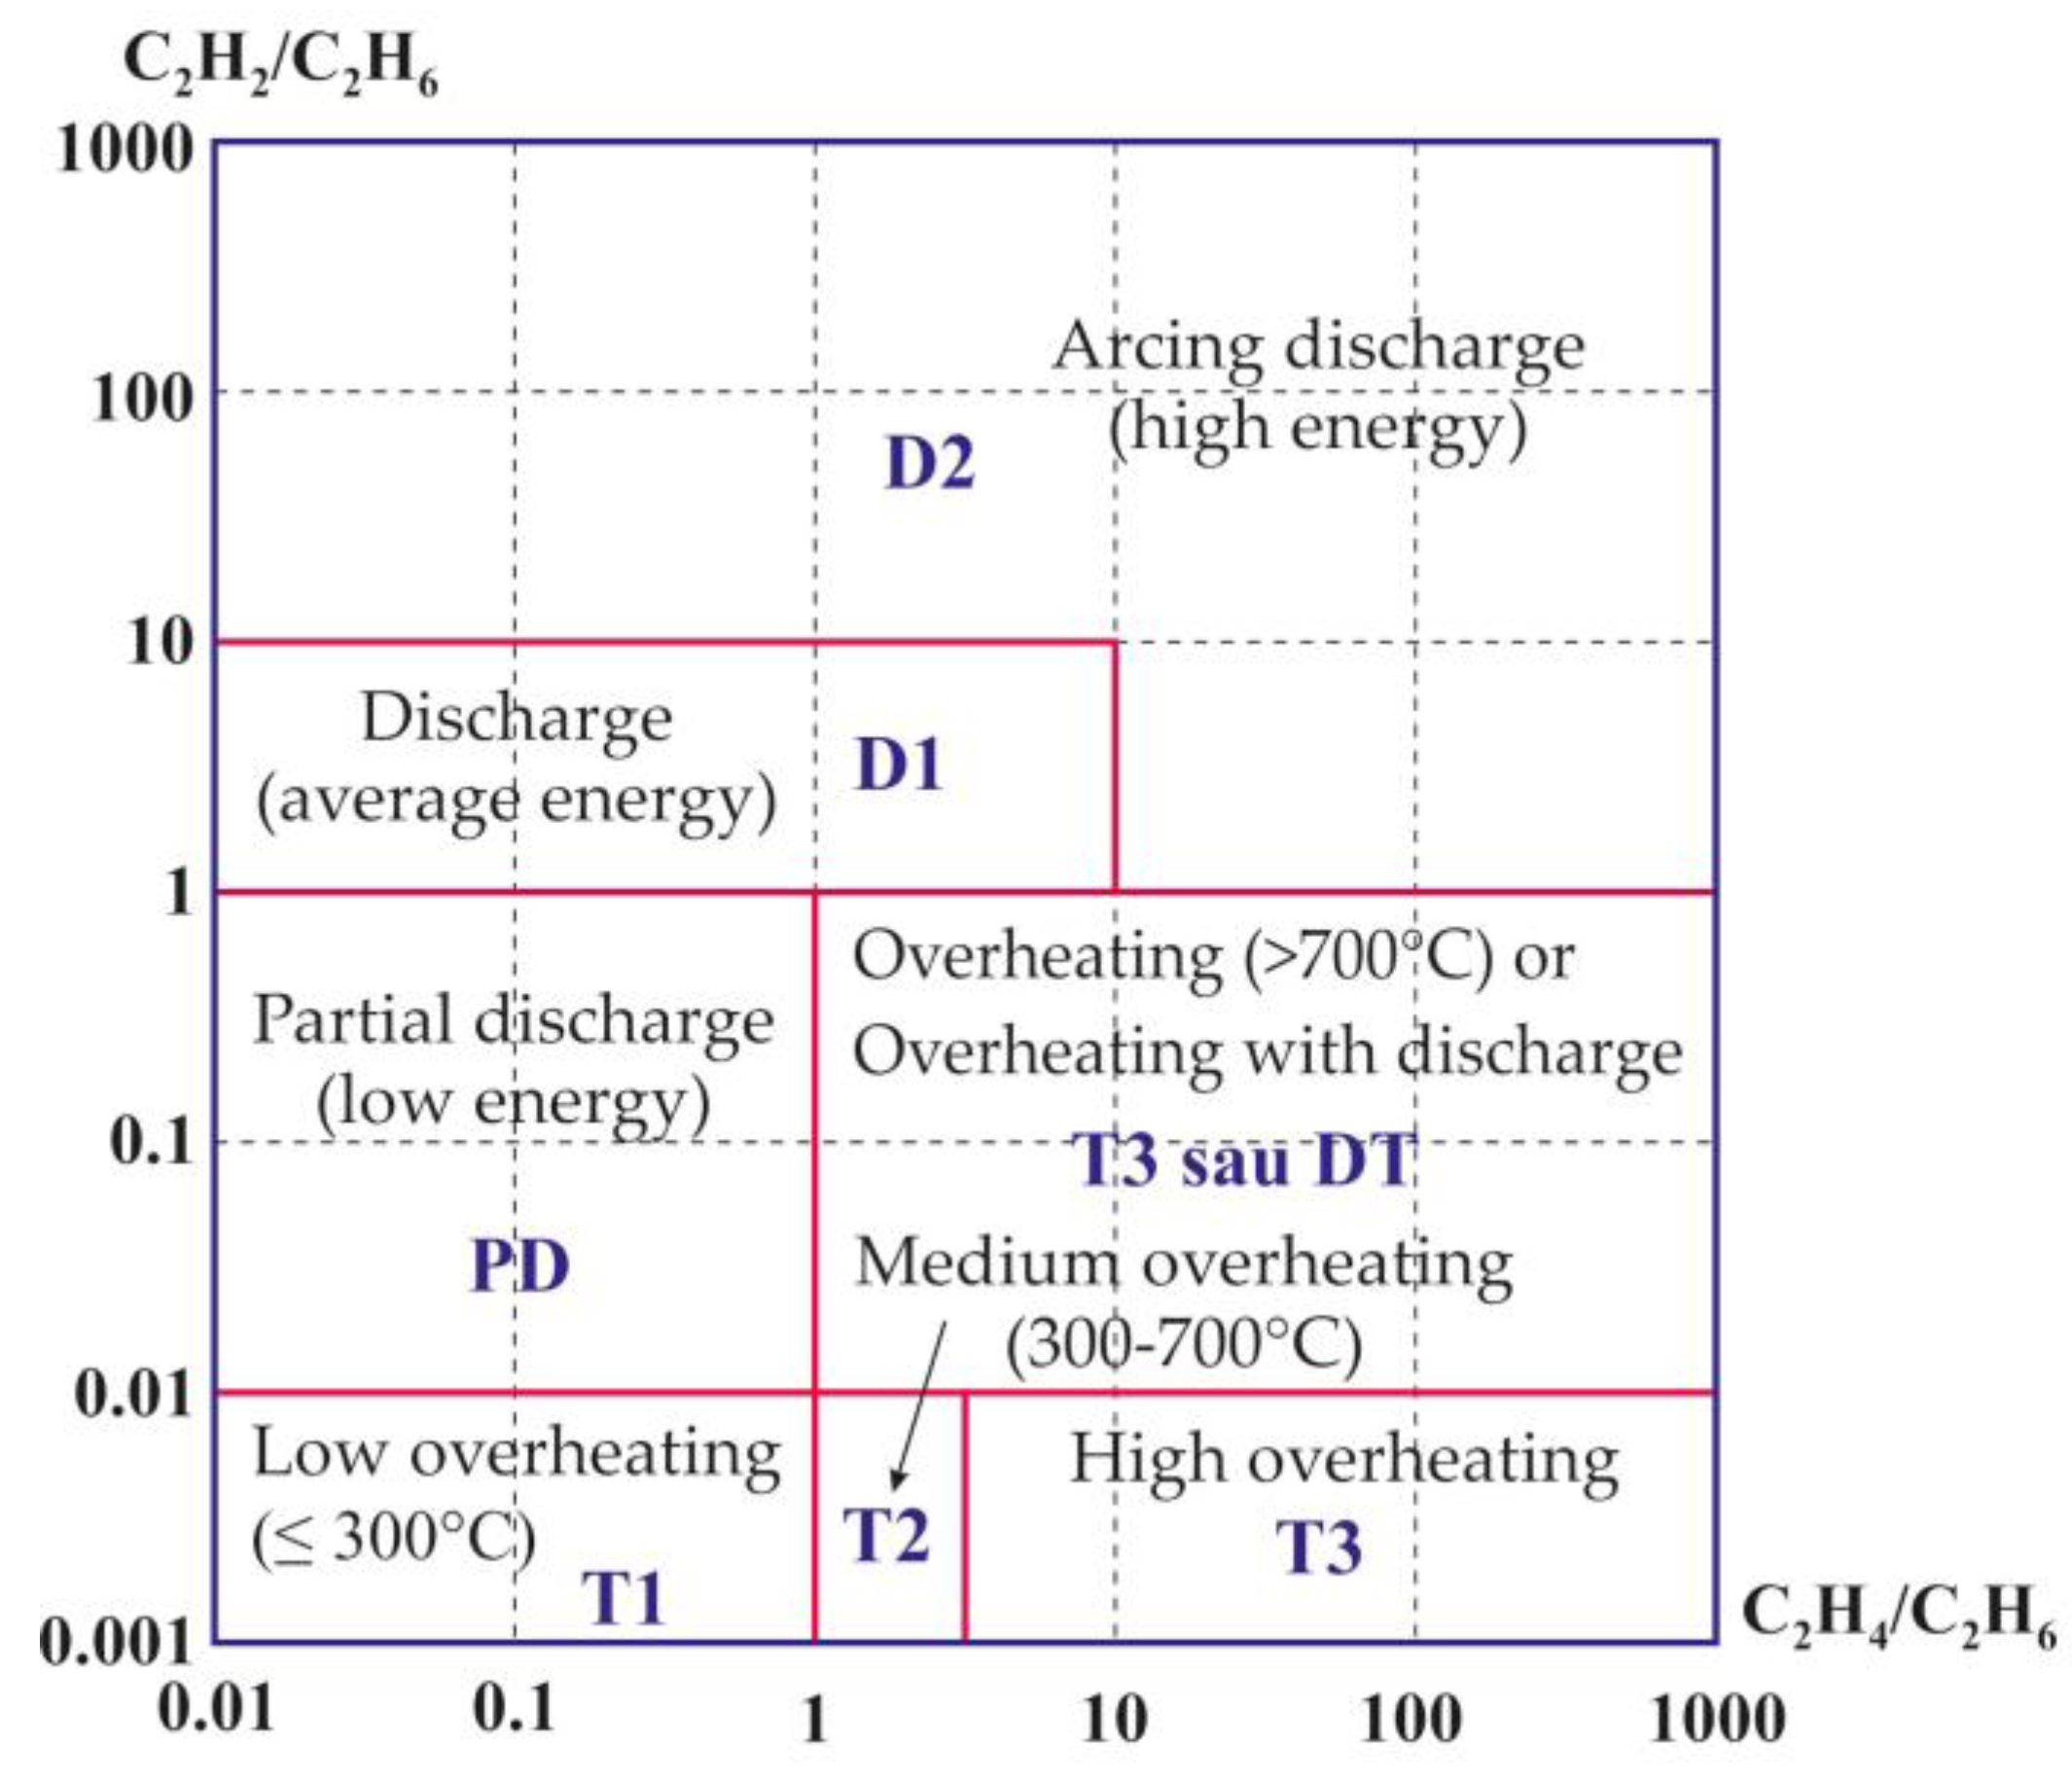
This method was developed by the Electric Technology Research Association (ETRA) (Japan) [30] and published in 1999. The method consists of using the ratios of three gases (C2H2, C2H4 and C2H6) and a diagnostic graph (in the form of a square) to identify the type of fault in oil-immersed power transformers.
Figure 12 shows a diagnostic graph with the fault areas defined by ETRA and the corresponding codes according to the IEC and IEEE standards. For example, the partial discharge (PD) fault area is limited by the following gas ratios, 0.01 ≤ C2H4/C2H6 ≤ 1 and 0.01 ≤ C2H2/C2H6 ≤ 1, and the medium overheating area (300–700 °C) is limited by the following gas ratios: 1 ≤ C2H4/C2H6 ≤ 4 and 0.001 ≤ C2H2/C2H6 ≤ 0.01.
According to the analysis of the IEC, Duval triangle 1, ETRA square and nomogram methods in [10], the graphical Duval triangle 1 and ETRA square methods provide the highest reliability in identifying the faults analysed.

4.3.3. Nomogram Method

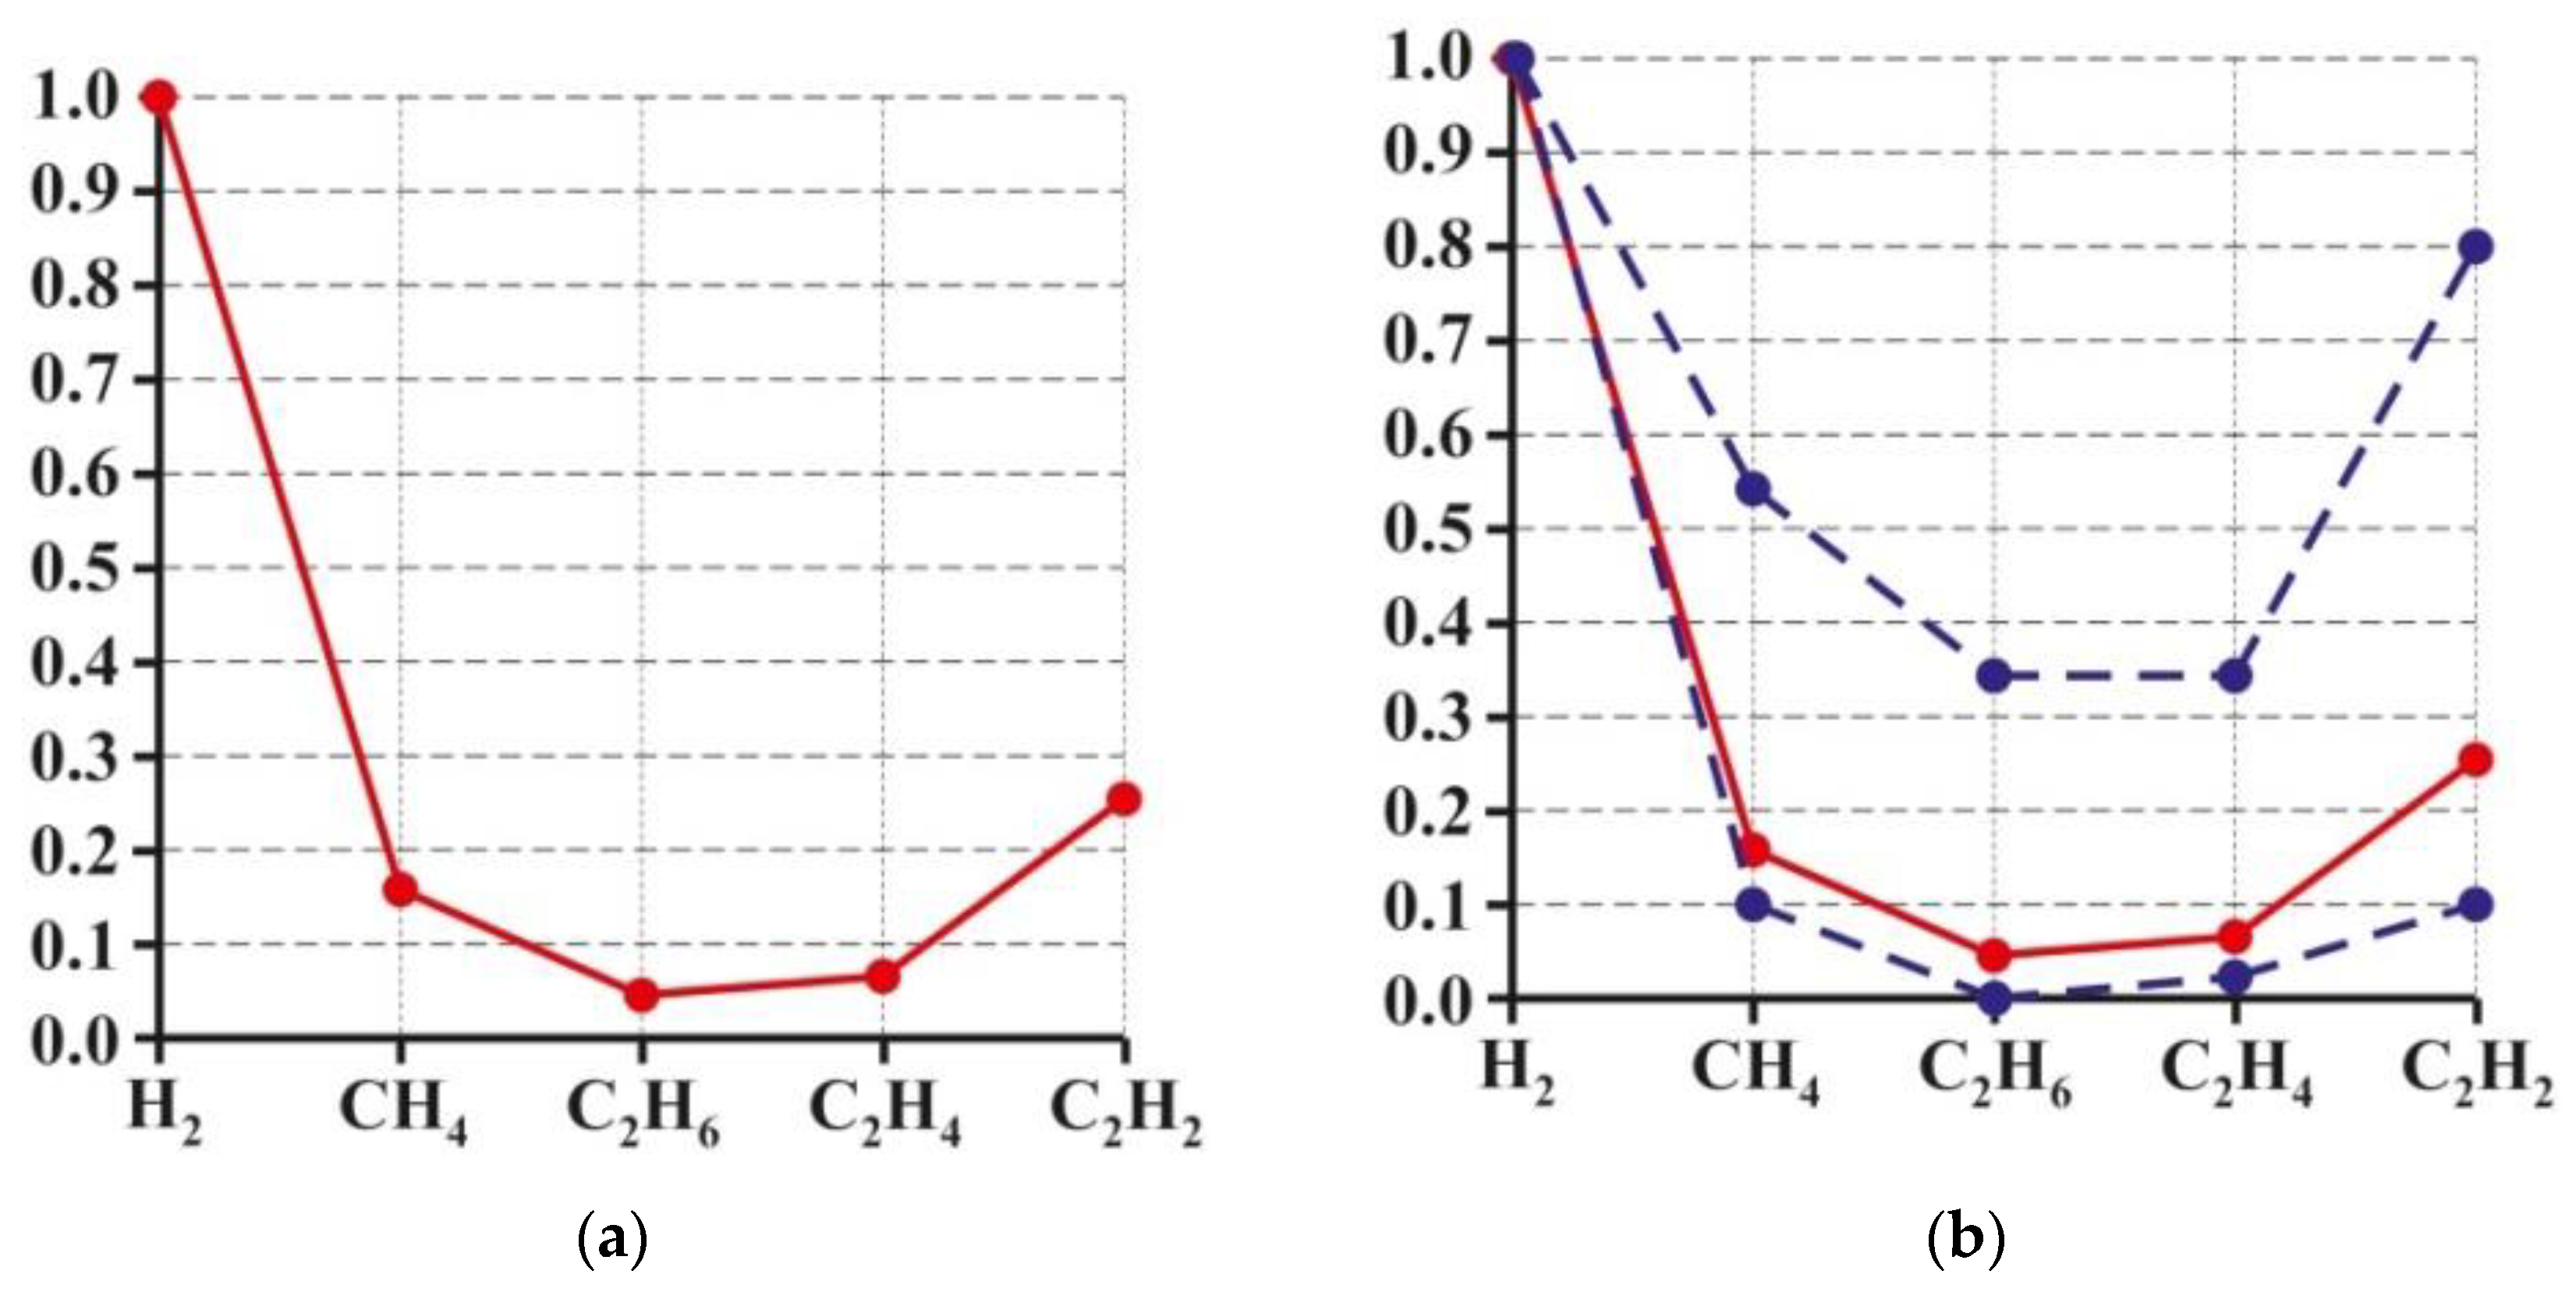
The nomogram method was first proposed by Japanese researchers, in the year 1986, [31] who used the ratio of the five key gases to the gas of the maximum concentration to identify the type of fault in DGA results.
To identify the type of fault using this method, first, the gas of the maximum concentration is determined; then, the values of the ratio of each gas to the gas of the maximum concentration are calculated. The next step is to construct the fault nomogram as follows: the values of the ratio obtained are placed on the Y axis and the gases are placed on the X axis in the following order: H2, CH4, C2H6, C2H4 and C2H2 (Figure 13). Finally, the resulting points are connected by a line.
The resulting graph is compared with the standardised reference nomograms (e.g., Figure 13a—red line/dots), and the best match is selected (Figure 13b—blue line/dots). The latter represents a nomogram of the type of fault.

5. Improvement of the Efficiency of DGA-Based Fault Diagnosis Methods

Nowadays, several computational techniques based on artificial intelligence (AI) have been developed to overcome the difficulties of the classical methods (analytical and graphical) and to improve the performance of DGA-based fault diagnosis. These techniques can only detect the types of faults for which they have been trained; otherwise, misdiagnosis may occur. They are also complicated and difficult for practising engineers to apply widely [32,33].
Since traditional DGA-based fault diagnosis methods use different rules and criteria against the same DGA results and depend on the knowledge of experts in the field, the probability of misdiagnosis increases. The integration of appropriate information into various intelligent techniques is therefore essential to improve the accuracy and precision of early fault diagnosis in power transformers.
To streamline fault diagnosis based on DGA interpretation, researchers in this field have offered solutions using intelligent techniques that can be applied to the traditional methods of fault identification in power transformers, either independently or in combination [34].
According to the literature, widely used intelligent techniques are Fuzzy Logic (FL), Neural Networks (NNs), Expert Systems, Support Vector Machines (SVMs) and combined techniques such as Adaptive Neuro Fuzzy Inference Systems (ANFISs) and Gene Expression Programming (GEP).
FL and NN techniques help to overcome the problems of uncertainty and unresolved diagnostic cases inherent in conventional DGA methods. ANFISs, SVMs and GEP are binary classifiers and require the use of separate models for different fault conditions. Therefore, they are successfully used to solve fault diagnosis problems, but the need for adequate data samples to train the methods in the case of an ANFIS, the selection of the kernel function in the case of an SVM and the choice of the correct matching function using the GEP method limit their use for practical purposes [7].
Grey clustering analysis (GCA) is also used to diagnose incipient faults in power transformers and has shown advantages over NN and FL systems because it requires smaller data samples for training and does not require the design of membership functions or the assignment of linguistic variables [35].
A comparative analysis of the most widely used artificial intelligence (AI) techniques showed that none of them can be considered the best for diagnosing power transformer faults but should be considered complementary methods, as these intelligent techniques provide directions for identifying the most suitable algorithm for interpreting DGA data [36].

Example of Using AI Techniques to Develop a New Graphical Technique for DGA

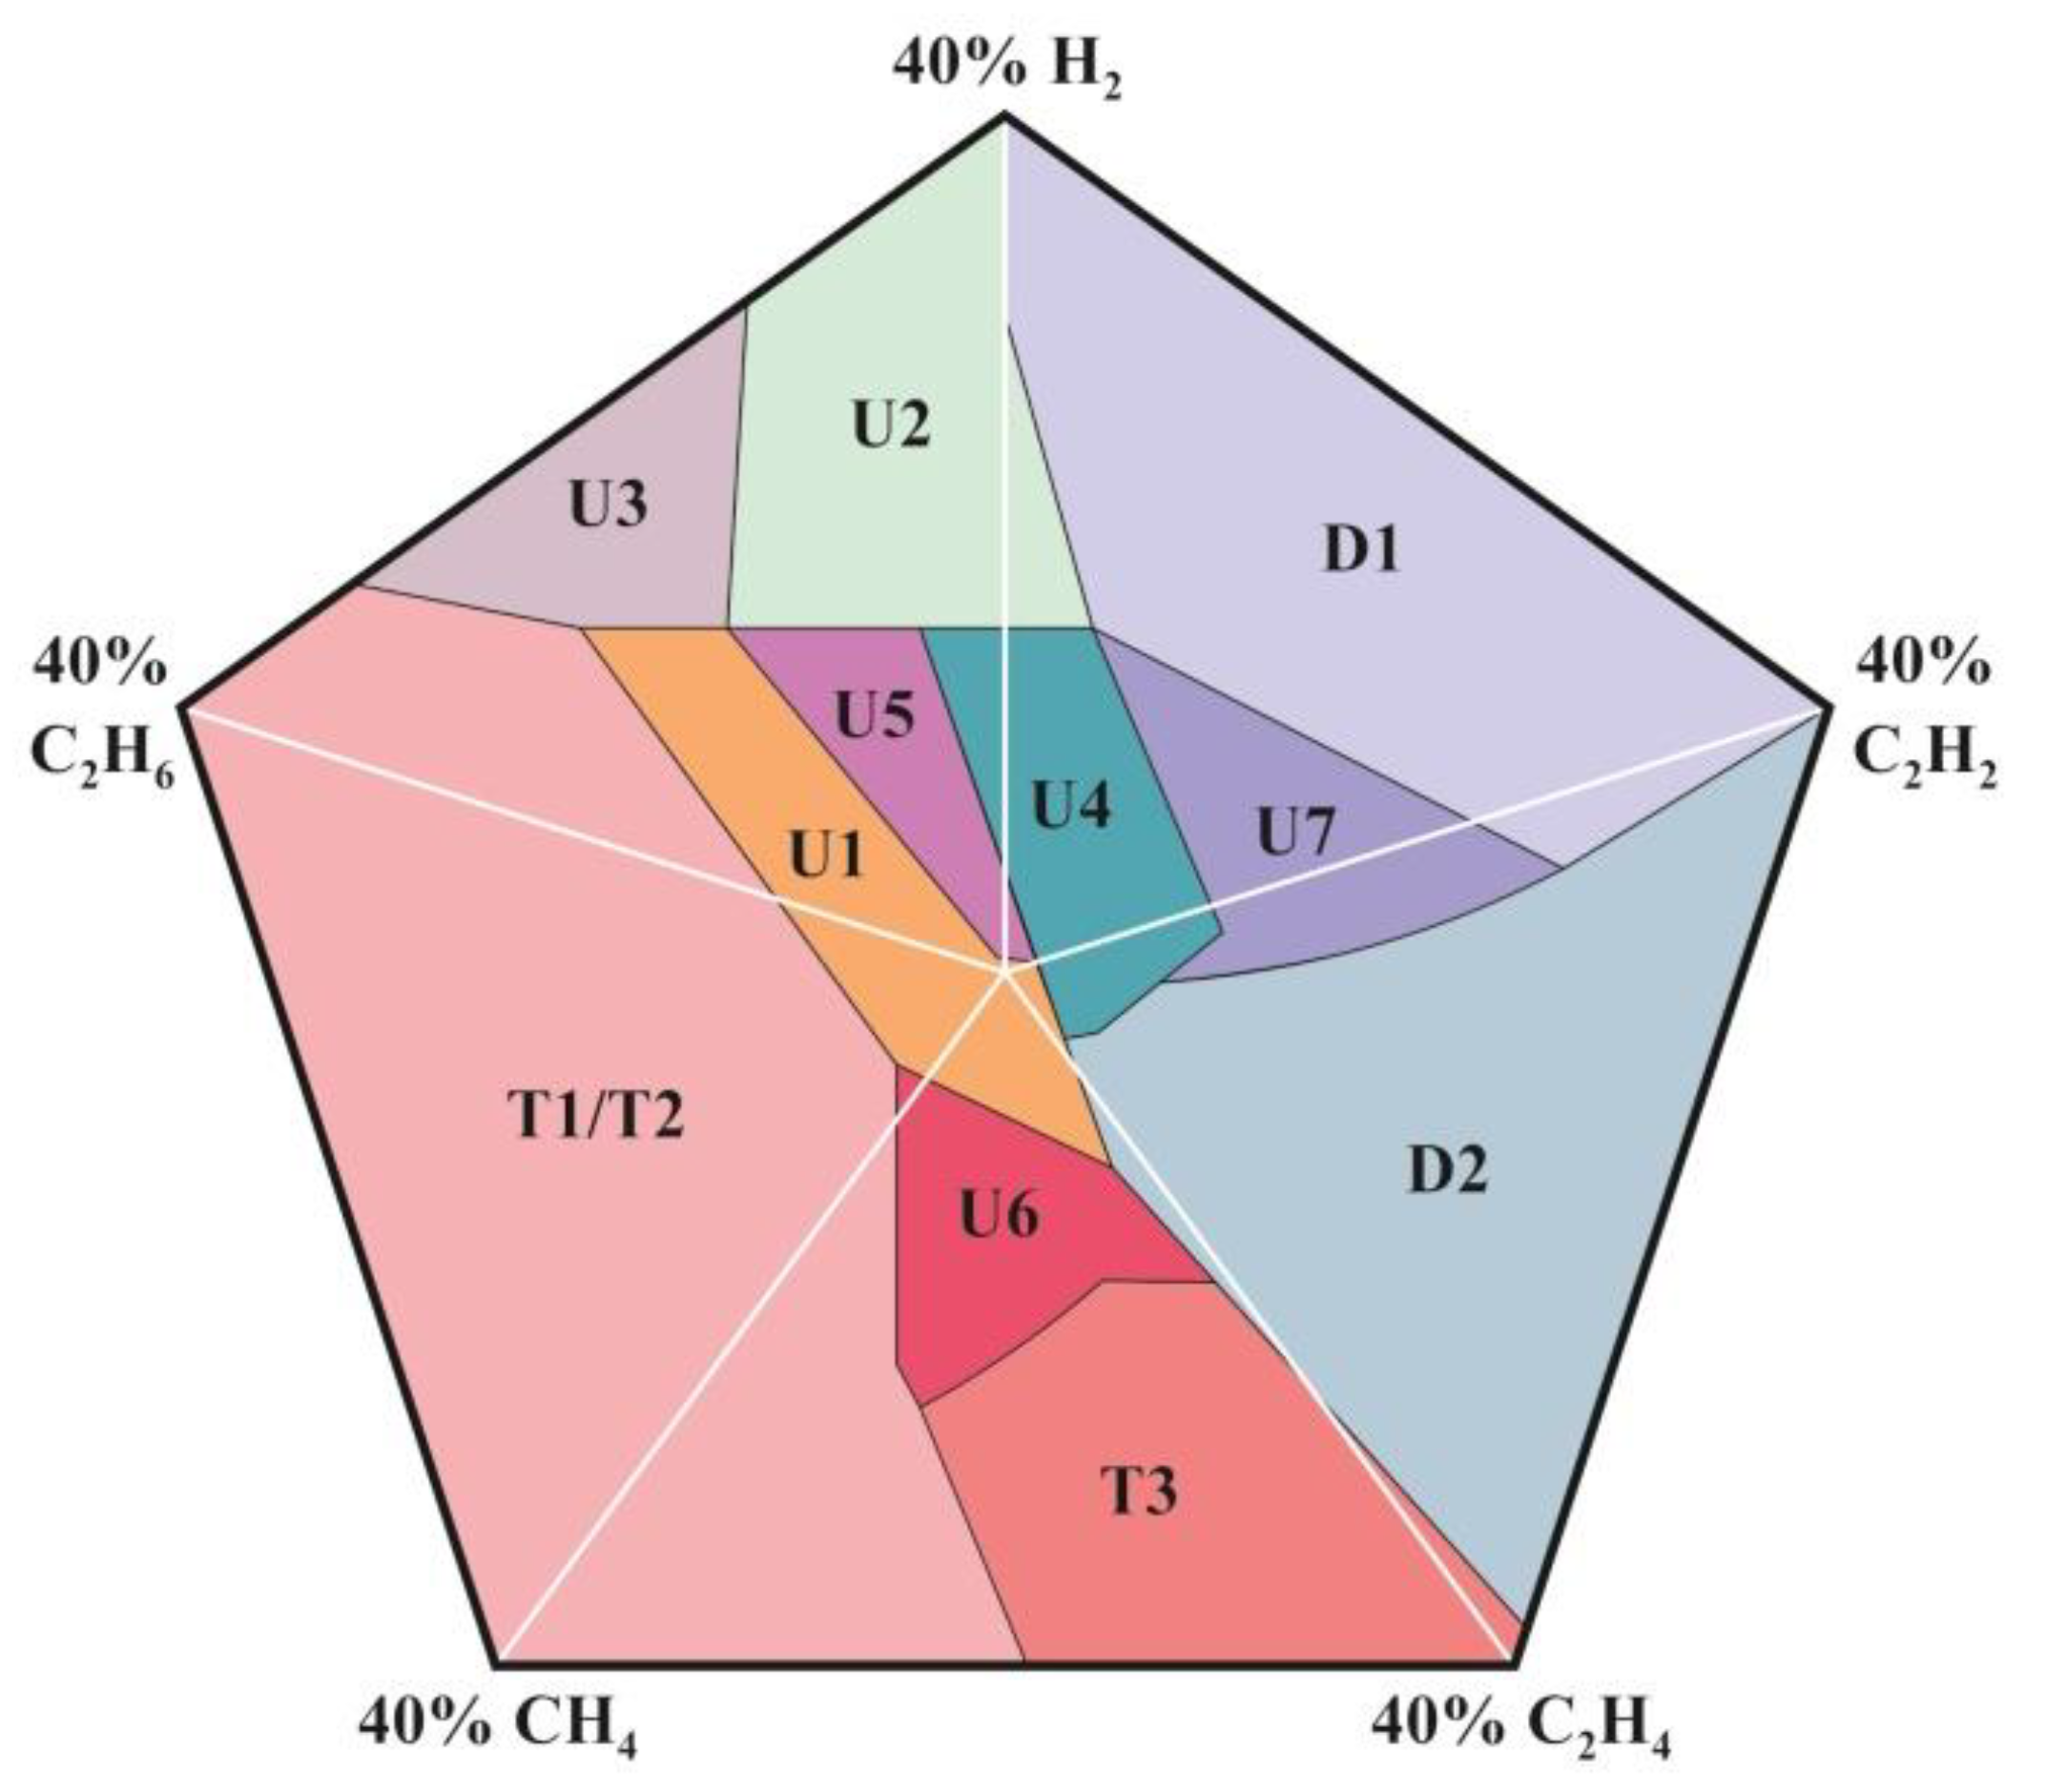
The paper [14] describes a new graphical (pentagon-shaped) DGA-based fault diagnosis technique, which differentiates fault areas based on prediction confidence and which combines the benefits of graphical and analytical methods.
The described pentagon was developed in the Java programming language and the Eclipse IDE, and the initial axes and boundaries were developed using Duval pentagon 1.
On the basis of the individual error distribution model, the new pentagon identifies two main regions according to the certainty of the predictions, the Region of Certainty (ROC) and the Region of Uncertainty (ROU). The Multi-Layer Perceptron (MLP) network is applied to outline overlapping fault areas from their allotment, creating areas of certainty and uncertainty.
Since the different types of faults oscillate in size and are determined by the energy of the formation of the fault gases, it follows that for each type of fault, some gases have dominant concentrations. Thus, the ROCs are distributed at the edges of the new pentagon according to the specific gas or gases they determine. So, if the defect point is positioned in one of the ROCs, then the defect type of the indicated area is predicted to be a defect given by the specified DGA data. If the failure point is located in a ROU, a decision system based on the method of combining the gas ratio and references from the graphical distribution of the failure is used.
Figure 14 shows the new pentagon consisting of four ROCs and seven ROUs (denoted as U1 to U7) as generated by the MLP network, and Table 17 and Table 18 show the faults and codes for the ROC and ROU regions.
It can be seen that T1 and T2 faults have been combined into one area. This is due to the fact that in most of the inspections of the samples analysed, T1 and T2 faults could not be identified separately. There is also no ROC for PDs because there is no region in the pentagon where PD faults are exclusively dominant.
According to [14], the described method has an accuracy of 83%, which indicates a higher performance than the methods with which it was compared, Duval pentagon 1 and the gas ratio combination method. The benefits of this method allow a concrete and precise analysis of the DGA results, providing information on the accuracy of the determined defect.

6. Conclusions

This paper focuses on practical information and applications to manage maintenance based on accurate and up-to-date data.
The diagnostic methods (analytical and graphical) for faults in oil-immersed power transformers are simple, economical and effective. However, all of the available methods described have discrepancies in the presentation of the results for the same defect data and therefore have their own disadvantages:
  • The main disadvantage of the key gas method is the difficulty of interpreting a fault in practice due to the independent gases since during the occurrence of a fault in the transformer, traces of other gases are produced in addition to the gas corresponding to the fault. It is therefore advisable to establish a correlation between them using a correction factor;
  • Fault diagnosis in the case of gas-ratio-based methods is determined when the fault code matches the code combination given by the ratios, but there are no available code combinations with specific fault codes, so the problem of the lack of a decision arises;
  • Due to the incomplete use of diagnostic information, the presence of rigid boundaries and areas of mixed faults, graphical methods have some uncertainty in diagnosing certain faults (e.g., low overheating and partial discharge in Duval triangle 1);
  • None of the methods based on artificial intelligence can be considered the best for diagnosing faults in power transformers, as they are more likely to provide directions for identifying the most appropriate algorithm for the most accurate interpretation of DGA data. We can conclude that complementing AI techniques with other conventional methods is recommended to improve their accuracy and precision.
With proper condition management of oil-immersed power transformers, faults can be detected and diagnosed early, preventing costly repairs and reducing downtime, risk to personnel and the destruction of nearby equipment. Understanding the types of faults and their causes and effects is therefore very important in the development of fault diagnosis methods and techniques, in which dissolved gas analysis plays an important role.
This article has reviewed the main steps in the process of diagnosing the health of power transformer insulation, which involves the science of analysing the gases dissolved in the oil of power transformers immersed in mineral oil, from oil sampling to analysis of the results obtained. In order to emphasise the advantages and disadvantages of the methods approached in this paper, we created Appendix A.
The evolution of the main methods adopted in the international standards was highlighted, providing general information on the evolution of the research in this field, including the development of AI techniques to reduce the diagnosis times and optimise the application of prompt and informed decisions.
This paper can be assimilated as a supporting document to assist other researchers/professionals in the field of developing DGA for carrying out the maintenance processes/procedures necessary for the sustainability of energy systems.
The contents of this paper will be of particular use to engineers who manufacture, monitor and/or use high-power transformers in the energy sector, as well as to undergraduate, master’s and PhD students interested in such applications.
In future papers, we propose approaching methods other than those presented in this paper but also methods for determining the defects and implicitly the state of health of transformers that use alternative oils (silicone and synthetic and natural esters).

Author Contributions

Conceptualisation, A.-M.A., S.E. and M.-C.N.; methodology, A.-M.A. and M.-C.N.; validation, A.-M.A., S.E. and M.-C.N.; formal analysis, A.-M.A. and S.E.; investigation, A.-M.A.; resources, A.-M.A., S.E. and M.-C.N.; writing—original draft preparation, A.-M.A.; writing—review and editing, A.-M.A. and M.-C.N.; visualisation, A.-M.A. and S.E.; supervision, M.-C.N.; project administration, A.-M.A.; funding acquisition, M.-C.N. All authors have read and agreed to the published version of the manuscript.

Funding

This paper was elaborated as part of the NUCLEU Program within the framework of the National Research, Development, and Innovation Plan for 2022–2027, developed with the support of the Ministry of Research, Innovation, and Digitization, Project No. PN 23 33 02 03.

Data Availability Statement

The data are contained within the article.

Conflicts of Interest

The authors declare no conflicts of interest.

Nomenclature

DGADissolved Gas Analysis
H2Hydrogen
CH4Methane
C2H6Ethane
C2H4Ethylene
C2H2Acetylene
CO2Carbon Dioxide
COCarbon Monoxide
O2Oxygen
N2Nitrogen
OLTCOn-Load Tap-Changer
TRTThree Ratio Technique
LEDTLow Energy Degradation Triangle
ETRAElectric Technology Research Association
AIArtificial Intelligence
ROCRegion of Certainty
ROURegion of Uncertainty

Appendix A

Table A1. Advantages and disadvantages of DGA methods.
MethodAdvantagesDisadvantages
Analytical Methods for Fault Diagnosis
Key gas methodFaults that can be detected: electric arcing in oil, partial discharges in oil, overtemperature in oil and cellulose overheatingIt is not widely used for diagnosing transformer conditions.
The Doernenburg ratio methodIdentify incipient faults in transformers such as thermal decomposition, partial discharge, arcingIt provides insufficient information, especially in the case of the existence of multiple faults and cases that fall outside the specified codes.
Rogers and IEC ratio methodsIdentify faults PD, D1, D2, T1, T2, T3A part of the gas ratio values obtained does not fall within the specific range of values, making diagnosis of the fault inconclusive.
There are overlapping situations for type D1 and D2 defects, resulting in the wrong interpretation of the intensity of the type of defect.
TRT (three ratio technique)Identify faults PD1, PD2, D1, D2, T1, T2, T3, T0, DT.
Has an accuracy of 99.86%, compared to 85.67% for the Duval triangle 1 method, 75.08% for the Doernenburg method, 47.34% for the IEC method and 39% for the Rogers method
It provides insufficient information, especially in the case of the existence of multiple faults and cases that fall outside the specified codes.
Single gas ratio methodThree unique gas ratios (CO2/CO, O2/N2 and C2H2/H2) can be used as complementary methods for diagnosing faults in transformers for the involvement of cellulose insulation, mineral oil oxidation, the possibility of contamination of the oil in the transformer main tank with oil or gas from the OLTCIt provides insufficient information, especially in the case of the existence of multiple faults and cases that fall outside the specified codes.
C3 hydrocarbon methodUsed to confirm the temperature range for thermal defects
Graphical fault diagnosis methods
Duval triangle 1Simplicity and robustness.
Faults identified: PD, D1, D2, T1, T2, T3, DT.
Is effective in determining the main type of fault.
New sub-areas make it possible to specify whether arc faults D1 and D2 in operating transformers are in paper or oil.
At the boundary between two fault zones, it is difficult to distinguish which of the two faults is the real one.
Because it uses only three dissolved gases, it provides insufficient information, especially in the case of the existence of multiple faults.
Interaction of stray gases with the correct identification of faults.
Duval triangle 4Is used to obtain more information about low-temperature faults like PD, T1 or T2.
Uses the “low-energy gases”: H2, CH4 and C2H6.
Faults identified: PD, S, O, C.
Because it uses only three dissolved gases, it provides insufficient information, especially in the case of the existence of multiple faults.
Duval triangle 5It is used to obtain more information about T2- or T3-type thermal defects and to confirm defects that present uncertainty after using Duval triangle 4.
Uses the “temperature gases”: C2H4, CH4 and C2H6.
Faults identified: PD, S, O, C, T2, T3.
The new sub-areas indicate the location of paper carbonisation faults.
Because it uses only three dissolved gases, it provides insufficient information, especially in the case of the existence of multiple faults
Gouda triangleResolve the inconsistencies that occur in Duval triangle 1.
Faults identified: N, PD, D1, D2, T1, T2, T3, DT.
Has an accuracy of 85.42%, compared with 77.21% for the Duval triangle, 56.58% for the IEC method, 65.33% for the Doernenburg method and 55.15% for the Rogers method, using the same set of data [12].
Uncertainty—if at least one of the gas concentrations (in ppm) for the five key gases exceeds the limit, the transformer is considered faulty.
At the boundary between two fault zones, it is difficult to distinguish which of the two faults is the real one.
Low Energy Degradation Triangle (LEDT)Is sensitive to both cellulose and oil insulation degradation and the amount of energy that may be present, ensuring early detection of transformer condition changes from normal to fault conditions.
Faults identified: N, PD, D1, D2, T1, T2, T3.
It is only effective when applied to on-line dissolved gas samples, where the dissolved gas trend plays a key role in detecting early changes in the level of insulation degradation.
Duval pentagon 1Is designed for the general analysis of fault types and in addition shows the stray gas “S” area associated with the production of gases during the normal ageing process.They are used after analysis with the Duval triangles and are complementary.
Pentagon 2Suggests filtering the analysis if T1, T2 or T3 failures are identified in Duval pentagon 1.
New sub-areas make it possible to specify whether arc faults D1 and D2 in operating transformers are in paper or oil, and also the location of paper carbonisation faults is specified.
Combined Duval pentagonFacilitates the automatic detection of faults in power transformers in service.
Has fewer defect areas than if both Duval pentagons were used separately.
Mansour pentagonEliminates the shortcomings of the Duval triangle 1 method.It provides insufficient information, especially in the case of the existence of multiple faults.
Heptagon graphTakes into account carbon oxide.
It assesses failures caused by overtemperature and low energy discharges.
It distinguishes between electrical and thermal faults.
The accuracy of this method reached 89.41%, while the Doernenburg, Rogers, IEC and Duval triangle 1 methods have accuracy percentages of 38.48%, 46.43%, 54.67% and 64.67%, respectively, for the same number of samples [17].
ETRA squareShows reliability in identifying faults compared to classical methods.Because it uses only three dissolved gases, it provides insufficient information, especially in the case of the existence of multiple faults.
Nomogram methodIt use the ratio of the five key gases to the gas of the maximum concentration to identify the type of faults in the DGA results.It provides insufficient information, especially in the case of the existence of multiple faults and cases that fall outside the specified codes.

References

  1. Soni, R.; Mehta, B. Review on asset management of power transformer by diagnosing incipient faults and faults identification using various testing methodologies. Eng. Fail. Anal. J. 2021, 128, 105634. [Google Scholar] [CrossRef]
  2. Shutenko, O.; Kulyk, O. Method of fault-type recognition based on the dissolved gas analysis using a set of diagnostic criteria. IET Gener. Transm. Distrib. 2023, 17, 5511–5523. [Google Scholar] [CrossRef]
  3. CIGRÉ. Life Extension of Oil Filled Transformers and Shunt Reactors, W.G. A2.55; Brochure 887; CIGRÉ: Paris, France, 2022; ISBN 978-2-85873-592-1. [Google Scholar]
  4. Rangel Bessa, A.; Farias Fardin, J.; Marques Ciarelli, P.; Frizera Encarnação, L. Conventional Dissolved Gases Analysis in Power Transformers: Review. Energies 2023, 16, 7219. [Google Scholar] [CrossRef]
  5. Wattakapaiboon, W.; Pattanadech, N. The state of the art for dissolved gas analysis based on interpretation techniques. In Proceedings of the IEEE International Conference on Condition Monitoring and Diagnosis (CMD), Xi’an, China, 25–28 September 2016; pp. 60–63. [Google Scholar] [CrossRef]
  6. Shutenko, O.; Kulyk, O. Comparative Analysis of the Defect Type Recognition Reliability in High-Voltage Power Transformers Using Different Methods of DGA Results Interpretation. In Proceedings of the IEEE Problems of Automated Electrodrive. Theory and Practice (PAEP), Kremenchuk, Ukraine, 21–25 September 2020; pp. 1–6. [Google Scholar] [CrossRef]
  7. Wani, S.A.; Rana, A.S.; Sohail, S.; Rahman, O.; Parveen, S.; Khan, S.A. Advances in DGA based condition monitoring of transformers: A review. Renew. Sustain. Energy Rev. J. 2021, 149, 111347. [Google Scholar] [CrossRef]
  8. Bustamante, S.; Manana, M.; Arroyo, A.; Castro, P.; Laso, A.; Martinez, R. Dissolved Gas Analysis Equipment for Online Monitoring of Transformer Oil: A Review. Sensors 2019, 19, 4057. [Google Scholar] [CrossRef] [PubMed]
  9. Nanfak, A.; Eke, S.; Kom, C.H.; Mouangue, R.; Fofana, I. Interpreting dissolved gases in transformer oil: A new method based on the analysis of labelled fault data. IET Gener. Transm. Distrib. 2021, 15, 3032–3047. [Google Scholar] [CrossRef]
  10. Shutenko, O.; Kulyk, O. Analysis of Gas Content in Oil-Filled Equipment with Low Energy Density Discharges. Int. J. Electr. Eng. Inform. 2020, 12, 258–277. [Google Scholar] [CrossRef]
  11. Faiz, J.; Soleimani, M. Dissolved gas analysis evaluation in electric power transformers using conventional methods a review. IEEE Trans. Dielectr. Electr. Insul. 2017, 24, 1239–1248. [Google Scholar] [CrossRef]
  12. Gouda, O.E.; El-Hoshy, S.H.; Hassan, H.; E.L.-Tamaly, H.H. Condition assessment of power transformers based on dissolved gas analysis. IET Gener. Transm. Distrib. 2019, 13, 2299–2310. [Google Scholar] [CrossRef]
  13. Mansour, D.-E.A. Development of a new graphical technique for dissolved gas analysis in power transformers based on the five combustible gases. IEEE Trans. Dielectr. Electr. Insul. 2015, 22, 2507–2512. [Google Scholar] [CrossRef]
  14. Chatterjee, K.; Dawn, S.; Jadoun, V.K.; Jarial, R.K. Novel prediction-reliability based graphical DGA technique using multi-layer perceptron network & gas ratio combination algorithm. IET Sci. Meas. Technol. 2019, 13, 836–842. [Google Scholar] [CrossRef]
  15. Ashkezari, D.; Saha, T.K.; Ekanayake, C.; Ma, H. Evaluating the accuracy of different DGA techniques for improving the transformer oil quality interpretation. In Proceedings of the AUPEC 2011, Brisbane, QLD, Australia, 25–28 September 2011; pp. 1–6. [Google Scholar]
  16. Duval, M.; Lamarre, L. The Duval Pentagon—A new complementary tool for the interpretation of dissolved gas analysis in Transformers. IEEE Electr. Insul. Mag. 2014, 30, 9–12. [Google Scholar]
  17. Gouda, O.E.; El-Hoshy, S.H.; Hassan, H.; El-Tamaly, H.H. Proposed heptagon graph for DGA interpretation of oil transformers. IET Gener. Transm. Distrib. 2018, 12, 490–498. [Google Scholar] [CrossRef]
  18. Power Transformer Health—Low Energy Degradation Triangle (LEDT). Available online: https://powertransformerhealth.com/2020/04/29/low-energy-degradation-triangle-ledt/ (accessed on 12 December 2023).
  19. CEI/IEC 60599; Mineral Oil-Impregnated Electrical Equipment in Service—Guide to the Interpretation of Dissolved and Free Gas Analysis. IEC: Geneva, Switzerland, 2022.
  20. IEEE Std C57.104™-2019; Guide for the Interpretation of Gases Generated in Mineral Oil-Immersed Transformers. IEEE: Piscataway, NJ, USA, 2019; ISBN 978-1-5044-5973-0.
  21. CIGRÉ. Advances in DGA Interpretation; JWG D1/A2.47; Brochure 771; CIGRE: Paris, France, 2019; ISBN 978-2-85873-473-3. [Google Scholar]
  22. Muniz, R.N.; da Costa Júnior, C.T.; Buratto, W.G.; Nied, A.; González, G.V. The Sustainability Concept: A Review Focusing on Energy. Sustainability 2023, 15, 14049. [Google Scholar] [CrossRef]
  23. Aciu, A.-M.; Nicola, C.-I.; Nicola, M.; Nițu, M.-C. Complementary Analysis for DGA Based on Duval Methods and Furan Compounds Using Artificial Neural Networks. Energies 2021, 14, 588. [Google Scholar] [CrossRef]
  24. Gouda, O.E.; El-Hoshy, S.H.; E.L.-Tamaly, H.H. Proposed three ratios technique for the interpretation of mineral oil transformers based dissolved gas analysis. IET Gener. Transm. Distrib. 2018, 12, 2650–2661. [Google Scholar] [CrossRef]
  25. Duval, M. The Duval Triangle for Load Tap Changers, Non-Mineral Oils and Low Temperature Faults in Transformers. IEEE Electr. Insul. Mag. 2008, 24, 22–29. [Google Scholar] [CrossRef]
  26. Duval, M.; Buchacz, J. Gas Formation from Arcing Faults in Transformers—Part II. IEEE Electr. Insul. Mag. 2022, 38, 12–15. [Google Scholar] [CrossRef]
  27. Duval, M.; Buchacz, J. Detection of Carbonization of Paper in Transformers Using Duval Pentagon 2 and Triangle 5. IEEE Trans. Dielectr. Electr. Insul. 2023, 30, 1534–1539. [Google Scholar] [CrossRef]
  28. Cheim, L.; Duval, M.; Haider, S. Combined Duval Pentagons: A Simplified Approach. Energies 2020, 13, 2859. [Google Scholar] [CrossRef]
  29. Duval, M.; Buchacz, J. Identification of Arcing Faults in Paper and Oil in Transformers—Part I: Using the Duval Pentagons. IEEE Electr. Insul. Mag. 2022, 38, 19–23. [Google Scholar] [CrossRef]
  30. Mori, E.; Taukioka, H.; Takamoto, K.; Miyamoto, N.; Kobayashi, T.; Kobayashi, S.; Okubo, H. Latest Diagnostic Methods of Gas-in-oil Analysis for Oil-filled Transformer in Japan. In Proceedings of the IEEE 13th International Conference on Dielectric Liquids (ICDL’99) (Cat. No.99CH36213), Nara, Japan, 25–25 July 1999; pp. 503–508. [Google Scholar] [CrossRef]
  31. Kawamura, T.; Kawada, N.; Ando, K.; Yamaoka, M.; Maeda, T.; Takatsu, T. Analyzing Gases Dissolved in Oil and Its Application to Maintenance of Transformers; CIGRE Session; Report 12–05; CIGRE: Paris, France, 1986; pp. 1–5. [Google Scholar]
  32. Dukarm, J.; Draper, Z.; Piotrowski, T. Diagnostic Simplexes for Dissolved-Gas Analysis. Energies 2020, 13, 6459. [Google Scholar] [CrossRef]
  33. Fan, J.; Wang, F.; Sun, Q.; Bin, F.; Liang, F.; Xiao, X. Hybrid RVM–ANFIS algorithm for transformer fault diagnosis. IET Gener. Transm. Distrib. 2017, 11, 3637–3643. [Google Scholar] [CrossRef]
  34. Hendel, M.; Meghnefi, F.; Senoussaoui, M.E.A.; Fofana, I.; Brahami, M. Using Generic Direct M-SVM Model Improved by Kohonen Map and Dempster–Shafer Theory to Enhance Power Transformers Diagnostic. Sustainability 2023, 15, 15453. [Google Scholar] [CrossRef]
  35. Lin, C.-H.; Wu, C.-H.; Huang, P.-Z. Grey clustering analysis for incipient fault diagnosis in oil-immersed transformers. Expert Syst. Appl. 2009, 36, 1371–1379. [Google Scholar] [CrossRef]
  36. Cui, Y.; Ma, H.; Saha, T. Pattern recognition techniques for power transformer insulation diagnosis—A comparative study part 2: Implementation, case study, and statistical analysis. Int. Trans. Electr. Energy Syst. 2015, 25, 2260–2274. [Google Scholar] [CrossRef]
  37. Wang, T.; Li, Q.; Yang, J.; Xie, T.; Wu, P.; Liang, J. Transformer Fault Diagnosis Method Based on Incomplete Data and TPE-XGBoost. Appl. Sci. 2023, 13, 7539. [Google Scholar] [CrossRef]
  38. Zhang, X.; Zhu, H.; Li, B.; Wu, R.; Jiang, J. Power Transformer Diagnosis Based on Dissolved Gases Analysis and Copula Function. Energies 2022, 15, 4192. [Google Scholar] [CrossRef]
  39. Wang, J.; Zhao, Z.; Zhu, J.; Li, X.; Dong, F.; Wan, S. Improved Support Vector Machine for Voiceprint Diagnosis of Typical Faults in Power Transformers. Machines 2023, 11, 539. [Google Scholar] [CrossRef]
  40. Hadjadj, Y.; Fofana, I.; van der Voort, F.R.; Bussieres, D. Potential of Determining Moisture Content in Mineral Insulating Oil by FTIR Spectroscopy. IEEE Electr. Insul. Mag. 2016, 32, 34–39. [Google Scholar] [CrossRef]
  41. Kornatowski, E.; Banaszak, S.; Molenda, P. Quality Index for Assessment of the Mechanical Condition of Transformers’ Active Part with Frequency Response and Vibroacoustic Measurements. Energies 2024, 17, 1431. [Google Scholar] [CrossRef]
  42. Quintella, C.M.; Meira, M.; Silva, W.L.; Filho, R.G.D.; Araújo, A.L.C.; Elias, T.S., Jr.; Sales, L.J.O. Development of a spectrofluorimetry-based device for determining the acetylene content in the oils of power transformers. Talanta 2013, 117, 263–267. [Google Scholar] [CrossRef]
  43. IEEE Std C57.104™-2008; Guide for the Interpretation of Gases Generated in Mineral Oil-Immersed Transformers. IEEE: New York, NY, USA, 2009; ISBN 978-0-7381-5834-1.
Figure 1. Duval triangle 1.
Energies 17 02331 g001
Figure 2. Duval triangles 4 and 5: (a) Duval triangle 4; (b) Duval triangle 5.
Energies 17 02331 g002
Figure 3. Sub-areas in Duval triangle 1 for faults produced by arc forming.
Energies 17 02331 g003
Figure 4. The sub-areas for faults with paper carbonisation in Duval triangle 5.
Energies 17 02331 g004
Figure 5. The proposed triangular technique (Gouda triangle).
Energies 17 02331 g005
Figure 6. LEDT with the detectable fault areas.
Energies 17 02331 g006
Figure 7. Representation of fault areas in Duval pentagons: (a) Duval pentagon 1; (b) Duval pentagon 2.
Energies 17 02331 g007
Figure 8. Combined Duval pentagon with the ten fault areas [23].
Energies 17 02331 g008
Figure 9. Duval pentagon 2: (a) subzones for arcing faults; (b) sub-areas for paper carbonisation defects.
Energies 17 02331 g009
Figure 10. Mansour pentagon.
Energies 17 02331 g010
Figure 11. Heptagon graph showing the fault areas.
Energies 17 02331 g011
Figure 12. ETRA square.
Energies 17 02331 g012
Figure 13. Nomogram method: (a) low energy discharge reference nomogram; (b) example of fault identification using the nomogram method.
Energies 17 02331 g013
Figure 14. New pentagon with ROC and ROU regions.
Energies 17 02331 g014
Table 1. Key gas faults.
Type of FaultGases GeneratedKey Gas
Electric arc in oil
-
large amounts: H2 and C2H2
-
small amounts: CH4 and C2H4
(there also may be CO and CO2 present)
C2H2
Partial discharges in oil
-
large amounts: H2 and CH4
-
small amounts: C2H6 and C2H4
H2
Over-temperature in oil
-
large amounts: C2H6 and C2H4
-
small amounts: CH4 and C2H2,
C2H4
Cellulose overheating
-
large amounts: CO and CO2
-
small amounts: CH4 and C2H4
CO and CO2
Table 2. Reference values for key gas concentrations [20].
Dissolved GasesH2CH4COC2H2C2H4C2H6CO2
Reference concentrations100120350150652500
Table 3. Failure analysis with the Doernenburg ratio method.
Type of FaultCH4/H2C2H2/C2H4C2H2/CH4C2H6/C2H2
Thermal decomposition>1<0.75<0.3>0.4
Corona (low-intensity PD)<0.1negligible<0.3>0.4
Arcing (high-intensity PD)>0.1 ÷ <1>0.75>0.3<0.4
Table 4. Fault analysis based on the Rogers ratio method.
Type of FaultC2H2/C2H4CH4/H2C2H4/C2H6
Normal unit<0.1>0.1 to <1<1
Partial discharge<0.1<0.1<1
Arcing0.1 to 3.00.1 to 1>3
Low thermal temperature<0.1>0.1 to <11 to 3
Thermal < 700 °C<0.1>11 to 3
Thermal > 700 °C<0.1>1>3
Table 5. Fault analysis based on IEC ratio method.
Fault CodeType of FaultC2H2/C2H4CH4/H2C2H4/C2H6
PDPartial dischargeNS<0.1<0.2
D1Low energy discharge>10.1 ÷ 0.5>1
D2High energy discharge0.6 ÷ 2.50.1 ÷ 1>2
T1Thermal: <300 °CNS>1 but NS<1
T2Thermal: 300 °C < T < 700 °C<0.1>11 ÷ 4
T3Thermal: >700 °C<0.2>1>4
Table 6. Coding of the TRT’s diagnostic interpretation.
Ratio RangeCode
R1R2R3
R1 < 0.05R2 < 1R3 < 0.050
0.05 ≤ R1 ≤ 0.91 ≤ R2 ≤ 3.50.05 ≤ R3 ≤ 0.51
R1 > 0.9R1 > 3.5R3 > 0.52
Table 7. Fault diagnosis using the TRT method.
R1R2R3Type of FaultFault Code
1 or 200 or 1High-temperature thermal fault T > 700 °CT3
1 or 210 or 1Medium-temperature thermal fault 300 °C < T < 700 °CT2
1 or 220 or 1Low-temperature thermal fault 150 °C < T < 300 °CT1
10Low-temperature thermal fault T < 150 °CT0
01 or 20 or 1Low partial dischargePD1
01 or 22High partial dischargePD2
0 or 10 or 12High energy dischargeD2
1 or 222Low energy dischargeD1
20 or 12Combination of electrical and thermal faultsDT
Table 8. Temperature domains for thermal faults.
Gas RatiosTemperature Range [°C]
150 ÷ 300300 ÷ 700>700
C3H6/C3H8<22 ÷ 6>6
C2H4/C3H8<33 ÷ 15>15
Table 9. Faults identified with Duval triangle 1.
Fault CodeType of Fault or Stress
PDCorona-type partial discharges
D1Low energy discharges
D2High energy discharges
T1Thermal faults due to temperature < 300 °C
T2Thermal faults due to temperature 300 °C < T < 700 °C
T3Thermal faults due to temperature > 700 °C
DTCombination of electrical and thermal faults
Table 10. Definition of fault areas in Duval triangles 4 and 5.
Fault CodeType of Fault or Stress
PDCorona-type partial discharges
SStray gassing of mineral oil
CHot spots accompanied by paper carbonisation (T > 300 °C)
OOverheating (T < 250 °C)
T2Thermal faults due to temperature 300 °C < T < 700 °C
T3Thermal faults at very high temperatures (T > 700 °C)
Table 11. Definition of the sub-areas of faults in Duval triangle 5.
Fault CodeType of Fault or Stress in Sub-Areas
C1carbonisation fault between winding turns or inside windings
C2carbonisation fault on the outside of the windings
C3carbonisation fault in cables
4overheating O, only with browning of the paper
Table 12. Classification of fault types in the Gouda triangle.
Fault CodeType of Fault or Stress
T1Thermal faults T < 300 °C
T2Thermal faults 300 < T < 700 °C
T3Thermal faults T > 700 °C
PDCorona-type partial discharge
D1Low energy discharge
D2High energy discharge
DTCombination of electrical and thermal fault
NNormal ageing
Table 13. Definition of the areas of thermal faults in Duval pentagon 2.
Fault CodeType of Thermal Faults or Stress
Ooverheating < 250 °C
Cthermal faults with/followed by paper carbonisation
T3-Hhigh-temperature faults that only occur in the oil
Table 14. Definitions of fault areas in the combined Duval pentagon.
Fault Area CodeDefinition of Fault Areas
PDCorona-type partial discharges
D1Low-energy electrical discharges
D2High-energy electrical discharges
SStray gassing of mineral oil
T1-OThermal faults at temperatures < 300 °C but without solid insulation carbonisation
T1-CThermal faults at temperatures < 300 °C, with probable involvement of solid insulation, possible carbonisation
T2-OThermal faults at temperatures between 300 °C and 700 °C, but with little chance of solid insulation or paper carbonisation
T2-CThermal faults at temperatures between 300 °C and 700 °C, with a high probability of solid insulation involvement (around 80%)
T3-HThermal faults in oil only, temperature range > 700 °C
T3-CThermal failures at high temperatures (over 700 °C) with solid insulation involved in the fault (paper carbonisation)
Table 15. Names of the fault areas in the Mansour pentagon.
Name of Fault AreaFault Area Code in Mansour PentagonFault Area Code in IEC 60599 [19]
Low thermal fault—T < 300 °CLTT1
Medium thermal fault—300 °C < T < 700 °CMTT2
High thermal fault—T > 700 °CHTT3
Low energy dischargeLEDD1
High energy dischargeHEDD2
Partial dischargePDPD
Table 16. Names of the fault areas in the heptagon.
Definition of Fault AreasFault Area Code
High concentration of cellulose degradationHCCD
Average cellulose degradation concentrationMCCD
Low cellulose degradation concentrationLCCD
Thermal fault < 300 °CT1
Thermal fault from 300 °C to 700 °CT2
Thermal fault > 700 °CT3
Electrical and thermal failureTD
Low energy consumption dischargesD1
High energy dischargesD2
Partial dischargesPD
Table 17. Names of ROCs.
Definition of ROCsROC Code
Low energy dischargeD1
High energy arcingD2
Thermal fault: T < 300 °C/300 °C < T < 700 °CT1/T2
Thermal fault T > 700 °CT3
Table 18. Sets of faults related to ROUs.
ROU CodeSet of FaultsROU CodeSet of Faults
U1T1/T2, PD, D2U5PD, D1, D2, T1/T2,
U2PD, D1U6D2, T1/T2, T3
U3T1/T2, PD,U7D1, D2
U4PD, D1, D2
Disclaimer/Publisher’s Note: The statements, opinions and data contained in all publications are solely those of the individual author(s) and contributor(s) and not of MDPI and/or the editor(s). MDPI and/or the editor(s) disclaim responsibility for any injury to people or property resulting from any ideas, methods, instructions or products referred to in the content.