Article

Research on Quantitative Diagnosis of Dendrites Based on Titration Gas Chromatography Technology

1
China Electric Power Research Institute, Beijing 100192, China
2
State Key Laboratory of Automotive Safety and Energy, Tsinghua University, Beijing 100084, China
3
International Infrastructure System Research Center, Power System Analysis Laboratory, Doshisha University, Kyoto 610-0321, Japan
4
Graduate School of Science and Engineering, IIST, Intelligent Robotics Laboratory, Hosei University, Tokyo 184-8584, Japan
*
Author to whom correspondence should be addressed.
Energies 2024, 17(10), 2409; https://doi.org/10.3390/en17102409
Submission received: 20 March 2024 / Revised: 22 April 2024 / Accepted: 27 April 2024 / Published: 17 May 2024
(This article belongs to the Special Issue Advances in Battery Technologies for Electric Vehicles)

Abstract

:
Lithium plating can cause capacity fade and thermal runaway safety issues in lithium-ion batteries. Therefore, accurately detecting the amount of lithium plating on the surface of the battery’s negative electrode is crucial for battery safety. This is especially crucial in high-energy-density applications such as battery energy storage systems or in electric vehicles (EVs). Early detection of lithium plating is crucial for evaluation of reliability and longevity. It also serves as a method for early diagnostics in practical industrial applications or infrastructure, such as EV transportation. This can enhance its impact on customers. This study validates the effectiveness of titration gas chromatography (TGC) technology in quantitatively detecting lithium plating on graphite negative electrodes in lithium-ion batteries. The results show that it can detect a minimum of 2.4 μmol of metallic lithium. Compared with the heating direct current resistance and reference electrode methods, which can be used to perform only qualitative dendrite detection, TGC has a wider range of detection. Compared with the nuclear magnetic resonance (NMR) method with higher quantitative detection accuracy, the maximum difference between the detection results of the two methods was only 7.2%, but the TGC method had lower cost and higher implementation convenience. In summary, among various dendrite detection methods, the TGC method can not only realize the effective quantitative detection of lithium plating, but also comprehensively consider its detection range, implementation convenience, cost, and detection accuracy, indicating that it is suitable for engineering applications and has the prospect of realizing large-scale quantitative detection of lithium plating in lithium-ion batteries.

1. Introduction

With the widespread adoption and application of electric vehicles, safety incidents have occurred from time to time, posing threats to the life and property of drivers and passengers [1]. One typical scenario of electric vehicle accidents is self-ignition during charging. Under charging conditions such as low temperature, high charge rate, and overcharging, lithium plating may occur on the negative electrode of the lithium-ion battery. Lithium plating is an abnormal occurrence during the charging process of lithium-ion batteries. Instead of integrating into the negative electrode material, lithium ions are deposited on the surface of the negative electrode as metallic lithium [2,3,4,5,6]. This metallic lithium often does not form a smooth coating but manifests as dendritic crystals, known as lithium dendrites [7]. Lithium dendrites possess high reductive activity and a large specific surface area. Their growth can lead to several risks. For instance, overgrown lithium dendrites can pierce the separator, causing a short circuit between the positive and negative electrodes, and potentially leading to the lithium-ion battery catching fire or even exploding [8,9,10,11]. Moreover, lithium dendrites cannot be completely reversibly oxidized during the discharge process. The dendrites detach from the negative electrode, forming “dead lithium”, which results in the loss of active lithium inside the battery, reducing the Coulombic efficiency and decreasing the capacity [12,13]. The newly formed metallic lithium surface reacts with the electrolyte to form a new solid electrolyte interface (SEI) film [14,15]. The SEI film plays a critical role in protecting the lithium metal from further reaction with the electrolyte and enabling stable lithium plating/stripping [16]. Meanwhile, this reaction consumes the electrolyte, increases the internal resistance of the battery, locally loses activity, and reduces the capacity [17,18,19,20]. Therefore, it is crucial to deeply understand the lithium plating phenomenon that may occur during the battery’s charging process, explore its causes and detection methods, and ensure the safe operation of the lithium-ion (Li-Ion) battery throughout its life cycle [21,22].
To date, many researchers have used various technical means to detect lithium plating. The most common one is the external characteristic method, which mainly relies on external characteristic signals such as voltage, current, temperature, and internal resistance of the battery during use and performs conversion to judge whether the battery is lithium plating. Representative methods include the relaxation voltage curve method, differential voltage analysis (DVA), the Arrhenius criterion method, internal resistance capacity (R-Q), etc. [23,24,25]. These methods are simple and easy to implement, and do not require disassembly of the battery. They are expected to be applied under actual use conditions to achieve real-time detection and monitoring of battery lithium plating. However, the current non-destructive lithium-plating detection methods for batteries generally involve qualitative detection, and it is still difficult to achieve quantitative detection of battery lithium plating. It can often only be corroborated by battery capacity decay and other means to verify the lithium-plating detection results, and it is difficult to determine the detection accuracy. Furthermore, there is a lack of direct evidence of the amount of metallic lithium deposited, and this is often questioned and challenged in the application process.
Physical detection methods may be employed. These are mainly intuitive observation methods and physicochemical analysis methods with the help of high-precision experimental equipment, such as scanning electron microscopy (SEM), transmission electron microscopy (TEM), ultrasonic waves, and X-ray diffraction (XRD). In situ TEM is also an essential visual observation research method to detect lithium plating. Zeng et al. [26] used TEM technology to study the lithium plating of specially made lithium-ion batteries, successfully observed the growth and melting process of lithium dendrites on the negative electrode surface and SEI film, and also provided inspiration for the optimized design of lithium-ion battery electrodes and addressing the internal short-circuit fault caused by the growth of lithium dendrites. Deng et al. [27], in the application of ultrasonic technology to characterize LiFeO4 batteries, indicated that the ultrasonic projection signal dropped sharply after low-temperature charging at the ear of the pole, which was a clear signal of abnormality. After disassembly, it was found that there was indeed obvious lithium plating at the ear of the pole, which confirmed the feasibility of using ultrasonic waves in lithium-plating detection. However, the above physical detection methods have common disadvantages: the experimental equipment is expensive, the cost is high, and quantitative lithium-plating detection cannot be performed.
Therefore, the development of destructive and quantitative lithium-plating detection methods is very important for researching the lithium-plating problems in lithium-ion batteries. The currently effective quantitative lithium-plating detection methods include solid-state nuclear magnetic resonance technology (SSNMR) and titration technology [titration -gas chromatography detection technology (TGC), mass spectrometry titration (MST) technology [28,29]. Nuclear magnetic resonance (NMR) is also an important experimental method for the quantitative detection of lithium plating [30,31]. J.Arai et al. [32] conducted solid-state in situ nuclear magnetic resonance analysis on a full battery with LiCoO2 as the positive electrode material and carbon as the negative electrode material during charging. The experiment clarified that lithium in different chemical environments showed different chemical shifts in the spectrum [33], and the area of the peak at different positions corresponded to the proportion of lithium elements in different states. Although NMR technology can accurately measure the amount of metallic lithium, it can analyze only about 50 mg of sample each time, and the detection equipment is expensive. In addition, the sample preparation is troublesome, and it is difficult to apply on a large scale in actual battery analysis. Titration technology mainly uses the characteristic reaction of metallic lithium with water or acid solution and production of gases such as hydrogen to detect battery lithium plating [34]. Mcshane et al. [35] proposed the MST method to detect battery lithium plating using sulfuric acid as the titration solution. Sulfuric acid reacts not only with metallic lithium and graphite intercalated with lithium but also with lithium salts in the SEI film, producing different gases. The amounts of inert lithium and lithium salts can be calculated based on the quantities of H2, CO2, and C2H2 gases detected via the mass spectrometer. However, there may be multiple substances in the battery’s negative electrode that produce the same gas, so this method cannot distinguish the individual content of each substance and, therefore, cannot accurately detect the amount of battery lithium plating. Compared with nuclear magnetic resonance technology, the principle of titration and its operation is relatively simple, and there are no special requirements for preparing the sample. It is expected to be used for detecting large-scale lithium plating at the level of the electrode sheet and even the core roll, and it is worth focusing on its development. At present, the titration method has been well applied in the detection of dead lithium in metallic lithium batteries, while the effectiveness of its use for quantitative detection in Li-Ion batteries still needs further research.
Based on the above, this paper compares dendrite detection methods based on heating DC resistance, reference electrode, TGC technology, and NMR technology. The above methods were analyzed from four evaluation indicators: detectable range, implementation convenience, cost, and detection accuracy. Among them, the heating DC resistance and reference electrode methods can realize only the qualitative detection of lithium plating, while the TGC method and NMR method can realize the quantitative detection of lithium plating, have a wider detection range, and are more suitable for accurately exploring the relationship between different charging conditions and the severity of lithium plating. Compared with the NMR method, the TGC method has better implementation convenience and lower cost, and its quantitative detection accuracy is also similar to that of the NMR method. Comprehensively considering the above four dimensions, the TGC method can realize the quantitative detection of dead lithium in lithium-ion batteries while taking into account cost control, implementation convenience, and high detection accuracy. This is of great significance for accurately exploring fast charging boundaries and ensuring safe operating conditions in electric vehicle charging scenarios.

2. Experiment

2.1. Dendrite Detection Based on Heating DC Resistance

When lithium metal produced by lithium plating reacts with the electrolyte, lithium plating in batteries causes an increase in DC internal resistance during heating. Therefore, a lithium-plating detection method is proposed, based on measuring the change in DC internal resistance when heated. The effectiveness of this proposed method was investigated under two states: 100% state of charge (SOC) and 0% SOC, with the experimental design shown in Figure 1. Table 1 provides the basic information of the commercial soft-pack lithium-ion battery used for the lithium-plating detection experiments.

2.2. Dendrite Detection Based on Reference Electrode

The oxidation–reduction potential of lithium ions is 0 V (vs. Li/Li+). Therefore, when the overpotential at the negative electrode is below 0 V, it indicates that lithium-plating reaction may have occurred inside the battery. In order to obtain the negative electrode potential of lithium-ion batteries during charging and discharging, and to investigate the occurrence of lithium-plating side reactions inside the battery, it was necessary to implant a reference electrode into the battery to indirectly obtain the required battery information. This experiment focused on lithium iron phosphate LiFePO4 (LFP) blade batteries, involving the implantation of a reference electrode and subsequent experimental verification. The specific parameters of the battery are presented in Table 2.
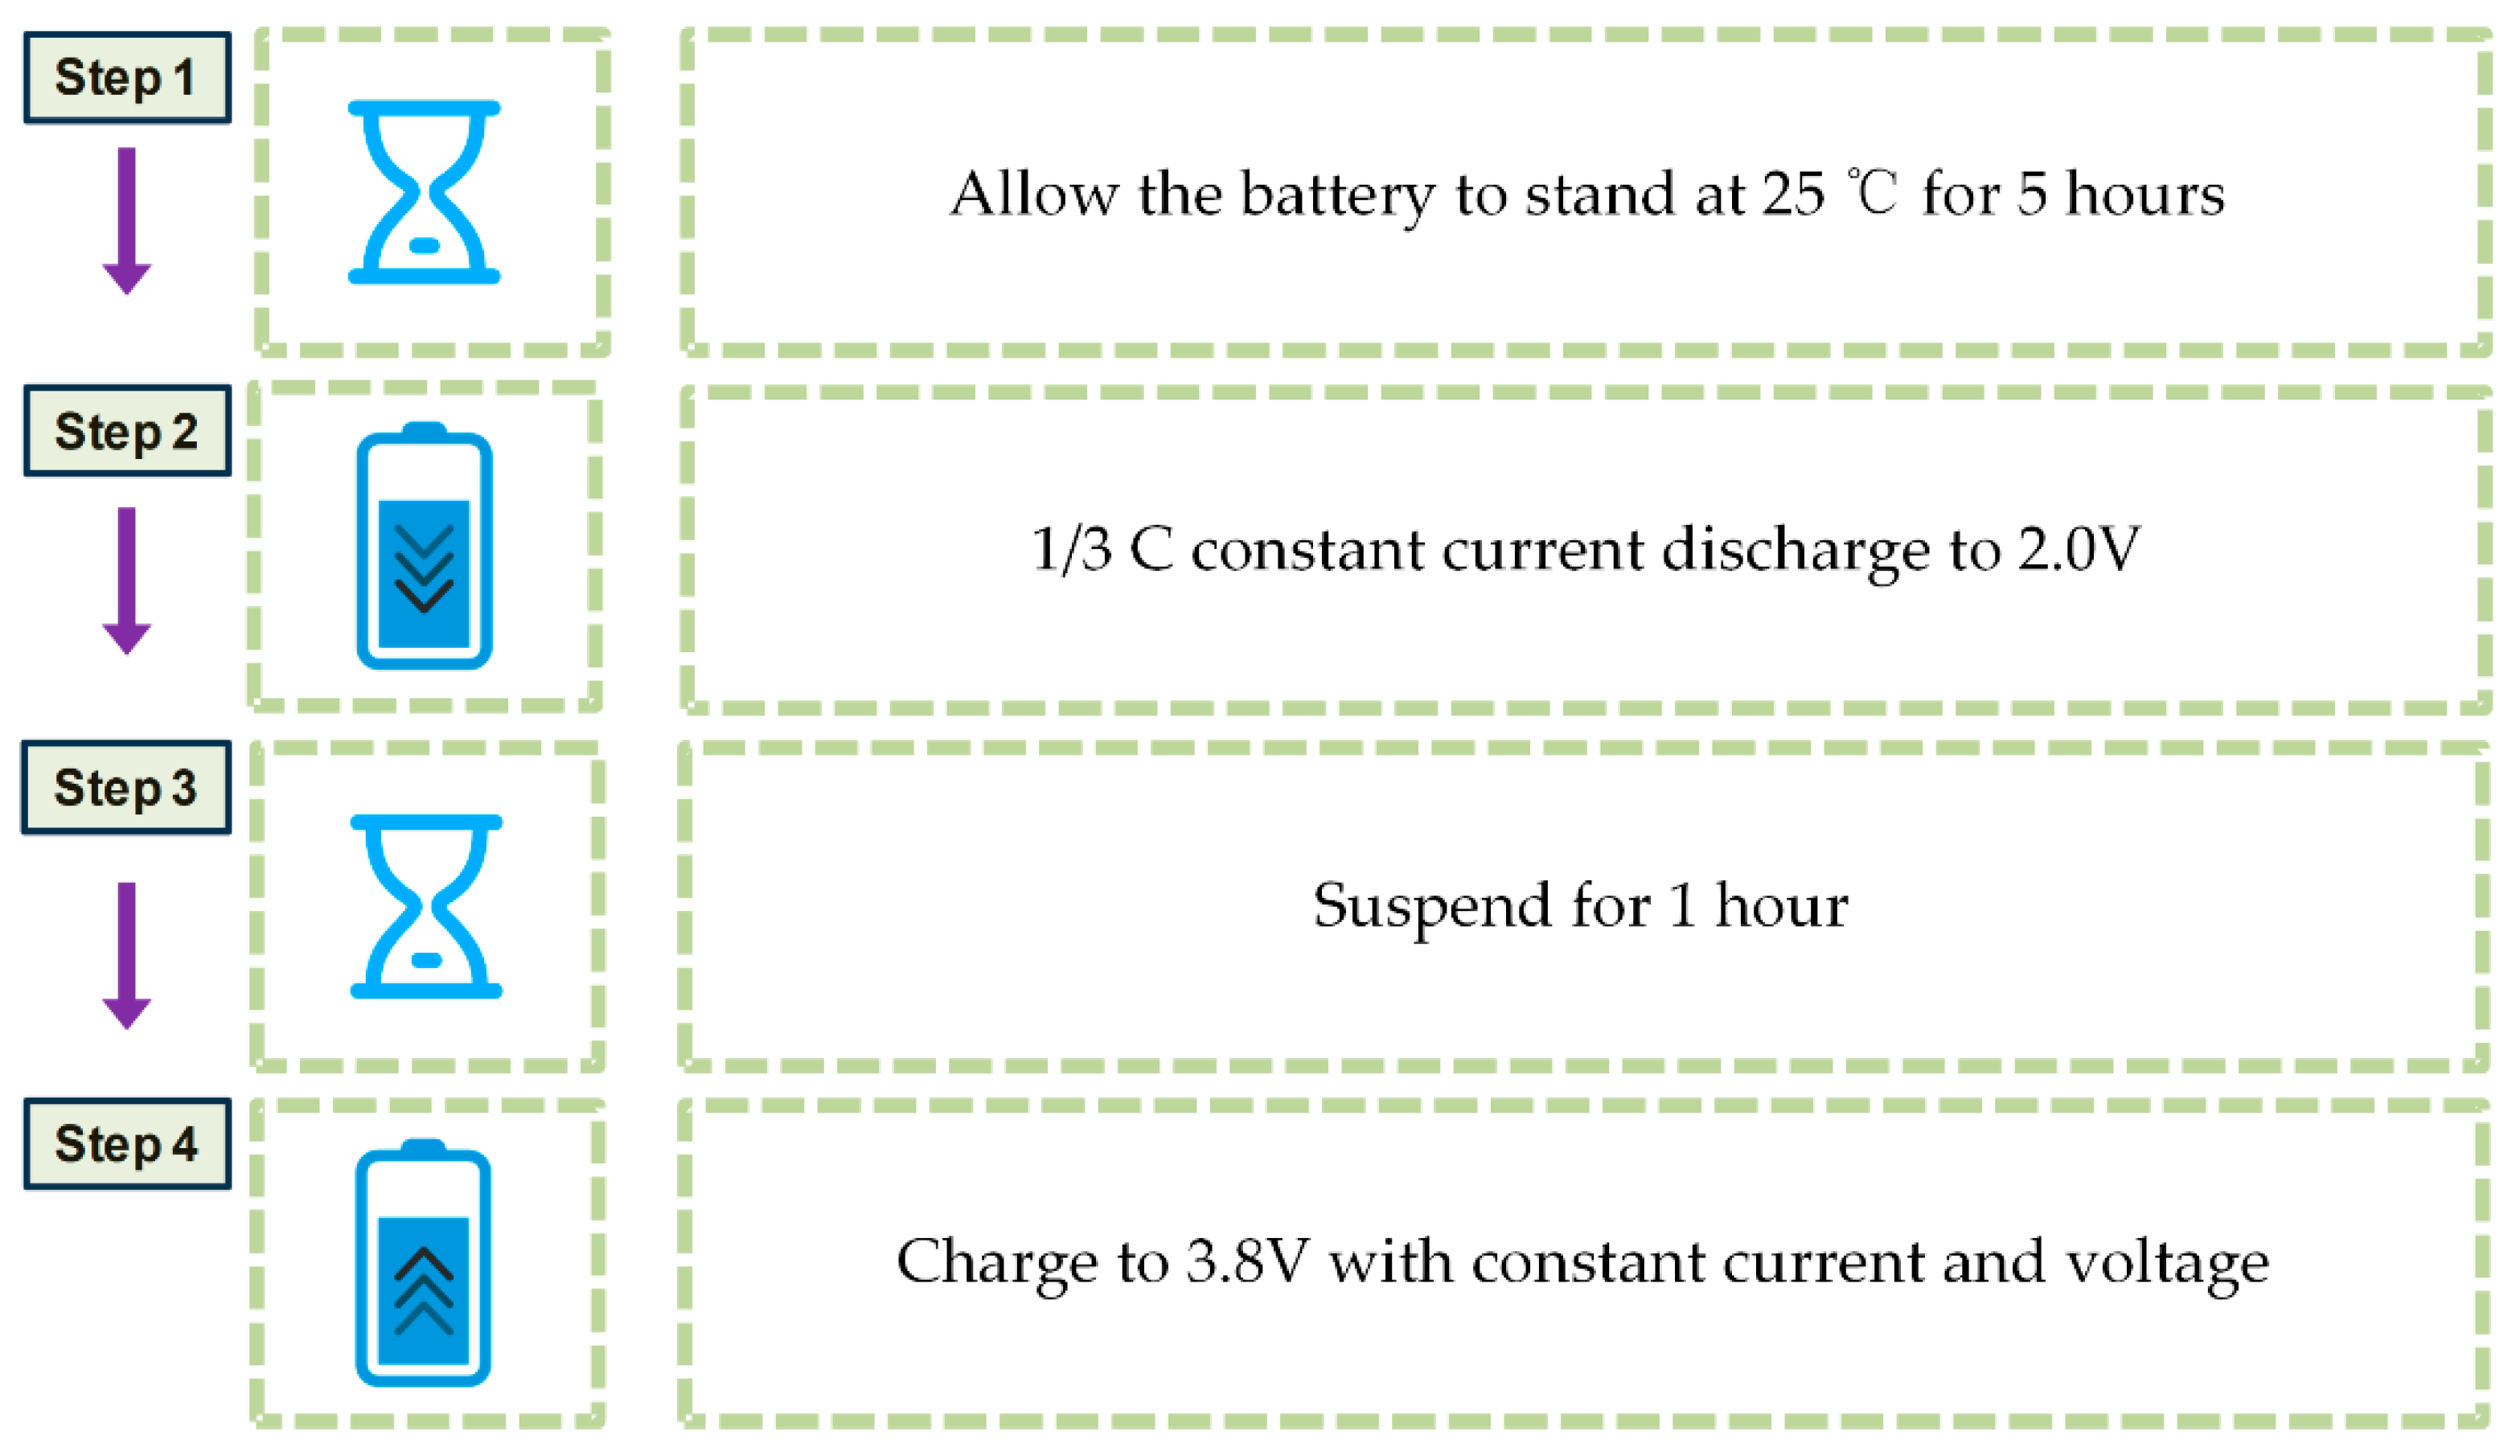
After the implanted reference electrode was verified for stability and accuracy, the battery underwent charge–discharge tests at various rates. During the 10 h rest period following the activation of the reference electrode, the first 3 h were a normal depolarization process for the battery, with the negative electrode potential decreasing normally. In the subsequent 7 h, the maximum fluctuation of the negative electrode potential was 2.95 mV, demonstrating the high stability of the reference electrode. Subsequent experiments also proved that the reference electrode, made in this way, can provide accurate measurements of the negative electrode potential, with a lifespan of more than two weeks. Via comparing the negative electrode potential during the charging phase of the last two stable cycles, the root mean square error (RMSE) between them was found to be only 4.3 mV, and the RMSE of the battery terminal voltage repeatability comparison in the cycle process of the last two cycles was only 2.8 mV [36]. These data fully demonstrate that the reference electrode implanted in the pouch cell using this method was stable and reliable and had almost no impact on the battery [37,38]. Due to the increased likelihood of lithium plating at higher charging rates, this experiment was conducted at 25 °C with six different constant-current constant-voltage (CCCV) charging rates: 1/6 C, 1/3 C, 1/2 C, 1 C, 1.5 C, and 1.9 C. Each charging rate corresponded to a fresh battery cell. Before starting the experiment, the batteries were placed in a 25 °C temperature chamber and allowed to stand for 5 h to ensure temperature equilibrium both inside and outside the battery. The temperature sensor was fixed at the middle position on the outside of the battery, monitoring temperature changes during the experiment to ensure the safety of the experiment. Subsequently, a constant current (CC) discharge at 1/3 C rate was conducted until reaching the cutoff voltage. After a 1 h rest period, the batteries underwent CCCV charging tests. Throughout the experiment, the negative electrode potential of the batteries was continuously monitored and recorded. The same procedure was repeated when switching to different rates. The detailed procedure is illustrated in Figure 2.

2.3. Dendrite Detection Based on TGC Technology

2.3.1. Battery Preparation for Measurement

The battery used in this study was a soft-pack battery with a rated capacity of 1 Ah, and the positive and negative electrodes of the battery were L i x N i 0.5 C o 0.2 M n 0.3 O 2 and graphite, respectively. The basic information of the battery is shown in Table 3. The lithium plating was induced by using low-temperature charging. In the test, the battery was placed in conditions at a temperature of −5 °C and charged with constant current and voltage using a charging multiplier of 1 C (1 A), with a cut-off current of C/20, and then discharged with constant current at C/3 to the cut-off voltage of 3.0 V. The battery was cycled under these conditions five times to obtain the lithium plating on the battery. The capacity of the battery was calibrated before and after the low-temperature cycling to determine the capacity decay and judge the degree of lithium plating. Capacity calibration of the battery at 25 °C was carried out as follows: C/3 (0.333 A) constant current charging to the cut-off voltage (4.2 V) followed by constant voltage charging to the cut-off current 1/20 C (0.05 A), and then C/3 constant current discharging to the cut-off voltage (3.0 V), cycling three times, and the last discharging capacity was recorded as the capacity of the battery. In this study, two batteries, A and B, were selected from the same batch for low-temperature cycling aging to induce lithium plating. Batteries A and B underwent five and six cycles of low-temperature cycling, respectively, which resulted in different degrees of lithium plating. The lithium plating of batteries A and B is shown in the following table.

2.3.2. Titration Gas Chromatography Test

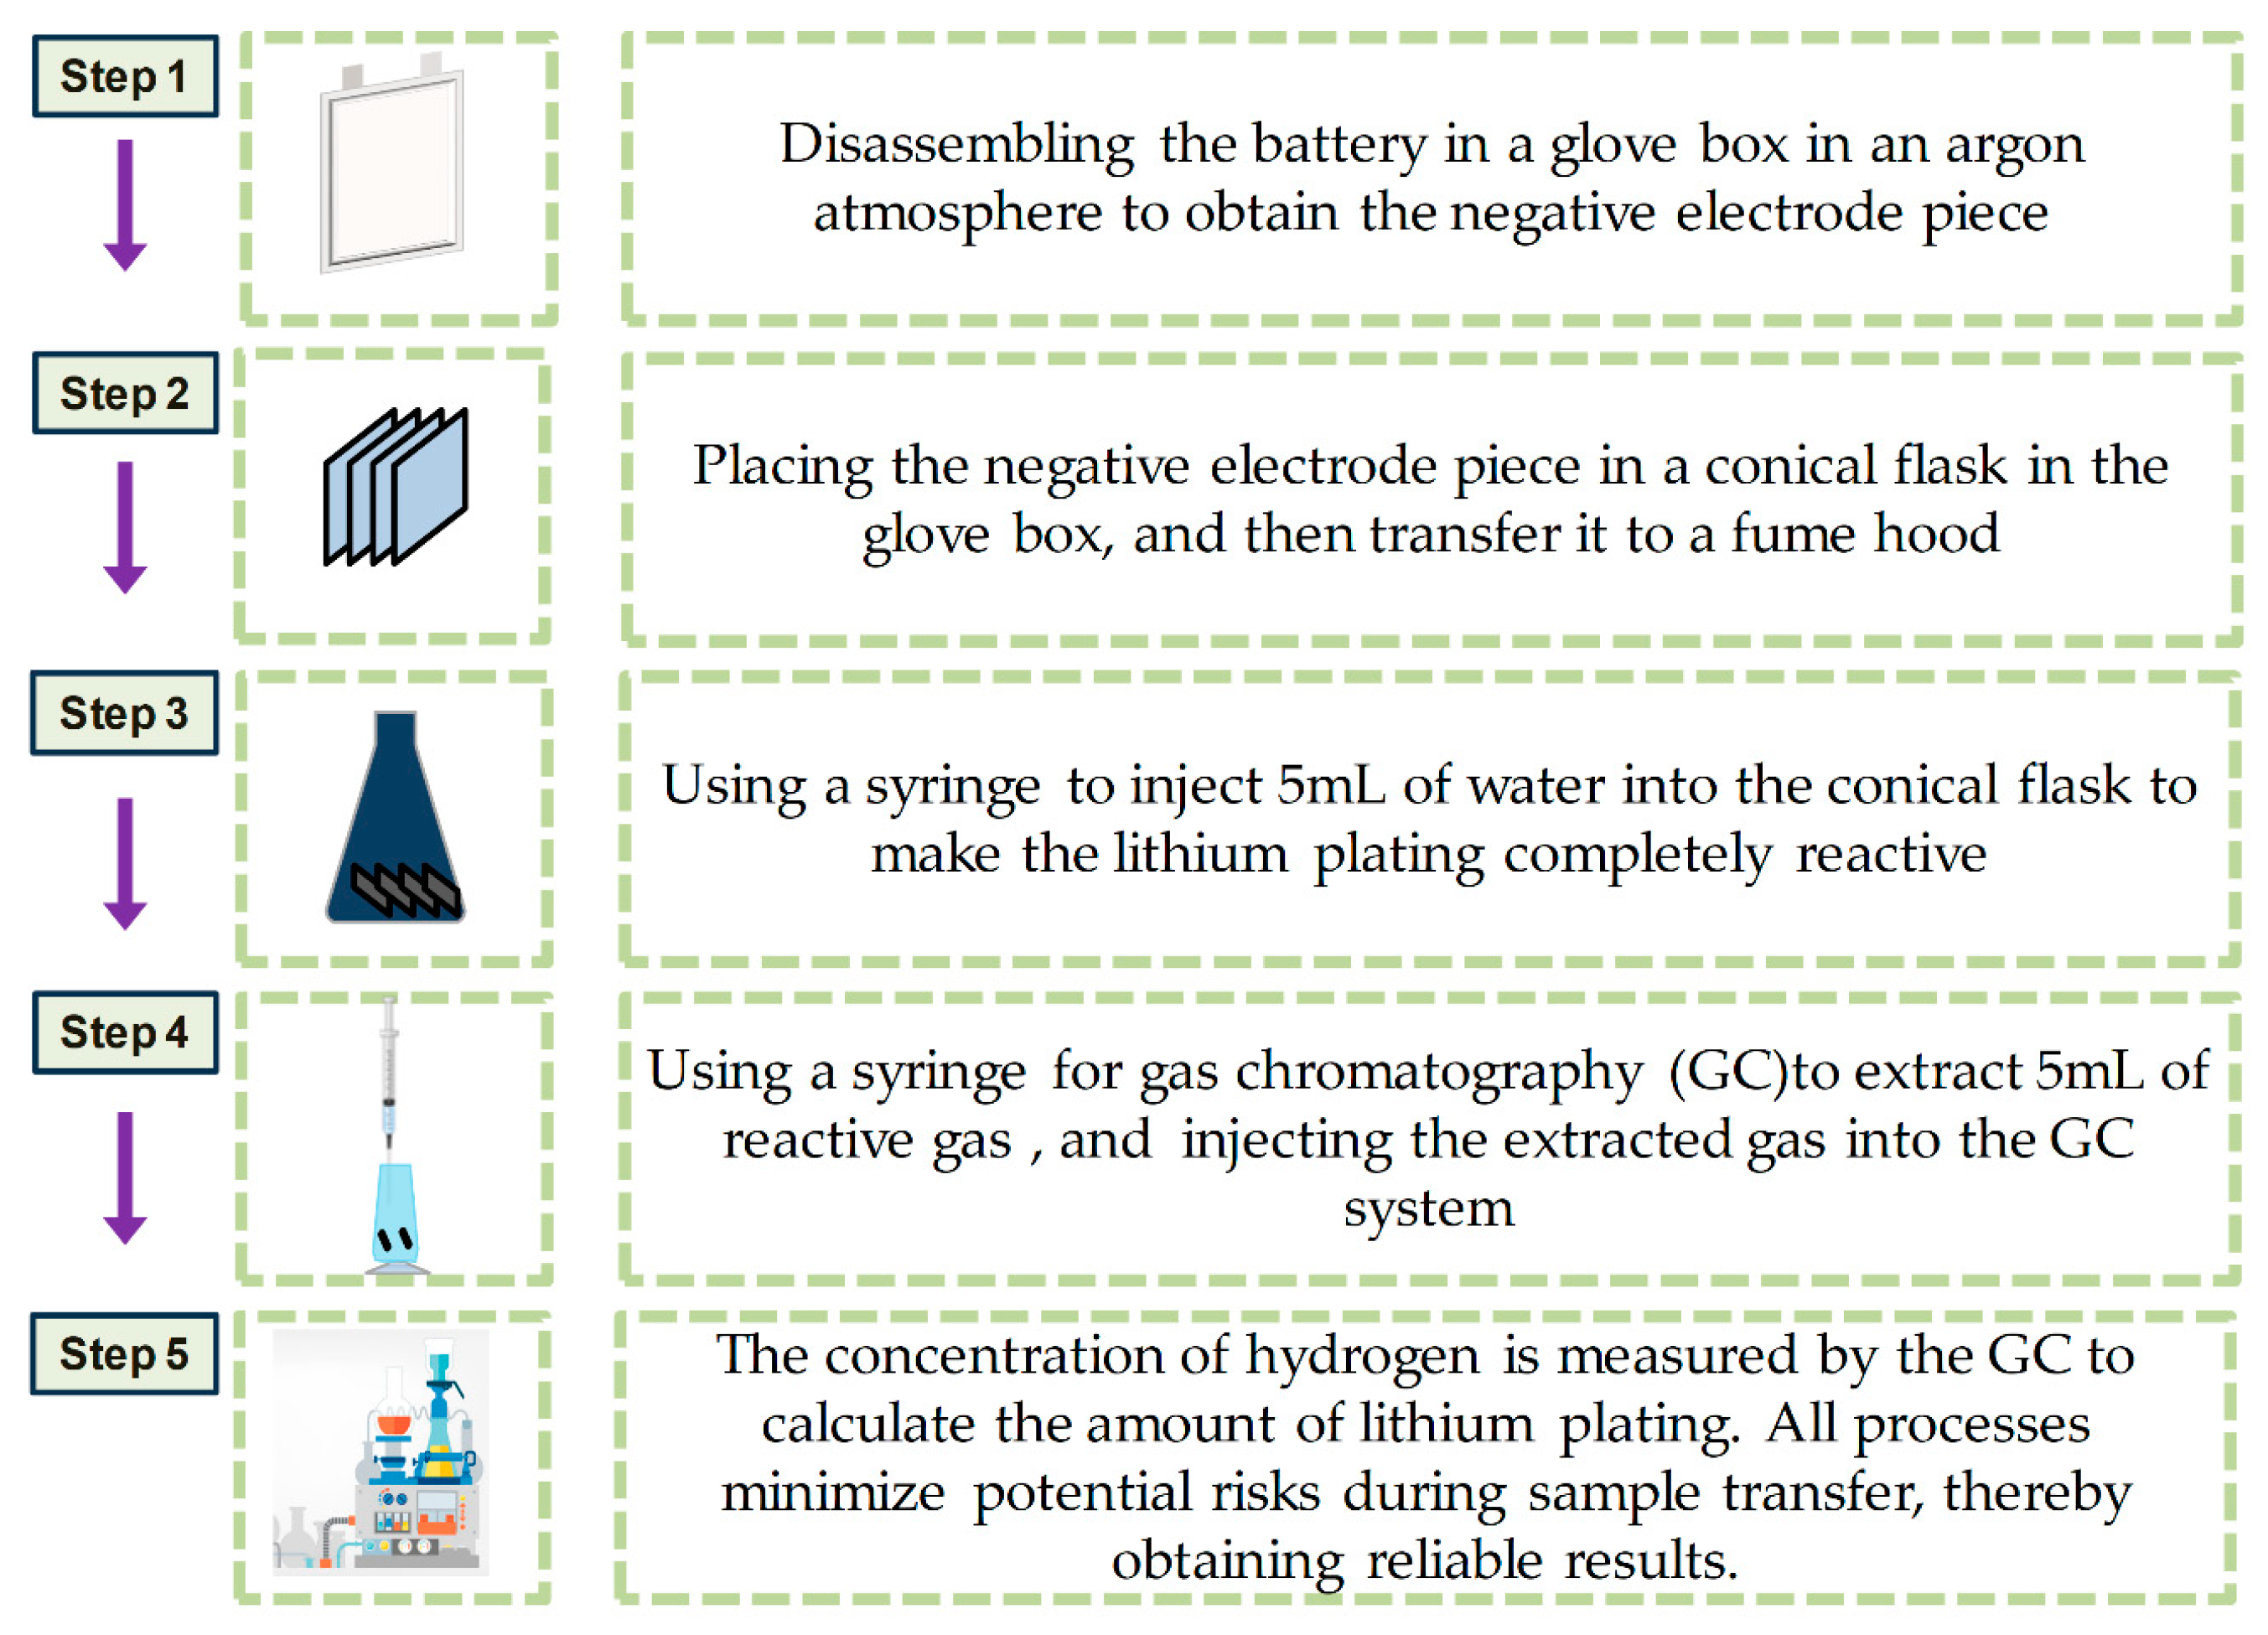
Figure 3 shows the process of lithium plating on a battery measured with TGC, encompassing five steps:
(1)
Disassembling the battery in a glove box in an argon atmosphere to obtain the negative electrode piece;
(2)
Placing the negative electrode piece in a conical flask in the glove box, and then transferring it to a fume hood;
(3)
Using a syringe to inject 5 mL of water into the conical flask to make the lithium plating completely reactive;
(4)
Using a syringe for gas chromatography (GC) to extract 5 mL of reactive gas, and injecting the extracted gas into the GC system;
(5)
Measuring the concentration of hydrogen via the GC to calculate the amount of lithium plating. All processes minimize potential risks during sample transfer, thereby obtaining reliable results.
The carrier gas during the experiment was nitrogen, an AL203 (50 m × 0.53 mm × 15 μm) column and thermal conductivity detector (TCD) were used, and the injection mode was 1 mL quantitative loop. The temperature of the gasification chamber at the injection port was 250 °C, the injection time is 1 min, the split ratio was 5, and the flow rate of the carrier gas was 51 mL/min. The temperature program was set at 50 °C for 2 min and then increased to 150 °C at 20 °C/min for 3 min, and the temperature of the TCD detector was 190 °C. The TGC method achieved quantitative analysis and diagnosis of lithium plating based on reaction Equation (1):
2 L i + 2 H 2 O = 2 L i O H + H 2
In order to achieve quantitative detection of lithium plating in batteries, the whole test system needed to be calibrated before performing the battery negative electrode test. The GC was first calibrated to obtain the relationship between the hydrogen concentration and the area of the hydrogen signal detected via the GC. In this study, the calibration was performed by passing a standard gas with a known concentration of hydrogen into the GC. Three bottles of standard hydrogen gas with concentrations of 16%, 21.6%, and 31.6% (volume of H2/volume of total) were selected, and the GC was used to take three sets of measurements. The peak area was averaged to establish the calibration line, which was used to obtain the relationship between the hydrogen concentration and the area of the hydrogen signal detected via the GC. The second step of the calibration involved the relationship between the lithium metal content and the hydrogen concentration, and a conical flask with a concentration of 587 mL was selected as the reaction device in this experiment. The reaction device was dried in a warm box for 12 h and then put into a glove box. In the glove box, an appropriate amount of lithium metal was weighed using a balance with an accuracy of 0.1 mg and put into the conical flask. The conical flask was placed in a fume hood, and an excess and known volume of water (5 mL) was added using a syringe until the lithium metal reaction occurred. Then, 5 mL of gas from the flask was injected into the GC using a syringe for analysis, and the peak area corresponding to hydrogen was recorded, with three assays for each sample. The relationship between lithium metal content and hydrogen concentration was assessed by varying the mass of lithium metal (1.2 mg, 3.3 mg, 4.7 mg, 7.0 mg, 10.7 mg) to produce different hydrogen concentrations, which were used for subsequent quantitative detection of lithium plating from graphite anode.

2.4. Dendrite Detection Based on NMR Technology

The experiments were performed using magic-angle spinning nuclear magnetic resonance (MAS-NMR) to obtain high-resolution solid-state NMR spectra. Similarly, the use of NMR analysis for quantitative detection of lithium requires calibration to obtain the area of the characteristic peaks in the NMR test spectra as a function of the atomic number of the lithium element. In this study, samples with different contents of lithium metal were prepared using different mass ratios of lithium metal powder mixed with LiCl to make the samples. The relationship between the lithium content and the area of the NMR peaks was determined using NMR. The battery was disassembled in a glove box, and the negative electrode wafers were soaked in dimethyl carbonate (DMC) for 2 h to remove electrolyte salts from the wafers, after which they were dried in the glove box for 2 h. The negative electrode material was scraped off the collector and used for the NMR and TGC tests. The battery used in the experiment was the same as that in the TGC experiment.

3. Results

3.1. Experimental Results of Heating DC Resistance

One fresh battery and three analyzed lithium plating batteries were selected as experimental objects, and standard capacity tests were conducted at 25 °C and 80 °C ambient temperatures, respectively. Their initial capacities and capacities after heating are shown in Figure 4a. For the fresh battery (Cell 1), there was no significant change in capacity before and after heating, while for the lithium-plated batteries (Cell 2–4), there was significant decay in capacity after heating.
The variation of the DC internal resistance of the batteries during heating is shown in Figure 4b. To eliminate the effect of inconsistency in the internal resistance between cells, the internal resistance curve was normalized by the value of internal resistance at the first point. From the figure, it can be seen that for fresh batteries without internal dead lithium, the DC internal resistance remained constant during the holding process. The internal resistance slightly decreased after cooling, relative to the initial value, mainly because the cooling time was not sufficient, and the internal temperature of the battery had not cooled down to the level it had been before heating. For batteries with internal dead lithium, the internal resistance gradually increased during the heating period, and the internal resistance increased significantly after cooling compared with the initial value. For fresh batteries, the capacity did not change significantly after heating, while for the dead lithium batteries, the capacity showed significant decay after heating, as shown in Table 4. By utilizing this feature, it is possible to distinguish batteries with internal dead lithium from normal batteries.
To investigate the effectiveness of this method at 0% SOC, one fresh battery and two lithium-plated batteries were selected as experimental objects, and standard capacity tests were conducted at 25 °C and 80 °C ambient temperatures, respectively. Figure 5a presents the changes in the capacities of the batteries before and after heating. There was no significant change in the capacity of the fresh battery (Cell 1) after heating, while for the analyzed lithium plating batteries (Cell 2–3), there was a significant decay in capacity after heating. Figure 5b. shows the changes in DC internal resistance during heating and holding. The DC internal resistance of the analyzed lithium-plated batteries showed a significant increase, and after cooling, the internal resistance was also higher than the value before heating. In contrast, the DC internal resistance of the fresh battery showed no significant change during heating and holding.
From the experimental results at 100% SOC and 0% SOC, it can be seen that the lithium-plating detection method based on heated DC internal resistance can quickly determine whether there is lithium plating in the test battery. Additionally, it does not damage fresh batteries, realizing the non-destructive qualitative detection of internal dead lithium.

3.2. Experimental Results of Reference Electrode

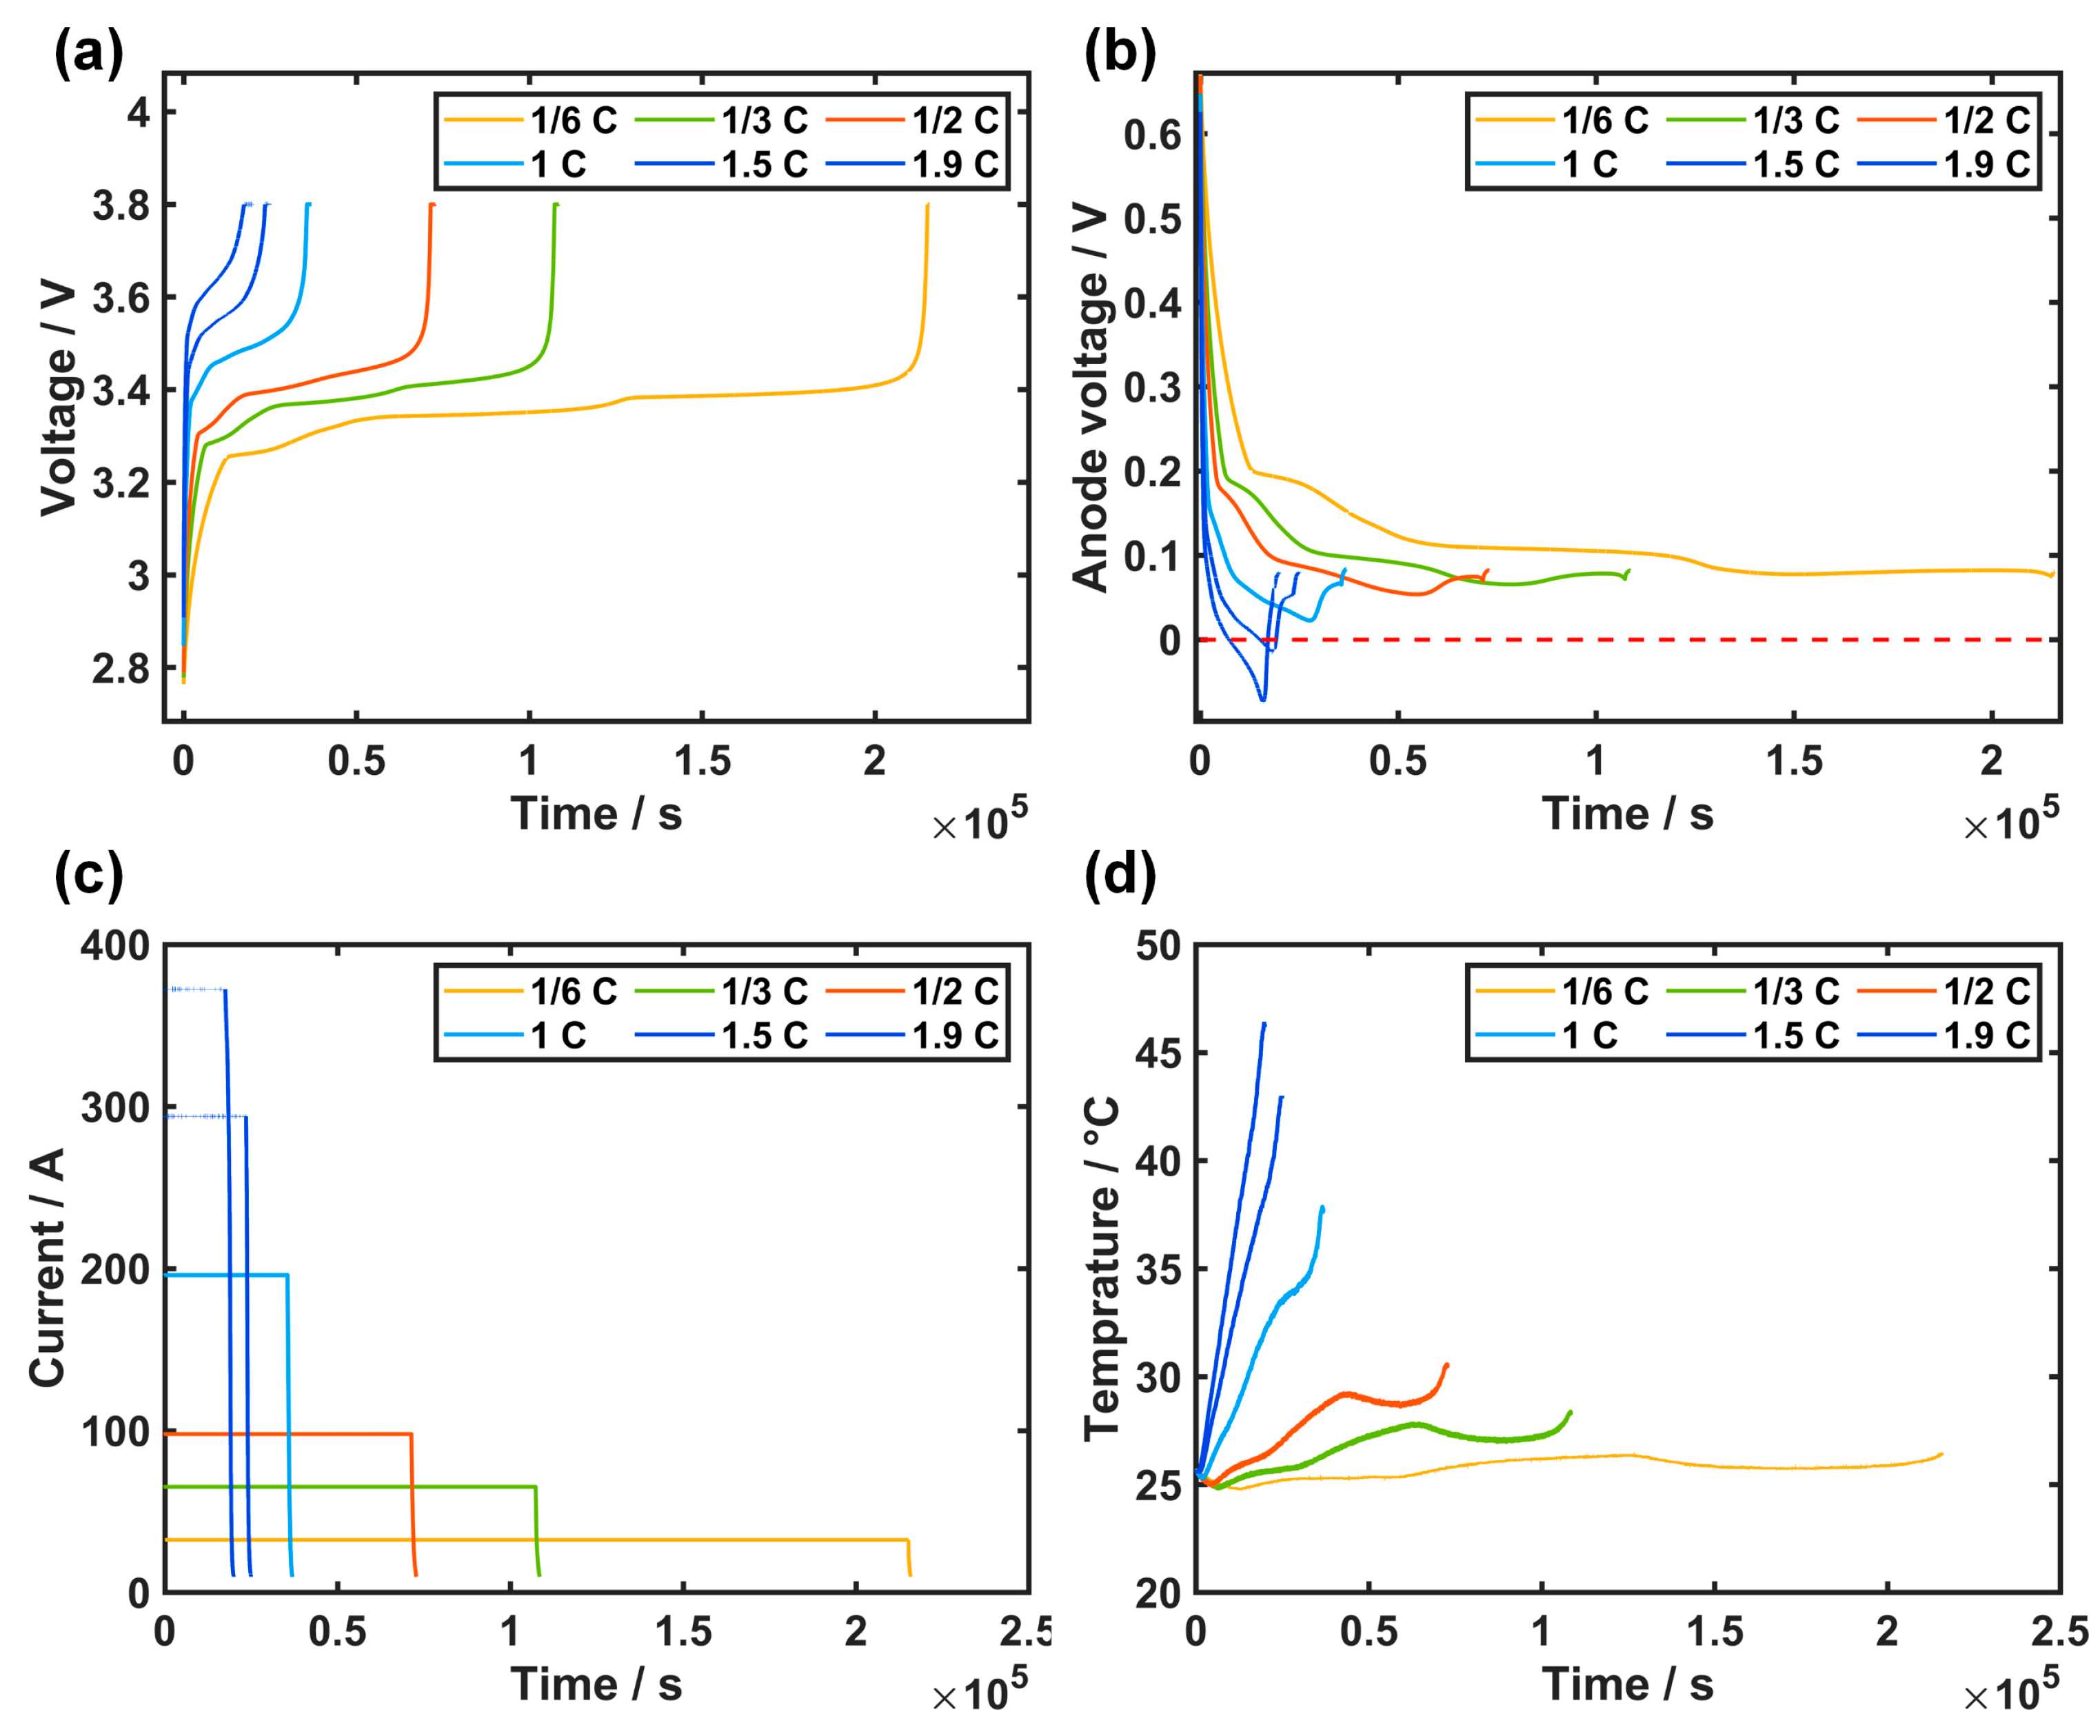
The test results during charging at six different rates are depicted in Figure 6. Figure 6a illustrates the variation of battery terminal voltage under different charging rates, all reaching from 2.0 V to 3.8 V before stopping. Figure 6c presents the specific current magnitudes and their variations for the six different rates. Figure 6d displays the temperature rise during charging. As shown in Figure 6b, the variation of negative electrode potential during charging at different rates indicates that at charging rates of 1.5 C and 1.9 C, the negative electrode potential exhibited a significant drop below 0 V. Under these high-charging-rate conditions, the negative electrode potential rapidly decreased from a high potential to 0 V. During this process, lithium ions undergo insertion into the graphite negative electrode. However, when the negative electrode potential drops below 0 V, apart from the normal insertion into the graphite negative electrode, some lithium ions begin to accept electrons directly at the surface of the negative electrode. Both of these reactions have the same current direction and compete with each other. However, 0 V is not an accurate initiation potential for lithium plating because the insertion and extraction of lithium metal affect this potential. Moreover, measurement errors in relation to the reference electrode can cause discrepancies between the measured potential and the actual potential. Subsequently, the negative electrode potential rapidly rises from below 0 V to above 0 V, indicating that the battery has reached the cutoff voltage and the constant-voltage charging current has started to decrease, at which point lithium plating ceases. Under the 1.5 C charging rate, the minimum value of the negative electrode potential was —13.9 mV, and the duration of the negative electrode potential being below 0 V was 405 s, indicating that a minor lithium-plating reaction may have occurred. However, under the 1.9 C charging rate, a portion of the negative electrode potential even dropped below—70 mV, and the duration of being below 0 V reached 1990 s, suggesting a severe lithium-plating reaction may have occurred. Under the other four rate conditions, the negative electrode potential remained above 0 V, confirming no lithium plating had occurred.
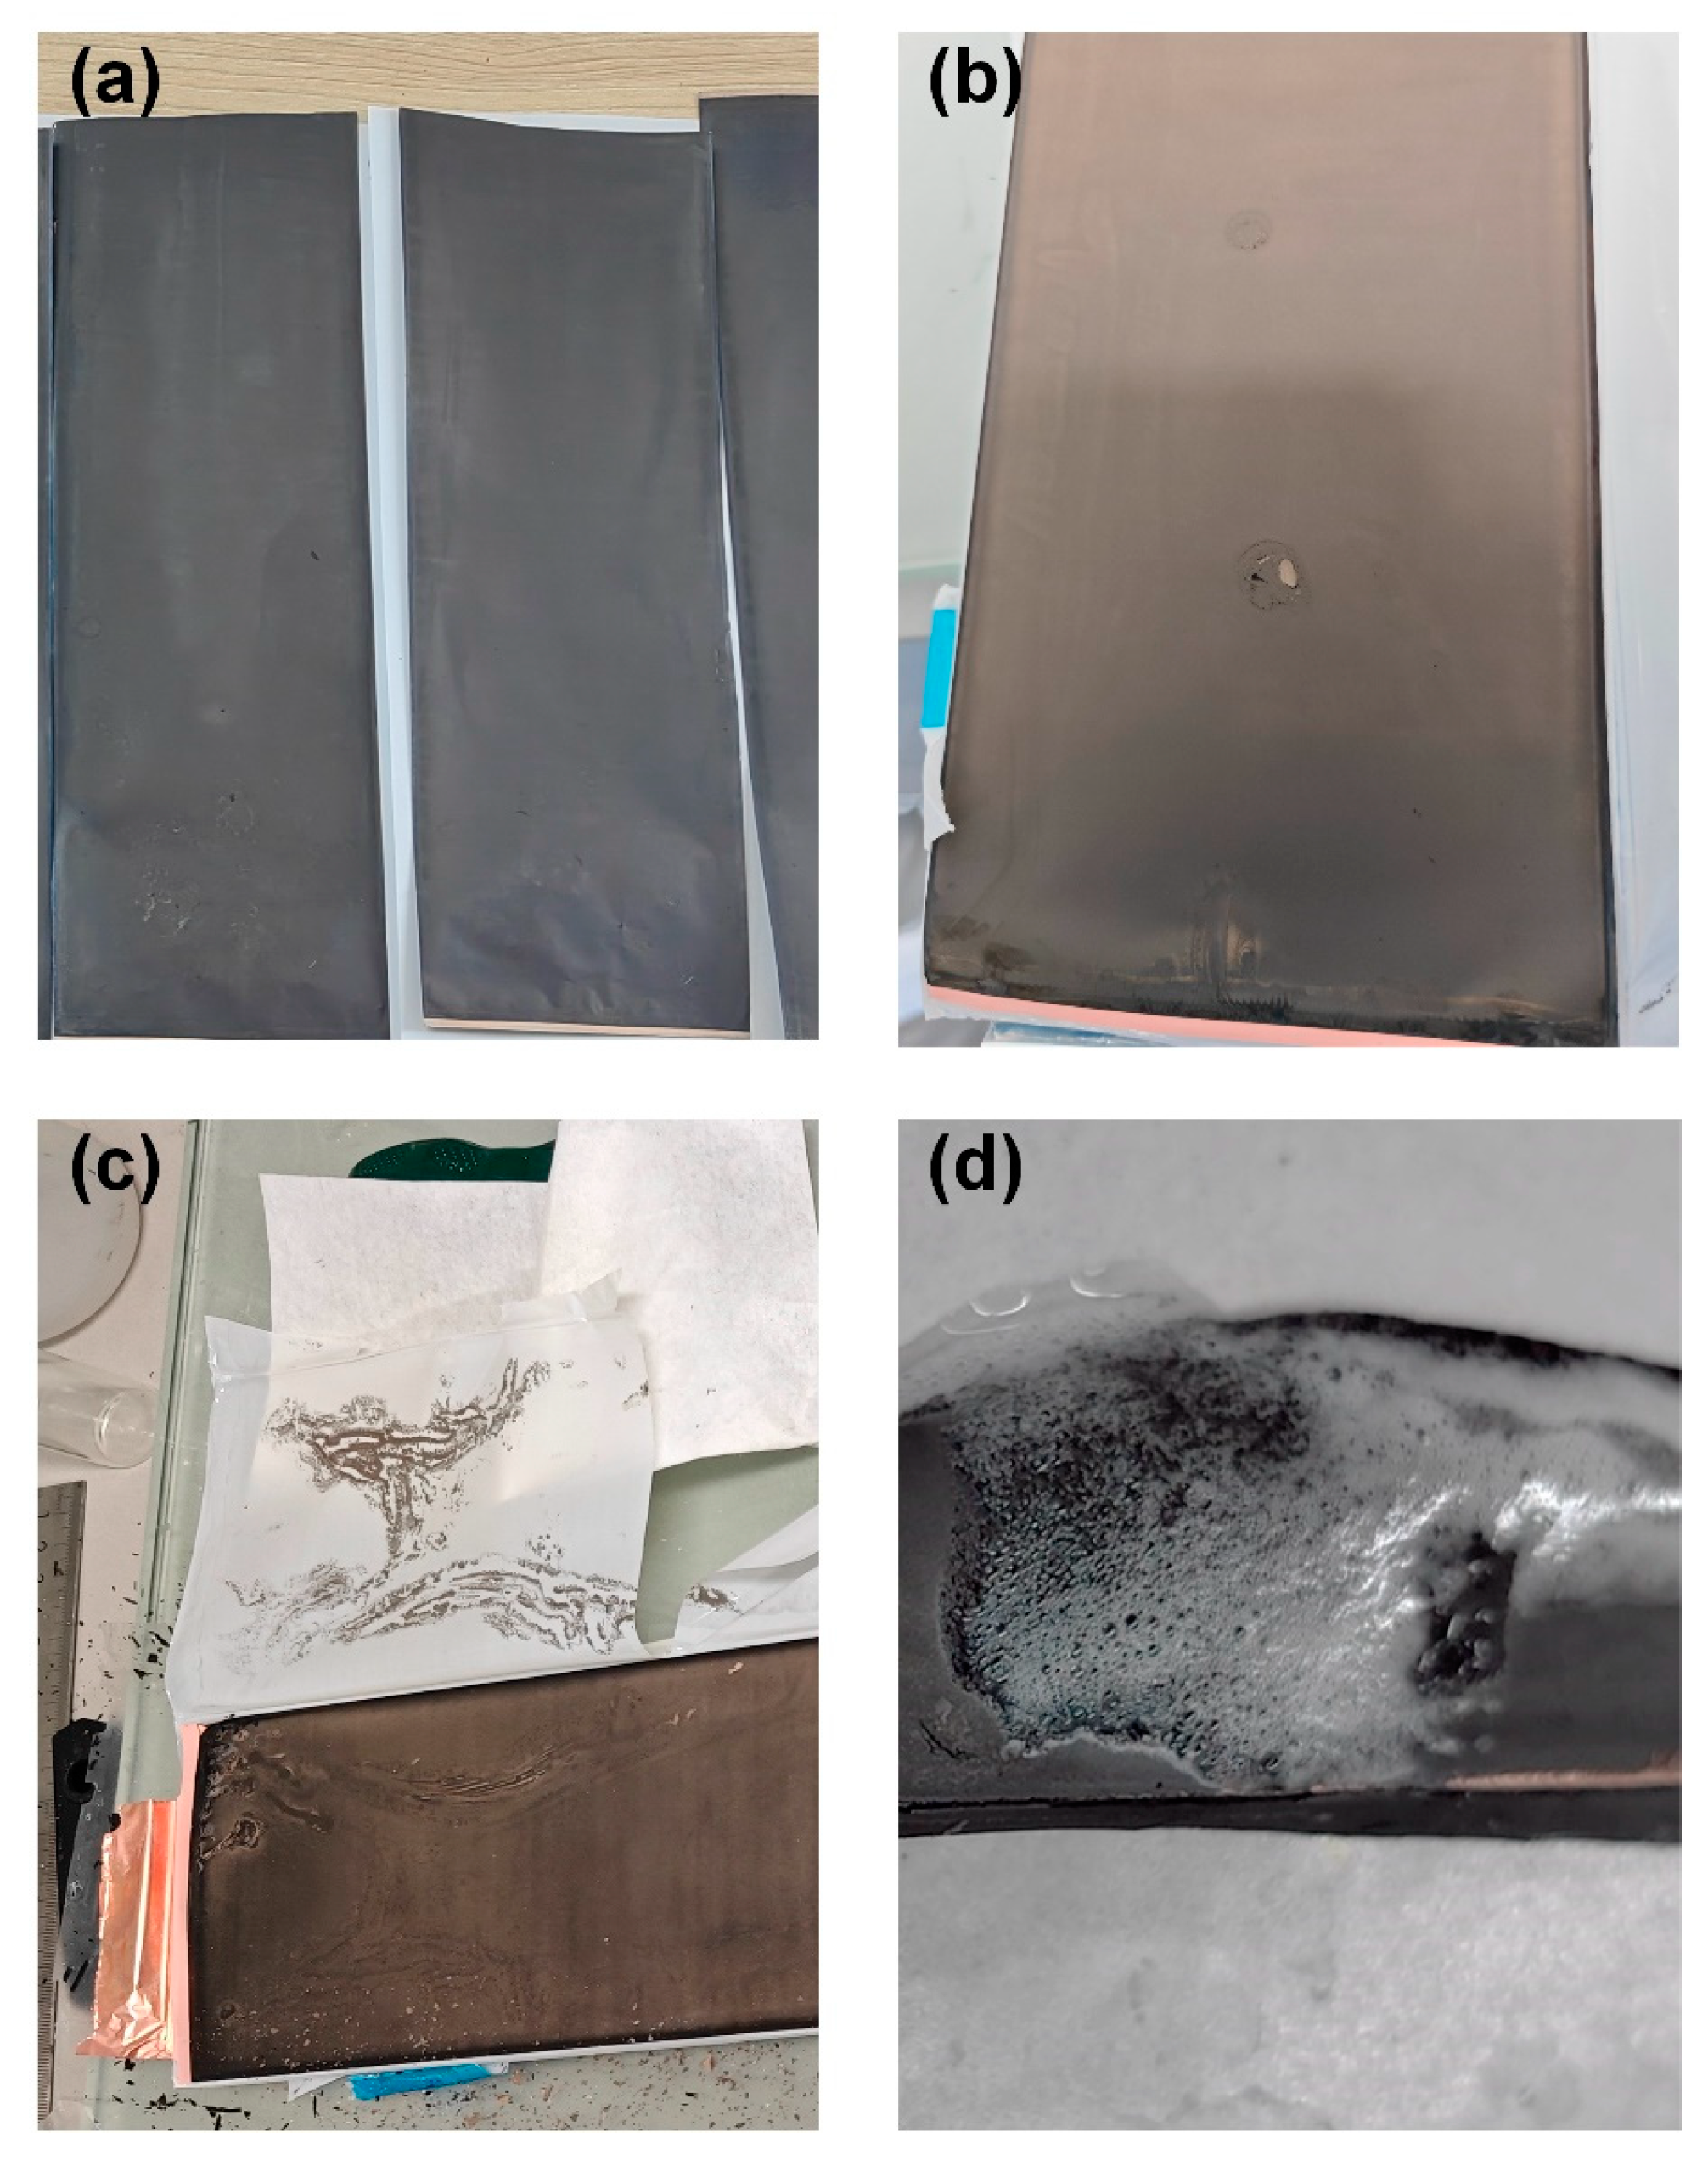
To validate the precision of lithium-plating detection based on negative electrode potential, three charging rates corresponding to the 0 V boundary of the negative electrode potential were selected for cycling: 1 C, 1.5 C, and 1.9 C. We cycled the batteries ten times at each rate before discharging them, then meticulously dismantled them for closer inspection, as illustrated in Figure 7. From the dismantling results in Figure 7a, under the 1 C charging rate, the surface of the negative electrode plate showed no obvious white or gray spots, indicating no lithium plating. Further sampling and electron microscope scanning of the electrode plate (Figure 7d) revealed intact graphite particles without rod-like or mossy lithium dendrites. At the 1.5 C charging rate (Figure 7b), some white spots appeared at the middle and edges of some of the negative electrode plates, suspected to be caused by lithium metal deposition. Under the 1.9 C charging rate (Figure 7c), most electrode plates showed evident white or gray substances on the negative electrode and separator. Furthermore, sampling was performed on the negative electrode of the 1.9 C battery, and direct water droplet testing (Figure 7d) showed significant bubble formation, indicating the deposition of lithium metal on the surface of the negative electrode. In conclusion, employing negative electrode potential as a marker for lithium-plating detection proves to be an exceptionally precise and reliable technique to discern whether batteries are undergoing or on the brink of lithium plating.

3.3. Experimental Results of TGC

3.3.1. TGC Calibration Results

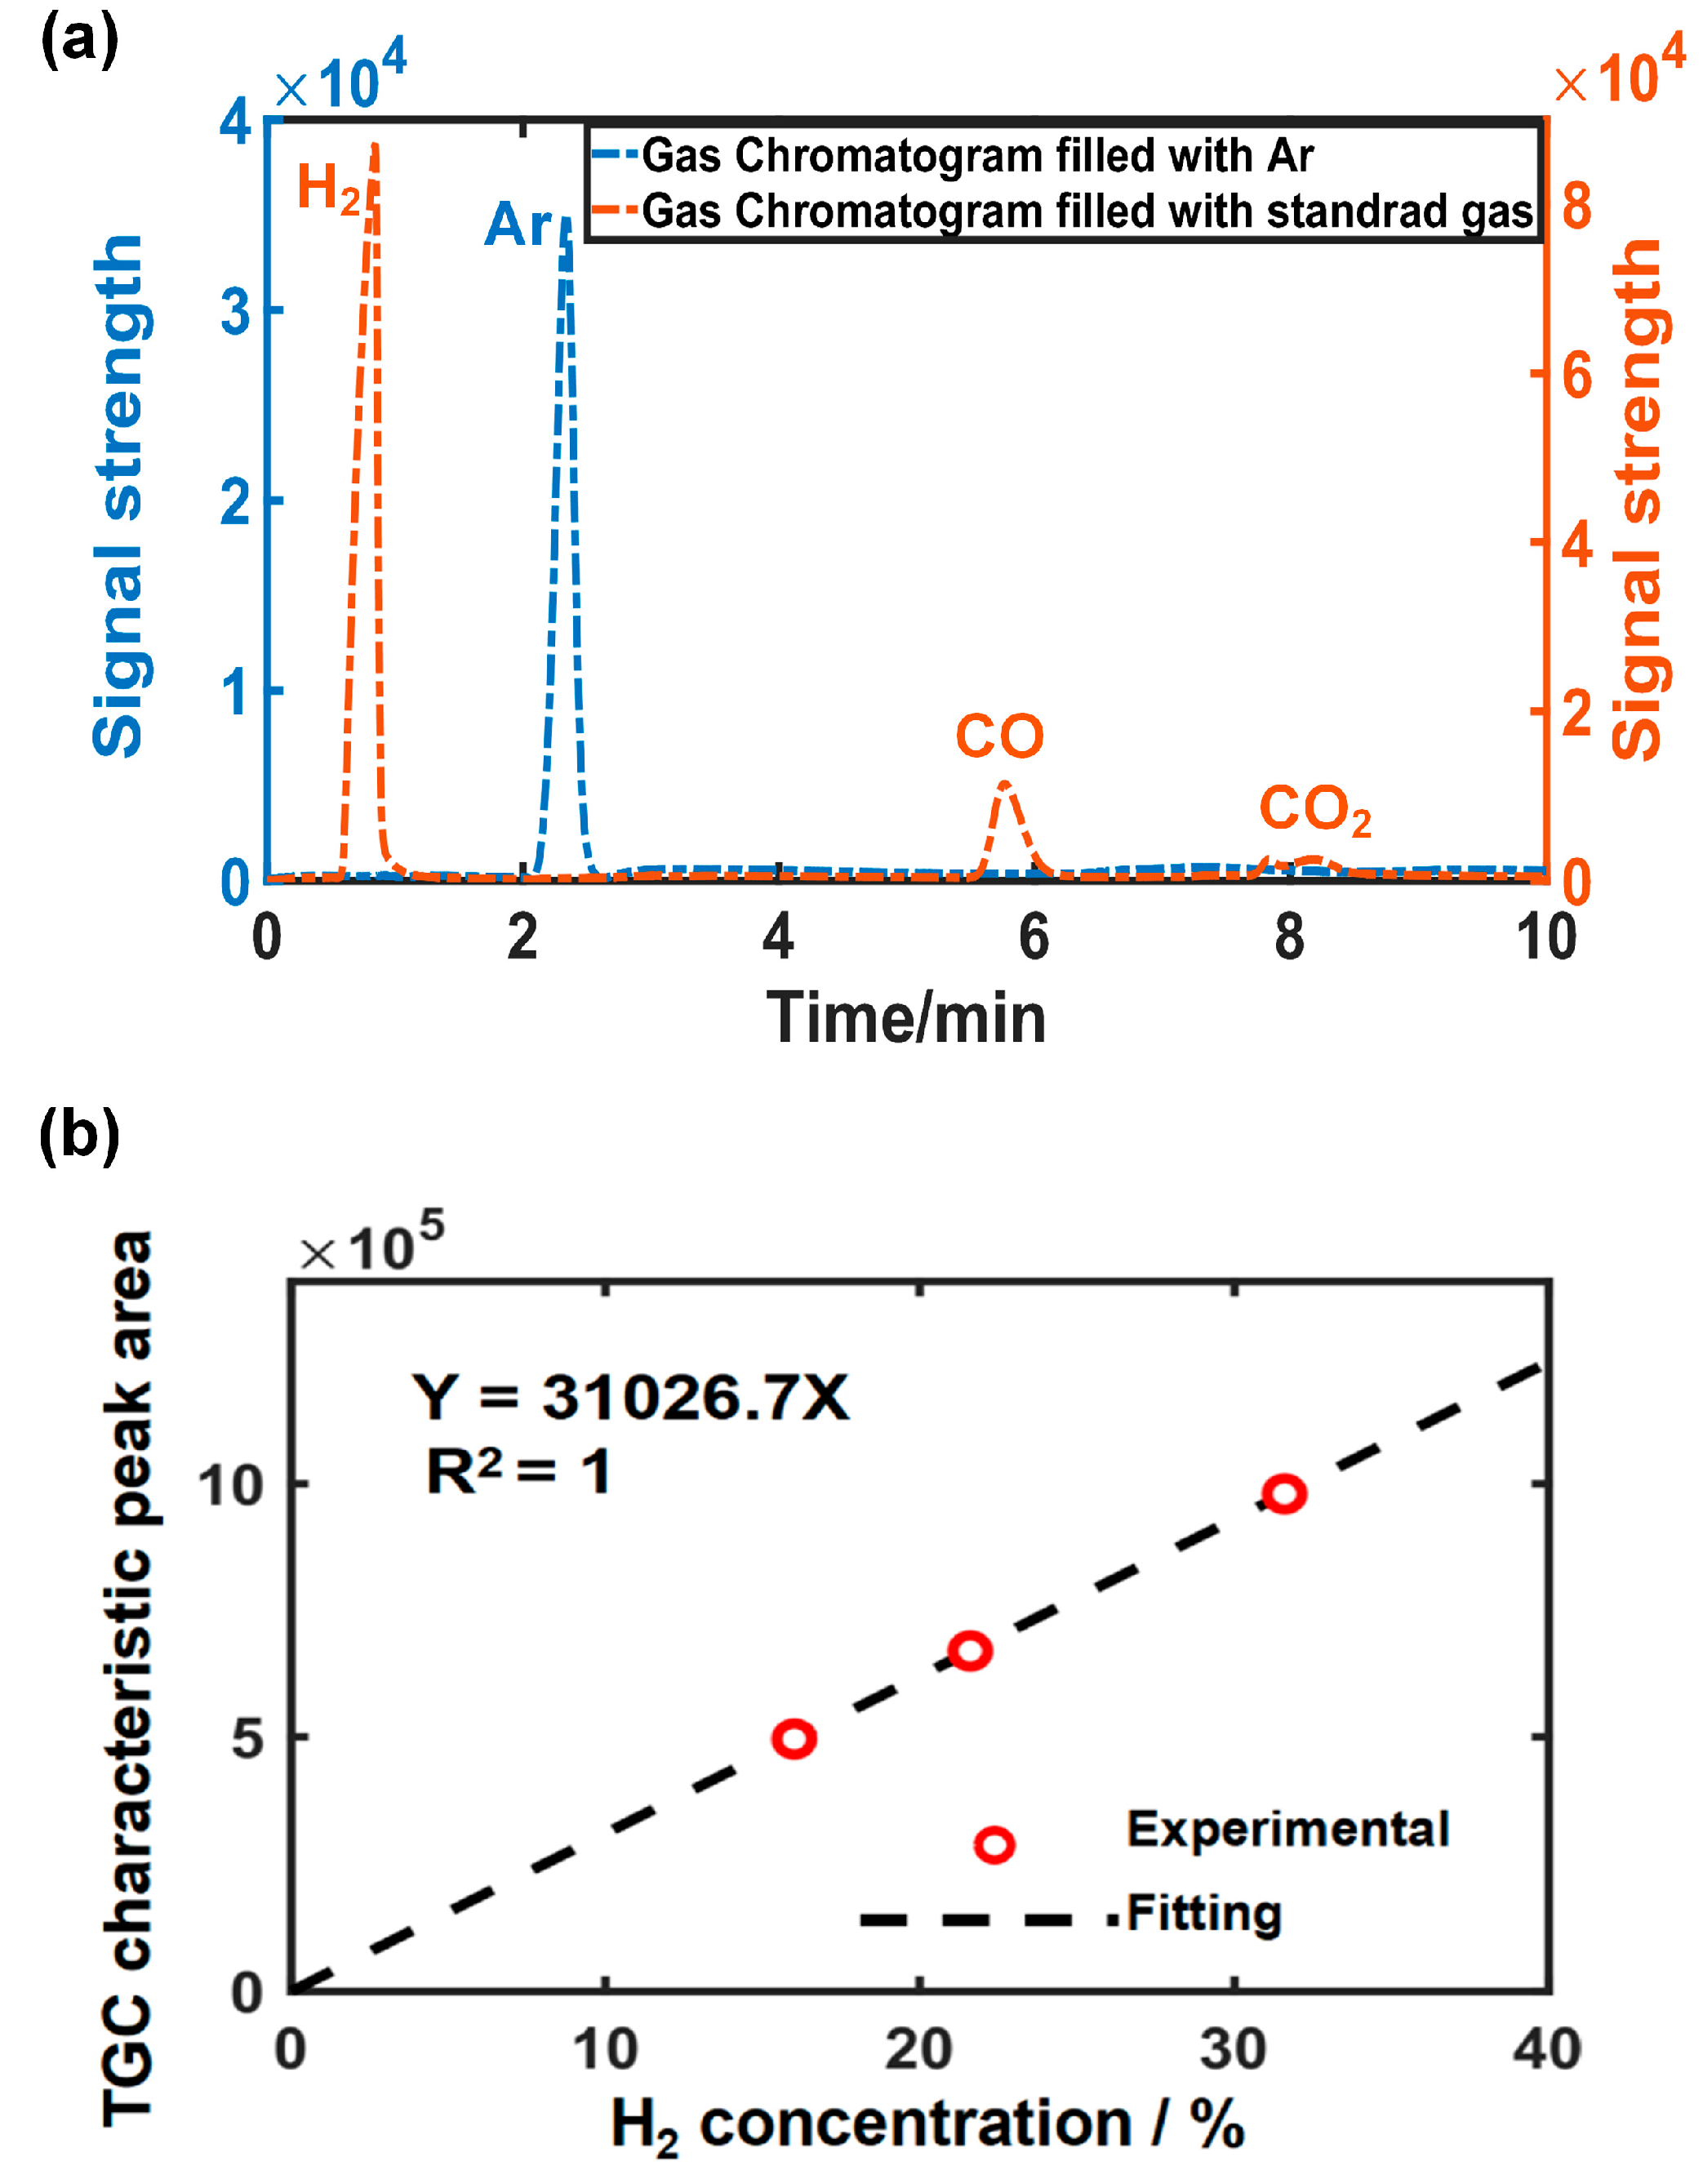
In GC columns, the stationary phase has different affinities for different substances, and different gases can be distinguished by their retention times. Figure 8a shows the peak of Ar at 2.35 min and the gas chromatogram of the standard gas, with characteristic peaks of H2, CO, and CO2 visible at 0.84, 5.7, and 8.1 min, respectively. Figure 8b illustrates the relationship between the H2 concentrations obtained from the standard gas tests of different gas compositions and the signal area of H2 detected via GC, where the dots are the test results and the dashed lines are the linear fitting results. It can be seen that the H2 concentration and the characteristic area of H2 detected via GC show a very good linear relationship (R2 = 1), and the fitting procedure yields the calculation formula shown in Equation (2):
Y = 31026.7 X
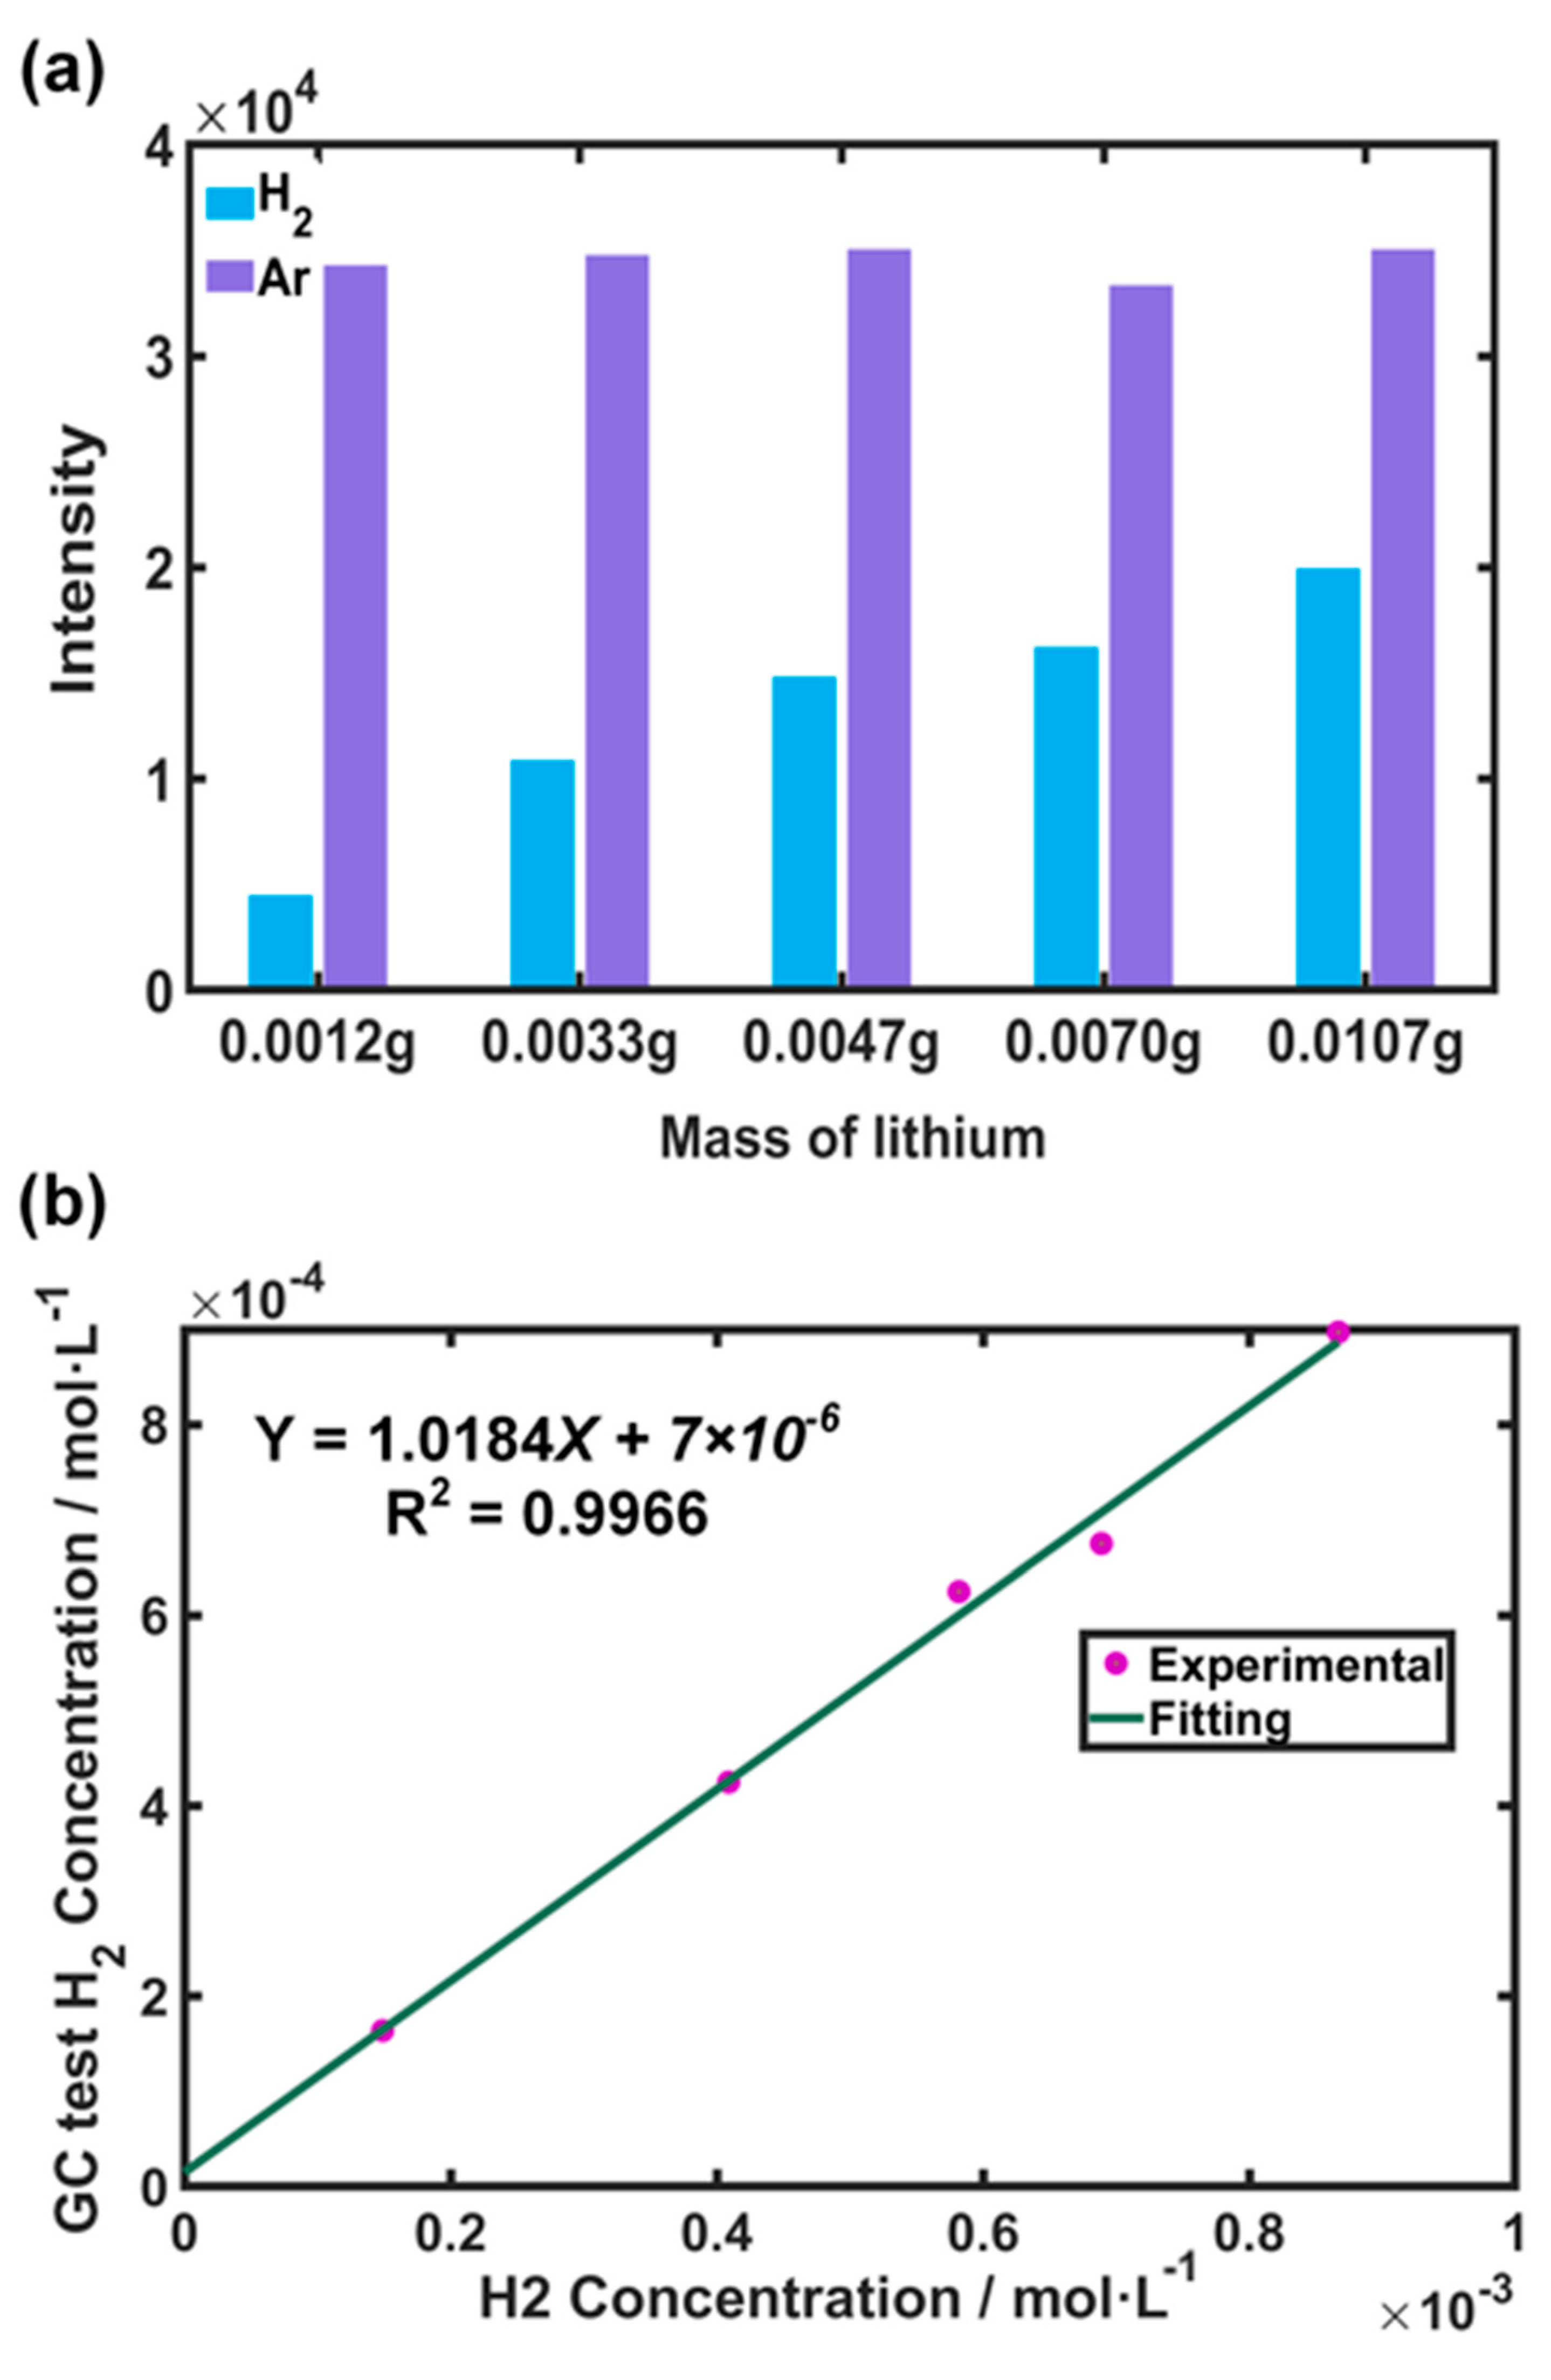
The relationship between lithium metal content and hydrogen concentration was calibrated by performing TGC tests on samples with varying lithium metal content. During the tests, the gas produced by the reaction of each lithium metal sample was measured three times using GC. After the first measurement, the reaction device was inverted for 30 min. The second measurement was carried out without liquid effusion, which proved that the test device was suitably gas-tight and the hydrogen gas was evenly distributed. Samples 1–4 used the 587 mL reaction vessel, and sample 5 used a 1124 mL reaction vessel. The test results for samples with different lithium metal contents are shown in Figure 9. Figure 9b depicts the relationship between the measured and theoretical values of hydrogen production from lithium metal, where the dots are the test results and the dashed lines are the linear fitting results. It was found that the two have a good linear relationship (R2 = 0.9966), indicating that the TGC detection system can achieve quantitative detection of lithium metal content in samples. In addition, it was found that the measured values were always slightly higher than the theoretical values. This discrepancy may have arisen from the fact that the theoretical values were calculated assuming ideal conditions of T = 298 K and P = 1 bar, whereas the temperature and other conditions changed to a certain extent with each experimental run. The effect of measurement error is small, and subsequent experiments can be corrected by dividing the measurement results by the coefficient 1.0184.

3.3.2. Testing of Lithium Plating in Battery Samples

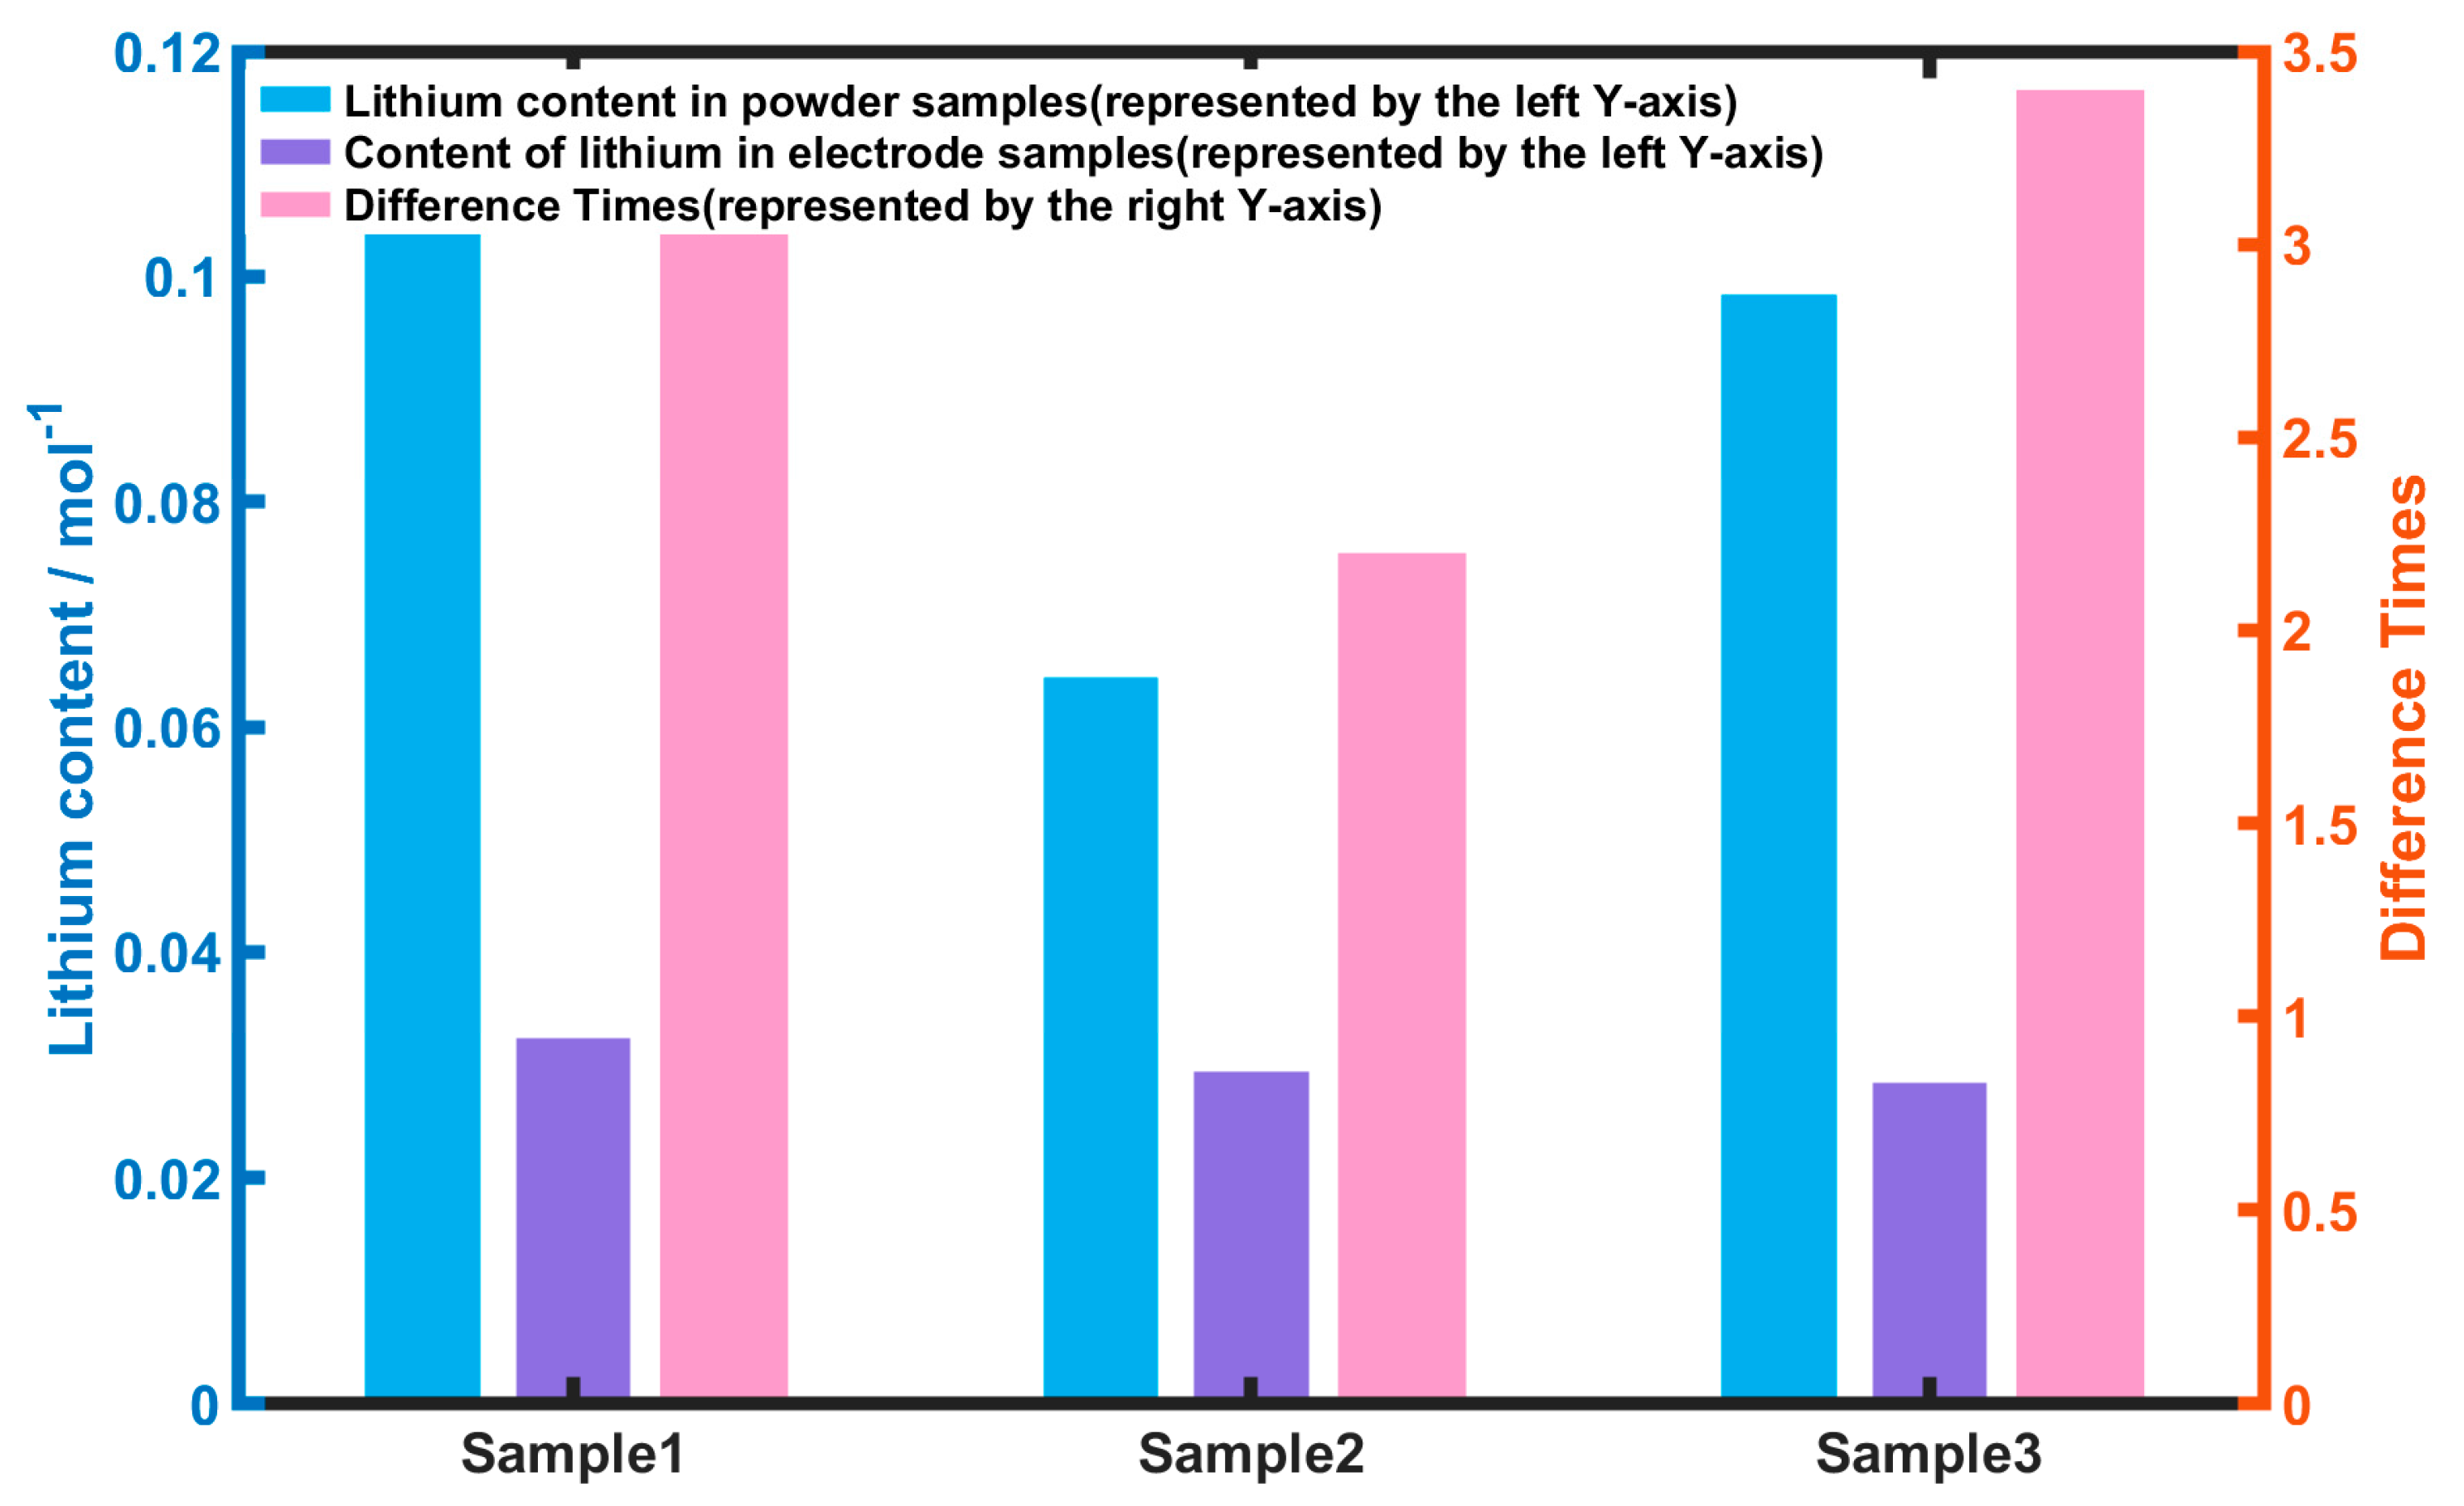
For TGC testing, the negative electrode can be either in the form of negative electrode material powder or the negative electrode wafer from the battery. In the case of powder samples, the negative electrode material needs to be scraped off from the collector, while the wafer can be cut along with the collector after disassembling the battery. Figure 10 presents the amounts of lithium plating obtained through TGC testing of samples of the same negative electrode but in different forms. From the test results, it can be observed that the metal lithium content in the powder samples was consistently higher than that obtained from direct reaction with the negative electrode wafer, with a difference of more than twofold. However, when observing the reaction phenomenon of the latter, the negative electrode material completely detached, leaving the copper foil clean and exposed, and no bubbles were generated even after repeated shaking, indicating that the reaction was complete. Further analysis revealed that due to the lower potential at the negative electrode–separator interface, lithium plating occurred preferentially at that location. The results obtained directly from the negative electrode wafer of the reaction sample were more accurate. Therefore, in subsequent tests, the entire negative electrode wafer was used for TGC testing, further demonstrating the advantages of TGC testing in sample preparation.

3.3.3. Fresh Cell Background Noise Analysis

Before proceeding with the quantitative detection of lithium plating in batteries, the negative electrodes from unused (fresh) batteries underwent testing to establish a baseline for background noise, with the findings presented in Table 5. Hydrogen production was observed in all three titration experiments on the fresh battery samples, and the presence of hydrogen was also measured via GC, demonstrating that even the fresh battery contained lithium-embedded graphite or other substances that produced hydrogen with water. If all are classified as lithium metal, the 1 Ah battery contained roughly 48 mAh (0.0126 g) of lithium metal, as shown in Table 5. Even when the battery was discharged to the cut-off voltage, the Li ions were not completely de-embedded from the negative electrode, and embedded lithium graphite was still present, needing to be discounted in subsequent battery sample tests. It should be noted that the outcomes of this baseline experiment should not be adopted as a universal standard for noise levels, since the quantities of embedded lithium graphite can vary amongst different battery types, even when each is discharged to the cut-off voltage.

3.3.4. Battery Sample Calibration Results

Based on the above test results, the lithium plating of two low-temperature lithium-plated aging batteries was examined using the TGC method, and the results are shown in Table 5. The capacity degradation rates after low-temperature cycling were 63% and 65% for Batteries A and B. The SEI growth side reaction is considered to be dependent on time and temperature, the capacity degradation caused by SEI growth can be neglected due to the low-temperature operating conditions and low number of cycling times, and the large degradation in capacity can be attributed to the lithium-plating side reaction. Due to the limited volume of the reaction vessel, the method of measuring the amount of lithium plating from a known portion of the electrode was adopted to estimate the amount of lithium plating on the battery as a whole. The experimental results are shown in Table 6. The estimated capacity of Batteries A and B were consistent with the measured value, and the error was within 7%, representing the accurate detection of lithium plating in the battery. The error mainly came from the background noise of lithium-embedded graphite in the fresh battery; the current discharge method is still not able to completely eliminate the influence of lithium-embedded graphite in the negative electrode material, and further exploration will be carried out in the future. In summary, this study demonstrates the effectiveness of the TGC method in the quantitative detection of lithium plating in lithium-ion batteries and proves that the TGC technique can be used to accurately detect the amount of lithium plating in batteries.

3.4. Experimental Results of NMR

In this study, samples with varying lithium metal contents were prepared through blending lithium metal powder with LiCl in diverse mass ratios to facilitate NMR calibration. Subsequently, a proportional relationship was pinpointed between the integral area of the lithium metal’s definitive peak within the NMR spectra and the lithium element’s molar quantity. The NMR test results for five different samples of lithium metal content are shown in Figure 11a. As the lithium metal content increased, the height and area of the characteristic peak also increased. Figure 11b. presents the relationship between the molar amount of lithium element (molar amount of lithium metal) in the test samples and the integrated peak area in the NMR spectrum. The data points represent the test results, while the dashed line represents the linear fitting. It can be observed that there is a good linear relationship between the integrated peak area in the NMR spectrum and the molar amount of lithium element, with a high linearity of 0.9947. The calculated formula derived from the fitting is shown in Equation (3), where NLi represents the molar amount of lithium element in the test sample, and Area corresponds to the integrated peak area of the corresponding characteristic NMR peak.
A r e a = 1.189 N L i

3.5. Discussion

In this experiment, due to the limited number of batteries, we used batteries from different electrochemical systems in the heating DC resistance and reference electrode experiments. In different electrochemical systems, the nature of lithium plating is the same, so this does not affect the comparison of experimental results. In the TGC and NMR experiments, the samples came from the same type of cell, ensuring the reliability of the comparison of quantitative accuracy. The experimental results illustrate that the heating DC resistance method leverages the reaction of dead lithium with the electrolyte upon heating, resulting in increased internal resistance in the battery and enabling qualitative dendrite detection; nevertheless, quantitative analysis is not feasible with this technique. The method based on the reference electrode can directly measure the negative electrode potential by implanting a reference electrode into the battery. When the negative electrode potential is below 0 V, it is used as a signal that lithium plating has occurred during the charging process, so that real-time detection of lithium plating during battery charging can be achieved. However, this method can only ascertain the presence of lithium plating that occurs during the charging process. TGC technology uses the reaction of metallic lithium and solvent (H2O) to generate H2, which can distinguish lithium ions and metallic lithium at the solid–electrolyte interface, then quantitatively detect the generated H2 through gas chromatography, and then accurately calculate the content of metallic lithium. NMR technology assesses the relationship between the area of the characteristic peak in the NMR test spectrum and the number of lithium atoms via calibration, thereby realizing the quantitative detection of lithium plating. As depicted in Figure 12, each method was comparatively appraised across four analytical indicators: detection scope, implementation ease, cost-effectiveness, and detection precision. The first was the detection range. The heating DC resistance method can detect dead lithium that already exists in the battery, while the reference electrode method can detect only whether lithium plating occurs during the charging process. Historical lithium plating cannot be detected. These two methods are both qualitative detection of lithium plating, and their detection range is evaluated as low. The TGC method and NMR method can realize quantitative dendrite detection, and their detection range is evaluated as high. The second indicator was the convenience of implementation. The heating DC resistance method does not require modification or damage to the battery during testing, so it has highly convenient implementation compared with the other three methods. The method involving the reference electrode necessitates the fabrication of a reference electrode and its subsequent integration into the battery—a process that is inherently irreversible and escalates experimental uncertainty due to the indeterminate effects on cell performance. Accordingly, the ease of this method’s implementation is deemed low. The TGC method also requires disassembling the battery, but only the pole piece needs to be cut to perform the test, so the implementation convenience is evaluated as medium. The NMR method requires not only disassembly of the battery but also scraping of the pole piece before testing, so the operation steps are more complicated than in the TGC method, and the implementation convenience is evaluated as low. Third is the cost. The heating DC resistance method needs the support of only the thermal chamber and the battery test system, and its cost is low. Similarly, the reference electrode method needs the support of only the reference electrode materials, and its cost is also low. Both the TGC method and the NMR method require the support of specific equipment, and the price of the NMR equipment is much higher than that of the TGC. Therefore, the cost evaluation of the TGC method is medium, and the cost evaluation of the NMR method is high. The fourth indicator is the detection accuracy. The heating DC resistance method and the reference electrode method cannot realize the quantitative detection of dead lithium, so their detection accuracy is evaluated as low. The NMR method has the highest detection accuracy, so it is evaluated as high, and the TGC method with relatively low accuracy is evaluated as medium. In summary, the TGC method covers the largest area in Figure 12, proving that TGC is the most ideal method among the four when applied to the field of accurate dendrite detection.

4. Conclusions and Outlook

4.1. Conclusions

Based on the above, this paper compares dendrite detection methods including heating DC resistance, reference electrode, TGC technology, and NMR technology. The above methods were analyzed according to four evaluation indicators: detectable range, implementation convenience, cost, and detection accuracy. Among them, the heating DC resistance and reference electrode methods can only qualitatively detect lithium plating, while the TGC method and NMR method can realize the quantitative detection of dead lithium, have a wider detection range, and are more suitable for accurately exploring the relationship between different charging conditions and the severity of lithium plating. Compared with the NMR method, the TGC method has more convenient implementation and lower cost, and its quantitative detection accuracy is similar to that of the NMR method. Comprehensively considering the above four dimensions, the TGC method can realize the quantitative detection of dead lithium in lithium-ion batteries while taking into account cost control, implementation convenience, and high detection accuracy. This is of great significance for accurately exploring fast charging boundaries and ensuring safe operating conditions in electric vehicle charging scenarios.

4.2. Outlook

The current research has demonstrated that the TGC system is capable of quantitatively detecting the amount of lithium plating on small-sized pouch-cell electrode sheets. In our future work, we will strive to expand the scale of detection, delve into the causes of errors, and achieve lithium-plating detection in larger areas of battery electrode sheets or even the entire cell roll. This will enable the application of the TGC system for the quality control and performance assessment of batteries under real-world electric vehicle conditions.

Author Contributions

Conceptualization, K.Y. and H.C.; methodology, K.Y. and H.C.; software, K.Y., H.C. and S.L.; validation, K.Y. and H.C.; formal analysis, K.Y., H.C., S.L., Y.W., X.Z. and Z.W.; investigation, S.L., Y.W., X.Z. and Z.W.; resources, K.Y., H.C., S.L., Y.W., X.Z. and Z.W.; data curation, Y.W., X.Z. and Z.W.; writing—original draft preparation, K.Y., H.C., S.L., Y.W., X.Z. and Z.W.; writing—review and editing, Y.L., M.B., K.B., N.N., Y.Z. and X.F.; supervision, Y.L., M.B., K.B., N.N., Y.Z. and X.F.; project administration, Y.L. and X.F.; funding acquisition, Y.L. and X.F. All authors have read and agreed to the published version of the manuscript.

Funding

This research is supported by State Grid Corporation of China science and technology project, Re-search on Online Detection and Early Warning Technology of Lithium Plating in Lithium Iron Phosphate Batteries (4000-202355090A-1-1-ZN).

Data Availability Statement

The original contributions presented in the study are included in the article, further inquiries can be directed to the corresponding author.

Conflicts of Interest

The authors declare no conflicts of interest.

References

  1. Rangarajan, S.S.; Sunddararaj, S.P.; Sudhakar, A.; Shiva, C.K.; Subramaniam, U.; Collins, E.R.; Senjyu, T. Lithium-Ion Batteries—The Crux of Electric Vehicles with Opportunities and Challenges. Clean Technol. 2022, 4, 908–930. [Google Scholar] [CrossRef]
  2. Hu, G.; Huang, P.; Bai, Z.; Wang, Q.; Qi, K. Comprehensively analysis the failure evolution and safety evaluation of automotive lithium ion battery. eTransportation 2021, 10, 100140. [Google Scholar] [CrossRef]
  3. Tomaszewska, A.; Chu, Z.; Feng, X.; O’Kane, S.; Liu, X.; Chen, J.; Ji, C.; Endler, E.; Li, R.; Liu, L.; et al. Lithium-ion battery fast charging: A review. eTransportation 2019, 1, 100011. [Google Scholar] [CrossRef]
  4. Piao, N.; Gao, X.; Yang, H.; Guo, Z.; Hu, G.; Cheng, H.-M.; Li, F. Challenges and development of lithium-ion batteries for low temperature environments. eTransportation 2022, 11, 100145. [Google Scholar] [CrossRef]
  5. Tanim, T.R.; Dufek, E.J.; Dickerson, C.C.; Wood, S.M. Electrochemical Quantification of Lithium Plating: Challenges and Considerations. J. Electrochem. Soc. 2019, 166, A2689–A2696. [Google Scholar] [CrossRef]
  6. Li, Z.; Fang, R.; Ge, H.; Liu, Z.; Spingler, F.B.; Jossen, A.; Zhang, J.; Liaw, B. Multiphysics Footprint of Li Plating for Li-Ion Battery and Challenges for High-Accuracy Detection. J. Electrochem. Soc. 2022, 169, 080530. [Google Scholar] [CrossRef]
  7. Xu, Y.; Wang, L.; Jia, W.; Yu, Y.; Zhang, R.; Li, T.; Fu, X.; Niu, X.; Li, J.; Kang, Y. Three-dimensional carbon material as stable host for dendrite-free lithium metal anodes. Electrochim. Acta 2019, 301, 251–257. [Google Scholar] [CrossRef]
  8. Börner, M.; Friesen, A.; Grützke, M.; Stenzel, Y.; Brunklaus, G.; Haetge, J.; Nowak, S.; Schappacher, F.; Winter, M. Correlation of aging and thermal stability of commercial 18650-type lithium ion batteries. J. Power Sources 2017, 342, 382–392. [Google Scholar] [CrossRef]
  9. Waldmann, T.; Wohlfahrt-Mehrens, M. Effects of rest time after Li plating on safety behavior—ARC tests with commercial high-energy 18650 Li-ion cells. Electrochim. Acta 2017, 230, 454–460. [Google Scholar] [CrossRef]
  10. Liu, W.; Qiu, B.; Yan, J.; He, C.; Zhang, P.; Mi, H. An aqueous polyethylene oxide-based solid-state electrolyte with high voltage stability for dendrite-free lithium deposition via a self-healing electrostatic shield. Dalton Trans. 2021, 50, 14296–14302. [Google Scholar] [CrossRef]
  11. Friesen, A.; Horsthemke, F.; Mönnighoff, X.; Brunklaus, G.; Krafft, R.; Börner, M.; Risthaus, T.; Winter, M.; Schappacher, F.M. Impact of cycling at low temperatures on the safety behavior of 18650-type lithium ion cells: Combined study of mechanical and thermal abuse testing accompanied by post-mortem analysis. J. Power Sources 2016, 334, 1–11. [Google Scholar] [CrossRef]
  12. Verma, P.; Maire, P.; Novák, P. A review of the features and analyses of the solid electrolyte interphase in Li-ion batteries. Electrochim. Acta 2010, 55, 6332–6341. [Google Scholar] [CrossRef]
  13. Chen, K.-H.; Wood, K.N.; Kazyak, E.; LePage, W.S.; Davis, A.L.; Sanchez, A.J.; Dasgupta, N.P. Dead lithium: Mass transport effects on voltage, capacity, and failure of lithium metal anodes. J. Mater. Chem. A 2017, 5, 11671–11681. [Google Scholar] [CrossRef]
  14. Yang, G.; Zhang, S.; Weng, S.; Li, X.; Wang, X.; Wang, Z.; Chen, L. Anionic Effect on Enhancing the Stability of a Solid Electrolyte Interphase Film for Lithium Deposition on Graphite. Nano Lett. 2021, 21, 5316–5323. [Google Scholar] [CrossRef] [PubMed]
  15. Yuan, X.; Liu, B.; Mecklenburg, M.; Li, Y. Ultrafast deposition of faceted lithium polyhedra by outpacing SEI formation. Nature 2023, 620, 86–91. [Google Scholar] [CrossRef] [PubMed]
  16. Qin, Y.; Wang, D.; Liu, M.; Shen, C.; Hu, Y.; Liu, Y.; Guo, B. Improving the Durability of Lithium-Metal Anode via In situ Constructed Multilayer SEI. ACS Appl. Mater. Interfaces 2021, 13, 49445–49452. [Google Scholar] [CrossRef] [PubMed]
  17. Jia, M.; Zhang, C.; Guo, Y.; Peng, L.; Zhang, X.; Qian, W.; Zhang, L.; Zhang, S. Advanced Nonflammable Localized High-Concentration Electrolyte for High Energy Density Lithium Battery. Energy Environ. Mater. 2021, 5, 1294–1302. [Google Scholar] [CrossRef]
  18. Beltran, S.P.; Balbuena, P.B. Lithium Dissolution and SEI Formation on Lithium Metal Anodes: Electrolyte and Surface Effects. ECS Meet. Abstr. 2022, MA2022-02, 145. [Google Scholar] [CrossRef]
  19. Luo, H. Lithium-Ion Battery Cathode-Electrolyte Interface. ECS Meet. Abstr. 2023, MA2023-01, 2828. [Google Scholar] [CrossRef]
  20. Li, R.; O’kane, S.; Marinescu, M.; Offer, G.J. Modelling Solvent Consumption from SEI Layer Growth in Lithium-Ion Batteries. J. Electrochem. Soc. 2022, 169, 060516. [Google Scholar] [CrossRef]
  21. Ren, Y.; Widanage, D.; Marco, J. A Plating-Free Charging Scheme for Battery Module Based on Anode Potential Estimation to Prevent Lithium Plating. Batteries 2023, 9, 294. [Google Scholar] [CrossRef]
  22. Carter, R.; Klein, E.J.; Kingston, T.A.; Love, C.T. Detection of Lithium Plating During Thermally Transient Charging of Li-Ion Batteries. Front. Energy Res. 2019, 7, 00144. [Google Scholar] [CrossRef]
  23. Yang, X.-G.; Ge, S.; Liu, T.; Leng, Y.; Wang, C.-Y. A look into the voltage plateau signal for detection and quantification of lithium plating in lithium-ion cells. J. Power Sources 2018, 395, 251–261. [Google Scholar] [CrossRef]
  24. Smart, M.C.; Ratnakumar, B.V. Effects of Electrolyte Composition on Lithium Plating in Lithium-Ion Cells. J. Electrochem. Soc. 2011, 158, A379–A389. [Google Scholar] [CrossRef]
  25. Petzl, M.; Danzer, M.A. Nondestructive detection, characterization, and quantification of lithium plating in commercial lithium-ion batteries. J. Power Sources 2014, 254, 80–87. [Google Scholar] [CrossRef]
  26. Zeng, Z.; Liang, W.-I.; Liao, H.-G.; Xin, H.L.; Chu, Y.-H.; Zheng, H. Visualization of Electrode–Electrolyte Interfaces in LiPF6/EC/DEC Electrolyte for Lithium Ion Batteries via in Situ TEM. Nano Lett. 2014, 14, 1745–1750. [Google Scholar] [CrossRef] [PubMed]
  27. Zhe, D.; Zhenyu, H.; Lei, L.; Huang, Y.; Shen, Y. Applications of ultrasound technique in characterization of lithium-ion batteries. Energy Storage Sci. Technol. 2019, 8, 1033. (In Chinese) [Google Scholar]
  28. Hsieh, Y.-C.; Leißing, M.; Nowak, S.; Hwang, B.-J.; Winter, M.; Brunklaus, G. Quantification of Dead Lithium via In Situ Nuclear Magnetic Resonance Spectroscopy. Cell Rep. Phys. Sci. 2020, 1, 100139. [Google Scholar] [CrossRef]
  29. Gotoh, K.; Izuka, M.; Arai, J.; Okada, Y.; Sugiyama, T.; Takeda, K.; Ishida, H. In situ 7Li nuclear magnetic resonance study of the relaxation effect in practical lithium ion batteries. Carbon 2014, 79, 380–387. [Google Scholar] [CrossRef]
  30. McShane, E.J.; Colclasure, A.M.; McCloskey, B.D. (Industrial Electrochemistry and Electrochemical Engineering Division Student Achievement Award) Mass Spectrometry Titration for Quantitative Probing of Lithium Plating and Solid-Electrolyte Interphase Formation. ECS Meet. Abstr. 2021, MA2021-01, 945. [Google Scholar] [CrossRef]
  31. Pecher, O.; Carretero-González, J.; Griffith, K.J.; Grey, C.P. Materials’ Methods: NMR in Battery Research. Chem. Mater. 2016, 29, 213–242. [Google Scholar] [CrossRef]
  32. Arai, J.; Okada, Y.; Sugiyama, T.; Izuka, M.; Gotoh, K.; Takeda, K. In Situ Solid State7Li NMR Observations of Lithium Metal Deposition during Overcharge in Lithium Ion Batteries. J. Electrochem. Soc. 2015, 162, A952–A958. [Google Scholar] [CrossRef]
  33. Chang, H.J.; Trease, N.M.; Ilott, A.J.; Zeng, D.; Du, L.-S.; Jerschow, A.; Grey, C.P. Investigating Li Microstructure Formation on Li Anodes for Lithium Batteries by in Situ 6Li/7Li NMR and SEM. J. Phys. Chem. C 2015, 119, 16443–16451. [Google Scholar] [CrossRef]
  34. Fang, C.; Li, J.; Zhang, M.; Zhang, Y.; Yang, F.; Lee, J.Z.; Lee, M.-H.; Alvarado, J.; Schroeder, M.A.; Yang, Y.; et al. Quantifying inactive lithium in lithium metal batteries. Nature 2019, 572, 511–515. [Google Scholar] [CrossRef] [PubMed]
  35. McShane, E.J.; Colclasure, A.M.; Brown, D.E.; Konz, Z.M.; Smith, K.; McCloskey, B.D. Quantification of Inactive Lithium and Solid–Electrolyte Interphase Species on Graphite Electrodes after Fast Charging. ACS Energy Lett. 2020, 5, 2045–2051. [Google Scholar] [CrossRef]
  36. Wang, Y.; Mao, S.; Chen, Q.; Chen, F.; Zhang, X.; Ouyang, M.; Han, X.; Zheng, Y. Online Fast Charging Model without Lithium Plating for Long-Dimensional Cells in Automotive Applications. Batteries 2023, 9, 563. [Google Scholar] [CrossRef]
  37. Liu, J.; Chu, Z.; Li, H.; Ren, D.; Zheng, Y.; Lu, L.; Han, X.; Ouyang, M. Lithium-plating-free fast charging of large-format lithium-ion batteries with reference electrodes. Int. J. Energy Res. 2021, 45, 7918–7932. [Google Scholar] [CrossRef]
  38. Zhao, T.; Zheng, Y.; Liu, J.; Zhou, X.; Chu, Z.; Han, X. A study on half-cell equivalent circuit model of lithium-ion battery based on reference electrode. Int. J. Energy Res. 2020, 45, 4155–4169. [Google Scholar] [CrossRef]
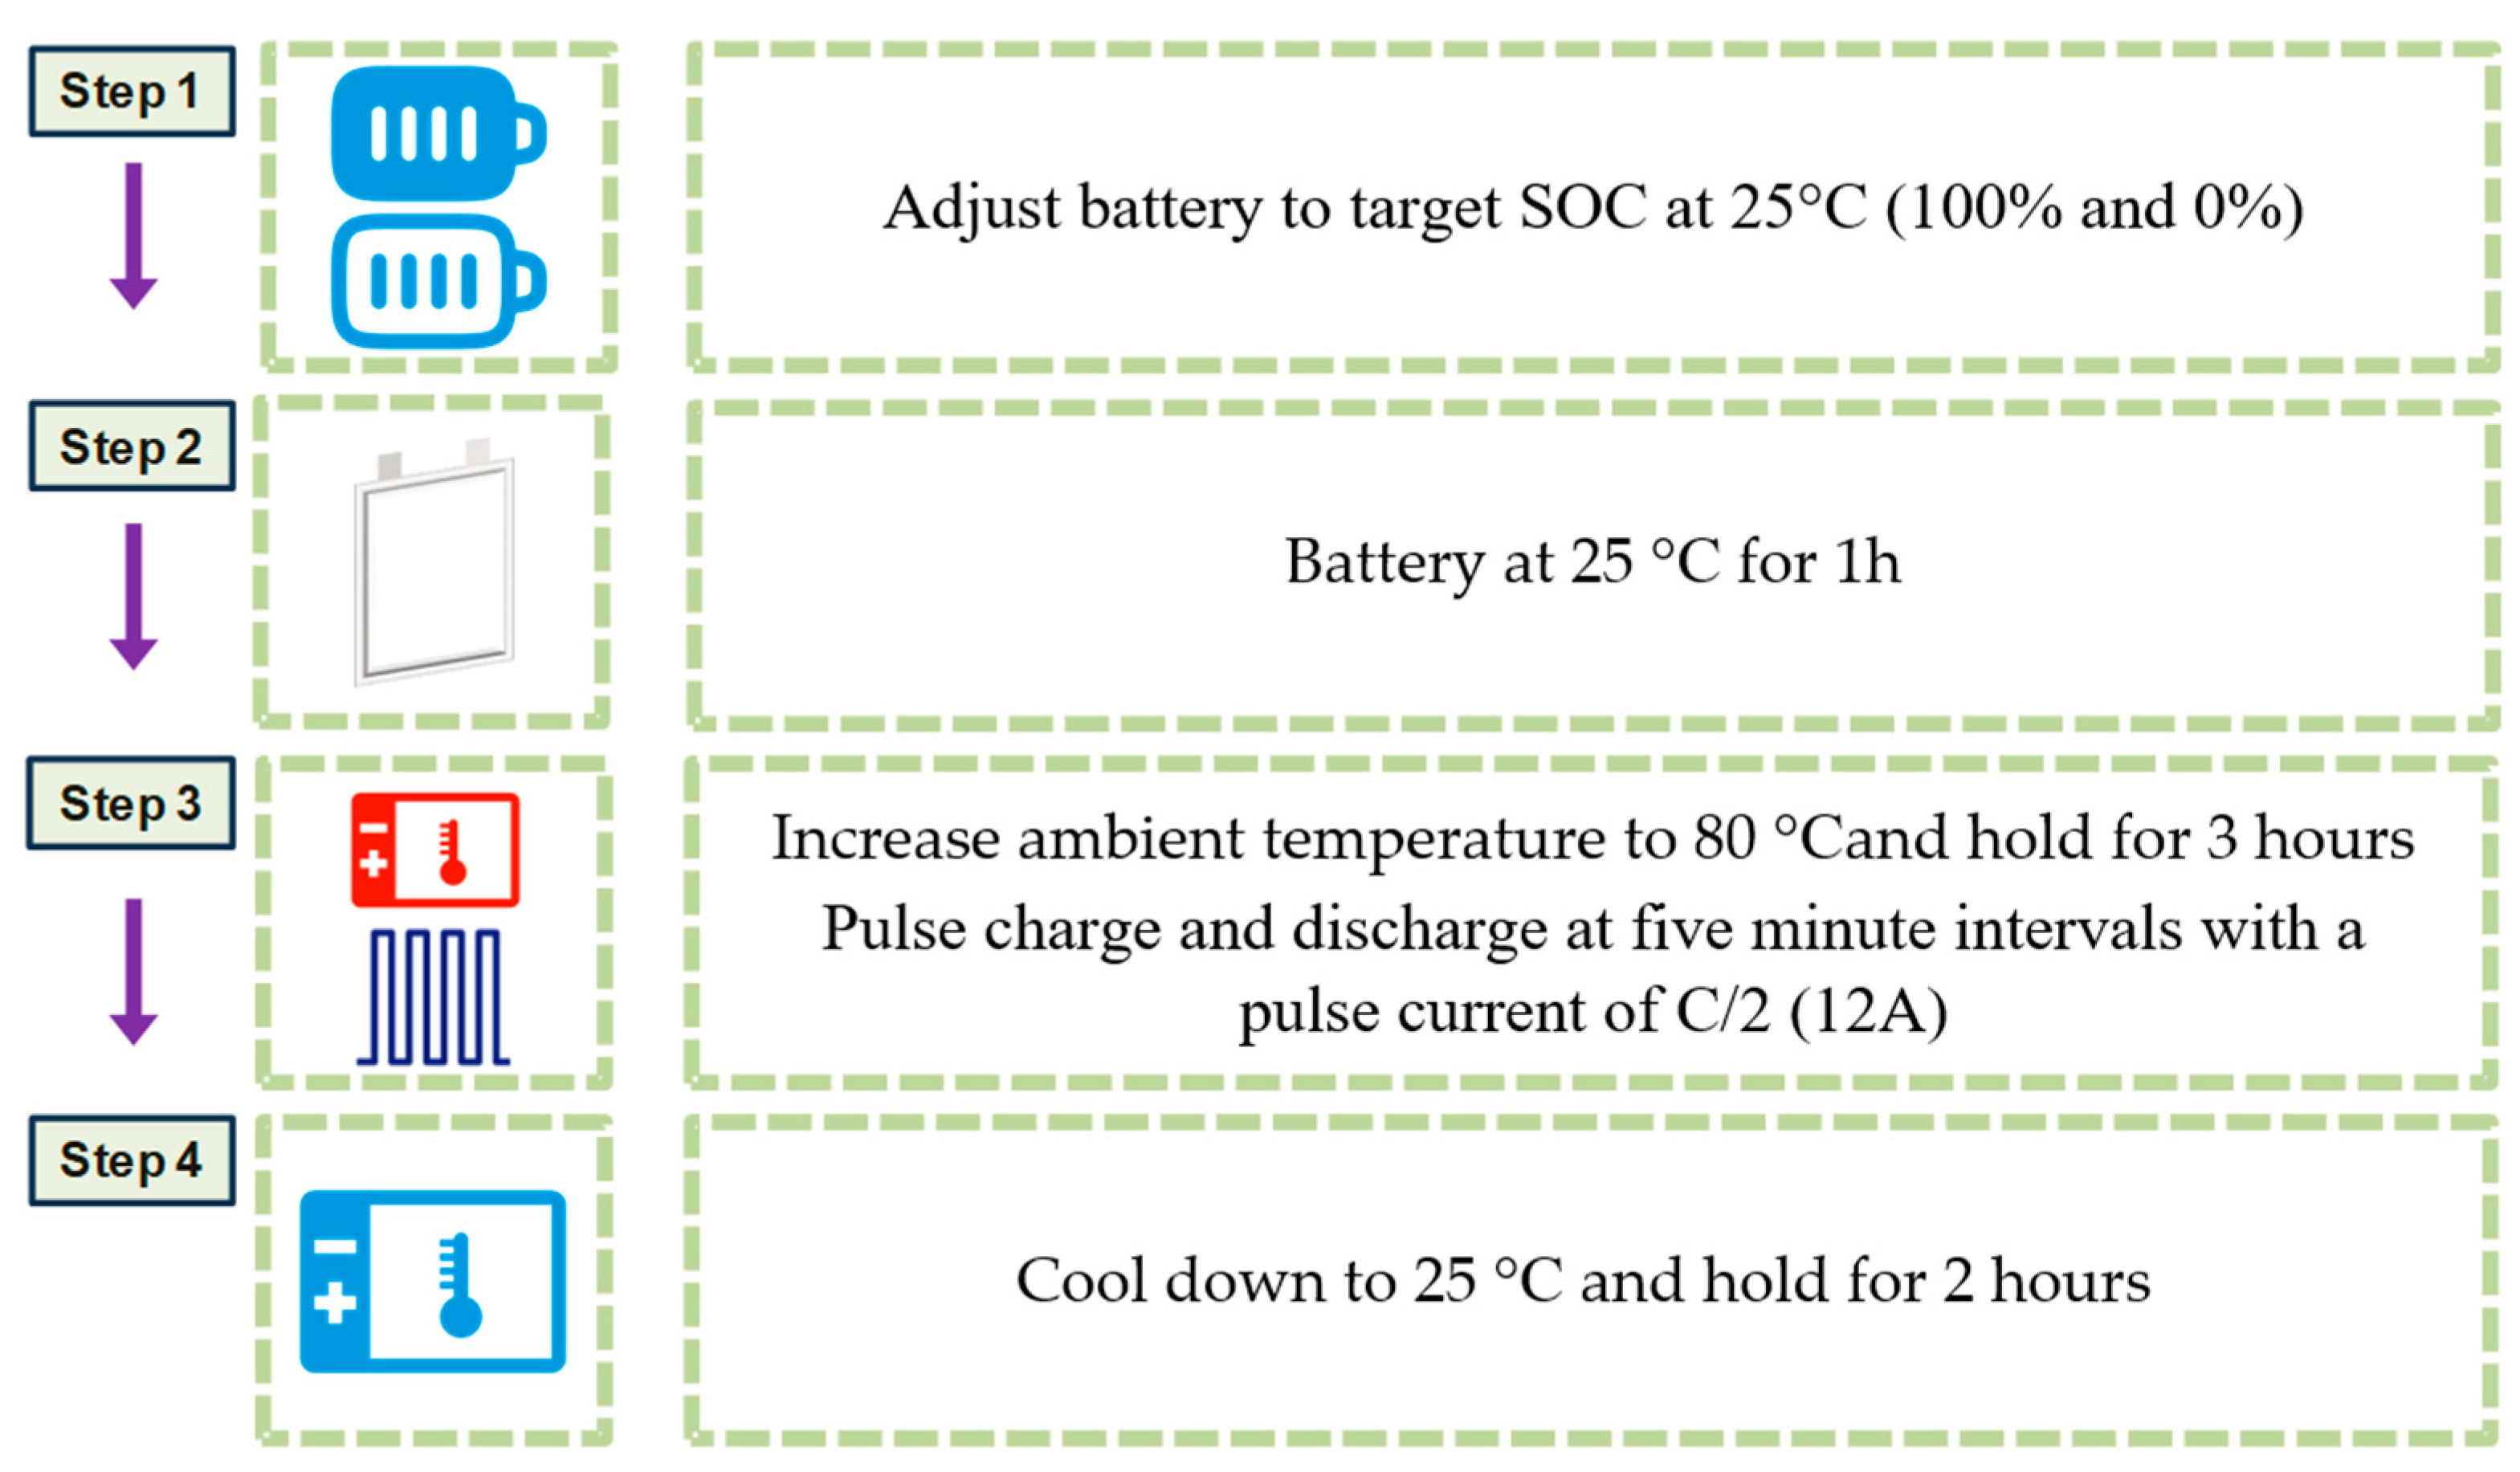
Figure 1. Experimental design of lithium-plating detection method based on heated DC internal resistance.
Energies 17 02409 g001
Figure 2. Multiple-rate CCCV charge–discharge process flowchart.
Energies 17 02409 g002
Figure 3. Typical process for quantitative detection of lithium plating in batteries via TGC.
Energies 17 02409 g003
Figure 4. (a) Changes in capacity of test cells before and after heating; (b) DC internal resistance during heating (100% SOC).
Energies 17 02409 g004
Figure 5. (a) Changes in capacity of test cells before and after heating; (b) DC internal resistance during heating (0% SOC).
Energies 17 02409 g005
Figure 6. Charging test with reference battery at multiple rates. (a) Battery terminal voltage at different C rates; (b) negative electrode potential of batteries at different C rates; (c) battery charging current at different rates; (d) temperature changes during charging at different rates.
Energies 17 02409 g006
Figure 7. Battery disassembly diagram; (a) 1 C negative pole; (b) 1.5 C negative electrode; (c) 1.9 C negative electrode; (d) negative electrode dripping produces a large amount of gas.
Energies 17 02409 g007
Figure 8. GC test: H2 concentration and the characteristic area; (a) GC test profiles of glove-box atmosphere samples and GC test profiles of lithium metal samples; (b) H2 concentration versus characteristic peak area of H2 detected via GC.
Energies 17 02409 g008
Figure 9. TGC test results of samples with different lithium metal contents; (a) GC test profiles of samples with different lithium metal contents; (b) theoretical amount of hydrogen produced versus the amount of hydrogen measured via GC for samples with different lithium metal contents.
Energies 17 02409 g009
Figure 10. Comparison of testing results for samples with different forms.
Energies 17 02409 g010
Figure 11. NMR test results of samples with different lithium metal contents. (a) NMR test results; (b) amount of substance of lithium metal versus characteristic NMR peak area.
Energies 17 02409 g011
Figure 12. Four-dimensional characteristics comparison chart of dendrite detection methods.
Energies 17 02409 g012
Table 1. Basic information of the battery.
ParametersValues/Types
Battery typeLix(NiCoMn)1/3O2/graphite
Rated capacity (Ah)24
Operating voltage (V)2.5~4.2
Charging operating temperature (°C)−25~55
Discharging operating temperature (°C)−30~55
Table 2. The basic parameters of the blade battery.
ParametersSpecifications
Size (mm)620 × 102 × 22.9
Rated capacity (Ah)190.6
Working voltage (V)2.0~3.8
Operation temperature (°C)−30~60
Weight (Kg)3.2
Table 3. Information of experimental batteries.
TypesProduct
Classification
Normal Capacity (Ah)Charge/Discharge Cut-Off Voltage
CellPouch cell1 Ah4.2/3.0
Table 4. Capacity change of batteries with different degrees of lithium plating before and after heating.
CellCapacity Change before Heating (Ah)Capacity Change after Heating (Ah)Capacity Retention Rate %
124.6224.5999.87
224.3024.2899.91
322.3020.7693.00
420.7418.4090.01
Table 5. Fresh Battery TGC Test Results.
SampleLithium Metal Content/gConverted Residual Capacity/mAh
10.01454
20.01142
30.01350
Mean value0.012749
Table 6. Battery lithium-plating test results.
SampleInitial Capacity/AhCapacity Decay/AhBased on Capacity Decay/gTGC/gError/%Remove Noise/gError/%
A1.0970.6870.1780.1790.60.1676.2
B1.1100.7200.1860.2049.70.1912.7
Disclaimer/Publisher’s Note: The statements, opinions and data contained in all publications are solely those of the individual author(s) and contributor(s) and not of MDPI and/or the editor(s). MDPI and/or the editor(s) disclaim responsibility for any injury to people or property resulting from any ideas, methods, instructions or products referred to in the content.