Article

Novel Hybrid Mexican Axolotl Optimization with Fuzzy Logic for Maximum Power Point Tracker of Partially Shaded Photovoltaic Systems

by
Ali M. Eltamaly
1,* and
Majed A. Alotaibi
2
1
Sustainable Energy Technologies Center, King Saud University, Riyadh 11421, Saudi Arabia
2
Department of Electrical Engineering, College of Engineering, King Saud University, Riyadh 11421, Saudi Arabia
*
Author to whom correspondence should be addressed.
Energies 2024, 17(11), 2445; https://doi.org/10.3390/en17112445
Submission received: 9 December 2023 / Revised: 21 February 2024 / Accepted: 2 April 2024 / Published: 21 May 2024
(This article belongs to the Section A2: Solar Energy and Photovoltaic Systems)

Abstract

:
Due to the nonlinear relation between the generated power and voltage of photovoltaic (PV) arrays, there is a need to stimulate PV arrays to operate at maximum possible power. Maximum power can be tracked using the maximum power point tracker (MPPT). Due to the presence of several peaks on the power–voltage (P–V) characteristics of the shaded PV array, conventional MPPT such as hill climbing may show premature convergence, which can significantly reduce the generated power. Metaheuristic optimization algorithms (MOAs) have been used to avoid this problem. The main shortcomings of MOAs are the low convergence speed and the high ripples in the waveforms. Several strategies have been introduced to shorten the convergence time (CT) and improve the accuracy of convergence. The proposed technique sequentially uses a recent optimization algorithm called Mexican Axolotl Optimization (MAO) to capture the vicinity of the global peak of the P–V characteristics and move the control to a fuzzy logic controller (FLC) to accurately track the maximum power point. The proposed strategy extracts both the benefits of the MAO and FLC and avoids their limitations with the use of the high exploration involved in the MOA at the beginning of optimization and uses the fine accuracy of the FLC to fine-track the MPP. The results obtained from the proposed strategy show a substantial reduction in the CT and the highest accuracy of the global peak, which easily proves its superiority compared to other MPPT algorithms.

1. Introduction

Energy is essential for modern life to power homes, businesses, and the transportation of goods and people. As the world’s population grows and economies develop, the energy demand is increasing. Global energy consumption is expected to rise by 50% by 2050 according to projections from the International Energy Agency (IEA) [1]. The main source of greenhouse gas emissions, which hasten climate change, is the combustion of fossil fuels, such as coal and oil. Moreover, the extraction and transportation of fossil fuels can also damage ecosystems and pollute the environment. To reduce their impact on the environment, a transition to clean energy sources, such as renewable energy and nuclear power becomes an urgent need. It is important to balance the need for energy with the need to protect the environment. This can be achieved by investing in renewable energy sources (RES), reducing our reliance on fossil fuels, and improving the efficiency of the generation and utilization of energy in different components of the renewable energy systems. Moreover, the energy can also be reduced by improving the energy efficiency of energy generation systems and load utilization as well. This can be achieved by using more efficient devices and controllers such as the effective photovoltaic (PV) maximum power point tracker (MPPT) and the use of modern energy storage systems such as the lithium-ion and vanadium redox flow batteries instead of use lead acid batteries.
Solar radiation may be directly converted into electricity using photovoltaic energy, eliminating the need for any further conversion steps. Sunlight absorption and conversion into electrical energy are processes carried out by semiconductor materials used in photovoltaic cells. Sustainable, clean, and renewable energy comes from photovoltaic cells. It is also a distributed energy source, meaning that it can be generated at or near the point of use, which can help to reduce grid congestion and power losses. In the global energy mix, photovoltaic energy is becoming more and more significant. Approximately 3% of the world’s power was produced with photovoltaic energy in 2022. By 2030, PV energy is expected to generate almost 10% of the world’s power, according to IEA projections [1].
There is a global peak (GP) at a certain voltage known as the maximum power voltage in the nonlinear relationship between the produced power and terminal voltage (P–V characteristics). For this reason, the PV system should track this voltage at different irradiances and temperatures. As seen in Figure 1a, the P–V characteristic has a single peak that falls on the PV array with a uniform dispersion. However, as Figure 1 illustrates, under partial shade conditions (PSC), the P–V curves contain many local peaks (LPs) in addition to one GP. The number of peaks is determined by the variation in irradiance levels across several series-connected PV modules. The P–V characteristics are displayed for varying numbers of peaks in Figure 1a. Figure 1b shows the P–V curves for three peaks at four shading patterns that will be used in the simulation work. A photovoltaic system’s PSC happens on the PV array when some of its PV modules are partially shaded by other PV modules, buildings, or trees. It may be challenging for a PV system to run at its MPP when there is a PSC since it might cause the MPP to move from its position and create several LPs and one GP. This challenge needs a robust tracker system to track the GP and avoid becoming trapped in one of the LPs thanks to the MPPT optimization algorithms. The MPPT must have the ability to track the GP under different PSCs, especially in fast-changing weather conditions sites. MPPT is a hot topic in which most studies are focusing on improving the generation efficiency in terms of the robust track of the GP and the avoidance of stagnation in the LPs, the fast convergence or the lowest convergence time (CT), the lowest ripple contents in the waveforms to ensure the highest PV system stability.

1.1. The Literature Survey

In the event that solar irradiation is uniform, the traditional MPPT techniques—hill climbing (HC) [2], perturb and observe (P&O) [3], and a fuzzy logic controller (FLC) [4,5,6]—are very successful in monitoring the MPP. However, these techniques are not able to track the MPP with PSC where they may stick in one of the LPs. Metaheuristic optimization algorithms (MOAs) have been devised to address the drawbacks of traditional MPPT approaches. [7,8,9,10,11]. The MOA avoids becoming stuck in the LPs and tracks the GP quite well. The lengthy CT and the strong ripples and oscillations surrounding the GP are the primary drawbacks of the MOAs, since they have the potential to interfere with the PV systems’ ability to operate, particularly in locations where solar irradiance changes quickly. Several studies have been used to fasten the convergence of the MOAs in capturing the GP without compromising the accuracy of the results and without being trapped in the LPs [12,13,14].
To increase the MPPT’s effectiveness in reducing the CT and preventing premature convergence, a number of modified MOAs have been used [9,12]. Several of these modifications have been concentrated on modifying the control parameters of these MOAs [15,16,17,18,19]. Both the CT and the convergence accuracy are strongly influenced by the control settings of the MOAs. One of these studies linearly decreases the weight value of the particle swarm optimization (PSO), improving both the exploitation and the exploration phases of the optimization process from the outset to the end [20]. Another study used the same logic but with all control parameters of PSO such as shown in [21,22]. Some other strategies used adaptive values of the control parameters based on the performance situation of the optimization algorithms [23]. Some other strategies introduced nested MOAs to predict the control parameters during offline operation and use these parameters to work with the system during normal operation of the MOAs such as nested PSO (NESTPSO) [15,16] and nested bat algorithm (BA) (BA-BA) [19]. Another study used a FLC with the MOAs to optimally determine the values of parameters during the MPPT normal operation [24].
The high number of search agents can effectively capture the GP and prevent premature convergence, but it will lengthen the CT. A significant influence on the MPPT performance while using MOAs is the search agents number [25,26,27]. On the contrary, the low number of search agents is reducing the CT but it will expose the MPPT to be trapped in premature convergence and may become trapped in the LPs. The ideal swarm size was determined by a number of studies that were published in the literature using different values of swarm size and check the one with minimum CT with the highest accuracy for different numbers of peaks [28]. Another study determines the optimal swarm size while determining the optimal control parameters such as the NESTPSO [15,16], BA-BA [19], and the nested Grey Wolf Optimizer (NestGWO algorithms) [29]. These studies proved that the swarm size of the MOAs has a great impact on the convergence performance and should be carefully determined. Most of these studies recommend using 4–6 search agents with the MPPT MOAs [15,16].
In order to improve exploration and decrease CT, a lot of studies were published in the literature to address the issue of not needing as many search agents at first as possible [9]. These techniques’ basic tenet is to use a large number of search agents early on in the optimization process, then progressively reduce them as the stages toward optimization advance. By using a high number of search agents to improve exploration at the start of optimization steps and a low number of search agents to decrease CT, increase accuracy, and lessen ripples in the voltage, current, and power waveforms at the end of optimization steps, these strategies accomplish two goals at once [9]. One of the most important studies that use this strategy is introduced based on the idea called musical chairs algorithm (MCA), which resembles the concept of the musical chairs game, in which each player acts as a search agent and the player who is unable to find a chair will be eliminated from the game as optimization stages are completed [9]. A similar idea has been used with the PSO in which the search agents’ number is reduced with the progress of the optimization [30]. The same logic has been used with several MOAs used for the same purpose such as Grey Wolf Optimizer (GWO) [31]. This study showed very effective performance in tracking the GP in PSC of the PV systems with shorter CT and higher accuracy than several optimization algorithms used for comparison with it [30,31].
Most of the MOAs recommend random initialization of the search agents [32]. Many studies recommend not using the random initialization of the PV MPPT because it prolongs the CT and may lead to convergence at one of the LPs when random duty ratios are concentrated far from the vicinity of the GP [30,33]. There are many strategies used for modifying the initial positions of search agents to avoid these limitations [15,26,30,33]. One of these studies recommended to use of equal duty ratio distances between the search agents’ initial values [34]. Some other studies derived formulas to predict the anticipated positions of the GP and use them as search agents’ initial values [35,36]. Although the number of search agents should match the number of peaks, the latter strategy—which initializes the search agents at the predicted locations of the GP—performs better in terms of reducing the CT and preventing premature convergence. Some other strategies predict the maximum and minimum position boundaries for the peaks, then check the values of power within these peaks and start all the particles inside the limits of the highest peak to reduce the possibilities of premature convergence and fasten the convergence speed [37].
Utilizing quick convergence at the start of optimization stages and handing off management to an accurate MPPT methodology at the end of the optimization process are two of the finest methods for managing the MPPT of PV systems. These strategies are called hybrid optimization algorithms which are widely used in many studies [38,39,40,41,42,43]. Some studies used fast MOA in the beginning and then accurate conventional optimization algorithms after that such as the use of PSO-IncCond [41] and GWO-P&O [42]. Several strategies were also introduced to hybridize two MOAs to achieve the fast convergence of the first one and the fine tracking of the second one such as Cuckoo Search (CS) and GWO [40]. Two hybrid MOAs (Cuckoo search and GWO) have been used for the same purpose where the cuckoo search algorithm is used at the beginning of optimization for the fast convergence followed by the GWO to effectively and accurately track the GP [40]. Another strategy used two MOAs shuffled frog leaping algorithm (SFLA) and PSO algorithm (SFLA-PSO) in hybrid [44]. Other studies used an MOA technique at the beginning of optimization and used the FLC after a few iterations as shown in [38,43] for the GWO-FLC and PSO-FLC, respectively. In [38], the GWO algorithm is used at the beginning of the optimization steps due to its fast convergence characteristics, and after certain iterations and based on a certain condition the control transfers the control to FLC, which is characterized by the fine tracking of the GP [38]. In [43], the PSO is used at the beginning of optimization followed by the FLC, where the PSO captures the vicinity of the GP and the FLC is used to fine-track the GP with the lowest ripples. For this reason, the benefits of the two techniques are achieved and their limitations can be avoided. This strategy showed superior performance for the PV MPPT and for this reason, it is used in this study.
The proposed study selected a recent fast and accurate MOA algorithm called Mexican Axolotl Optimization (MAO) [45,46] to track the nearest GP position sequentially followed by the FLC for accurately tracking the GP with the lowest ripples in the PV voltages and currents. The proposed system that contains the PV array, boost converter, MAO-FLC MPPT, and PWM inverter is shown in Figure 2.

1.2. Motivation and Innovation

The long CT associated with the MOAs is one of the principal difficulties hindering the utilization of these optimization algorithms in PV MPPT. Moreover, compared to many standard algorithms, such as FLC, these algorithms experience higher levels of oscillation and ripple around the steady state conditions. The FLC does not have the ability to avoid becoming stuck in the LPs; meanwhile, it has excellent and accurate tracking of the GP with low ripples and oscillations and in the current, voltage, and power waveforms. So, the idea introduced in this paper is to have hybrid optimization algorithms work synergistically to achiever faster capture of the GP at the start of optimization steps and another optimization algorithm to fine-track this GP after that. This idea can be achieved by introducing a recent MAO algorithm that shows very fast convergence in many applications [45,46] to be used at the start of the optimization algorithm to distinguish the GP vicinity. After a few iterations based on certain conditions, the control moves to an FLC to fine-track the GP with the lowest possible ripples and oscillations. This proposed methodology is hitting two birds with one stone, which can swiftly capture the vicinity of the GP using the MAO then fine-tracking the accurate value of the GP with the lowest oscillation and ripples using the FLC.

1.3. Paper Outlines

This paper is presented in seven sections. The first section introduces an overview of the MPPT, the literature review, and the innovation introduced in this paper. Section 2 introduces a PV system overview and modeling of different parts. Section 3 introduces a description of the MAO algorithm and how it can be utilized as a PV MPPT. Section 4 introduces a detailed description of the FLC and how it can be used in the PV MPPT. The simulation and experimental studies of the proposed strategy are introduced in Section 5 and Section 6, respectively. Section 7 presents the findings gathered from this investigation.

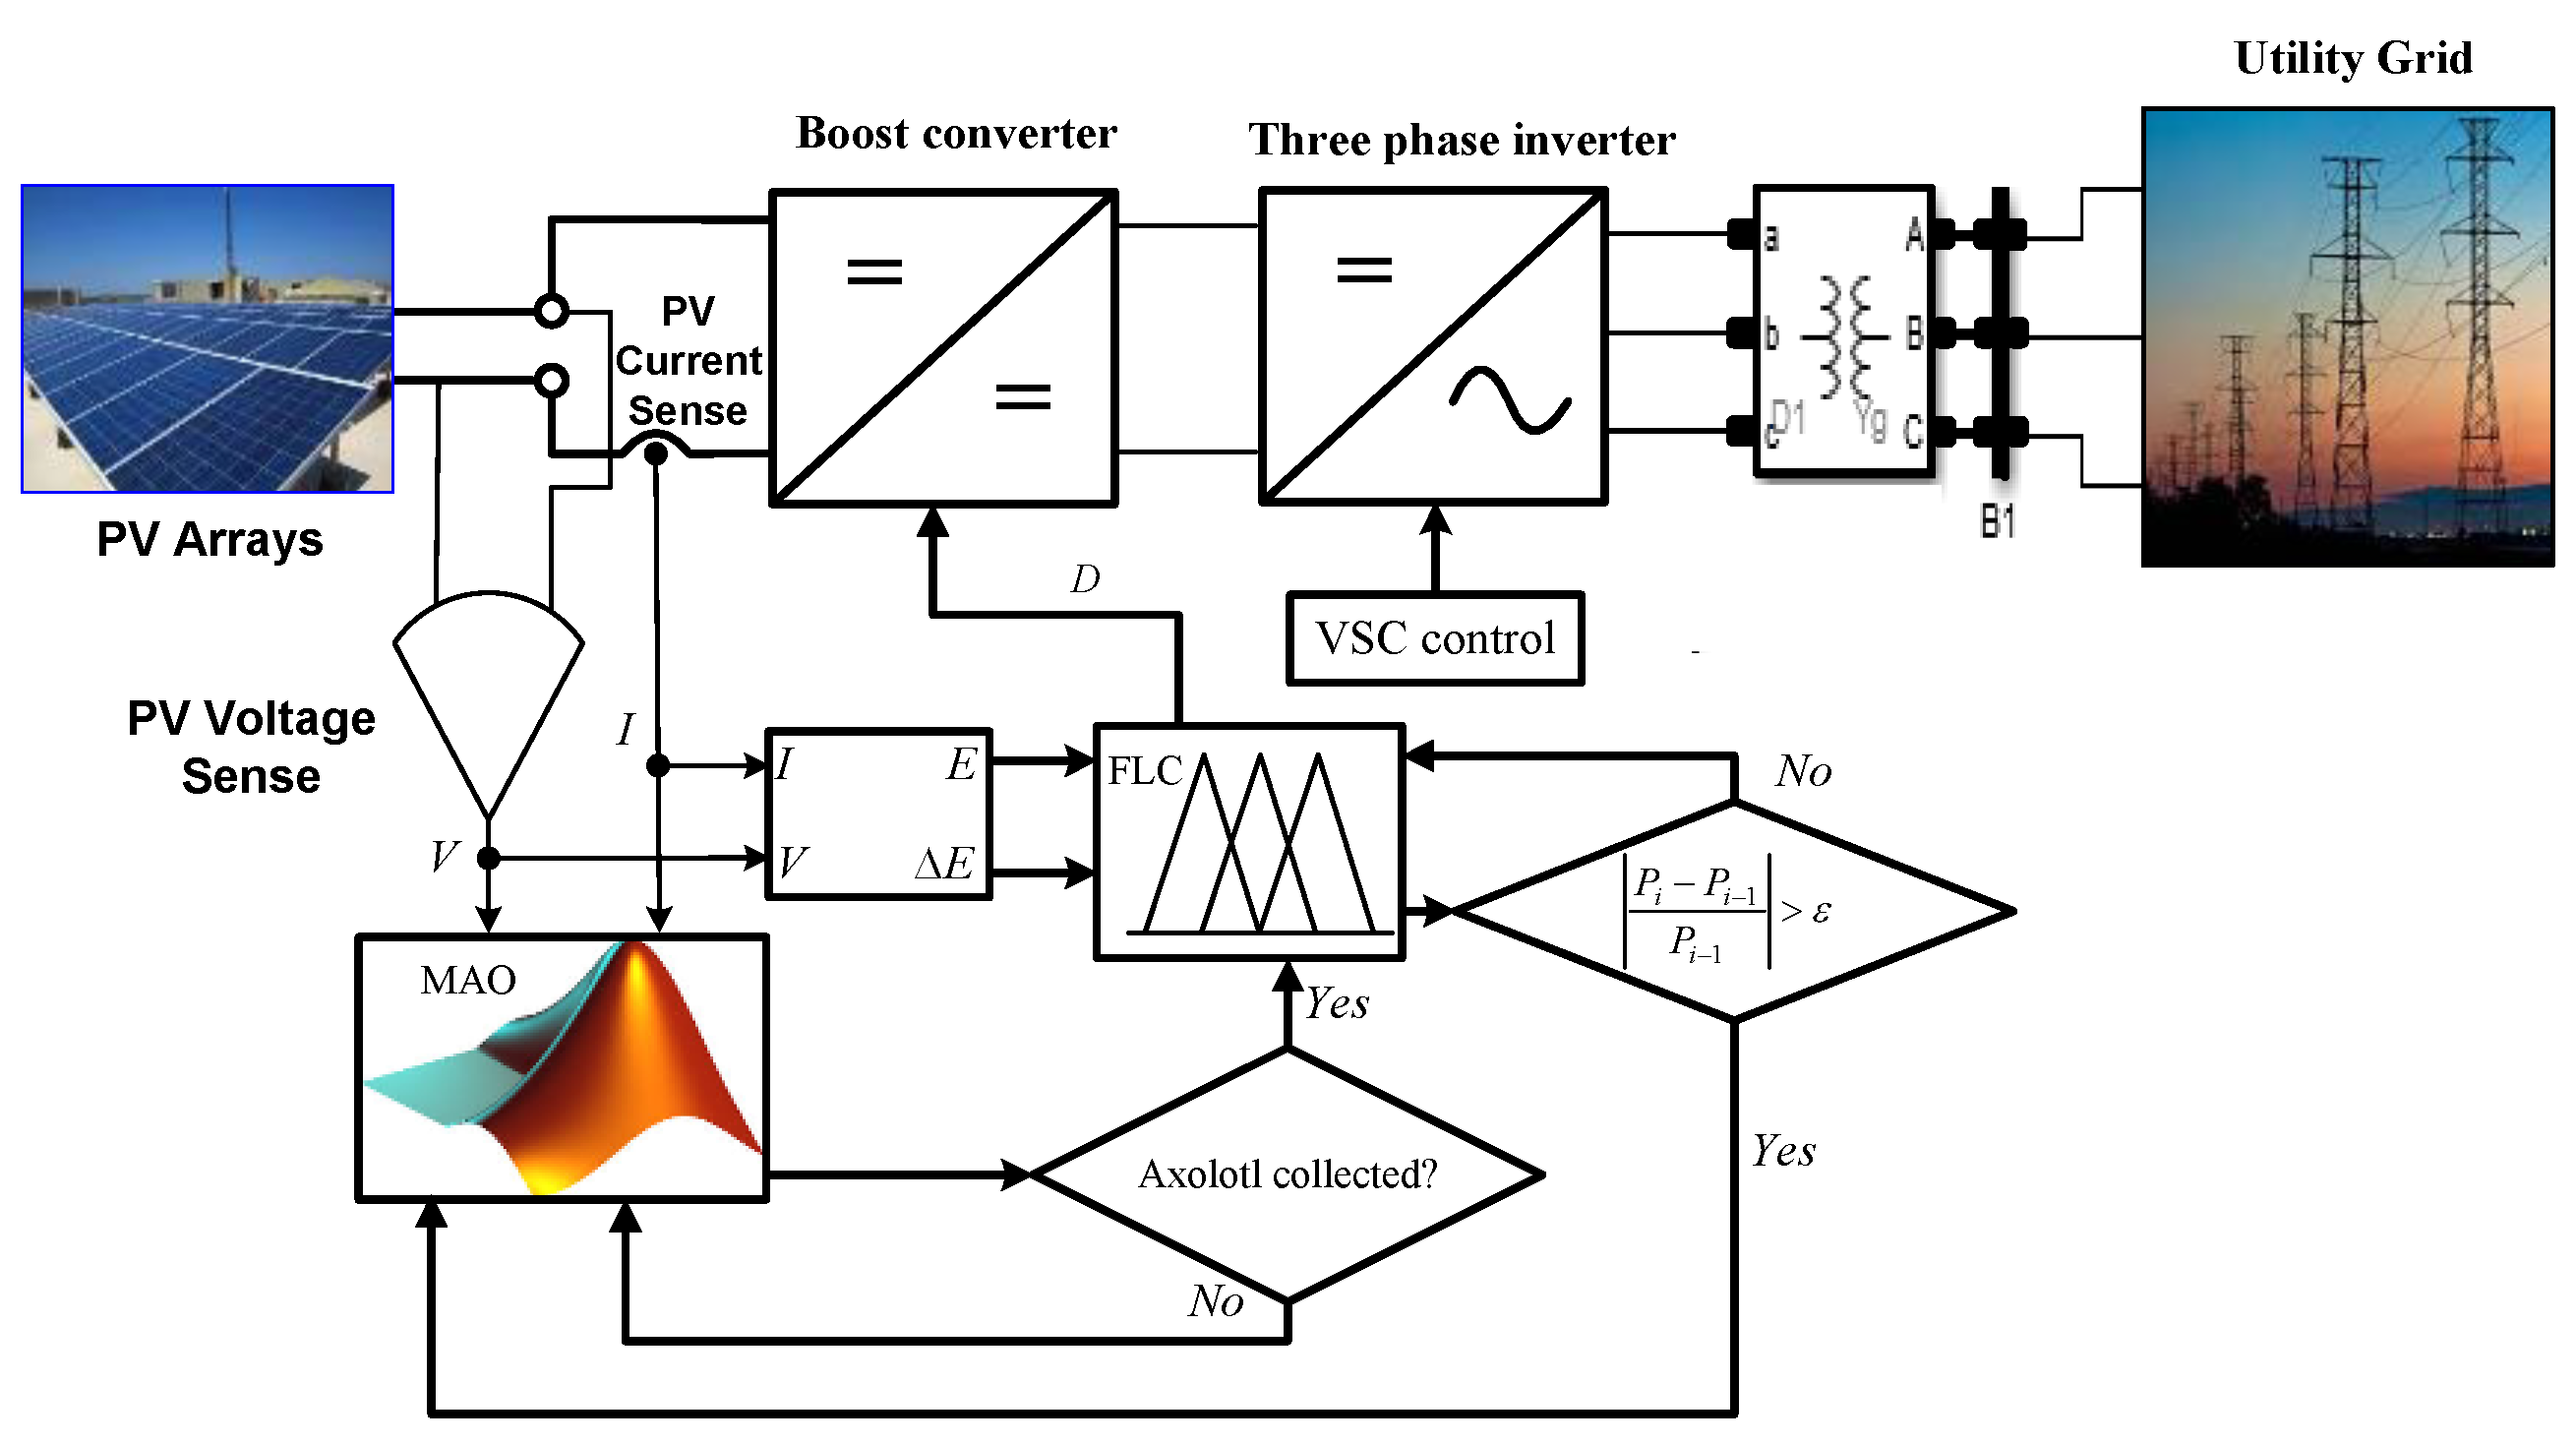
2. PV System Description

Two different PV energy system configurations are used, ON-grid and OFF-grid configurations. The ON-grid storage should be connected to an inverter to be synchronized with the electric grid and it may or may not have a battery storage system. To store excess energy and feed in shortfall energy to the load when the PV system’s generation is less than the load and vice versa, the off-grid system should be equipped with a battery storage system or some other type of energy storage system. To adjust the PV array’s terminal voltage so that it operates at the GP under various operating circumstances, the PV system needs a DC–DC converter. To maximize the power output from the PV system, the MPPT is utilized to regulate the DC–DC converter. Figure 2 displays the schematic of the MPPT-equipped ON-grid PV system.

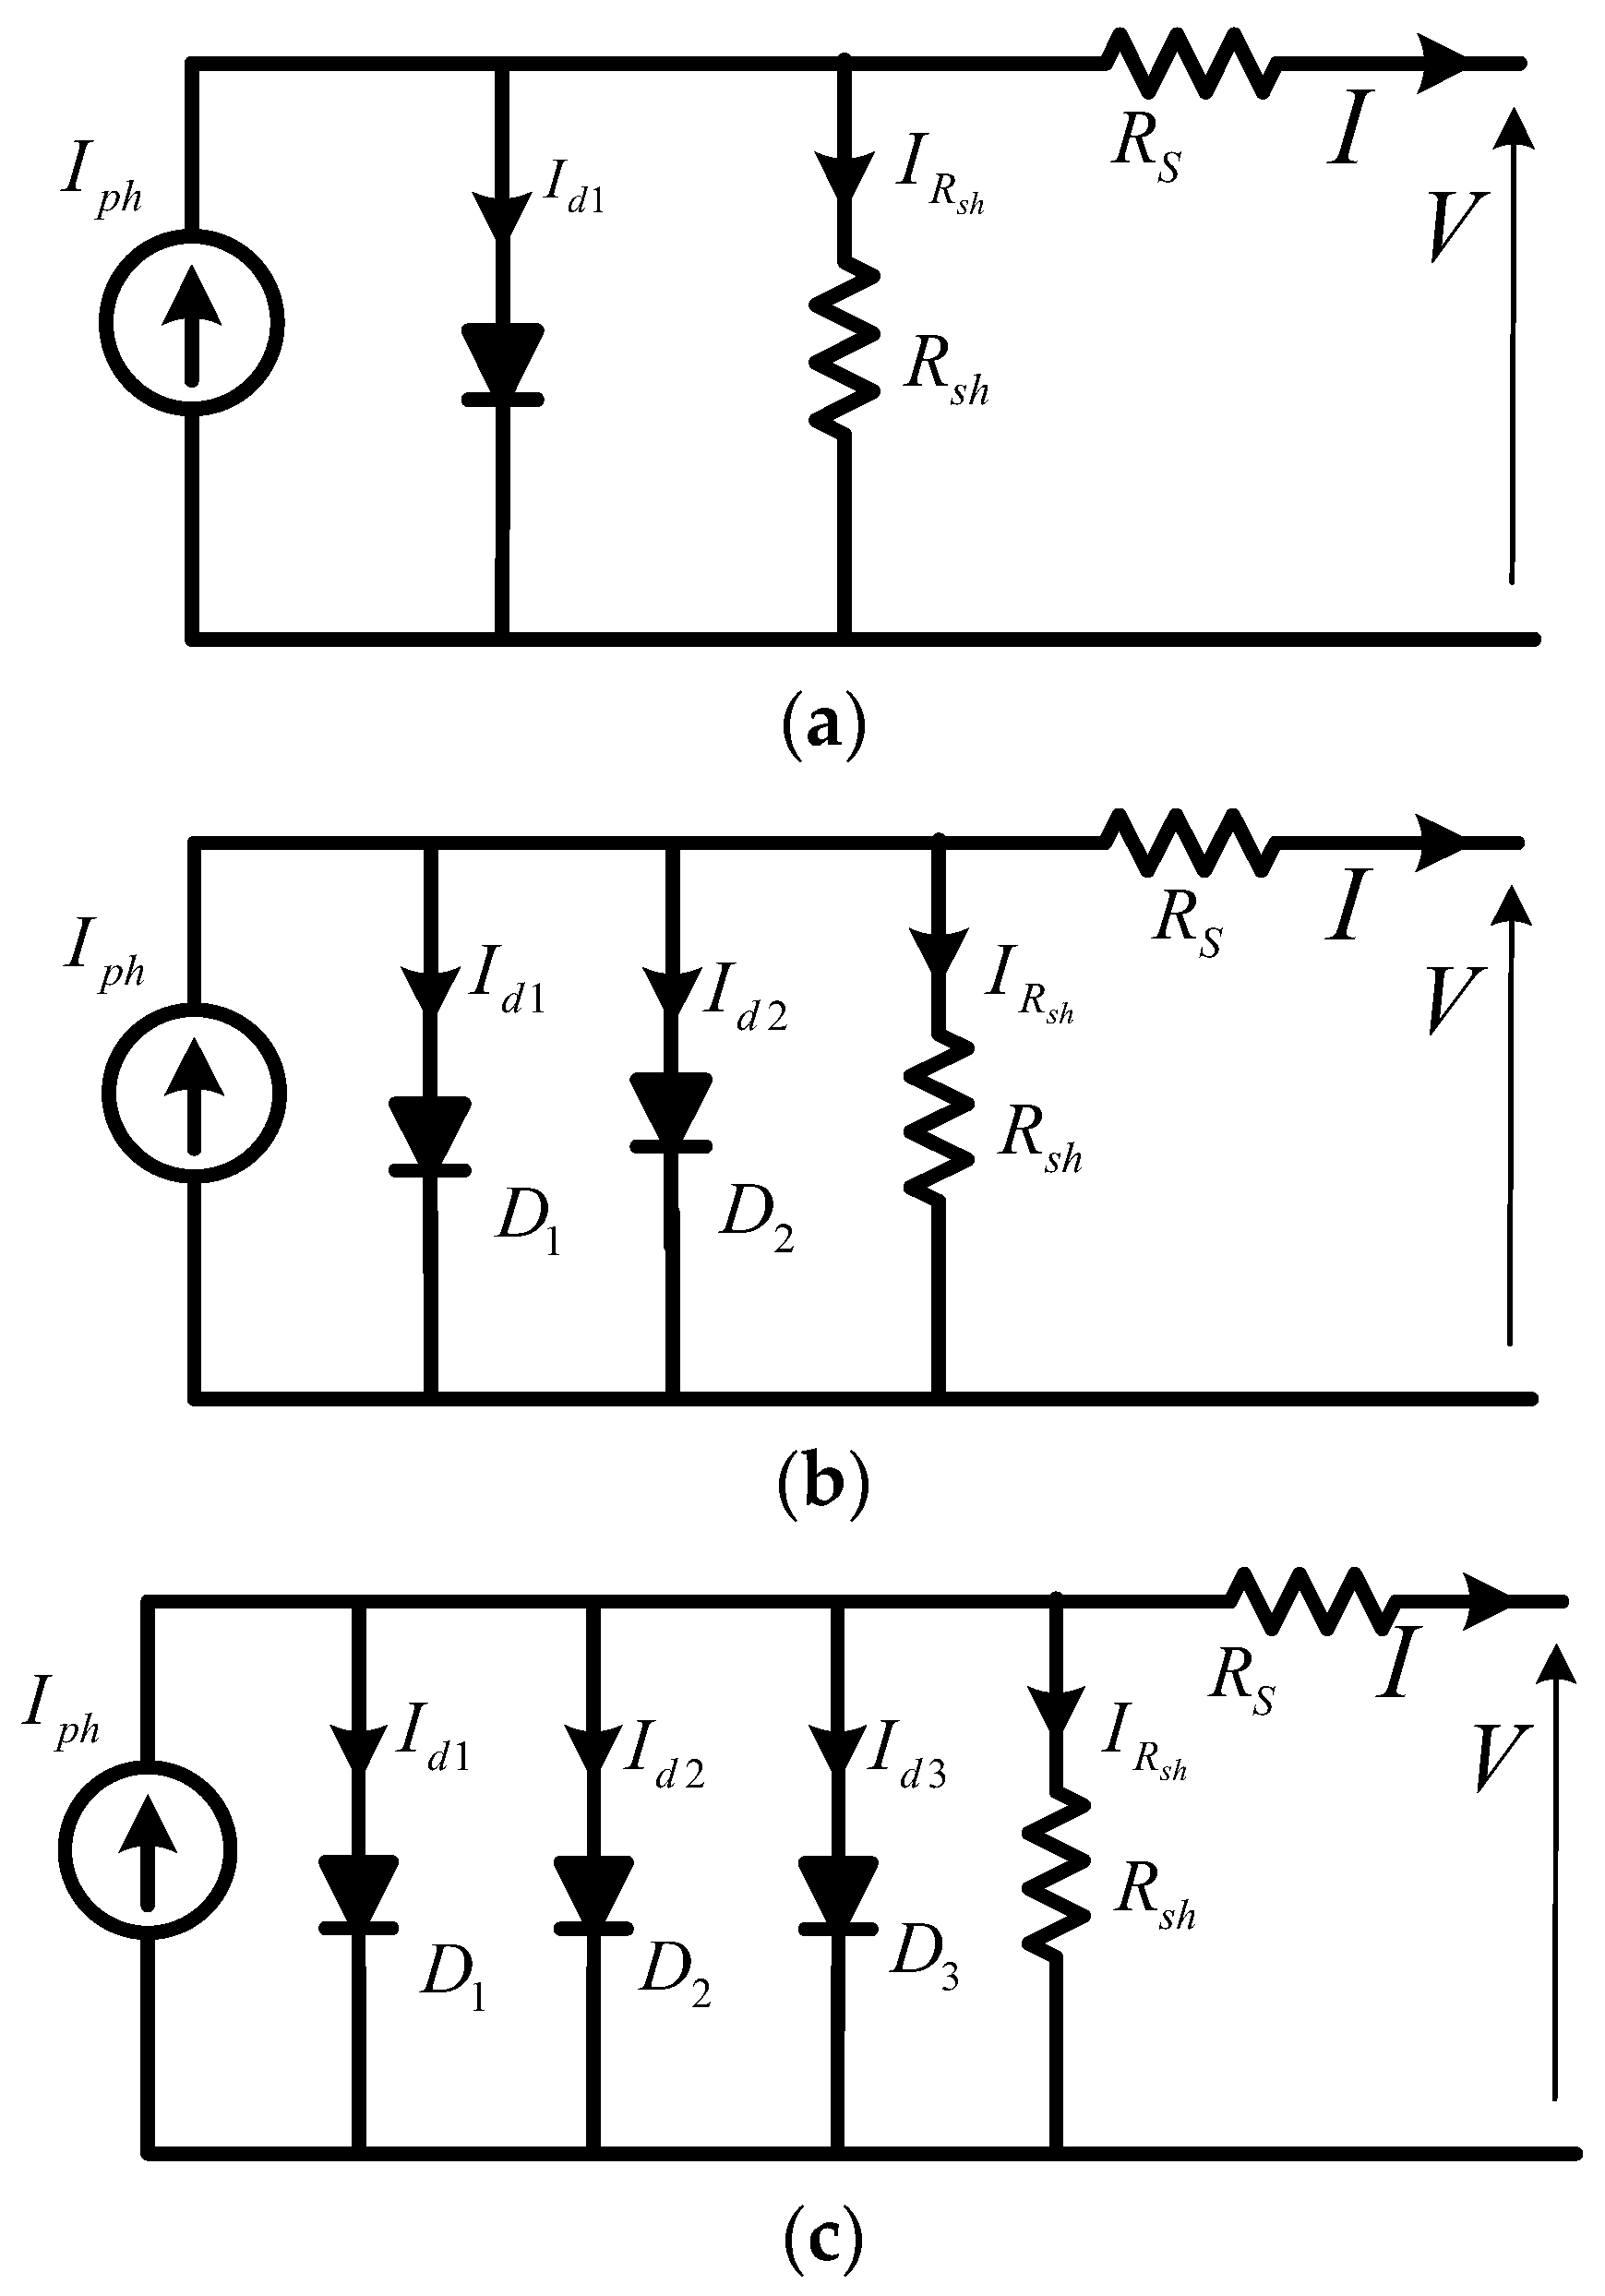
2.1. PV Cell Modelling

The PV cell is the smallest unit building the PV array. The PV cell is a P-N junction that is sensitive to light falling on the surface of the PV cell. With silicon semiconductor material, a voltage difference of approximately 0.7 V can be produced between the two layers when the photons in the light give the free electron in the N-layer more energy to move to the hole in the P-layer, converting it from a positive anode to a negative ion. If the load is connected between the two PV cell terminals the power will flow through the load. Several PV cells can be connected in series to increase the terminal voltage of the PV module and several PV cells can be connected in parallel branches to increase the PV module terminal current. The PV cell is modeled in several forms [47,48,49,50,51,52,53,54]. Single-diode modeling (SDM) of the PV cell is the most famous model with the equivalent circuit shown in Figure 3a. This model has five parameters which are shunt resistance (Rsh), series resistance (Rs), diode saturation current (Id1), ideality factor (n1), and the photon generated current (Iph). This model is simple and adequately represents the actual operation of the PV cell but sometimes is inaccurate due to missing some important physical characteristics such as the recombination of electrons and holes in the semiconductor material [54]. This recombination process reduces the current that can be generated by the PV cell. For this reason, a double-diode model (DDM) is introduced as shown in Figure 3b. In this model, the recombination of the electrons and holes has been considered by adding another shunt diode in parallel with the single diode shown in the SDM. Despite the high accuracy of the DDM, it shows higher complexity than SDM, where it needs to deal with seven parameters; however, SDM is dealing only with five parameters. The two extra parameters are the saturation current of the second diode (Id2) and its ideality factor (n2). Based on the higher accuracy obtained from DDM, an extra shunt diode can be inserted for higher accuracy as in the triple-diode model (TDM), but at the cost of the simplicity of the circuit where it needs to deal with nine parameters instead of five or seven parameters of SDM or DDM, respectively. The extra two parameters in the TDM are the ideality factor (n3) and the saturation current of the third diode (Id3) as shown in Figure 3c. Several studies were introduced in the literature to determine the PV-cell models based on actual measurements in the lab [32,54,55]. These studies used the measured data of the current and voltage and compared it with the calculated values obtained from the model and minimize the root mean square errors using metaheuristic algorithms [55] or analytic strategies [56]. The formulas that represent the SDM, DDM, and TDM are shown in Equations (1)–(3).
I = I p h I d 1 [ e q ( V + R s I ) n 1 K T 1 ] V + R s I R s h
I = I p h I d 1 [ e q ( V + R s I ) n 1 K T 1 ] I d 2 [ e q ( V + R s I ) n 2 K T 1 ] V + R s I R s h
I = I p h I d 1 [ e q ( V + R s I ) n 1 K T 1 ] I d 2 [ e q ( V + R s I ) n 2 K T 1 ] I d 3 [ e q ( V + R s I ) n 3 K T 1 ] V + R s I R s h

2.2. DC–DC Converter

Several DC–DC converters have been used with the PV systems such as boost converters [54], buck converters [57], SEPIC converters [58], and interleaved boost converters [59]. The main function of these converters is to stimulate the PV array to operate at the optimal voltage that ensures the highest possible generated power and to participate in maintaining the DC-link voltage constant for the proper operation of the inverter. Since it is straightforward and has linear control properties that make it easy for the control system to regulate the PV array’s terminal voltage, the boost converter has been utilized extensively in several studies. For this reason, it will be employed in this one as well.
The boost converter has one inductor, two capacitors, one diode, and one switching transistor, mostly of the MOSFET type. During the ON state of the switch, the diode will be in reverse state and the PV starts supplying the inductor with a linearly rise current. The PV is completely disconnected from the output circuit due to the switch OFF of the diode. Once the switch is turned OFF, the inductor stored energy forces the diode to switch ON and the energy will move from the inductor to the capacitor. The relation between the PV voltage and the voltage of the DC-link is shown in Equation (4).
V D C V = 1 1 d
With the boost converter operating in the continuous conduction mode, the state space equations for the voltage and current may be found in Equations (5) and (6), respectively [60].
d v d t = 1 R P V C i n ( R s h i L R P V i L v )
d i L d t = 1 L ( v R e q i L ( 1 d ) V D )
where d is the duty ratio, VD is the diode voltage during conduction, and RPV is the internal PV array resistance, which can be obtained from Equation (7).
R P V = R s + R s h
The boost converter equivalent circuit, Req can be determined from the following equation:
R e q = R L + d . R s w + ( 1 d ) R D
where RD is the diode forward resistance, Rsw is the switching-ON resistance of the MOSFET, RL is the load resistance, which can be obtained by dividing the voltage of the DC-link by the output boost current.
The PV array’s input capacitor is utilized to lessen terminal voltage variations [61]. In order to ascertain the ideal value of the input capacitor, several studies have been introduced [60,61]. To ascertain the impact of variations in the input capacitor relative to the output capacitor, a thorough investigation is presented [61]. This study concluded that the input capacitor should be less than half of the output capacitor for efficient PV system performance. Another study concluded that the minimal capacitance value of the input capacitor for 1–5% allowable ripple limits of the input voltage of the boost converter is introduced in Equation (9) [60,62].
C i n > d ( 1 d ) 8 L D F 2 . δ v
where F is the boost converter switching frequency and δ v is the allowable ripple in the input voltage.
The variation in the input voltage and current from the small signal modeling of the PV array and the boost converter can be obtained from Equation (10) and Equation (11), respectively [60].
δ v ( s ) = 1 R P V C i n s + 1 ( R s h δ i i n ( s ) R P V δ i L ( s ) )
δ i L ( s ) = 1 R e q + L s ( δ v ( s ) ( 1 d ) δ v D C ( s ) )
The small signal of the output voltage can be determined from Equation (12) [60].
δ v o u t ( s ) = 1 1 + C o u t R L s ( δ i L ( s ) )
The relation between the input voltage and the input current due to the variation in solar irradiance can be obtained by dividing Equation (10) by Equation (11) [60]. It is evident from this relationship that the input capacitor value need to be as low as feasible and should not surpass the value indicated in Equation (9). A detailed description of the boost converter design components is shown in Section 5.

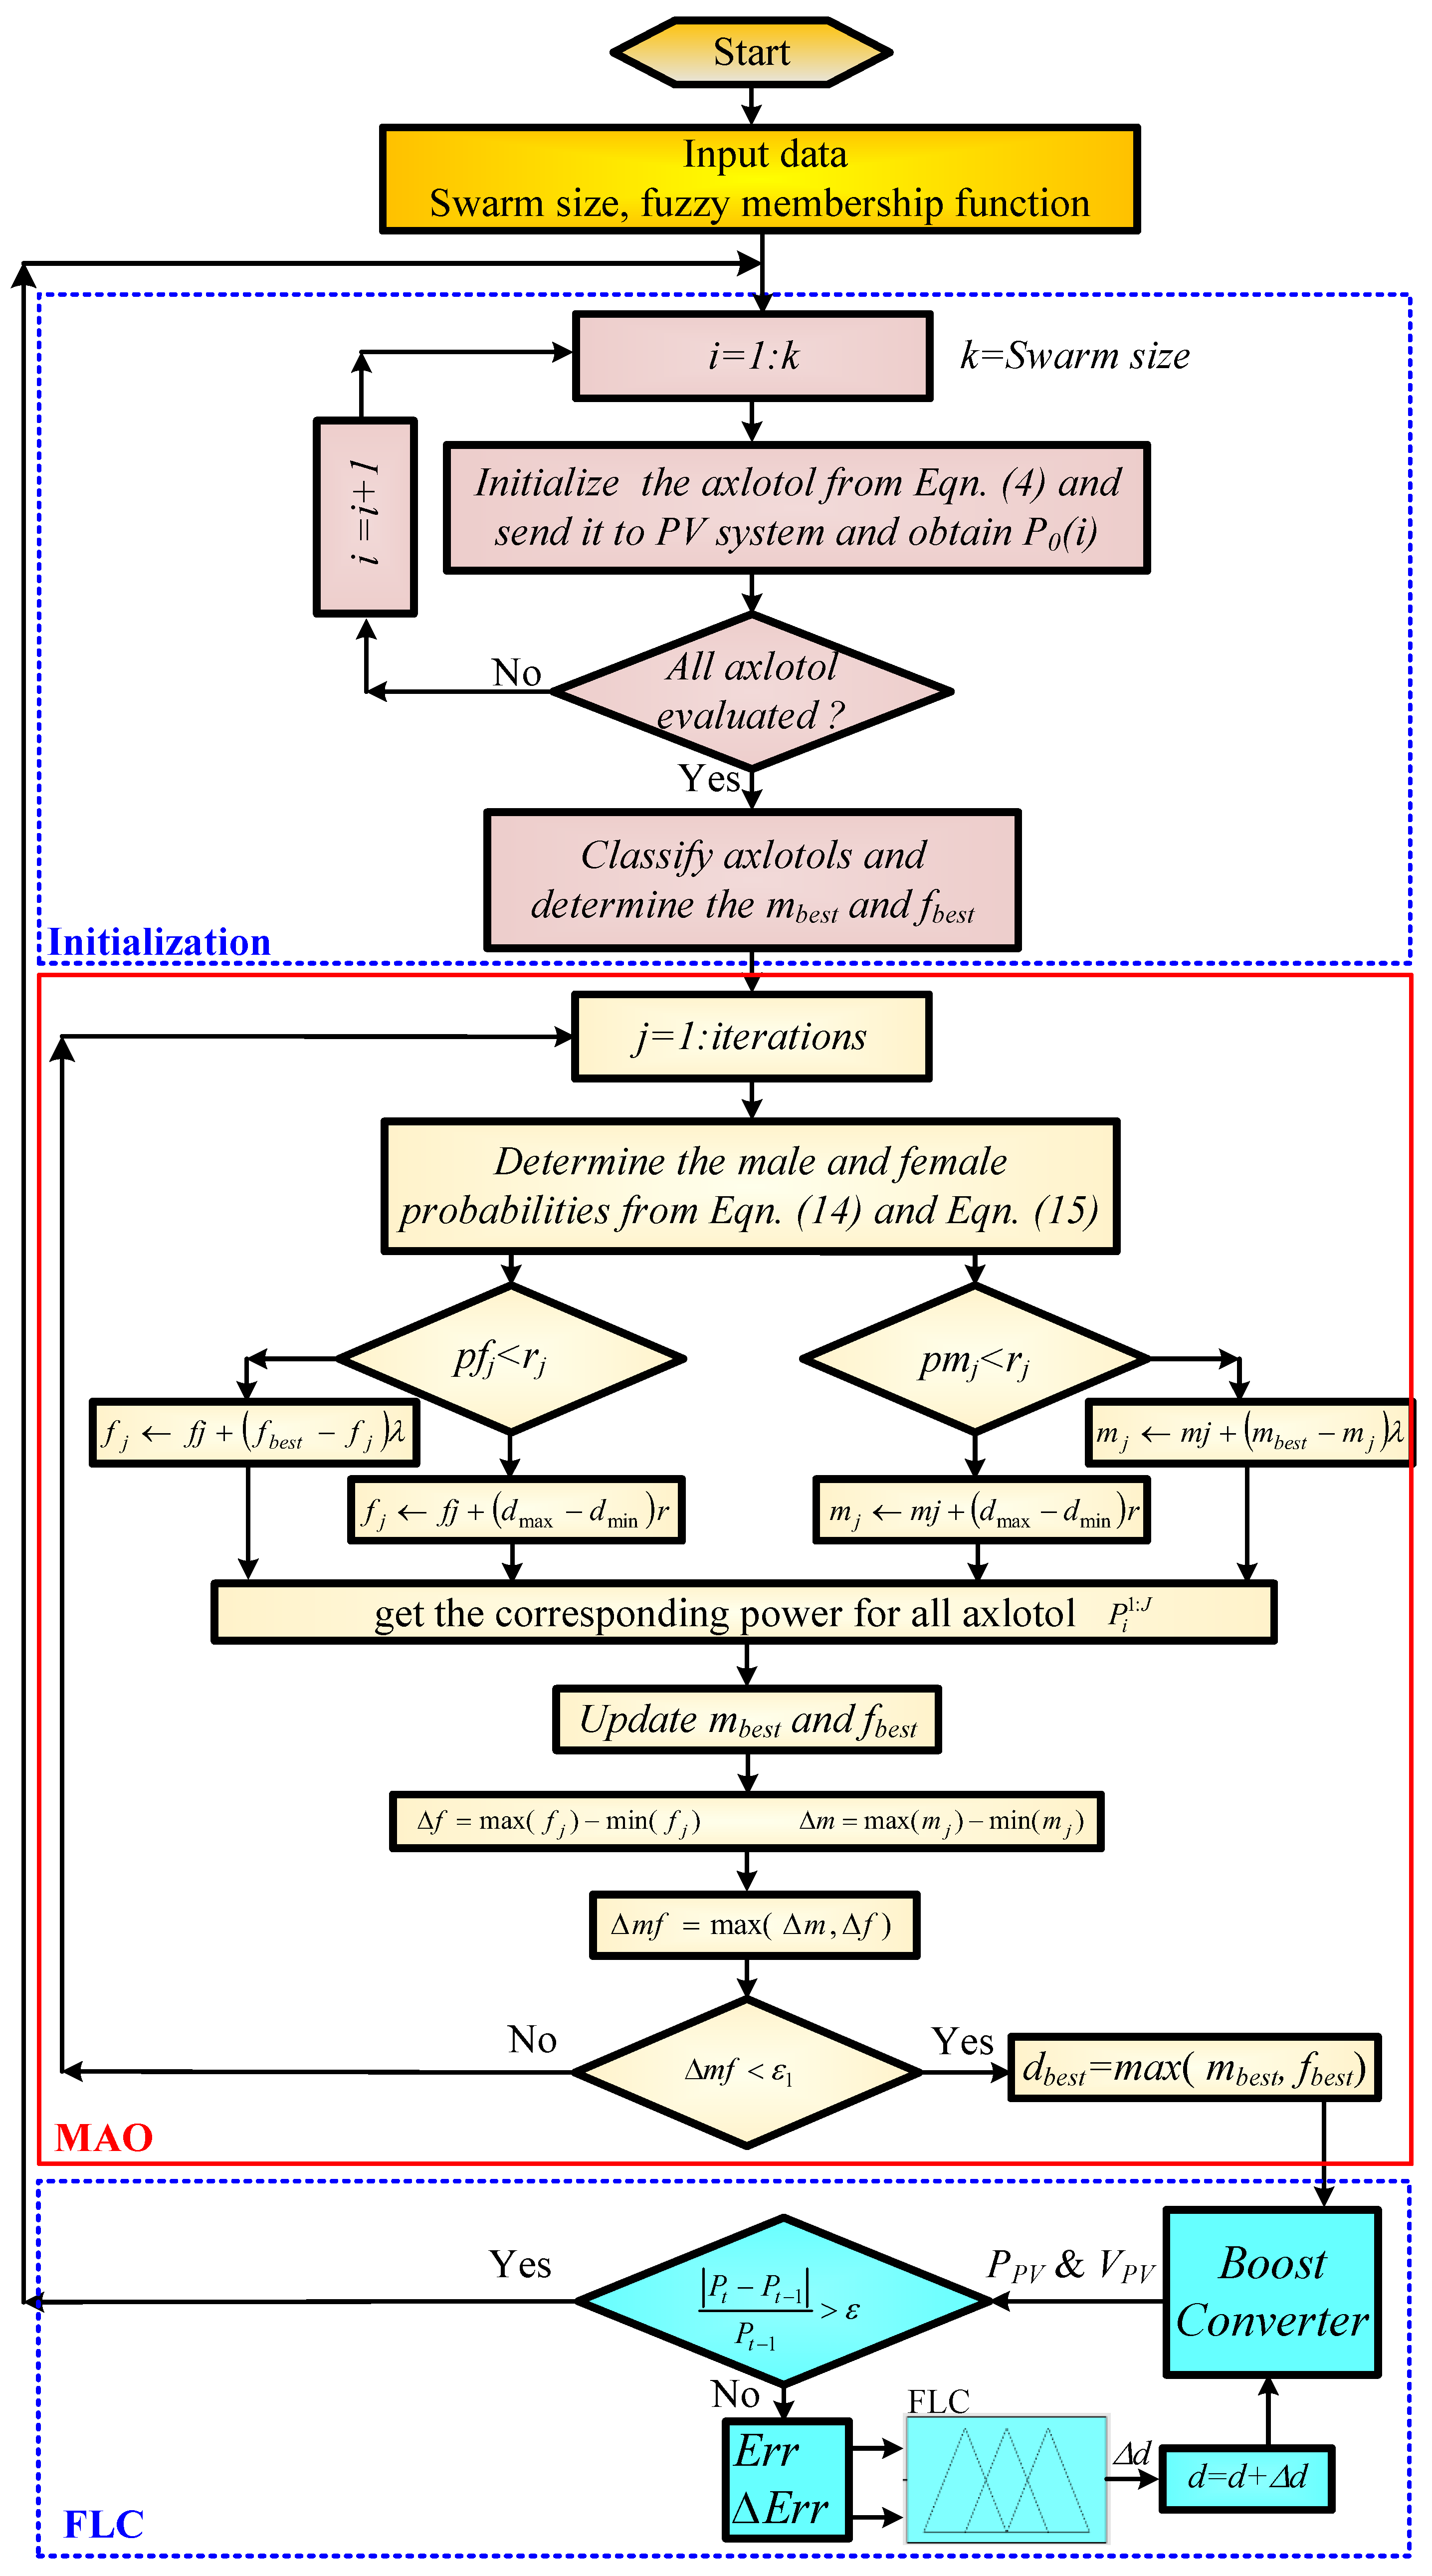
3. The Mexican Axolotl Optimization Algorithm

This algorithm is one of the MOAs that mimics the behavior of the life of the Mexican axolotl in their birth, breeding, and tissue restoration [45,46]. Males and females make up the population of axolotls, as they are sexed organisms. Additionally, take into account that axolotls may change the color of some areas of their bodies in order to blend in with their surroundings and elude predators. The changes associated with becoming an adult, reproduction, injury and restoration, and assortment (TIRA), and these four iterative steps show how the MAO algorithm works. The suggested system in this study is more efficient as the loss is reduced by the highest power generated technique.
Below is a detailed explanation of the MAO algorithm’s step-by-step procedure as it applies to PV system MPPT [45,63].
  • Initialize the female and male search agents by providing each duty ratio between the minimum and maximum boost converter duty ratio. In normal operation of the MAO, the position of these search agents is selected randomly but as discussed before the random initialization causes longer CT in PV MPPT, and for this reason, the initialization of search agents will be according the anticipated peaks positions obtained from Equation (13).
    d ( k ) = d min + k 1 k ( d max d min )
    where k is the axolotl order, and dmin, and dmax are the range of the boost converter duty ratio.
2.
Ascertain the produced power, or fitness value, for every search agent position (boost converter duty ratio).
3.
Classify the male and female populations [45] based on random selection.
4.
Based on the fitness values, select the top male and female candidates.
TIRA state in which the axolotl male changes its body color in water, which can be determined by the inverse probability of each sex as shown in Equations (14) and (15). For axolotl male, if the pmj < rj (where rj is a random number rj ∈ [0, 1]), then change the position of the axolotl based on body restoration as shown in Equation (16); otherwise, change the male position based on the color as shown in Equation (17). Similarly, for females, if the pfj < rj, then change the position of the axolotl based on body restoration of the axolotl as shown in Equation (18); otherwise, change the male position based on the color change as shown in Equation (19).
p m j = O M j Σ O M
p f j = O F j Σ O F
m j m j + ( m b e s t m j ) λ j
m j m j + ( d max d min ) r j
f j f j + ( f b e s t f j ) λ j
f j f j + ( d max d min ) r j
5.
Use the new position to obtain the new PV power from the PV model and update the mbest and fbest.
6.
If max(mj) − min(mj) and max(fj) − min(fj) is less than ε1, where ε1 is a predefined tolerance (ε1 = 0.01), then transfer the control to the FLC as will be described in the following section; otherwise, go to step 4.

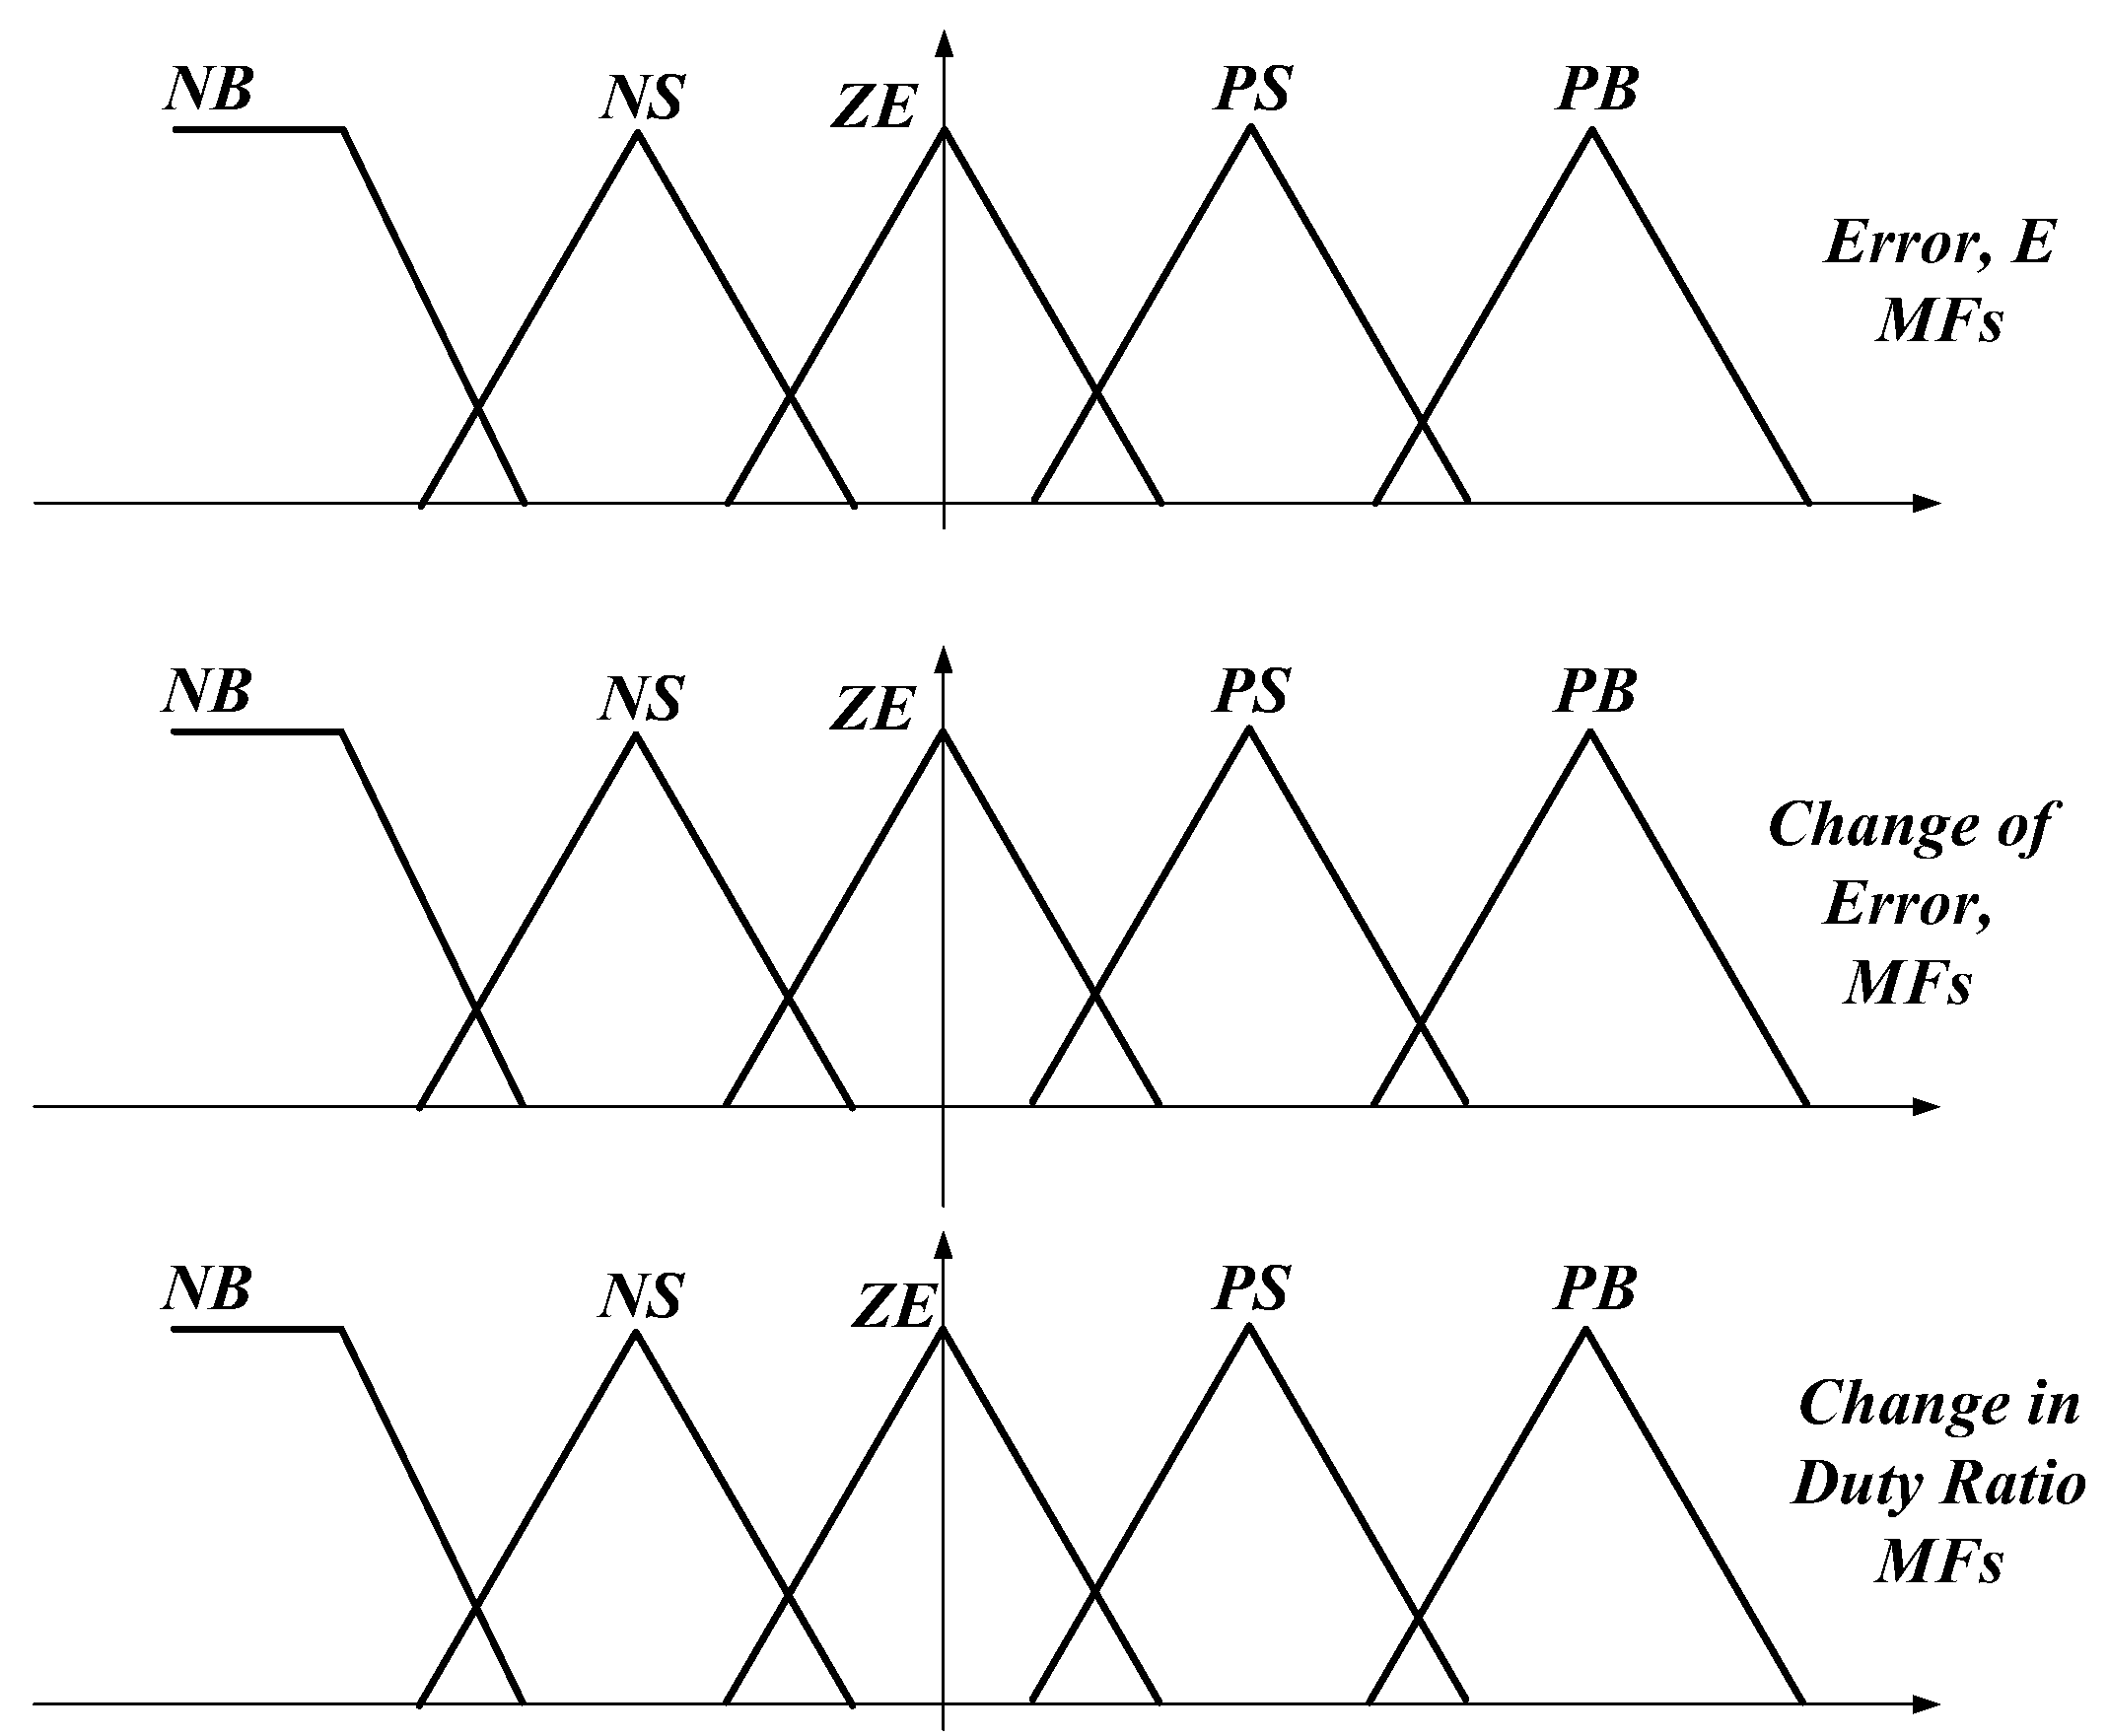
4. The Fuzzy Logic Controller

The FLC was studied in early 1920 [64]; since then, it has not been discussed in the literature until 1965 by L. A. Zadeh [65]. FLC shows robust performance in many applications compared to other controllers such as proportional integrator and for this reason, it has been used with several applications. FLC has been used alone for PV MPPT in many literature without discussing its performance with the PSC in [4,6,32]. One of these studies compared the FLC with the PSO in the presence of the PSC and it showed that the FLC has better tuning for the global peak. Meanwhile, it is simple to become stuck in one of the LPs [32]. Because of this, the MAO is used in this study to distinguish the vicinity of the GP and sequentially let the FLC fine-tune the GP accurately and effectively. Once the axolotl positions are very near to each other the MPPT control should be transferred to the FLC to fine-tune the GP and to reduce the voltage and current ripples. The starting duty ratio of the FLC will be the best position obtained from the MAO.
As demonstrated by Equations (20) and (21), the FLC employed the error signal of power between the two successive iterations and the change in error signal as two inputs. The output variable from the FLC is the change in the boost converter duty ratio. Figure 4 displays the membership functions for the input and output variables. In the membership functions, each variable of the FLC includes five variables, namely NB, NS, Z, PS, and PB, which stands for the negative big, negative small, zero, positive small, and positive big, respectively. The simplest technique to implement FLC membership functions on a hardware digital control system is to utilize them as triangle-shaped functions for both input and output variables. The relation connecting the input and output variables is shown in Table 1. These relations shown in this table have been generated based on the designer’s experience with the performance of the PV MPPT. The relationship between the input and output variables is depicted by the surface function in Figure 5.
E i = P i P i 1 V i V i 1
Δ E i = E i E i 1
In order to calculate the new duty ratio, the duty ratio increase will be applied to the existing duty ratio once it has been calculated from the FLC. The FLC will continue tracking the GP until a significant change in power occurs according Equation (22). Once this condition is validated the proposed MPPT will reinitialize the MAO again and follow the steps shown above.
| P i P i 1 P i 1 | > ε
The Matlab/Simulink platform’s Fuzzy Inference System (FIS) is used to implement the FLC. The Matlab code calls the FLC after the MAO captures the vicinity of the GP based on the condition shown in step-6 in Section 3 and continues using it until there is a significant change in output PV power, which gives the controller an indication for change in shading pattern; and in this case, the control will transfer again to the MAO with the new initialization based on Equation (13).
The 3-D graph represents the relation between the input/output variables, called the surface function as shown in Figure 5. This relation summarizes the rules shown in Table 1. It is clear from this surface function how clear the smooth relation between the input and output variables of the FLC.

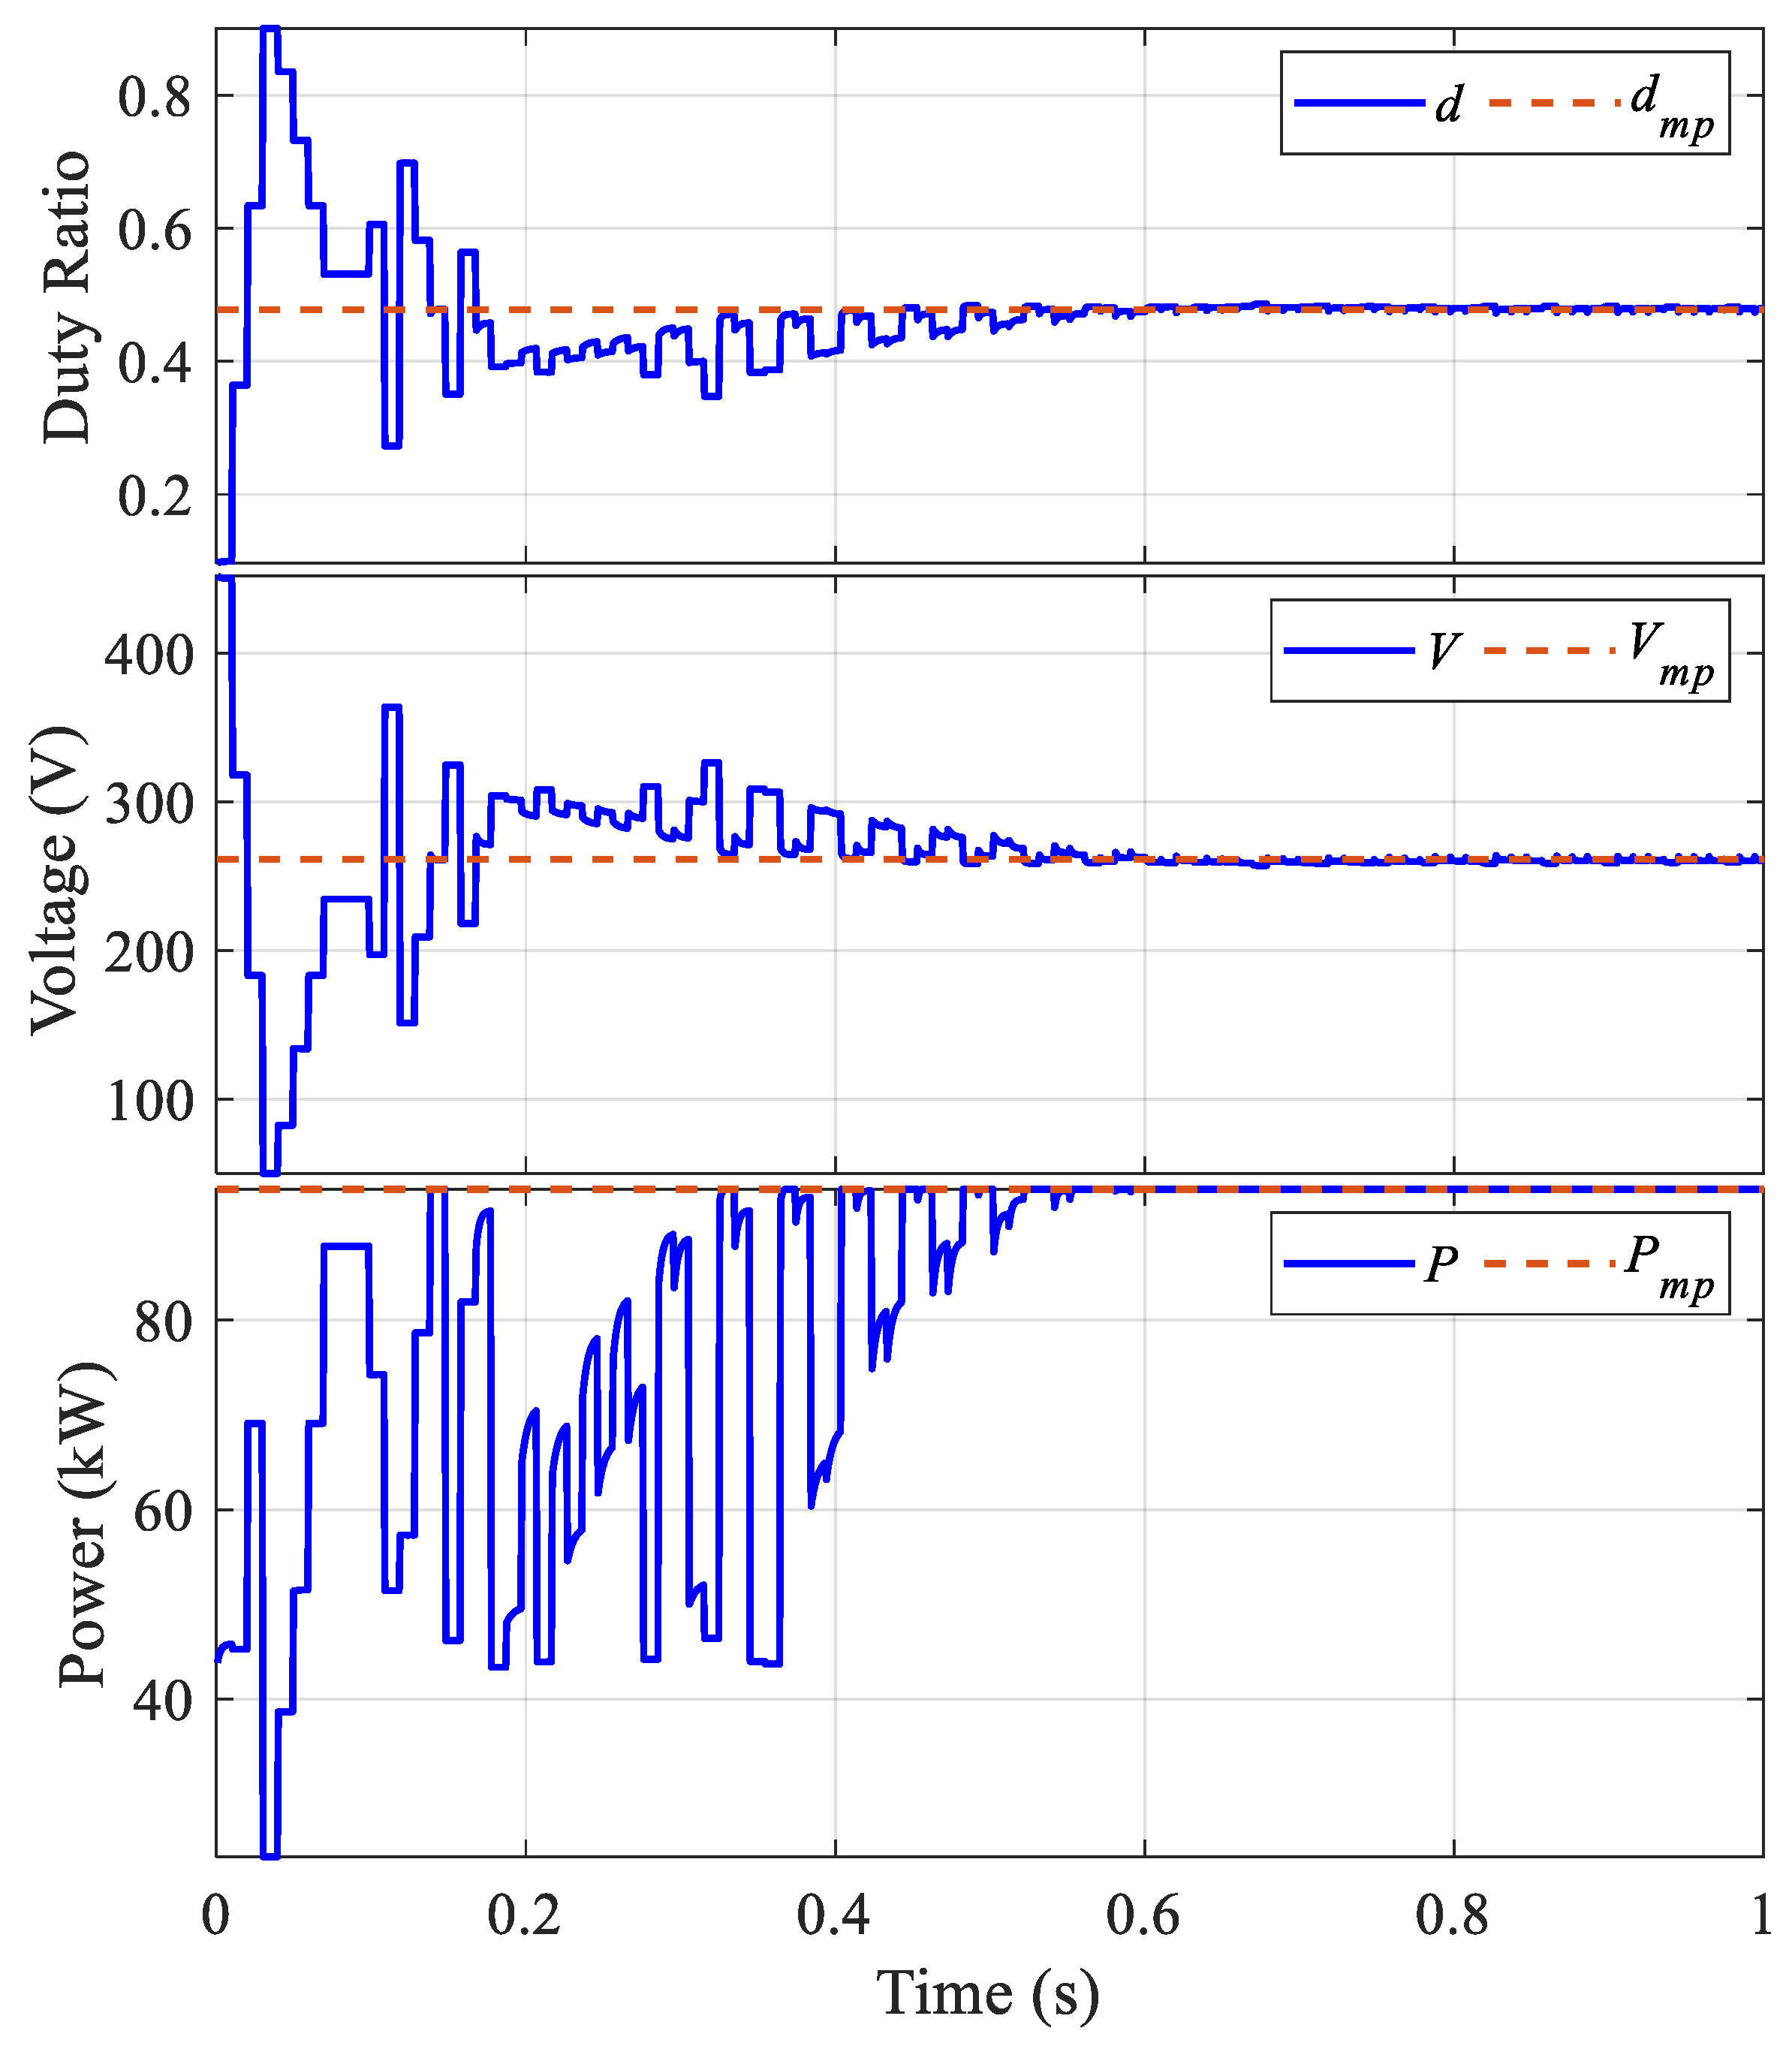
5. Simulation Results

The flowchart showing the simulation program used sequentially for PV MPPT using hybrid MAO and the FLC is shown in Figure 6. The simulation of the proposed PV MPPT algorithm and the other algorithms used for comparison are implemented in MatLab/Simulink ToolBox R2023a. To study the impact of the swarm size (the number of search agents (axolotls)), the simulation is performed for four and six axolotls. The next sections provide a thorough explanation of simulation research.

5.1. Input Data

Table 2 lists the PV module’s performance parameters. Table 3 displays the details of the boost converter that was utilized in the simulation and investigation. The shading pattern used in this study is the recommended benchmark shading pattern introduced in [30]. This shading pattern is chosen to show all the trick points that may occur to the MPPT. The limit for the error variable used as an input to the FLC is −50 to 50, and the change in error is −10 to 10. The limit for the change in duty ratio as shown as an output of the FLC is −0.01 to 0.01.

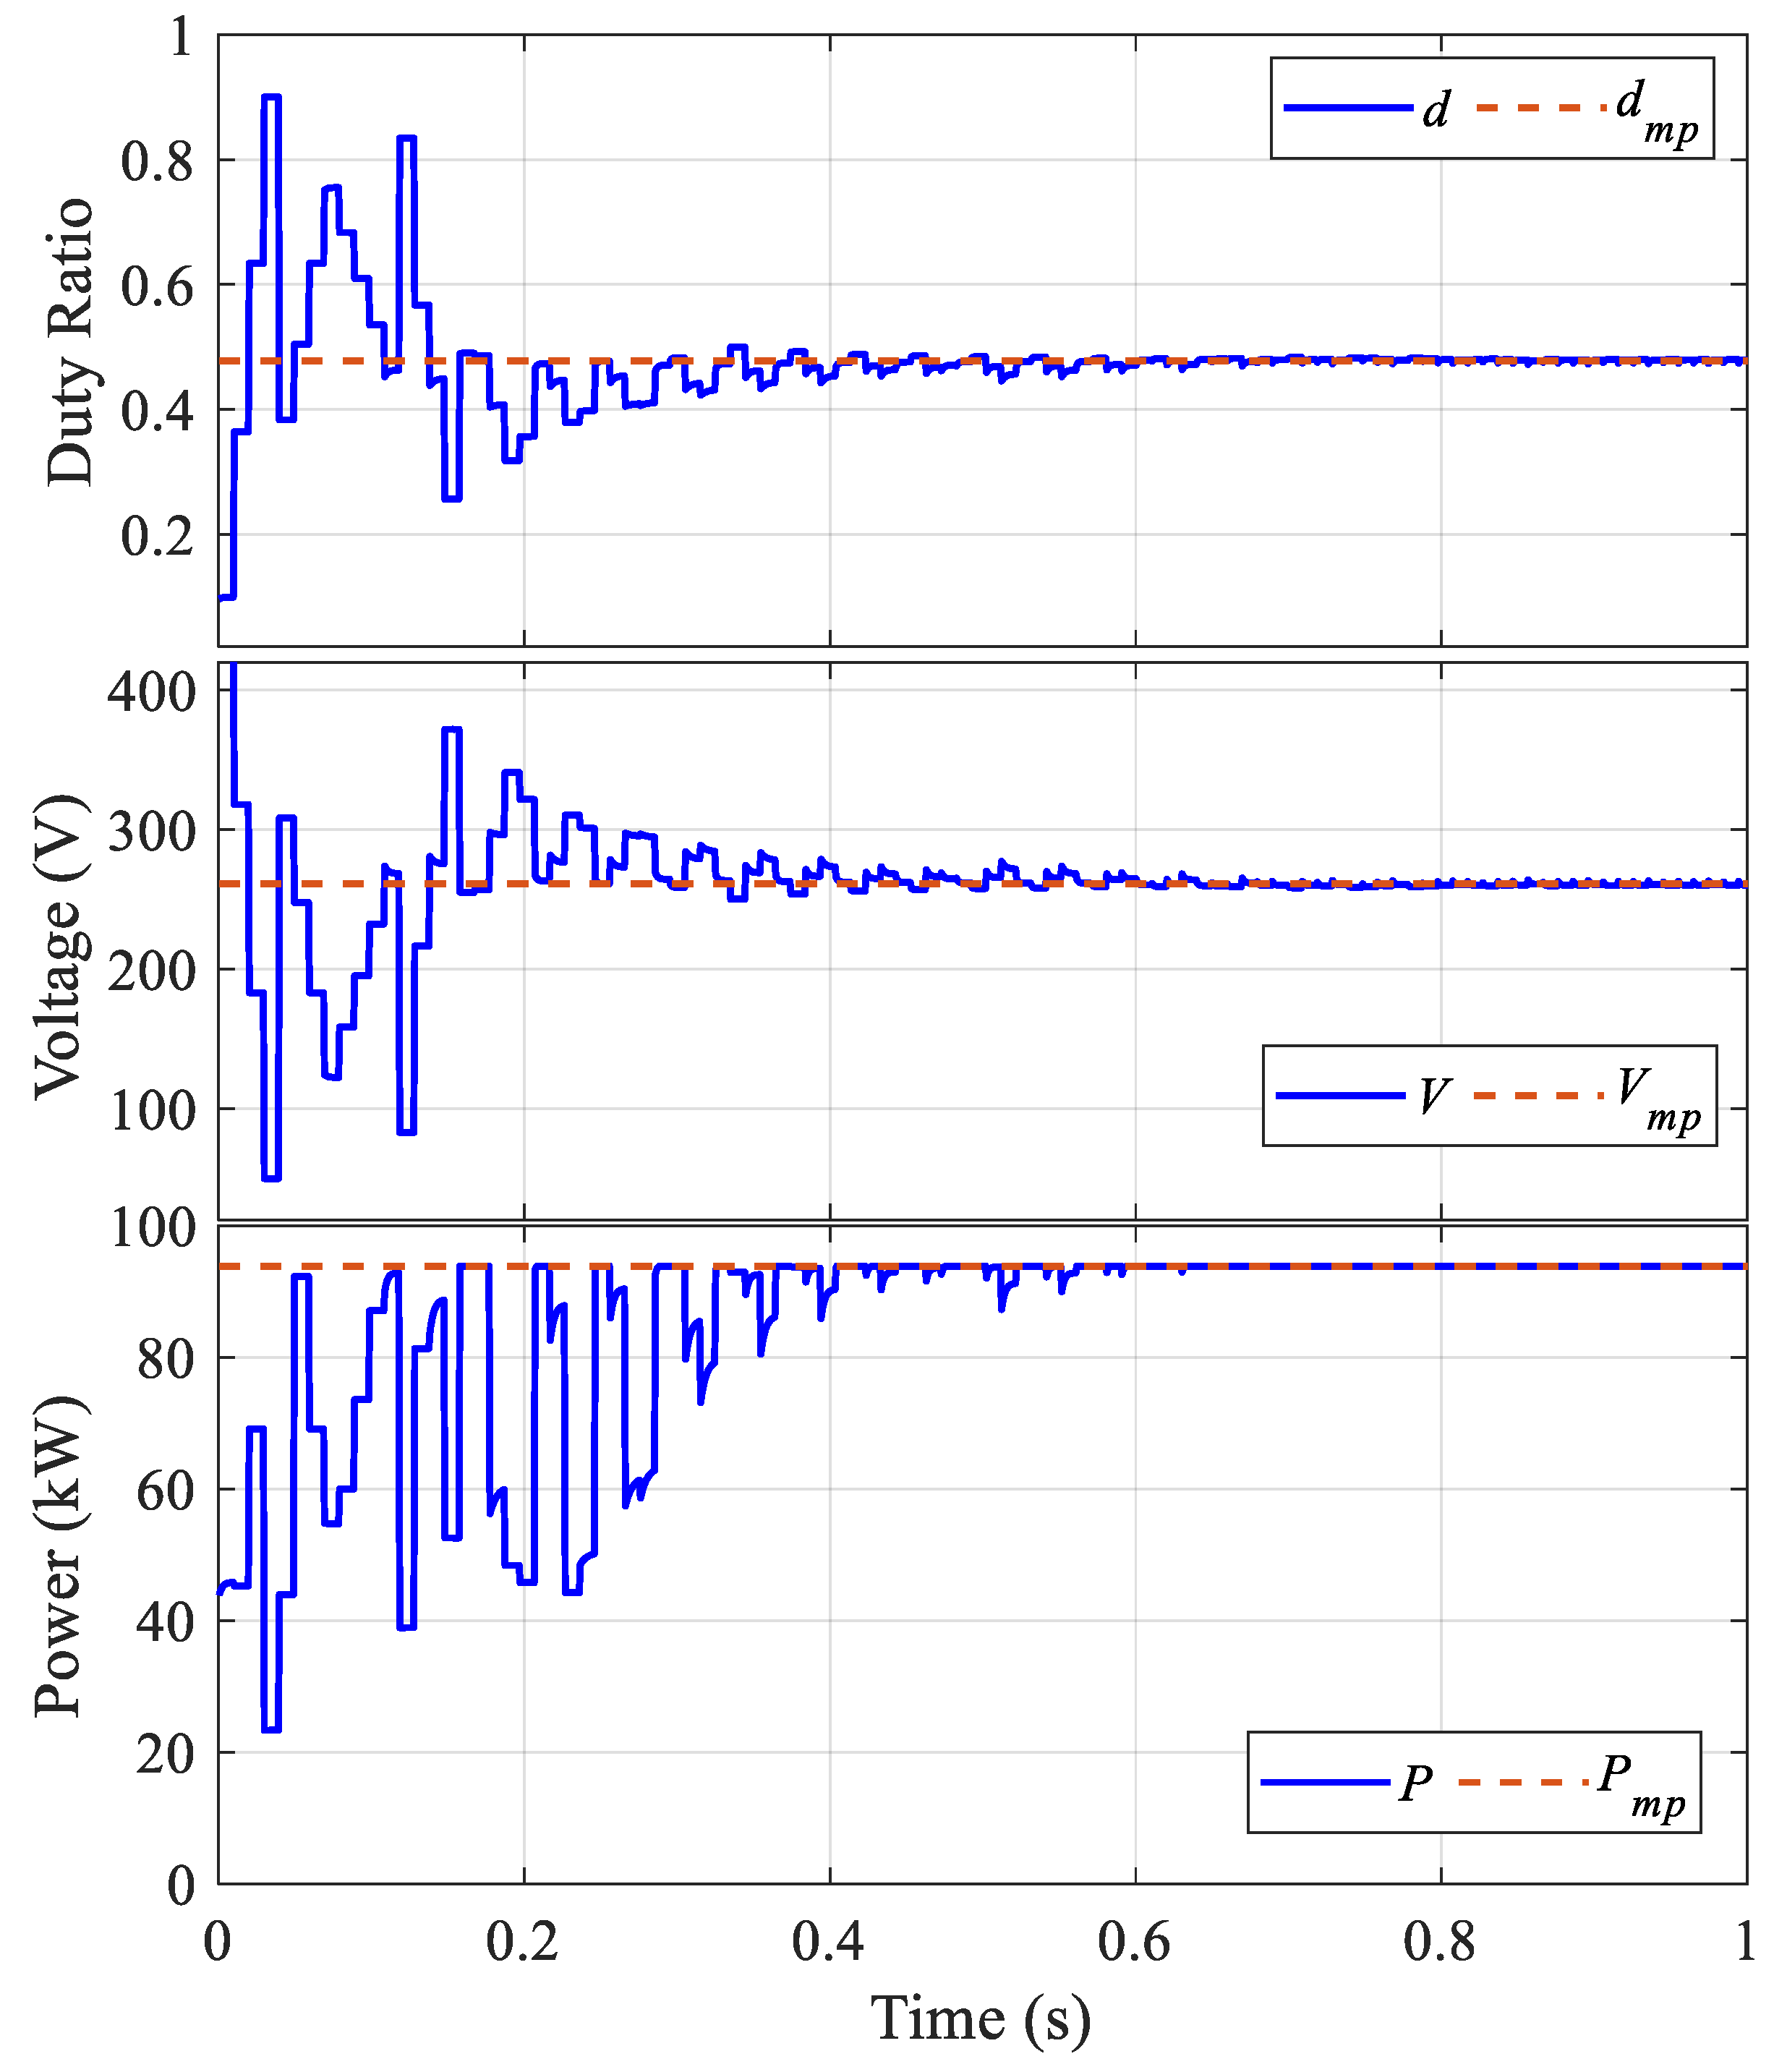
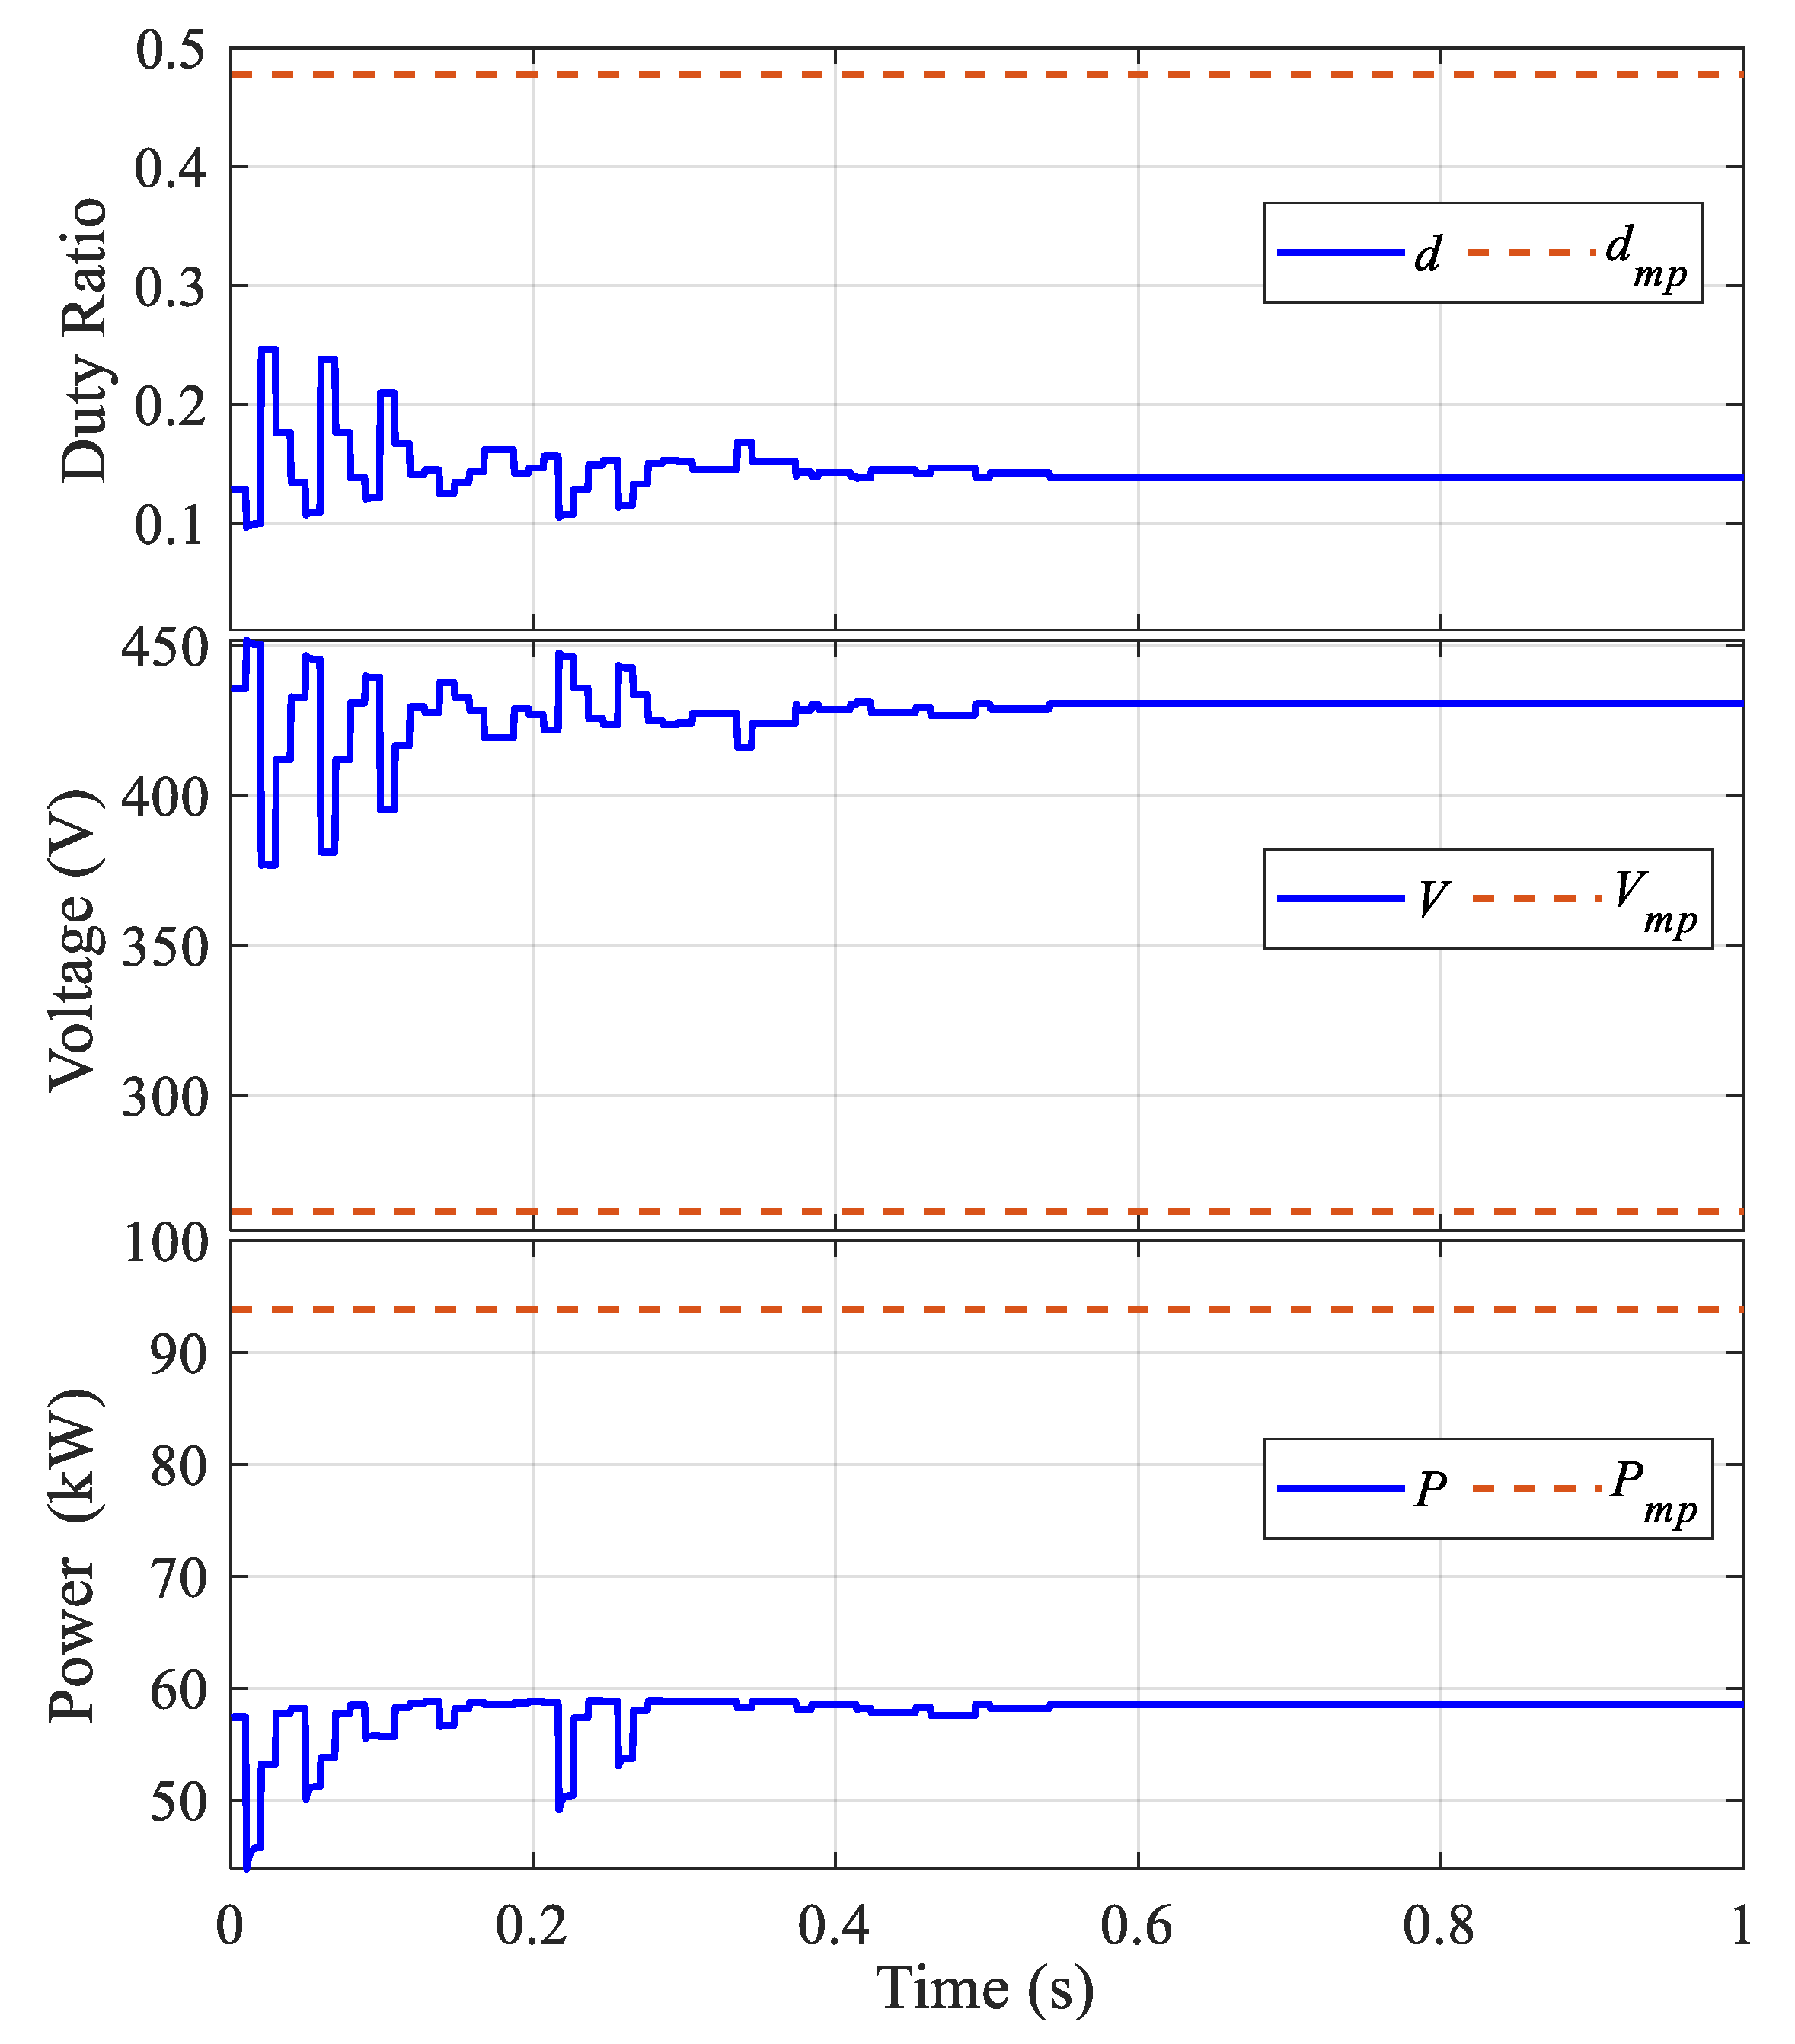
5.2. The Comparison between MAO and Other Optimization Algorithms

The first study is introduced to show the CT and steady-state ripples associated with the MAO alone, FLC alone, Hybrid MOA-FLC, and PSO. Four search agents are selected as a swarm size for the MAO. The selection of the male and female axolotl is performed randomly. The initialization of the MAO is selected to put the search agents initial position in equal distances between 0.1 and 0.9 based on Equation (13). The same swarm size and initial position of other algorithms are selected same as used with the MAO for fair comparison. The study’s findings are displayed in Figure 7, Figure 8, Figure 9 and Figure 10. Figure 7 shows how fast the MAO captured the GP within 0.38 s which shows the fastest algorithm in capturing the GP of the MPPT. Although the fast convergence of the MAO shows high ripples around the GP for this reason it was recommended to be hybridized with fine-tracking algorithms such as the FLC to smoothly track the PV GP.
Based on Figure 8’s convergence performance, it can be inferred that the FLC will likely converge at one of the LPs as it will do so at the peak closest to the initial values. In this figure that FLC converges at the peak position when started at d = 0.8, it will converge at the nearest LP at V = 123.02 V, d = 0.75396, and P = 54.21 kW, which is less than the GP (V = 260.37, d = 0.47926, and P = 93.89 kW), which proves the limitations of the FLC when used alone as a PV MPPT. Furthermore, the CT of the FLC is very long compared to the MAO, and PSO where it converges after 0.53 s, which is counted as approximately 2-fold the convergence of the MAO and twice the convergence of the PSO.
Figure 9 shows the convergence performance of the PSO with 4 swarm sizes and initialization as recommended by Equation (13). It is clear from Figure 9 that the CT associated with the use of PSO is almost 0.62 s but it converges at the GP (V = 260.37, d = 0.47926, and P = 93.89 kW), which proves the superiority of the MOAs when used in PV MPPT. It is evident from Figure 9 that the primary limitation of the PSO is its lengthy CT.
The convergence performance of the hybrid MAO-FLC is shown in Figure 10. It is clear from this figure that the CT is very fast as has been shown with the MAO alone in Figure 7. Moreover, after almost 0.18 s the convergence control moved to the FLC and the complete convergence occurred at 0.29 s, which is longer than the MAO alone (Figure 7) but with almost zero ripples due to the high accuracy of the FLC in fine tracking the GP. Moreover, the CT is significantly shorter than the CT of the FLC alone and the PSO alone which demonstrates the MAO-FLC’s exceptional ability in measuring the GP of PV systems under PSC quickly and accurately. The results of PV power (kW), CT, and ripple contents in the voltage waveform are summarized in Table 4.

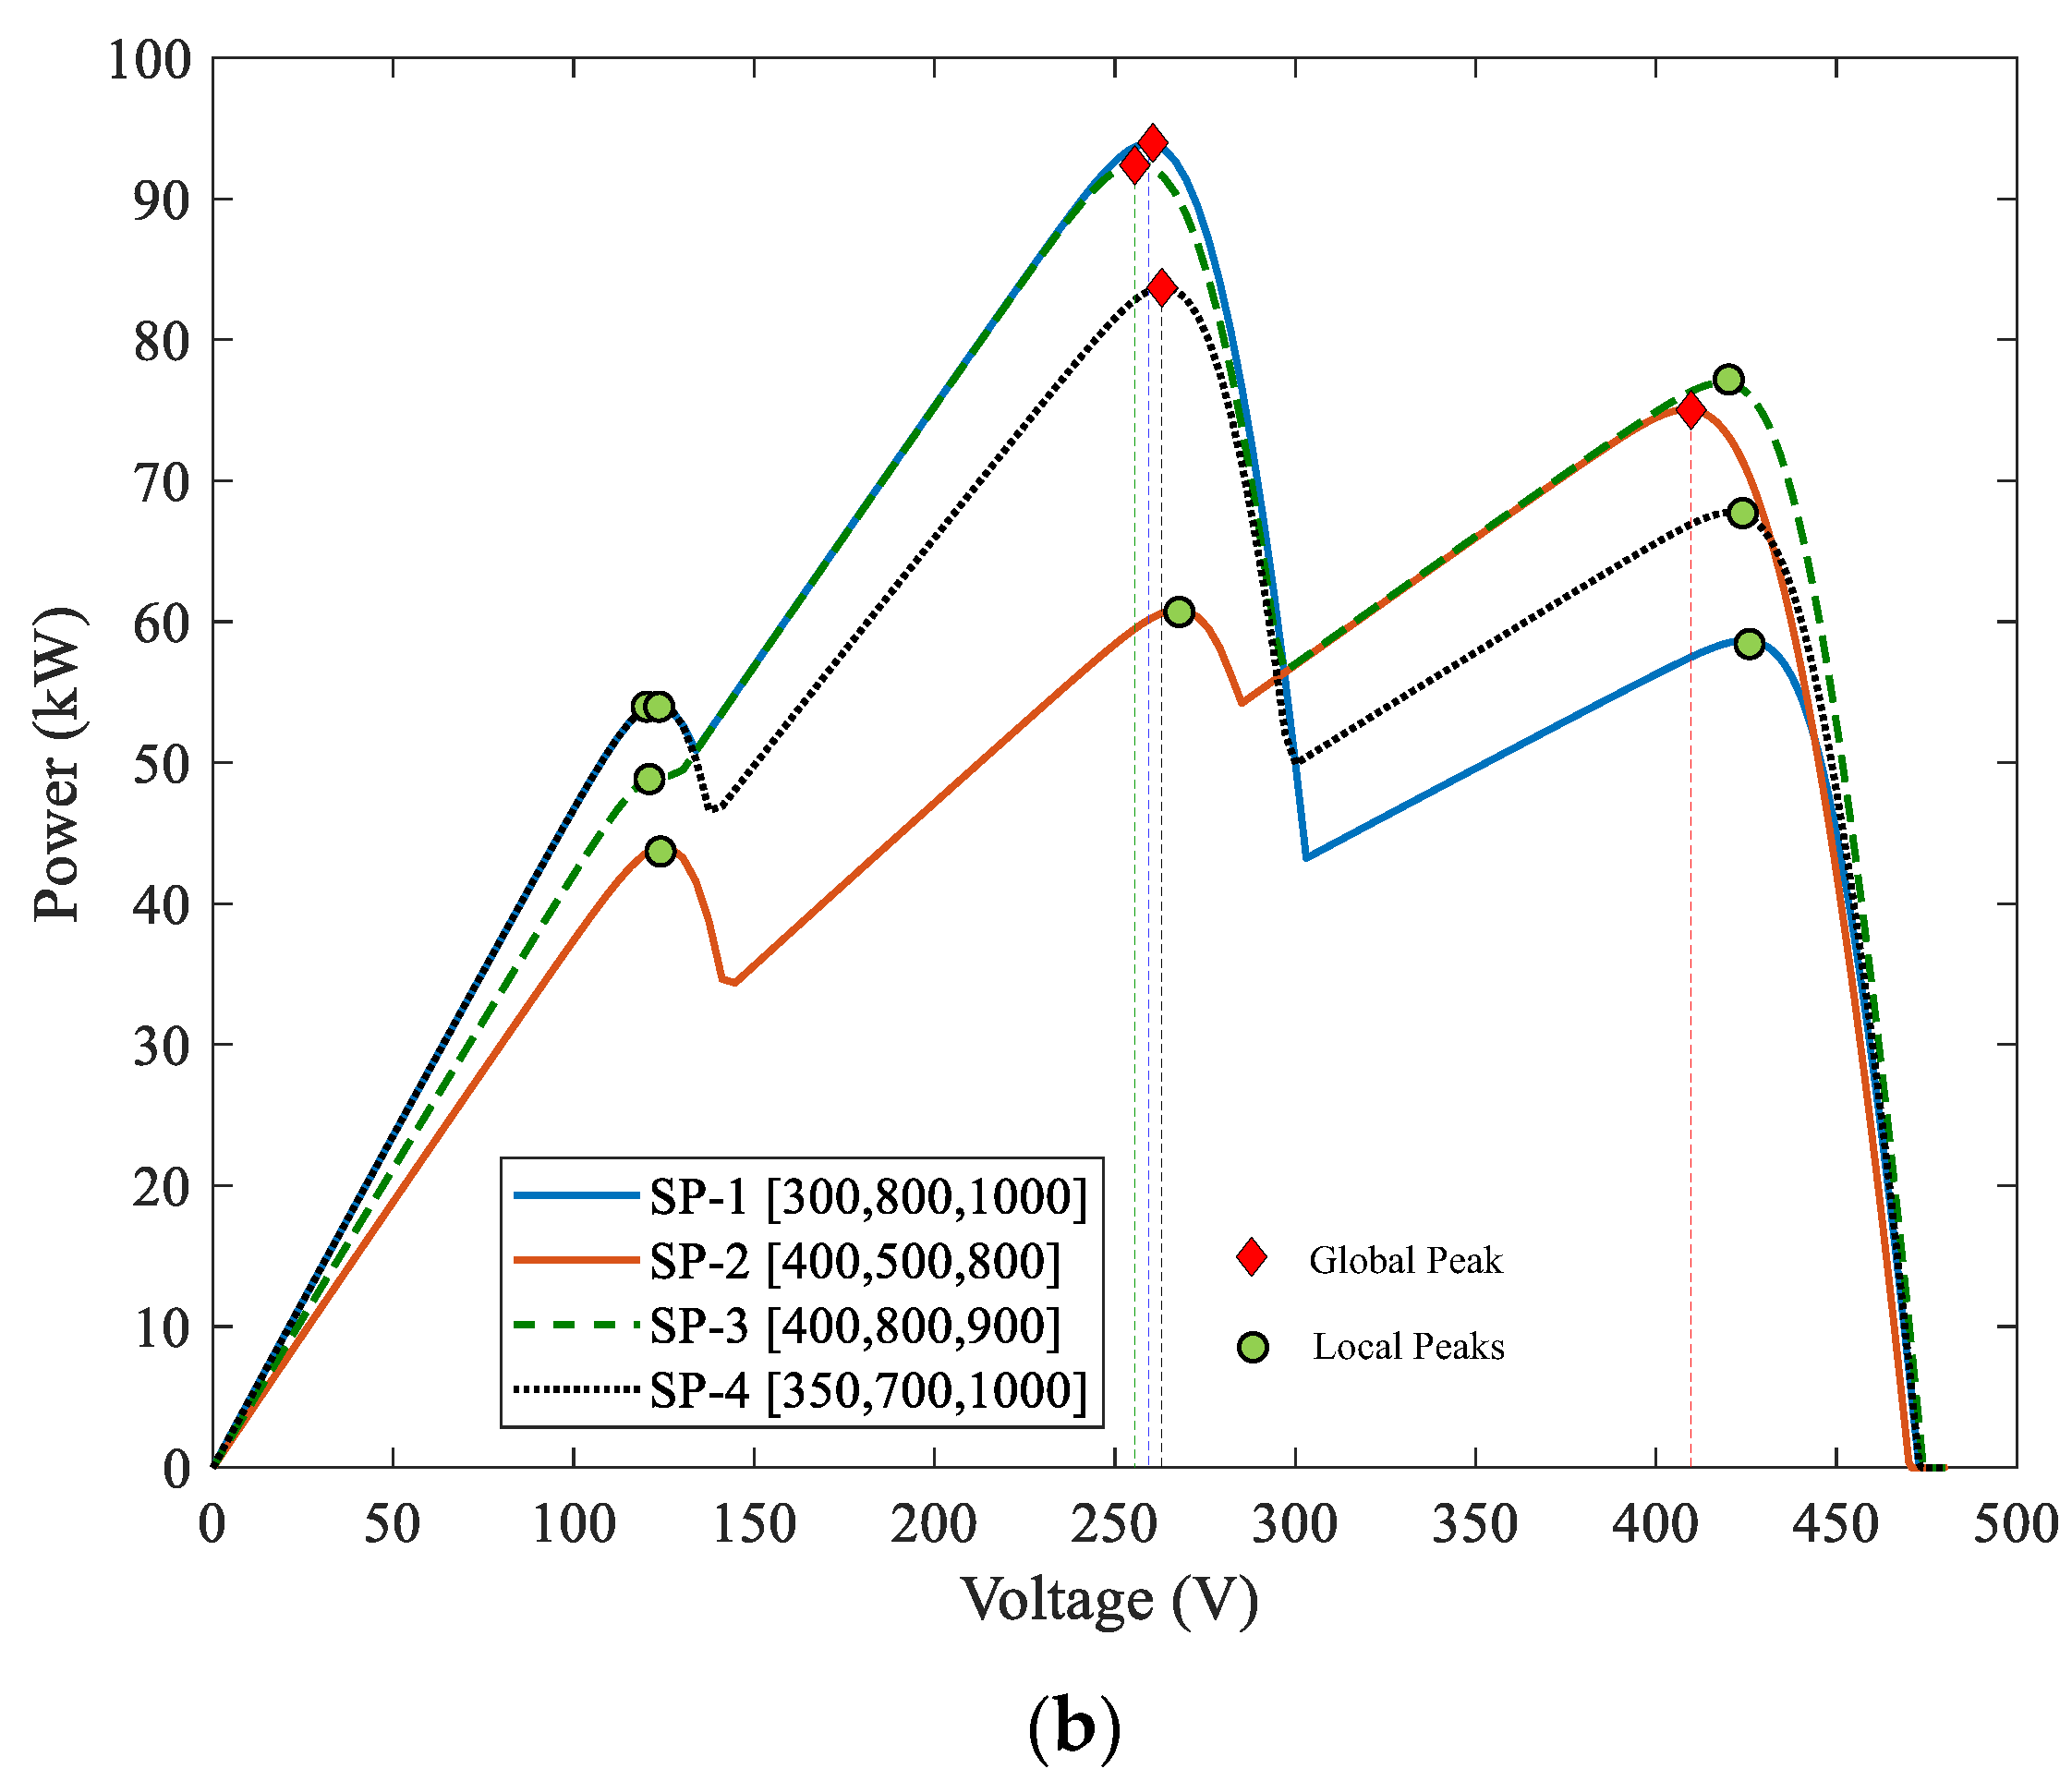
5.3. The Effect of Swarm-Size and Shading Pattern Change

The effect of the number of axolotls on the CT and other performances is shown in Figure 7 and Figure 11 for 4 and 6 axolotls, respectively. The CT for 4 and 6 axolotls are 0.29 s and 0.43 s, respectively and for this reason, 4 axolotls will be used in all simulation studies shown below.
The second study is performed to show the performance of the MAO-FLC when the shading pattern changes smoothly and suddenly based on the benchmark shading pattern introduced in [30]. Figure 12 displays the findings of this investigation. The upper trace shows the shading pattern and the lower traces show the duty ratio, the PV terminal voltage, and the generated power. The first shade pattern in this picture illustrates how the MAO began with the search agents’ beginning locations, which were based on the values derived from Equation (13). The shading pattern lasted from 0 to 2 s. The MAO keeps searching the GP until all search agents become in the vicinity of the GP which takes almost 0.18 s. After the search agents become very near to the GP, the function of the MAO is ended at this point and the control moves to the FLC for fine-tracking the GP with the lowest ripple, which is the main privilege of the FLC. After t = 2 s, the new shading pattern is used, the generated power changes from 93.89 kW to 60.8 kW which reinitializes the MAO based on the conditions introduced in Equation (22). The MAO again reinitializes based on Equation (13) and starts searching for the GP vicinity and once all the axolotl becomes very near to each other the control transfers again to the FLC at t = 2.18 s.
The results obtained from the MAO-FLC show superior results where it shows very fast convergence almost 0.29 s, which is almost half the PSO and the FLC when used alone to track the MPP. Moreover, the proposed methodology effectively tracks the GP with gradual or sudden changes in the shading patterns. Furthermore, it shows very low ripples thanks to the FLC that continues to track the GP at very low ripples. The same performance occurs in different PSC shown in Figure 12. Table 5 displays the findings that demonstrate how the size of the swarm affects the MAO-FLC MPPT’s performance.

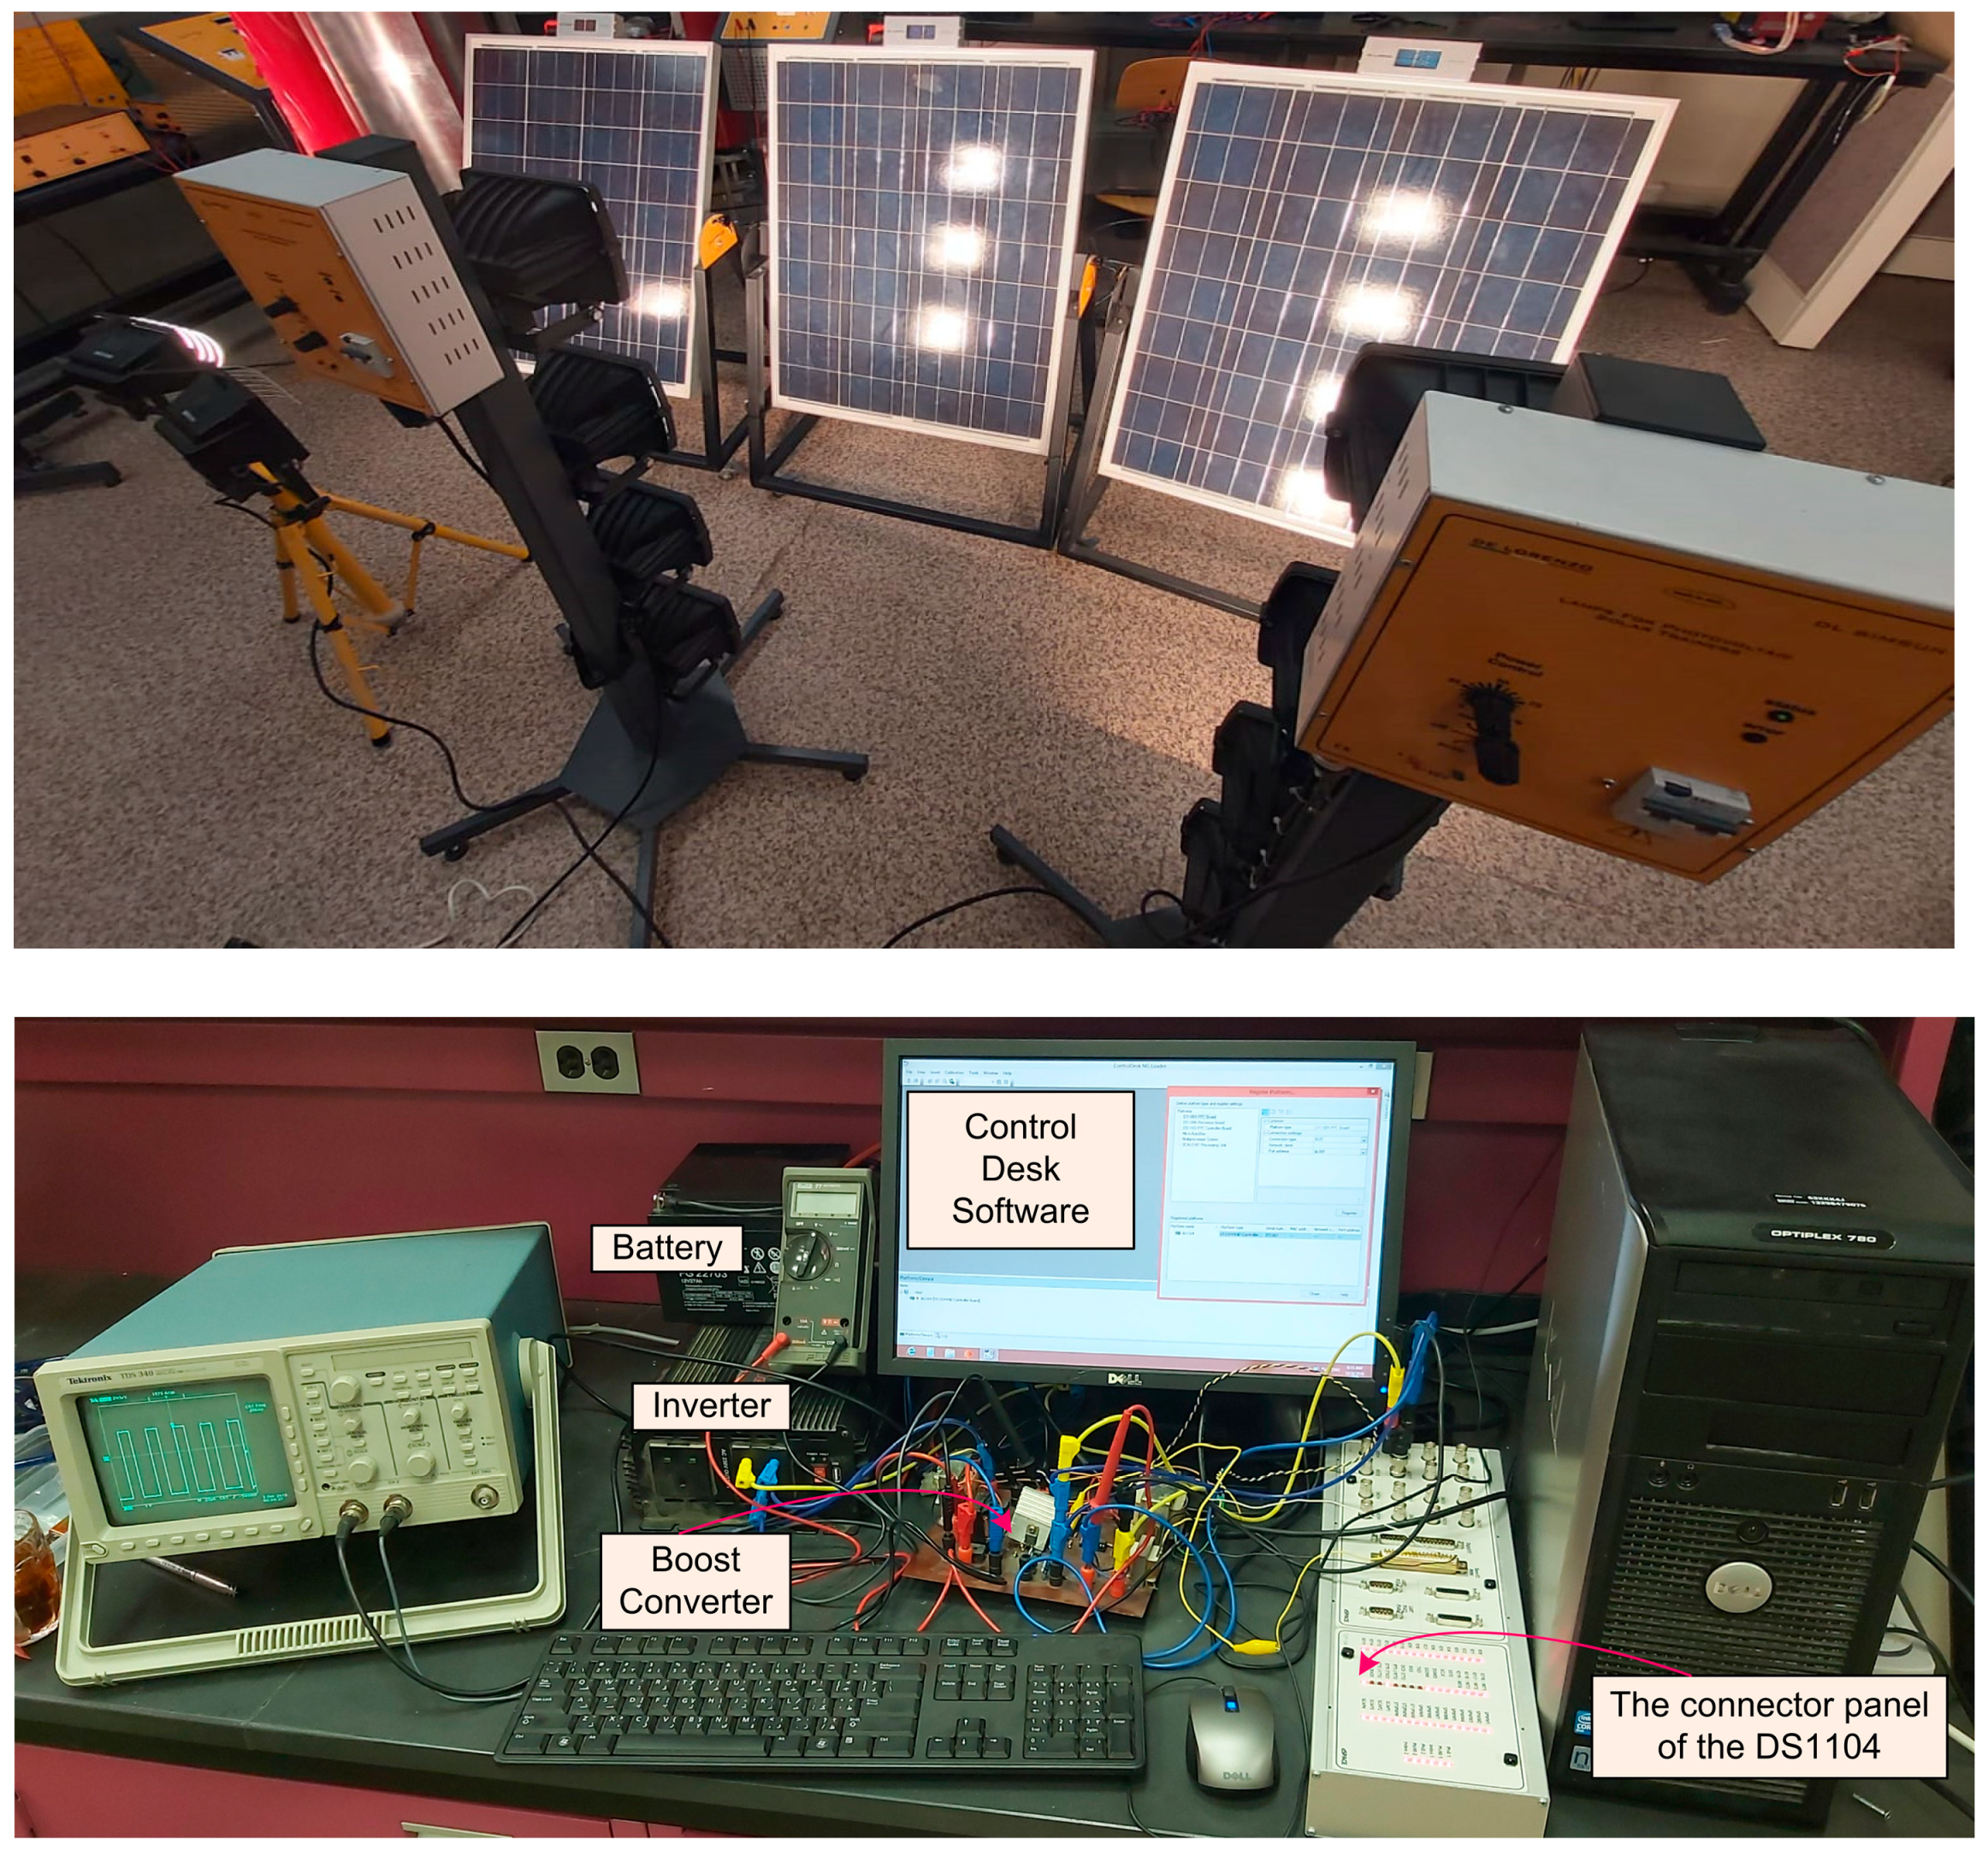
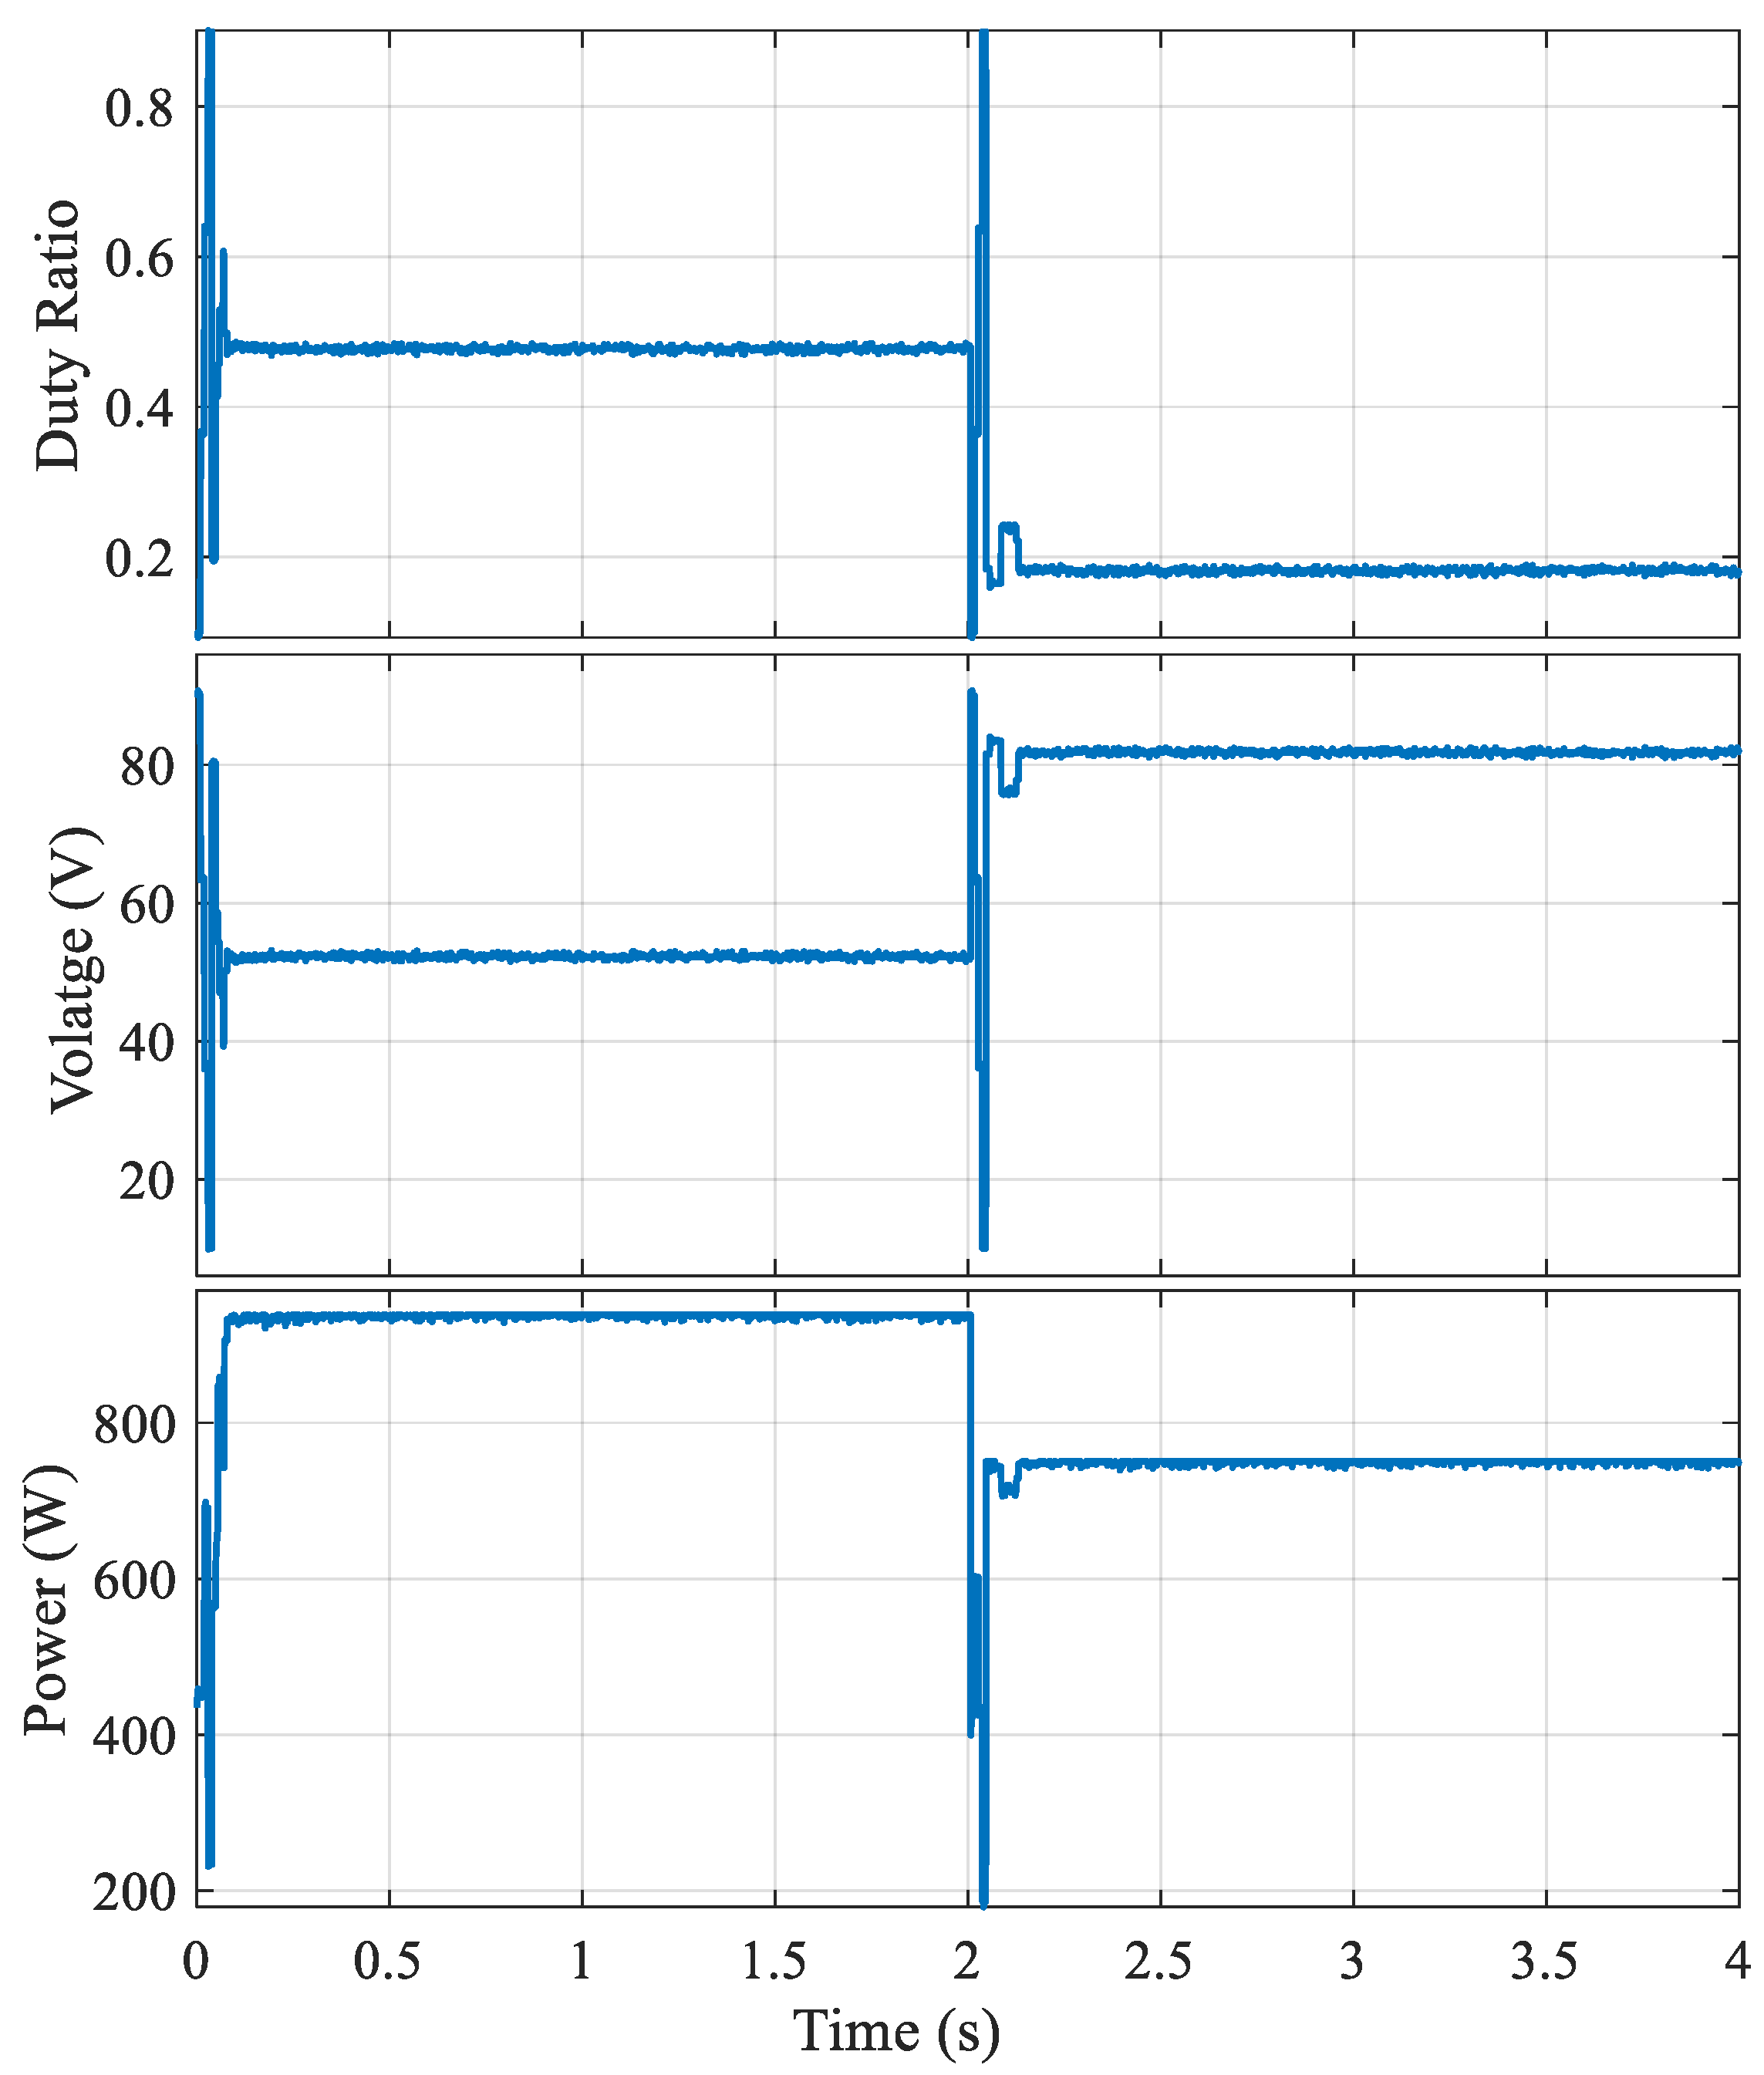
6. Experimental Results

The proposed MAO-FLC MPPT system is implemented in the lab using the Dspace digital interface circuit ((DS1104)) to interface the hardware circuit with the model introduced in the Matlab/Simulink platform. The hardware circuit and the Matlab/Simulink output signals are interfaced by the DSpace using the real-time interface (RTI) module. Table 3 displays the details of the boost converter. Figure 13’s controlled artificial sunlight has been employed to produce the simulation’s shading pattern. Figure 13 illustrates the hardware utilized in the PV system implementation using the MAO-FLC as an MPPT. The SP1 shading pattern is used for 2 s and the SP2 shading pattern is used for another 2 s as shown in Figure 14 and Figure 15. Figure 14 illustrates the usage of the MAO alone for GP tracking. The figure reveals the MAO’s swiftness in capturing the GP’s vicinity, achieving 0.22 s. However, this speed comes at the cost of significant voltage and power waveform ripples, which reduce the PV system’s efficiency. Despite this drawback, the MAO’s rapid GP identification makes it suitable for this study, where it promptly locates the GP and transfers control for refined MPPT techniques like FLC. As has been revealed from Figure 14, the MAO continues with the GP until the power changes with the new shading pattern (SP2) due to the condition introduced in Equation (22). Once this condition is validated, the MAO will reinitialize again based on Equation (13) and the MAO starts tracking the GP again.
The experimental results illustrated in Figure 15 show how the MAO-FLC captured the GP in less than 0.22 s then the control transfers after that to the FLC based on the condition shown in step-6 in Section 3. The FLC continues tracking the GP until the power changes with the new shading pattern (SP2) due to the condition introduced in Equation (22). Once this condition is validated, the MAO will reinitialize again based on Equation (13) and the MAO starts tracking the GP and once the condition shown in step-7 in Section 3 is validated again it will transfer the control again to the FLC.
It is clear from the experimental results of the MAO-FLC that the CT is very short (0.29 s), The MAO-FLC captured the GP and avoided premature convergence. Moreover, the voltage, current, and power waveforms have the lowest ripple compared to the use of MAO or PSO alone thanks to the FLC. The results shown in Figure 15 show very fast and accurate convergence performance which proves the superiority of the MAO-FLC in tracking the GP of shaded PV systems.

7. Conclusions

Efficient tracking of the global peak (GP) while evading local peak traps (LPs) under partial shading is crucial for MPPT algorithms in PV systems. Additionally, a short convergence time (CT) and minimal steady-state ripples are necessary for system stability and optimal conversion efficiency. Traditional MPPT methods like hill climbing fall short due to their slowness and susceptibility to becoming stuck in LPs. Consequently, this study explores soft computing optimization algorithms as a superior alternative. Some soft computing algorithms are very accurate in tracking the peaks with the lowest ripple contents in the waveforms but, unfortunately, they are easily converged to the nearest peak to the initial value such as the FLC. The metaheuristic optimization algorithms (MOAs) are capable of capturing the GP but with slow performance and high ripples. This study overcomes the limitations of a slow convergence time (CT) and high voltage/power waveform ripples in traditional MPPT techniques by employing a two-pronged approach—firstly, the Mexican Axolotl Optimization (MAO) algorithm, renowned for its speed, tackles the issue of sluggish CT; secondly, the MAO is sequentially hybridized with the Fine-tuned Linear Congruential Generator (FLC), effectively suppressing the unwanted ripples and fostering smooth system operation. The proposed hybrid MAO-FLC showed very fast and accurate convergence with the lowest possible ripples in the voltage and current waveforms. The proposed MAO-FLC avoided all the shortcomings of conventional, soft computing, and other MOAs where the MAO captures the vicinity of the GP very fast and then transfers the tracking flow to the FLC for accurate tracking of the GP. By this methodology, the superior performance in these two strategies (MAO and FLC) has been utilized and the shortcomings of these two optimization algorithms have been avoided. This ingenious hybrid approach leverages the strengths of both Mexican Axolotl Optimization (MAO) and the Fine-tuned Linear Congruential Generator (FLC) to achieve exceptional MPPT performance. Initially, the MAO’s rapid search capability tackles the convergence time barrier, swiftly guiding the system towards the global peak (GP) within 0.3 s. Subsequently, the FLC takes over, meticulously refining the tracking process and minimizing output waveform ripples to a remarkable level below 0.01%. These impressive results showcase the proposed strategy’s superiority, evident in its lightning-fast convergence time, negligible ripples, and highly precise GP tracking.

Author Contributions

Conceptualization, A.M.E. and M.A.A.; methodology, A.M.E. and M.A.A.; software, A.M.E. and M.A.A.; validation, A.M.E. and M.A.A.; formal analysis, A.M.E. and M.A.A.; investigation, A.M.E. and M.A.A.; resources, A.M.E. and M.A.A.; data curation, A.M.E. and M.A.A.; writing—original draft preparation, A.M.E. and M.A.A.; writing—review and editing, A.M.E. and M.A.A.; visualization, A.M.E. and M.A.A.; supervision, A.M.E. and M.A.A.; project administration, A.M.E. and M.A.A.; funding acquisition, A.M.E. and M.A.A. All authors have read and agreed to the published version of the manuscript.

Funding

The authors extend their appreciation to the Deputyship for Research and Innovation, “Ministry of Education” in Saudi Arabia for funding this research (IFKSUOR3-330-1).

Data Availability Statement

Data is contained within the article.

Conflicts of Interest

The authors declare no conflict of interest.

Abbreviations

PVPhotovoltaic
FLCFuzzy logic controller
P–VPower–voltage characteristic
MOAsMetaheuristic optimization algorithms
CTConvergence time
MAOMexican axolotl optimization
MPPTMaximum power point tracker
IEAInternational energy agency
PSOParticle swarm optimization
GWOGrey wolf optimizer
MCAMusical chairs algorithm
SFLAShuffled frog leaping algorithm
RsSeries resistance
RshShunt resistance
n1, n2Ideality factors
IdDiode saturation current
IphPhoton generated current
TModule temperature in Ko
KBoltsman’s constant
VDCDC-link voltage
VPV terminal voltage
dDuty ratio
VDConduction diode voltage
RPVInternal PV resistance
ReqBoost converter resistance
RDDiode forward resistance
RswSwitching-ON resistance
RLLoad resistance
CinInput capacitance
FSwitching frequency
δ v Input voltage ripple
CoutOutput capacitance
PSCPartial shading condition
MPPMaximum power point
HCHill climbing
P&OPerturb and observe
GHGGreenhouse gas
EVElectric vehicle
GPGlobal peak
LPsLocal peaks
CSCuckoo search
SDMSingle diode model
DDMDouble-diode model
TDMTriple-diode model
rjRandom number [0, 1]
pmjinverse probability of axolotl male
pfjAxolotl female inverse probability
ε1Predefined tolerance
mj & fjAxolotl male and female positions
mbestThe best axolotl male position
fbestThe best axolotl female position
OMjThe axolotl male value
OFjThe axolotl female value
dmaxMaximum duty ratio
dminMinimum duty ratio
λRandom number [0, 1]
EChange in power to voltage
VocOpen-circuit PV voltage
LInductance of boost converter
VmpVoltage at MPP
dmpDuty ratio at MPP
ImpCurrent at MPP
IscShort circuit PV current
kAxolotl order

References

  1. IEA’s World Energy Outlook 2022. Available online: https://www.iea.org/reports/world-energy-outlook-2022 (accessed on 1 June 2023).
  2. Jately, V.; Azzopardi, B.; Joshi, J.; Sharma, A.; Arora, S. Experimental Analysis of hill-climbing MPPT algorithms under low irradiance levels. Renew. Sustain. Energy Rev. 2021, 150, 111467. [Google Scholar] [CrossRef]
  3. Mamatha, G. Perturb and observe MPPT algorithm implementation for PV applications. Int. J. Comput. Sci. Inf. Technol. 2015, 6, 1884–1887. [Google Scholar]
  4. Eltamaly, A. Modeling of fuzzy logic controller for photovoltaic maximum power point tracker. In Proceedings of the Solar Future Conference, Istanbul, Turkey, 11–12 February 2010. [Google Scholar]
  5. Robles Algarín, C.; Taborda Giraldo, J.; Rodriguez Álvarez, O. Fuzzy Logic Based MPPT Controller for a PV System. Energies 2017, 10, 2036. [Google Scholar] [CrossRef]
  6. Eltamaly, A.M.; Alolah, A.I.; Abdulghany, M.Y. Digital implementation of general purpose fuzzy logic controller for photovoltaic maximum power point tracker. In Proceedings of the SPEEDAM 2010, Pisa, Italy, 14–16 June 2010; IEEE: Piscataway, NJ, USA, 2010; pp. 622–627. [Google Scholar]
  7. Abbassi, R.; Abbassi, A.; Heidari, A.A.; Mirjalili, S. An efficient salp swarm-inspired algorithm for parameters identification of photovoltaic cell models. Energy Convers. Manag. 2019, 179, 362–372. [Google Scholar] [CrossRef]
  8. Awadallah, M.A. Variations of the bacterial foraging algorithm for the extraction of PV module parameters from nameplate data. Energy Convers. Manag. 2016, 113, 312–320. [Google Scholar] [CrossRef]
  9. Eltamaly, A.M. A novel musical chairs algorithm applied for MPPT of PV systems. Renew. Sustain. Energy Rev. 2021, 146, 111135. [Google Scholar] [CrossRef]
  10. Deotti, L.M.P.; Pereira, J.L.R.; da Silva Júnior, I.C. Parameter extraction of photovoltaic models using an enhanced Lévy flight bat algorithm. Energy Convers. Manag. 2020, 221, 113114. [Google Scholar] [CrossRef]
  11. Rajalakshmi, M.; Chandramohan, S.; Kannadasan, R.; Alsharif, M.H.; Kim, M.-K.; Nebhen, J. Design and Validation of BAT Algorithm-Based Photovoltaic System Using Simplified High Gain Quasi Boost Inverter. Energies 2021, 14, 1086. [Google Scholar] [CrossRef]
  12. Baatiah, A.O.; Eltamaly, A.M.; Alotaibi, M.A. Improving Photovoltaic MPPT Performance through PSO Dynamic Swarm Size Reduction. Energies 2023, 16, 6433. [Google Scholar] [CrossRef]
  13. Eltamaly, A.M.; Al-Saud, M.; Abokhalil, A.G. A novel scanning bat algorithm strategy for maximum power point tracker of partially shaded photovoltaic energy systems. Ain Shams Eng. J. 2020, 11, 1093–1103. [Google Scholar] [CrossRef]
  14. Koh, J.S.; Tan, R.H.G.; Lim, W.H.; Tan, N.M.L. A Modified Particle Swarm Optimization for Efficient Maximum Power Point Tracking under Partial Shading Condition. IEEE Trans. Sustain. Energy 2023, 14, 1822–1834. [Google Scholar] [CrossRef]
  15. Eltamaly, A.M. A novel particle swarm optimization optimal control parameter determination strategy for maximum power point trackers of partially shaded photovoltaic systems. Eng. Optim. 2022, 54, 634–650. [Google Scholar] [CrossRef]
  16. Eltamaly, A.M. A Novel Strategy for Optimal PSO Control Parameters Determination for PV Energy Systems. Sustainability 2021, 13, 1008. [Google Scholar] [CrossRef]
  17. Jordehi, A.R. Enhanced leader particle swarm optimisation (ELPSO): An efficient algorithm for parameter estimation of photovoltaic (PV) cells and modules. Sol. Energy 2018, 159, 78–87. [Google Scholar] [CrossRef]
  18. Hashim, N.; Salam, Z. Critical evaluation of soft computing methods for maximum power point tracking algorithms of photovoltaic systems. Int. J. Power Electron. Drive Syst. 2019, 10, 548. [Google Scholar] [CrossRef]
  19. Eltamaly, A.M. Optimal control parameters for bat algorithm in maximum power point tracker of photovoltaic energy systems. Int. Trans. Electr. Energy Syst. 2021, 31, e12839. [Google Scholar] [CrossRef]
  20. Shi, Y.; Eberhart, R. Empirical study of particle swarm optimization. In Proceedings of the 1999 Congress on Evolutionary Computation-CEC99 (Cat. No. 99TH8406), Washington, DC, USA, 6–9 July 1999; IEEE: Piscataway, NJ, USA, 1999; Volume 3, pp. 1945–1950. [Google Scholar]
  21. Liu, Y.-H.; Huang, S.-C.; Huang, J.-W.; Liang, W.-C. A Particle Swarm Optimization-Based Maximum Power Point Tracking Algorithm for PV Systems Operating under Partially Shaded Conditions. IEEE Trans. Energy Convers. 2012, 27, 1027–1035. [Google Scholar] [CrossRef]
  22. Ratnaweera, A.; Halgamuge, S.; Watson, H. Self-Organizing Hierarchical Particle Swarm Optimizer with Time-Varying Acceleration Coefficients. IEEE Trans. Evol. Comput. 2004, 8, 240–255. [Google Scholar] [CrossRef]
  23. Alireza, A. PSO with adaptive mutation and inertia weight and its application in parameter estimation of dynamic systems. Acta Autom. Sin. 2011, 37, 541–549. [Google Scholar]
  24. Merchaoui, M.; Hamouda, M.; Sakly, A.; Mimouni, M.F. Fuzzy logic adaptive particle swarm optimisation based MPPT controller for photovoltaic systems. IET Renew. Power Gener. 2020, 14, 2933–2945. [Google Scholar] [CrossRef]
  25. Dziri, S.; Alhato, M.M.; Bouallègue, S.; Siarry, P. Improved Particle Swarm Optimizer-Based MPPT Control of PV Systems under Dynamic Partial Shading. In Proceedings of the 2022 19th International Multi-Conference on Systems, Signals & Devices (SSD), Sétif, Algeria, 6–10 May 2022; IEEE: Piscataway, NJ, USA, 2022; pp. 1603–1608. [Google Scholar]
  26. Eltamaly, A.M.; Al-Saud, M.; Abokhalil, A.G.; Farh, H.M. Simulation and experimental validation of fast adaptive particle swarm optimization strategy for photovoltaic global peak tracker under dynamic partial shading. Renew. Sustain. Energy Rev. 2020, 124, 109719. [Google Scholar] [CrossRef]
  27. Tambouratzis, G. Investigating the Effect of Hyperparameter Values and Size on Swarm Optimization Effectiveness. In Proceedings of the 2022 IEEE Symposium Series on Computational Intelligence (SSCI), Singapore, 4–7 December 2022; IEEE: Piscataway, NJ, USA, 2022; pp. 1636–1643. [Google Scholar]
  28. Eltamaly, A.M. An Improved Cuckoo Search Algorithm for Maximum Power Point Tracking of Photovoltaic Systems under Partial Shading Conditions. Energies 2021, 14, 953. [Google Scholar] [CrossRef]
  29. Rabie, A.H.; Eltamaly, A.M. A new NEST-IGWO strategy for determining optimal IGWO control parameters. Neural Comput. Appl. 2023, 35, 15143–15165. [Google Scholar] [CrossRef]
  30. Eltamaly, A.M. A novel benchmark shading pattern for PV maximum power point trackers evaluation. Sol. Energy 2023, 263, 111897. [Google Scholar] [CrossRef]
  31. Eltamaly, A.M. Optimal Dispatch Strategy for Electric Vehicles in V2G Applications. Smart Cities 2023, 6, 3161–3191. [Google Scholar] [CrossRef]
  32. Eltamaly, A.M. Performance of smart maximum power point tracker under partial shading conditions of photovoltaic systems. J. Renew. Sustain. Energy 2015, 7, 043141. [Google Scholar] [CrossRef]
  33. Eltamaly, A.M.; Al-Saud, M.S.; Abo-Khalil, A.G. Performance improvement of PV systems’ maximum power point tracker based on a scanning PSO particle strategy. Sustainability 2020, 12, 1185. [Google Scholar] [CrossRef]
  34. Eltamaly, A.M.; Farh, H.M.H.; Abokhalil, A.G. A novel PSO strategy for improving dynamic change partial shading photovoltaic maximum power point tracker. Energy Sources Part A Recover. Util. Environ. Eff. 2020, 1–15. [Google Scholar] [CrossRef]
  35. Ahmed, J.; Salam, Z. A critical evaluation on maximum power point tracking methods for partial shading in PV systems. Renew. Sustain. Energy Rev. 2015, 47, 933–953. [Google Scholar] [CrossRef]
  36. Ben Regaya, C.; Farhani, F.; Hamdi, H.; Zaafouri, A.; Chaari, A. A new MPPT controller based on a modified multiswarm PSO algorithm using an adaptive factor selection strategy for partially shaded PV systems. Trans. Inst. Meas. Control 2024. [Google Scholar] [CrossRef]
  37. Harrison, A.; Alombah, N.H.; Ndongmo, J.d.D.N. Solar irradiance estimation and optimum power region localization in PV energy systems under partial shaded condition. Heliyon 2023, 9, e18434. [Google Scholar] [CrossRef]
  38. Eltamaly, A.M.; Farh, H.M. Dynamic global maximum power point tracking of the PV systems under variant partial shading using hybrid GWO-FLC. Sol. Energy 2019, 177, 306–316. [Google Scholar] [CrossRef]
  39. Garud, K.S.; Jayaraj, S.; Lee, M.-Y. A review on modeling of solar photovoltaic systems using artificial neural networks, fuzzy logic, genetic algorithm and hybrid models. Energy Rep. 2020, 45, 6–35. [Google Scholar] [CrossRef]
  40. Salim, J.A.; Albaker, B.M.; Alwan, M.S.; Hasanuzzaman, M. Hybrid MPPT approach using Cuckoo Search and Grey Wolf Optimizer for PV systems under variant operating conditions. Glob. Energy Interconnect. 2022, 5, 627–644. [Google Scholar] [CrossRef]
  41. Koad, R.B.A.; Zobaa, A.F.; El-Shahat, A. A Novel MPPT Algorithm Based on Particle Swarm Optimization for Photovoltaic Systems. IEEE Trans. Sustain. Energy 2016, 8, 468–476. [Google Scholar] [CrossRef]
  42. Mohanty, S.; Subudhi, B.; Ray, P.K. A Grey Wolf-Assisted Perturb & Observe MPPT Algorithm for a PV System. IEEE Trans. Energy Convers. 2017, 32, 340–347. [Google Scholar] [CrossRef]
  43. Farh, H.M.H.; Eltamaly, A.M.; Othman, M.F. Hybrid PSO-FLC for dynamic global peak extraction of the partially shaded photovoltaic system. PLoS ONE 2018, 13, e0206171. [Google Scholar] [CrossRef]
  44. Mao, M.; Zhou, L.; Yang, Z.; Zhang, Q.; Zheng, C.; Xie, B.; Wan, Y. A hybrid intelligent GMPPT algorithm for partial shading PV system. Control Eng. Pract. 2019, 83, 108–115. [Google Scholar] [CrossRef]
  45. Rao, C.S.V.P.; Pandian, A.; Reddy, C.R.; Aymen, F.; Alqarni, M.; Alharthi, M.M. Location Determination of Electric Vehicles Parking Lot with Distribution System by Mexican AXOLOTL Optimization and Wild Horse Optimizer. IEEE Access 2022, 10, 55408–55427. [Google Scholar] [CrossRef]
  46. Villuendas-Rey, Y.; Velázquez-Rodríguez, J.L.; Alanis-Tamez, M.D.; Moreno-Ibarra, M.-A.; Yáñez-Márquez, C. Mexican Axolotl Optimization: A Novel Bioinspired Heuristic. Mathematics 2021, 9, 781. [Google Scholar] [CrossRef]
  47. Al-Shabi, M.; Ghenai, C.; Bettayeb, M.; Ahmad, F.F.; Assad, M.E.H. Estimating PV models using multi-group salp swarm algorithm. IAES Int. J. Artif. Intell. 2021, 10, 398. [Google Scholar] [CrossRef]
  48. Alam, D.; Yousri, D.; Eteiba, M. Flower Pollination Algorithm based solar PV parameter estimation. Energy Convers. Manag. 2015, 101, 410–422. [Google Scholar] [CrossRef]
  49. Batzelis, E.I.; Papathanassiou, S.A. A Method for the Analytical Extraction of the Single-Diode PV Model Parameters. IEEE Trans. Sustain. Energy 2016, 7, 504–512. [Google Scholar] [CrossRef]
  50. Belgacem, C.; El-Amine, A. Parameters Extraction of the Au/SnO2-Si(n)/Al pn Junction Solar Cell Using Lambert W Function. Silicon 2015, 7, 279–282. [Google Scholar] [CrossRef]
  51. Brano, V.L.; Ciulla, G. An efficient analytical approach for obtaining a five parameters model of photovoltaic modules using only reference data. Appl. Energy 2013, 111, 894–903. [Google Scholar] [CrossRef]
  52. Cannizzaro, S.; Di Piazza, M.; Luna, M.; Vitale, G. Generalized classification of PV modules by simplified single-diode models. In Proceedings of the 2014 IEEE 23rd International Symposium on Industrial Electronics (ISIE), Istanbul, Turkey, 1–4 June 2014; IEEE: Piscataway, NJ, USA, 2014; pp. 2266–2273. [Google Scholar]
  53. Cotfas, D.; Cotfas, P.; Kaplanis, S. Methods to determine the dc parameters of solar cells: A critical review. Renew. Sustain. Energy Rev. 2013, 28, 588–596. [Google Scholar] [CrossRef]
  54. Eltamaly, A.M. Musical chairs algorithm for parameters estimation of PV cells. Sol. Energy 2022, 241, 601–620. [Google Scholar] [CrossRef]
  55. Hasanien, H.M. Shuffled Frog Leaping Algorithm for Photovoltaic Model Identification. IEEE Trans. Sustain. Energy 2015, 6, 509–515. [Google Scholar] [CrossRef]
  56. Shongwe, S.; Hanif, M. Comparative Analysis of Different Single-Diode PV Modeling Methods. IEEE J. Photovolt. 2015, 5, 938–946. [Google Scholar] [CrossRef]
  57. Ranaivoson, S.S.A.; Saincy, N.; Sambatra, E.J.R.; Andrianajaina, T.; Razafinjaka, N.J. Experimentation of MPPT Control Driving a Buck Converter with PV Module Disturbances and Variable Load in a Nanogrid. Int. J. Recent Technol. Eng. (IJRTE) 2023, 12, 95–101. [Google Scholar] [CrossRef]
  58. Varatharaju, V.; Senthilkumar, B.; Manivannan, R.; Mahalakshmi, S.; Geetha, C.; Gomathi, S. MPPT Control using Modified Sepic Converter in PV Modules Connected DC Micro Grid Systems. In Proceedings of the 2023 7th International Conference on Trends in Electronics and Informatics (ICOEI), Tirunelveli, India, 11–13 April 2023; IEEE: Piscataway, NJ, USA, 2023; pp. 181–186. [Google Scholar]
  59. Farh, H.M.; Eltamaly, A.M.; Al-Saud, M.S. Interleaved boost converter for global maximum power extraction from the photovoltaic system under partial shading. IET Renew. Power Gener. 2019, 13, 1232–1238. [Google Scholar] [CrossRef]
  60. Nasiri, M.; Chandra, S.; Taherkhani, M.; McCormack, S.J. Impact of Input Capacitors in Boost Converters on Stability and Maximum Power Point Tracking in PV systems. In Proceedings of the 2021 IEEE 48th Photovoltaic Specialists Conference (PVSC), Fort Lauderdale, FL, USA, 20–25 June 2021; pp. 1004–1008. [Google Scholar]
  61. Hayat, A.; Sibtain, D.; Murtaza, A.F.; Shahzad, S.; Jajja, M.S.; Kilic, H. Design and Analysis of Input Capacitor in DC–DC Boost Converter for Photovoltaic-Based Systems. Sustainability 2023, 15, 6321. [Google Scholar] [CrossRef]
  62. Obukhov, S.; Ibrahim, A.; Diab, A.A.Z.; Al-Sumaiti, A.S.; Aboelsaud, R. Optimal Performance of Dynamic Particle Swarm Optimization Based Maximum Power Trackers for Stand-Alone PV System under Partial Shading Conditions. IEEE Access 2020, 8, 20770–20785. [Google Scholar] [CrossRef]
  63. Rashmi, K.; Patil, R. Energy Aware cross Layer Based Clustering and Congestion Control Using Mexican Axolotl Algorithm in VANET. Int. J. Comput. Netw. Appl. (IJCNA) 2022, 9, 701–711. [Google Scholar]
  64. Łukasiewicz, J. On three-valued logic. Ruch Filoz. 1920, 5, 170–171. [Google Scholar]
  65. Zadeh, L.A. Fuzzy Sets and Systems. System Theory; Polytechnic Press: New York, NY, USA, 1965; pp. 29–39. [Google Scholar]
Figure 1. The P–V and I–V characteristics under different PSCs. (a) P–V and I–V characteristics for different peak numbers. (b) P–V characteristics for different irradiances.
Energies 17 02445 g001aEnergies 17 02445 g001b
Figure 2. The PV system with MAO-FLC MPPT schematic.
Energies 17 02445 g002
Figure 3. Equivalent circuit models of the PV cell. (a) SDM. (b) DDM. (c) TDM.
Energies 17 02445 g003
Figure 4. Membership function of the input and variables.
Energies 17 02445 g004
Figure 5. FLC surface function used for MPPT of PV system.
Energies 17 02445 g005
Figure 6. The flowchart of the MAO-FLC algorithm.
Energies 17 02445 g006
Figure 7. The initial convergence performance of the MAO.
Energies 17 02445 g007
Figure 8. The initial convergence performance of the FLC.
Energies 17 02445 g008
Figure 9. The initial convergence performance of the PSO.
Energies 17 02445 g009
Figure 10. The initial convergence performance of the MAO-FLC.
Energies 17 02445 g010
Figure 11. The performance of using six axolotls in the MAO algorithm.
Energies 17 02445 g011
Figure 12. The performance of the MAO-FLC MPPT algorithm for different operating conditions.
Energies 17 02445 g012
Figure 13. The prototype of experimental work.
Energies 17 02445 g013
Figure 14. The experimental results of using MAO alone as an MPPT.
Energies 17 02445 g014
Figure 15. The experimental results of using the MAO-FLC PV MPPT.
Energies 17 02445 g015
Table 1. The relation between the linguistic variables in the input and output.
Δ ENBNSZEPSPB
E
NBNBNBNBNMZE
NSNBNMNSZEPM
ZENBNSZEPSPB
PSNMZEPSPMPB
PBZEPMPBPBPB
Table 2. The PV module specification parameters.
ItemSpecificationItemSpecification
NameSunperfect Solar
CRM185S156P-54
IL (A)7.9281
Rated power185 WI0 (A)1.9997 × 10⁻¹⁰
Cells per module54n10.95194
Voc (V)32.2Rsh (Ω)185.00028
Isc (A)7.89Rs (Ω)0.43433
Vmp (V)25.2Imp (A)7.35
Table 3. The specifications of the boost converter used in the simulation.
ItemSpecificationItemSpecification
Cin25 μFF20 kHz
Cout75 μFSampling period0.01 s
L80 μHCurrent sensorLTS 25-NP
MOSFET IXFP72N20X3Voltage sensorLV 25-P
MOSFET current72MOSFET driver74HC14
MOSFET voltage200Sampling rate0.01 s
Table 4. The results of PV power (kW), CT, and ripple contents in the voltage waveform.
ItemsMAOFLCPSOMAO-FLC
PV Power (kW)93.8854.2193.8993.89
CT (s)0.380.530.620.29
Ripples (%)1.30.010.570.01
Table 5. The outcomes demonstrating how the size of the swarm affects the MAO-FLC MPPT’s performance.
Swarm SizeCT (s)
40.29
60.43
Disclaimer/Publisher’s Note: The statements, opinions and data contained in all publications are solely those of the individual author(s) and contributor(s) and not of MDPI and/or the editor(s). MDPI and/or the editor(s) disclaim responsibility for any injury to people or property resulting from any ideas, methods, instructions or products referred to in the content.

