Abstract
This paper presents an experimental study of the effect of the mass of dust retained on a fibrous filter bed operating singly and in a “cyclone-filter-bed” system on changes in filtration efficiency and accuracy, as well as the increase in flow resistance. The research was carried out using a novel and unprecedented method, determining the dust absorption coefficient km of the filter baffle under laboratory conditions. A filtration system built of a single cyclone and a cylindrical filter cartridge with an appropriately sized surface set behind it was studied. Conditions corresponding to the actual operating conditions of the air filter were maintained: dust concentration, filtration speed and dust extraction from the cyclone settling tank. The purpose of the research was to evaluate filter materials with different structures in terms of filtration efficiency and accuracy, as well as flow resistance. The study showed that the parameters of the structure of filter materials—permeability, grammage and thickness—affect the process of retaining dust particles. It was shown that the increase in the flow resistance of the filter bed has a higher intensity when dust grains of small sizes are directed at it, which is the case when the bed is operated behind a cyclone, which separates larger dust grains from the air. There is a reduction in the operating time of the filtration system due to the limitation of the permissible resistance ∆pfdop, and the corresponding dust absorption km has a lower value. For a fixed value of the flow resistance, the dust absorption coefficient km2 of three different filtration baffles AC, B2, and B, working with a cyclone, take values 50–100% smaller than when working in a single-stage system. It has been shown that the “cyclone-filter baffle” unit, due to its greater dust separation capability, allows the filter cartridge to operate for a longer time until a certain flow resistance is reached. This allows the unit to operate longer at lower flow resistance without changing the filter cartridge, thus saving energy. The km values obtained during the tests, using the proposed original method, allow the selection of the filter bed for specific vehicle operating conditions by modelling its course.
1. Introduction
A common air pollutant that is harmful to the technical equipment in operation is mineral dust, which is lifted to a considerable height from the ground (dirt roads or sandy terrain) by the wind or by passing vehicles, working and construction machinery in operation, and is then drawn in with the air by the reciprocating internal combustion engines of motor vehicles and working machinery and living organisms. The ambient air also contains plant fragments, pollen, animal dander and moulds [1,2] and bioaerosols, which occur in the size range of 0.001–100 µm and are the cause of many diseases [3]. Internal combustion engines, which are the power units of vehicles and machinery, are the main source of gaseous pollutants (CH, CO, NOx) and PM. During the operation of motor vehicles, “non-motor” pollutants are emitted into the atmosphere, i.e., products that result from the braking process and abrasive wear in the friction joints like brake disc-friction linings, clutch disc-pressure plates, as well as from the abrasion of the tyre tread over the road surface [4,5,6,7,8].
The main constituents of mineral dust are silica (SiO2) and alumina (Al2O3). The proportion of both these components in the dust is in the range of 60–95%. At the same time, SiO2 and Al2O3 have the highest hardness, which, assessed on the basis of the ten-point Mohs scale, is 7 and 9, respectively [9,10].
The air drawn in by engines contains mineral dust grains with sharp edges and a maximum size of 50–80 µm. When the dust grains enter the engine with the air, they penetrate between the mating running surfaces of the components, causing intensive wear, mainly to the “piston-rings-cylinder” friction connection. The result is an increase in piston-cylinder clearances and an associated decrease in cylinder compression pressure, resulting in a decrease in torque and power, an increase in fuel consumption and increased exhaust emissions [11,12,13].
All pollutants that are hung in the air fall by gravity after a certain period of time and accumulate on the road surface, after which they are lifted to a considerable height by traffic or by the wind. These pollutants are referred to in the literature as road dust [14,15,16].
The mass of dust in grams or milligrams contained in one cubic metre of air is defined as the dust concentration, and its value depends mainly on the condition and type of ground and the speed of vehicle traffic. The authors of the paper [17] state that dust concentrations on motorways take values in the range of 0.0004–0.1 g/m3, and when a column of vehicles is driving on sandy terrain, concentrations can reach 0.03–8 g/m3. According to the author of the paper [18,19], the dust concentration in the air can take values in the range of 0.001–10 g/m3, depending on the type of ground. The dust concentration in the air at a distance of several meters behind a moving vehicle column on sandy ground reached a maximum value of 1.17 g/m3 [20].
An example engine with an air demand of 1000 m3/h consumes 1 kg of dust particles at a dust concentration of 1 g/m3, i.e., more than 16 g of dust enters the engine in one minute. Stopping such a large mass of dust requires a filter with a large surface area of filter material (filter paper or composite), which poses an installation problem. In order to reduce the volume occupied by the filter media, the filter paper is pleated, with the parameters of the paper material: pleat height, pleat spacing, pleat shape (flat pleat, V-shaped pleat and corrugated shape), filter paper thickness and airflow velocity having a significant effect on flow resistance [21,22]. The air filter with the optimized sinusoidal filter paper had the lowest pressure drop, and it also provided the lowest exhaust gas temperature of 218 °C and the lowest fuel consumption of 290 g/kWh [21]. In addition, during operation, due to the retention and accumulation of dust inside the thin paper layer (0.6–0.8 mm) and its limited absorbency, there is a systematic and rapid increase in filter flow resistance ∆pf, resulting in additional engine energy loss and excessive exhaust emissions [23,24,25,26].
For these reasons, two-stage air filters are used to remove such a large mass of dust in a short period of time with the required efficiency of 99.5% and an accuracy of more than 1 µm. The first stage of air filtration is the inertia filter (multicyclone), which is an assembly of individual cyclones with internal diameters not exceeding D = 40 mm arranged in parallel [27,28]. Multicyclones can be constructed of tangential inlet return cyclones or through-feed cyclones (Figure 1).
Figure 1.
The types of cyclones used for filtering the intake air in motor vehicles: (a) reverse-flow cyclone, (b) reverse-flow with axial inlet, (c) axial flow cyclone (vortex tube separators).
The second stage of air filtration is the baffle element (filter cartridge), which, due to space constraints and the desire to increase the surface area of the filter material, is usually made of pleated filter paper and formed into a cylinder shape [29]. Various solutions of filter cartridges working as a second stage behind the inertia filter are shown in Figure 2.
Figure 2.
Different solutions of filter cartridges working as a second stage after the inertia filter: (a) cylindrical cartridge with an elliptical cross-section, (b–e) cylindrical cartridge with a circular cross-section.
The installation of a pre-filter in the form of a multi-cyclone before the main (baffle) filter can significantly reduce the intensity of the increase in the flow resistance of the baffle filter and thus prolong its operating time, which is limited by the value of the permissible resistance ∆pfdop. Values of ∆pfdop of air filters are most often determined from the condition of a 3% decrease in engine power and are in the range of 2.5–4.0 kPa for passenger car engines and 4–7 kPa for heavy-truck engines [30]. For special application vehicle engines, the values are in the range of 9–12 kPa [31].
For the filtration of the inlet air of internal combustion engines, cellulose filter materials are usually used, due to the fact that this material is cheap and easy to process. However, due to the low initial filtration efficiency and relatively high pressure drops across the filter bed, composites of synthetic layers and cellulose are used. A layer of 1–5 µm thick nanofibers with diameters of 300–800 nm is applied to a standard filter bed (cellulose) [32,33,34,35,36], which improves the filtration efficiency of dust grains below 5 µm in the engine intake air.
For nonwoven filter fabrics used as filter media material for passenger car engines, the dust absorption coefficient km assumes much higher values (km = 350–500 g/m2) than filter paper (thickness does not exceed 1 mm), which may be due to the greater thickness (2–5 mm) of the filter bed. For example, in the work [37], it is shown that the value of the absorption coefficient of a non-calendered nonwoven fabric with a thickness of 3.2 mm, determined at a flow resistance of 0.3 kPa, is km = 54.5–89.3 g/m2. The same nonwoven fabric subjected to calendering has an absorption coefficient of km = 85.5–112.3 g/m2, which is much higher. According to the authors of the paper [38], who experimentally studied high-performance fibreglass filter media (thickness 0.33 mm and weight 93.4 g/m2), showed that the dust absorption coefficient of the bed at the time of reaching a pressure drop of 2.5 kPa takes, at a filtration velocity of 0.1 m/s and dust concentration of 0.32–7.08 µg/cm3, values in the range of 125–220 g/m2. The filtration velocity is defined as the average velocity of the flowing air stream through the surface of the filter medium and is determined from the following relation:
where QG—flow rate [m3/h] and Ac—active area of the filter area of the material [m2].
In a two-stage air filtration system (multicyclone-filter-paper), dust with grain sizes below dp = 80 μm flows into cyclones from the environment, and dust grains with much smaller sizes (not exceeding dp = 15–35 μm) and a different fractional composition are directed to the second stage of filtration, which results from the filtration process in the cyclone [39,40,41,42,43]. Consequently, when small-sized dust flows onto the porous baffle along with the air, there is a steeper increase in flow resistance resulting from lower air permeability of the dust layer formed. As a result, the filter reaches ∆pfdop much earlier and for a smaller mass of retained dust. Such a phenomenon was observed during experimental [44,45,46,47,48] and numerical [48,49] studies of fibrous materials and during experimental studies of the “cyclone—pleated filter paper” assembly [50,51,52,53].
For example, the authors of the paper [44] studied a nonwoven bed using two dusts with different particle distributions. The bed to which dust with a particle size of 0–12 µm was dosed obtained a value of 7 kPa for a loading of km = 400 g/m2. Dust with a larger particle size of 0–20 µm caused a lower intensity of increase in the flow resistance of the tested bed; hence, the value of 7 kPa was obtained for a higher value of km = 800 g/m2. A similar phenomenon was observed when the synthetic bed was tested with three dusts of different granulometric composition: dust of 0–10 µm, AC fine (0–80 µm) and AC coarse (0–200 µm) [45]. The highest intensity of increase in bed flow resistance was obtained in the first case for ∆pf = 0.25 kPa and dust loading km = 125 g/m2.
The paper [46] investigated the changes in the pressure drop of a cellulose filter bed as a function of dust loading. Four dusts of similar chemical composition but different granulometric composition were used: No. 1—(0–10 µm), No. 2—(0–20 µm), No. 3—(0–40 µm), No. 4—AC Coarse (0–200 µm). Fine dust causes a more intensive increase in inlet air flow resistance, resulting in a smaller mass of dust retained per unit area. For the same value of flow resistance ∆pf = 5 kPa, the dust loading of the filter bed takes the values km1 = 75 g/m2, km2 = 210 g/m2, km3 = 310 g/m2 and km4 = 560 g/m2, respectively.
The authors of paper [47] studied pressure drops during surface filtration of PTFE HEPA material for low dust loading applications. Experimentally, pressure drop curves were obtained using SiO2 monodisperse dust with different diameters dp = 52; 103; 310; 553 nm. Fine dust caused a more intense increase in bed flow resistance than coarse dust. As the size of dust grains increases, dust bed loading increases for smaller and smaller values of pressure drop ∆pf.
Poon and Liu [48] tested several types of filter media using two test dusts: SAE Fine and submicron aluminium oxide powder (median diameter 0.25 μm) containing 99% Al(OH)3. The results showed that dust loading depends on the particle size distribution and filter type. Submicron particles cause the pressure drop of the filter beds to increase much faster than when SAE Fine dust particles are in use.
The authors of paper [49] examined the pressure drop on industrial filters exposed to fine alumina (median diameter 0.25 μm) containing 99% Al(OH)3 and coarse Arizona dust and found that the greater the mass ratio of fine to coarse particles, the faster the pressure drop increased. If only fine dust was dosed onto the filter bed, a pressure drop of 850 kPa was obtained for a dust loading of km = 15 g/m2. Such a value of pressure drops on the filter bed for Arizona (coarse) dust was obtained for a much higher dust loading of km = 150 g/m2.
In paper [50], the course of pressure drops during filtration of aerosol particles with diameters of 0.18, 0.31 and 0.4 µm at two filtration speeds (0.03 and 0.3 m/s) was studied. For dust absorption km = 5 g/m2 and filtration velocity v = 0.03 m/s, the pressure drops for particles with sizes of 0.18, 0.31, and 0.4 µm have values of, respectively: 4, 3.5 and 2.6 kPa. This result explains the fact that larger particles have a smaller specific surface area, which entails a smaller final pressure drop.
The authors of paper [51] carried out experimental studies of a filter cartridge with pleated non-woven fabric with a thickness of g = 2.5 mm operating under single-stage and two-stage filtration conditions, where a multicyclone of through cyclones was used as the first filtration stage. In both cases, polydisperse test dust with grain size dpmax = 80 µm was used. The established value of flow resistance ∆pw = 5 kPa was achieved by the nonwoven filter media operating under single-stage filtration conditions at a dust absorption rate of km1 = 700 g/m2. This is twice as high as under two-stage filtration conditions, where a value of km2 = 325 g/m2 was obtained [51].
The authors of paper [52] conducted experimental tests of a cylindrical filter media made of pleated filter paper with a thickness of g = 0.56 mm. Polydisperse dust with grain size dpmax = 80 µm. was used. Under single-stage filtration conditions, the filter paper, at a resistance value of ∆pw = 5 kPa, achieves a dust absorbency of km = 278 g/m2. When the paper cartridge was operated as the second stage of filtration (after the through cyclone), the absorption coefficient achieved a much lower value of km = 210 g/m2.
The authors of the paper [53], during an experimental study of a filter bed with a pore diameter of 26.2 µm, showed that at a mass loading of 10 g/m2 for particles with sizes of 1.16 and 2.20 µm, the pressure drops are 14 and 8 mm H2O, respectively, and at a mass loading of 20 g/m2 the corresponding pressure drops increased to 79 and 29 mm H2O. Smaller particles cause much higher pressure drops during loading due to their larger specific surface area.
Presented research analysis shows that the baffle on which small-size particles are directed has a much lower dust absorption capacity than when the baffle is loaded with large-size particles. In the case of small-sized particles, the dust layer that is formed has a more compact and, thus, less permeable structure. There is a more intense increase in flow resistance resulting from lower air permeability through the dust layer km. Such a phenomenon happens during the operation of a two-stage air filter “multicyclone–paper partition”. Therefore, for the correct design of a two-stage air filter, it is necessary to know the dust absorption coefficient km of the filter material determined under two-stage filtration conditions.
The selection of an air filter baffle for a special vehicle engine equipped with a two-stage filtration system requires knowledge of, among other things, the absorption coefficient km of the filter material procuring under these conditions. Manufacturers of filter materials do not provide such data, but only the parameters of the paper structure: pore size, air permeability and filter material thickness. There are no data on the dust absorbency of the filter bed. It can be obtained during experimental tests of material samples. However, these tests are expensive and labor-intensive, but it is the most reliable and correct research method. The problem of filtration of small grain size dust occurring in a pleated paper (nonwoven) filter working directly behind an inertia filter is not sufficiently studied and described in the available literature.
To fill the gap in this area, this paper presents a novel methodology for the experimental determination of the dust absorption coefficient of any filter material operating in a two-stage system—directly behind an inertia filter. The methodology consists of studying under laboratory conditions the filtration characteristics of a sample of any material directly behind a single cyclone, with flow conditions as in a real air filter. The purpose of the study is to experimentally evaluate the filtration characteristics and, in particular, the unit dust absorption of three types of filter media when they are loaded with dust of large grain size and small grain size (operation behind a cyclone) and to analytically demonstrate the effect of the obtained dust absorption coefficient of the material filter used on the course of the car.
2. Materials and Methods
2.1. Subject of the Study
The subjects of the study were three grades of filter materials, which were shaped into small-sized cylindrical research filter cartridges having a filter material area Ac = 0.034 m2. The characteristic dimensions of the research filter cartridge are shown in Figure 3.
Figure 3.
Research filter cartridges: (a) nonwoven AC, (b) nonwoven B2, (c) paper B.
The filter materials obtained for the study differ in their structural parameters, and it is not easy to directly compare them since they come from different manufacturers, and each of them provided technical sheets containing data on other parameters. Table 1 shows the parameters of two-ply nonwoven fabric with the conventional design AC, single-ply nonwoven fabric B2 and filter paper B.
Table 1.
Parameters of nonwoven filter fabrics obtained for testing.
From the materials listed in Table 1, two-ply nonwoven AC has the greatest thickness (g = 2.34–2.86 mm). Nonwoven B2 has a thickness of 2 mm, and the smallest thickness (g = 0.9 mm) is characterized by filter paper B. All shown materials have similar grammage gm = 200–210 g/m2. However, when converted to a thickness of 1 mm, the unit grammage of gmj materials takes on varying values, with filter paper having the highest grammage, which can cause high flow resistance but can provide high filtration efficiency and accuracy. B2 nonwoven fabric has the highest air permeability, which can result in low flow resistance but also low filtration efficiency and accuracy.
The purpose of this study was to evaluate the operational filtration properties of nonwoven fabrics and paper for inlet air filtration of internal combustion engines in terms of their filtration efficiency and accuracy, dust absorption and flow resistance working in two variants: as a single-stage filter and as a second stage of filtration behind an inertia filter (after a cyclone working zone).
2.2. Test Stand
Due to the need to determine the filtration characteristics of several grades of nonwoven filter fabrics that differ in their structural parameters and come from different manufacturers (domestic and foreign), their exploratory studies were conducted based on a methodology that allows for a significant reduction in the time and cost of testing. This methodology is based on the study of a small-sized filter cartridge with a known surface area of the filter material at an appropriately selected value of air flow to ensure the required air filtration rate υF.
For this purpose, a test stand was prepared, the functional diagram of which is shown in Figure 4. The essential element of the stand is a test filter cartridge 7 made of the tested material and its housing. Since the characteristics of the tested filter fabrics will be determined in single-stage and two-stage filtration conditions, it is possible to attach a through cyclone 1 to the filter cartridge housing, together with a dust settler, which constitutes the first stage of filtration. To the dust settler is attached a pipe extracting the separated dust together with an absolute filter 14, which at the same time protects the rotameter from the influx of dust particles.
Figure 4.
Functional diagram of the test stand for filter materials: 1—cyclone, 2—dust settling tank, 3—dust dispenser, 4—compressed air rotameter, 5—instrument for measuring temperature, humidity and ambient pressure, 6—test filter cartridge, 7—U-tube liquid pressure gauge, 8—test tube, 9—dust probe, 10—main stream absolute filter, 11—flow meter, 12—analytical balance, 13—suction stream absolute filter, 14—rotameter, 15—suction fans.
Dust is provided in the tested filter cartridge or cyclone (during tests of a two-stage system) using a special dispenser. Its basic element is an electromagnet that forces the dust container to vibrate. This causes the dust to flow gravitationally into the ejector chamber, from where a stream of compressed air transports it to the dust chamber and then to the system being tested.
Directly behind the tested cartridge, at a distance of 6dw, where dw is the outlet diameter of the tested filter, there is a U-tube manometer tip mounted to measure the static pressure drop ∆hm behind the cyclone.
At an appropriate distance behind the “research filter”, the tip of the measurement probe 8 is placed centrally in the line axis, the inlet opening of which is directed towards the inflow of the contaminated air stream QG. The probe sucks in a research air stream, which is directed to the sensor, where it is analyzed in terms of the number and size of dust grains. The voltage signal is transmitted to the microprocessor of the Pamas—2132 particle counter.
The characteristics were determined for three values of the air stream QG flowing through the filter cartridge, which correspond to the next adopted filtration speeds: υF = 0.08 m/s, 0.17 m/s and 0.27 m/s. To measure the QG air flow, an FMT430 mass flow meter was used, with a measurement range of 10–150 m3/h and an accuracy of 1.2%. A rotameter was used to measure the suction flow, with a measuring range of 1–7 m3/h and an accuracy of 0.01 m3/h. The mass of the dust dispenser tank and the mass of absolute filters were determined using an analytical balance with a measurement range of 0–220 g and an accuracy of 0.001 g. Flow resistance ∆pw was determined as the drop in static pressure in the measuring line behind the filter insert at a distance of 6dw (where dw—internal diameter of the measuring line) based on the readings ∆hm read from a U-tube liquid manometer.
A view of the experimental test bed with the names of the major components is shown in Figure 5.
Figure 5.
View of the test stand.
2.3. Methodology and Research Conditions
The tests were carried out for the value of the mainstream flowing through the QG filter cartridge determined on the basis of the following relationship:
where Ac—active surface area of the filter cartridge [m2] and υF—assumed filtration speed [m/s].
During the tests, three values of filtration speed in the filter bed were adopted: υF = 0.08 m/s, 0.17 m/s and 0.27 m/s, which corresponds to the air stream respectively: QG = 9.79 m3/h, 20.81 m3/h, and 33.05 m3/h.
During the tests of the filter insert under two-stage filtration conditions, a pass-through cyclone with known filtration efficiency φc = f(QG) was used as the first stage, which was in the range of φc = 84–85% for the used test stream range. The value of the suction stream QS from the cyclone settling tank was determined based on the following relationship:
where m0—assumed dust extraction rate [%].
During the tests, a constant dust extraction rate from the cyclone settling tank was assumed, m0 = 10%.
The air dust concentration was adopted in accordance with the standard [54]. When testing materials under single-stage filtration conditions, the air dust concentration was s = 0.5 g/m3, and during tests under two-stage filtration conditions, s = 1 g/m3. The actual concentration of dust in the sucked air in a given measurement cycle was determined each time after the measurement. In accordance with the [54] standard, PTC-D test dust was used for testing, which is a national substitute for AC “fine” dust. A day before the measurements (24 h), the dust was heated for one hour at a temperature of 120–140 °C. The basic components of this dust and its granulometric composition are shown in Figure 6. A characteristic feature of the PTC-D test dust is a very high (almost 40%) mass content of grains with sizes of 0 ÷ 5 µm in the total dust mass. Due to their very small size, these dust grains are difficult to retain by filtration systems. In the PTC-D test dust, over 67% are quartz grains (SiO2), a mineral characterized by high hardness, causing accelerated wear of engine components.
Figure 6.
Characteristics of PTC-D test dust: (a) fractional composition of the dust, (b) chemical composition of the dust [55].
The tests were carried out by measuring cycles of τp duration. In the initial period of operation of the cartridge corresponding to the period of transient filtration (rapid increase in efficiency), the duration of the cycle was set at τp = 3 min. As soon as the filtration efficiency was established, the duration of the measurement cycle was extended twice.
Studies of the characteristics of the effectiveness φw and accuracy dpmax of filtration and flow resistance ∆pw of filter cartridges made of the tested materials were carried out according to the following methodology:
- (1)
- Before each measurement cycle, the mass m’Dj of the dust dispenser container, the mass of the test filter cartridge m’wj and the mass of the absolute filter cartridge m’AGj were determined;
- (2)
- The suction fan and air compressor were started, and then, on the basis of the readings of the airflow meter and RIN-type float rotameters and their trait charts, the desired values of the airflow QG (discharge from the test filter), QS (suction of dust from the cyclone settling tank) and QSPR (compressed air supplied to the dust dispenser) were determined;
- (3)
- The dust dispenser was activated, and the dust was dispensed evenly into the test filter at τp. During the testing of cartridges operating under single-stage filtration conditions, dust was dispensed into the mixing chamber and then onto the test filter cartridge. During tests of nonwovens operating under conditions corresponding to two-stage filtration, dust was dosed first into the mixing chamber and then into the through cyclone, which is the first filtration stage of the two-stage “cyclone-test cartridge” system;
- (4)
- Sixty seconds before the end of the scheduled measurement cycle time, the procedure for measuring the number Np and size dp of dust grains in the air stream downstream of the test filter cartridge was started in the particle counter. Dust particles were recorded in i = 32 measurement intervals;
- (5)
- After the period of the measurement cycle τp, the dust dispenser was blocked in a certain position, and then the height of the water column ∆hm was read (in mm H2O) from the liquid pressure gauge, after which the value of flow resistance was determined using the relationship 6;
- (6)
- The flow of air streams QG, QSPR and QS was closed, and then the mass m″Dj of the dust dispenser container, the mass of the test filter cartridge m″wj and the mass of the absolute filter cartridge m″Aj after the measurement cycle was determined using the weight method.
- (7)
- After each test cycle, the mass of dust retained on the filter cartridge, on the absolute filter, and the loss of dust mass from the dispenser was determined, which made it possible to calculate the following:
- Filtration efficiency during the measurement cycle “j” according to the following relation:where mwj—the mass of dust retained on the test filter cartridge and mAj—the mass of dust retained on the absolute filter during the subsequent measurement cycle.
- The actual value of dust concentration in the inlet air according to the following relation:
- Filter flow resistance from the following relationship:where ∆hm—the value of the pressure drops behind the cyclone [mm H2O], ρm—the density of the manometric fluid [kg/m3], ρH—the density of atmospheric air [kg/m3], g—the acceleration of the earth,
- Value of the mass loading of dust kmj from the following relation:where Ac—area of the active surface of the filter material of the test cartridge [m2], mwj—total mass of dust retained on the filter cartridge after a consecutive measurement cycle.
- Based on the results from the particle counter, the size of the maximum dust grain dpmaxj was determined.
3. Analysis of Test Results of Nonwoven Filter Fabrics Operating under Single-Stage Filtration Conditions
The characteristics of filtration efficiency φw1 = f(km1) and filtration accuracy dpmax1 = f(km1), as well as flow resistance ∆pw1 = f(km1) as a function of the mass loading of dust km1 of a double-layer AC filter cloth operating under single-stage filtration conditions are shown in Figure 7 and Figure 8. With the amount of dust mass that is retained in the filter bed, the filtration efficiency increases quite rapidly, after which it stabilizes at a certain level in order to reduce its value again in the final period of operation of the cartridge. Because of the course and because of the achieved values of filtration efficiency, the working time of the filter cartridge and the time of dust accumulation in the filter bed is conventionally divided into three periods. The first period (I) is characterized by small but systematically and rapidly increasing values of filtration efficiency, which is named the period of undetermined filtration in the literature. This period lasts from the start of the filtration process in the filter bed until the cartridge reaches a maximum, conventionally determined value of filtration efficiency. In the case of the studied materials, it was assumed that the limit of separation of the two periods (I and II) would be the moment when the filtration efficiency φw = 99.5% was achieved. A similar method of analyzing the filtration process in fibrous partitions, i.e., dividing the dust collection process into three stages, is presented in [56].
Figure 7.
Characteristics of filtration efficiency φw1 = f(km1) and flow resistance ∆pw1 = f(km1) as a function of mass loading of dust km1 of AC nonwoven filter media determined under single-stage filtration conditions.
Figure 8.
Characteristics of filtration accuracy dpmax1 = f(km1) and filtration efficiency φw1 = f(km1) as a function of the mass loading of dust km1 of the nonwoven AC filter media determined under filtration conditions.
Such a course of characteristics of filtration efficiency and accuracy, as well as flow resistance, should be explained by the fact that dust grains retained on the baffle fibres as a result of the main filtration mechanisms (inertial, direct hooking and diffusion) are a source of formation of secondary elements of the filter material structure. Subsequent dust grains settle not only on the fibres but also on previously retained grains. Agglomerates that grow to a considerable size are formed, which fill the free spaces between the fibres. This results in the retention of smaller and smaller dust grains, but at the same time, there is a hindered aerosol flow through the closely aligned dust grains, which is explained by the increase in the flow resistance of the filter bed as the mass of retained dust increases. The general trend is similar to the behavior of high efficiency filters under dust loading reported by other researchers [57,58].
After the first test cycle, the filtration efficiency of the nonwoven AC, regardless of the filtration speed used, reached a value close to φw1 = 95%. In subsequent test cycles, as the mass of dust dosed and retained on the test filter cartridge increases, the filtration efficiency assumes higher and higher values, and the established value of filtration efficiency φw = 99.5% was obtained fastest for the test cartridge at the filtration speed υF = 0.08 m/s. This moment corresponds to the value of the absorption coefficient km0.08 = 55 g/m2. The testing of the cartridge at the filtration speed to υF = 0.17 m/s resulted in the extension of the transient filtration time, and the moment of reaching the filtration efficiency φw = 99.5% occurred at the coefficient value km0.17 = 66.5 g/m2. At the highest filtration speed (υF = 0.27 m/s), the filtration efficiency φw = 99.5% was achieved only at km0.27 = 87 g/m2. The second (II) period of the filtration process, called the period of steady-state filtration, is characterized by filtration efficiency values above φw = 99.5%, reaching φw = 99.9%, and lasts until the filtration efficiency decreases markedly, thus beginning the third (III) period of the filtration process. Higher filtration velocity υF makes the filtration efficiency of the bed decrease, and the characteristics of φw = f(km) are shifted almost in parallel towards lower values, which is particularly evident in the first (I) and third (III) periods of filtration.
After the first measurement cycle, the air behind the research filter cartridge contained dust grains of dzmax1 = 28 µm when the filtration velocity was highest υF = 0.27 m/s and dzmax1 = 19.8 µm when the filtration velocity was lowest υF = 0.08 m/s. As the mass of dust stopped on the test filter cartridge increases, the filtration accuracy takes on higher and higher values, as evidenced by the increasingly smaller grain sizes dzmax1 in the air behind the filter (Figure 8). With higher filtration velocity, filtration accuracy decreases, as evidenced by increasingly larger dust grain sizes dpmax, and the characteristics of dpmax = f(km) shift almost parallel toward higher values of dpmax.
The high flow velocity through the filter bed causes already deposited dust grains to be stripped from the substrate and transported deep into the bed to the outlet side. Dust grains moving at a higher velocity have higher kinetic energy and can knock out dust grains previously deposited on the fibres. Therefore, the air with the filter at filtration velocity υF = 0.27 m/s contained dust grains of much larger size than at filtration velocity υF = 0.08 m/s. The removal of previously deposited particles hinders the growth of agglomerates, which are formed on the fibres as a result of the retention of dust grains; hence, their formation time is prolonged, and they fill the spaces between the fibres more slowly. Therefore, the intensity of the build-up of filtration efficiency is lower, and the time to reach φw = 99.5% is prolonged. The grain sizes in the air behind the test filter media when the filtration efficiency φw = 99.5% is reached take values in the range of dpmax1 = 11.8–12.6 µm.
In the second, the most essential period of filtration, the efficiency increases all the time, but very slowly, and takes values exceeding 99.5%. In the case of the velocity υF = 0.08 m/s, the filtration efficiency during the fundamental period of the cartridge operation takes on values in the range φw1 = 99.95–99.99%. The lowest values of filtration efficiency not exceeding 99.8% were observed in the case of the highest filtration velocity used during the tests υF = 0.27 m/s. The sizes of dust grains passed through the test filter media take on sizes in the range of dpmax1 = 3.8 ÷ 11.8 µm during this period, with higher values for higher filtration speeds. At the filtration velocity υF = 0.08 m/s, the filtration accuracy was dpmax1 = 3.8 ÷ 6.2 µm. An increase in filtration velocity to υF = 0.17 m/s resulted in an increase in the size of dust grains in the air behind the filter to dpmax1 = 7 ÷ 7.8 µm, while at υF = 0.27 m/s, the sizes of grains passed through the test filter media were dpmax1 = 7.8–11.8 µm.
The last (III) period of the filter cartridge is characterized by a slow decrease in filtration efficiency and the appearance of dust grains of increasing size in the air stream behind the test filter cartridge. In the course of the research, the moment when the nonwoven fabric achieved filtration efficiency below φw = 99.5% was taken as the limit of separation of periods (II) and (III). This value was obtained by the AC nonwoven at different times, which was influenced by the filtration speed. The lower the filtration velocity, the decrease in efficiency occurs at a higher value of the km factor. For υF = 0.27 m/s, the attainment of the efficiency limit value occurred at the mass loading of dust km1 = 242.5 g/m2. At the filtration velocity υF = 0.17, it is km1 = 297.3 g/m2, and at υF = 0.08 m/s − km1 = 350.5 g/m2.
With the increase in the mass of dust retained by the filter fabric, the flow resistance ∆pw of the tested filter fabric increases steadily all the time, with the intensity of the increase in flow resistance ∆pw increasing with the increase in the filtration speed υF. The fastest increase in flow resistance was observed at the filtration velocity υF = 0.27 m/s and the slowest at the filtration velocity υF = 0.27 m/s, which is consistent with the general conditions of flow through a porous baffle. As soon as the set flow resistance ∆pw = 5 kPa was reached, a mass of dust was retained on the filter cartridge, determining the mass loading of dust km of the tested nonwoven. In the case of nonwoven AC at the filtration velocity υF = 0.27 m/s, the value of the mass loading of dust was obtained at km1 = 290 g/m2. At the filtration speed of υF = 0.17 m/s, the mass loading of dust has a value of km = 330 g/m2, and at υF = 0.08 m/s, the coefficient of km1 = 343 g/m2. Thus, reducing the filtration speed from υF = 0.27 m/s to υF = 0.08 m/s increased the mass loading of dust km by 18%.
Period (III) of the nonwoven filtration process is characterized by a decrease in filtration accuracy after the cartridge retains a certain mass of dust. This phenomenon is manifested by the occurrence of the so-called “breakthrough” phenomenon, which consists of the detachment from the substrate (as a result of high flow velocities) of dust grains as well as whole agglomerates of them and movement deep into the material, up to the outlet side of the filter material. In the stream of purified air there are dust grains of a size larger than in the second (II) basic period of operation of the cartridge. The dust grain outlet locations visible on the outlet side of the material are shown in Figure 9.
Figure 9.
AC filter cloth after testing: (a) dust-laden inlet side, (b) outlet side with visible dust grain outlet areas.
The phenomenon of entrainment by the air stream of previously retained dust grains is more likely at higher flow velocities; hence, the highest accuracy (smallest size of maximum dust grains dpmax1 = 3.8 µm) during the basic period of the cartridge operation was observed at the filtration velocity υF = 0.08 m/s, and the lowest accuracy (dpmax1 = 11 µm) at υF = 0.27 m/s.
Lower values of filtration efficiency and lower intensity of its accumulation at higher filtration velocities are explained by the fact that particles of contaminants then have higher velocities and can definitely more easily penetrate deep into the structure of the filter material and get to the other side of it. Some of the dust grains with high kinetic energy are not retained on the surface of the fibre but bounce off it, also causing the previously deposited particles to be knocked out, lowering the overall filtration efficiency and increasing its build-up time to a fixed value.
For a constant filtration velocity υF and a constant value of the mass loading of dust km, the number of dust grains found in the air behind the test filter cartridge decreases as the grain size dp increases until they disappear completely (Figure 10a). The single dust grain located in the last size range has the largest size dp = dpmax. The size of the grain located in the last dimensional interval was assumed to be the filtration accuracy of the test material in a given measurement cycle. With an increase in the mass of dust retained on the filter bed (an increase in the km coefficient), the number of dust grains of the same size decreases, and the curves described by the relation Np = f(dp) move almost parallel toward the horizontal axis of the graph.
Figure 10.
Dust granulometric composition in each size range for successive test cycles: (a) number of dust grains in the air behind the tested non-woven AC insert, (b) numerical share of Up dust grains in the air in front of and behind the tested non-woven AC insert.
It can be seen from Figure 10b that as the mass of dust retained on the filter bed increases (the increase in the km coefficient), the numerical proportion Up of dust grains of the smallest size (less than 1.2 µm) assumes increasingly larger values (from UpAC = 43.3% during cycle No. 1, to UpAC = 84.1% during the last measurement cycle), and the proportion of grains above 1.2 µm is increasingly smaller. This is confirmed by the test results for subsequent test cycles (1, 3 and 5) shown in Figure 11.
Figure 11.
Numerical contribution of Up of dust grains in the air behind the tested AC nonwoven fabric in particular size ranges for successive measurements: (a) measurement No. 1 (km = 3.52 g/m2), (b) measurement No. 3 (km = 21.1 g/m2), (c) measurement No. 5 (km = 34.5 g/m2).
This shows that filtration efficiency and accuracy increases as the mass of dust retained in the non-woven AC bed increases, which is consistent with the data shown earlier (Figure 5 and Figure 6). Figure 10 shows the UpT number share of test dust particles in the range of dp = 0.7–80 µm used during testing. Test dust grains with grain size dp = 4 µm represent the maximum (UpT = 16.2%) of their proportion in the test dust. Above the size of dp = 4 µm, the share of dust grains decreases parabolically, and for 10.5 µm is UpT = 6%, and for 30 µm has a value of only UpT = 0.01%. A similar parabolic decrease in dust shares occurs for dust grains below dp = 4 µm. Test dust grains in the range of dp = 0.7–1 µm account for a share of UpT = 5.4–6.4%, which is much smaller than the share of dust grains in the air behind the filter.
Figure 12 and Figure 13 show the characteristics of filtration efficiency, accuracy and flow resistance of the B2 nonwoven fabric performed under the same conditions and for the same three filtration speeds as the AC nonwoven fabric. The characteristics of the AC and B2 nonwoven fabrics have a similar course, but they differ as to the obtained values of filtration efficiency and accuracy, flow resistance and the values of the mass loading of dust of the tested material km.
Figure 12.
Characteristics of filtration efficiency φw = f(km1) and flow resistance ∆pw = f(km1) as a function of mass loading of dust km1 of nonwoven B2 filter media determined under single-stage filtration conditions.
Figure 13.
Characteristics of filtration efficiency φw1 = f(km1) and filtration accuracy dpmax1 = f(km1) as a function of mass loading of dust km1 of nonwoven B2 filter media determined under single-stage filtration conditions.
After the first measurement cycle, the filtration efficiency of the B2 nonwoven at the filtration speed υF = 0.08 m/s reached φw0 = 85.1%. At the highest filtration speed used (υF = 0.27 m/s), the efficiency obtained during the first measurement cycle was φw0 = 77.3%. The filtration accuracy of the B2 nonwoven during the first measurement cycle was dpmax = 35 µm at the filtration speed υF = 0.27 m/s and dpmax = 25 µm for the filtration speed υF = 0.08 m/s.
The established value of filtration efficiency φw = 99.5%, marking the end of the established filtration period, was obtained at the value of the absorption coefficient km1 = 93 g/m2 for the filtration velocity υF = 0.08 m/s. At the filtration velocity υF = 0.17 m/s, filtration efficiency exceeding φw = 99.5% was obtained only at single measurement points, and at the highest filtration velocity υF = 0.27 m/s, the efficiency did not exceed φw = 99% at all. This does not mean that at higher filtration speeds, the B2 nonwoven did not reach steady-state filtration. In the cases of both speeds, stabilization of filtration efficiency and accuracy can be observed, but at a slightly lower level than in the case of the AC nonwoven. Particularly pronounced is the stabilization of filtration accuracy, which is strongly related to the filtration speed. As the filtration speed increases, the stabilization of the filtration accuracy of the B2 nonwoven occurs at increasingly higher values of the mass loading of dust km1, and the diameters of the dust grains dzmax1 passed through the test filter media have larger sizes. At the filtration velocity υF = 0.08 m/s, the filtration accuracy has already stabilized at the value of mass loading of dust km1 = 70 g/m2, and for the rest of the cartridge’s operation, the diameters of dust grains in the air behind the cartridge are in the range dpmax1 = 4.6 ÷ 8.6 µm. The filtration efficiency of nonwoven fabric B2 adopts values in the range φw1 = 99.51 ÷ 99.92% during this time, and in the last measurement cycle, it drops to φw1 = 98.17%, which may indicate the occurrence of the “breakthrough” phenomenon.
At the filtration velocity υF = 0.17 m/s, the filtration accuracy stabilized at dpmax1 = 8.6–11 µm as soon as the absorption coefficient km1 = 120 g/m2 was reached. In the final period of operation, particles of larger (dpmax1 = 12.6 µm) sizes are again present in the air behind the cartridge.
The operation of the cartridge at a filtration velocity of up to υF = 0.27 m/s was associated with the longest build-up of filtration efficiency to a value close to 99.5%. The highest filtration efficiency φw1 = 98.95% was achieved by the B2 nonwoven at km1 = 186.2 g/m2. At this time, the filtration accuracy stabilized at dpmax1 = 12.6–15.8 µm. When the absorption coefficient km1 = 240 g/m2 was exceeded, the filtration efficiency dropped to φw1 = 94% and did not exceed φw1 = 95% until the end of the cartridge’s operating time. The decrease in filtration efficiency, without a noticeable reduction in accuracy, is explained by the entry of a significant number of dust grains of smaller sizes. Filtration efficiency is determined by the mass of particles passed through, not their number. A significant number of particles of even small sizes can yield a significant mass of dust, making the overall filtration efficiency low.
At lower filtration speeds, the flow resistance of ∆pw = 5 kPa could not be achieved, and the tests were stopped early enough. This was due to the dust sprinkling from the test filter cartridges after the main jet was turned off and during their weighing, which indicates that the absorbency of the porous structure of the material was exhausted. Determined when the values of filtration efficiency and flow resistance decreased, the absorbency of the B2 nonwoven at υF = 0.08 m/s was km1 = 276 g/m2.
The achievement of higher flow resistance and higher values of the mass loading of dust km1 for higher filtration velocities is explained by the fact that the accelerated dust grains penetrate deeper into the structure of the filter medium formed by the fibres of the material and agglomerates formed from previously retained dust grains and are more permanently bound to it so that they do not peel off when the air flow is turned off.
Figure 14 shows the results of the tests (at the filtration velocity υF = 0.08 m/s) of the characteristics of filter paper B, the parameters of which are shown in Table 1. The tested filter paper is characterized by a high (φw0 = 99.3%) initial efficiency and high (dpmax = 5.9 µm) filtration accuracy, as well as an intense (up to ∆pw = 7 kPa) increase in flow resistance, compared to the tested AC and B2 nonwovens. For km1 = 20.6 g/m2, the paper cartridge achieves the required filtration efficiency φw1 = 99.5%, after which it increases to 99.9% and remains at this level during its further period of operation. During the essential period of the cartridge’s operation, the size of the maximum dust grains stabilizes at dpmax1 = 2.3–3.9 µm, after which they increase, and in the final period, dust grains with a size of dpmax1 = 6.3 µm appear in the air stream.
Figure 14.
Characteristics of filtration efficiency φw1 = f(km1) and flow resistance ∆pw1 = f(km1) as a function of km1 of filter paper B determined under single-stage filtration conditions.
Figure 15 shows the numerical shares of Up of dust grains in the air behind the tested B-paper cartridge for three test cycles: measurement No. 1, No. 3 and No. 5. For measurement No. 1, the numerical share of Up of dust grains with a size of 0.7 µm takes the value UpB = 51.34%, during cycle No. 3 and No. 5 the values are much higher, respectively: UpB = 78.92% and UpB = 88.01%. The numerical shares of dust grains of 1.1 µm and above increase. There is a phenomenon similar to the changes in the numerical shares of Up dust grains in the air behind the nonwoven AC filter media. In the case of the tested paper B, the numerical shares of Up of dust grains with a size of 0.7 µm are significantly higher than in the corresponding test cycles for nonwoven AC, which indicates the better filtration properties of paper B. A detailed comparison of the three tested filter materials, nonwoven AC and B2, and Paper B, is shown in Figure 16 and Figure 17.
Figure 15.
Numerical shares of Up of dust grains in the air behind the tested paper cartridge B in individual size ranges for the following test cycles: (a) measurement No. 1 (Up = 13.6 g/m2), (b) measurement No. 3 (Up = 21.1 g/m2), (c) measurement No. 5 (Up = 35.2 g/m2).
Figure 16.
Characteristics of efficiency φw1 = f(km1) and flow resistance ∆pw1 = f(km1) as a function of mass loading of dust km1 of filter fabrics AC and B2 and filter paper B determined under single-stage filtration conditions.
Figure 17.
Characteristics of efficiency φw1 = f(km1) and filtration accuracy dzmax1 = f(km1) as a function of mass loading of dust km1 of AC and B2 filter fabrics and B filter paper determined under single-stage filtration conditions.
The characteristics of the tested filter materials (Figure 16 and Figure 17) differ as to their values and do not differ as to their waveforms. The waveforms of the characteristics depend on their properties (Table 1). A clear relationship can be seen between the values of efficiency and flow resistance of the tested material. The higher filtration efficiency obtained entails higher flow resistance. Filter paper in the essential period of work achieved filtration efficiency at a high level φw1 = 99.99%, but also high (∆pw = 7 kPa) flow resistance. Nonwoven B2, which achieved filtration efficiency at a much lower level φw1 = 99.2–99.5%, showed a maximum flow resistance of only ∆pw = 1.22 kPa. A similar relationship can be seen between filtration efficiency and accuracy. The high filtration efficiency is related to the small size of the maximum dust grains.
With the increase in the mass of dust retained by the paper filter cartridge, the flow resistance ∆pw is steadily increasing all the time, and the intensity of the increase is much higher than that of nonwoven cartridges. Therefore, the set flow resistance ∆pw = 5 kPa is reached earlier because at the mass loading of dust, km1 = 190 g/m2. This value is 45% lower than that of nonwoven filter AC, which reaches the flow resistance ∆pw = 5 kPa at km1 = 343 g/m2. With a mass loading of dust of km1 = 190 g/m2, the AC nonwoven reached a flow resistance of ∆pw1 = 1.35 kPa, and the B2 nonwoven ∆pw1 = 0.71 kPa. Thus, the flow resistance of a cartridge made of filter paper reaches a value three times higher than that of a cartridge made of nonwoven AC and more than six times higher than that of nonwoven B2. The significantly higher values of the flow resistance of the cartridge made of filter paper are mainly due to its structure and grammage. The initial flow resistance of the paper cartridge (uncontaminated with dust) is ∆pwB = 176 Pa, while for AC and B2 nonwovens, the flow resistance is ∆pwAC = 39.7 Pa and ∆pwB2 = 11.2 Pa, respectively.
4. Analysis of Test Results of Nonwoven Filter Fabrics Operating under Two-Stage Filtration Conditions
The next stage involved performing experimental tests of the same filter materials but operating under conditions corresponding to two-stage filtration: a baffle behind a single cyclone. As the first stage of filtration, a pass-through cyclone with four swirl vanes with an inner diameter of the cylindrical part D = 36 mm was used. Ejective dust extraction from the cyclone settling tank with an extraction rate of m0 = 10% was used. The scope of the study was to perform characteristics of filtration efficiency and accuracy, as well as flow resistance as a function of the mass loading of dust km2, for three filtration velocities υF = 0.08; 0.17; 0.27 m/s in the filter bed. The AC nonwoven test results are shown in Figure 18 and Figure 19.
Figure 18.
Characteristics of filtration efficiency φw2 = f(km2) and flow resistance ∆pw2 = f(km2) as a function of mass loading of dust km2 of nonwoven AC filter media determined under two-stage filtration conditions.
Figure 19.
Characteristics of filtration efficiency φw2 = f(km2) and accuracy dpmax2 = f(km2) as a function of the mass loading of dust km2 of the AC nonwoven filter element determined under two-stage filtration conditions.
The initial filtration efficiency determined after the first measurement cycle of the nonwoven working behind the cyclone reached a value of about φw0 = 80% (Figure 18), which is much lower than the filtration efficiency of the AC nonwoven (φw0 = 95%) working under single-stage filtration conditions (Figure 16). The established value of filtration efficiency of 99.5% was observed, depending on the filtration velocity υF, with a km2 ratio of 25–30 g/m2. During single-stage filtration, the AC nonwoven reached a filtration efficiency value of 99.5% only at km1 = 55–87 g/m2, with higher values for higher filtration speeds. In the case of a nonwoven working behind a cyclone, the effect of filtration speed on the intensity of the increase in filtration efficiency to the set value of φw = 99.5% is less.
During the initial period of operation of the nonwoven AC operating in the “cyclone-partition” system, the exhaust air contains dust grains with maximum sizes of dpmax2 = 4.6 ÷ 10.2 µm at filtration speed υF = 0.27 m/s, dpmax2 = 7–16.6 µm, at filtration speed 0.17 m/s, and dpmax2 = 6.2–17.4 at filtration speed υF = 0.08 m/s (Figure 19). The sizes of dust grains are much smaller than in the corresponding period during single-stage filtration, which is due to the fact that larger grains were retained by the cyclone. With the increase in dust mass on the cartridge, the grain diameters dpmax2 take on smaller and smaller values, and during the main (II) period of the cartridge’s operation, they stabilize at 3.8–5.4 µm, which is lower than during single-stage filtration. During this period, the filtration efficiency of the tested nonwoven takes on values in the range φw2 = 99.5–99.99%, with the highest values of filtration efficiency obtained, as in the case of single-stage filtration, at the lowest (υF = 0.08 m/s) filtration rate.
The intensity of the increase in flow resistance ∆pw increases with the increase in the filtration speed υF. The highest intensity of increase in flow resistance was observed at the filtration speed υF = 0.27 m/s and the lowest at the filtration speed υF = 0.08 m/s, which is consistent with the general conditions of flow through the porous partition. For a set value of flow resistance ∆pw = 5 kPa, the mass loading of dust km2 of AC nonwoven fabric operating in conditions corresponding to the second stage of filtration becomes higher the lower the filtration speed υF. The lowest value of the mass loading of dust km2 = 135 g/m2 was obtained at the filtration speed υF = 0.27 m/s. At the filtration speed υF = 0.17 m/s, the value of km2 = 164.3 g/m2 was obtained, and at υF = 0.08 m/s, the mass loading of dust was km2 = 203.2 g/m2 (Figure 18). Therefore, reducing the filtration speed υF from 0.27 m/s to 0.08 m/s resulted in an increase in the mass loading of dust km2 by 50%. Due to low values of dust absorption and high values of flow resistance, the use of high filtration speeds in fibrous beds is unjustified.
As in the first stage of fibre testing, the moment of filtration efficiency φw2 = 99.5% was assumed as the boundary of the separation of periods (II) and (III). During tests of AC nonwoven fabric operating in two-stage filtration conditions (after the cyclone), a decrease in filtration efficiency was observed after reaching the coefficient km2 = 155 g/m2 at the filtration speed υF = 0.27 m/s and km2 = 218 g/m2 at the filtration speed υF = 0.17 m/s. At the lowest filtration speed υF = 0.08 m/s, the filtration efficiency decreased to the established level of 99.5% at km2 = 244 g/m2. Thus, the obtained values of absorption coefficients are higher than those achieved by the bed after obtaining the permissible flow resistance ∆pwdop = 5 kPa (Figure 18).
At the final stage of operation of the cartridge (period III), dust grains of increasingly larger dpmax appear in the exhaust air stream, the cause of which may be the so-called “breakthrough” phenomenon, i.e., movement of dust grains to the outlet side of the filter bed. This phenomenon was also observed when testing this bed under single-stage filtration conditions, and the reason is the high value (more than 5 kPa) of flow resistance (vacuum behind the filter) caused by accumulated dust. A decrease in filtration accuracy (the appearance of large dust grains in the air behind the filter) is synonymous with a simultaneous decrease in filtration efficiency. At the filtration velocity υF = 0.27 m/s, after the absorption coefficient km2 = 135 g/m2 is reached, the diameters of dust grains passed through the research filter cartridge take on values in the range of dpmax2 = 6.2–9.4 µm, while during the crucial period of the cartridge’s operation, these diameters were in the range of dpmax2 = 3.8–5.4 µm. The lower the filtration speed, the moment of appearance of large grains occurred later. The reasons for the decrease in the effectiveness and filtration accuracy of the cartridges in the final period of operation were explained previously during the analysis of the results of tests on nonwoven fabrics operating under single-stage filtration conditions.
From the graphs shown in Figure 20, it can be seen that the operation of the filter with the same filter material but under two-stage filtration conditions results (regardless of the value of the filtration speed) in a more intensive build-up of flow resistance; therefore, the value of the permissible flow resistance ∆pwdop = 5 kPa is reached at a lower mass loading of dust, and, therefore, much faster. The increase in pressure drop in a cartridge operating in a two-stage system (cyclone cartridge-filter) is more intense, despite the smaller mass of dust retained by the bed. This is because small dust particles form dendrites on the fibres, which grow faster when the bed is loaded with smaller particles. Small dust grains, which are much larger in number when the cyclone is the first stage of filtration, penetrate the structure of the filter paper much more easily and fill it more tightly compared to grains with larger diameters. The free spaces created between the anchored dust particles of small sizes are much smaller than those of large dust particles, resulting in a higher velocity of aerosol flow through them, thus increasing the pressure drop. In addition, small-size particles adhere more tightly and block the flow more than larger-size particles because they have a larger surface-to-volume ratio. Consequently, they achieve a greater pressure drop per unit volume/mass of particles.
Figure 20.
Characteristics of filtration efficiency φw2 = f(km2) and flow resistance ∆pw2 = f(km2) as a function of the mass loading of dust km2 of a cartridge made of nonwoven AC operating under conditions corresponding to single-stage and two-stage filtration behind an axial flow cyclone.
For the filtration velocity υF = 0.08 m/s, the absorption coefficient of the nonwoven working under single-stage filtration conditions has a value of km2 = 343 g/m2, and under two-stage filtration conditions, this value is much lower and is km2 = 203 g/m2 (Figure 20). The higher the filtration velocity, the higher the intensity of resistance buildup and the achievement of resistance ∆pwdop = 5 kPa occurs at a lower mass loading of dust. For the filtration velocity υF = 0.27 m/s, the absorption coefficient of the nonwoven under single-stage filtration conditions has a value of km2 = 281 g/m2, and under two-stage filtration conditions the value is km2 = 134 g/m2.
The characteristics presented in Figure 21 show that if the filter element operates in the two-stage “cyclone-nonwoven AC” system, the diameters of dust grains dpmax2 in the air behind the element (passed through the filter material) are smaller than in the case when the element operates individually (single-stage filter). This is especially visible in the first filtration period.
Figure 21.
Characteristics of the filtration efficiency φw2 = f(km2) and filtration accuracy dpmax2 = f(km2) as a function of the mass loading of dust km2 of the cartridge made of nonwoven AC operating under conditions corresponding to single-stage and two-stage filtration behind an axial flow cyclone.
At a filtration velocity of υF = 0.27 m/s in the air behind the filter cartridge (single-stage filtration), there are grains in the range of dpmax1 = 12.6–28 µm, while in the case of two-stage filtration, there are grains in the range of dpmax1 = 4.6–10.2 µm. This phenomenon can be explained by the fact that the proportion of large grains in the dust directed to the filter material was significantly reduced in the cyclone. At the same time, as the filtration speed increases, the contribution of the inertia and direct trapping mechanism to the retention of large dust grains increases. Small dust grains, due to their small mass, are less susceptible to the action of these mechanisms, so they move deeper into the bed and to the outlet side.
The phenomenon of a more intensive increase in the flow resistance of a baffle bed operating under two-stage filtration conditions is due to the fact that dust, the granulometric composition of which has changed during filtration in a cyclone, flows onto the filter bed. The dust has been practically deprived of grains with sizes above 20–35 µm, and the proportion of grains with smaller sizes is reduced (Figure 22). Dust with standard granulometric composition and grain sizes up to dpmax = 80 µm flows into the cyclone. In the exhaust air from the cyclone, the maximum dust grain size does not exceed dpmax = 35 µm; the proportion of dust grains with a size of dp = 20 µm is only 0.2%. The baffle is mainly influenced by grains of small sizes in the range of dp = 0.7 ÷ 5 µm, with the share of dust grains of dp = 2 µm having the highest value and amounting to Up2 = 23.6% (Figure 22).
Figure 22.
The granulometric composition of dust in the airstream before (1) and after the cyclone (2).
Dust particles flowing onto the filter bed fibres form dendrites, which grow faster as smaller particles flow onto the bed. The number of particles is much higher when the bed is operated with a cyclone. Smaller particles penetrate the structure of the filter paper much more easily and fill it more tightly compared to larger diameter grains. Therefore, the free spaces created between the deposited dust particles of small sizes are much smaller, which is the reason for the higher velocity of the aerosol flow, and thus the flow resistance increases. This phenomenon occurs despite the smaller mass retained by the bed. This is what characterizes the filtration process of a baffle bed operating in a two-stage system (cyclone-filter bed).
From the above analysis, it can be seen that the dust absorption capacity of a baffle retaining small grain sizes is much lower than when the baffle is loaded with dust particles of large grain sizes. The essence of the “inertia filter-porous baffle” two-stage filtration system is to extend the operation of the filter bed. This occurs by retaining a significant mass of dust in the inertia filter in the form of grains of large size and mass and leaving in the exhaust air dust grains of smaller size, which results in only a negligible mass of dust entering the baffle, which was directed with the inlet air to the filtration system. In this case, only about 15%, which is based on the efficiency (φc = 85%) of the cyclone used for the tests. As a result, the buildup of the flow resistance of the filter baffle caused by dust accumulation is less intense, and then the permissible value of flow resistance is reached in a longer time. This happens regardless of the fact that the absorptive capacity of the baffle in the two-stage system is lower, as shown by the tests carried out. In addition, an important aspect of two-stage filtration is the fact that the dust retained by the inertia filter does not increase the flow resistance of the filtration system, unlike the baffle filter, which must be replaced each time the set value of the permissible resistance is reached. Therefore, there is a need to use inert filters with the highest possible filtration efficiency in two-stage filtration systems.
Figure 23 and Figure 24 show the characteristics of filtration efficiency and accuracy, as well as the flow resistance of the B2 nonwoven working under conditions corresponding to the first and second stages of filtration, with a filtration velocity of υF = 0.08 m/s.
Figure 23.
Characteristics of filtration efficiency φw2 = f(km2) and flow resistance ∆pw2 = f(km2) as a function of the mass loading of dust km2 of the cartridge made of nonwoven B2 operating under conditions corresponding to single-stage and two-stage filtration behind an axial flow cyclone.
Figure 24.
Characteristics of filtration efficiency φw2 = f(km2) and filtration accuracy dpmax2 = f(km2) as a function of the mass loading of dust km2 of the cartridge made of B2 nonwoven fabric operating under conditions corresponding to single-stage and two-stage filtration behind an axial flow cyclone.
The filtration efficiency of the B2 nonwoven fabric (operating behind the cyclone) determined after the first measurement cycle reached a value of about φw2 = 67%, so definitely less than in the case when dust of standard granular composition was placed on the tested nonwoven fabric, then the efficiency had a value of φw2 = 86.9%. This is explained by the fact that the filter bed receives dust devoid of large grains, and thus, the proportion of small grains is significant, as shown in Figure 22. At the same time, however, the increase in efficiency is more intense than in the case of single-stage filtration, which is due to the fact that dust grains of smaller sizes fill the free spaces between the fibres much more tightly, hence the faster increase in filtration efficiency and flow resistance. The established filtration efficiency value of 99.5% was observed at km2 = 44 g/m2, while under single-stage filtration conditions, the nonwoven reached this 99.5% filtration efficiency value only at km1 = 93 g/m2.
The intensity of flow resistance buildup ∆pw2 of the cartridge operating behind the through cyclone is higher than when dust of standard granular composition was placed on the cartridge. At the time of loss of filtration efficiency (km1 = 270 g/m2), the B2 nonwoven working under single-stage filtration conditions obtained a flow resistance of ∆pw1 = 1.22 kPa. Nonwoven B2 obtained a higher value of flow resistance (∆pw1 = 1.61 kPa) without loss of efficiency at a much lower value of km2 = 174 g/m2. This was due to the fact that dust grains of small size form a tighter and more durable dust layer, which prevents dust from migrating to the outlet side of the filter.
During the initial period of operation of the cartridge under two-stage filtration conditions, the sizes of grains passed through the filter cartridge assume maximum values of dpmax2 = 11–16.6 µm (Figure 24). With the increase in dust mass on the cartridge, the grain sizes dpmax2 take on smaller and smaller values and, in the basic (II) period of cartridge operation, stabilize at the level of dpmax2 = 4.6–6.2 µm. Under single-stage filtration conditions, the grain sizes in the air behind the filter cartridge take on much larger values (dpmax2 = 7.8–22.2 µm), which is because dust with large grains forms a looser structure on the fibres, which allows the migration of dust grains to the outlet side of the filter.
Figure 25 and Figure 26 show a comparative analysis of the characteristics of the filtration efficiency φw = f(km) and filtration accuracy dpmax = f(km2), as well as the flow resistance ∆pw = f(km) as a function of the mass loading of dust km of a cartridge made of filter paper B operating under conditions corresponding to single-stage and two-stage filtration behind a passing cyclone. The course of the characteristics of the tested paper is like those obtained when testing AC and B2 nonwoven fabrics. Due to the more intensive increase in the flow resistance of the filter cartridge (paper B) operating behind the cyclone, the cartridge obtained a set flow resistance of 5 kPa at a mass loading of dust km2 = 45.1 g/m2. The same cartridge, but operating in a single-stage filtration system, achieved a flow resistance of 5 kPa at a dust absorption rate of km2 = 190 g/m2, which is related to the slower build-up of flow resistance. Thus, paper B, working behind the cyclone, has an absorption coefficient of 76% lower, which is related to the influx of small dust grains on the paper.
Figure 25.
Characteristics of filtration efficiency φw = f(km) and flow resistance ∆pw = f(km) as a function of the mass loading of dust km of the cartridge made of filter paper B operating under conditions corresponding to single-stage and two-stage filtration behind an axial flow cyclone.
Figure 26.
Characteristics of filtration efficiency φw = f(km) and filtration accuracy dpmax2 = f(km2) as a function of the mass loading of dust km of the cartridge made of filter paper B operating under conditions corresponding to single-stage and two-stage filtration behind an axial flow cyclone.
This phenomenon was described earlier when analyzing AC and B2 nonwoven paper. From the data shown in Figure 25, it can be seen that the operation of the B paper cartridge is possible after the flow resistance of 5 kPa is exceeded, even up to 9 kPa. During this time, the filtration efficiency remains high at φw = 99.99%, and the maximum grain sizes do not exceed the values dpmax1 = 6.3 µm during single-stage filtration and dpmax2 = 3.9 µm during two-stage filtration (Figure 26). On the other hand, the operation of the engine with an air filter with such a high flow resistance is inadvisable due to a decrease in power, an increase in fuel consumption and an increase in exhaust emissions.
Analysis of the characteristics of filtration efficiency φw = f(mDU) and flow resistance ∆pw = f(mDU) as a function of the mass of dust mDU supplied to the system (Figure 27) shows that for the cartridge operating under two-stage filtration conditions (after the cyclone), the set value of flow resistance ∆pw = 5 kPa was obtained by the cartridge, after dosing 46.6 g of dust into the system. Compared to the mass of dust retained by the cartridge operating under single-stage filtration conditions, this is 86% more (Figure 28).
Figure 27.
Characteristics of filtration efficiency φw = f(mD), flow resistance ∆pw = f(mD) and filtration accuracy dpmax = f(mD) of nonwoven AC filter cartridge operating in single-stage and two-stage filtration systems as a function of the mass of dust applied mD.
Figure 28.
Characteristics of filtration efficiency φw = f(mD), flow resistance ∆pw = f(mD) of nonwoven AC filter cartridges operating in single-stage and two-stage filtration system as a function of the mass of dosed dust mD.
Figure 29 and Figure 30 show the characteristics of filtration efficiency φw = f(mD) and flow resistance ∆pw = f(mD), as well as filtration accuracy dpmax = f(mD)of a nonwoven B2 filter insert operating in a single-stage and two-stage filtration system as a function of the mass of injected dust mD. A similar course of characteristics was obtained as in the course of tests with non-woven AC, but the achieved values of filtration efficiency and accuracy, as well as flow resistance, are at a lower level, which results from the structure (much higher permeability and lower grammage of the B2 material. The filter cartridge made of non-woven B2 operating in a single-stage filtration system lost its filtration efficiency at a flow resistance of ∆pw1 = 1.22 kPa, while in two-stage filtration at a resistance slightly higher ∆pw2 = 1.63 kPa. Thus, the cartridge can no longer be operated. The mass of dust supplied also takes on smaller values, 10.2 g and 38.3 g, respectively (Figure 30). Due to its low filtration properties, non-woven B2 cannot be considered as a filter material for the intake air of internal combustion engines.
Figure 29.
Characteristics of filtration efficiency φw = f(mD) and flow resistance ∆pw = f(mD) and filtration accuracy dpmax = f(mD) of nonwoven filter cartridge B2 operating in single-stage and two-stage filtration system as a function of mass of dosed dust mD.
Figure 30.
Characteristics of filtration efficiency φw = f(mD) and flow resistance ∆pw = f(mD) of nonwoven filter cartridge B2 operating in single-stage and two-stage filtration system as a function of mass of dosed dust mD.
Figure 31 and Figure 32 show a comparative analysis of the filtration characteristics: efficiency, filtration accuracy and flow resistance of cartridges made of AC and B2 nonwoven fabrics and B paper operating at υF = 0.08 m/s under conditions corresponding to the second stage of filtration as a function of the mass loading of dust km.
Figure 31.
Characteristics of filtration efficiency φw2 = f(km2) and flow resistance ∆pw2 = f(km2) and filtration accuracy dpmax2 = f(km2) as a function mass loading of dust km2 of filter fabrics AC and B2 and filter paper B determined under two-stage filtration conditions.
Figure 32.
Characteristics of filtration efficiency φw2 = f(km2) and flow resistance ∆pw2 = f(km2) as a function mass loading of dust km2 of filter fabrics AC and B2 and filter paper B determined under two-stage filtration conditions.
Filter paper B definitely reaches steady-state filtration faster, and a filtration efficiency of 99.5% was observed already at the value of the mass loading of dust km2 = 4.5 g/m2, while for nonwoven AC only at km2 = 25 g/m2. Nonwoven B2 achieved filtration efficiency φw = 99.5% at the latest, at km2 = 44 g/m2. The filtration efficiency of the B paper during the fixed period remained at a constant and high level, reaching φw2 = 99.99%, and no breakthrough phenomenon was observed. The filtration efficiency of the AC cartridge achieves filtration efficiency values also high as that of paper B during the steady-state period. Slightly lower efficiency values are achieved by the B2 nonwoven (φw2 = 99.5–99.94%), with a breakthrough phenomenon at the final stage of its operation, resulting in a temporary reduction in filtration efficiency and flow resistance.
The flow resistance ∆pw2 of filter paper B varies very rapidly, reaching the assumed value of the permissible resistance ∆pwdop = 5 kPa at the value of the dust absorption coefficient km2 = 43 g/m2, while the cartridge made of non-woven filter paper AC reached a flow resistance of 5 kPa only at km2 = 203 g/m2. The lowest intensity of changes in flow resistance as a function of km2 is characterized by a cartridge made of nonwoven B2, which does not reach the flow resistance of ∆pwdop2 = 5 kPa. The low intensity of changes in flow resistance of nonwoven B2 is due to the parameters of the structure of the tested material, and mainly to its high permeability, three times greater than that of the other tested materials.
The possibility of accumulation of dust grains on the fibres is smaller, so the time of increase in filtration efficiency to φw = 99.5% is longer, and the flow resistance builds up slowly. Lower than filter paper B, the intensity of flow resistance buildup of nonwoven AC filter fabric is mainly due to its three times (g = 2.34–2.86 mm) greater thickness and thus greater ability to absorb dust per unit area.
The filtration accuracy of paper B very quickly reaches 3.5 µm (at kmB = 1.83 g/m2) and remains at this level until the end of the cartridge’s operation. The filtration accuracy of 3.8 µm of nonwoven AC reaches only at kmAC = 55 g/m2 and remains at dpmax2 = 3–4.6 µm until the end of the cartridge’s operating time. The diameters of dust grains in the air behind the cartridge made of nonwoven B2 take on values higher than those of nonwoven AC and remain at 4.6–6.2 (Figure 31). A strong relationship can be seen between increasing filtration efficiency and decreasing dust grain size dpmax2, with increasing mass loading of dust km2.
The results shown in Figure 33 are evidence that the cyclone-infiltration system definitely increases the operating time of the cartridge until a fixed flow resistance is reached, which is due to the fact that a significant part (about 85%) of the dust supplied to the system is removed by the cyclone.
Figure 33.
Characteristics of filtration efficiency φw = f(mD), flow resistance ∆pw = f(mD) of filter cartridge made of Paper B and nonwoven AC fabric working in single-stage and two-stage filtration system as a function mass loading of dust mD.
For this reason, paper cartridge B operating after the cyclone achieves a flow resistance value of 5 kPa after delivering 18.3 g of dust to the system, which is 182% more than when operating the cartridge without the cyclone. From the presented test results of cartridge B, it can be predicted that the cartridge can continue to be used at higher flow resistance values (for example, up to 9 kPa) due to its sustained high (99.99%) filtration efficiency. However, the operation of an internal combustion engine or other flow-forcing device at such high flow resistance is inadvisable due to high energy losses. Therefore, the selection of an air filter for the device is a technical compromise between increasing efficiency with the mass of dust retained on the filter bed and increasing flow resistance. A similar situation occurs with non-woven AC. The flow resistance value of 5 kPa is achieved by the AC non-woven after 46.6 g of dust is delivered to the system, 86% more than when the cartridge is operated without a cyclone.
Figure 34 and Figure 35 show the results of the study of the characteristics of filtration efficiency φ = f(km) and flow resistance ⊗pw = f(km) as a function of the dust absorption coefficient km of a cellulose filter bed loaded with dusts of different granulometric composition: fine SAE Fine, coarse SAE Coarse, and dusts with grain sizes of 0–10 µm, 0–12 µm, 0–20 µm [44].
Figure 34.
Characteristics of filtration efficiency φ = f(km) and flow resistance ∆pw = f(km) as a function of dust absorption coefficient km of filter paper filter bed loaded with SAE Fine dust and SAE Coarse dust. Figure made by the author based on data from the paper [44].
Figure 35.
Characteristics of filtration efficiency φ = f(km) and flow resistance ∆pw = f(km) as a function of dust absorption coefficient km of filter paper filter bed loaded with (a) SAE Fine dust and SAE Coarse dust for different filtration speeds, (b) SAE Fine dust and dust of 0–10 µm, 0–12 µm and 0–20 µm. Figure made by the author based on data from the paper [44].
The presented characteristics have a similar course to those obtained from the tests in this paper but differ as to the values. This is probably due to the chemical composition and structure of the tested material, which the authors of the paper [44] do not specify. The phenomena observed during the study by the Authors of the paper [44] confirm the results of the study by the author of the present work in terms of the effect of fine dust grains on the faster increase in flow resistance and the obtaining by the filter bed of a lower dust absorption capacity. For flow resistance ∆p = 500 Pa, the filter bed loaded with fine dust “fine” obtained an absorption coefficient of km = 70 g/m2, which is three times lower than the same bed but tested with coarse dust (Figure 34). From the data shown in Figure 35, it can be seen that for a flow resistance of ∆p = 5 kPa, the filter bed that was loaded with 0–20 µm, 0–12 µm and 0–10 µm dust obtained increasingly smaller values of the dust absorption coefficient, respectively: km3 = 550 g/m2, km2 = 380 g/m2 and km1 = 220 g/m2. Here, we can see a clear effect of the granulometric composition of dust with a predominance of fine grains on the faster increase in flow resistance. Thus, these results confirm the reliability of the studies conducted by the author of this paper.
5. Vehicle Mileage Modeling
A characteristic feature of baffle filters is that during operation, as a result of deposition and accumulation of dust particles in the filter bed, its throughput decreases, and the filter flow resistance ∆pf increases its value systematically. The intensity of the increase in filter resistance depends on the conditions under which the vehicle is operated and mainly on the concentration of dust in the air. The higher the value of dust concentration in the air sucked into the engine, the intensity of the increase in filter flow resistance ∆pf higher. Excessive air filter flow resistance impedes the flow of air into the engine cylinders, resulting in a decrease in engine filling and power and an increase in specific fuel consumption. For this reason, the operating time of a baffled air filter is limited by the achievement of the permissible flow resistance ∆pfdop, the values of which are adopted by designers depending on the type of engine and the conditions under which the vehicle is operated.
The value of permissible flow resistance ∆pfdop for passenger car engines is 2.5–4.0 kPa, for truck engines 4–7 kPa [30] and 9–12 kPa for special-purpose vehicle engines [31].
According to the authors of the paper [59], it is assumed that for trucks and special vehicles, the values ∆pfdop are about 6.25–7.5 kPa above the flow resistance of a clean air filter.
When the filter reaches the permissible value of flow resistance, it is necessary to perform servicing of the filter by replacing the filter element with a new one. The mileage of a vehicle until the filter reaches the ∆pfdop value can be determined during its in-vehicle performance tests under specific environmental conditions or during laboratory tests. However, such tests are very expensive, labour-intensive, and complicated. The distance travelled by the Sp vehicle until the filter reaches the value of ∆pfdop can be determined theoretically from the relationship:
where Vp—constant (average) speed [km/h], τp1—operating time of the single-stage (baffle) air filter until the permissible flow resistance ∆pfdop is reached, which can be expressed by the following relation:
where Ac—the active area of the filter material [m2], km—the mass loading of dust of the material [g/m2] at the time of reaching the permissible value of flow resistance, kc—a coefficient taking into account the difference between the parameters of test and real pollution, QN—the nominal air demand of the engine [m3/h], s—the average dust concentration of the air sucked into the filter [g/m3], φp—the efficiency of the filter bed.
Sp = τpf · Vp · [km]
After considering relation (9), the distance travelled by a vehicle equipped with a baffle filter is determined by the relation:
If the vehicle is equipped with a two-stage filter, and most often it is a filter operating in an “inertia-baffle filter” system, the distance travelled by the vehicle is determined by the following relationship:
where φb—efficiency of the inertia filter
The nominal air demand of the engine can be determined from the following relationship:
where Vss—engine displacement [dm3], nN—engine maximum power speed [rpm], κ—stroke number factor (2—for four-stroke engines, 1—for two-stroke engines), ηυ—filling factor, the value of which should be taken depending on the type of engine.
Practical use of the above relationships requires knowledge of the data characterizing a given filter material, such as the filtration efficiency φp of the baffle material, the absorption coefficient km of the filter material, the filtration efficiency φb of the inert filter, and the kc coefficient, which takes into account the difference between the test and actual parameters under specific operating conditions (chemical and granulometric composition of the dust, its concentration, type of dust and air velocity). The kc coefficient mainly considers the effect of soot on the life of the paper cartridge and takes values of kc < 1 (the higher the soot content, the lower the value of the coefficient and the shorter the working time of the filter). It is of great importance in the case of paper cartridge air filters of passenger cars of vehicles operated in urban conditions, where soot is the dominant component of engine inlet air pollution.
The operating parameters that significantly determine the intensity of the increase in the filter’s flow resistance and thus the vehicle’s mileage, and are derived from relation (11), are the mass loading of dust km, dust concentration and vehicle speed. The design parameters that determine the mileage are the filtration efficiency φp of the baffle filter and the surface area of the material, and the filtration efficiency of the inertia filter φb.
From the studies carried out in this paper, one can see significant differences in the values of the km coefficient for different filter materials determined under the same conditions. Particularly large differences in the values of the km coefficient, regardless of the filter material, occur when the filter material is in the second stage of filtration. At a constant permissible flow resistance of ∆pfdop = 5 kPa, the absorption coefficient of the material operating in a two-stage system has a value of half. Therefore, when designing air filters, it should be borne in mind that the same filter material, but working as a second stage of filtration, has an absorption rate that is much lower, and this property should be considered.
Using the calculated values of the km coefficient for two filter materials, nonwoven AC and paper B, and taking the values of the other parameters in relation (11) as constants, the modelled mileages of the truck at which the filter should be serviced—replacement of the filter cartridge—were determined.
For the calculations, it was assumed that the test vehicle would be operated mainly in non-urban conditions, on dirt roads, where the main component of pollution is mineral dust, which allows us to assume a correction factor kc = 1. According to [60], the concentration of dust in the air during the operation of trucks and special vehicles can take values up to s = 1 g/m3. To calculate the mileage of the truck (achieving ∆pfdop), the following data were assumed: average speed of the vehicle Vp = 50 km/h, dust concentration in the air s = 0.5 g/m3. Calculations were carried out using the data of the Scania engine (diesel engine with turbocharging and air cooler): displacement Vss = 11.7 dm3, area of filter paper Ac = 10 m2, nominal air demand by the engine QSilmax = 1350 m3/h.
The mass loading of dust km and filtration efficiency φp were adopted from tests of AC, B filter material for the corresponding operating conditions. From Figure 36, it can be seen that the use of two-stage air filtration significantly extends vehicle mileage, even though the mass loading of dust km has a lower value. The two-stage “cyclone- nonwoven AC filter” filtration system extends the vehicle mileage by four times compared to a single-operating fibre filter. For the assumptions made, the modelled mileage of the vehicle is over 1157 km. The two-stage “cyclone-paper” filtration system extends vehicle mileage by only two times due to the lower values of the paper mass loading of dust, which is related to the faster buildup of flow resistance. As already mentioned, AC nonwoven fabric is three times thicker than B-paper, which increases its unit (m2) mass absorption, but at the same time, the initial period (achieving efficiency φw = 99.5%) takes much longer. This period is characterized by low filtration efficiency and accuracy and has a negative impact on the wear of engine components. Therefore, when selecting an air filter material, one should be guided not only by the mileage of the car but also by the filtration properties of the material: filtration efficiency and accuracy.
Figure 36.
Modeled car runs depending on the type of filter material (AC nonwoven, B paper) with single-stage and two-stage filtration.
Vehicle mileage may change depending on changes in operating conditions and the design of the filtration system according to the relationship (11) and (12). An increase in cyclone efficiency results in longer vehicle mileage, as expected. The greater mass of dust delivered to the system is separated by the cyclone, so that a smaller portion of it reaches the filter media, reduces the intensity of the increase in flow resistance and increases the time to reach the permissible resistance. Increasing the cyclone efficiency from 87% to 97% extends the vehicle’s mileage by five times, with values for the “cyclone-AC fleece” system higher than for the “cyclone-paper B” system (Figure 37). This is due to the previously described different filtration properties of nonwoven C and paper B.
Figure 37.
Modelled car runs depending on cyclone filtration efficiency for the system: “cyclone-AC nonwoven” and “cyclone-paper B”.
The concentration of dust in the air changes the mileage of the vehicle regardless of the filter material used and the efficiency of the cyclone (Figure 38). An increase in dust concentration in the range of s = 0.2–0.8 g/m3 reduces the mileage of the car from 4699 to 1174, or four times.
Figure 38.
Modelled runs of the car depending on the concentration of dust in the air for different cyclone efficiencies in the “cyclone-AC nonwoven” and “cyclone-paper B” systems.
6. Conclusions
The manuscript presents an experimental study to determine the mass loading of dust km of three different filter materials, formed into cylindrical cartridges, operating in a single-stage and two-stage system directly downstream of an axial flow cyclone. The characteristics of filtration efficiency, filtration accuracy and flow resistance as a function of km factor were determined, keeping the same flow conditions and dust concentration in the inlet air. The purpose of the study was to show that if dust with small grain sizes flows onto the filter material, this affects the filtration process in the filter material, resulting in a decrease in absorption and a more intense increase in flow resistance. Such a case occurs when the filter element works in a two-stage filtration system for engine inlet air with a porous baffle. During the experiment, an original methodology was used, which was that the filter element material, which worked downstream of the cyclone, was influenced by dust without large grains, and its granulometric composition was changed and shaped by the actual air filtration process in the cyclone. This had a direct impact on the value of the mass loading of dust of the filter material. The research was carried out in the context of using the results of the research for designing baffles of two-stage filters for trucks. As a result of the research, the following conclusions were made:
- (1)
- The characteristics of the tested filter materials differ in terms of values and do not differ in terms of their course, which is determined by their properties, mainly grammage, air permeability and thickness. The higher filtration efficiency and accuracy obtained are associated with higher flow resistance. Filter paper (B) achieved high filtration efficiency φw1 = 99.99% and grain size dpmax = 5.9 µm, but also high (∆pw = 7 kPa) flow resistance during the main period of operation. Nonwoven B2 achieved a maximum flow resistance of only ∆pw = 1.12 kPa but achieved filtration efficiency at a much lower level φw1 = 99.2–99.5%;
- (2)
- The low (φ = 70–92%) efficiency of the tested filter materials and the presence of large (dpmax = 17.5–25 µm) dust grains in the purified air during the initial period of operation is a characteristic of the filter materials. The time to achieve the required filtration efficiency (φ = 99.5%) varies and depends on the structure of the material. Filter paper B operating in a single-stage system reaches this value after obtaining dust absorption km = 20.6 g/m2, non-woven AC for km = 87.5 g/m2, and non-woven B2 after obtaining km = 122.7 g/m2, which is related to the increasing permeability of the material;
- (3)
- The initial lifetime of filter materials is significantly reduced when the filter cartridge works in the “cyclone-filter cartridge” system. The shortest, compared to the tested non-woven AC and B2, time to achieve filtration efficiency φw = 99.5% was achieved by filter paper B, which is due to its structure: lower permeability and higher grammage;
- (4)
- Filter materials working in the system “cyclone-filter-paper” obtain filtration parameters (filtration efficiency and accuracy and flow resistance) significantly different in terms of course and value than the same materials working in a single-stage filtration system. This is influenced by the altered fractional composition of dust in the cyclone. The numerical proportion of dust grains with the smallest size (less than 1.2 µm) increases to UpAC = 84.1% compared to UpT = 5.4% before the cyclone, resulting in a more intense increase in flow resistance;
- (5)
- Filter materials operating in the “cyclone-infiltration” system achieve an absorption coefficient significantly lower than the same materials operating in a single-stage filtration system. For non-woven AC, it is a decrease from km1 = 343 g/m2 to km2 = 203 g/m2, i.e., by 40%, and for paper B, the absorption coefficient takes the values of km1 = 190 g/m2 and km2 = 45.1 g/m2, respectively;
- (6)
- Lower values of the dust absorption coefficient of the material working in the “cyclone—filter cartridge” system do not reduce its working time because only a part (5–15%) of the dust mass, which was delivered with air to the cyclone, is directed to the filter material. Thus, the operating time of the material working in the “cyclone—filter media” system is increased. For non-woven AC, this is an increase of 86%, and for filter paper, by 182%;
- (7)
- Pre-filter (multi-cyclone) before the main filter significantly improves the performance of the entire filtration system by extending the life of the main filter (later reaching the permissible resistance) despite the reduction of its dust absorption due to the influx of fine dust grains;
- (8)
- The “cyclone-ac non-woven” filtration system extends by four times the operating time of the filter cartridge, limited by the achievement of the permissible resistance and, thus, the mileage of the vehicle. The frequency of maintenance of the filtration system (filter cartridge replacement) is reduced, which translates into lower operating costs;
- (9)
- In the actual operating conditions of the air filter and engine, improperly selected filter material results in a decrease in the efficiency and accuracy of filtration of the engine’s inlet air. This can have a direct effect on accelerated wear of mating engine components, especially piston-piston-ring-cylinder (P-PR-C), resulting in lower engine power and higher exhaust emissions;
- (10)
- Increasing the cyclone efficiency from 87% to 97% extends the operating time of the filter element in the “cyclone-pore-partition” system by five times, and thus the mileage of the vehicle, with the mileage values for the “cyclone-ac fleece” system being higher than that of the “cyclone-paper B” system. It is expedient to carry out work to increase the filtration efficiency of inertia filters that are pre-filters.
Funding
This research received no external funding.
Data Availability Statement
Data are contained within the article.
Conflicts of Interest
The author declares no conflicts of interest.
Nomenclature
| Symbol | Description |
| A | filter area [m2] |
| d | diameter [m] |
| g | thickness [mm] |
| gm | grammage [g/m2] |
| H | active height of paper [m] |
| k | coefficient |
| m | dust mass [g] |
| m0 | dust extraction degree [%] |
| Rm | tensile strength [kPa] |
| S | length of the road [km] |
| s | concentration of dust in the air [g/m3] |
| U | numerical proportion of dust grains [%] |
| Greek symbols | |
| ρ | fluid density [kg/m3] |
| Vss | engine displacement [dm3] |
| Vp | average driving speed [km/h] |
| υF | filtration speed [m/s] |
| Q | Airflow [m3/h] |
| q | air permeability [dm3/m2/s] |
| η | engine cylinder filling level |
| φ | filtration efficiency [%] |
| ∆p | airflow resistance [kPa] |
| τp | duration of the measurement cycle [s] |
| ∆h | height of the column of the gauge liquid [mm] |
| κ | stroke number factor |
| Subscripts | |
| AG | dust mass on absolute filter |
| b | inertial filter |
| c | active surface, cyclone |
| D | dust dispenser |
| E | engine |
| dop | limit value |
| f | filter |
| G | main |
| H | environmental conditions |
| m | mass absorption of dust |
| max | maximum value |
| N | nominal value |
| n | engine speed [rpm] |
| p | dust grains, vehicle |
| S | dust extraction |
| w | inlet, filter cartridge |
| zw | mass of dust on the filter cartridge |
| Abbreviations | |
| P-PR-C | piston-piston ring-cylinder |
| CH | hydrocarbons |
| CO | carbon monoxide |
| NO | nitric oxide |
References
- Baddocka, M.C.; Zobeck, T.M.; Van Pelt, R.S.; Fredrickson, E.L. Dust emissions from undisturbed and disturbed, crusted playa surfaces: Cattle trampling effects. Aeolian Res. 2011, 3, 31–41. [Google Scholar] [CrossRef]
- Li, B.; Cao, R.; He, H.-D.; Peng, Z.-R.; Qin, H.; Qin, Q. Three-dimensional diffusion patterns of traffic-related air pollutants on the roadside based on unmanned aerial vehicles monitoring. Build. Environ. 2022, 219, 109159. [Google Scholar] [CrossRef]
- Miri, A.; Shirmohammadi, E.; Sorooshian, A. Impacts of dust storms on indoor and outdoor bioaerosol concentration in the Sistan region of Iran. J. Build. Eng. 2023, 76, 107302. [Google Scholar] [CrossRef]
- Jung, U.; Choi, S.-S. Classification and Characterization of Tire-Road Wear Particles in Road Dust by Density. Polymers 2022, 14, 1005. [Google Scholar] [CrossRef]
- Rauert, C.; Charlton, N.; Okoffo, E.D.; Stanton, R.S.; Agua, A.R.; Pirrung, M.C.; Thomas, K.V. Concentrations of Tire Additive Chemicals and Tire Road Wear Particles in an Australian Urban Tributary. Environ. Sci. Technol. 2022, 56, 2421–2431. [Google Scholar] [CrossRef] [PubMed]
- Chae, E.; Jung, U.; Choi, S.S. Types and concentrations of tire wear particles (TWPs) in road dust generated in slow lanes. Environ. Pollut. 2024, 346, 123670. [Google Scholar] [CrossRef]
- Thomas, J.; Moosavian, S.K.; Cutright, T.; Pugh, C.; Soucek, M.D. Method Development for Separation and Analysis of Tire and Road Wear Particles from Roadside Soil Samples. Environ. Sci. Technol. 2022, 56, 11910–11921. [Google Scholar] [CrossRef] [PubMed]
- Kovochich, M.; Oh, S.C.; Lee, J.P.; Parker, J.A.; Barber, T.; Unice, K. Characterization of tire and road wear particles in urban river samples. Environ. Adv. 2023, 12, 100385. [Google Scholar] [CrossRef]
- Bojdo, N.; Filippone, A. Effect of Desert Particulate Composition on Helicopter Engine Degradation Rate. In Proceedings of the 40th European Rotorcraft Forum, Southampton, UK, 2–5 September 2014. [Google Scholar]
- Haig, C.; Hursthouse, A.; McIlwain, S.; Sykes, D. The effect of particle agglomeration and attrition on the separation efficiency of a Stairmand cyclone. Powder Technol. 2014, 258, 110–124. [Google Scholar] [CrossRef]
- Dziubak, T.; Dziubak, S.D. A Study on the Effect of Inlet Air Pollution on the Engine Component Wear and Operation. Energies 2022, 15, 1182. [Google Scholar] [CrossRef]
- Wróblewski, P. Analysis of Torque Waveforms in Two-Cylinder Engines for Ultralight Aircraft Propulsion Operating on 0W-8 and 0W-16 Oils at High Thermal Loads Using the Diamond-Like Carbon Composite Coating. SAE Int. J. Engines 2022, 15, 129–146. [Google Scholar] [CrossRef]
- Nyirenda, G.; Tamaldin, N.; Zakaria, M.H. The Impact of Biodiesel Blend Variation Contamination to Engine Friction, Wear, Performance and Emission. Int. J. Automot. Mech. Eng. 2021, 18, 8592–8600. [Google Scholar] [CrossRef]
- Cardozo, J.I.H.; Sánchez, D.F.P. An experimental and numerical study of air pollution near unpaved Roads. Air Qual. Atmos. Health 2019, 12, 471–489. [Google Scholar] [CrossRef]
- Fujiwara, F.; Rebagliati, R.J.; Dawidowski, L.; Gómez, D.; Polla, G.; Pereyra, V.; Smichowski, P. Spatial and chemical patterns of size fractionated road dust collected in a mega citiy. Atmos. Environ. 2011, 45, 1497–1505. [Google Scholar] [CrossRef]
- Fussell, J.C.; Franklin, M.; Green, M.D.; Gustafsson, M.; Harrison, R.M.; Hicks, W.; Kelly, F.J.; Kishta, F.; Miller, M.R.; Mudway, I.S.; et al. A Review of Road Traffic-Derived Non-Exhaust Particles: Emissions, Physicochemical Characteristics, Health Risks, and Mitigation Measures. Environ. Sci. Technol. 2022, 56, 6813–6835. [Google Scholar] [CrossRef] [PubMed]
- Jaroszczyk, T.; Pardue, B.A.; Heckel, S.P.; Kallsen, K.J. Engine air cleaner filtration performance—Theoretical and experimental background of testing. In Proceedings of the AFS Fourteenth Annual Technical Conference and Exposition, Tampa, FL, USA, 1 May 2001. [Google Scholar]
- Pinnick, R.G.; Fernández, G.; Hinds, B.D.; Bruce, C.W.; Schaefer, R.W.; Pendleton, J.D. Dust Generated by Vehicular Traffic on Unpaved Roadways: Sizes and Infrared Extinction Characteristics. Aerosol Sci. Technol. 1985, 4, 99–121. [Google Scholar] [CrossRef]
- Barbolini, M.; Di Pauli, F.; Traina, M. Simulation der Luftfiltration zur Auslegung von Filterelementen. MTZ-Mot. Z. 2014, 75, 52–57. [Google Scholar] [CrossRef]
- Dziubak, T. Zapylenie powietrza wokół pojazdu terenowego. Wojsk. Przegląd Tech. 1990, 3, 154–157. (In Polish) [Google Scholar]
- Allam, S.; Mimi Elsaid, A. Parametric Study on Vehicle Fuel Economy and Optimization Criteria of the Pleated Air Filter Designs to Improve the Performance of an I.C Diesel Engine: Experimental and CFD Approaches. Sep. Purif. Technol. 2020, 241, 116680. [Google Scholar] [CrossRef]
- Zhang, Y.; Men, X.; Wang, S.; Fu, X.; Chen, L. CFD-DEM Study of Pleated Filter Plugging Process Based on Porous Media Model. Machines 2022, 10, 862. [Google Scholar] [CrossRef]
- Dziubak, T.; Karczewski, M. Experimental Studies of the Effect of Air Filter Pressure Drop on the Composition and Emission Changes of a Compression Ignition Internal Combustion Engine. Energies 2022, 15, 4815. [Google Scholar] [CrossRef]
- Karczewski, M.; Chojnowski, J.; Szamrej, G. A review of low CO2 emission fuels for a dual-fuel RCCI engine. Energies 2021, 14, 5067. [Google Scholar] [CrossRef]
- Yang, A.-J.; Song, Z.-J.; Yang, J.-W.; Zhao, C.-J. Effect of Air Filter on Performance of S1110 Diesel Engine. IOP Conference Series. Mater. Sci. Eng. 2019, 688, 022050. [Google Scholar]
- Thomas, J.; West, B.; Huff, S. Effect of Air Filter Condition on Diesel Vehicle Fuel Economy; SAE Technical Paper 2013-01-0311; SAE International: Warrendale, PA, USA, 2013. [Google Scholar] [CrossRef]
- Muschelknautz, U. Design criteria for multicyclones in a limited space. Powder Technol. 2019, 357, 2–20. [Google Scholar] [CrossRef]
- Dziubak, T. Theoretical and Experimental Studies of Uneven Dust Suction from a Multi-Cyclone Settling Tank in a Two-Stage Air Filter. Energies 2021, 14, 8396. [Google Scholar] [CrossRef]
- Rieger, M.; Hettkamp, P.; Löhl, T.; Madeira, P.M.P. Effcient Engine Air Filter for Tight Installation Spaces. ATZheavy Duty Worldw. 2019, 12, 56–59. [Google Scholar] [CrossRef]
- Barris, M.A. Total FiltrationTM. The Influence of Filter Selection on Engine Wear. Emissions and Performance; SAE Technical Paper: 952557; SAE International: Warrendale, PA, USA, 2018. [Google Scholar] [CrossRef]
- Bugli, N.J.; Green, G.S. Performance and Benefits of Zero Maintenance Air Induction Systems. SAE Trans. 2005, 114, 1015–1028. [Google Scholar]
- Borojeni, I.A.; Gajewski, G.; Riahi, R.A. Application of Electrospun Nonwoven Fibers in Air Filters. Fibers 2022, 10, 15. [Google Scholar] [CrossRef]
- Liu, Y.; Jia, C.; Li, P.; Zhang, H.; Jia, L.; Yu, L.; Wang, R.; Liu, D.; Wu, H.; Li, B. Mass Production of Hierarchically Designed Engine-Intake Air Filters by Multinozzle Electroblow Spinning. Nano Lett. 2022, 22, 4354–4361. [Google Scholar] [CrossRef]
- Nowak, B.; Bonora, M.; Winnik, M.; Gac, J.M. An effect of fibrous filters modification with MTMS aerogel structure on oil mist filtration dynamics. J. Aerosol Sci. 2023, 170, 106147. [Google Scholar] [CrossRef]
- Heikkilä, P.; Sipilä, A.; Peltola, M.; Harlin, A.; Taipale, A. Electrospun PA-66 Coating on Textile Surfaces. Text. Res. J. 2007, 77, 864–870. [Google Scholar] [CrossRef]
- Tian, X.; Ou, Q.; Liu, J.; Liang, Y.; Pui, D.Y. Particle loading characteristics of a two-stage filtration system. Sep. Purif. Technol. 2019, 215, 351–359. [Google Scholar] [CrossRef]
- Sakthivel, S.; Ezhil, A.J.; Ramachandran, T. Development of Needle-Punched Nonwoven Fabrics from Reclaimed Fibers for Air Filtration Applications. J. Eng. Fibers Fabr. 2014, 9, 149–154. [Google Scholar] [CrossRef]
- Wang, Q.; Lin, X.; Chen, D.-R. Effect of dust loading rate on the loading characteristics of high efficiency filter media. Powder Technol. 2016, 287, 20–28. [Google Scholar] [CrossRef]
- Mrad, W.; Theron, F.; Joubert, A.; Zgheib, N.; Le Coq, L. Local variations of air velocity in the vicinity of filter pleats in transitional airflow regime—Experimental and numerical approaches. Sep. Purif. Technol. 2021, 268, 118658. [Google Scholar] [CrossRef]
- Chu, K.; Chen, J.; Yu, A. Applicability of a coarse-grained CFD–DEM model on dense medium cyclone. Miner. Eng. 2016, 90, 43–54. [Google Scholar] [CrossRef]
- Zhang, W.; Zhang, L.; Yang, J.; Hao, X.; Guan, G.; Gao, Z. An experimental modeling of cyclone separator efficiency with PCA-PSO-SVR algorithm. Powder Technol. 2019, 347, 114–124. [Google Scholar] [CrossRef]
- Baltrėnas, P.; Chlebnikovas, A. Experimental research on the dynamics of airflow parameters in a six-channel cyclone-separator. Powder Technol. 2015, 283, 328–333. [Google Scholar] [CrossRef]
- Dziubak, T. Problems of dust removal from multi-cyclones of engine air cleaners in cross-country motor vehicles. Arch. Automot. Eng. 2017, 76, 37–62. [Google Scholar]
- Jaroszczyk, T.; Fallon, S.L.; Pardue, B.A. Analysis of Engine Air Cleaner Efficiency For Different Size Dust Distributions. Fluid-Part. Sep. J. 2002, 14, 75–88. [Google Scholar]
- Jaroszczyk, T.; Wake, J.; Connor, M.J. Factors Affecting the Performance of Engine Air Filters. J. Eng. Gas Turbines Power 1993, 115, 693–699. [Google Scholar] [CrossRef]
- Jaroszczyk, T. Air Filtration in Heavy-Duty Motor Vehicle Applications. In Proceedings of the Dust Symposium III, Vicksburg, MS, USA, 15–17 September 1987. [Google Scholar]
- Zhang, W.; Deng, S.; Wang, Y.; Lin, Z. Modeling the surface filtration pressure drop of PTFE HEPA filter media for low load applications. Build. Environ. 2020, 177, 106905. [Google Scholar] [CrossRef]
- Poon, W.S.; Liu, B.Y.H. Dust Loading Behavior of Engine and General Purpose Air Cleaning Filters; SAE Technical Paper Series 970676; International Congress & Exposition: Detroit, MI, USA, 1997. [Google Scholar]
- Lee, J.-K.; Kim, S.-C.; Liu, B.Y.H. Effect of Bi-Modal Aerosol Mass Loading on the Pressure Drop for Gas Cleaning Industrial Filters. Aerosol Sci. Technol. 2001, 35, 805–814. [Google Scholar] [CrossRef]
- Thomas, D.; Penicot, P.; Contal, P.; Leclerc, D.; Vendel, J. Clogging of brous lters by solid aerosol particles Experimental and modelling study. Chem. Eng. Sci. 2001, 56, 3549–3561. [Google Scholar] [CrossRef]
- Dziubak, T. Experimental research of axial cyclones of combustion engines air filters. Bull. Mil. Univ. Technol. 2013, 2, 201–217. (In Polish) [Google Scholar]
- Long, J.; Tang, S.Z.; Yun Liang, Y.; Hu, J. Dust Loading Performance of a Novel Submicro-Fiber Composite Filter Medium for Engine. Materials 2018, 11, 2038. [Google Scholar] [CrossRef] [PubMed]
- Japuntich, D.A.; Stenhouse, J.I.T.; Liu, B.Y.H. Experimental results of solid monodisperse particle clogging of fibrous filters. J. Aerosol Sci. 1994, 25, 385–393. [Google Scholar] [CrossRef]
- PN-ISO 5011; Filtry Powietrza do Silników Spalinowych i Sprężarek. PKNM: Warsaw, Poland, 1994.
- Dziubak, T.; Bąkała, L.; Dziubak, S.D.; Sybilski, K.; Tomaszewski, M. Experimental Research of Fibrous Materials for Two-Stage Filtration of the Intake Air of Internal Combustion Engines. Materials 2021, 14, 7166. [Google Scholar] [CrossRef] [PubMed]
- Song, Y.; Shim, E. Structure characterization of the clogging process of coarse fibrous filter media during solid particle loading with X-ray micro-computed tomography. Sep. Purif. Technol. 2021, 273, 118980. [Google Scholar] [CrossRef]
- Jung, S.; Kim, J. Advanced Design of Fiber-Based Particulate Filters: Materials, Morphology, and Construction of Fibrous Assembly. Polymers 2020, 12, 1714. [Google Scholar] [CrossRef]
- Sun, Z.; Liang, Y.; He, W.; Jiang, F.; Song, Q.; Tang, M.; Wang, J. Filtration performance and loading capacity of nano-structured composite filter media for applications with high soot concentrations. Sep. Purif. Technol. 2019, 221, 175–182. [Google Scholar] [CrossRef]
- Norman, K.; Huff, S.; West, B. Effect of Intake Air Filter Condition on Vehicle Fuel Economy; Oak Ridge National Laboratory: Oak Ridge, TN, USA, 2009. [Google Scholar]
- Dziubak, T. Experimental Investigation of Possibilities to Improve Filtration Efficiency of Tangential Inlet Return Cyclones by Modification of Their Design. Energies 2022, 15, 3871. [Google Scholar] [CrossRef]

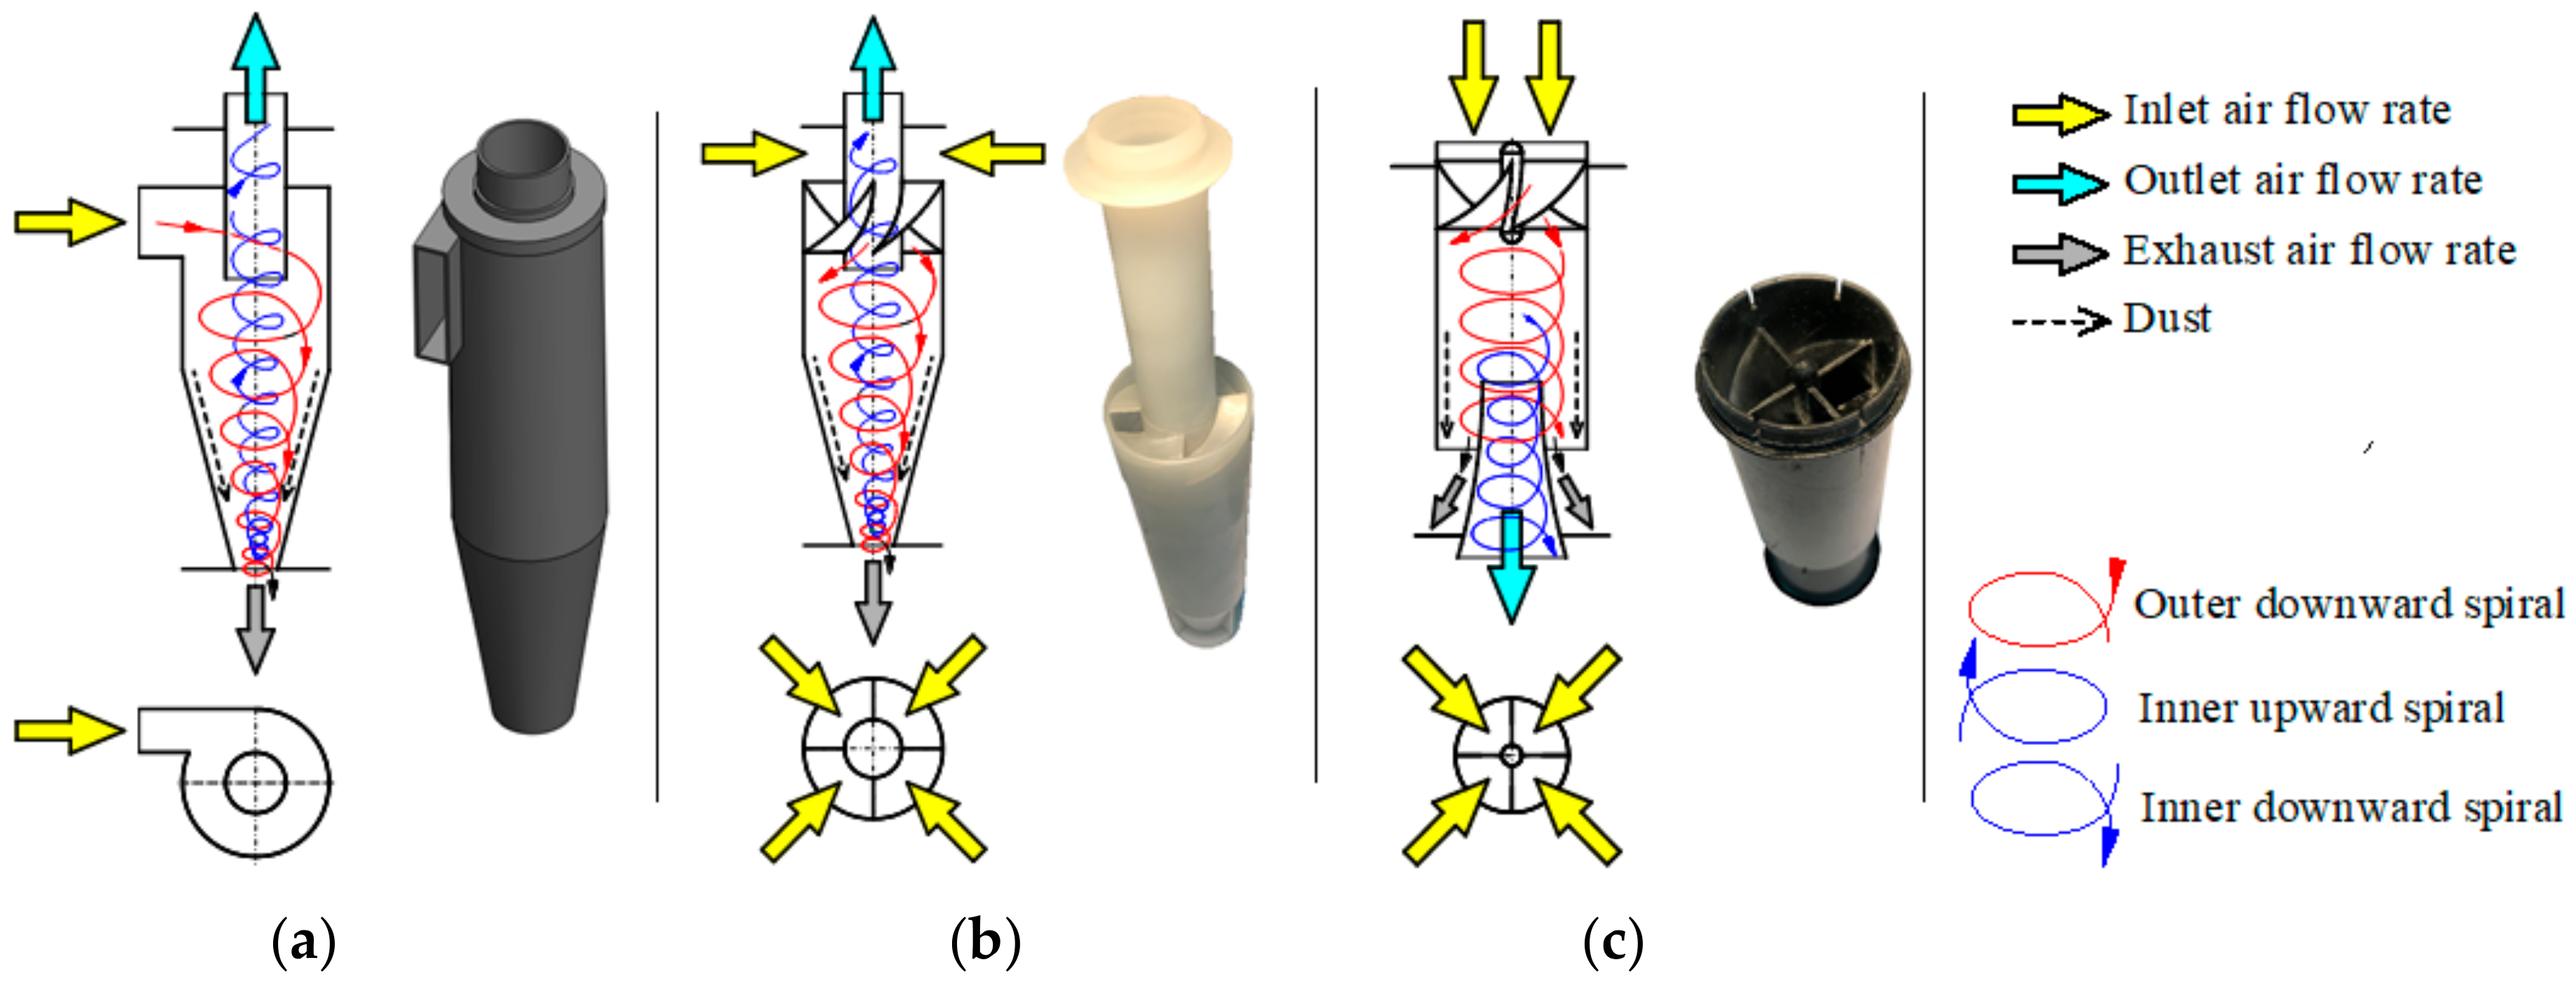
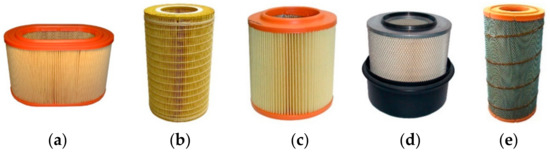

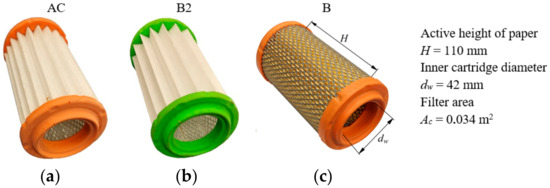


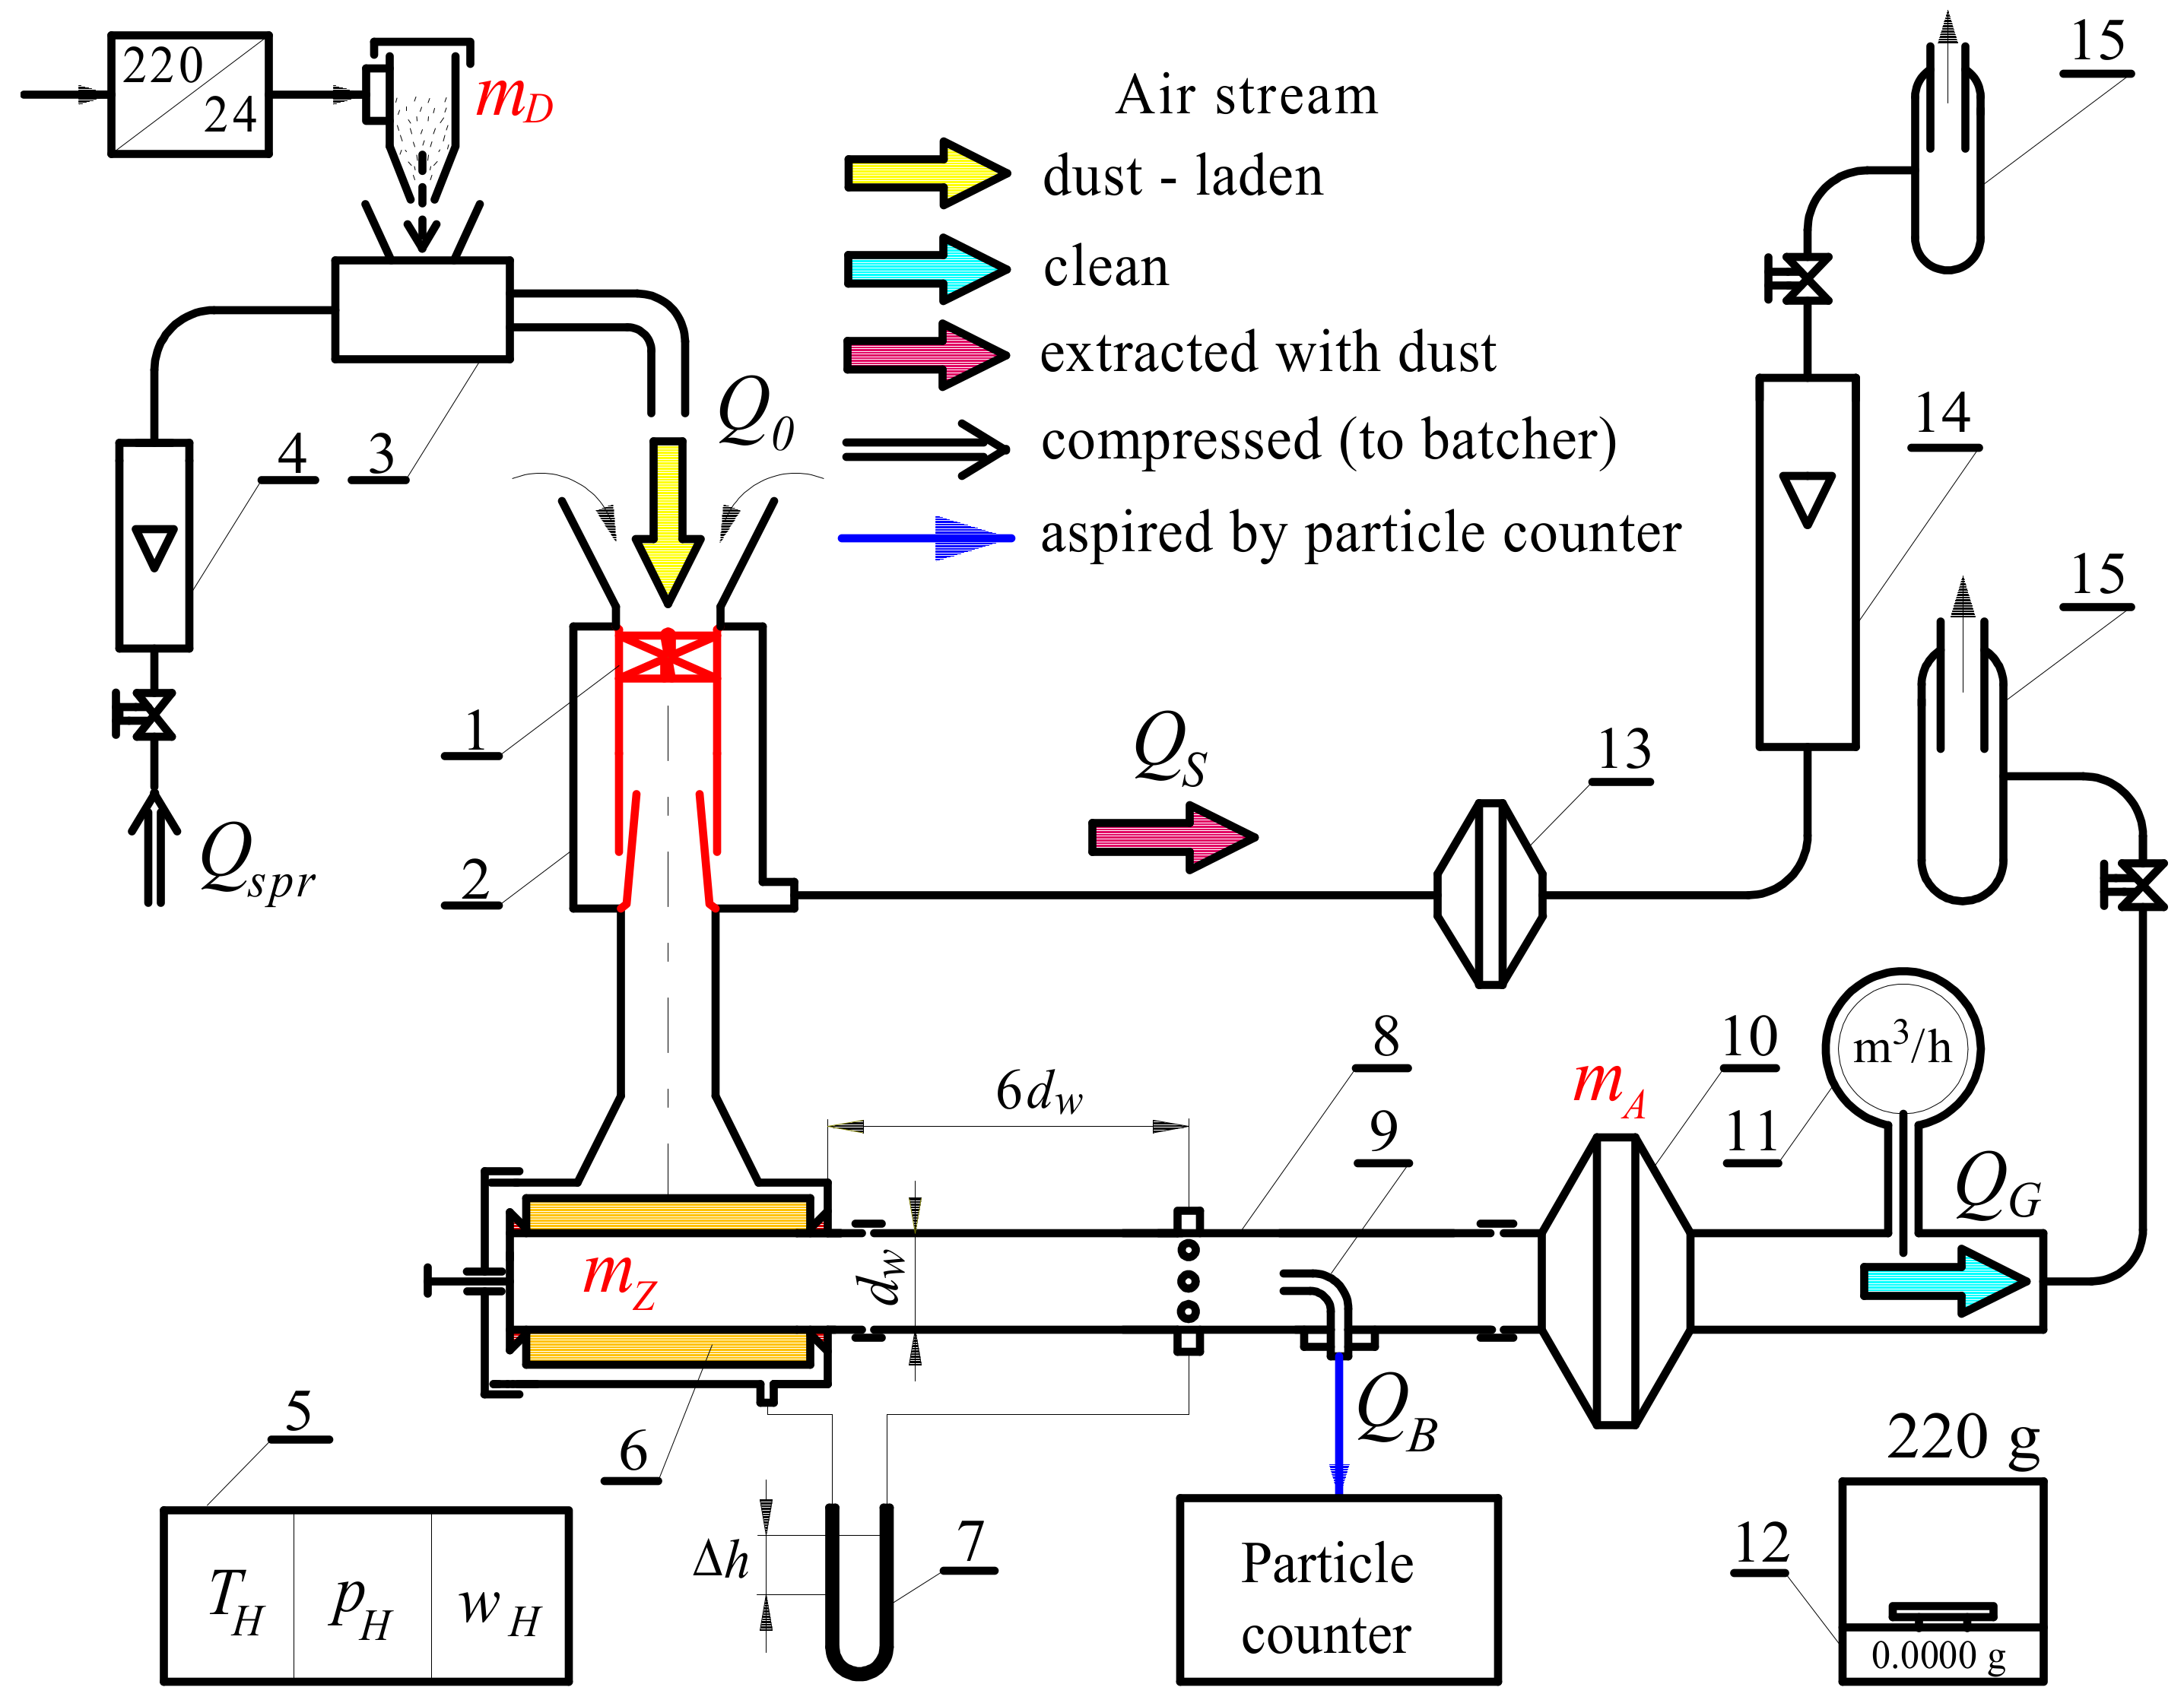
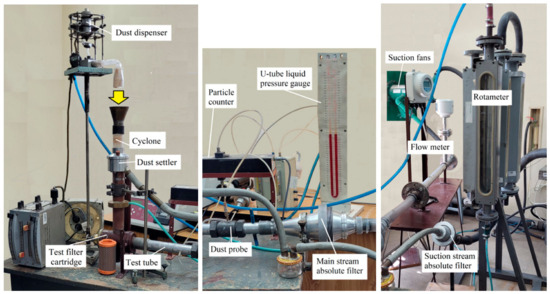

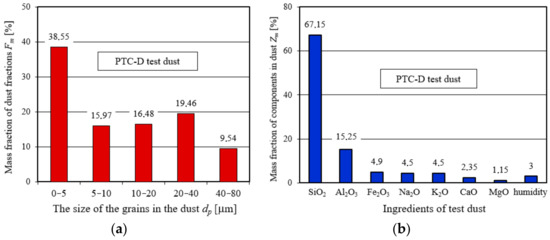
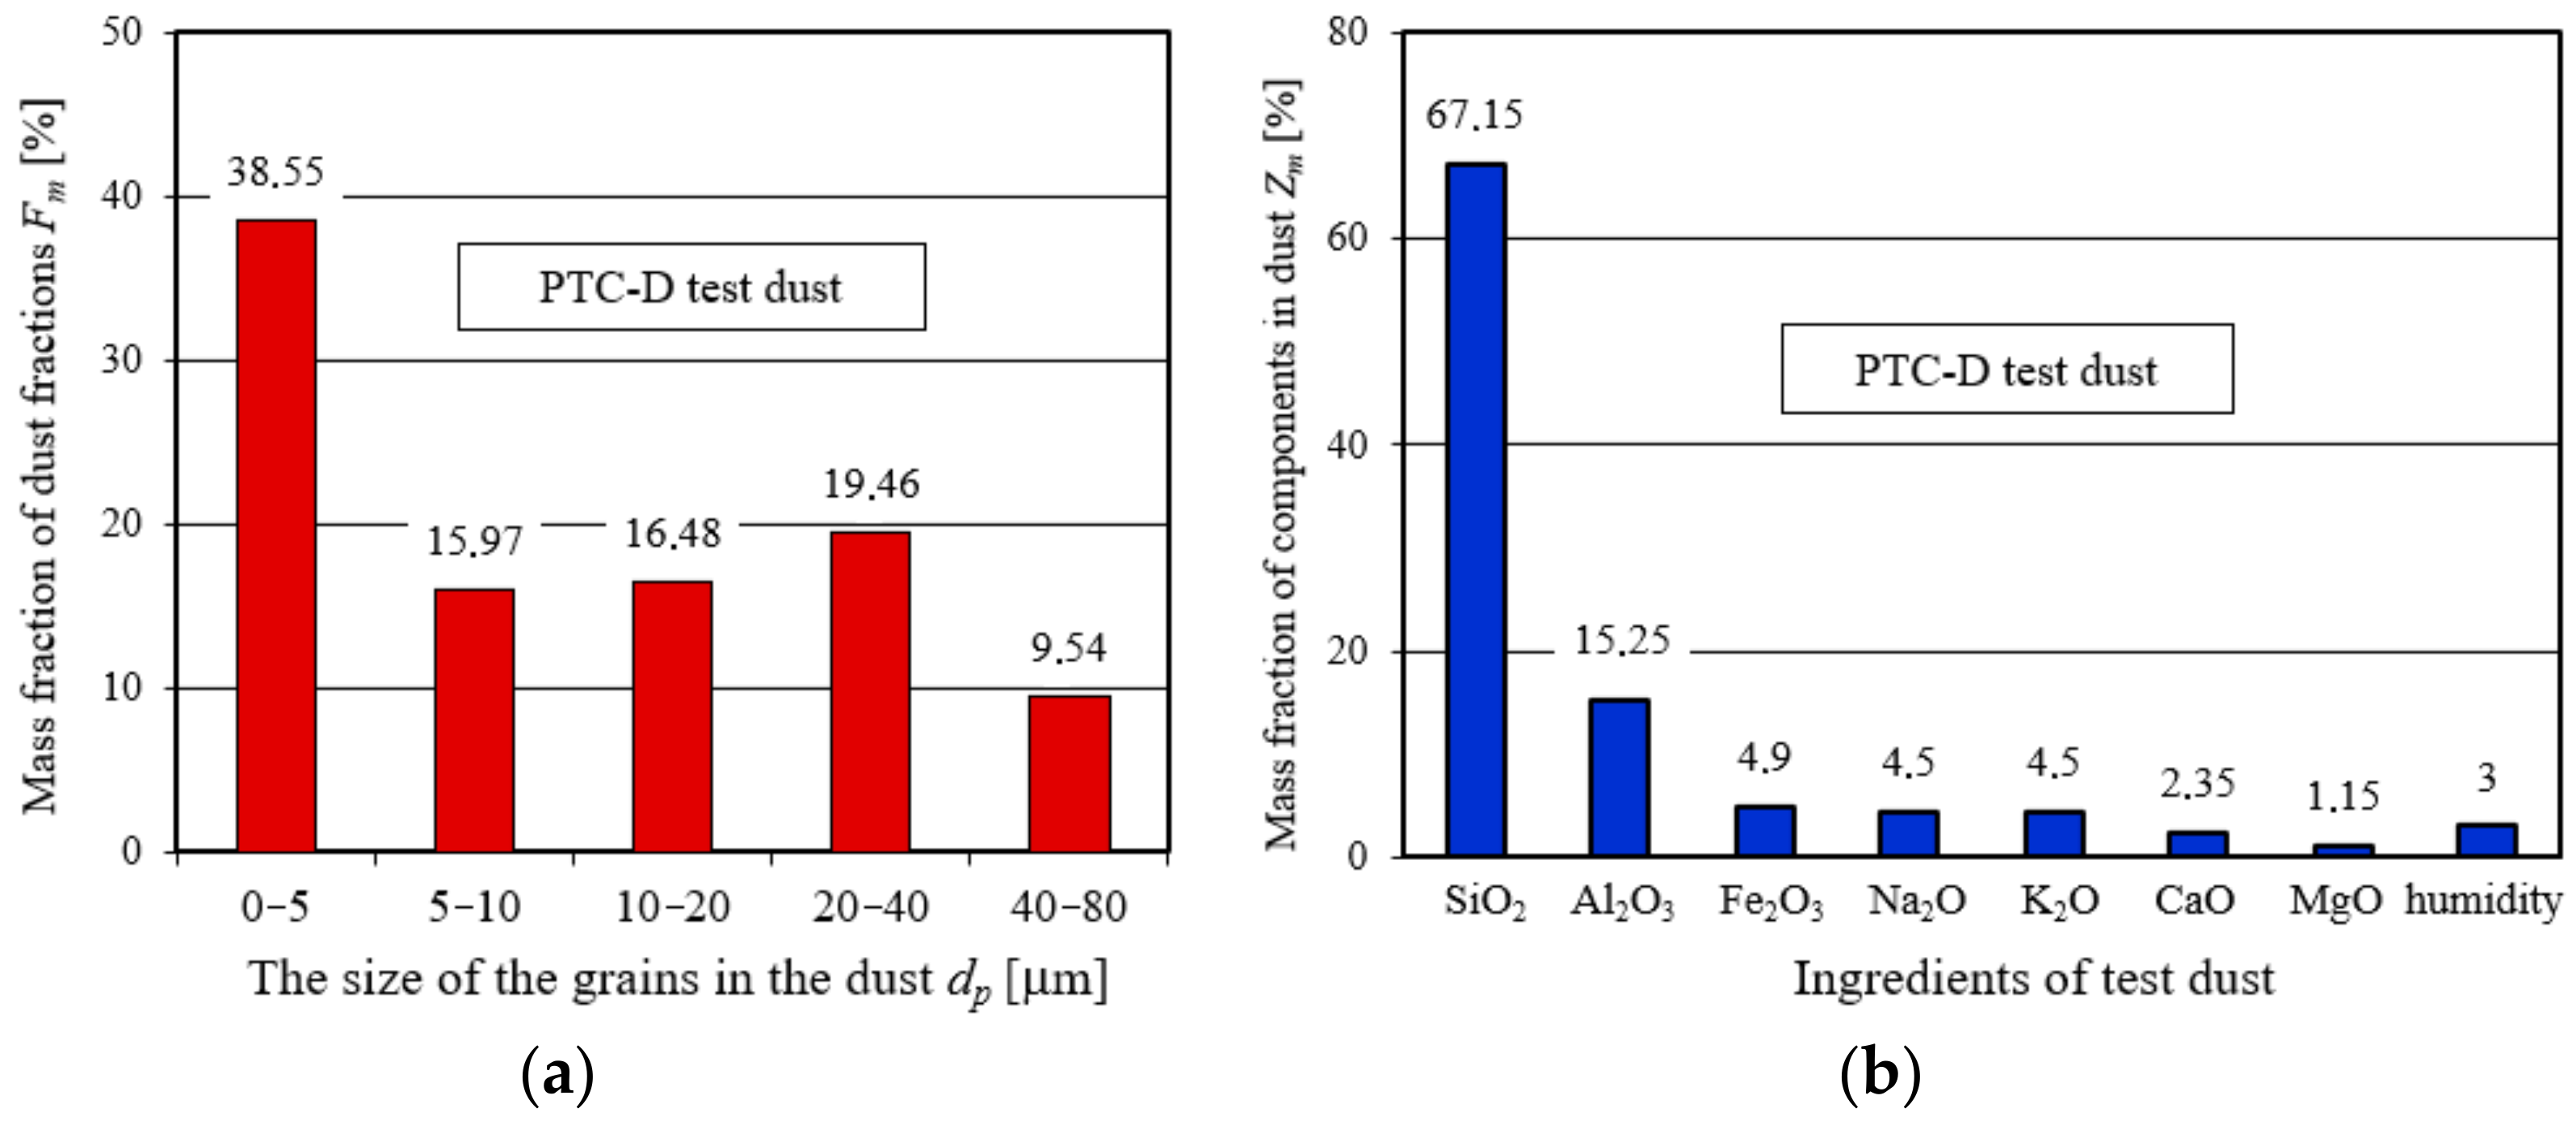
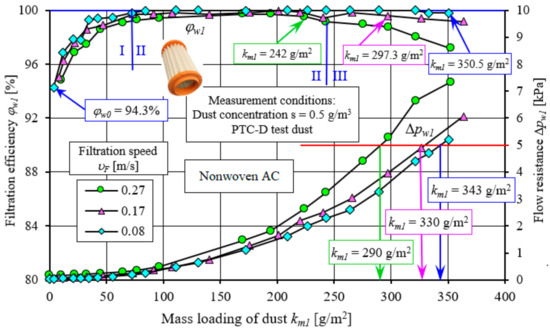

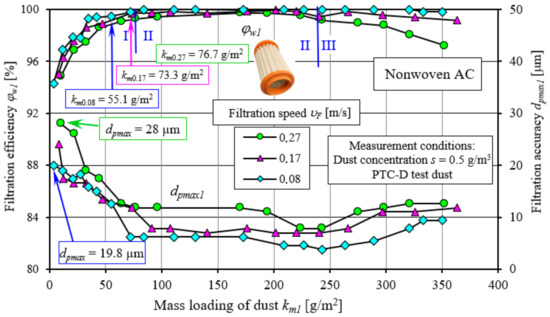
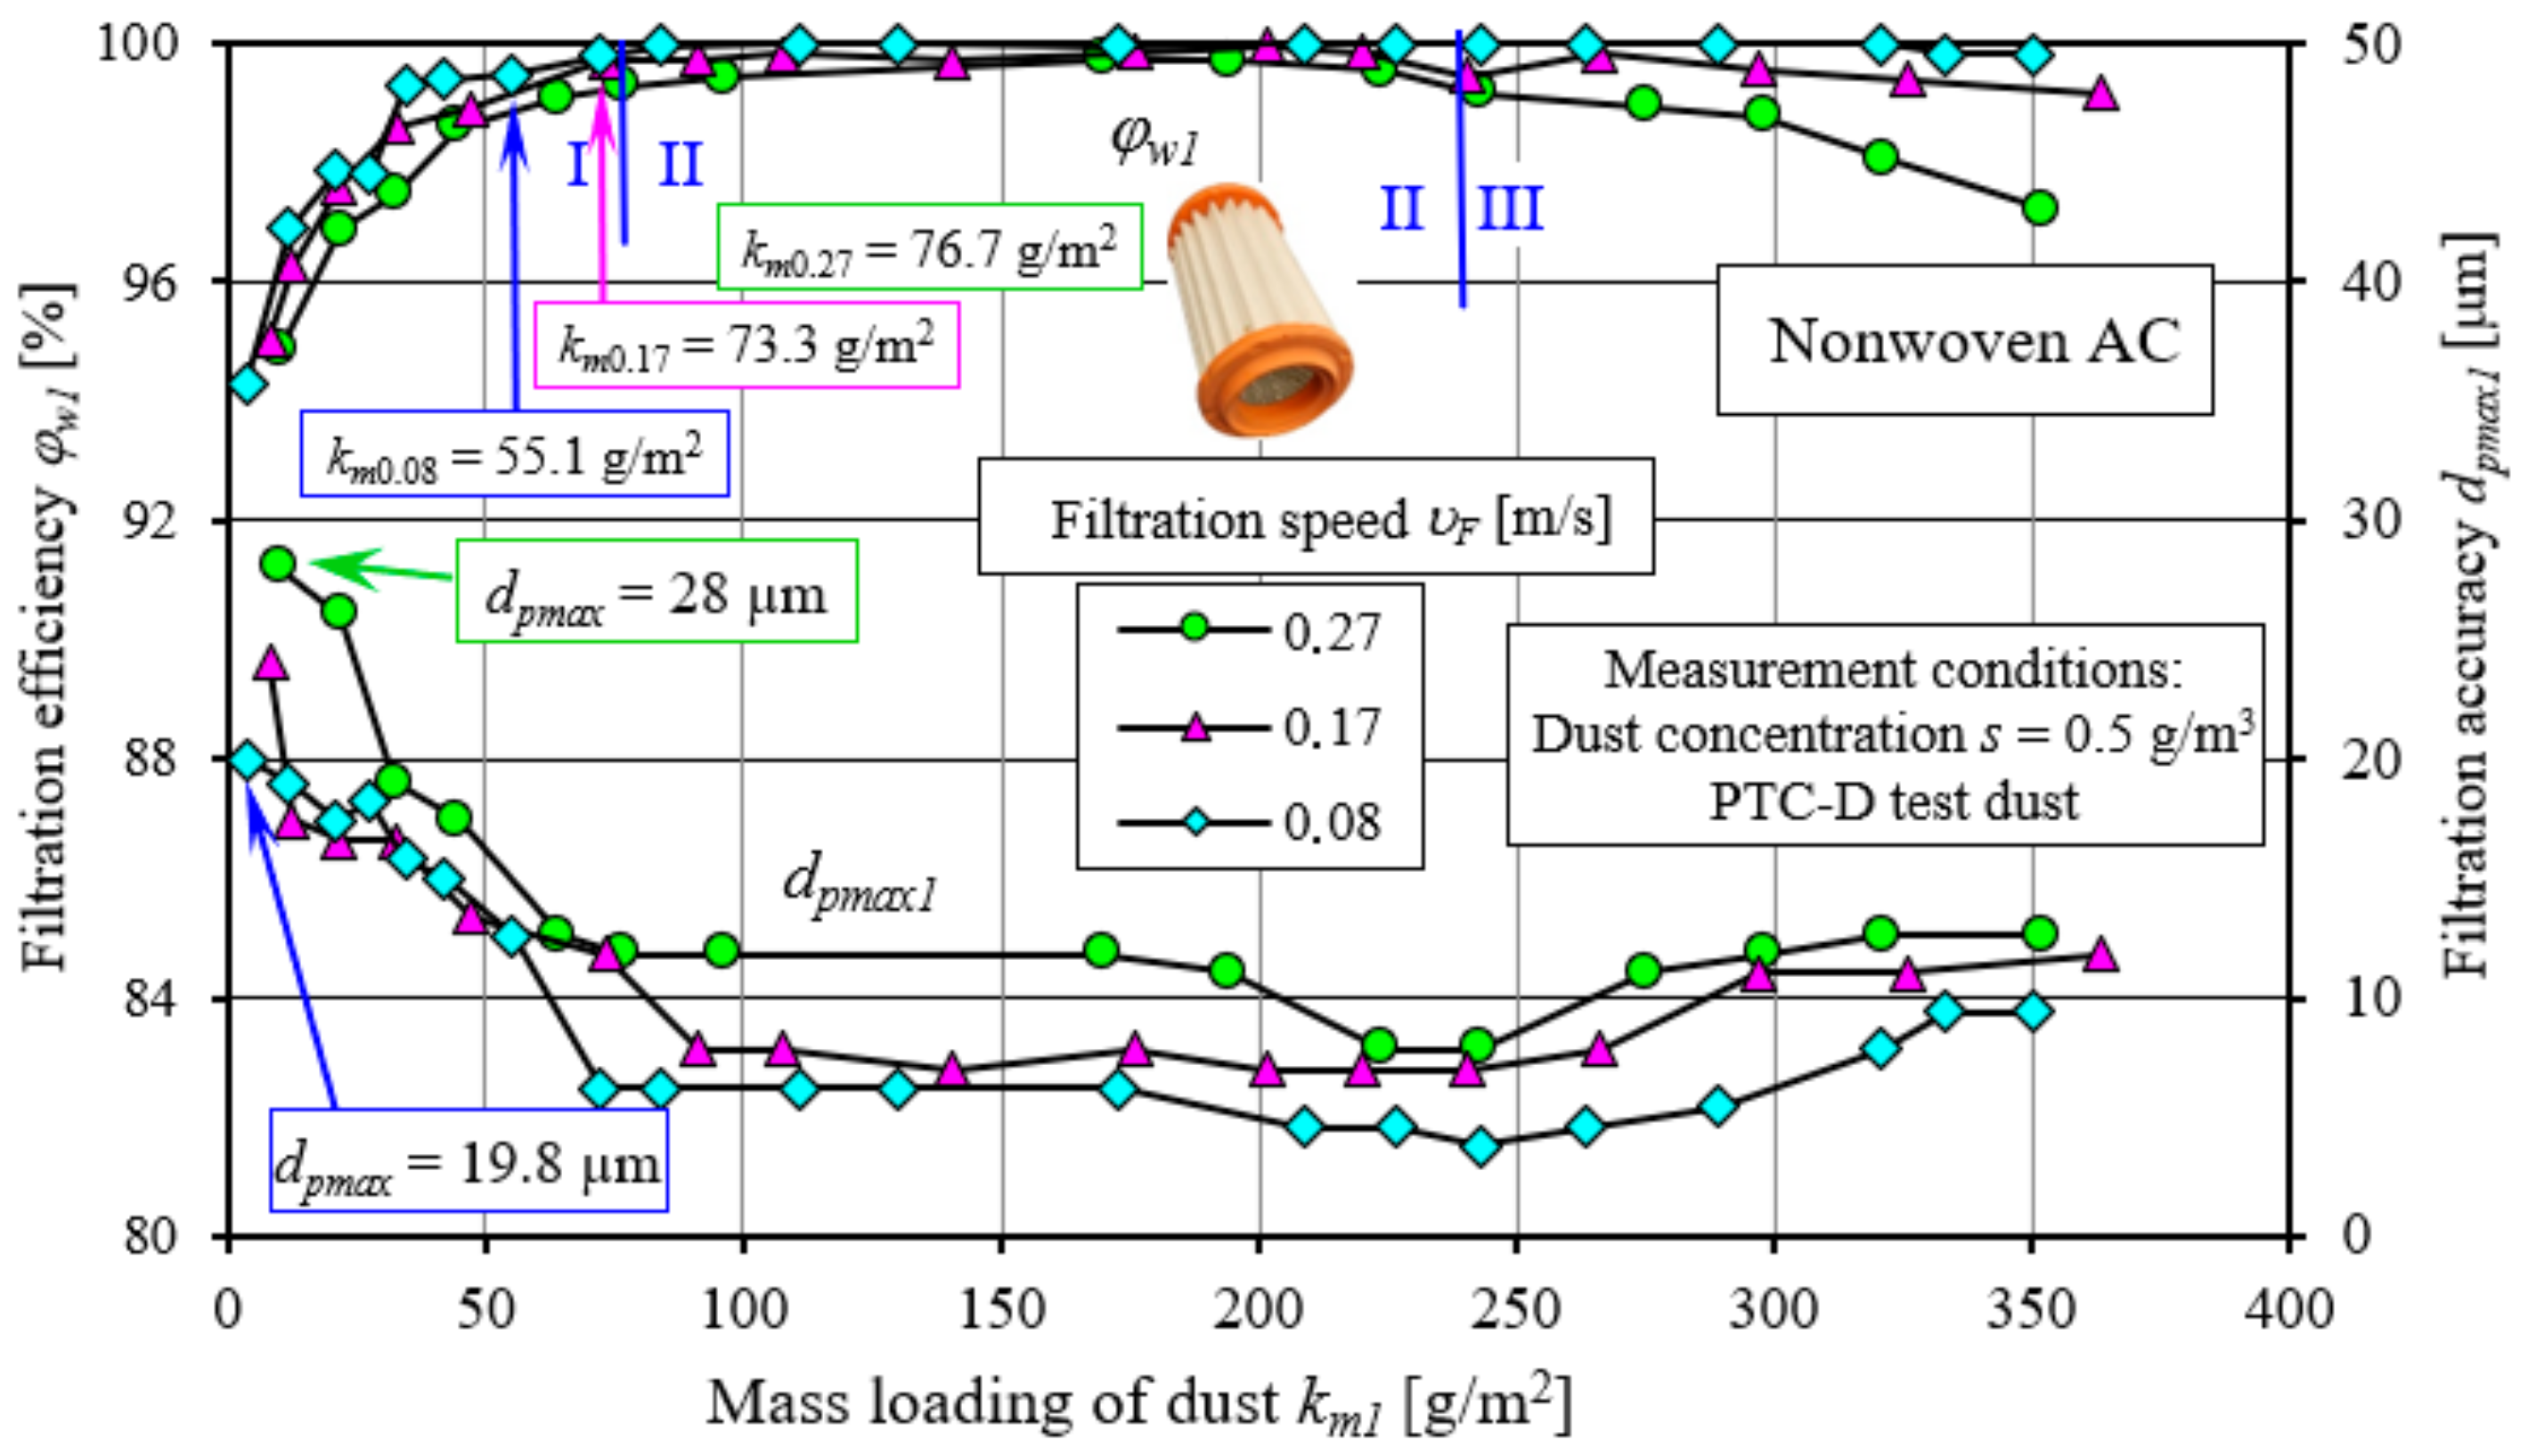

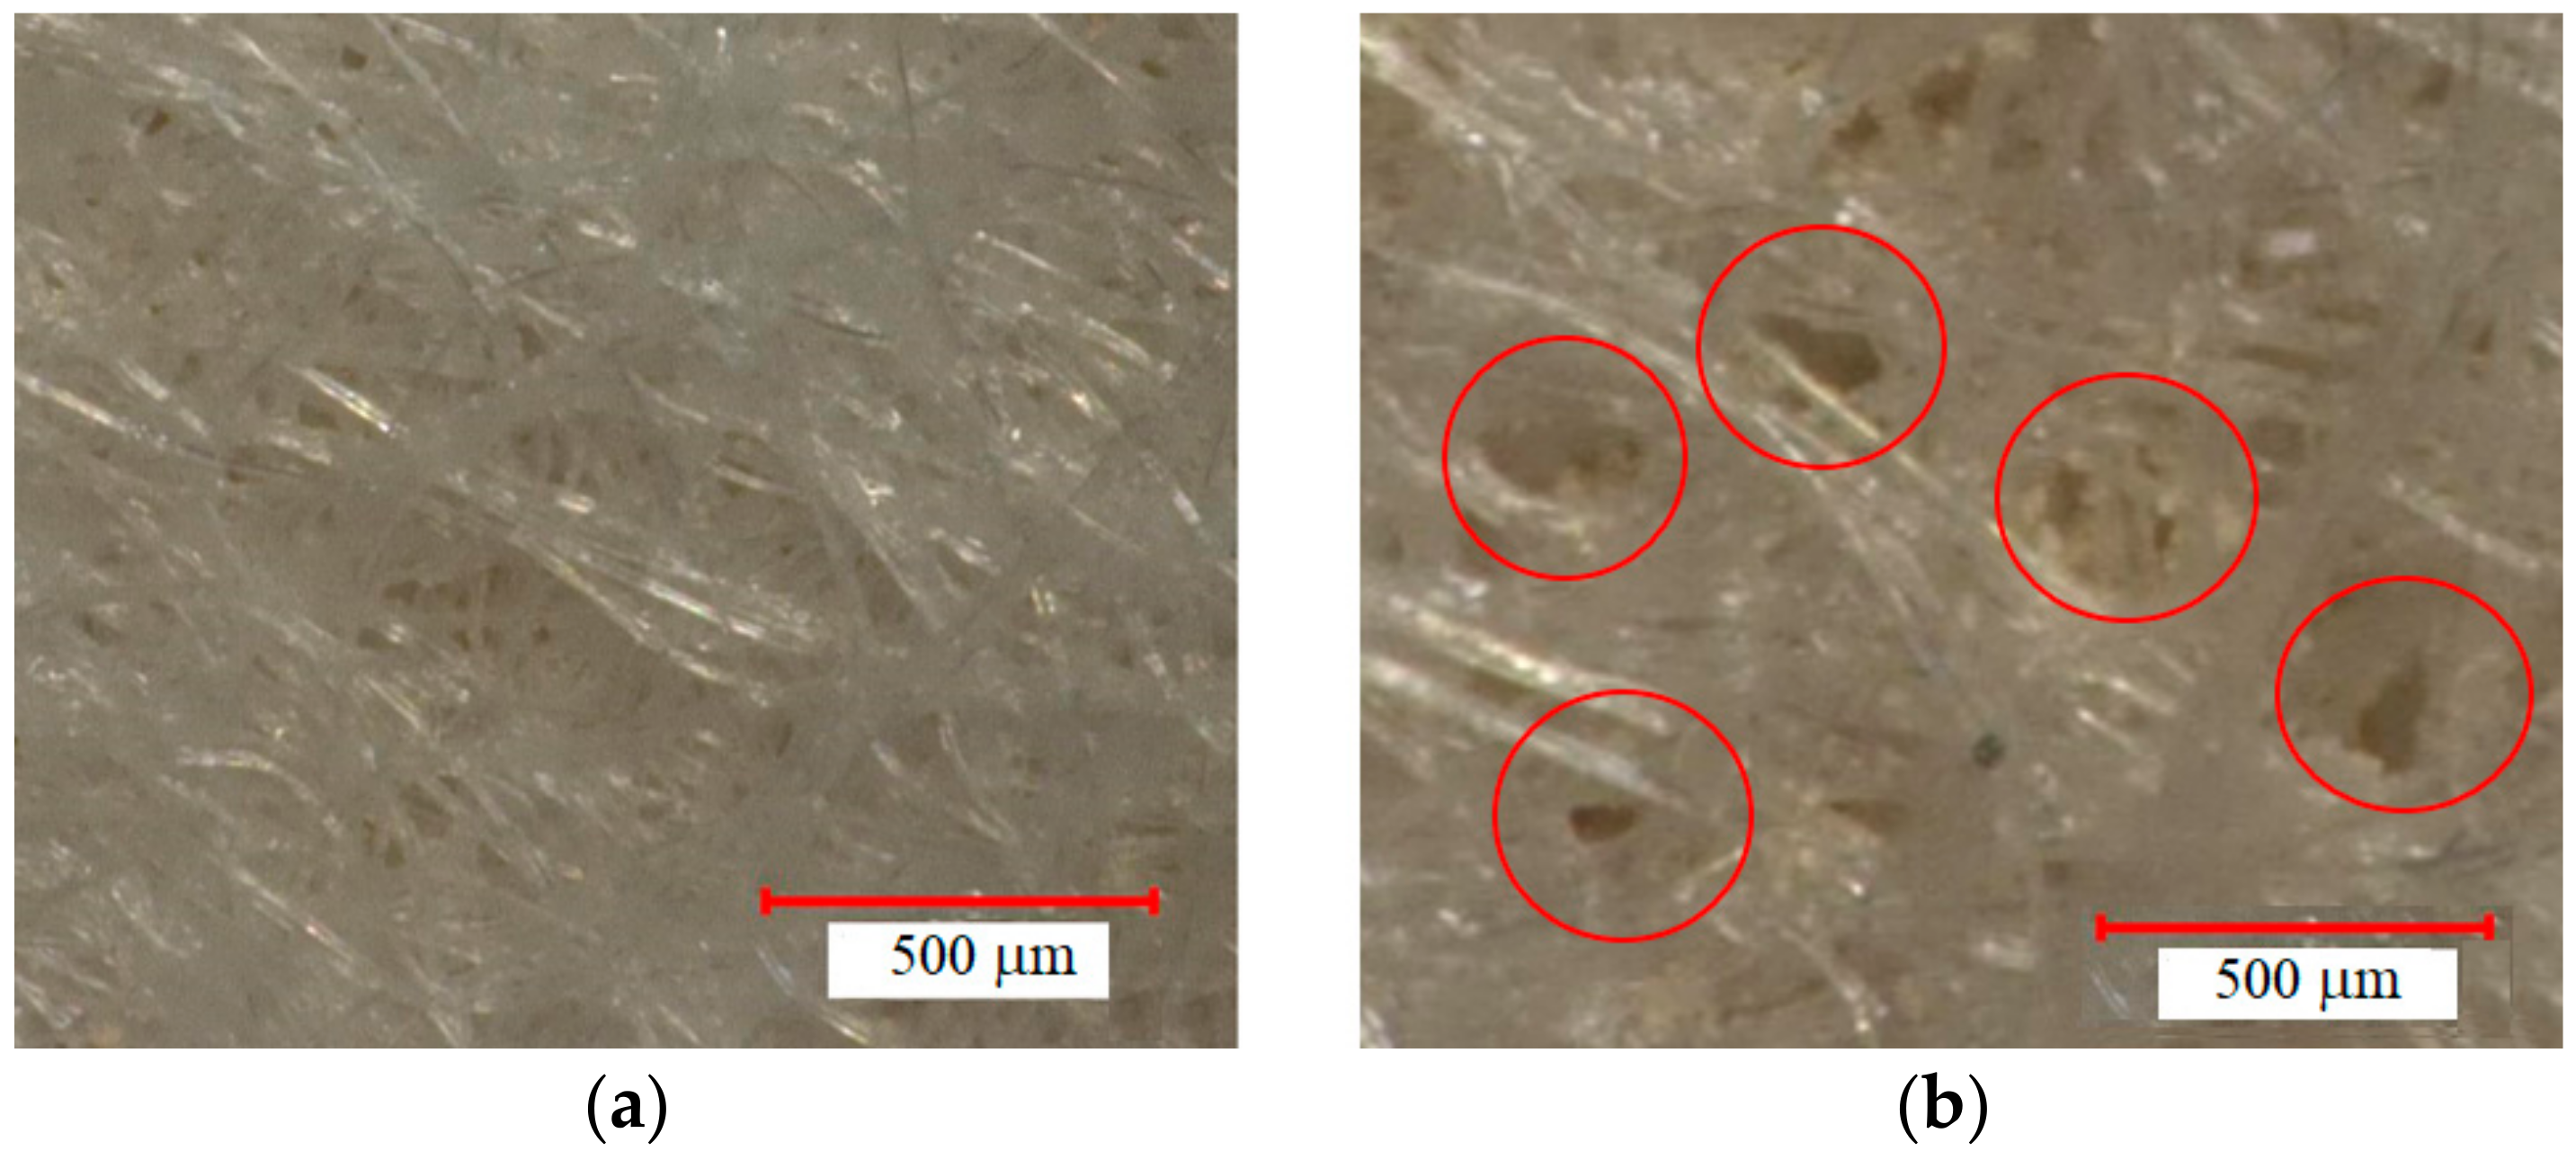

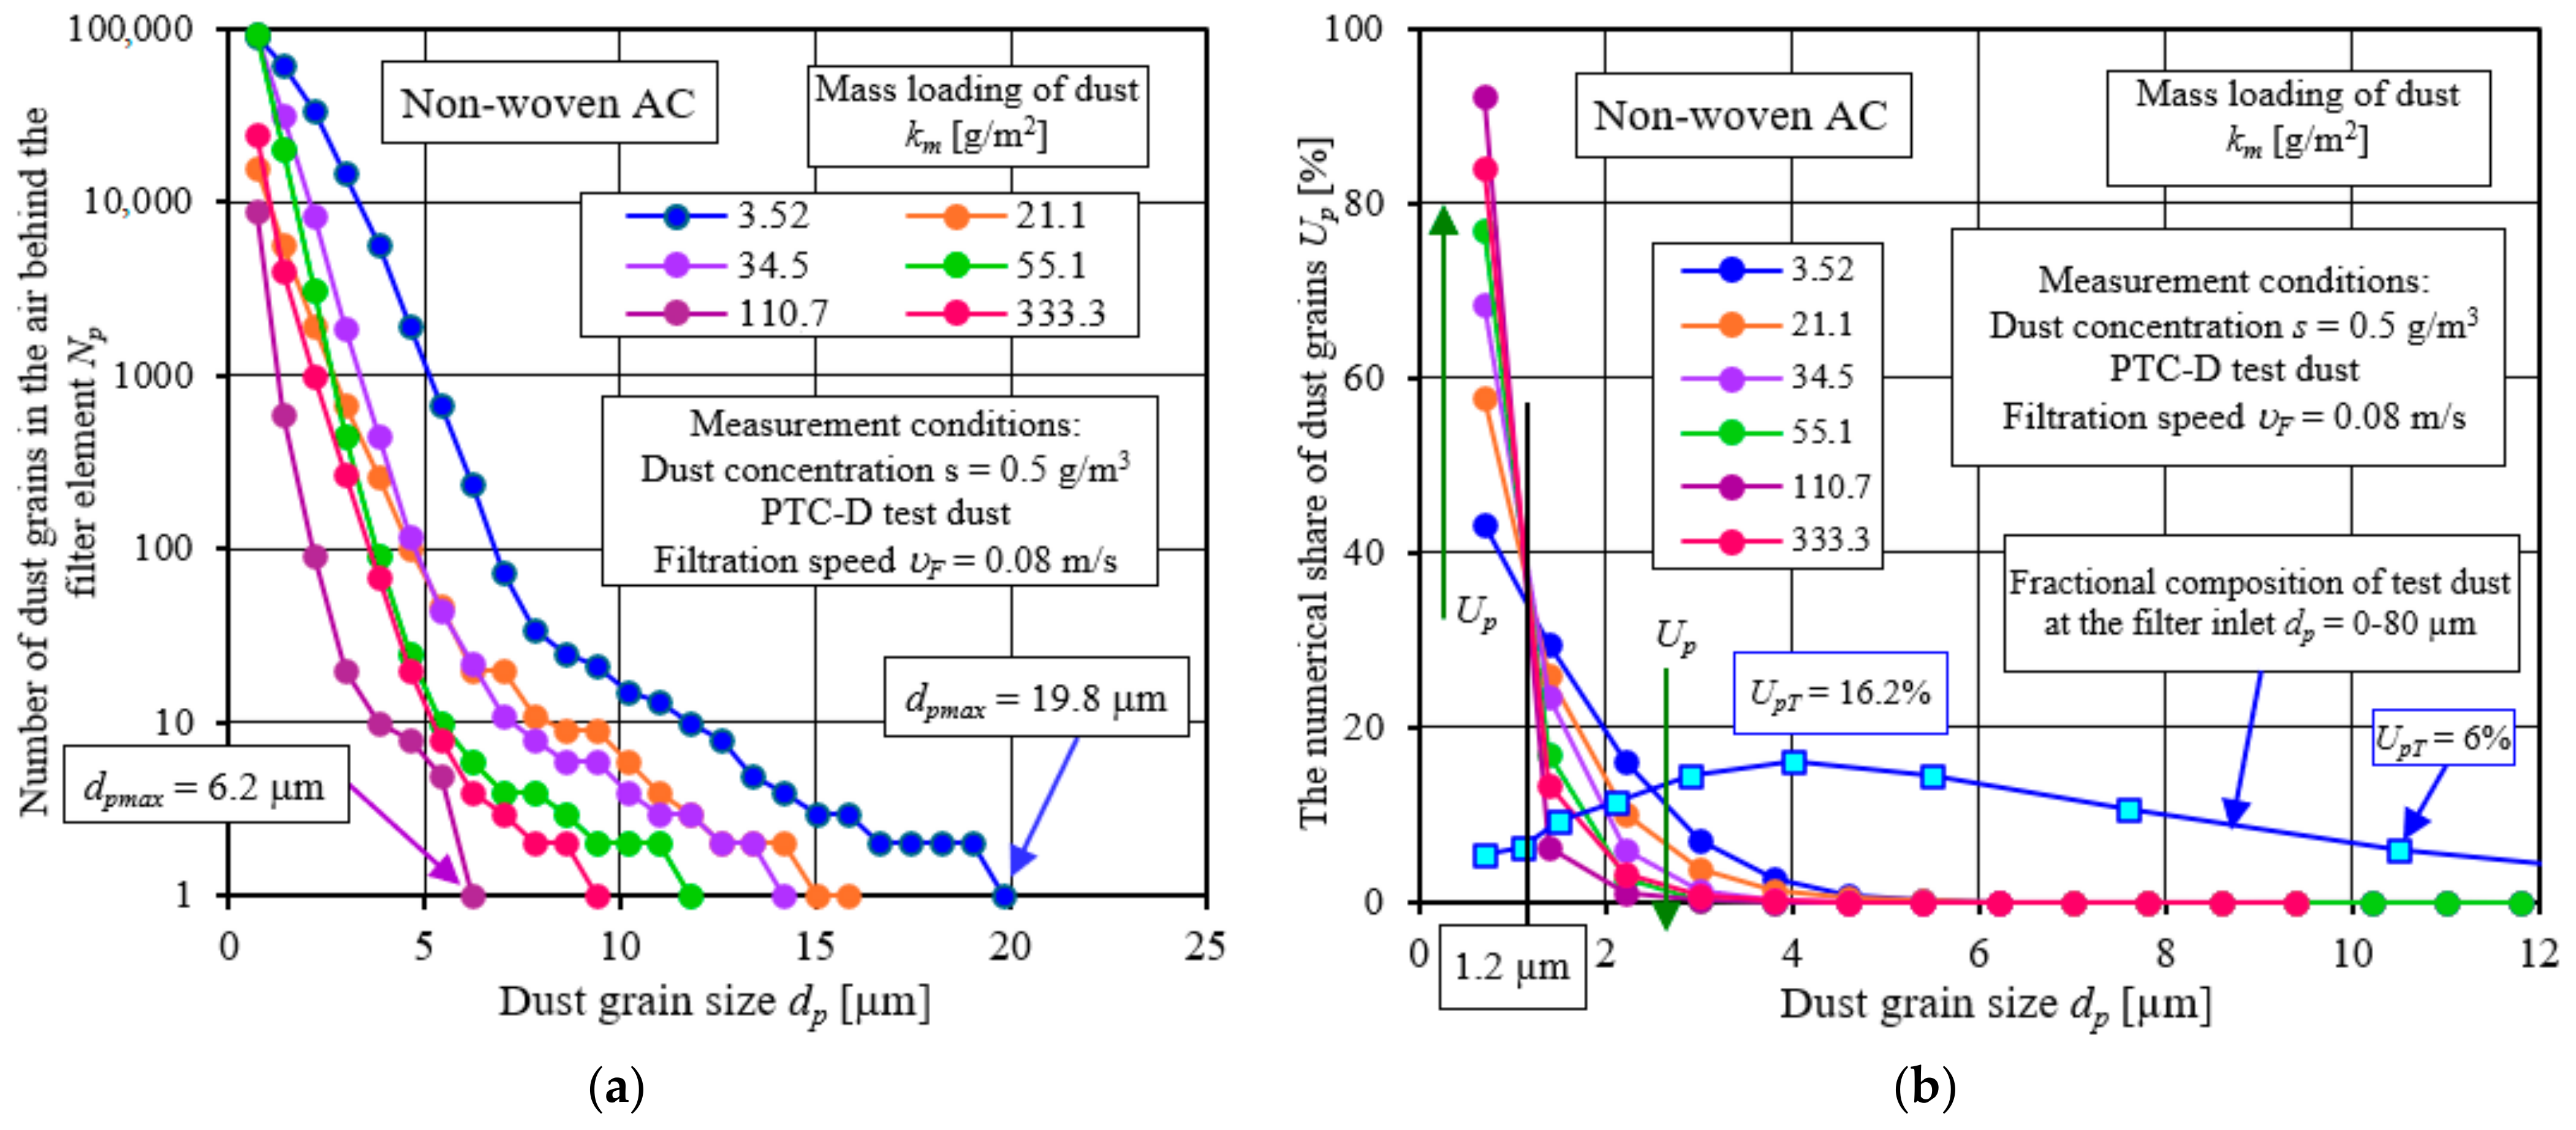

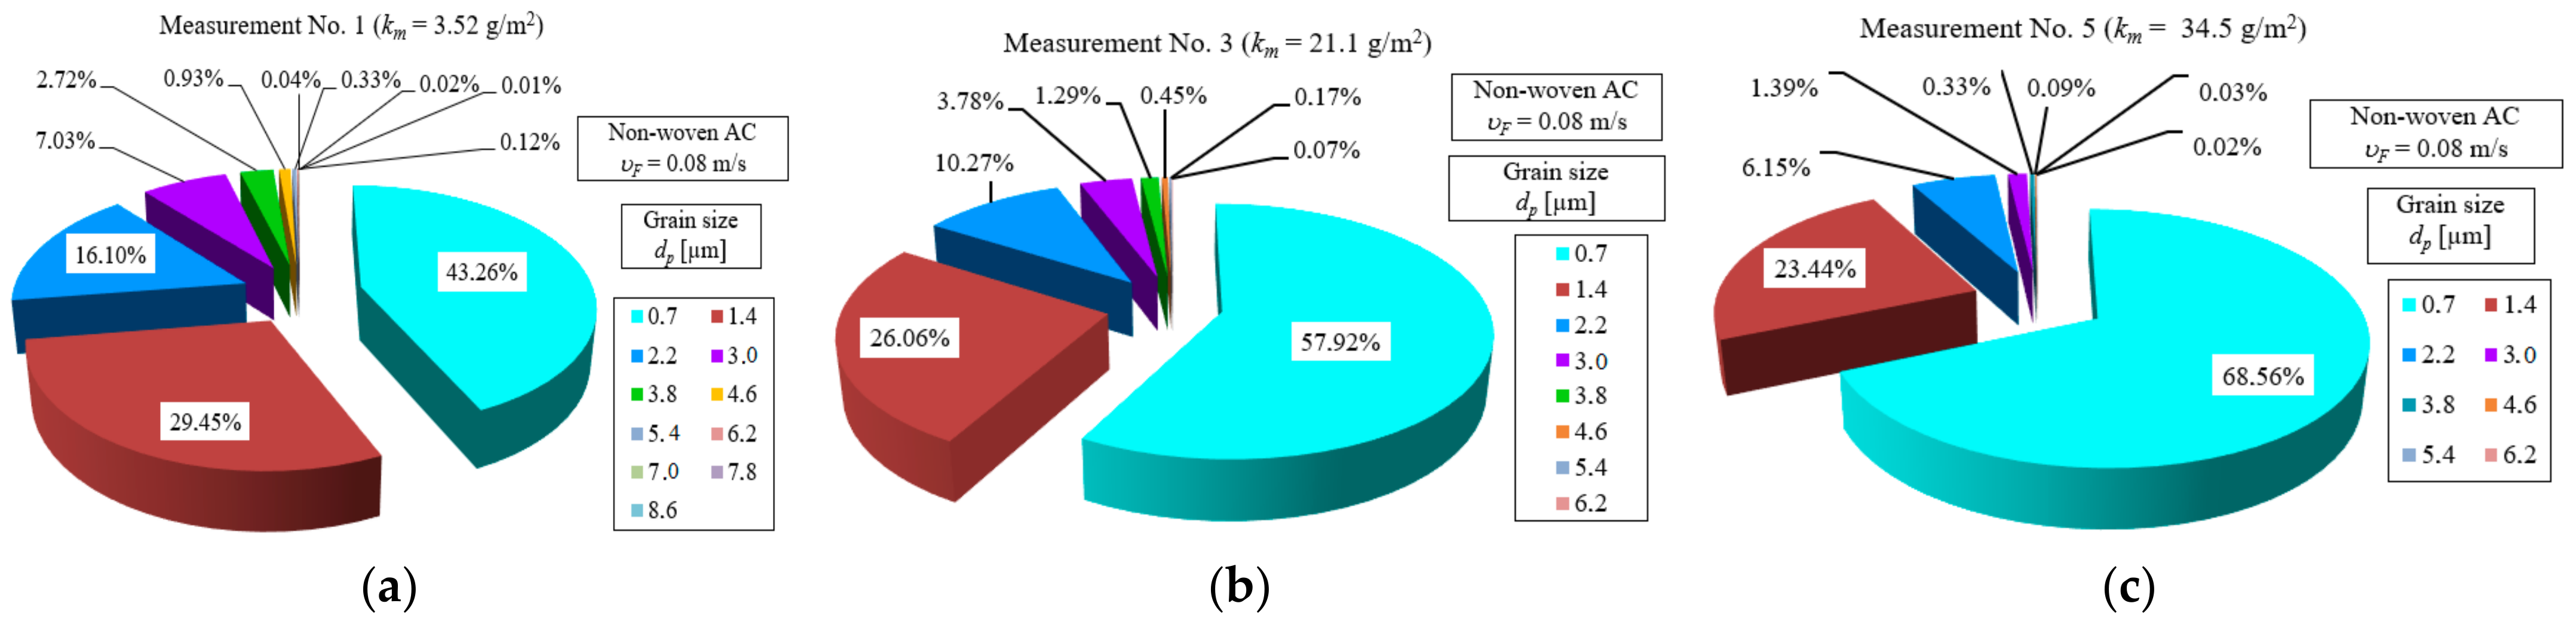

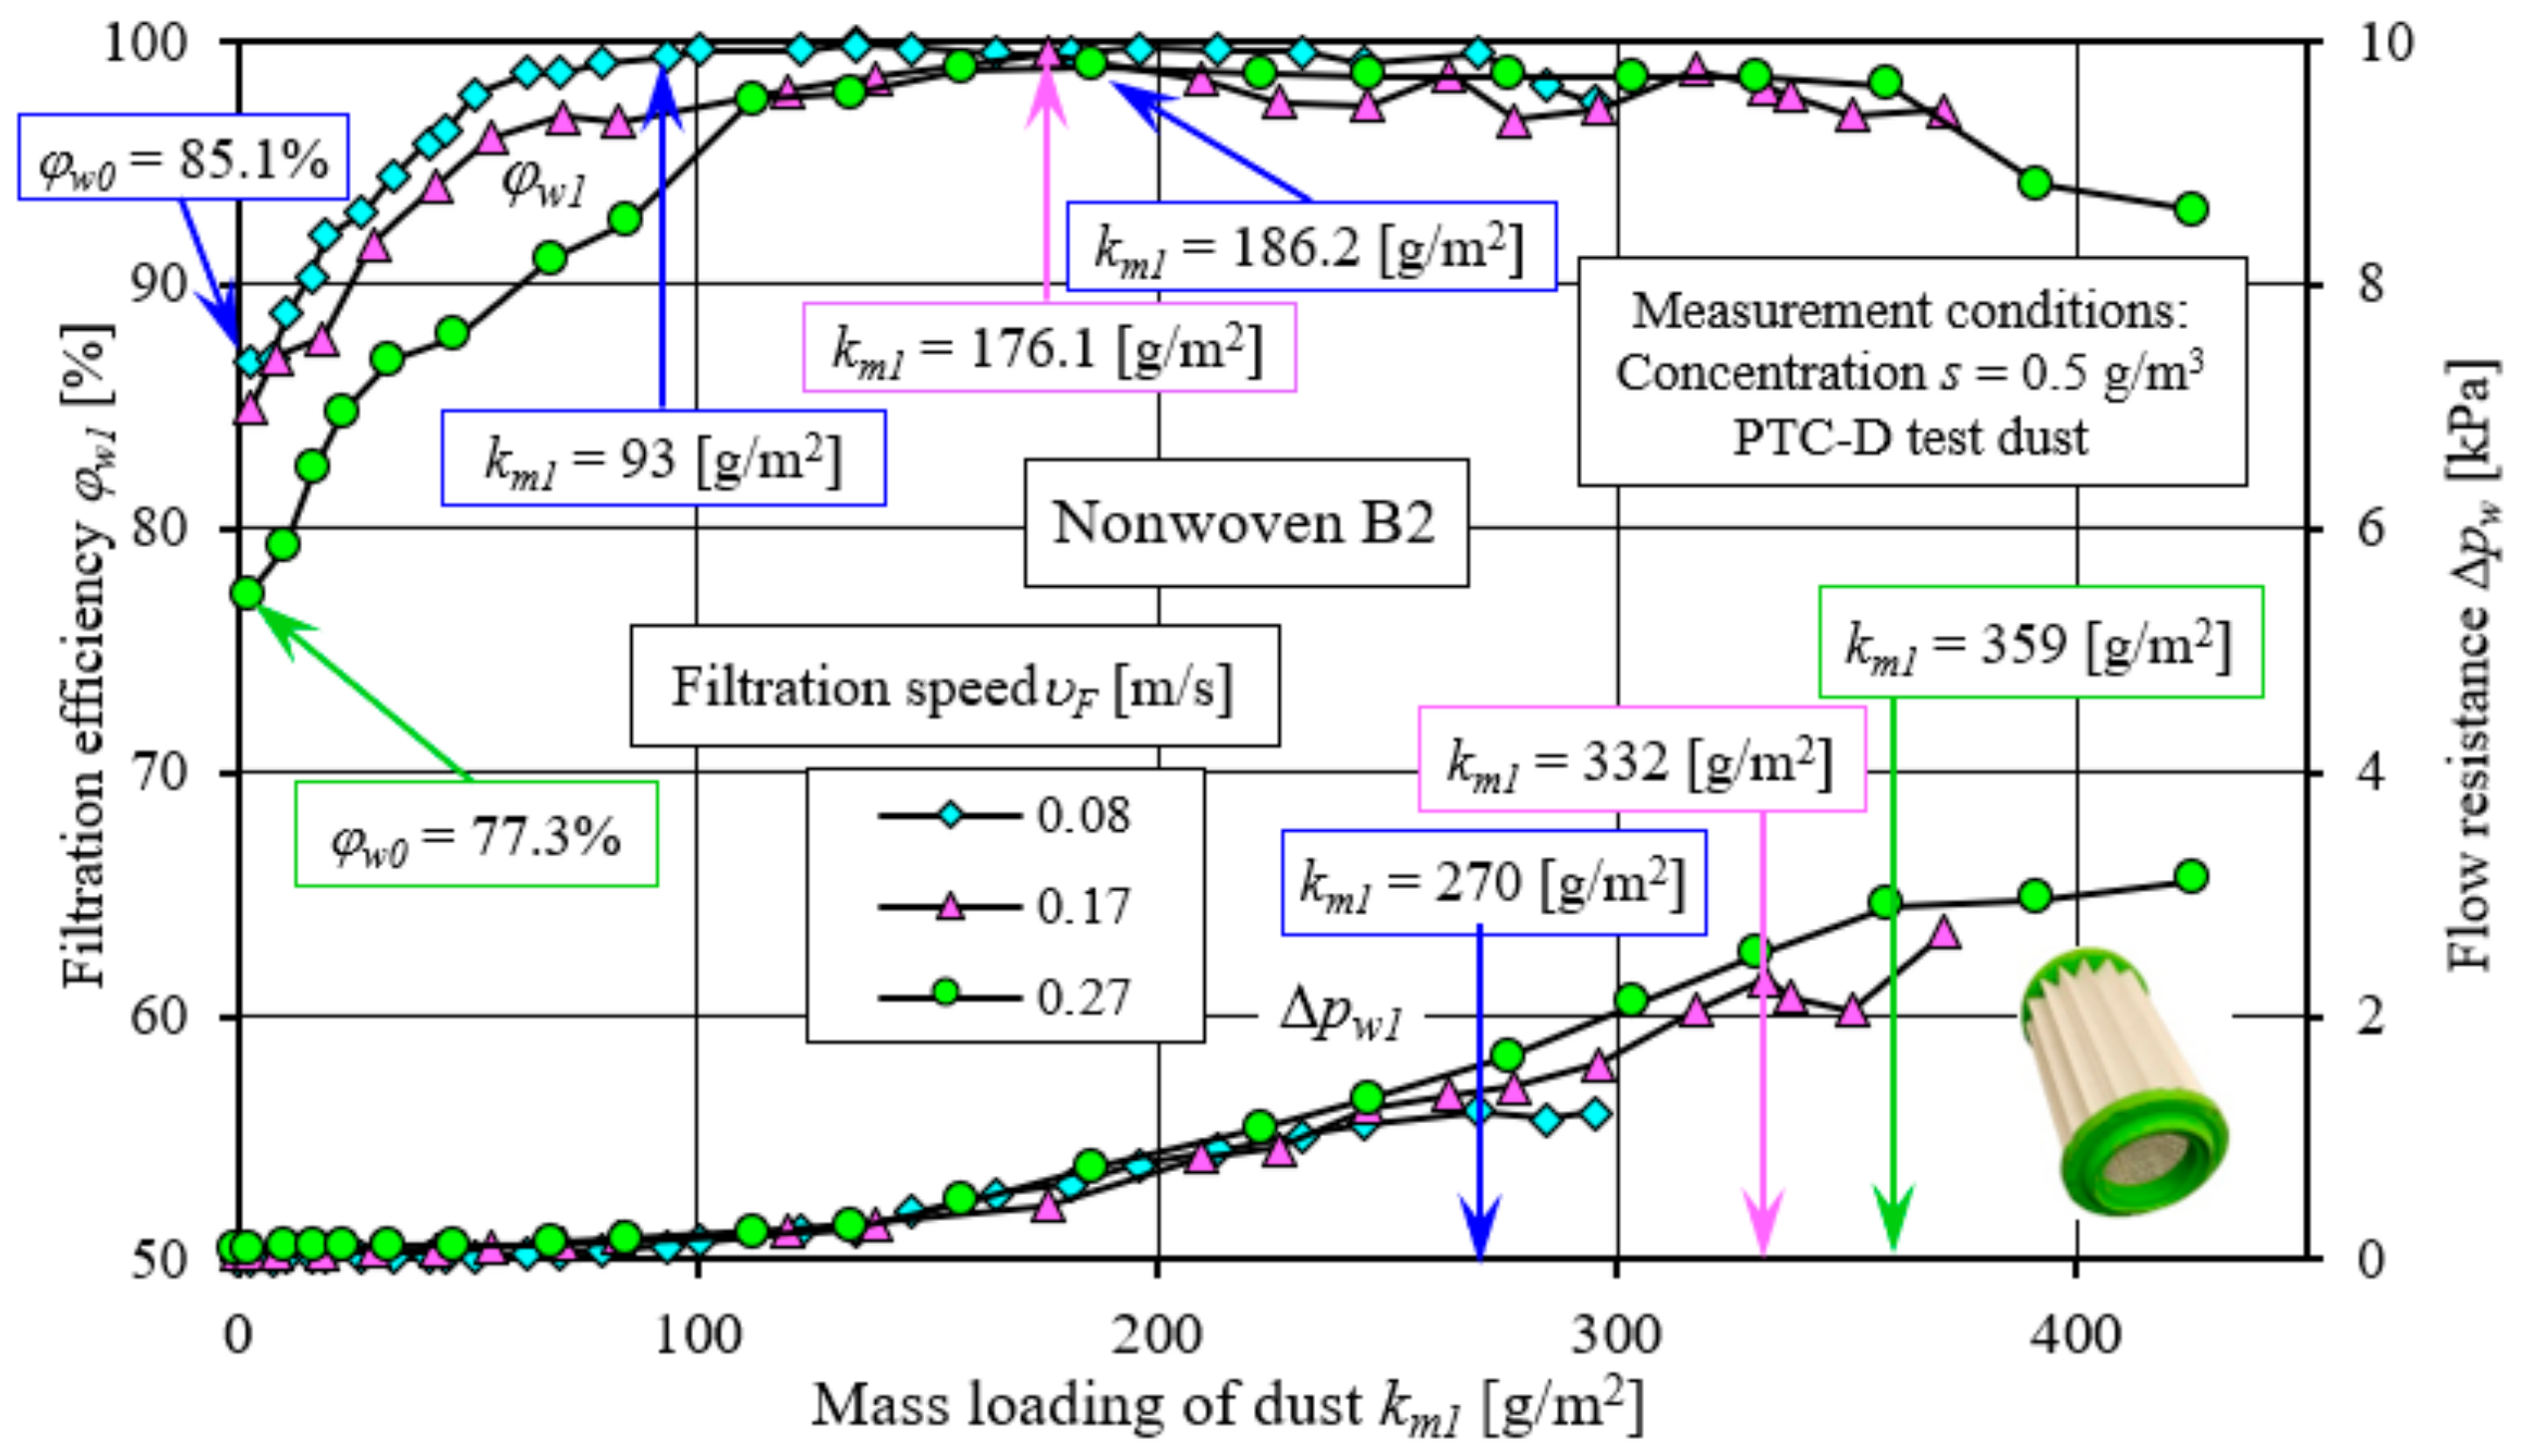

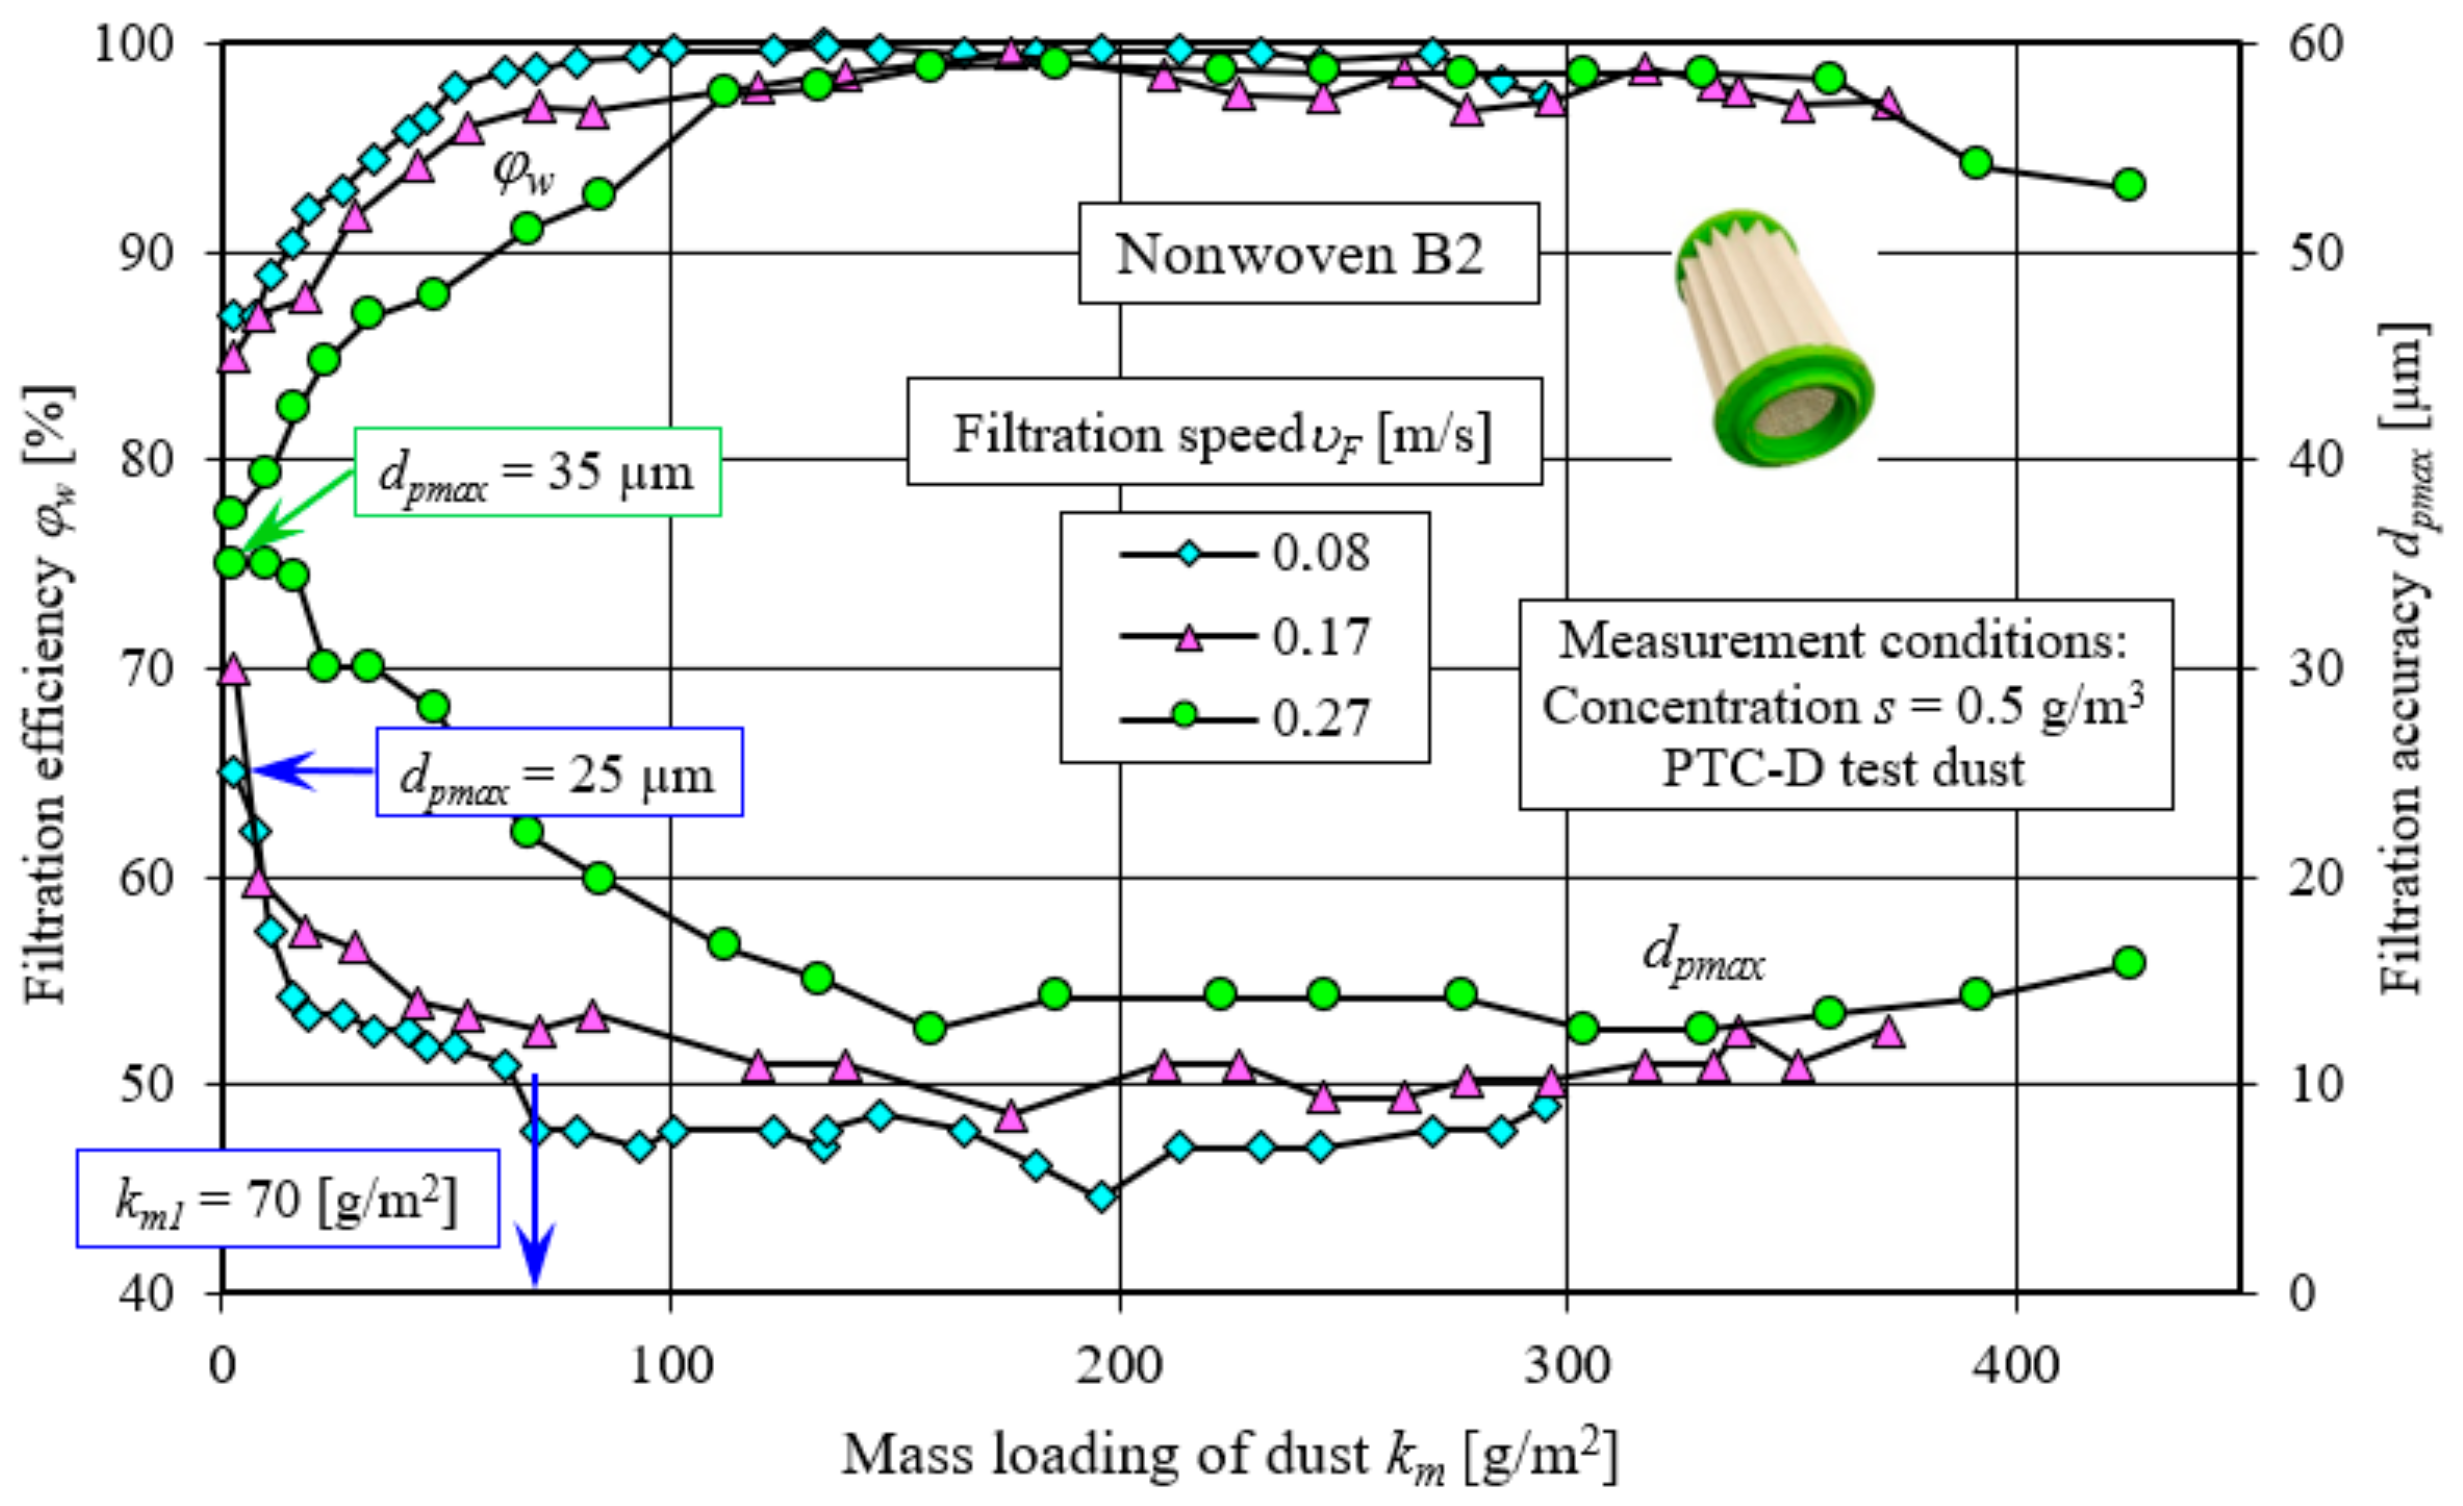
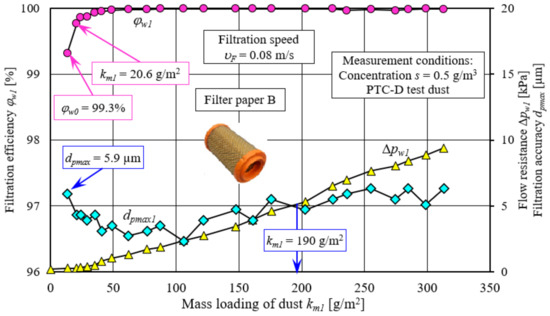


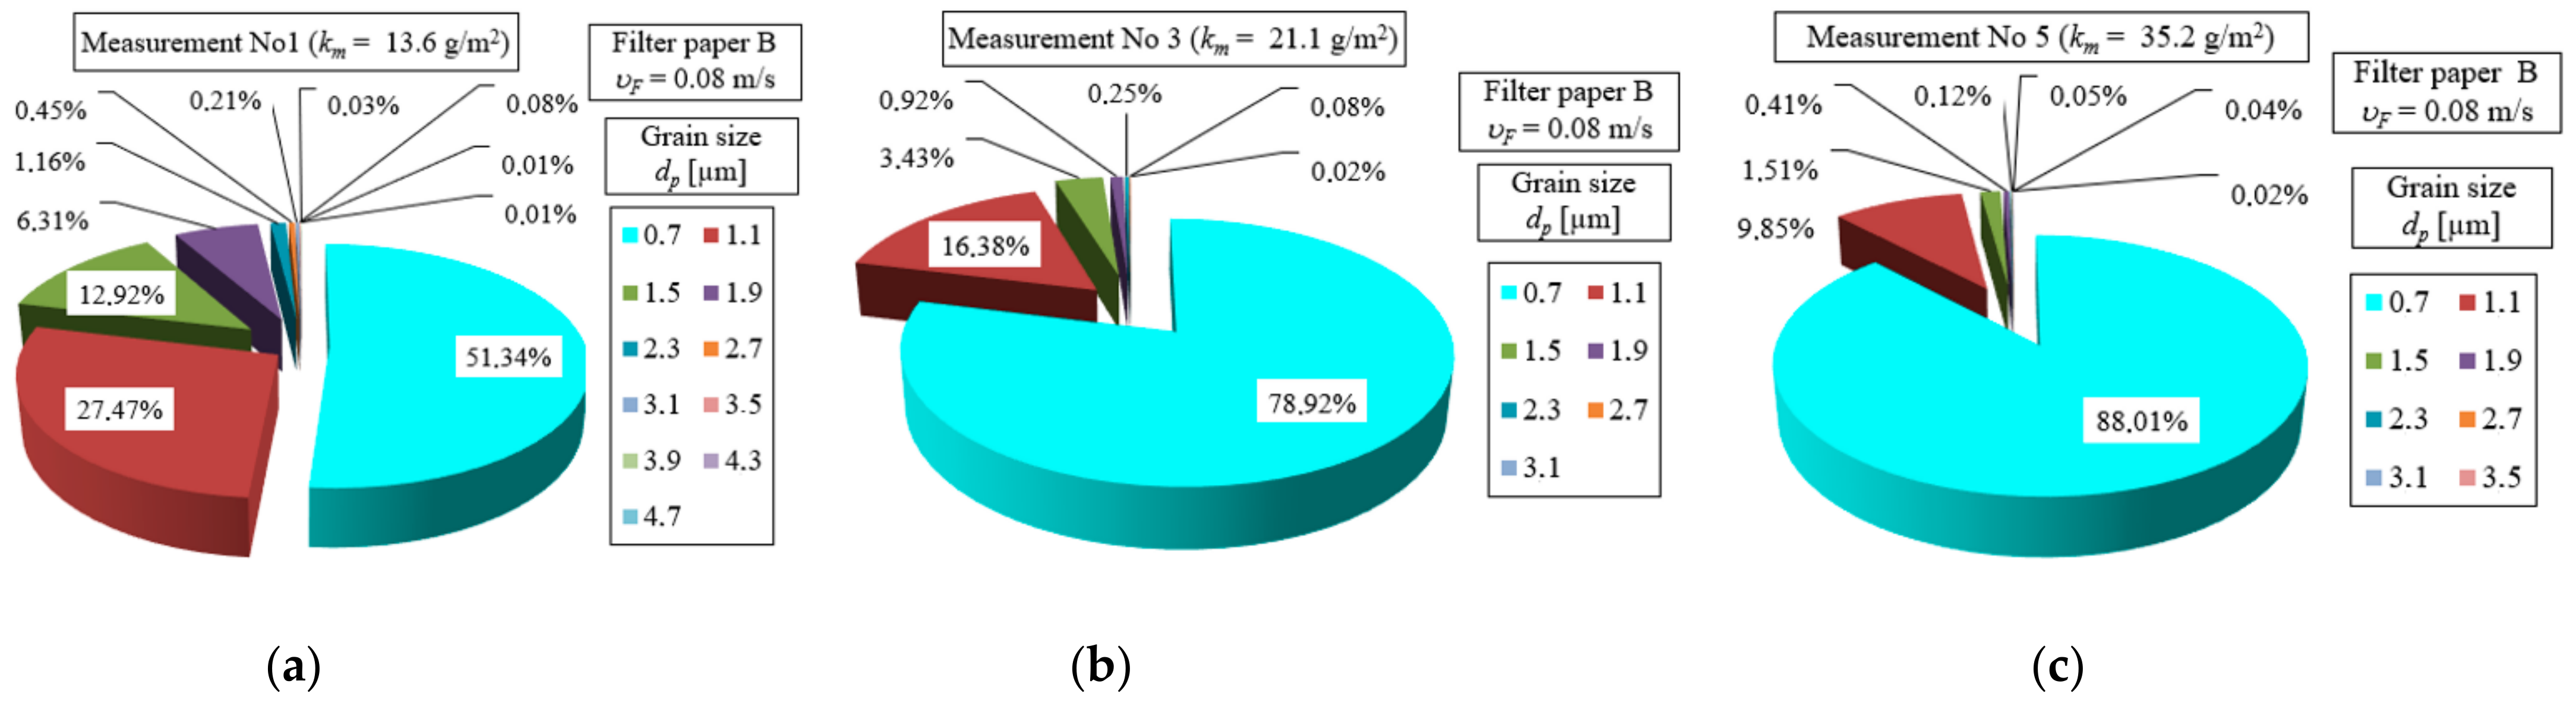
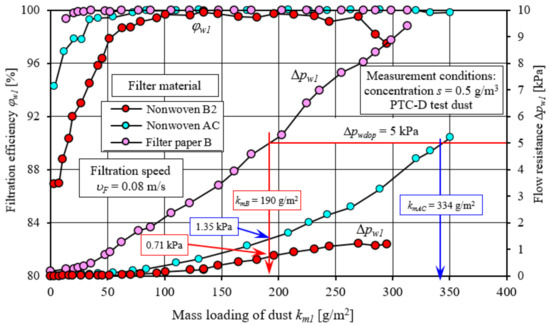

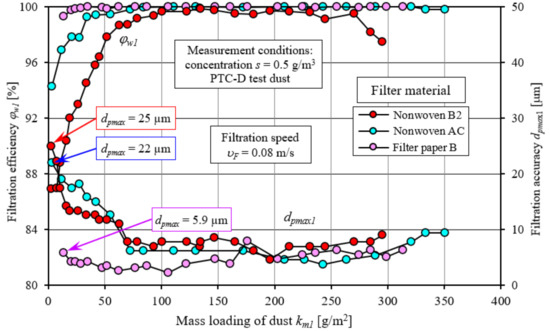


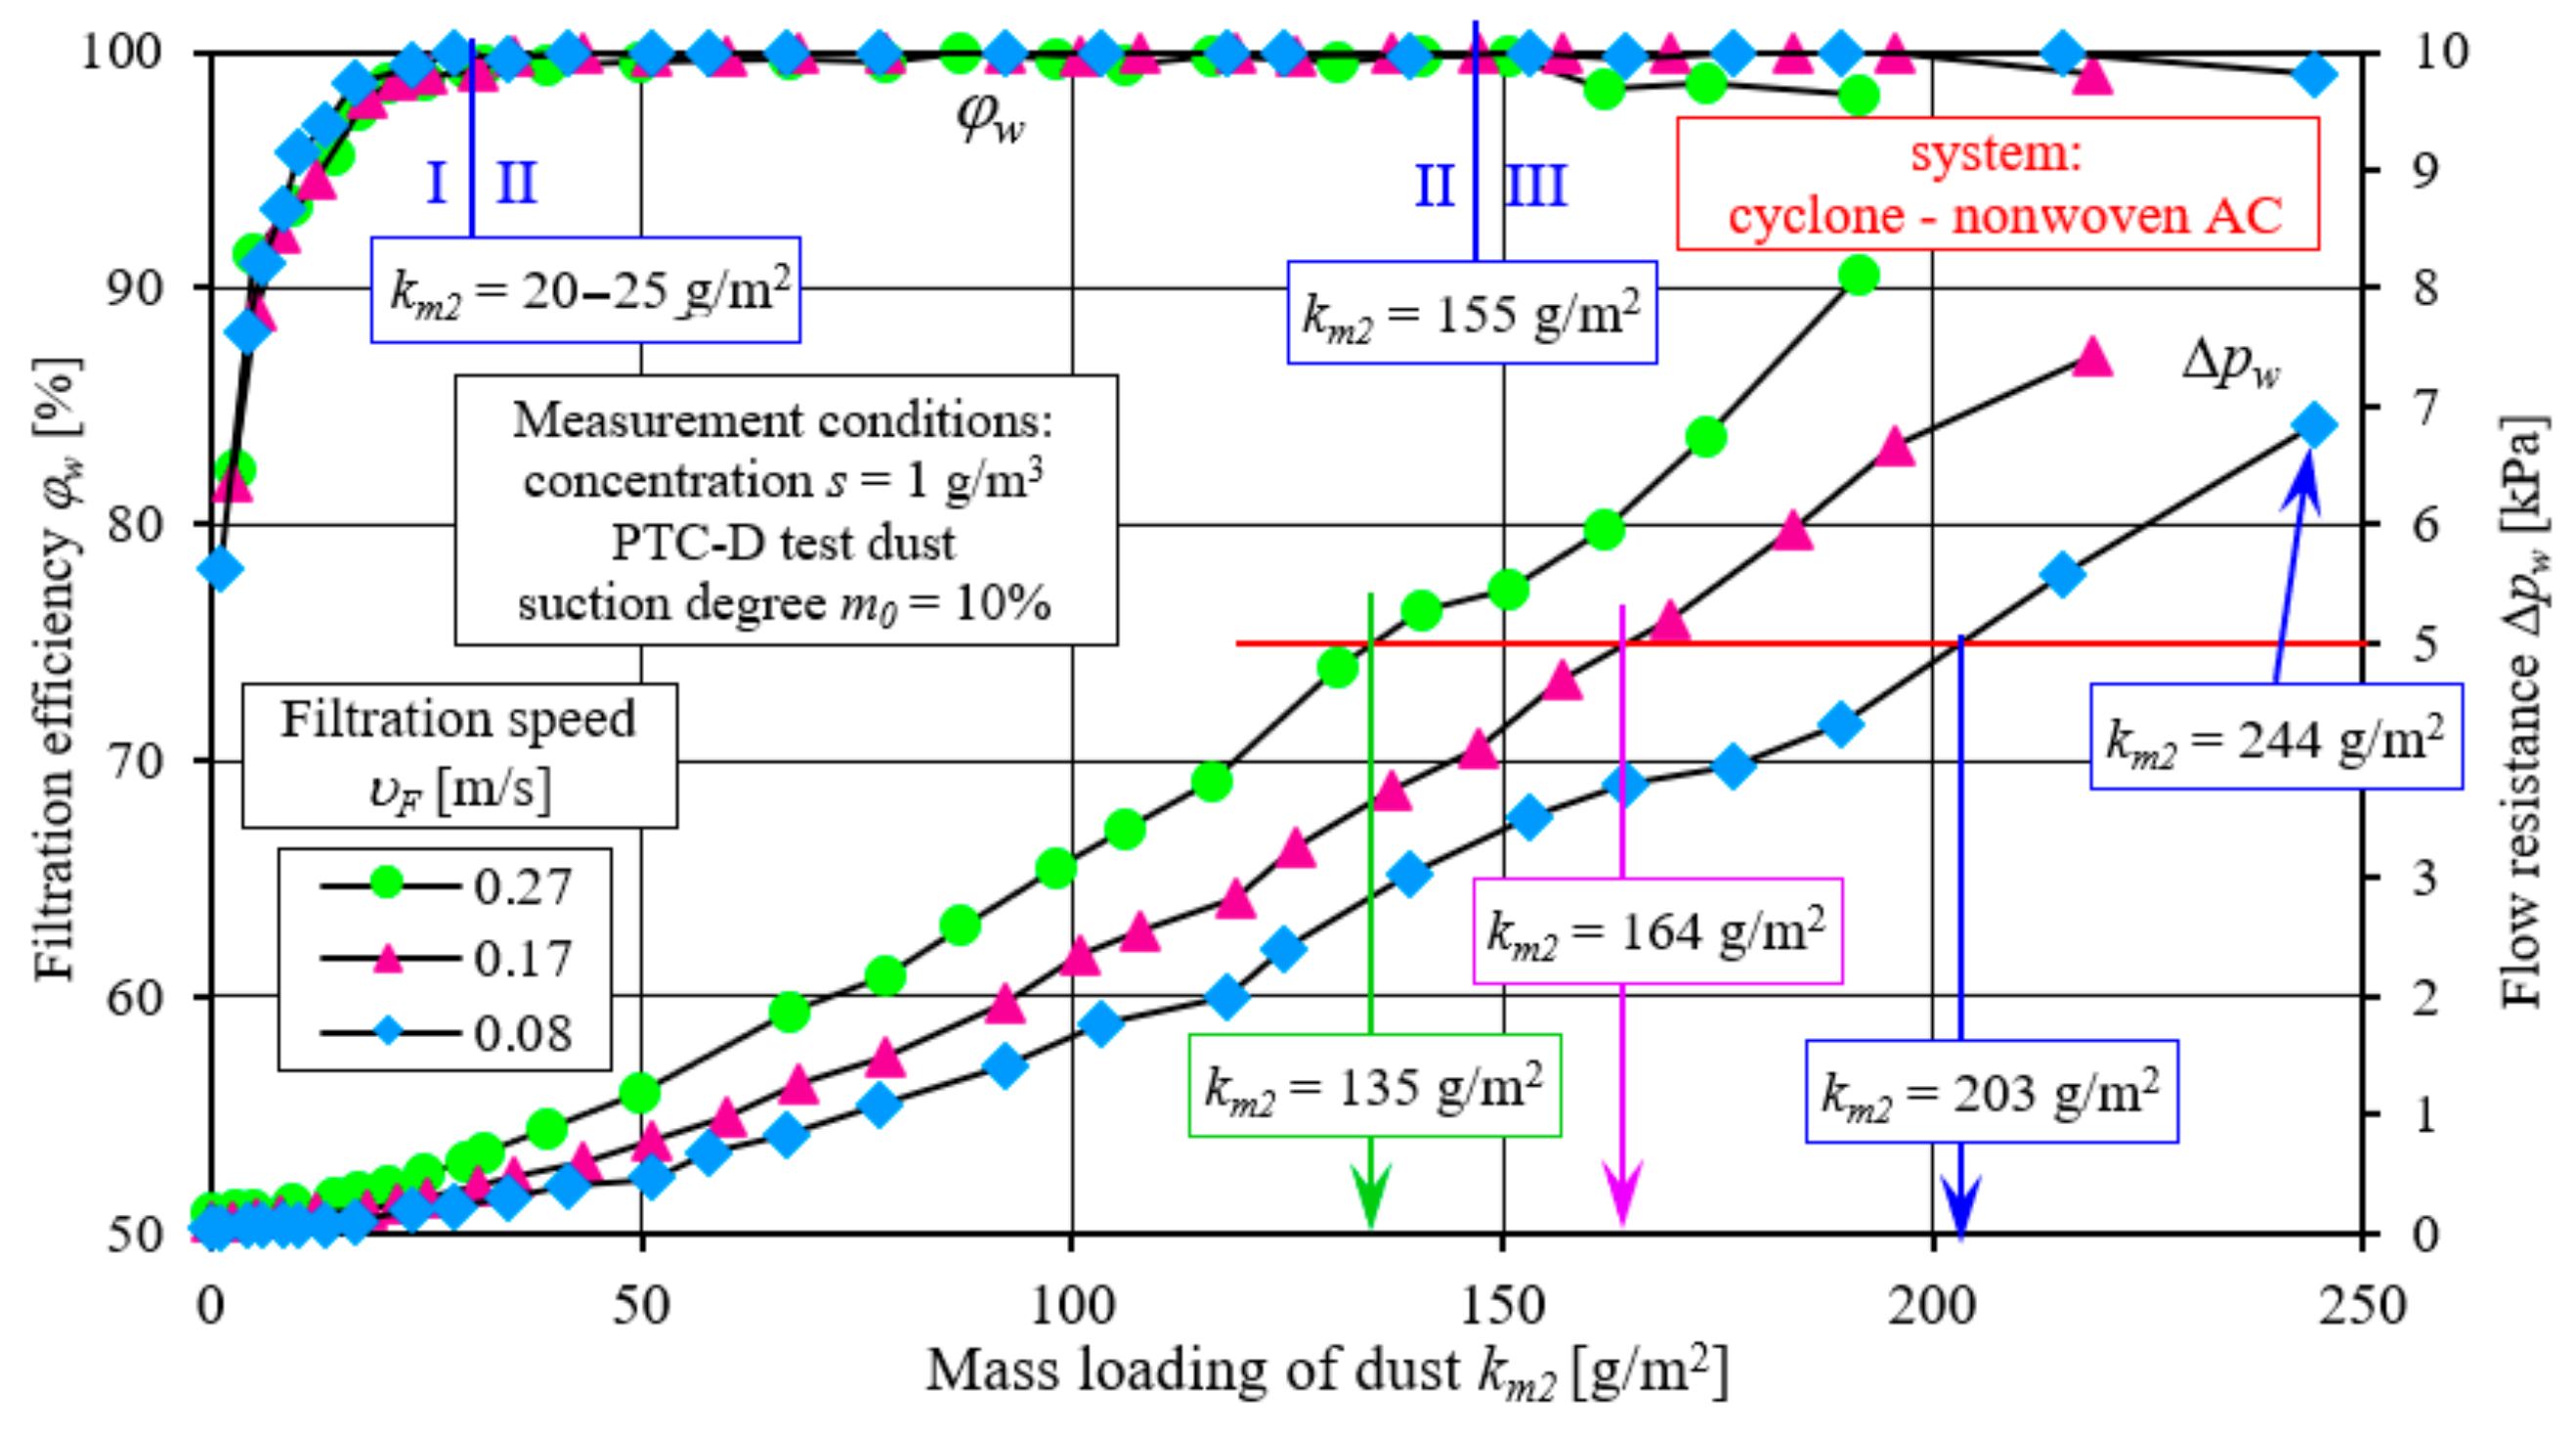
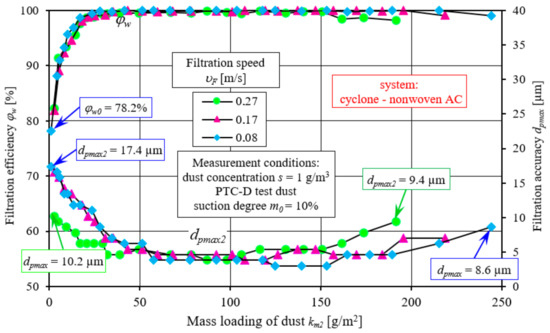
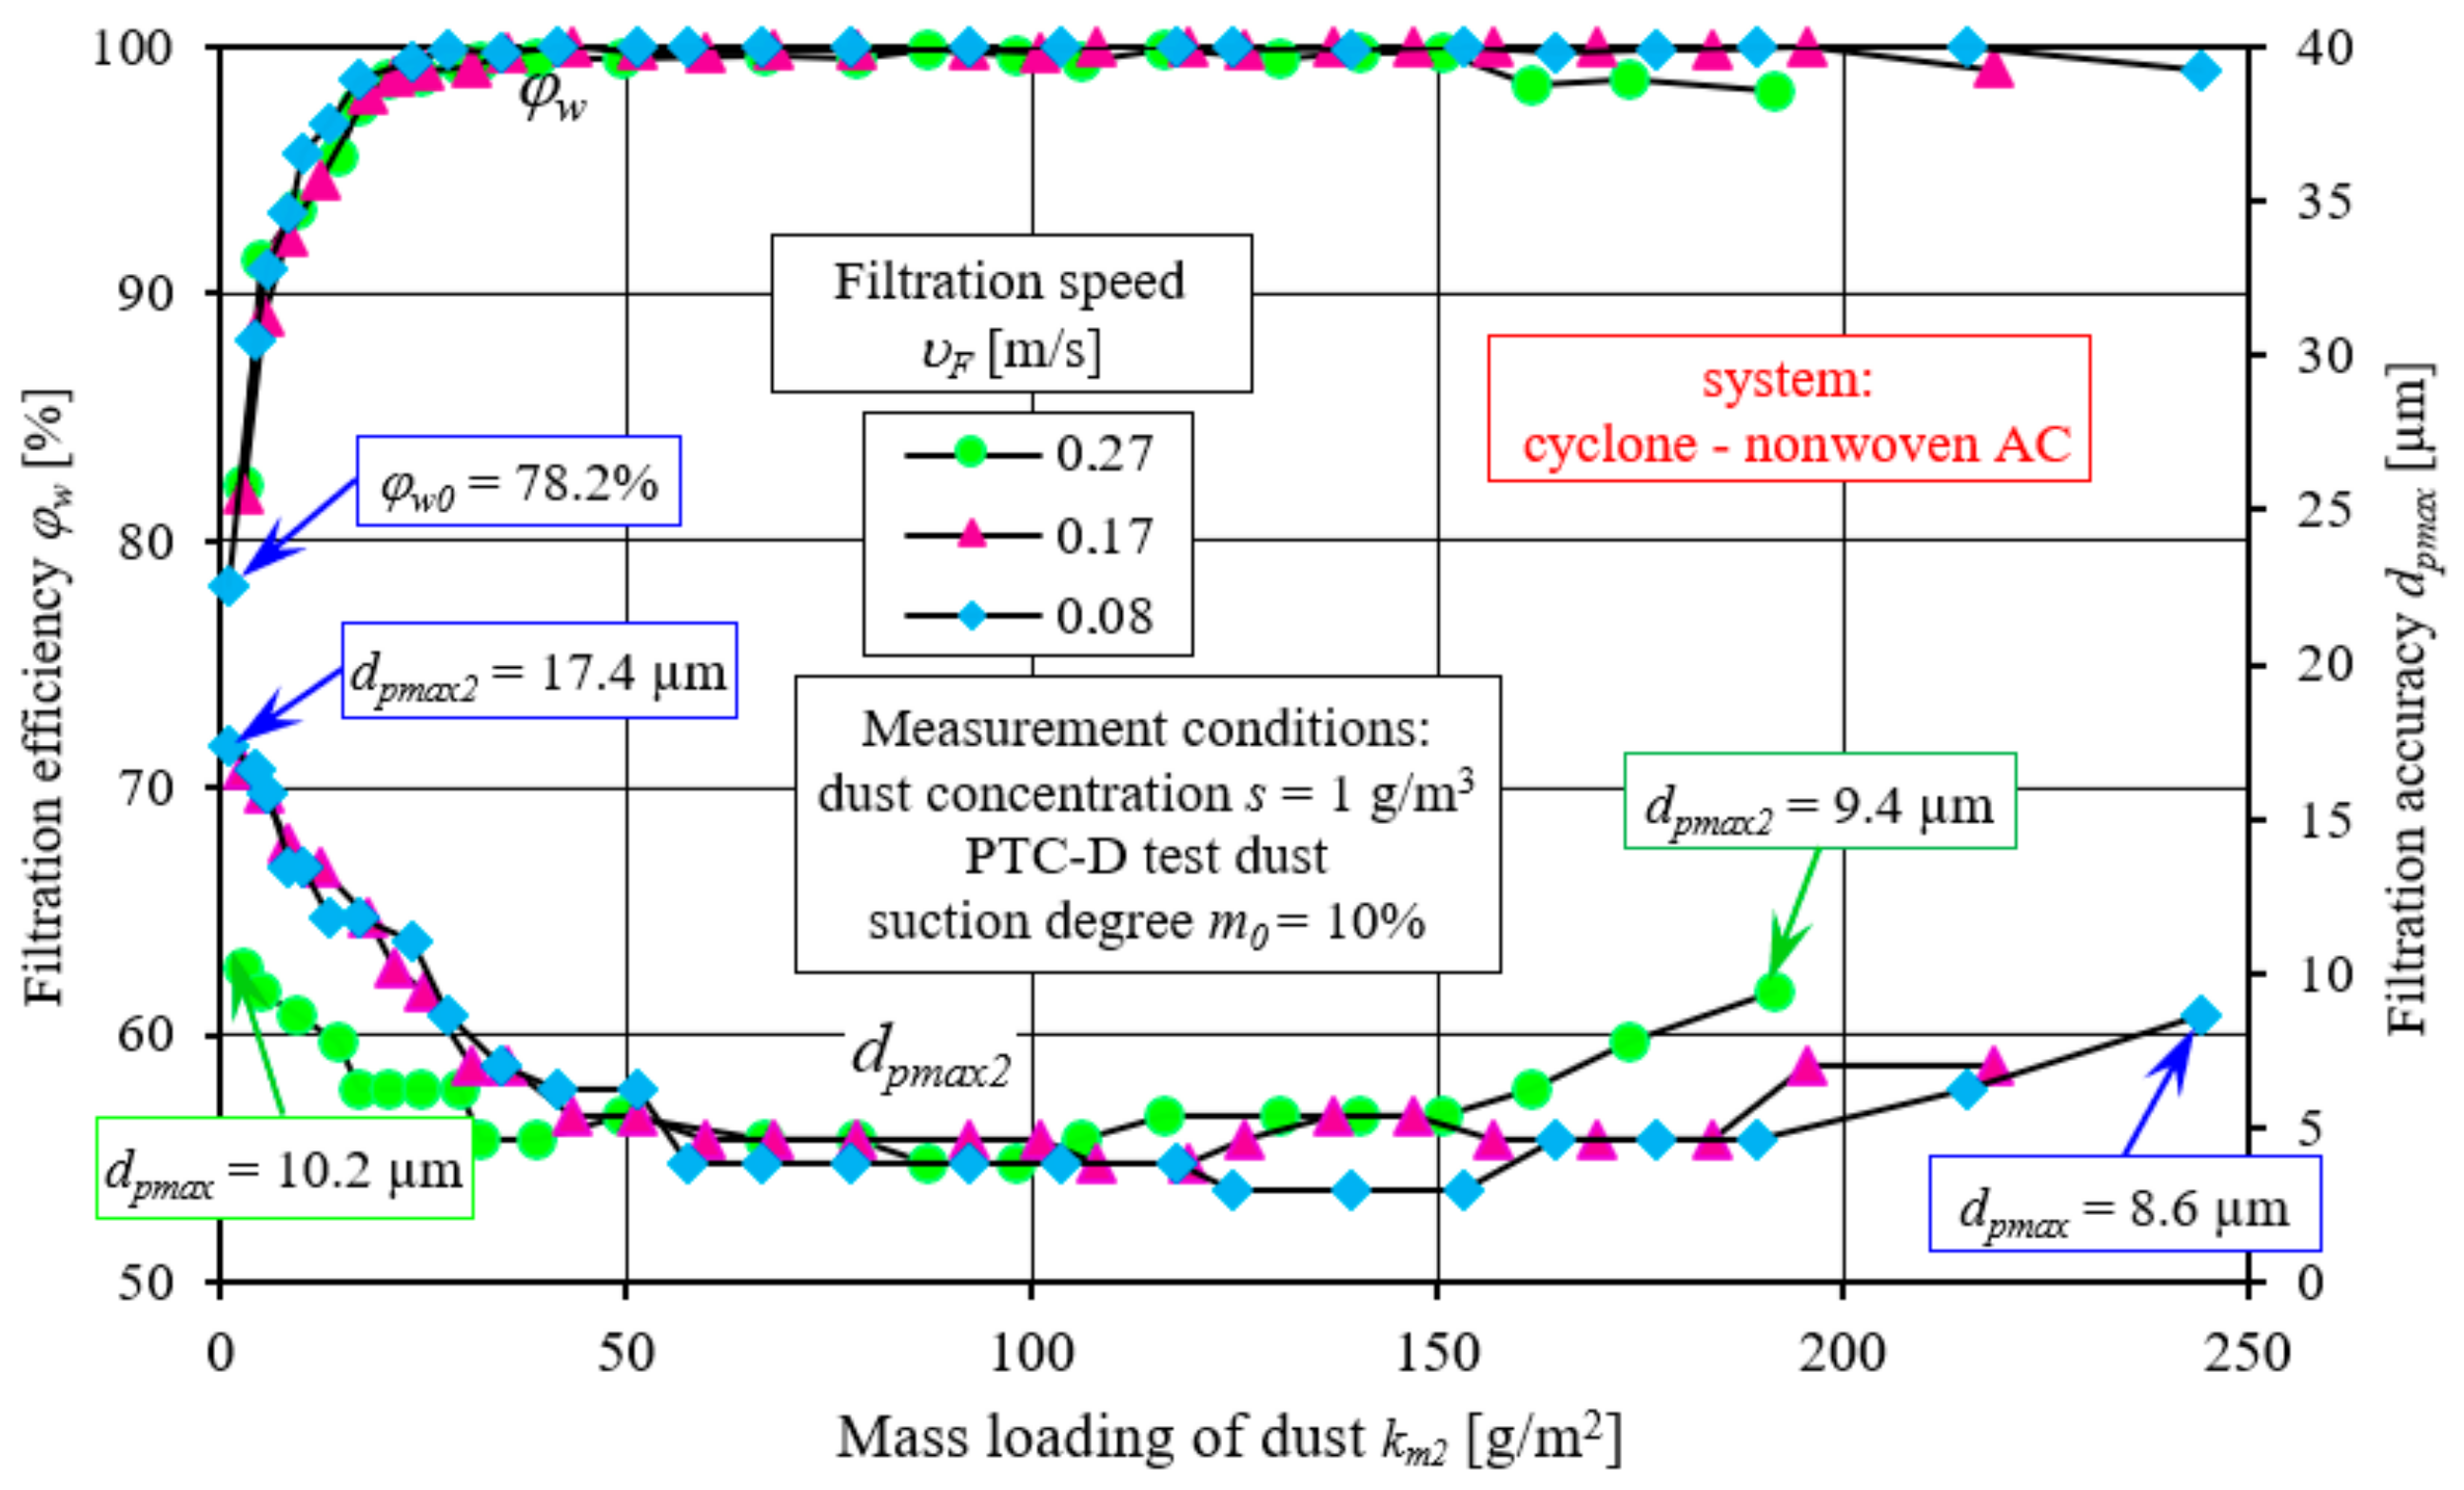
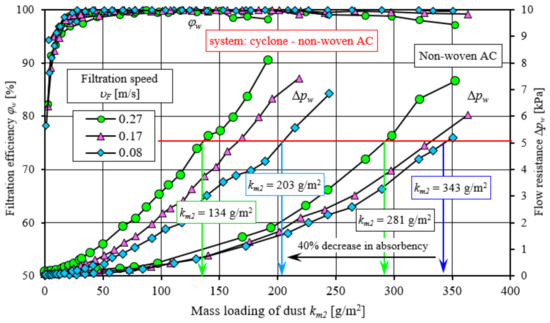
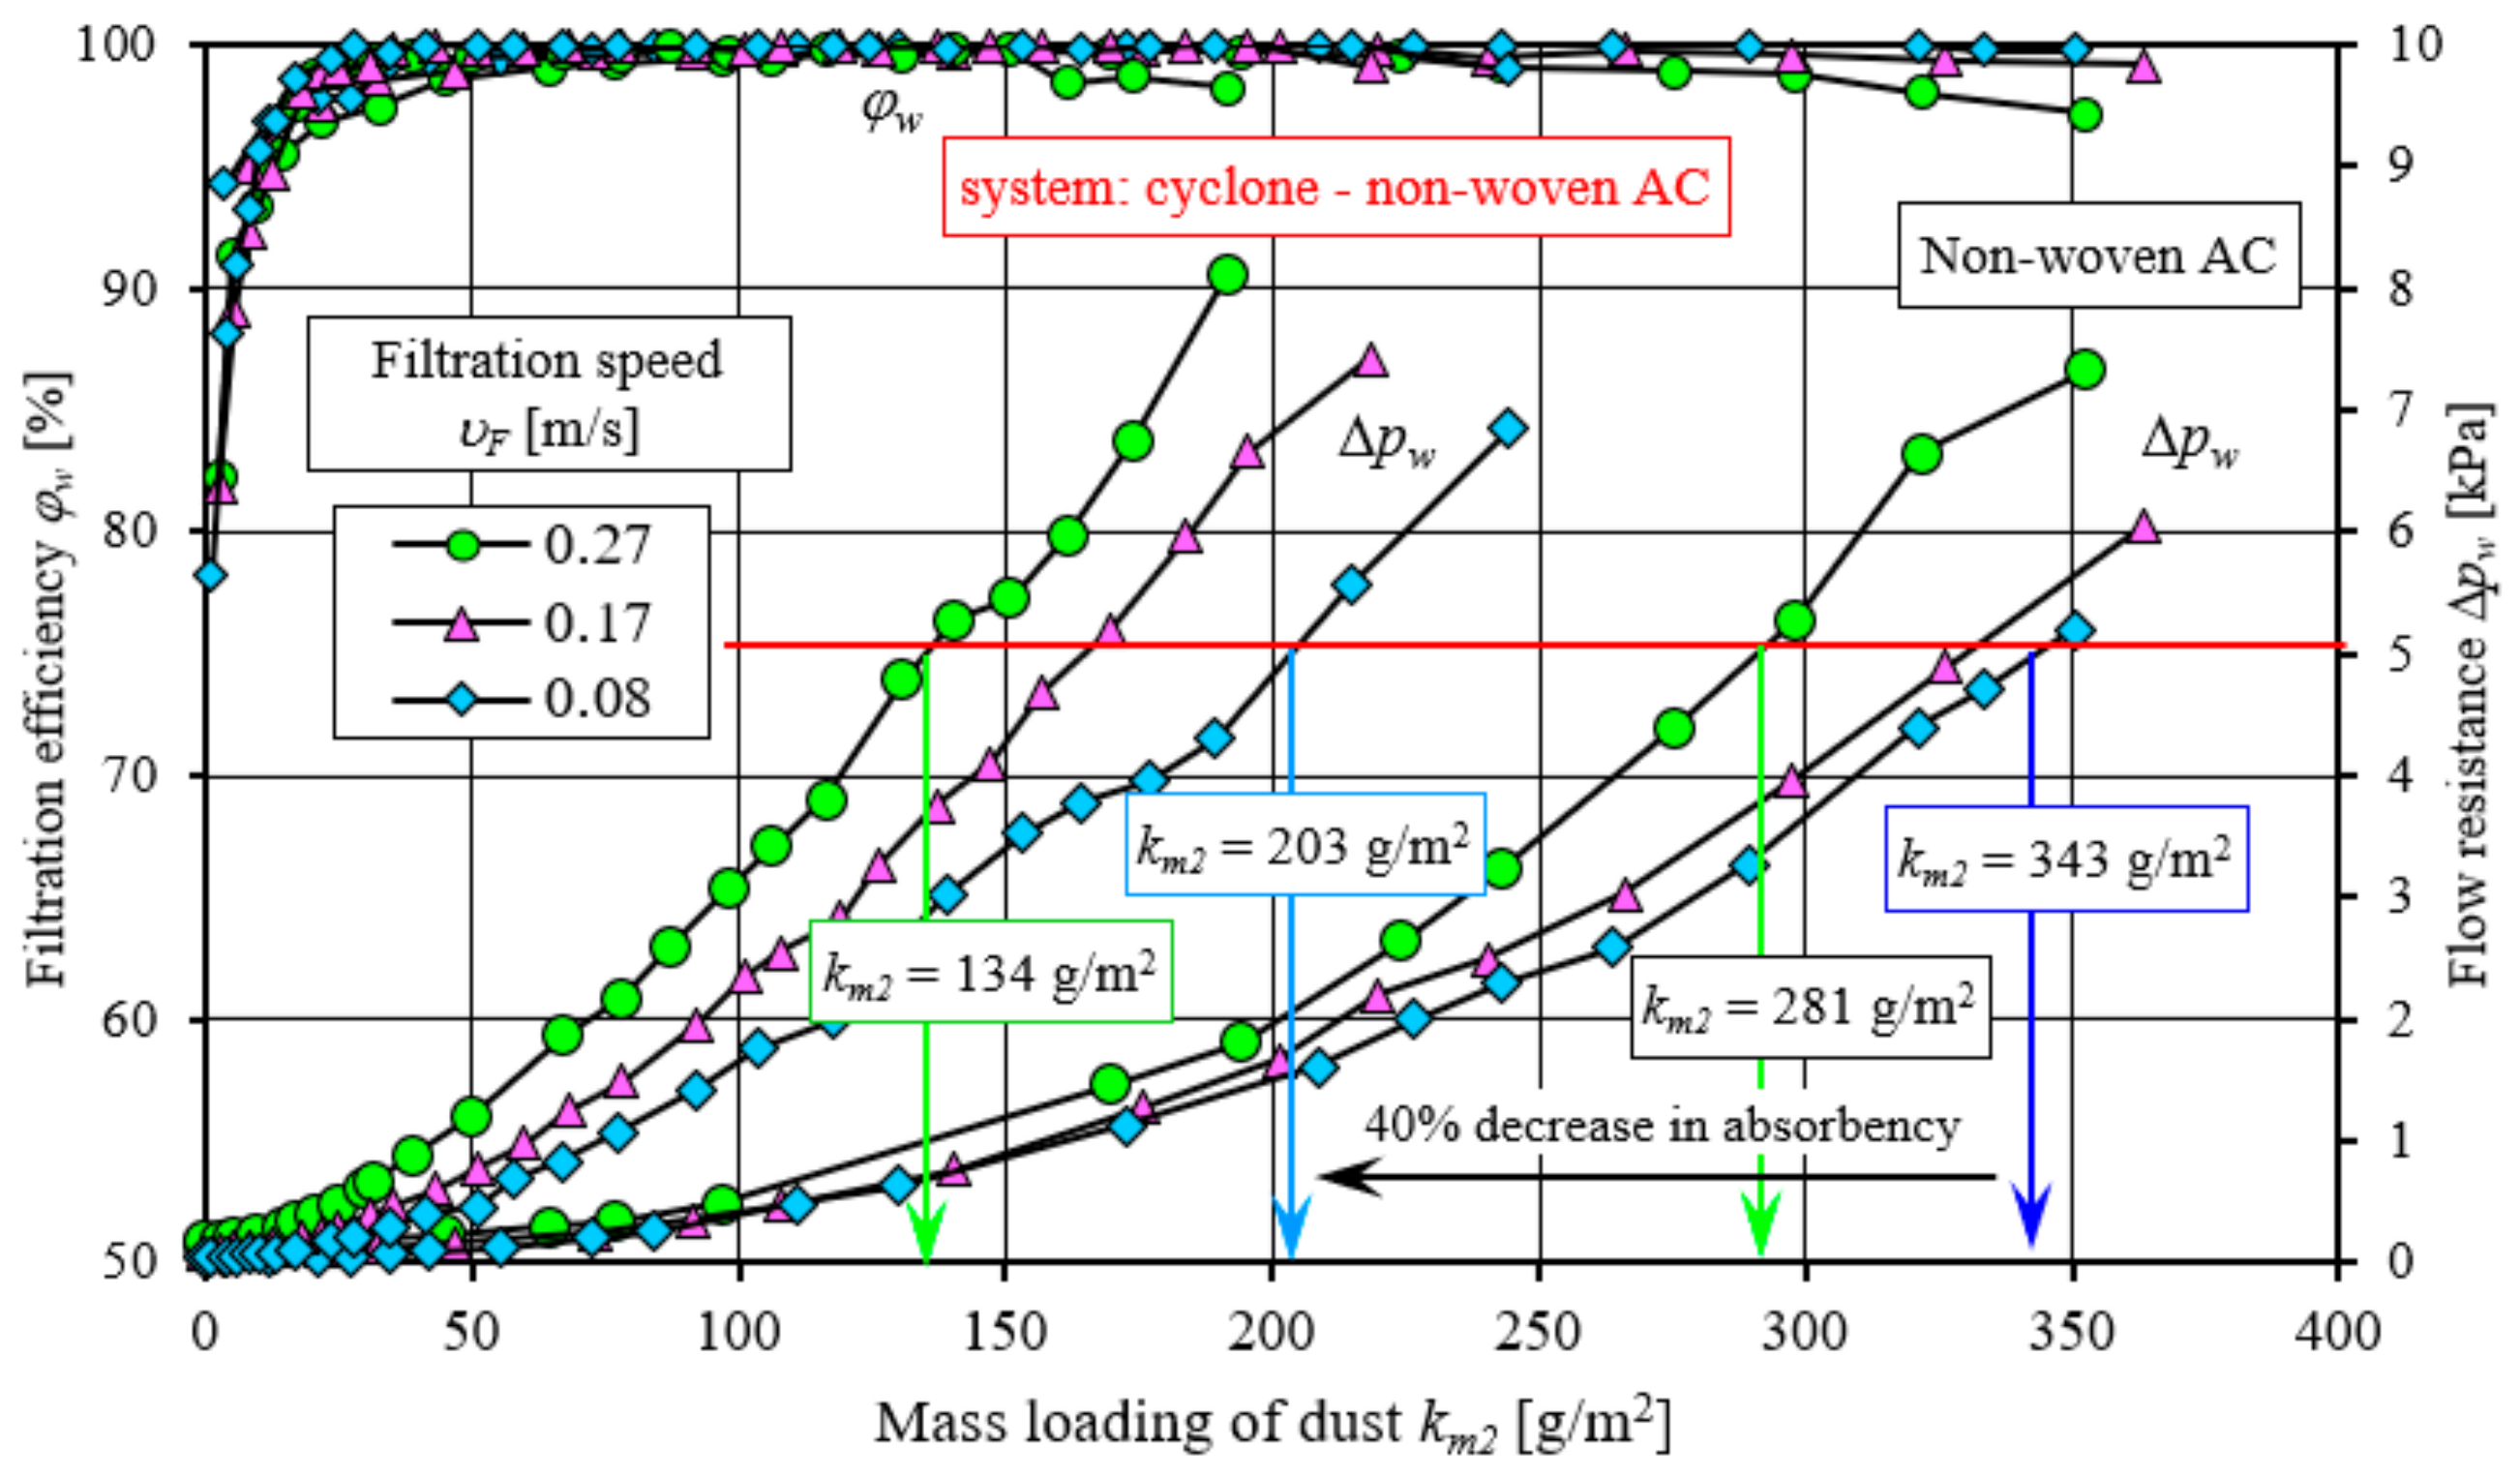
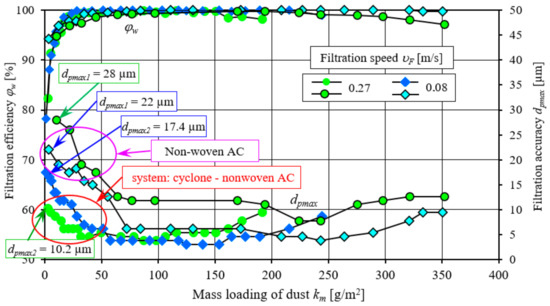
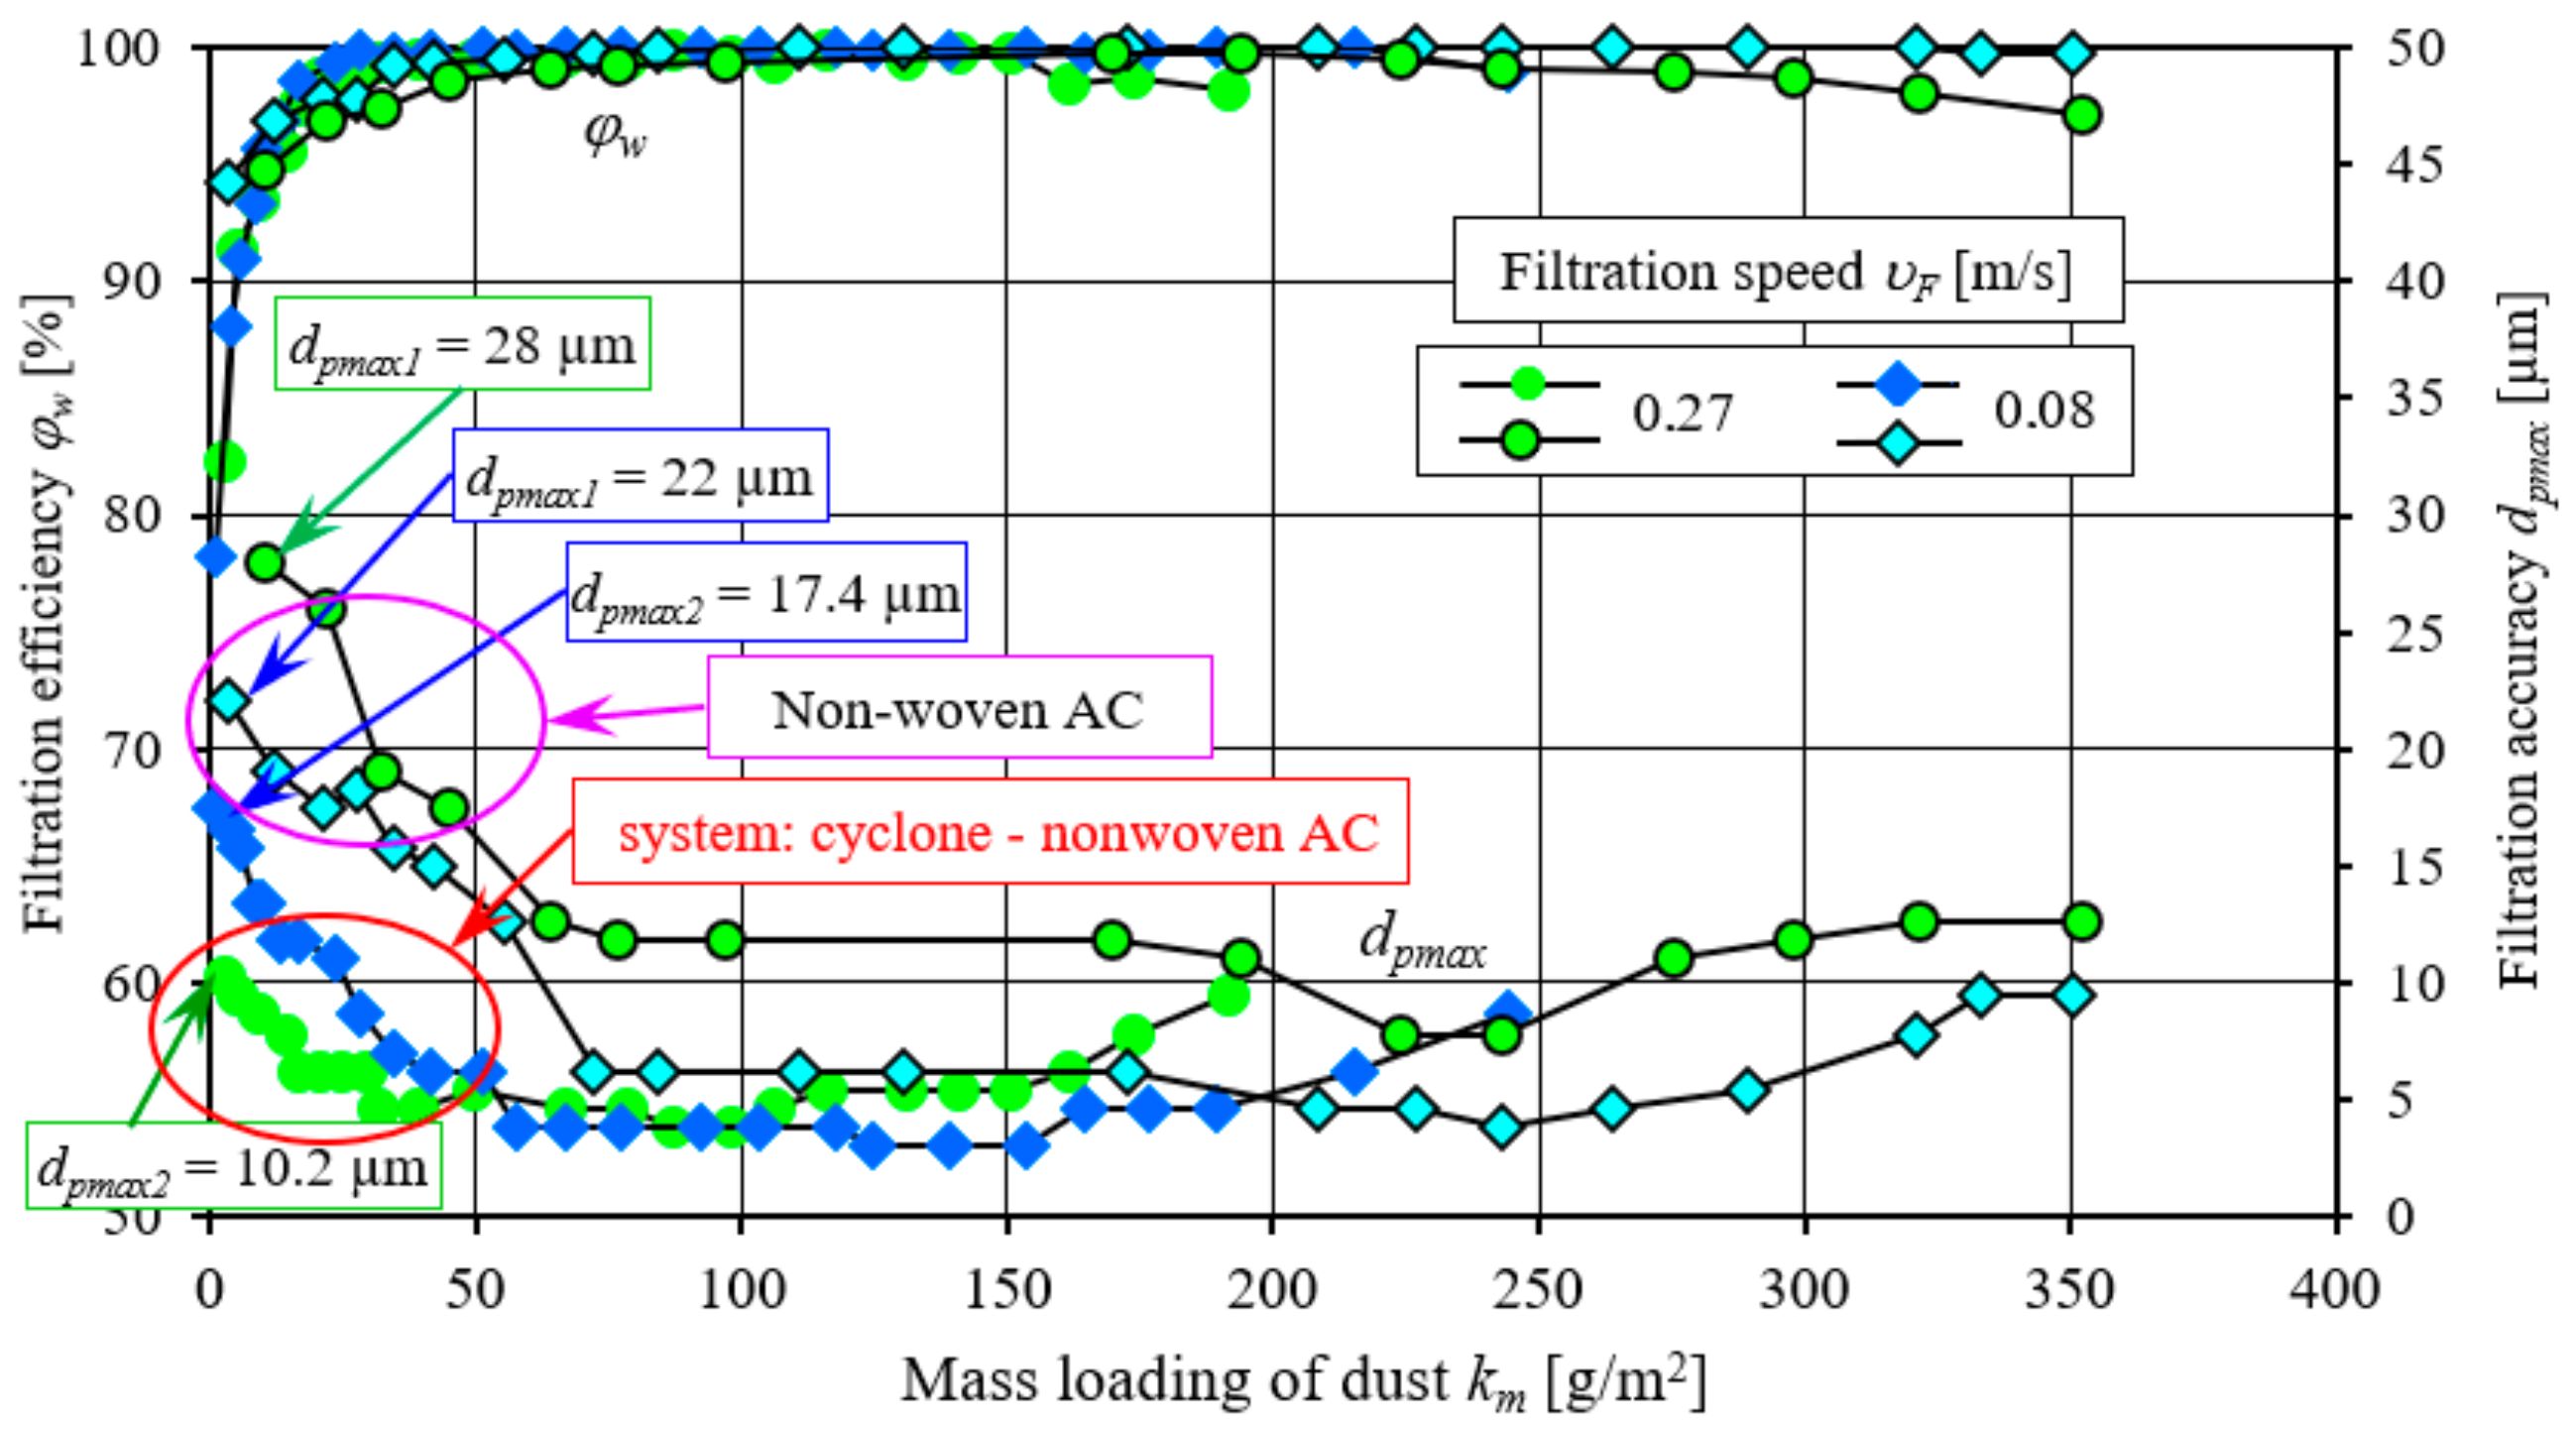
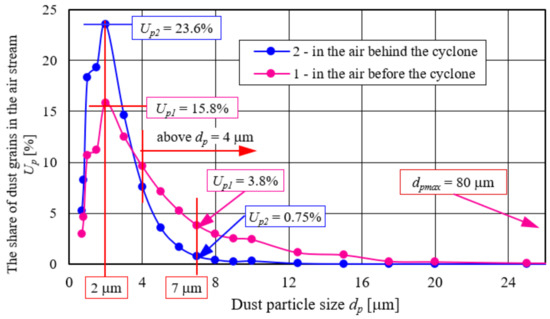

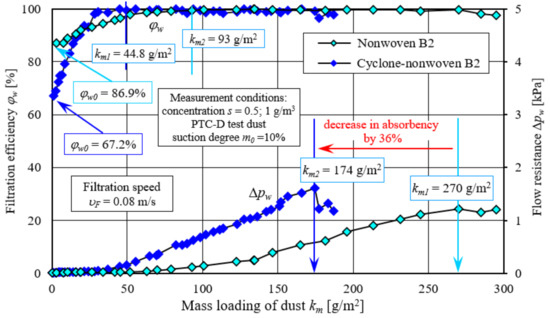
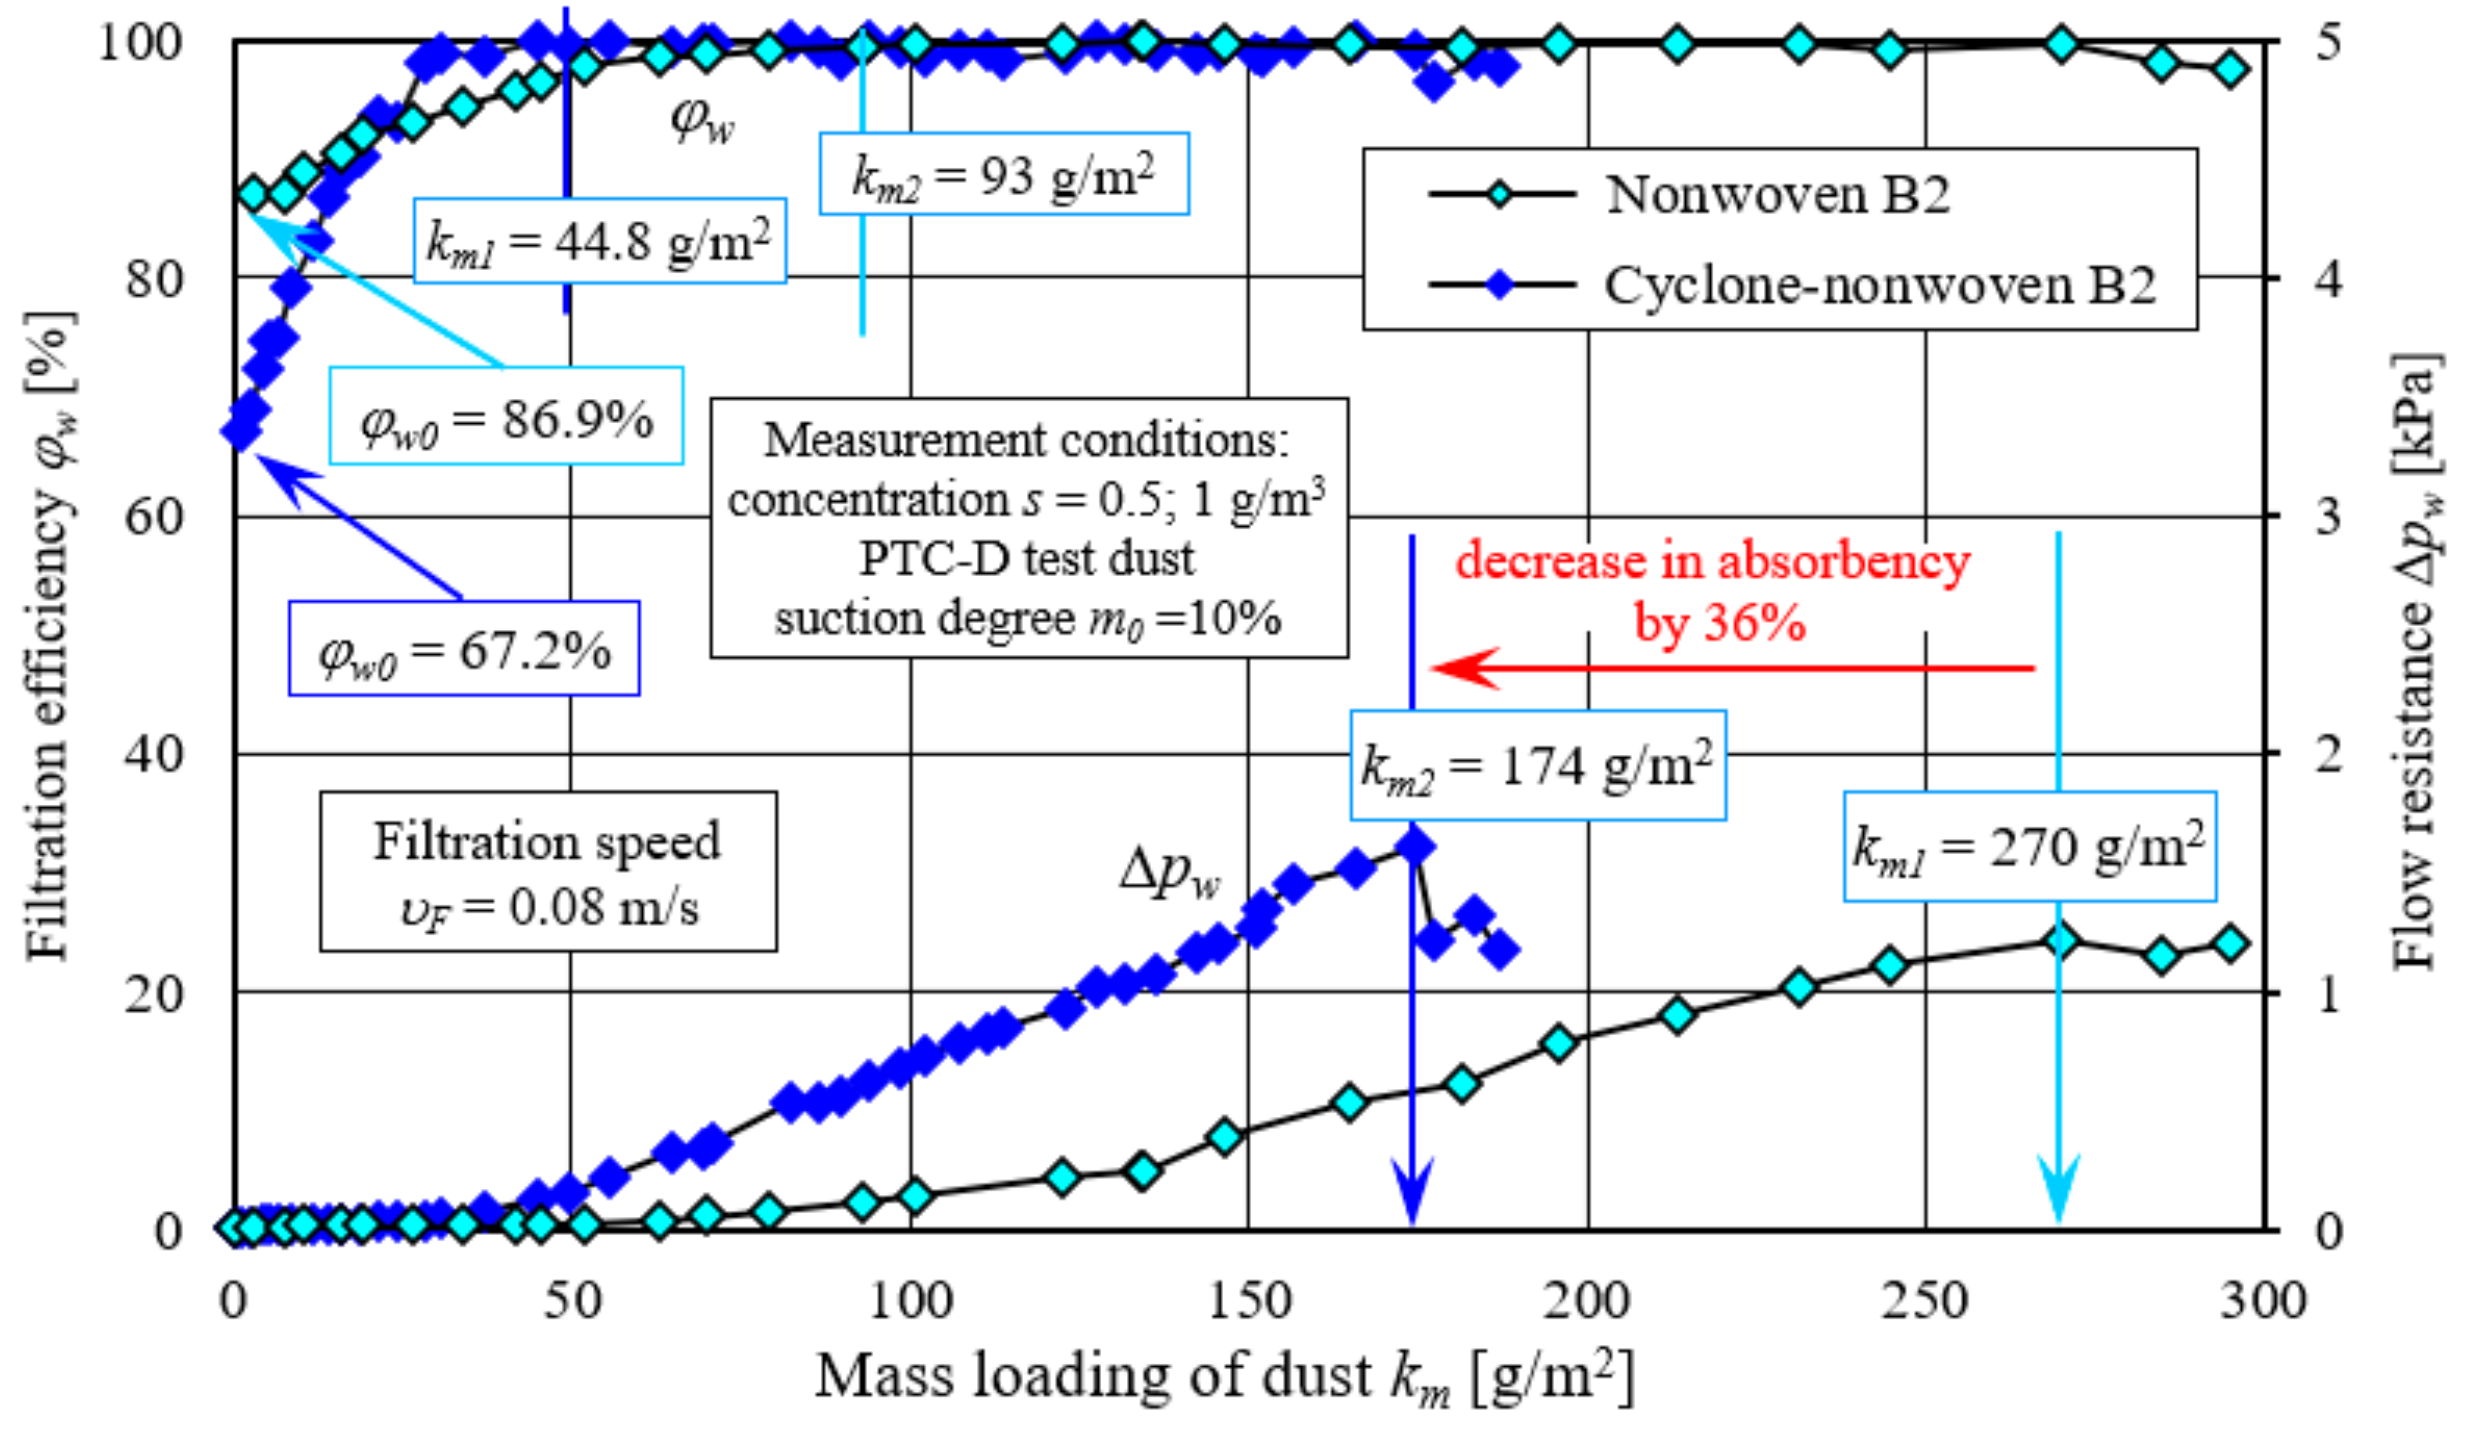

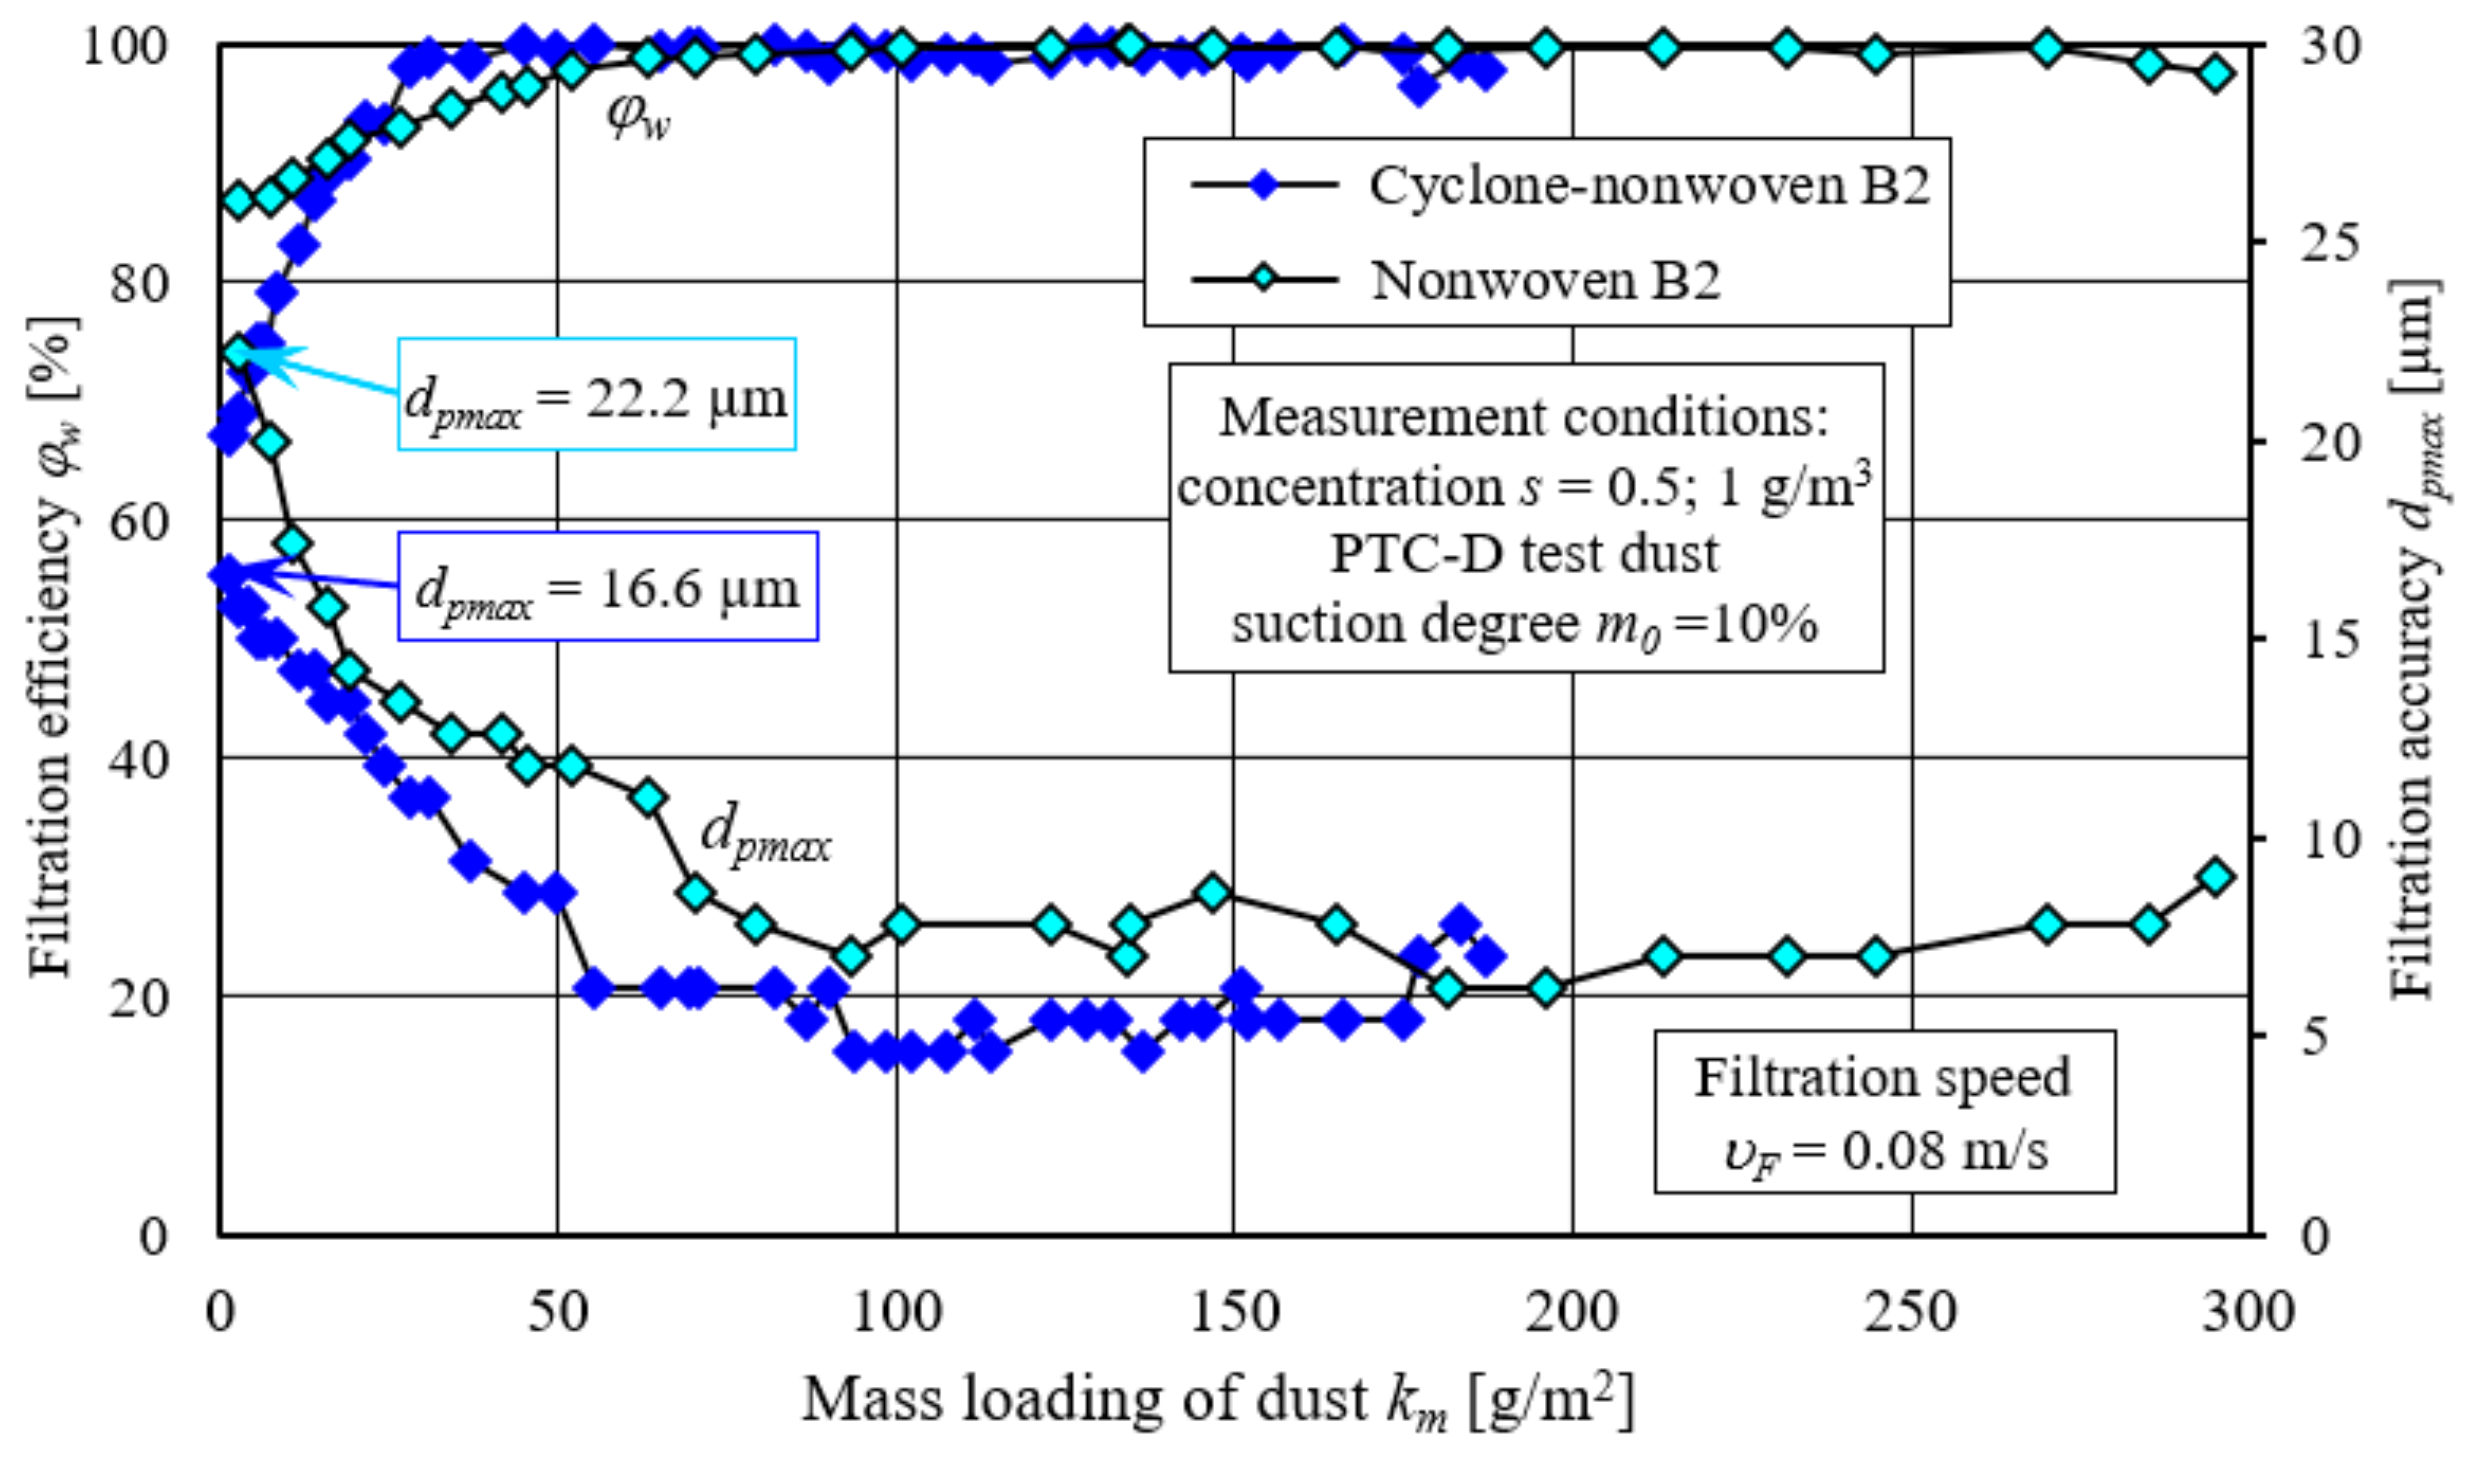
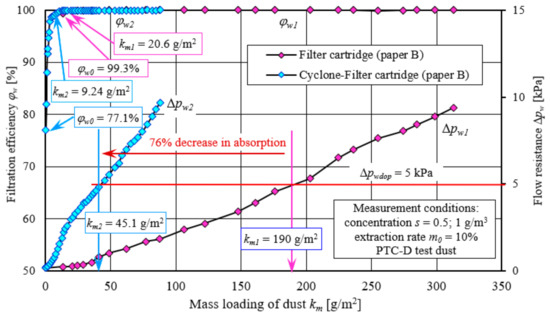

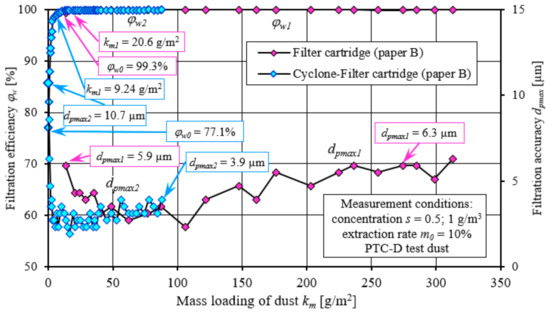

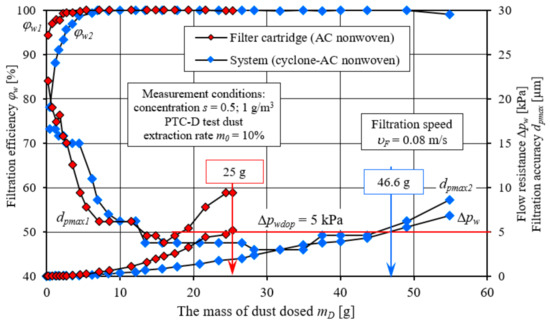


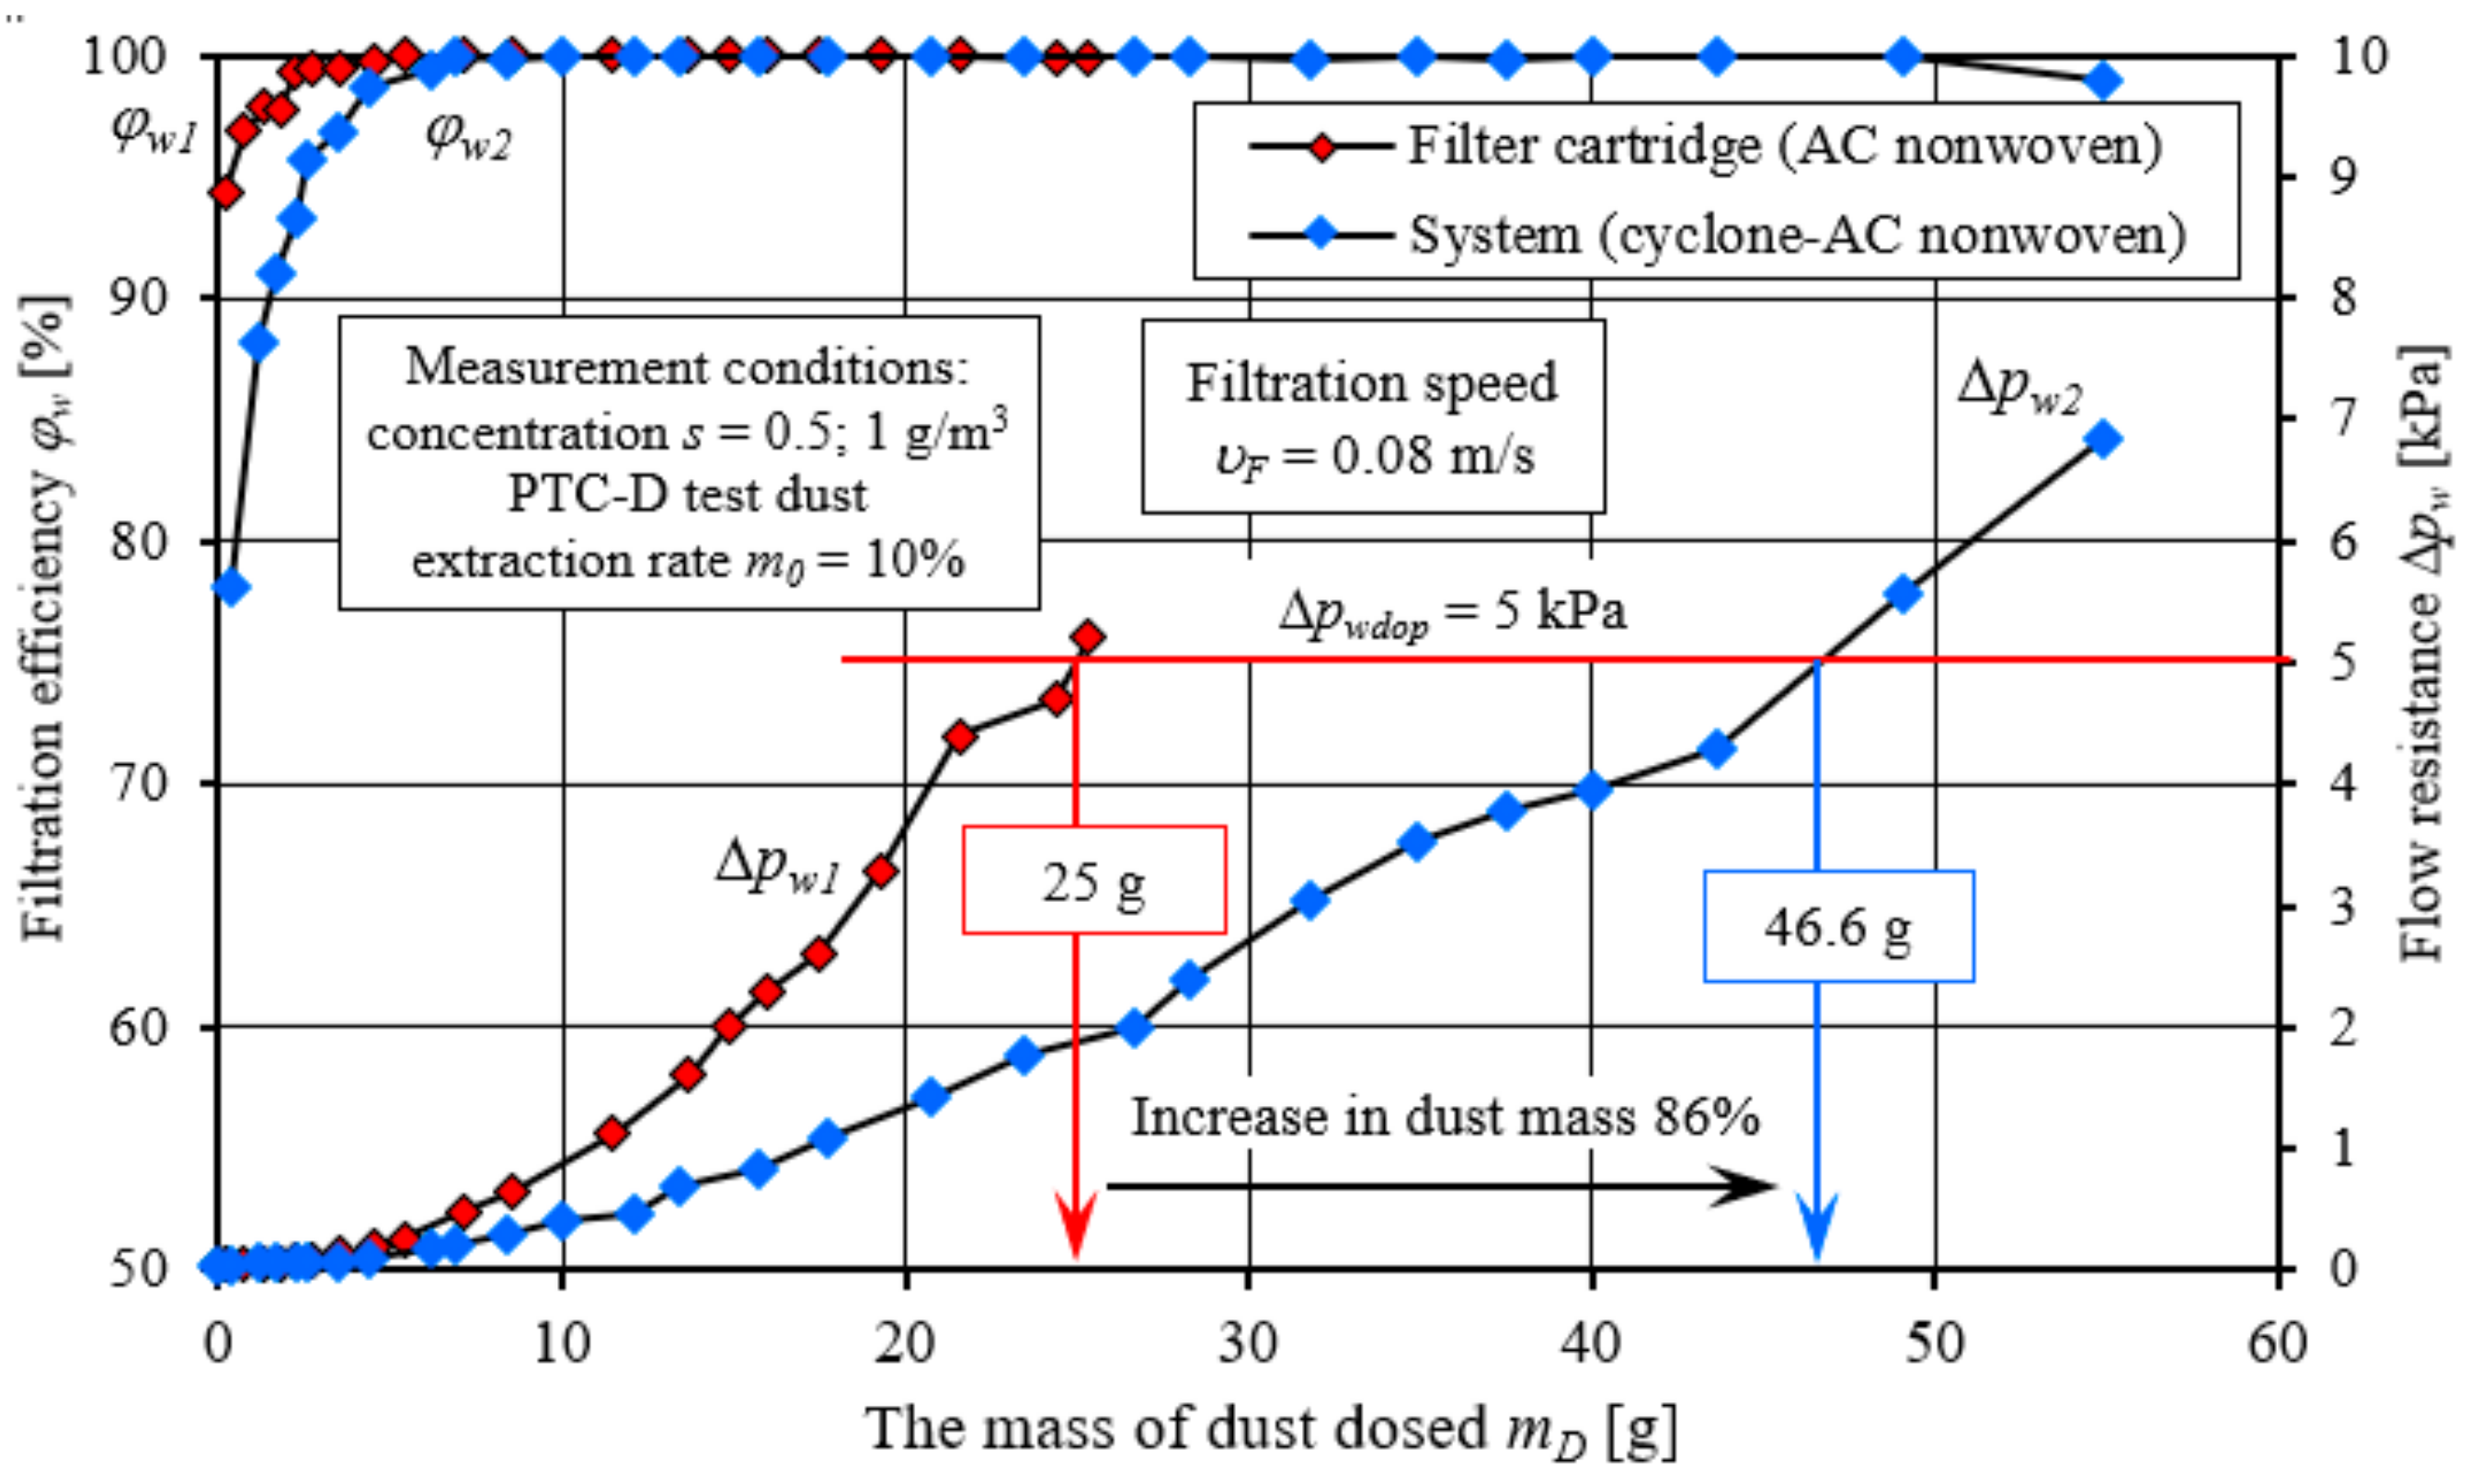
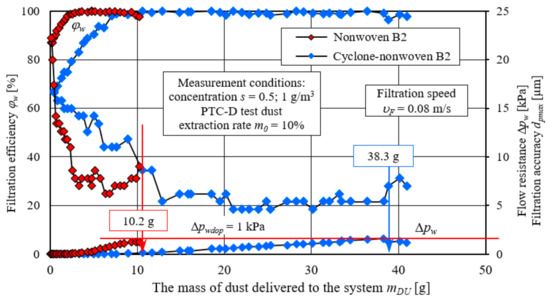


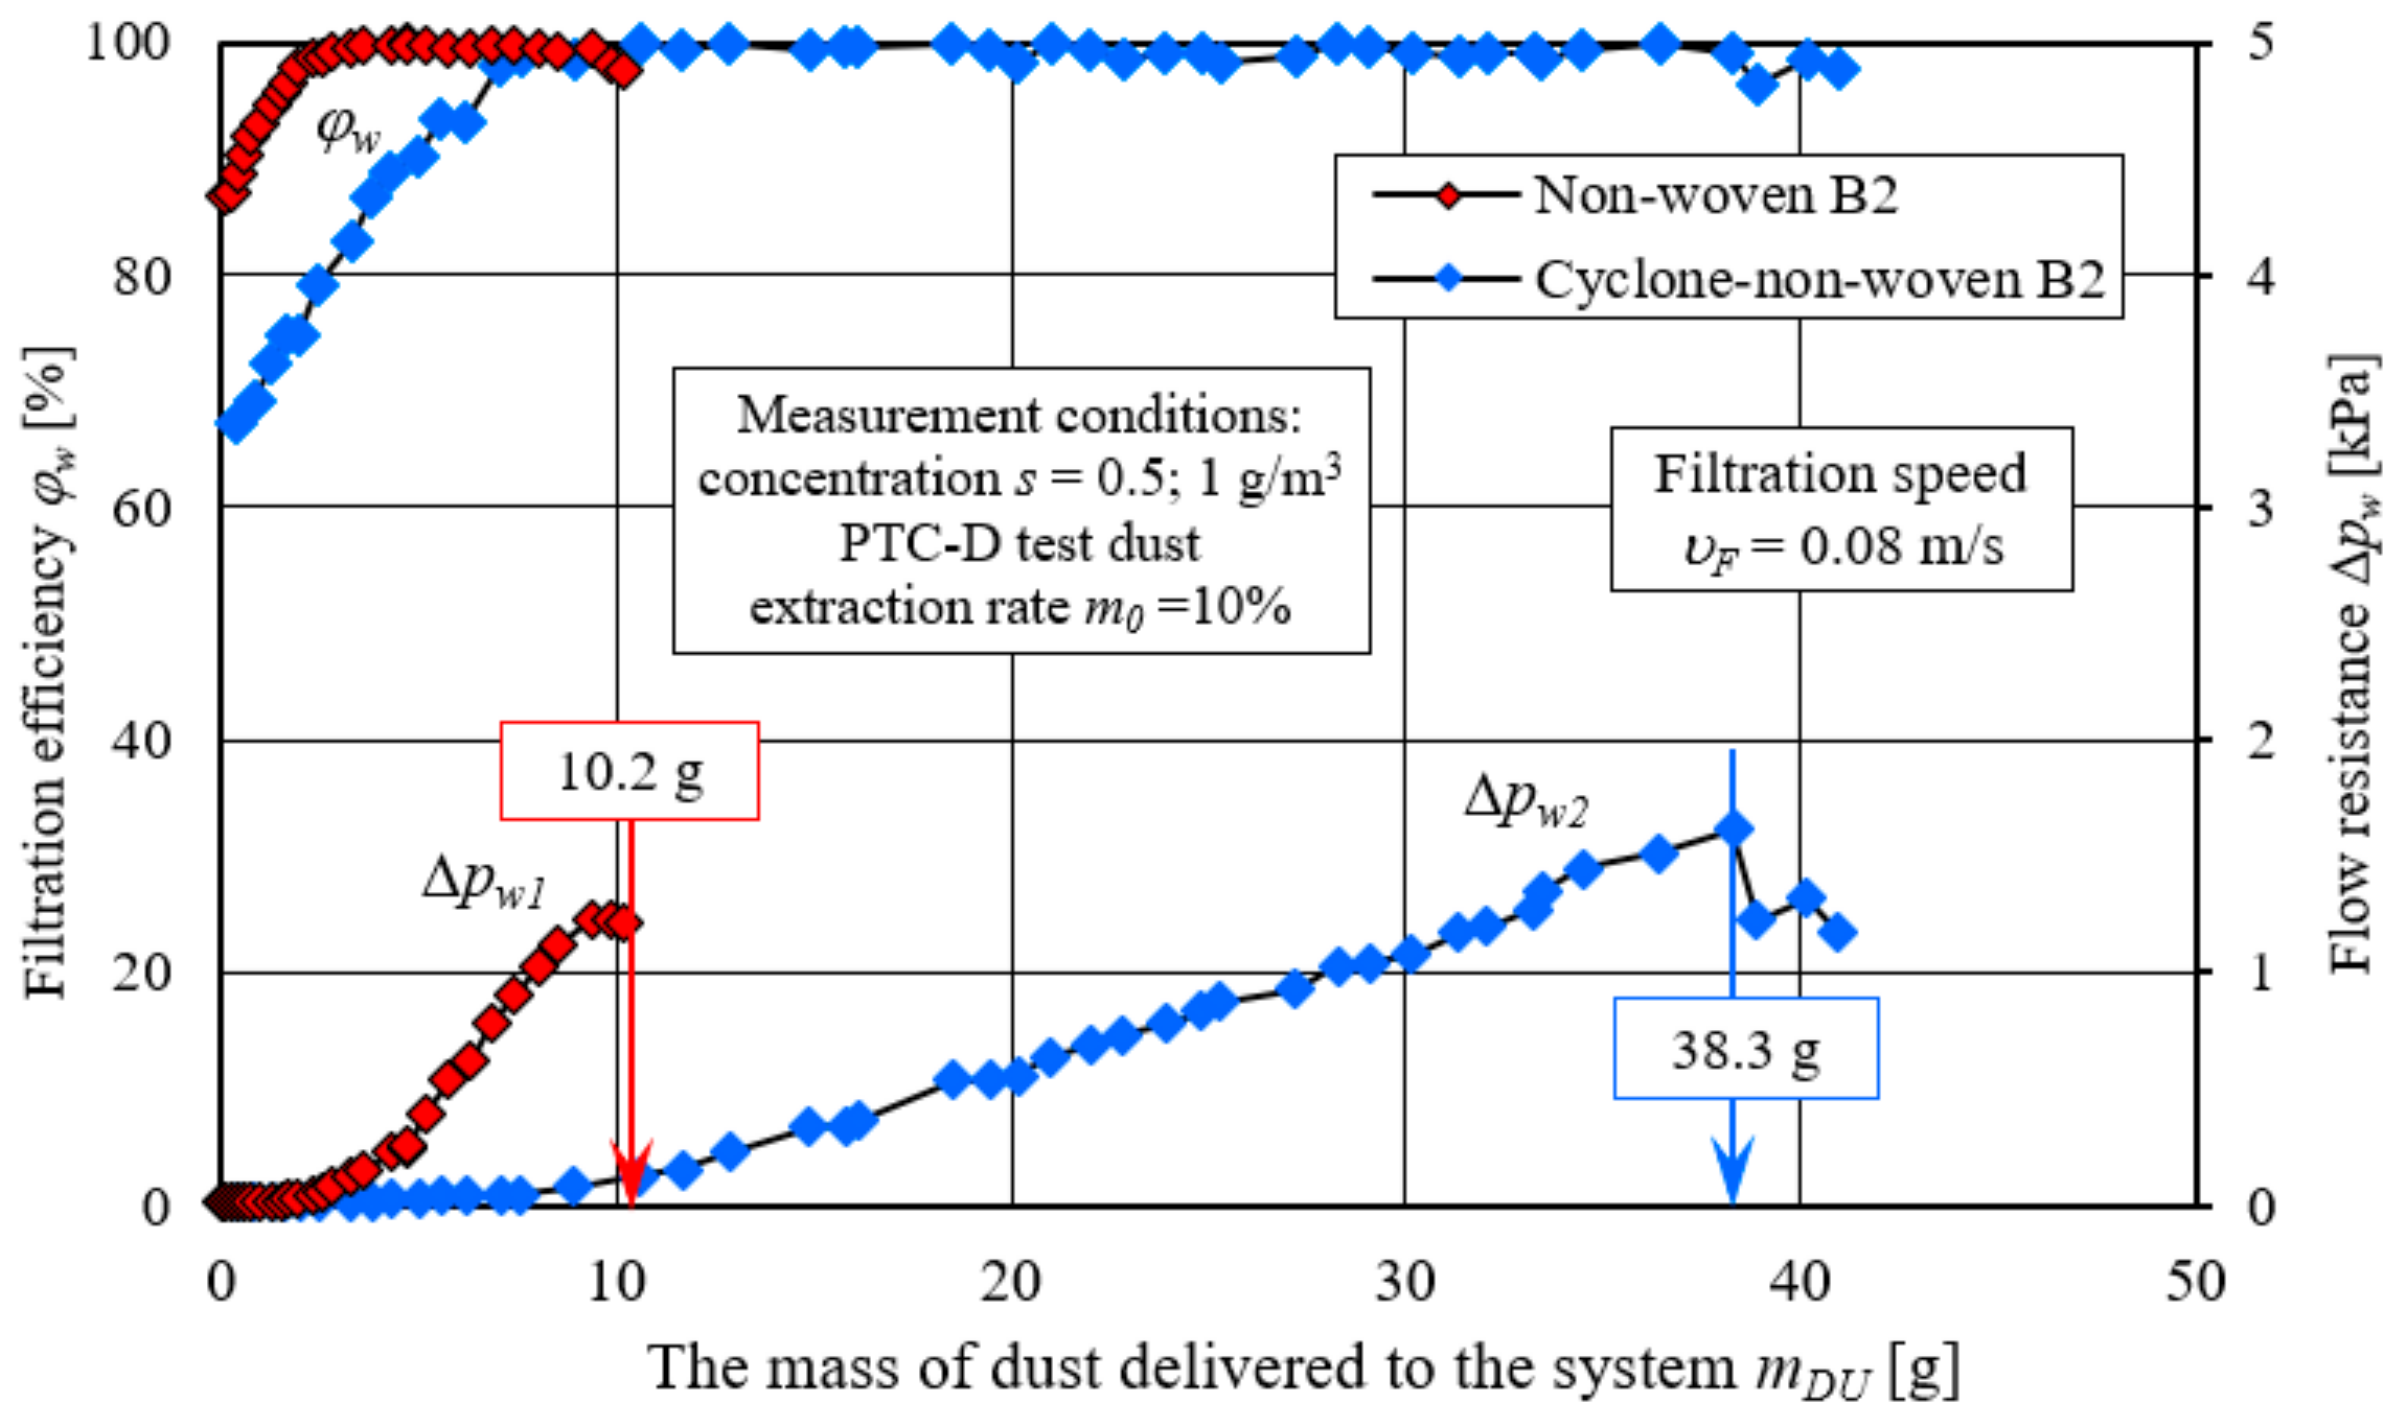

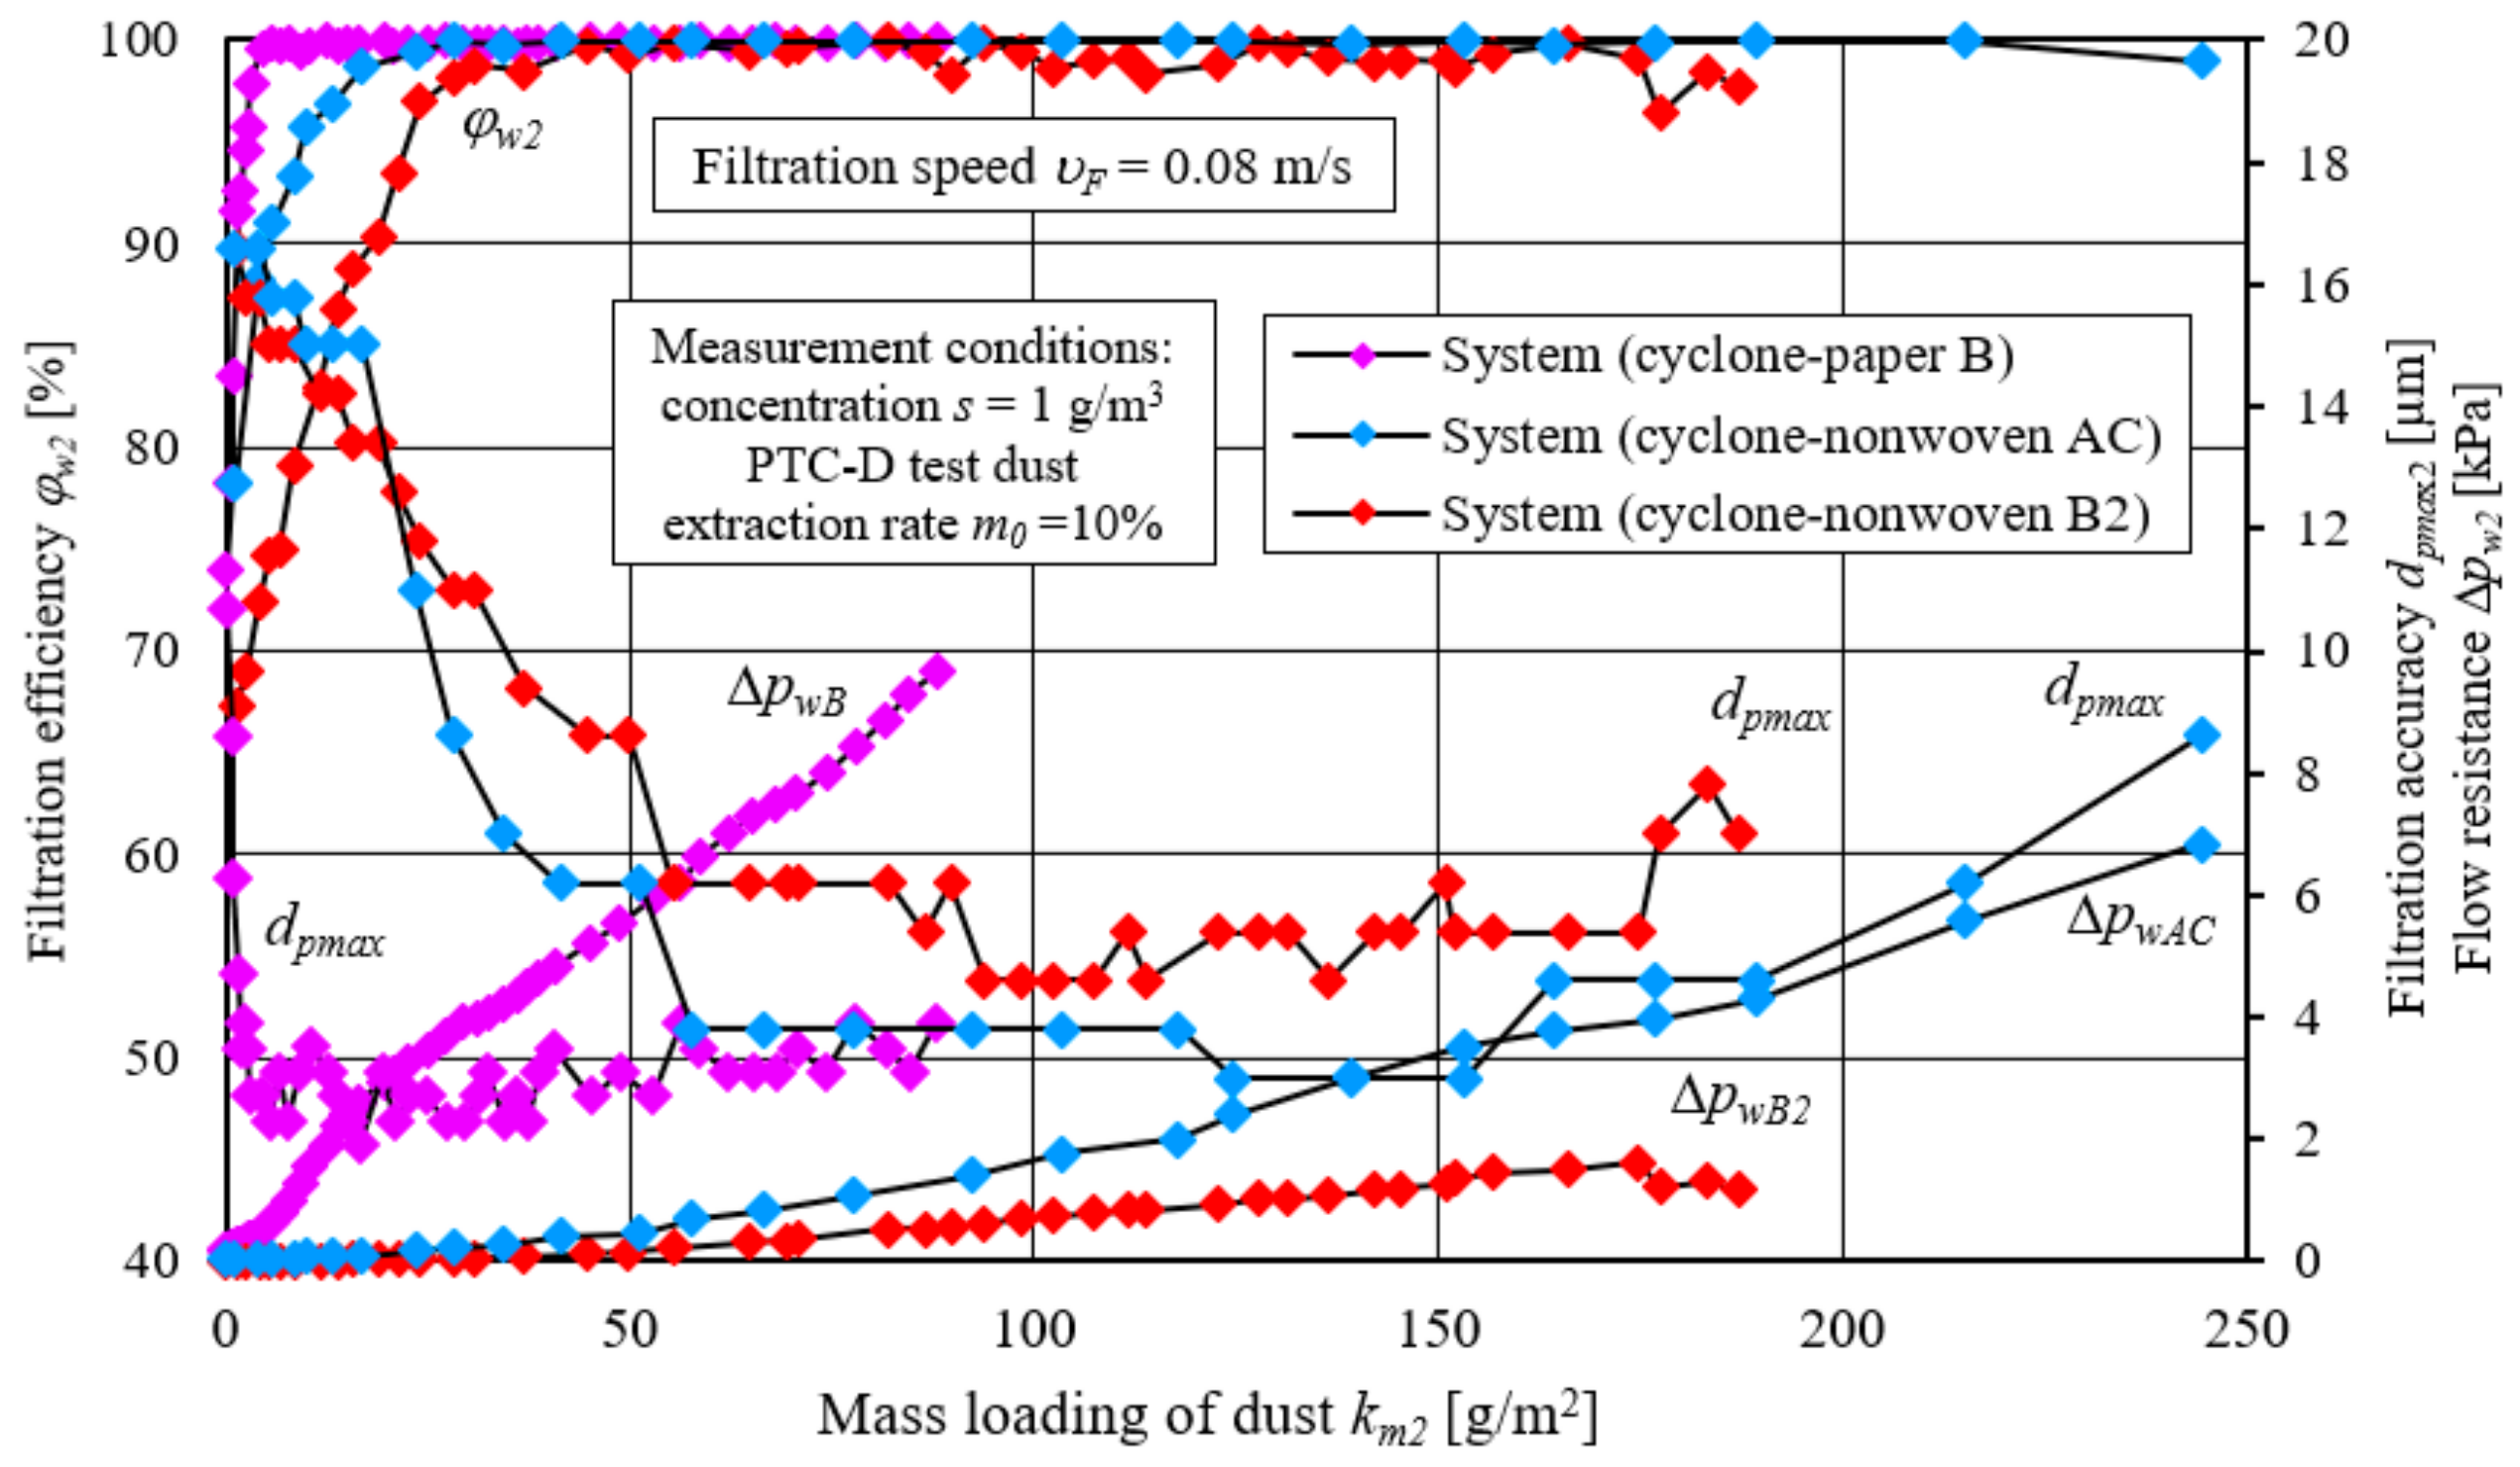

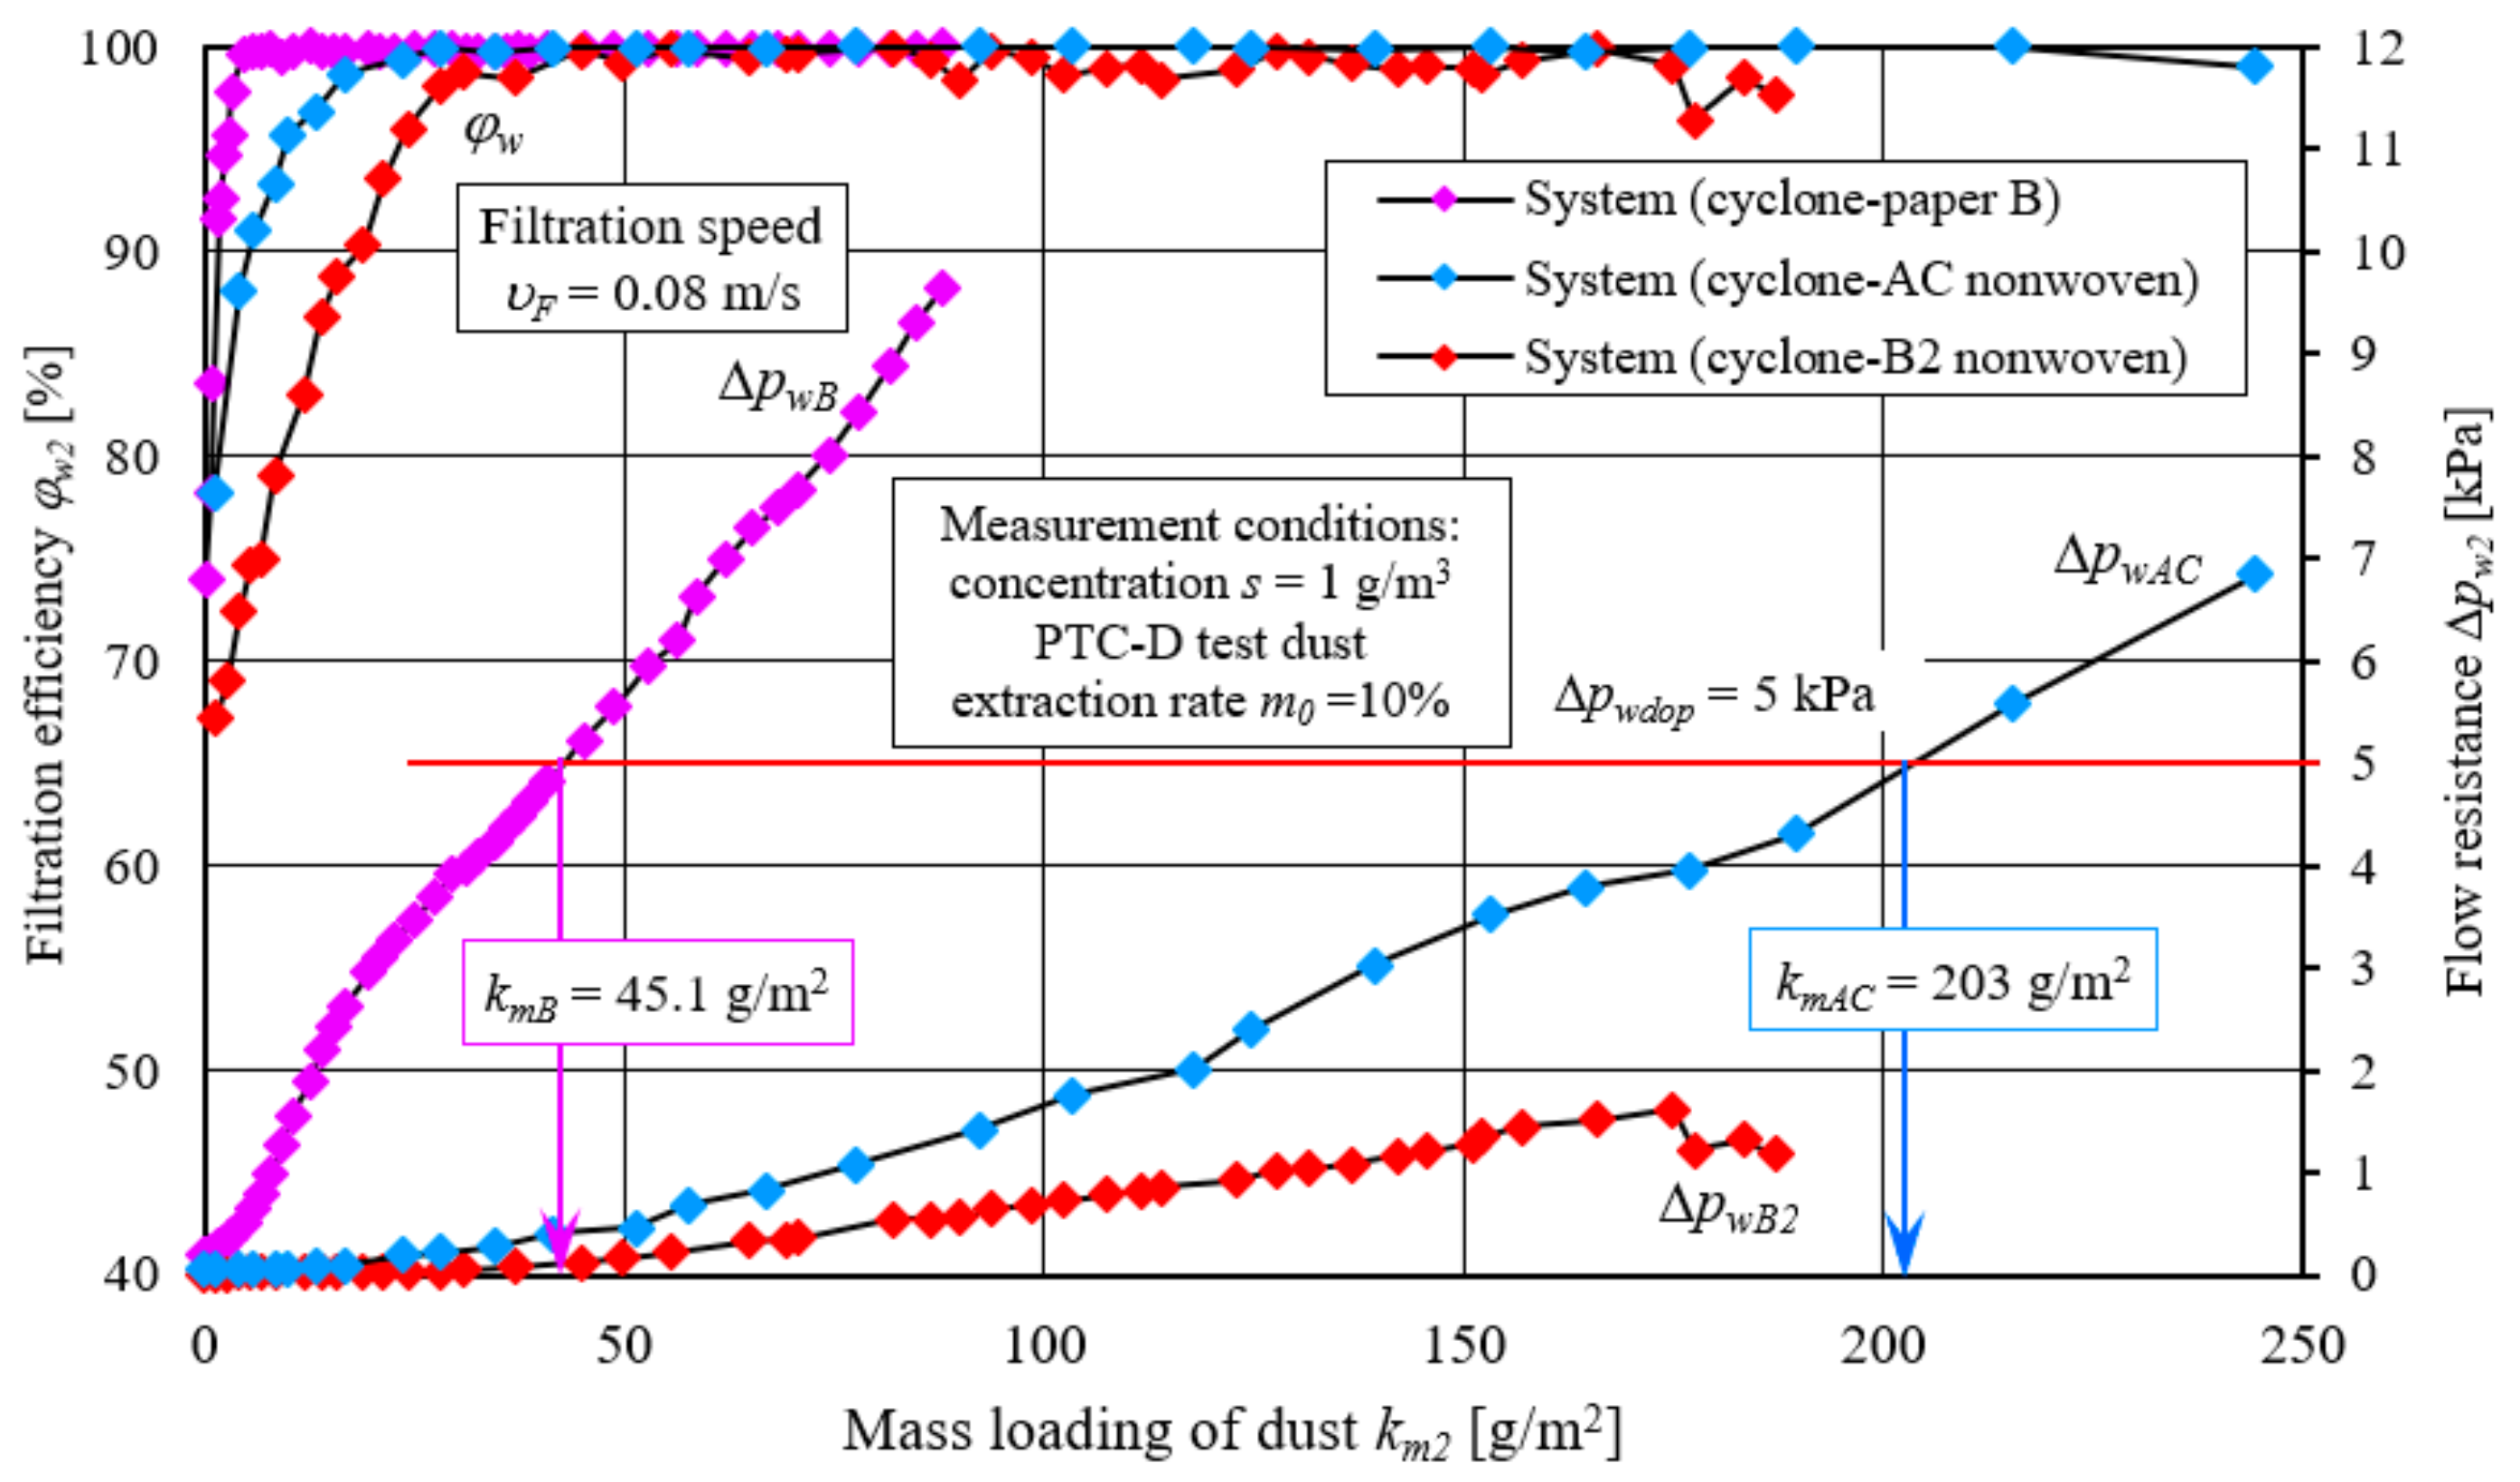

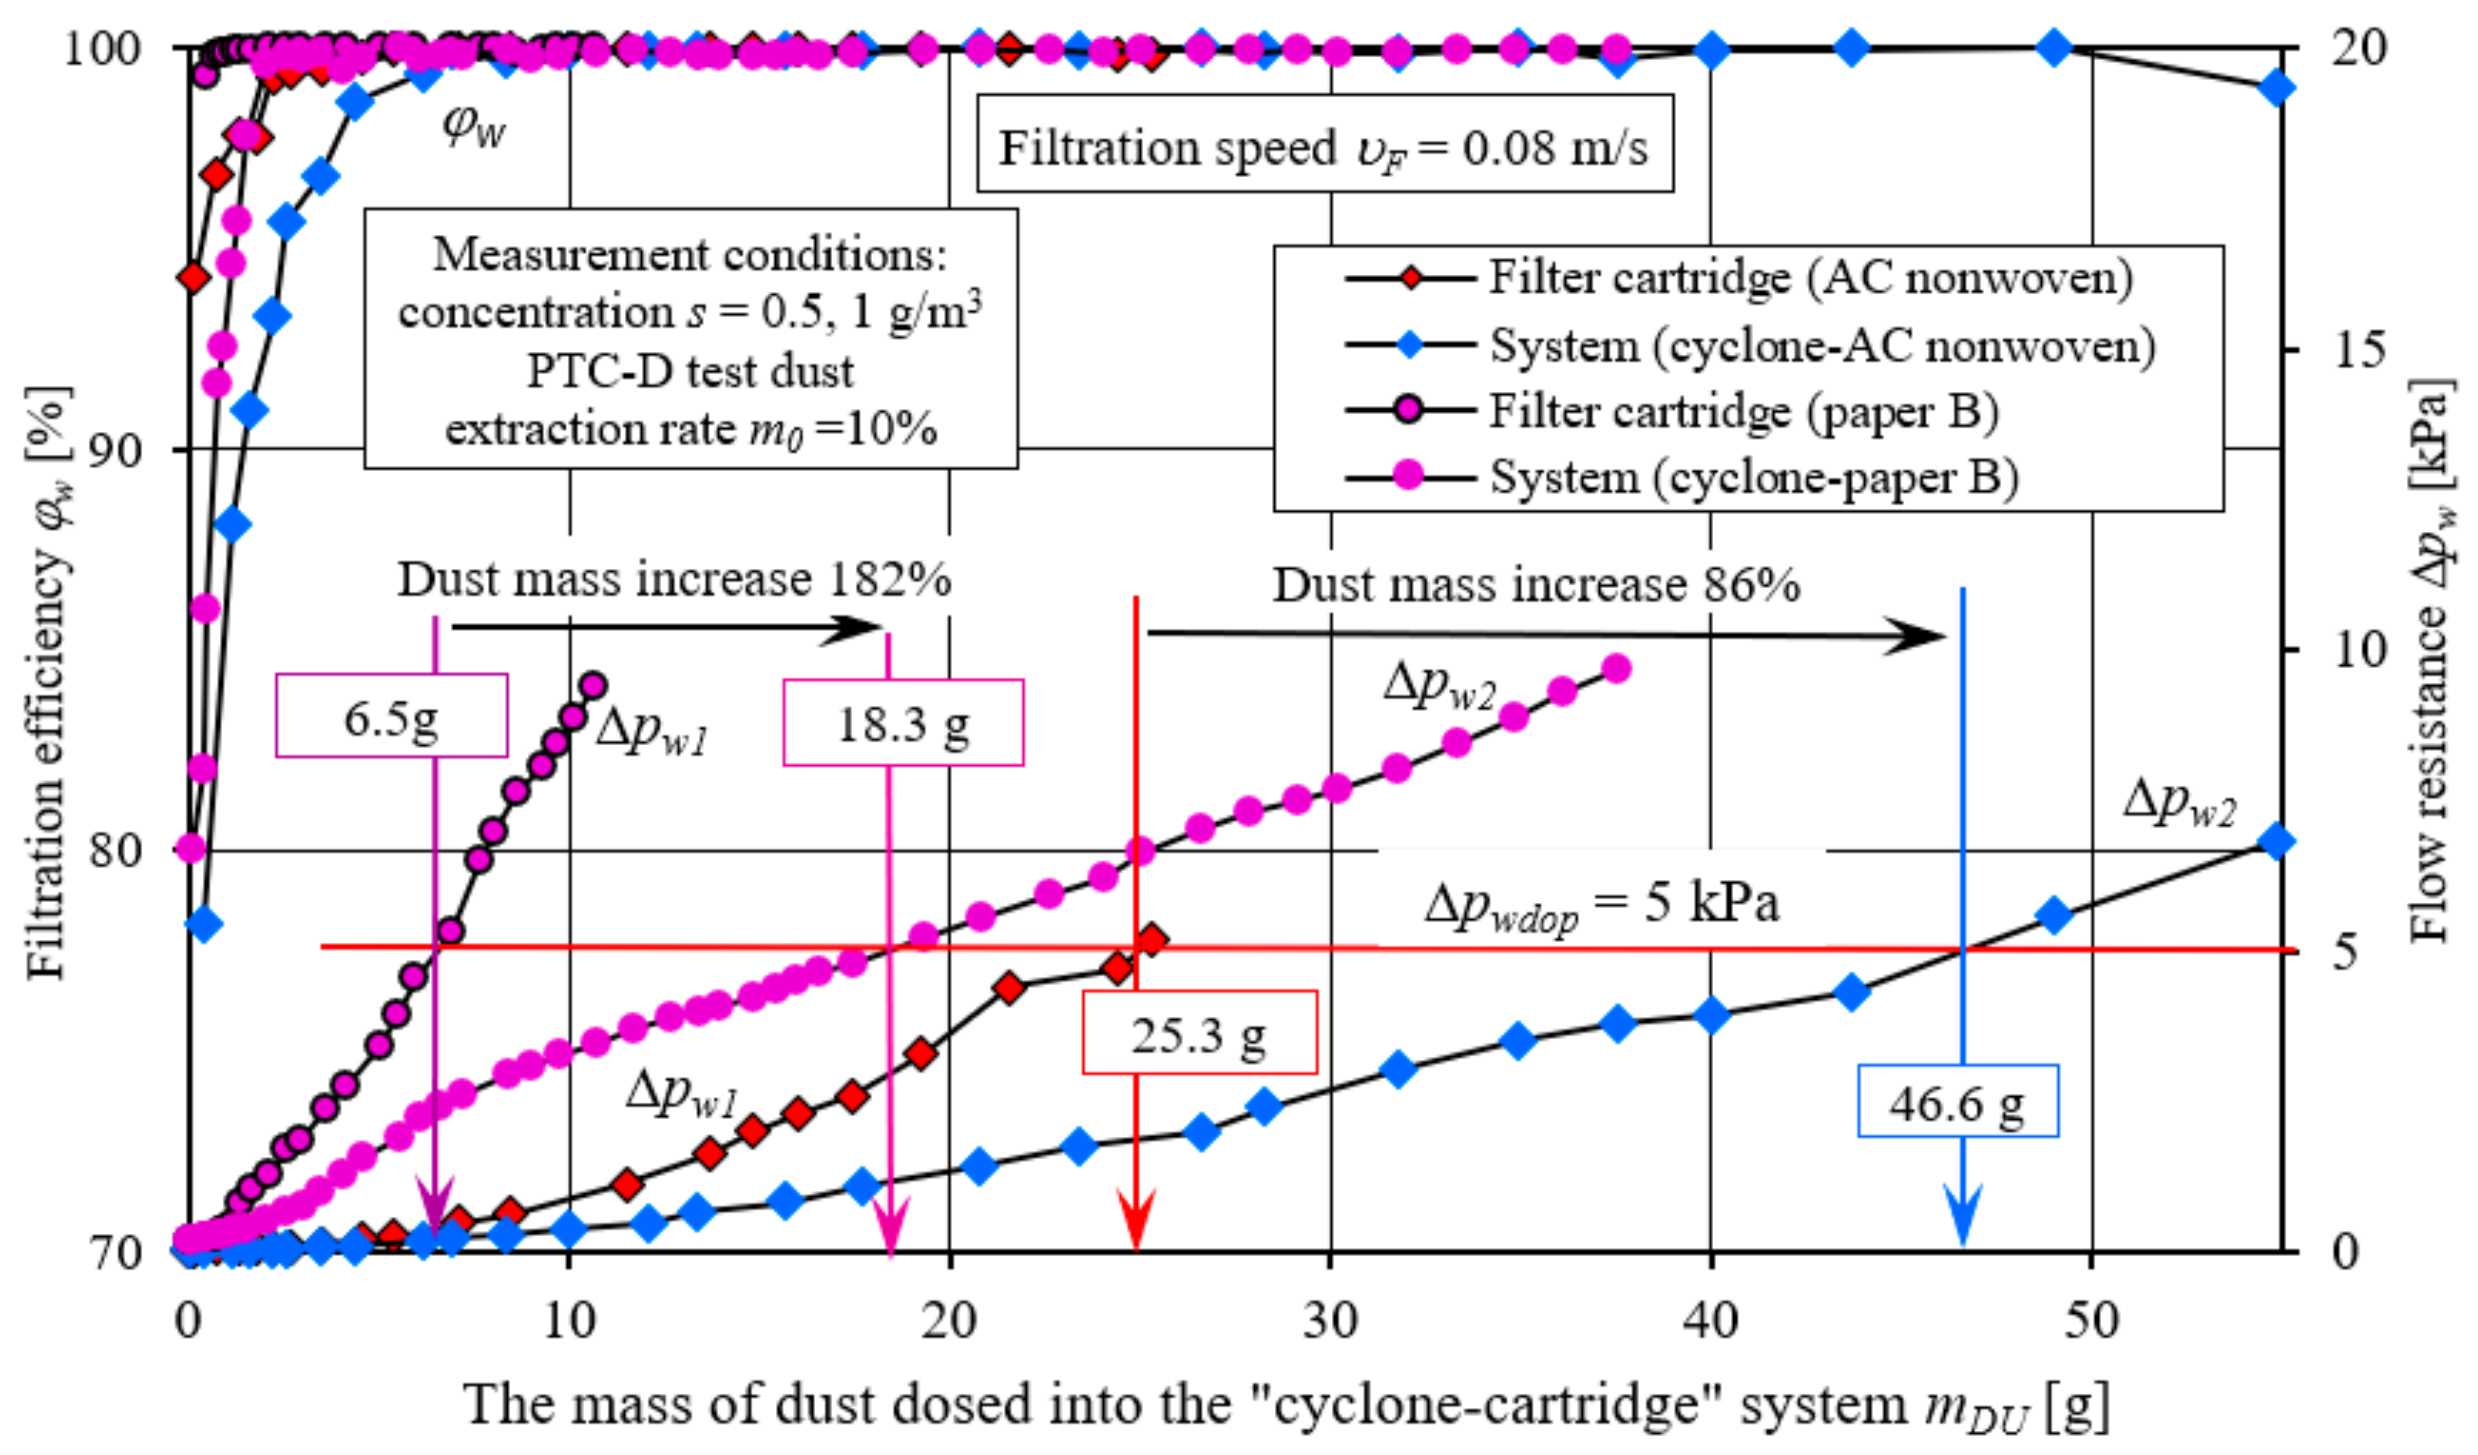
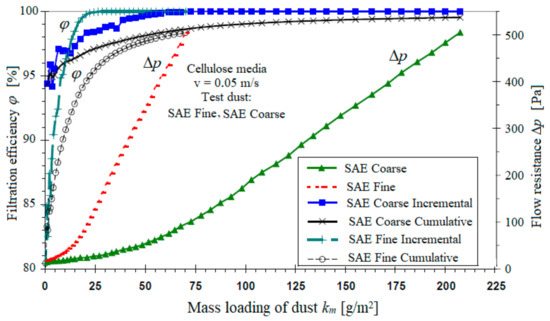
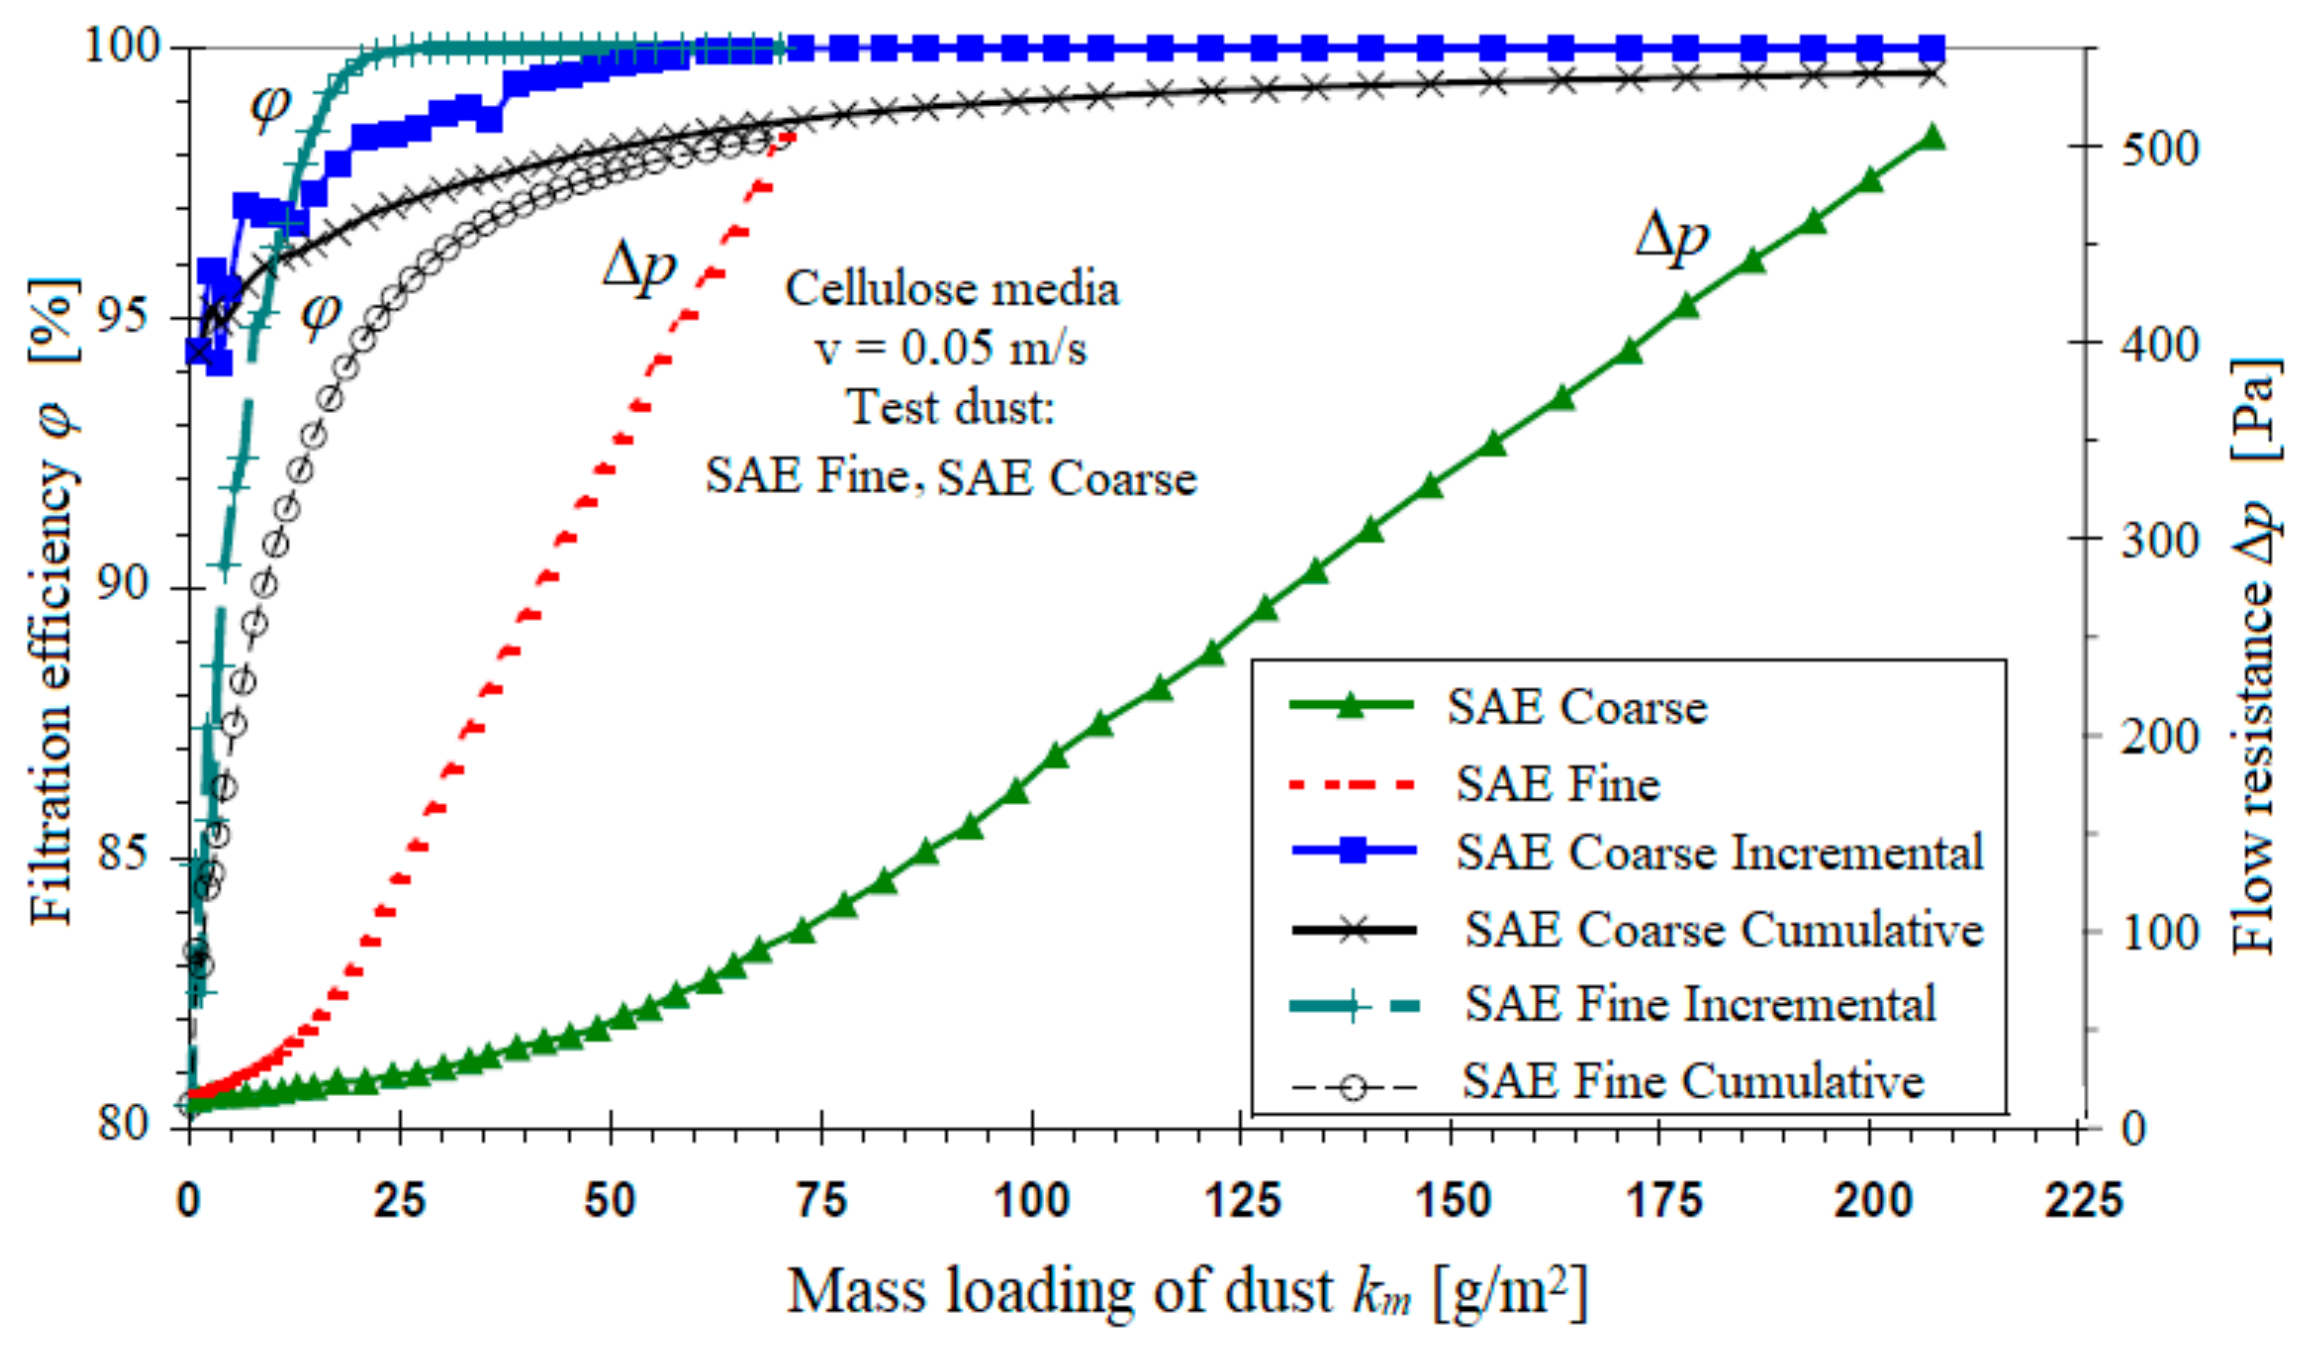
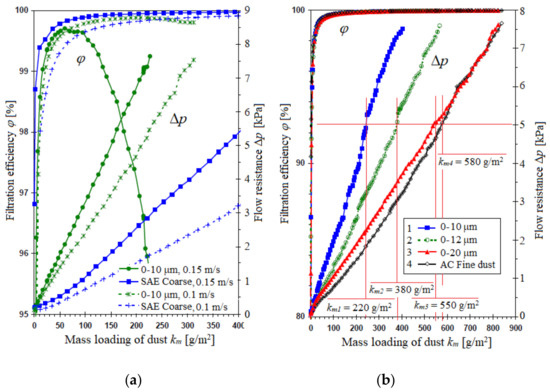
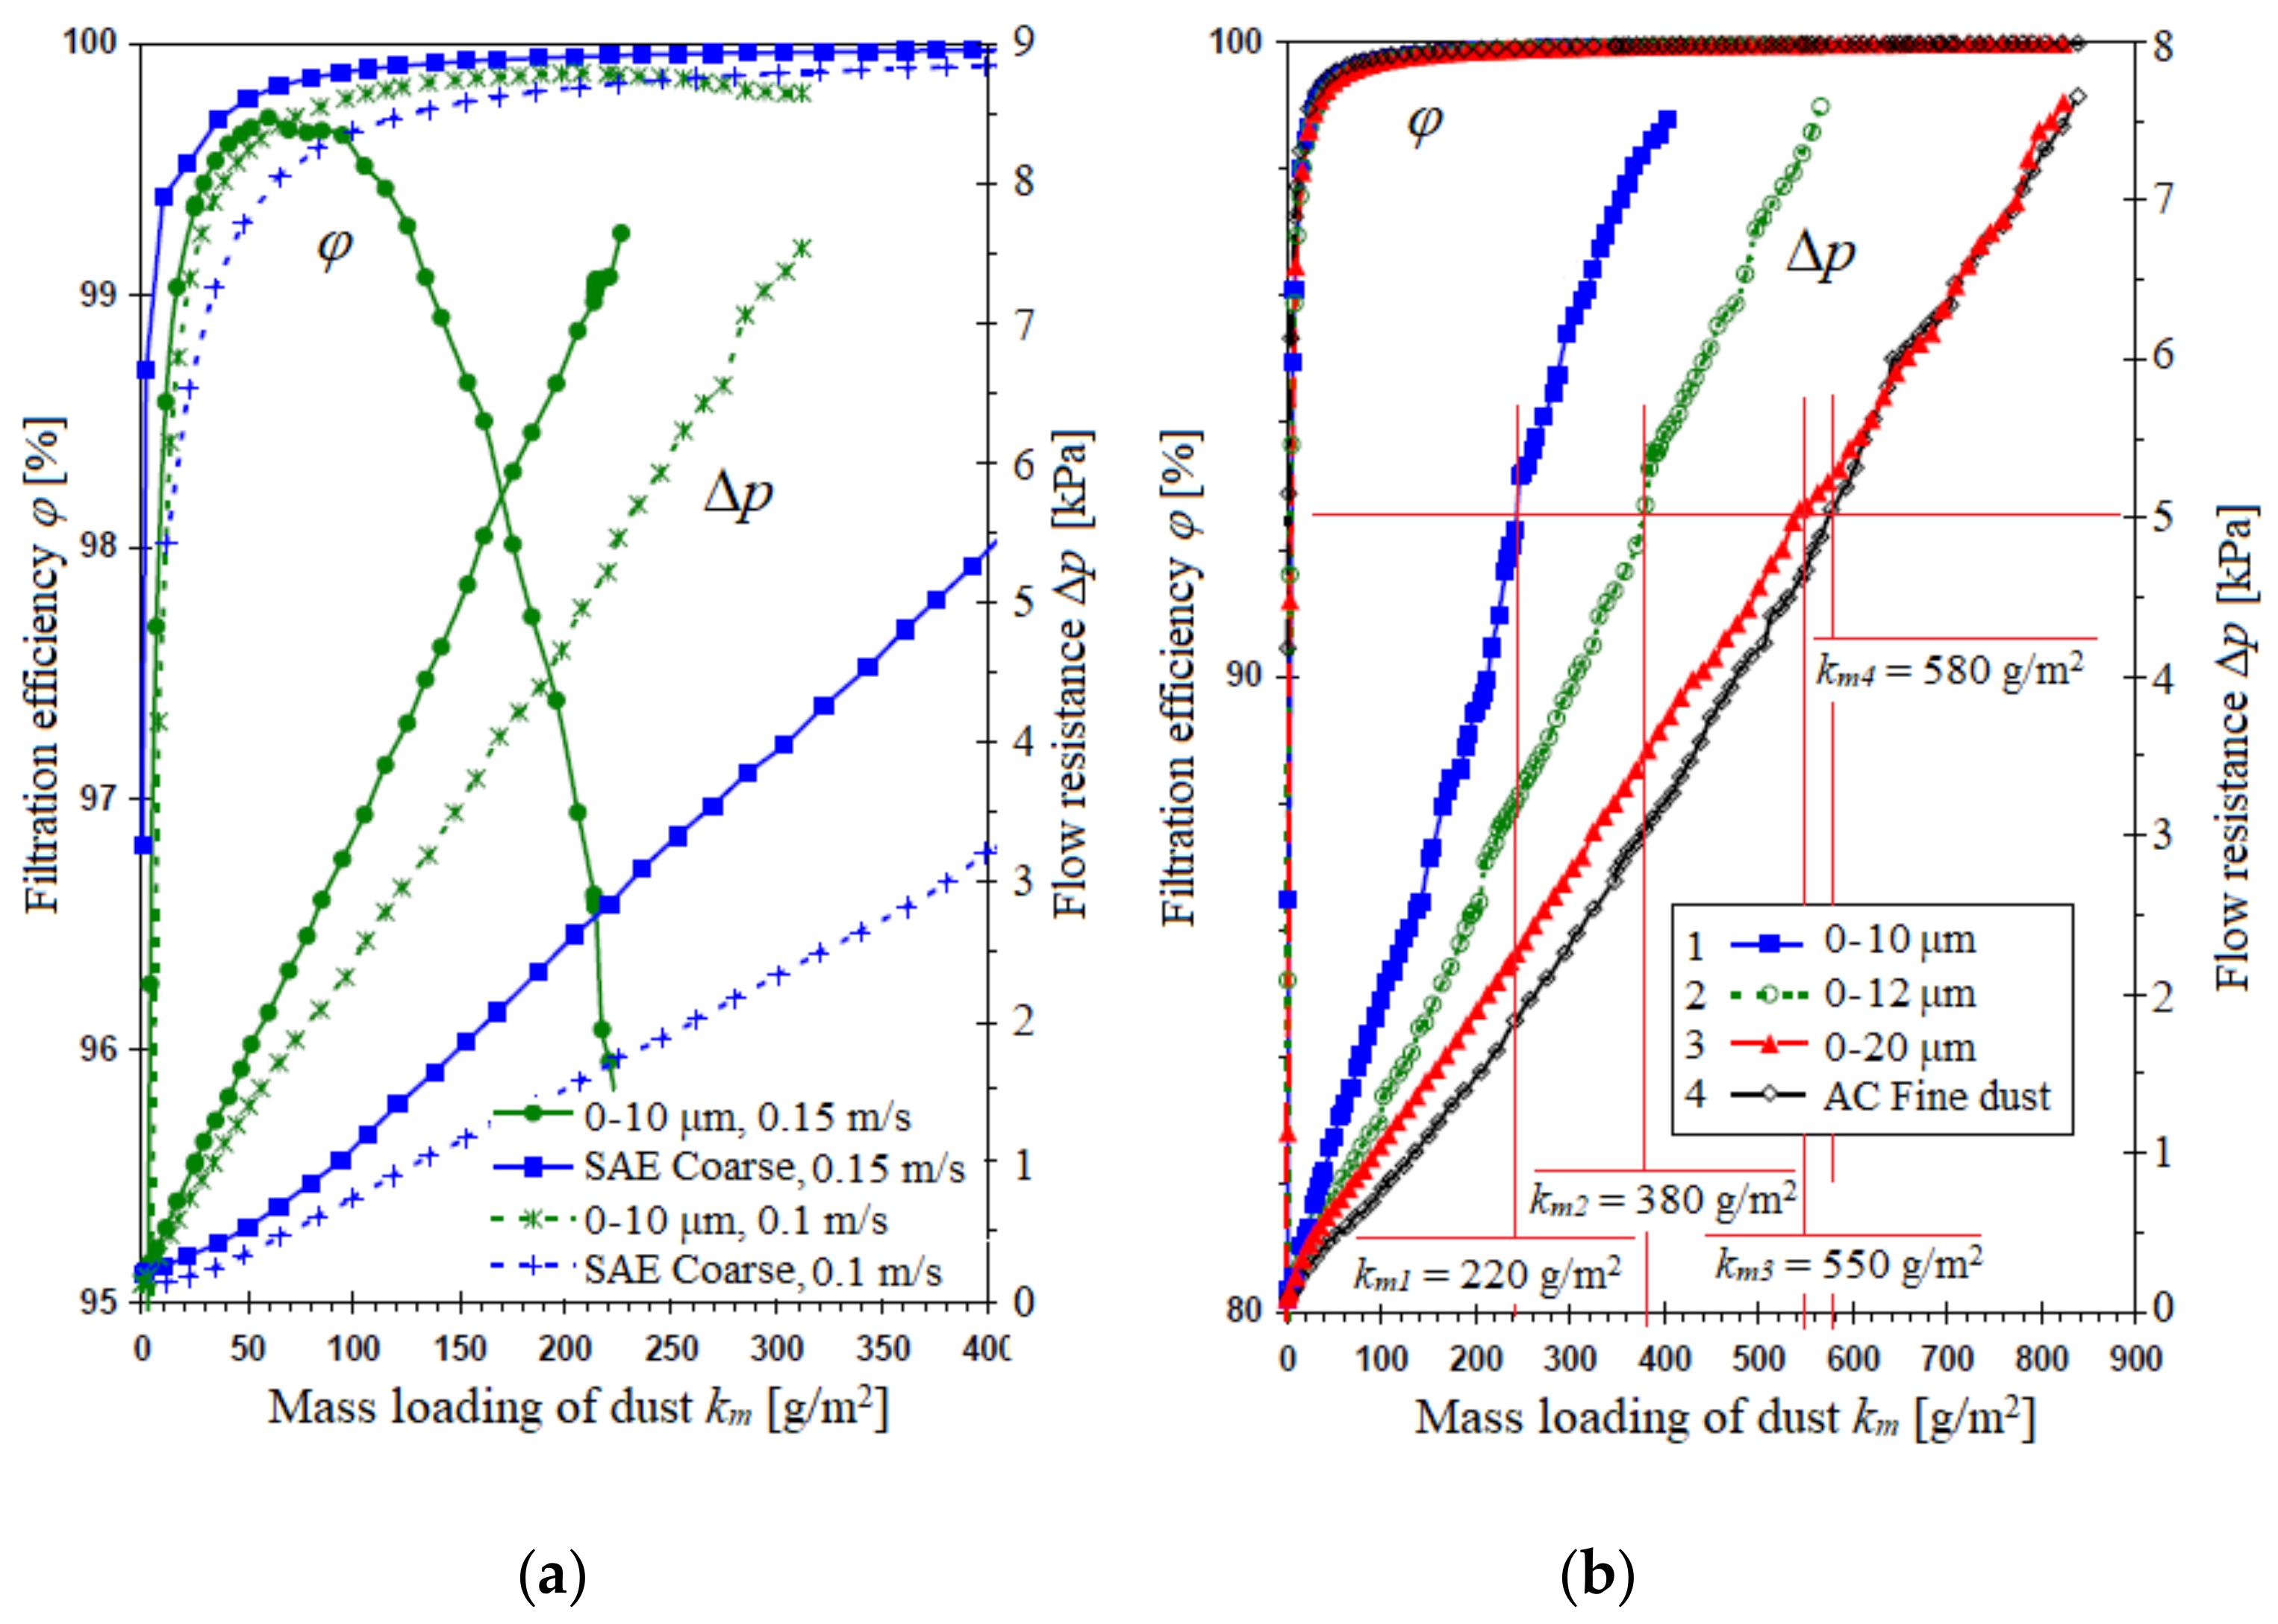

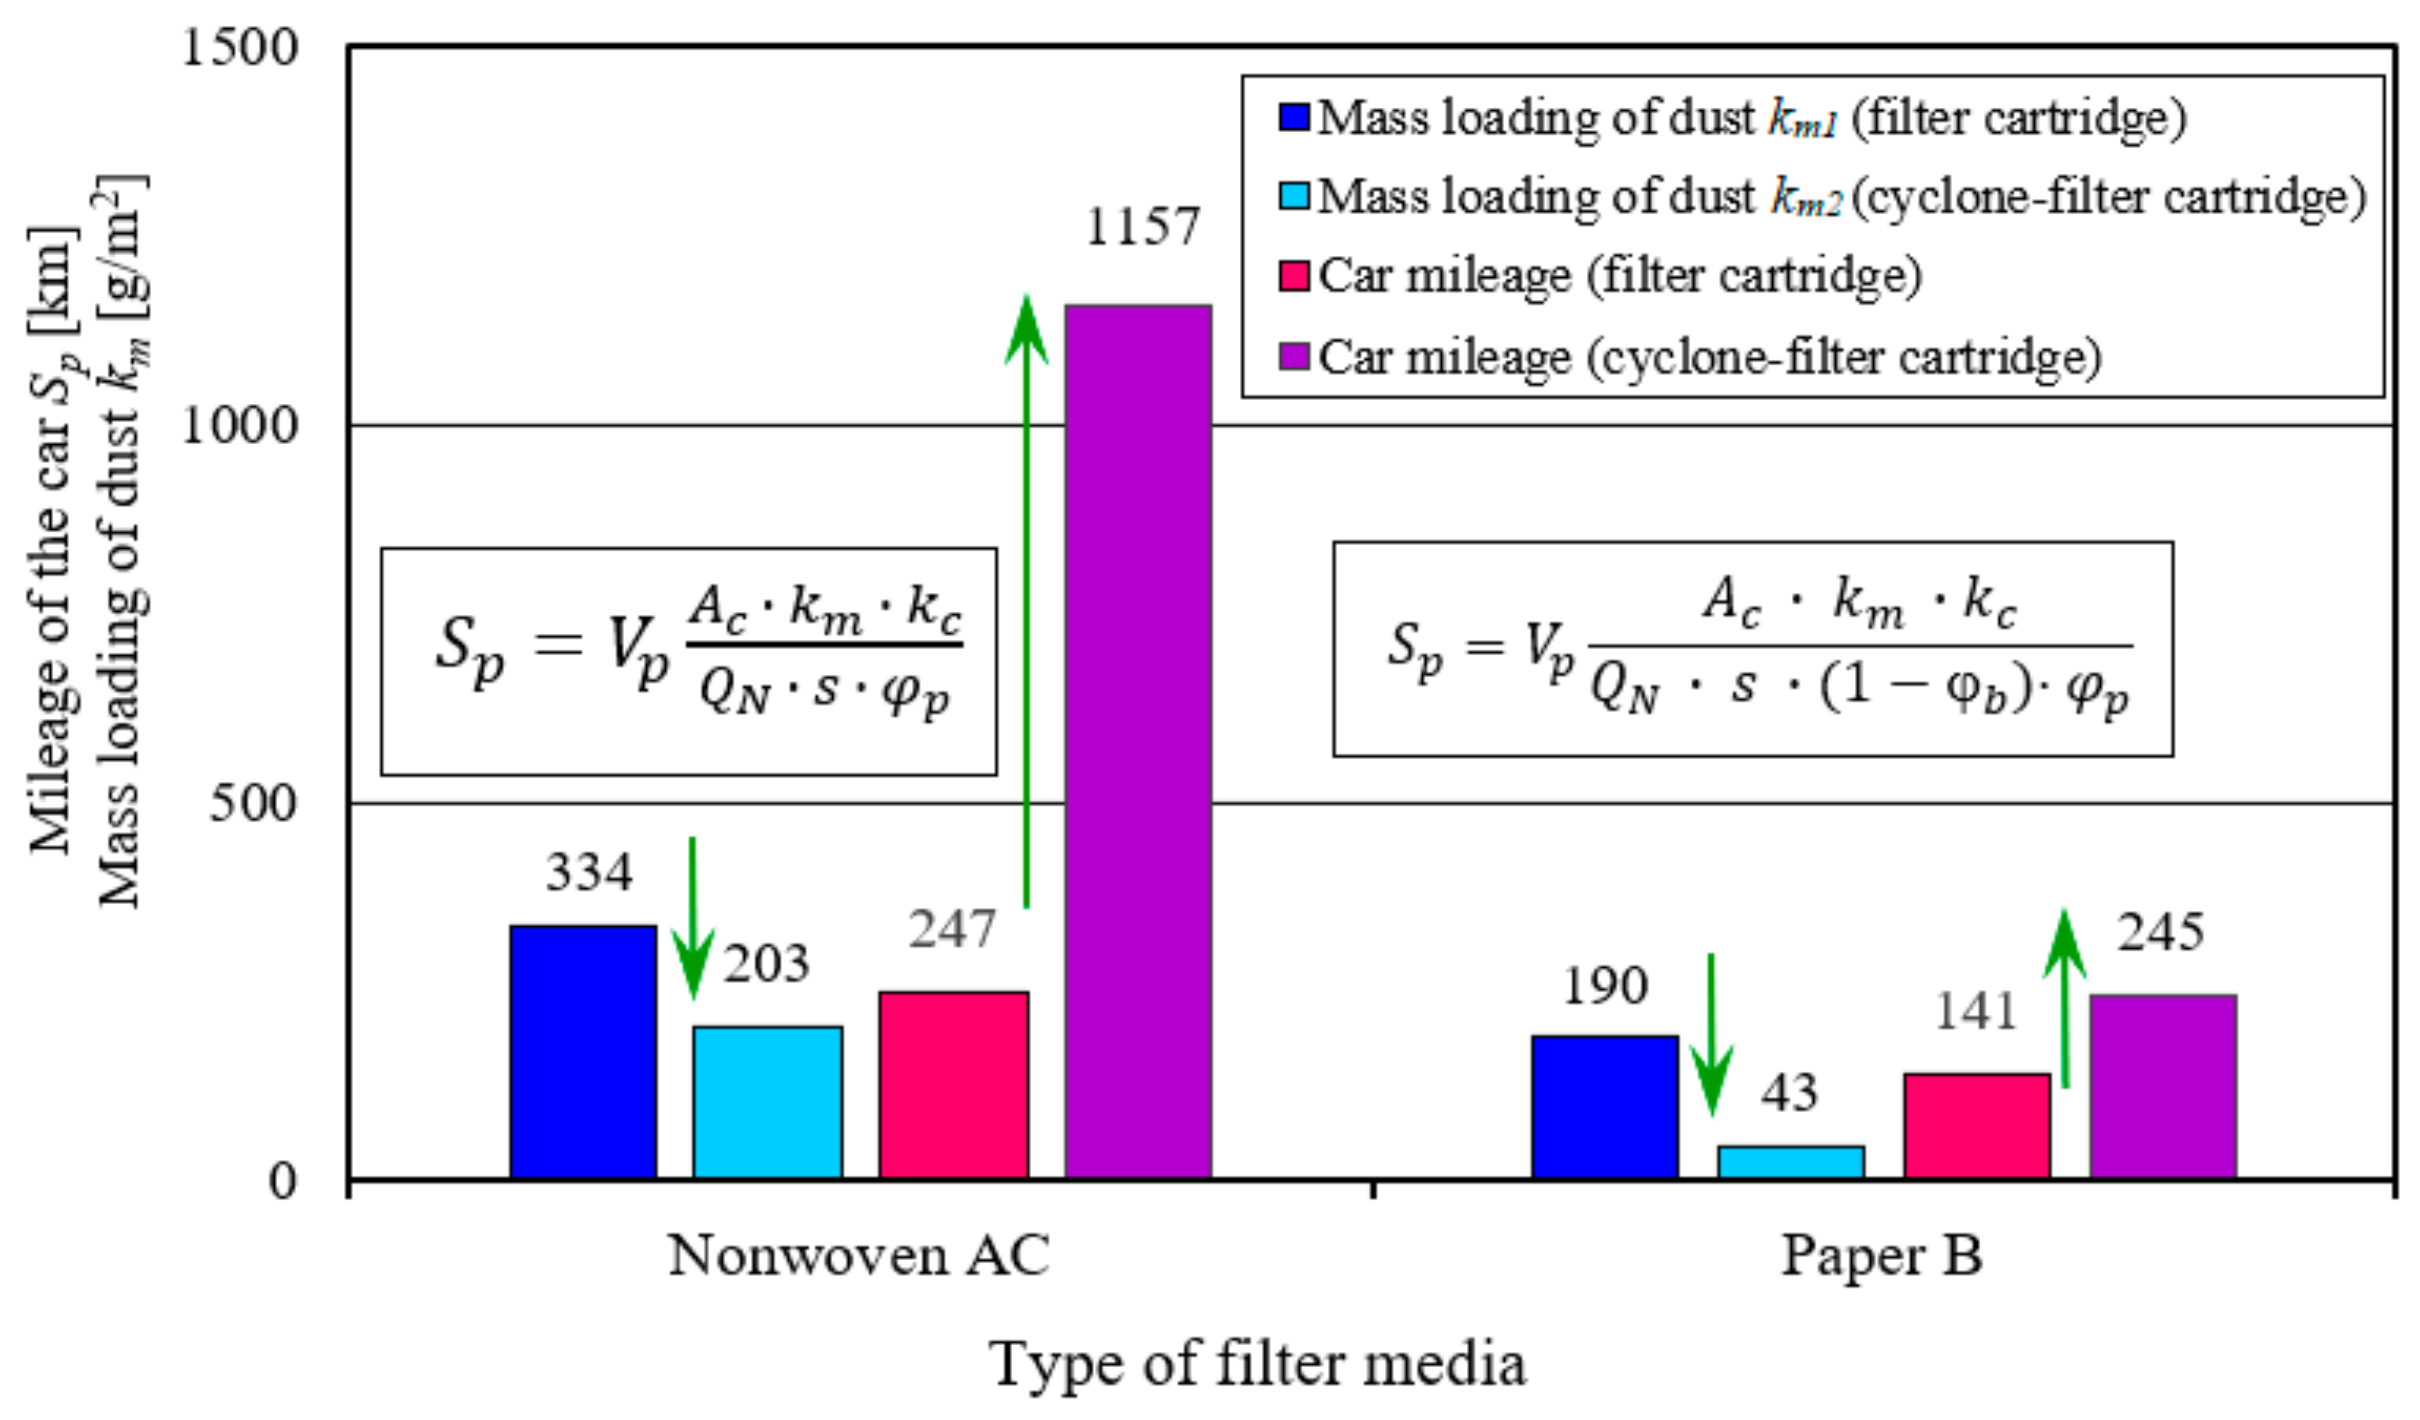
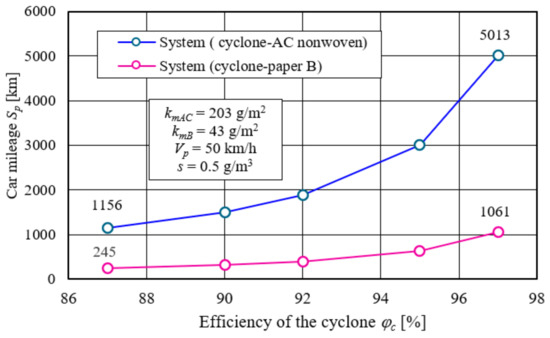


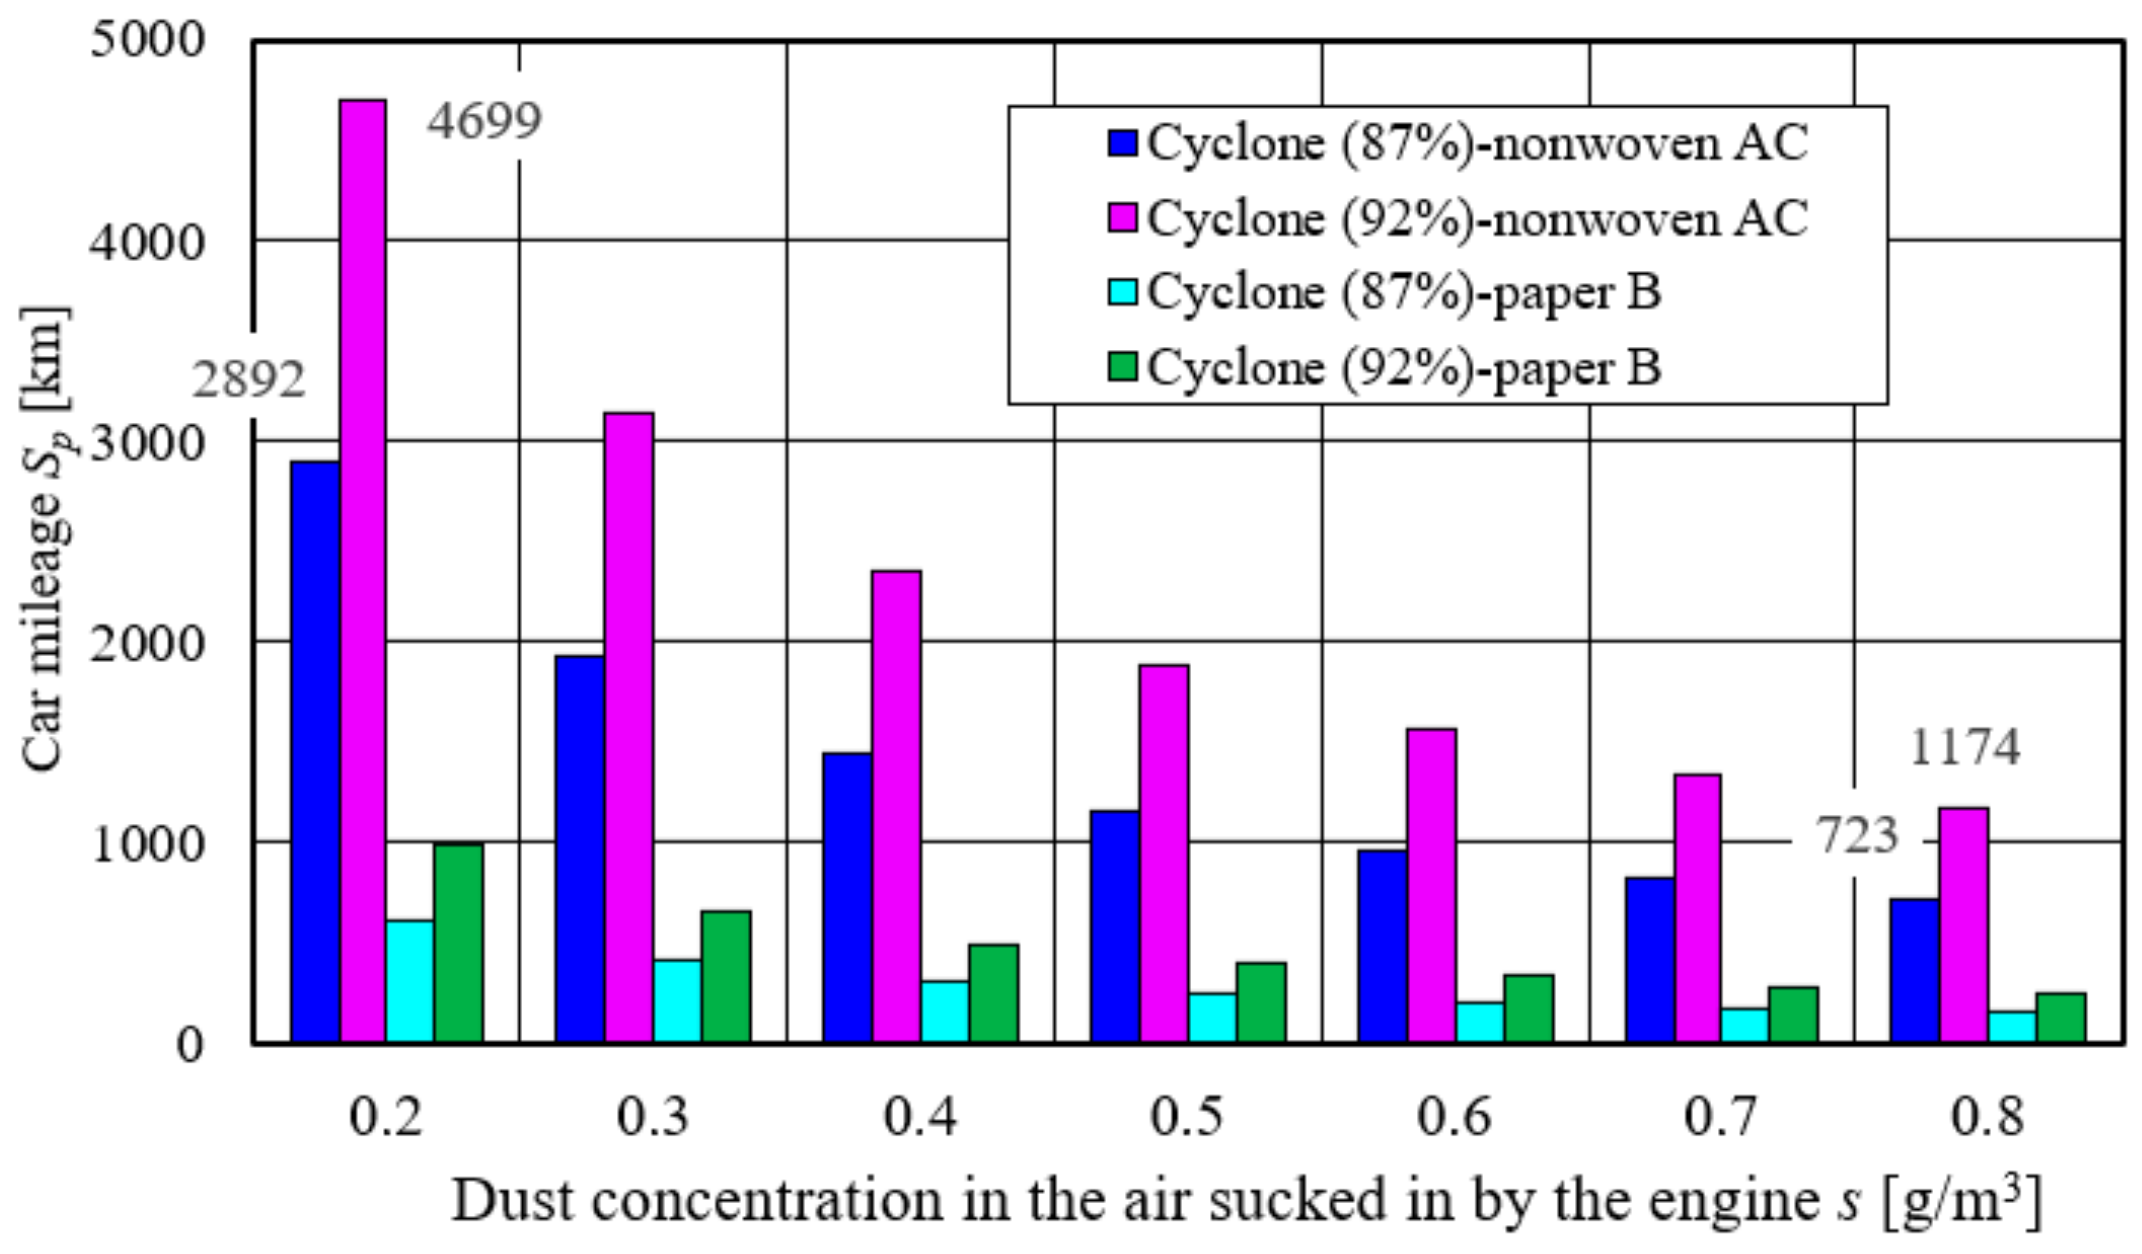

Disclaimer/Publisher’s Note: The statements, opinions and data contained in all publications are solely those of the individual author(s) and contributor(s) and not of MDPI and/or the editor(s). MDPI and/or the editor(s) disclaim responsibility for any injury to people or property resulting from any ideas, methods, instructions or products referred to in the content. |
© 2024 by the author. Licensee MDPI, Basel, Switzerland. This article is an open access article distributed under the terms and conditions of the Creative Commons Attribution (CC BY) license (https://creativecommons.org/licenses/by/4.0/).