Article

Numerical Study on Effect of Flow Field Configuration on Air-Breathing Proton Exchange Membrane Fuel Stacks

1
State Key Laboratory of Engines, Tianjin University, 135 Yaguan Road, Tianjin 300350, China
2
National Industry-Education Platform for Energy Storage, Tianjin University, 135 Yaguan Road, Tianjin 300350, China
3
China North Engine Research Institute (Tianjin), NO. 96, Yongjin Road, Beichen District, Tianjin 300400, China
4
Internal Combustion Engine Research Institute, Tianjin University, 92 Weijin Road, Tianjin 300072, China
*
Author to whom correspondence should be addressed.
Energies 2024, 17(11), 2501; https://doi.org/10.3390/en17112501
Submission received: 17 April 2024 / Revised: 2 May 2024 / Accepted: 17 May 2024 / Published: 23 May 2024
(This article belongs to the Special Issue Applications of Microfluidic Power Systems)

Abstract

:
Air-breathing proton exchange membrane fuel cells (PEMFCs) show enormous potential in small and portable applications because of their brief construction time without the need for gas supply, humidification and cooling devices. In the current work, a 3D multiphase model of single air-breathing PEMFCs is developed by considering the contact resistance between the gas diffusion layer and bipolar plate and the anisotropic thermal conduction and electric conductive in the through-plane and in-plane directions. The 3D model presents good grid independence and agreement with the experimental polarization curve. The single PEMFC with the best open area ratio of 55% achieves the maximum peak power density of 179.3 mW cm−2. For the fuel cell stack with 10 single fuel cells, the application of the anode window flow field is beneficial to improve the stack peak power density compared to the anode serpentine flow field. The developed model is capable of providing assistance in designing high-performance air-breathing PEMFC stacks.

1. Introduction

Recently, the rapid advancements in portable micro-electronic devices (e.g., mini laptops, micro biosensors, and mini unmanned aerial vehicles) have created urgent requirements to assemble a micro power source with high power density, long duration, and low cost [1,2,3]. Fuel cells serve as a highly efficient electrochemical reaction energy conversion device, which provides a promising solution to support the power of these micro-electronic devices [4,5,6]. As a kind of micro fuel cell, air-breathing proton exchange membrane fuel cells (PEMFCs) are fed by hydrogen from a micro hydrogen tank and oxygen from the air [7,8]. Thus, the subsystems, including the oxygen supply, cooling and humidification in traditional PEMFCs, are not necessary for the air-breathing PEMFCs, resulting in a simpler system with small volume and low weight [9,10].
Air-breathing PEMFCs have received great research interest and profuse investigations by researchers, aiming at achieving higher power density and output voltage [11]. For instance, Ferreira-Aparicio and Chaparro [12] analyzed the effects of characteristic parameters of cathode electrode materials, including gas diffusion layers (GDLs) and catalyst layers (CLs), on the transfer processes of oxygen, proton and water in Air-breathing PEMFC performance. Xu et al. [13] experimentally and numerically investigated the effects of the open ratio of cathode flow field configuration on the performance of high-temperature air-breathing PEMFCs. The authors obtained the highest power density (160 mW cm−2) under a cathode open ratio of 75%. A flow field with a condensing tower structure was developed to accelerate air transportation and improve the air-breathing PEMFC performance [14]. By optimizing the condensing tower structure curve of the flow field, they achieved a 55.2% improvement in the peak power density compared to the fuel cell with planar flow field. Bussayajarn et al. [15] performed performance and stability tests on air-breathing PEMFCs with three kinds of cathode flow fields (circular open, parallel slit, and oblique slit). The results show that the circular opening configuration has the smallest hydraulic diameter and shortest rib distance, resulting in the highest power density of 347 mW cm−3. Folgado et al. [16] developed a new cathodic plate with an array of columns for air-breathing fuel cells, and the innovative structure of the columnar plate is favorable to eliminating the liquid water produced in the cathode, resulting in an enhancement in air-breathing fuel cell performance comparing to the perforated planar plate. Therefore, the flow channel structures and open area of the cathodic flow field significantly influence the reactant transfer and liquid water elimination, which are vital to the air-breathing PEMFC performance [17]. However, the unclear mechanism of the mass transfer and electrochemical reaction process in air-breathing PEMFCs with various flow fields hinders its development and application in portable energy devices.
To meet the voltage demand of practical micro electro-device applications, different numbers of air-breathing PEMFCs need to be assembled as fuel cell stacks. For instance, Sapkota et al. [18] reported a 12-celled cylindrical stack with a higher self-breathing function, which achieves a maximum power density of 1 W cm−2. Chen et al. [19] analyzed an air-cooled PEMFC stack performance with an air supply system in the blow and exhaust modes. They found that the blow mode is beneficial to improving the output voltage and temperature uniformity of the stack compared to that using exhaust mode. Generally, the application of parallel or serpentine flow channels in each internal single cell will cause larger pressure drops and less liquid water remaining in the cathode membrane electrode, resulting in a large pump power loss and membrane dehydration. Thus, Lee et al. [20] proposed an innovative design for the cathode flow field to accelerate the air supplies and retain the moisture in the CL. Their new cathode flow field presents a high O2 concentration and a low temperature in cathode CL compared to conventional flow fields, resulting in a high-performance air-breathing PEMFC stack. All of the above fuel cell stacks possess compact structures, which usually require an air fan to remove the waste heat, resulting in system complexity and extra energy consumption by the fan.
Compared with the fuel cell with a stacked structure, the cell stacked with a planar structure does not need compressors or blowers [21]. Min et al. [22] constructed a planar and modular air-breathing PEMFC stack on the base of a printed circuit board. The highest peak power density of 0.6 W cm−2 is obtained under forced air flow condition. Kim et al. [23] used silicone adhesive bonding to fabricate the air-breathing PEMFC stack with an anode bipolar plate/membrane assembly unit. The properties of the assembly unit including bonding strength, gas sealability and stack performance were tested under various operating conditions. Chen et al. [24] explored the air-breathing PEMFC stack with a planar structure. From their results, the serial-connected stack achieves a higher power density than that of the parallel-connected stack under consistent conditions. However, the planar stacks with different connected modes meet the challenges of hydrogen supply and reactant uniformity.
The parallel or serpentine flow fields used in the above-reported research still meet the challenge of inconsistent distributions of the reactant gases and the unclear interaction between the reactant gases on the cathode and anode sides [25]. Therefore, a 3D multiphase model of an air-breathing PEMFC was developed to investigate the internal processes of mass and heat transfer and electron and proton conduction. The model considers the contact resistances between the bipolar plate and GDL and the anisotropic thermal conduction and electric conductive in the through-plane and in-plane directions. With this 3D single-cell model, the influence of the cathode flow fields with various open area ratios on fuel cell performance was investigated. Then, a new type of stack structure with window structures both in the cathode and anode sides was proposed in this research. The corresponding 3D fuel cell stack model was constructed to understand the effects of the anode window flow field and traditional anode serpentine flow field on the planar stack performance. Our work might shed light on explaining the transfer mechanism of reaction gases in the stack with different anode flow field structures and inspire new design strategies for high-power dense air-breathing PEMFCs.

2. Numerical Method

2.1. Description of the Computation Domain

To consider the air-flowing behavior in a real room environment, the calculation domain of our model contains not only the air-breathing PEMFC but also the extended air domain (Figure 1). To guarantee the simulation accuracy, the PEMFC is assumed to be placed in a big open-air chamber, and the size of the air chamber is six times the thickness and three times the length and width of the air-breathing PEMFC [26]. With this assumption of a large air chamber, the air flow will not be disturbed by external environmental conditions (e.g., temperature and pressure) in our model, and the consideration of the large air space can describe the oxygen distribution in the single-cell model. Taking the air-breathing PEMFC stack with window flow fields as an example, the hydrogen gas space is the transparent rectangle above the window flow field. A repeating unit with symmetrical boundary conditions is usually chosen for calculation to improve computing efficiency. In air-breathing PEMFCs, the current collectors at the anode or cathode sides are designed according to the serpentine or window flow field structures. When assembling the PEMFC, the compressive deformation of GDL is inevitable under the pre-tightening force. Because the same grid plates are used at the anode and cathode, the assumption of a consistent GDL compression rate is reasonable.

2.2. Governing Equations

On the basis of the first conservation law, the 3D multiphase single-fuel-cell model contains the mass conservation equation, momentum conservation equation and energy conservation equation, which can be used to describe the gas and liquid flowing behavior and heat transfer process in the flow field, GDL, MPL and CL [27]. The mass conservation equation is written as follows:
t ( ε ( 1 s ) ρ g ) + ( ρ g u g ) = S m
where ρ g , ε , u g , t , s and S m are the gas density (kg m−3), porosity, gas velocity (m s−1), time (s), liquid saturation and the source term of mass transfer.
The momentum conservation equation is written as follows:
t ( ρ g u g ε ( 1 s ) ) + ( ρ g u g u g ε 2 ( 1 s ) 2 ) = P g + μ g ( ( u g ε ( 1 s ) ) + ( u g T ε ( 1 s ) ) ) 2 3 μ g ( ( u g ε ( 1 s ) ) ) + S u
where μ g , P g , and S u are gas dynamic viscosity (kg m−1 s−1), gas pressure (Pa), and the source term of gas velocity.
The species equation is used to describe the gaseous reactant transportation, which is written as follows:
t ( ε s g ρ g Y i ) + · ( ρ g u g Y i ) = · ( ρ g D i eff Y i ) + S i
where Y i and D i eff represent the mass fraction of gas species i and the effective diffusion coefficient (m2 s−1).
The capillary pressure is the main driving force for liquid water in the porous structures in GDL and MPL, and the liquid pressure equation is written as follows:
t ( ρ l ε s ) = ( ρ l K k l μ l P l ) + S l
where ρ l , K , k l , μ l and P l are liquid density (kg m−3), intrinsic permeability (m2), relative permeability of liquid water (m2), liquid dynamic viscosity (kg m−1 s−1) and liquid pressure (Pa).
The proton and electron transport processes are calculated by the ion potential and electric potential equations, namely, Equations (5) and (6), respectively.
0 = · ( κ ion eff φ ion ) + S ion
0 = · ( κ e eff φ e ) + S e
where φ e , κ ion eff , φ ion and κ e eff , are proton potential (V), ionic conductivity (S m−1), electric potential (V), and effective electric conductivity (S m−1).
The energy conservation equation is given as follows:
t ( ε s l ρ l C p , l T + ε s g ρ g C p , g T ) + · ( ε s l ρ l C p , l u l T + ε s g ρ g C p , g u g T ) = · ( k eff T ) + S T
where C p , g , C p , l , k eff   T , and S T are the gas heat capacity (J mol−1 K−1), liquid heat capacity (J mol−1 K−1), effective thermal conductivity (W m−1 K−1), temperature (T) and heat generation source term.
Subscripts g and l represent the gas mixture and the liquid water, respectively. All of the source items in different equations and parameters in the simulation are introduced in Table 1 and Table 2. The carbon paper, Pt/C particle and Nafion 211 are used to fabricate the GDL, CL and membrane, respectively. More detailed information for the current model can be found in the reported papers [28,29,30].

2.3. The Compression of GDL

In the current study, the GDLs at the anode and cathode are considered to be deformed uniformly during the assembly processes [31,32], and the physical parameters of GDL, such as thermal conductivity, electrical conductivity, porosity, and permeability, will change with the varying compressibility. Specifically, our model takes into account the anisotropic thermal conduction and electric conductive, which are seldom considered in traditional 3D simulation [33,34].
The GDL thickness δ new   (m) is obtained by calculating the assembly pressure force P C (Pa) and the original assembly pressure force P C * (Pa) [35], which is written as follows:
δ original   δ new   δ original   = 0.449 [ 1 exp ( 1.063 P C P C * ) ] , P C 1   MPa
Thus, the formula of new porosity ε new   is given as follows:
ε new   = 1 ( 1 ε original   ) δ original   δ new  
The anisotropic permeability k eff (m2) along the through-plane and in-plane directions are presented as follows:
k eff k S = { 1 0.975 ( 1 ε ) 0.002 exp [ 0.865 ( 1 ε ) ] [ 3 ε 3 ( 1 ε ) ]  through-plane 1 0.997 ( 1 ε ) 0.009 exp [ 0.344 ( 1 ε ) ] [ 3 ε 3 ( 1 ε ) ]  in-plane
The electrical conductivity κ (S m−1) is given as follows:
κ d 2 = 0.012 ε ( π 2 16 ( 1 ε ) 2 π 2 ( 1 ε ) + 1 ) ( 1 + 0.72 1 ε ( ε 0.11 ) 0.54 ) , d = 9.3   μ m
The equation of effective electric conductivity σ eff (S m−1) is described as follows:
σ eff σ S = ( 1 ε ) m , m = 3.4
The effective parameter is represented by the subscript eff, and the original state is represented by the subscript origin, 0, s. It is worth noting that the relationship between the strain behavior and the assembly pressure force in Equation (8) is reasonable only when the assembly pressure is less than 1 MPa [36]. This also satisfies the requirement in practical applications, where the compression range of GDL is 15%~30%.

2.4. Boundary Conditions

The anode inlet boundary adopts the hydrogen mass flow m a , while the anode outlet boundary is equal to atmospheric pressure. The anode mass flow is controlled by adjusting the hydrogen stoichiometry and can be obtained by calculating Equations (13) and (14):
m a = ρ g a I ξ a A act 2 F C H 2
C H 2 = P g , out a + Δ P g a R H a P sat R T
where A act (m2), ξ , P sat (Pa) and R H are active area, stoichiometric ratio, water saturation pressure and relative humidity (RH), respectively. In terms of the electronic potential boundary conditions, the anode end plate is equal to the total overpotential, while zero potential is defined as the cathode end plate.
The window and channel structures of flow fields are open to the air chamber directly. In our model, the air migrates from the air chamber to the cathode current collector, GDL and CL through natural convection. To prevent disturbance of the cathode inlet configuration, the calculation domain is extended by 3 times the fuel cell geometrical configuration. Thus, the ambient pressure is considered to be undisturbed at the cathode inlet. As a consequence, the free pressure condition is considered to be the cathode inlet boundary condition when the air chamber is big enough [26,37]. In our model, the governing equations of momentum, energy and mass are solved by using ANSYS Fluent software (19.1). In the porous electrode, the source terms in each equation are coded and calculated by the UDF [38]. All of the physical and operation parameters in the current calculation are introduced in Table 2.

3. Results and Discussion

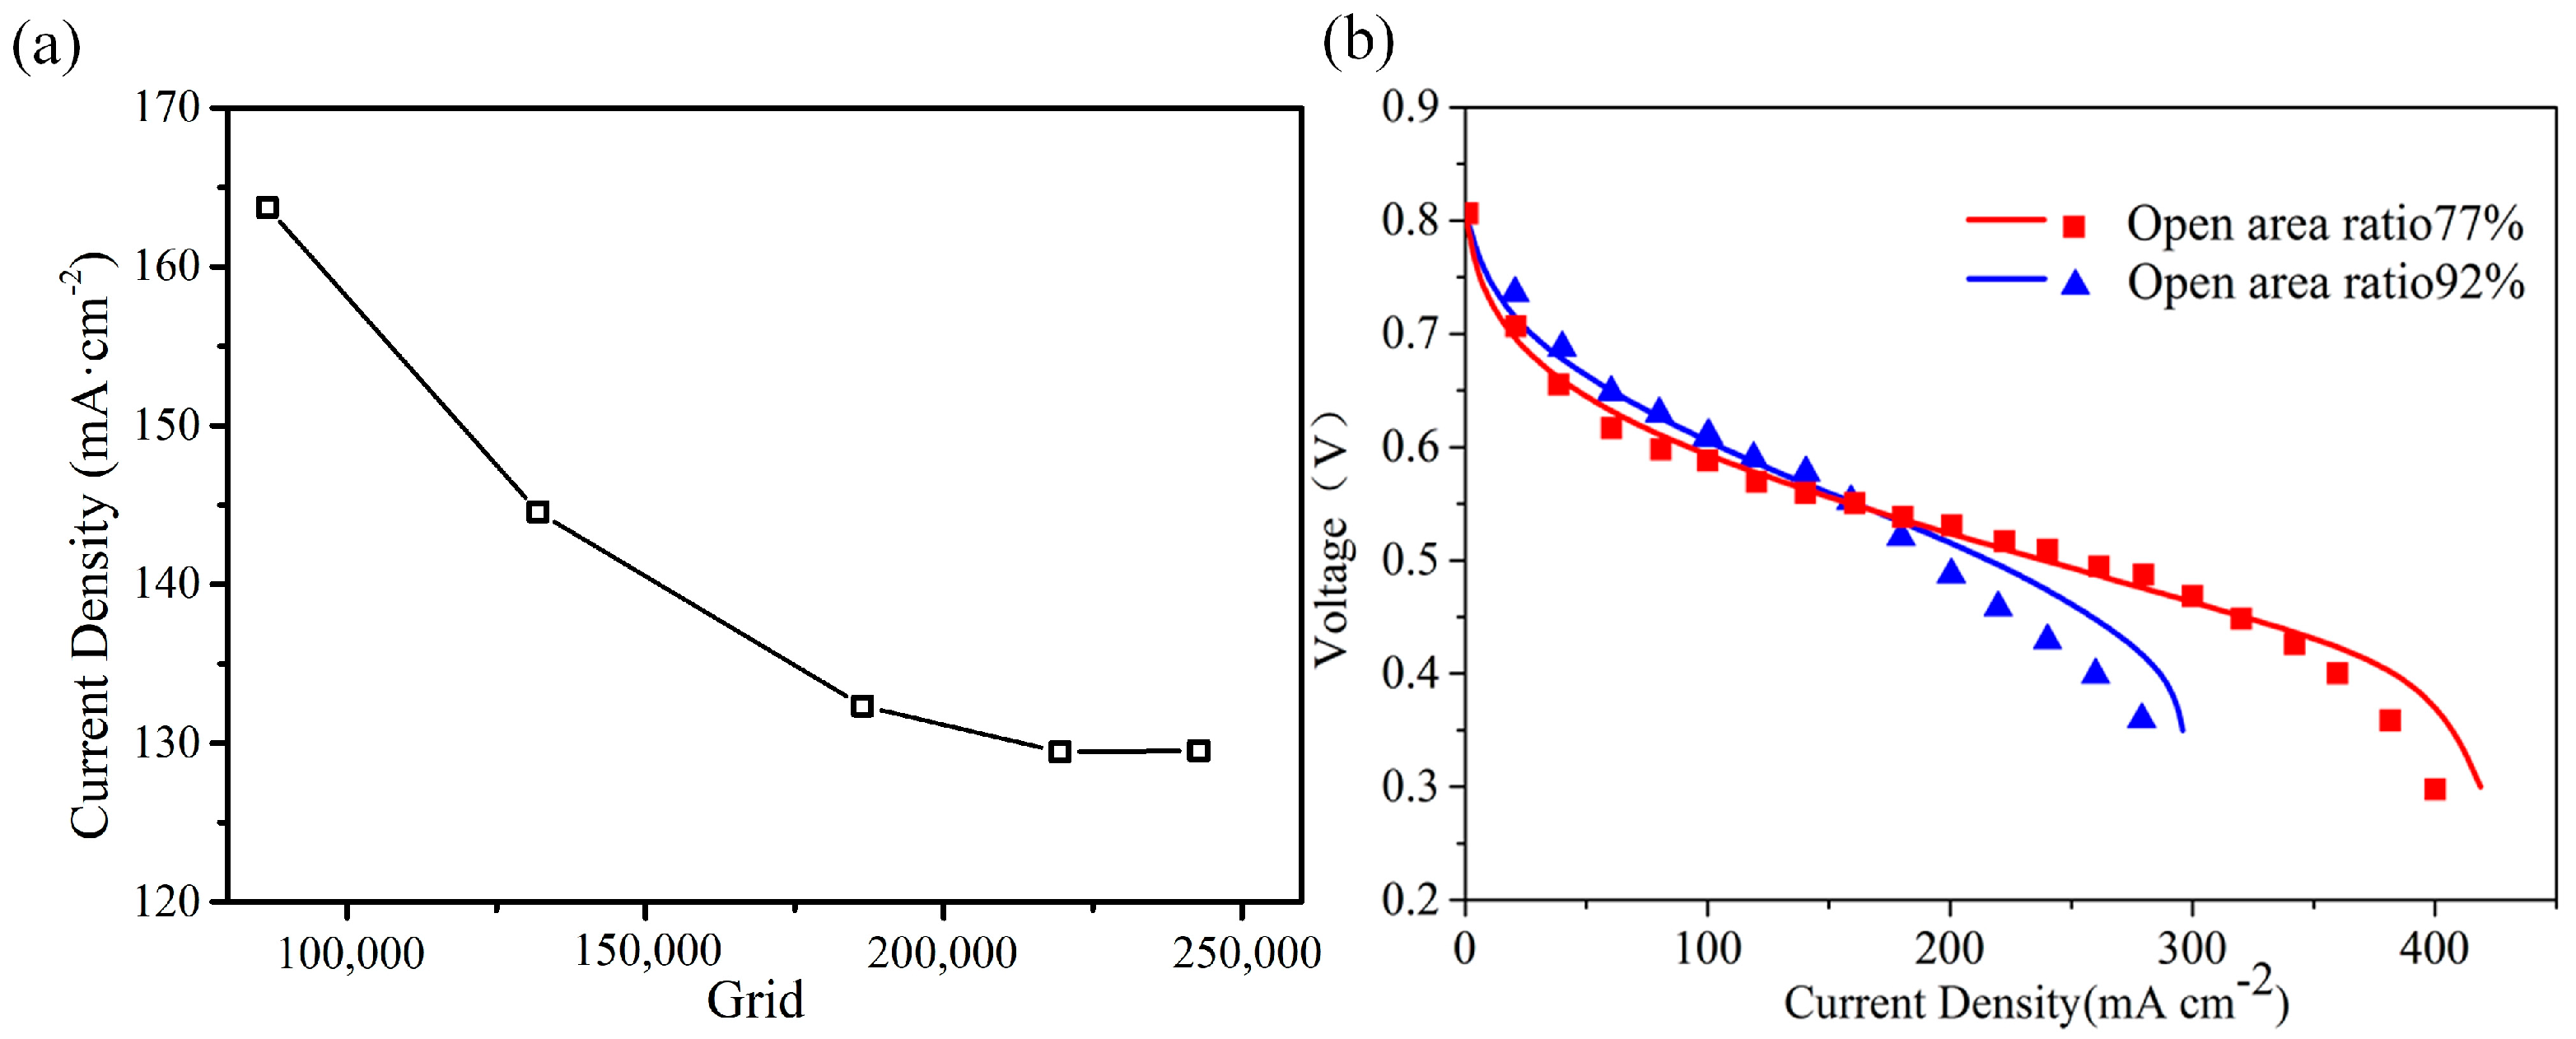
3.1. Validation of Grid Independence and Simulation Model

In order to confirm the reasonable grid number, the grid independence validation is performed in Figure 2. The total grid number increases by increasing the grid layers in the X, Y, and Z directions for different components. In Figure 2a, when the total grid number reaches about 0.22 million, the current density reaches a steady state at a constant voltage of 0.5 V. Thus, the grid number for subsequent simulation models is the same as the mesh settings. To validate the developed air-breathing PEMFC model, a comparison of current–voltage curves between simulation and experiment results under different cathode open ratio rates of 77% and 92% is shown in Figure 2b. The polarization curves obtained from simulation and experiment exhibit good agreement. According to our previous study [38], the same 3D multiphase single-fuel-cell model was also verified by comparing the polarization curves from simulation and experiments under different relative humidity conditions. Therefore, the accuracy and availability of our numerical model have been efficiently validated from different aspects.

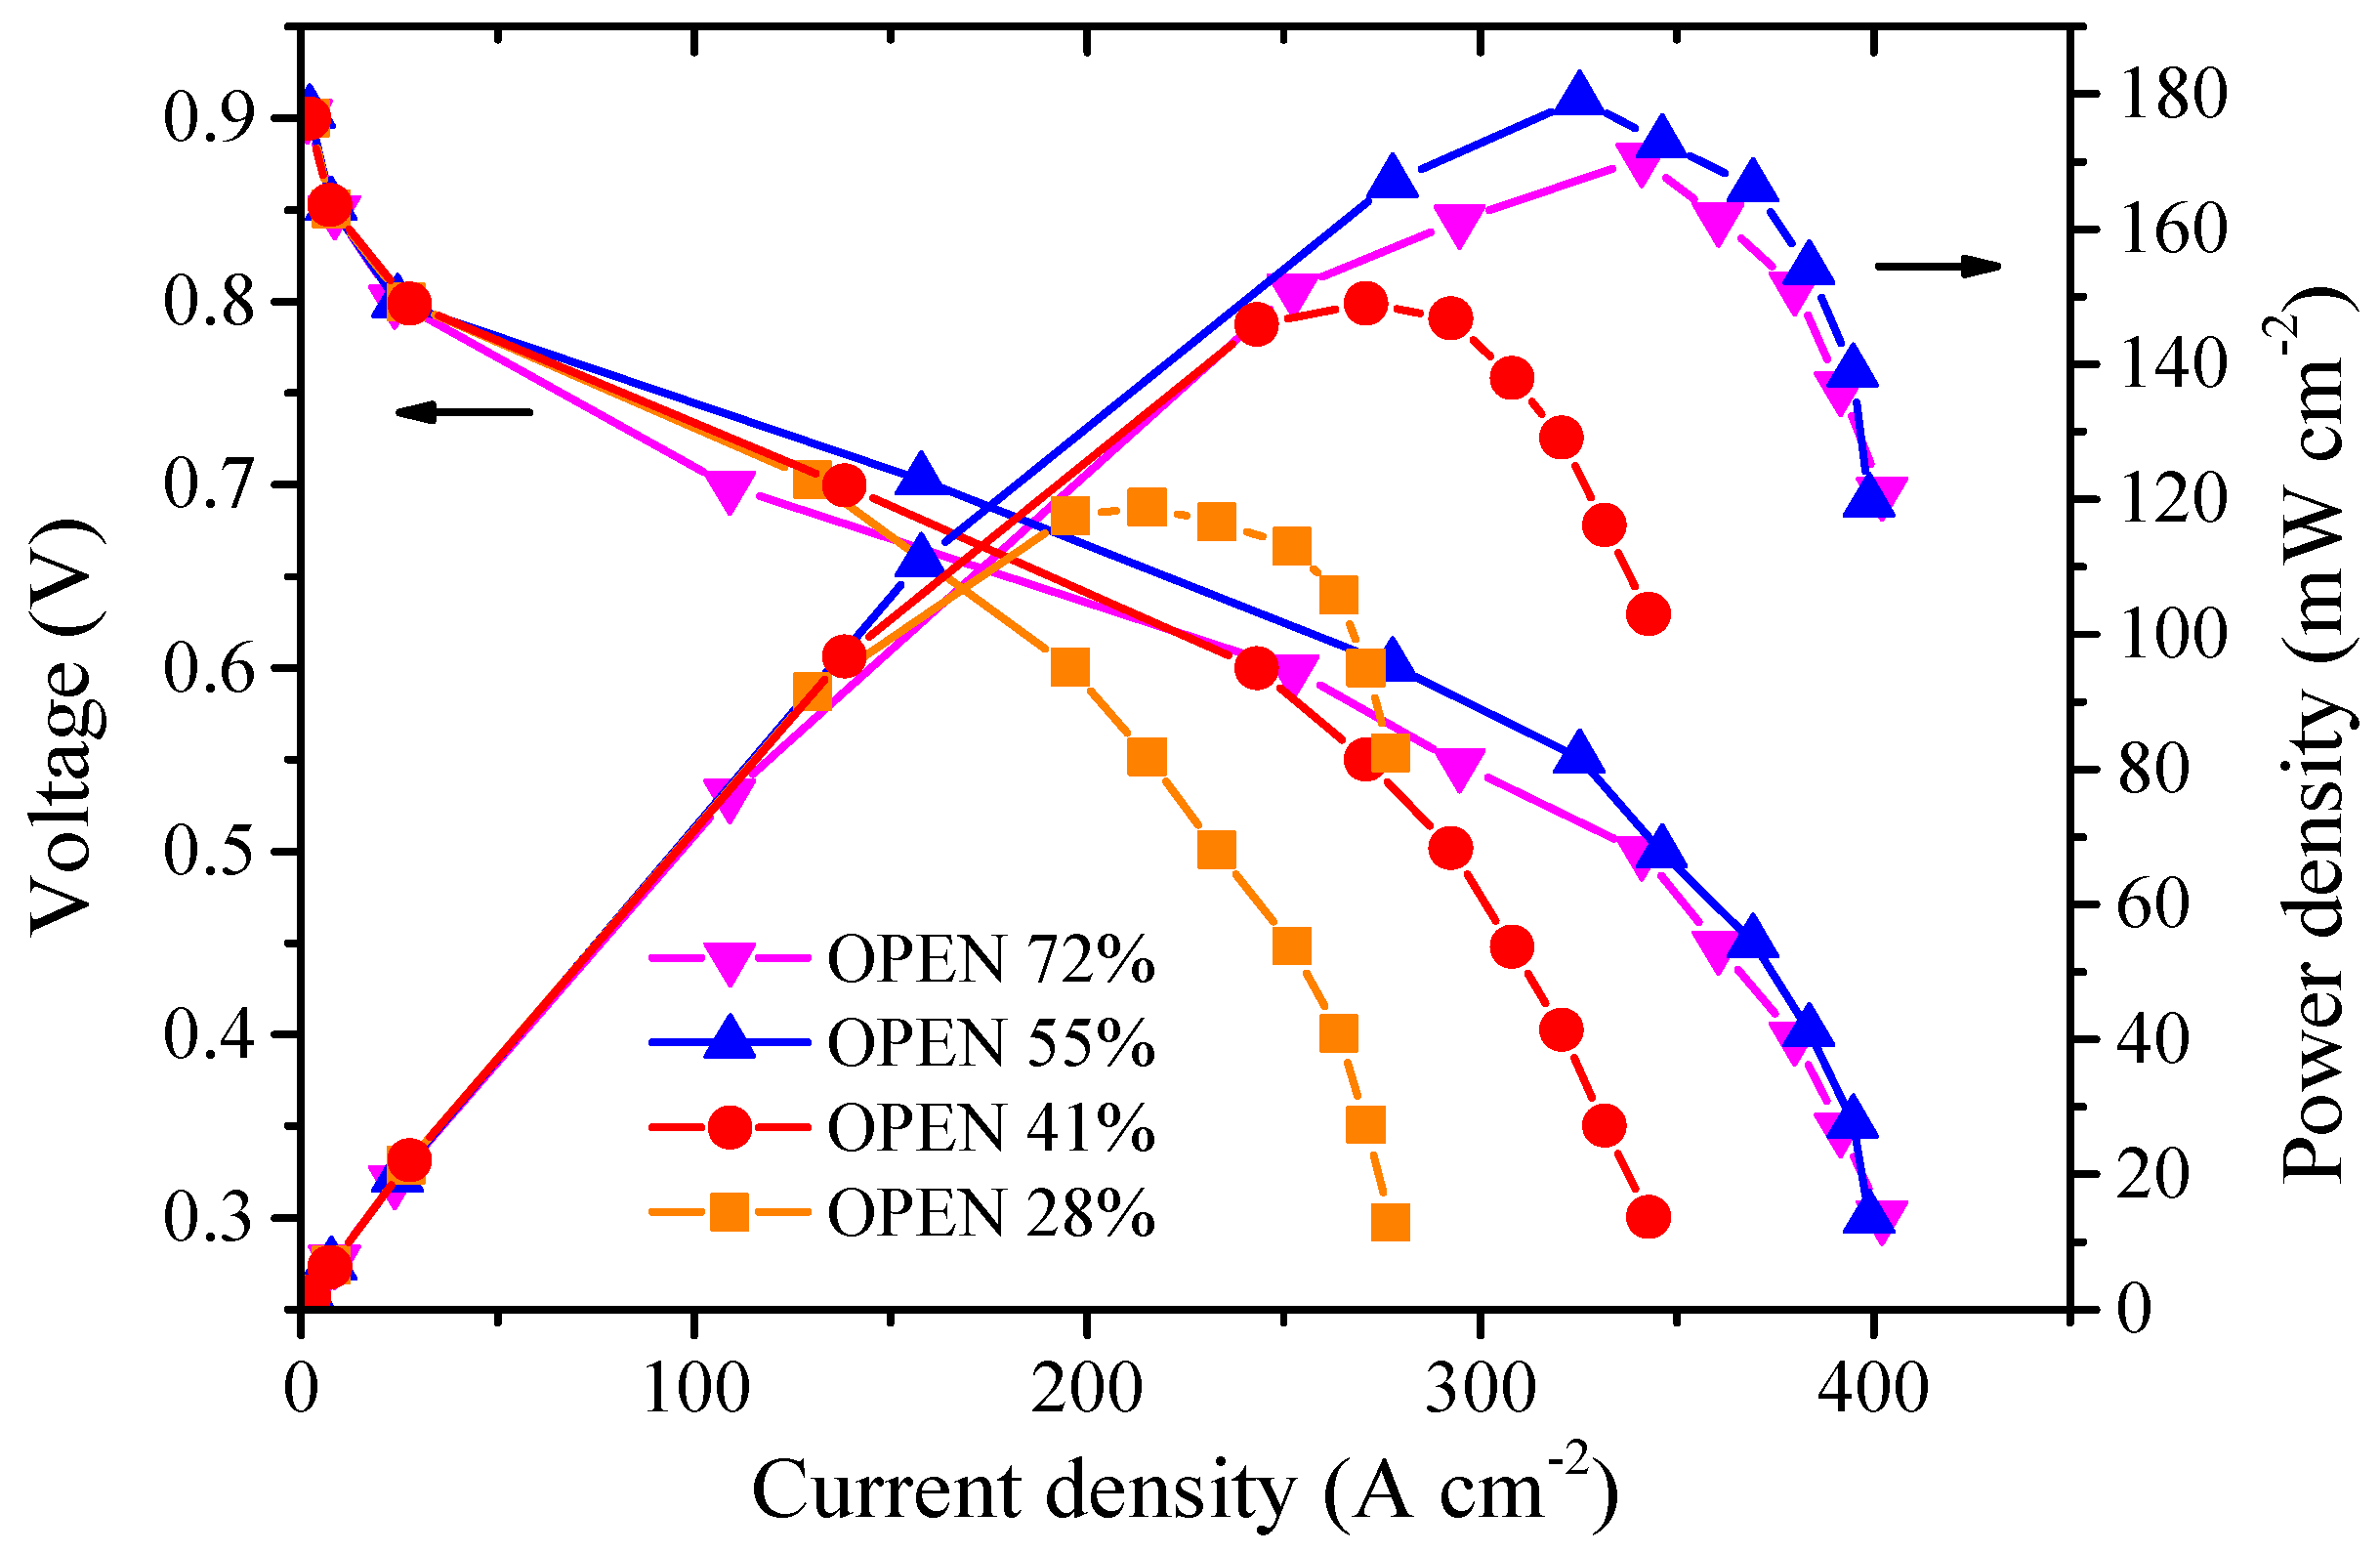
3.2. Effect of Cathode Open Area Ratio on the Performance of a Single Fuel Cell

Before performing the fuel cell stack simulation, a 3D model of a single fuel cell is developed to verify its reliability and availability. In the 3D model, the single fuel cell consists of the conventional serpentine flow channel at the anode, the window flow field with an opening at the cathode, and the membrane electrode assembly (MEA) (Figure 1). Since the air inflow determines the reactant amount and electrochemical reaction rate in the cathode CL, the single-fuel-cell model is calculated at 308.15 K and 20% RH to understand the influence of the cathode open area ratio.
In Figure 3, the limited current density increases firstly with the increased cathode open area ratio. But the increasing tendency can not be sustained under a high open area ratio. By contrast, the peak power density of the single fuel cell first increases and then decreases with an increasing open area ratio. It achieves the highest peak power density of 179.3 mW cm−2 at a cathode open area ratio of 55%. Correspondingly, the largest limited current density is obtained at a cathode open area ratio of 55%. This is mainly because a big open area in the cathode flow field is favorable to enhancing the oxygen transfer, resulting in a high oxygen concentration at the CL and an enhancement in the reaction rate. Thus, the air-breathing PEMFC performance is enhanced with an increased open ratio at a relatively low value. However, a large open area in the cathode flow field will lead to an amplified electrical resistance and activation overpotential. When the open area ratio exceeds a certain value, the activation overpotential will play a dominant role in fuel cell performance compared to oxygen concentration at the cathode CL, resulting in a slightly decreased air-breathing PEMFC performance. Therefore, an optimal cathode open area ratio of 55% is obtained and chosen for the following fuel cell stack modeling.

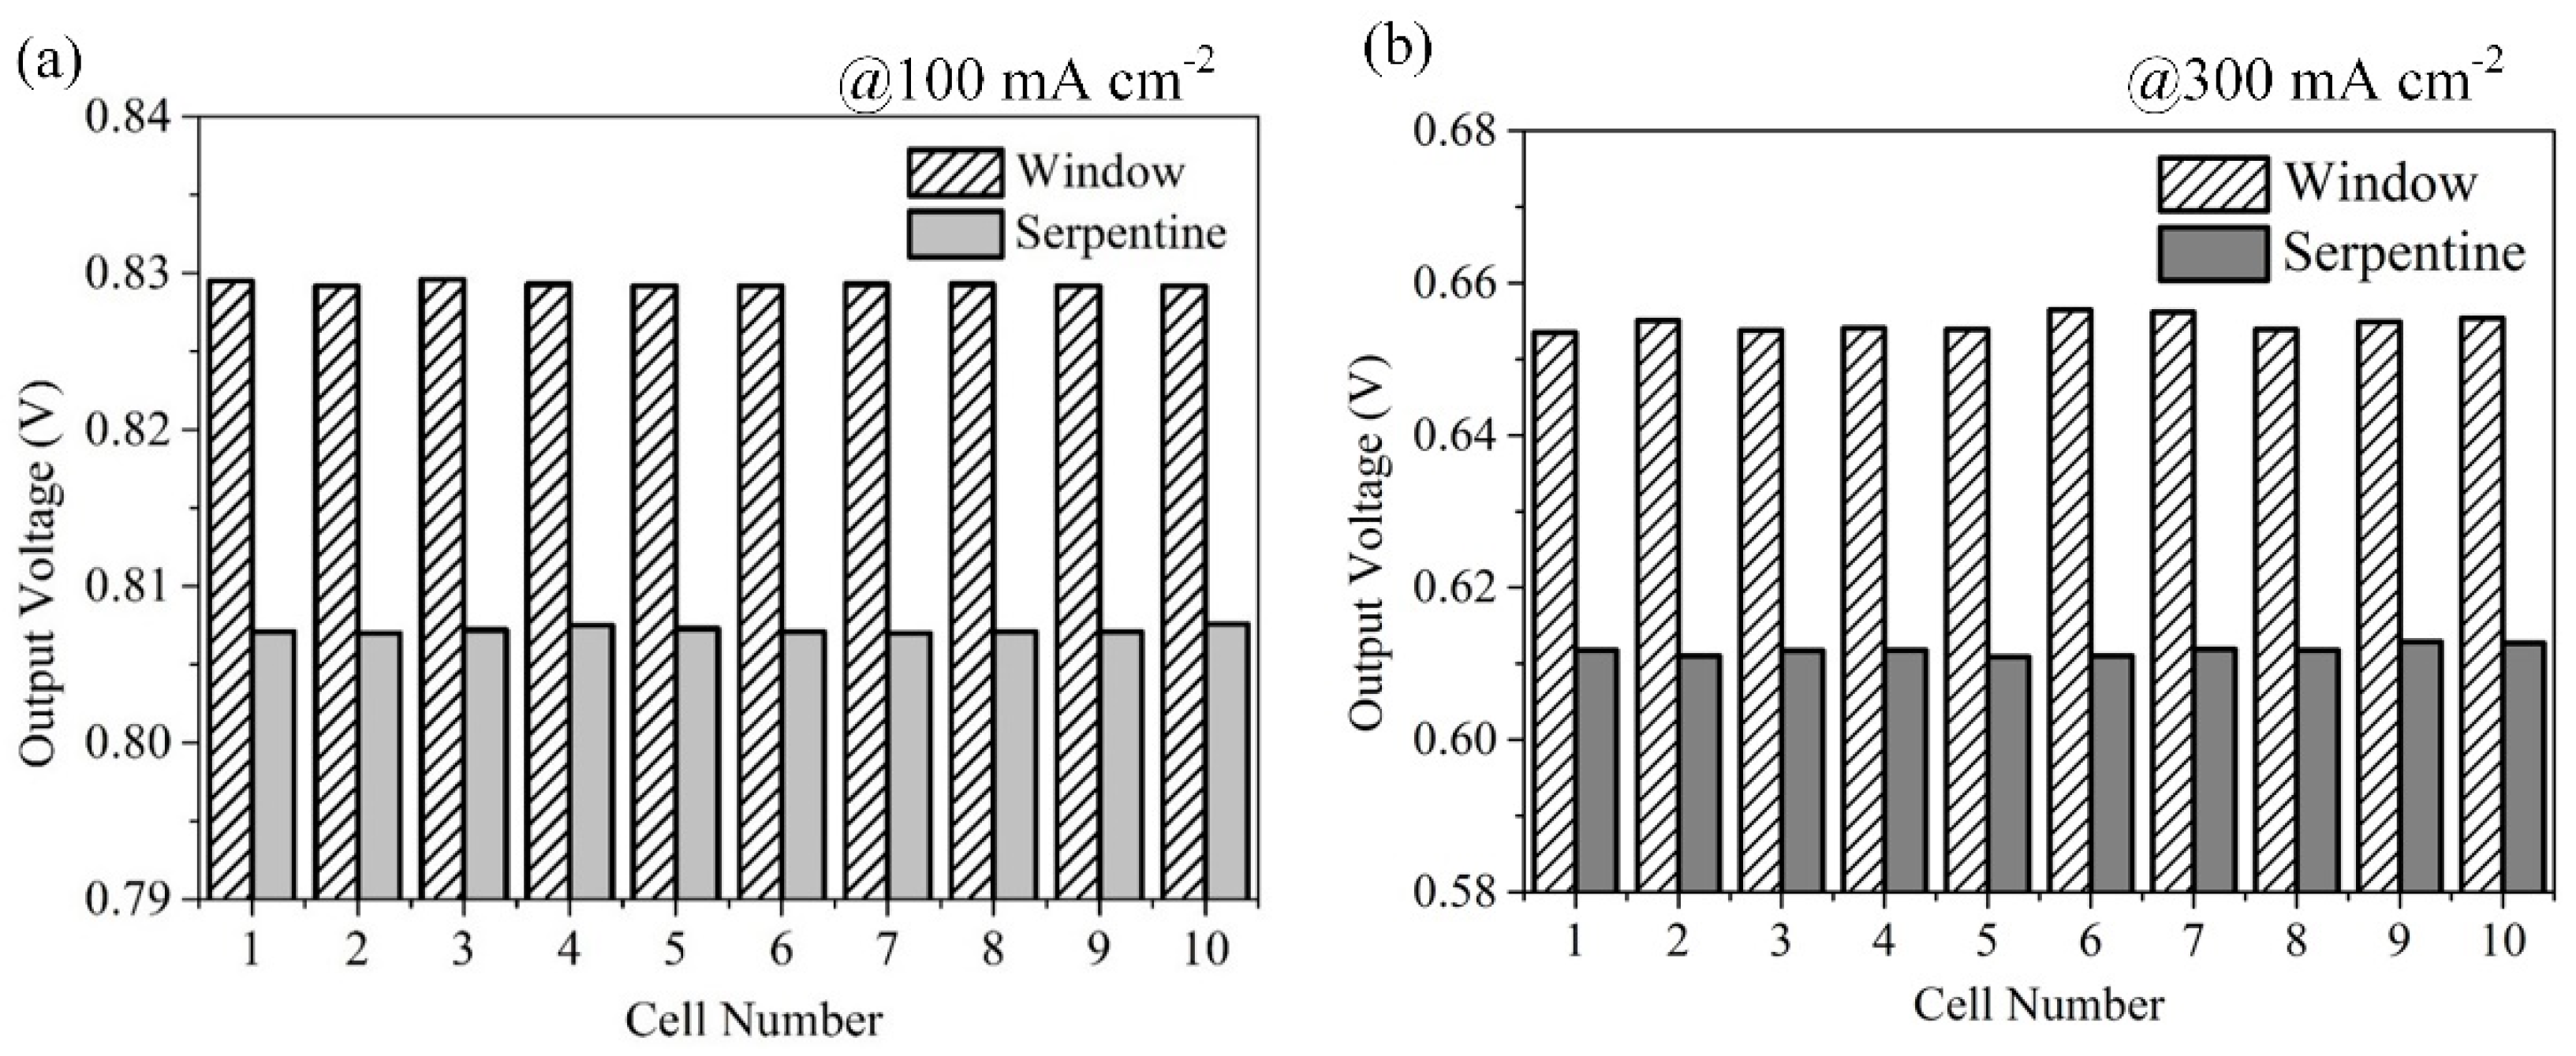
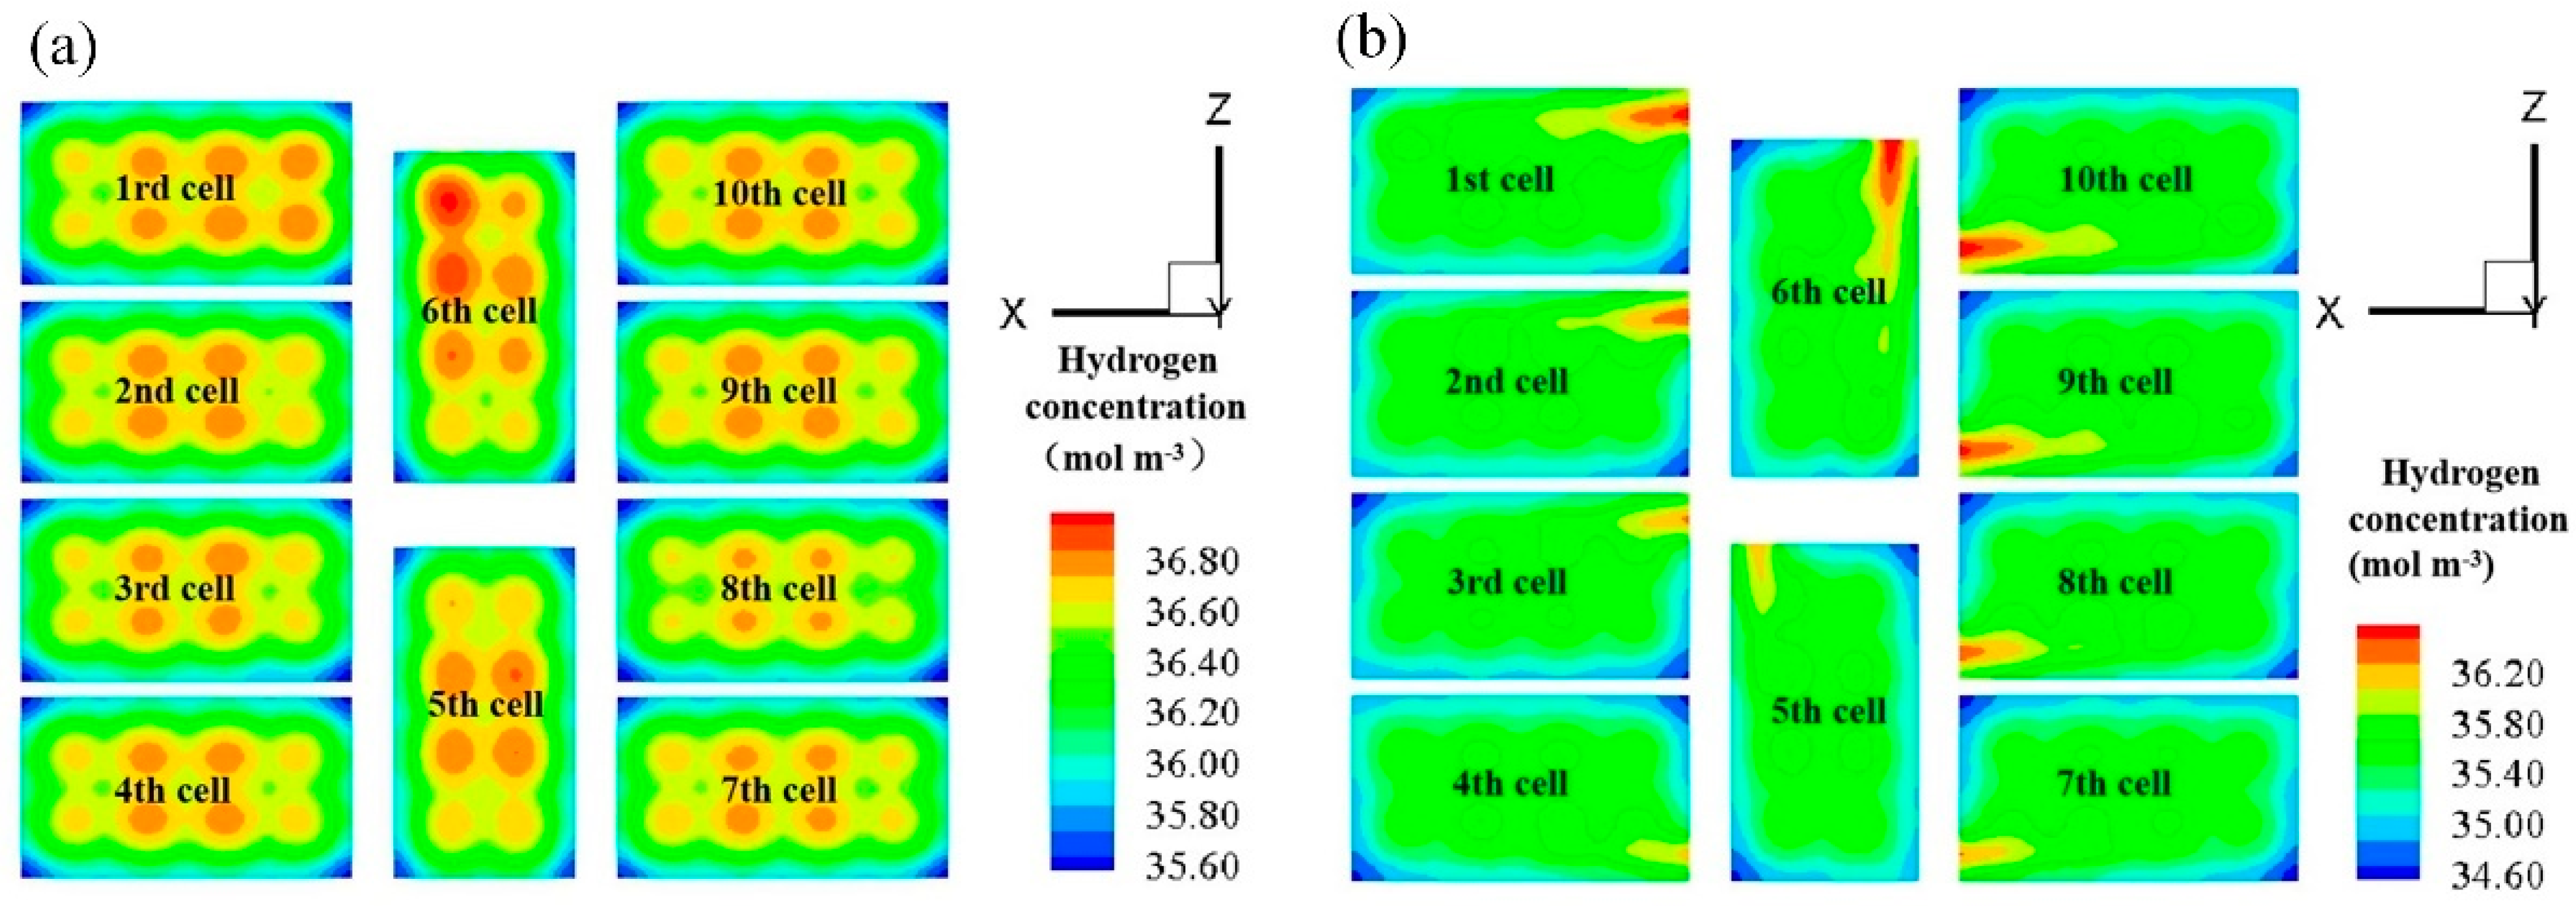
3.3. Effect of Anode Flow Field Configuration on Fuel Cell Stack Performance

On the basis of the 3D single fuel cell simulation results, the planar fuel cell stack model with 10 single cells (named 1 to 10) is developed to understand the underlying mechanism of mass transfer and electrochemical reaction processes in the stack. Since the uniform distribution of reaction gas plays a significant role in the fuel cell stack performance, the effect of the hydrogen intake mode on the stack performance is investigated. As shown in Figure 4, the conventional serpentine flow fields with manifold connection and the window-type flow fields with hydrogen chamber, which have the same open area ratio of 55%, are applied as the anode side for two fuel cell stacks to adjust the hydrogen intake distribution, respectively. While the cathode sides of these two cell stacks are assembled the window-type flow fields for air breathing. To ensure the computational accuracy and stability, the computational domain for the air area is amplified as three times the length, three times the width and six times the length of the fuel cell stack.
The performance comparison between two types of fuel cell stacks with different anode flow field configurations is analyzed in Figure 5. It’s noticeable that the anode window flow field plays a more significant role on the fuel cell stack performance. The stack with anode window flow field achieves a higher peak power density of 2042 mW cm−2 at 400 mA cm−2, which is increased by 15.3% compared to the stack with anode serpentine flow field. It’s mainly because the window flow field has short H2 transfer distance to the CL and small mass transfer resistance, the H2 concentration over the CL surface at the side of window flow field is greater than that of the serpentine flow field. Additionally, the rib and channel structures in serpentine flow field will lead to a larger pressure drop and a lower heat dissipation effect, which is not harmful for the performance improvement of fuel cell stack.
The consistency of each fuel cell in the stack is also analyzed in Figure 6. We can see that all of the single fuel cells in stacks with window flow fields and serpentine flow fields present highly consistent output voltages at 100 mA cm−2. The single fuel cells with window flow fields present better performance compared to that of fuel cells with serpentine flow fields. This is mainly because the limitations of the manifold connection mode for each fuel cell in a stack with serpentine flow fields will increase the uneven distribution of hydrogen in each fuel cell. However, the voltage consistency of each fuel cell in stacks with a window flow field is worse than that in stacks with a serpentine flow field at a high current density of 300 mA cm−2. It indicates that the hydrogen supply is not sufficient for these two stacks at a high current density. Comparing fuel cell stacks with serpentine flow fields using the manifold connection mode, the location of the fuel cell in the fuel cell stack with window flow fields is more sensitive to the hydrogen transfer and consumption, resulting in a high voltage fluctuation in the stack with an anode window flow field.
In order to give a detailed discussion, the hydrogen concentration and oxygen concentration are shown in Figure 7 and Figure 8, respectively. From these figures, the distributions of hydrogen and oxygen concentrations in each fuel cell of the same stack are relatively consistent. From Figure 7, a higher hydrogen concentration at the CL is shown in the cell stack with a window flow field compared to the stack with a serpentine flow field. Specifically, the central region of the fuel cell with a window flow field presents higher hydrogen concentration, indicating a more violent reaction in the open area. In contrast, the hydrogen will be consumed along the serpentine flow field gradually, and the high hydrogen concentration only appears at the entrance region in each fuel cell of the stack with a serpentine structure. Similarly, a higher oxygen concentration is observed at the cathode CL in the fuel cell stack with a window flow field compared to that of the stack with a serpentine flow field (Figure 8). This is mainly because the violent reaction in the fuel cell with a window flow field will consume more O2 at the cathode CL, which will accelerate the O2 migration to the cathode side. Because of the same window flow field structure at the cathode, the O2 distributions at the cathode CL in each fuel cell are almost the same for different stacks.
As in the above discussions, a 3D multiphase model of the planar air-breathing PEMFC stack with 10 single fuel cells has been constructed to analyze the distribution of muti-physics fields to understand the underlying mechanism of mass transfer and electrochemical reaction processes in a fuel cell stack. To enhance the hydrogen supply in each fuel cell, the window-type flow fields with hydrogen chambers are newly designed and applied for the PEMFC stack. Compared to the stack with a serpentine flow field, the stack with a window flow field contributes to more even distribution and higher concentrations of hydrogen at the anode CL and oxygen at the cathode CL, resulting in enhanced stack performance. However, this work still has some limitations for practical applications. For instance, many assumptions are proposed to simplify our model, including laminar flow for the liquid and gas phases and only considering the liquid phase of water, which may lead to difficulties in understanding the mechanism of the water phase change under subzero conditions. Additionally, the model does not consider the hydrogen gas recirculation or exhaust mode at the anode side, which will result in a waste of fuel and low energy utilization efficiency.

4. Conclusions

In the current study, we built a 3D multiphase model of a single fuel cell to analyze the influence of flow field configuration on cell performance. The grid independence validation and polarization curve verification were performed to support the availability of the 3D multiphase model. On the basis of the single-fuel-cell model, the peak power density of the single PEMFC first increased and then decreased with an increased open area ratio, which achieved the maximum peak power density of 179.3 mW cm−2 at an open area ratio of 55%. Then, a 3D multiphase air-breathing PEMFC stack model was developed to study the performance of fuel cell stacks with different anode flow field configurations. The fuel cell stack with anode window flow fields produced a higher peak power density of 2042 mW cm−2 at 400 mA cm−2, which was increased by 15.3% compared to the stack with anode serpentine flow fields. The stack with an anode window flow field showed a higher output voltage and larger hydrogen and oxygen concentrations in each fuel cell. The developed 3D multiphase stack model would be a powerful tool for designing the optimization of flow field configurations.

Author Contributions

Conceptualization, Z.L.; investigation, T.S.; resources, Z.L. and F.B.; supervision, Z.L. and F.B.; validation, T.S.; writing—review and editing, Z.L. and F.B. All authors have read and agreed to the published version of the manuscript.

Funding

This work is supported by the National Natural Science Foundation of China (Grant No. 52106105 and Grant No. 52311530069).

Data Availability Statement

Data is contained within the article.

Conflicts of Interest

The authors declare no conflicts of interest.

References

  1. Ahmad, S.; Nawaz, T.; Ali, A.; Orhan, M.F.; Samreen, A.; Kannan, A.M. An overview of proton exchange membranes for fuel cells: Materials and manufacturing. Int. J. Hydrogen Energ. 2022, 47, 19086–19131. [Google Scholar] [CrossRef]
  2. Wang, H.; Qu, Z.; Yin, Y.; Zhang, J.; Ming, P. Thermal Management for Hydrogen Charging and Discharging in a Screened Metal–Organic Framework Particle Tank. ACS Appl. Mater. Inter. 2021, 13, 61838–61848. [Google Scholar] [CrossRef] [PubMed]
  3. Wang, Z.; Liu, Z.; Fan, L.; Du, Q.; Jiao, K. Application progress of small-scale proton exchange membrane fuel cell. Energy Reviews 2023, 2, 100017. [Google Scholar] [CrossRef]
  4. Wang, H.; Wang, Z.; Qu, Z.; Zhang, J. Deep-learning accelerating topology optimization of three-dimensional coolant channels for flow and heat transfer in a proton exchange membrane fuel cell. Appl. Energ. 2023, 352, 121889. [Google Scholar] [CrossRef]
  5. Ma, J.; Zhang, C.; Xi, F.; Chen, W.; Jiao, K.; Du, Q.; Bai, F.; Liu, Z. Experimental study on the influence of environment conditions on the performance of paper-based microfluidic fuel cell. Appl. Therm. Eng. 2023, 219, 119487. [Google Scholar] [CrossRef]
  6. Zhe, W.; Wang, K.; Jiao, K.; Du, Q.; Peng, Z.; Bai, F.; Liu, Z. Application of template method in fabricating ordered gas diffusion layer of PEMFC. Int. J. Green Energy 2024, 1–10. [Google Scholar]
  7. Nunes, H.X.; Ferreira, M.J.F.; Rangel, C.M.; Pinto, A.M.F.R. Hydrogen generation and storage by aqueous sodium borohydride (NaBH4) hydrolysis for small portable fuel cells (H2–PEMFC). Int. J. Hydrogen Energ. 2016, 41, 15426–15432. [Google Scholar] [CrossRef]
  8. Wang, Y.; Seo, B.; Wang, B.; Zamel, N.; Jiao, K.; Adroher, X.C. Fundamentals, materials, and machine learning of polymer electrolyte membrane fuel cell technology. Energy AI 2020, 1, 100014. [Google Scholar] [CrossRef]
  9. Zhao, J.; Li, X.; Shum, C.; McPhee, J. A Review of Physics-based and Data-driven Models for Real-time Control of Polymer Electrolyte Membrane Fuel Cells. Energy AI 2021, 6, 100114. [Google Scholar] [CrossRef]
  10. Lin, T.; Hu, L.; Wisely, W.; Gu, X.; Cai, J.; Litster, S.; Kara, L.B. Prediction of high frequency resistance in polymer electrolyte membrane fuel cells using long short term memory based model. Energy AI 2021, 3, 100045. [Google Scholar] [CrossRef]
  11. Choi, H.; Choi, H.J.; Kang, S.Y.; Kim, J.; Choi, H.; Ahn, C.-Y.; Kang, H.J.; La, I.; Kim, O.-H.; Cho, Y.-H.; et al. Optimization of hydrophobic additives content in microporous layer for air breathing PEMFC. J. Electroanal. Chem. 2024, 952, 117963. [Google Scholar] [CrossRef]
  12. Ferreira-Aparicio, P.; Chaparro, A.M. Influence of the gas diffusion cathode structure on the performance of an air-breathing proton exchange membrane fuel cell. Int. J. Hydrogen Energ. 2014, 39, 3997–4004. [Google Scholar] [CrossRef]
  13. Xu, X.; Yang, W.; Zhuang, X.; Xu, B. Experimental and numerical investigation on effects of cathode flow field configurations in an air-breathing high-temperature PEMFC. Int. J. Hydrogen Energ. 2019, 44, 25010–25020. [Google Scholar] [CrossRef]
  14. Jin, H.; Zou, S.; Wen, Q.; Li, Y.; Ning, F.; Xu, P.; Pan, S.; Zhou, X. Performance improvement of air-breathing proton exchange membrane fuel cell (PEMFC) with a condensing-tower-like curved flow field. Chinese Chem. Lett. 2023, 34, 107441. [Google Scholar] [CrossRef]
  15. Bussayajarn, N.; Ming, H.; Hoong, K.K.; Ming Stephen, W.Y.; Hwa, C.S. Planar air breathing PEMFC with self-humidifying MEA and open cathode geometry design for portable applications. Int. J. Hydrogen Energ. 2009, 34, 7761–7767. [Google Scholar] [CrossRef]
  16. Folgado, M.A.; Duque, L.; Chaparro, A.M. Air-breathing fuel cell with a columnar cathodic plate for the passive removal of water. Int. J. Hydrogen Energ. 2024, 52, 1315–1324. [Google Scholar] [CrossRef]
  17. Omrani, R.; Shabani, B. Review of gas diffusion layer for proton exchange membrane-based technologies with a focus on unitised regenerative fuel cells. Int. J. Hydrogen Energ. 2019, 44, 3834–3860. [Google Scholar] [CrossRef]
  18. Sapkota, P.; Brockbank, P.; Aguey-Zinsou, K.-F. Development of self-breathing polymer electrolyte membrane fuel cell stack with cylindrical cells. Int. J. Hydrogen Energ. 2022, 47, 23833–23844. [Google Scholar] [CrossRef]
  19. Chen, J.; Sun, L.; Zhu, W.; Pei, H.; Xing, L.; Tu, Z. Influence of cathode air supply mode on the performance of an open cathode air-cooled proton exchange membrane fuel cell stack. Appl. Therm. Eng. 2024, 243, 122709. [Google Scholar] [CrossRef]
  20. Lee, J.; Gundu, M.H.; Lee, N.; Lim, K.; Lee, S.W.; Jang, S.S.; Kim, J.Y.; Ju, H. Innovative cathode flow-field design for passive air-cooled polymer electrolyte membrane (PEM) fuel cell stacks. Int. J. Hydrogen Energ. 2020, 45, 11704–11713. [Google Scholar] [CrossRef]
  21. Sapkota, P.; Boyer, C.; Dutta, R.; Cazorla, C.; Aguey-Zinsou, K.-F. Planar polymer electrolyte membrane fuel cells: Powering portable devices from hydrogen. Sustain. Energ. Fuels 2020, 4, 439–468. [Google Scholar] [CrossRef]
  22. Min, X.; Xie, Y.; Chai, D.; Zhang, X. Preliminary experimental study of the performances for a print circuit board based planar PEMFC stack. Int. J. Hydrogen Energ. 2022, 47, 5599–5608. [Google Scholar] [CrossRef]
  23. Kim, M.; Lee, D.G. Development of the anode bipolar plate/membrane assembly unit for air breathing PEMFC stack using silicone adhesive bonding. J. Power Sources 2016, 315, 86–95. [Google Scholar] [CrossRef]
  24. Chen, C.-Y.; Lai, W.-H.; Weng, B.-J.; Chuang, H.-J.; Hsieh, C.-Y.; Kung, C.-C. Planar array stack design aided by rapid prototyping in development of air-breathing PEMFC. J. Power Sources 2008, 179, 147–154. [Google Scholar] [CrossRef]
  25. Bunyan, S.T.; Dhahad, H.A.; Khudhur, D.S.; Yusaf, T. The Effect of Flow Field Design Parameters on the Performance of PEMFC: A Review. Sustainability 2023, 15, 10389. [Google Scholar] [CrossRef]
  26. Ying, W.; Sohn, Y.-J.; Lee, W.-Y.; Ke, J.; Kim, C.-S. Three-dimensional modeling and experimental investigation for an air-breathing polymer electrolyte membrane fuel cell (PEMFC). J. Power Sources 2005, 145, 563–571. [Google Scholar] [CrossRef]
  27. Song, J.; Huang, Y.; Liu, Y.; Ma, Z.; Chen, L.; Li, T.; Zhang, X. Numerical Investigation and Optimization of Cooling Flow Field Design for Proton Exchange Membrane Fuel Cell. Energies 2022, 15, 2609. [Google Scholar] [CrossRef]
  28. Zhang, G.; Xie, X.; Xie, B.; Du, Q.; Jiao, K. Large-scale multi-phase simulation of proton exchange membrane fuel cell. Int. J. Heat Mass Tran. 2019, 130, 555–563. [Google Scholar] [CrossRef]
  29. Xie, B.; Zhang, G.; Jiang, Y.; Wang, R.; Sheng, X.; Xi, F.; Zhao, Z.; Chen, W.; Zhu, Y.; Wang, Y.; et al. “3D+1D” modeling approach toward large-scale PEM fuel cell simulation and partitioned optimization study on flow field. eTransportation 2020, 6, 100090. [Google Scholar] [CrossRef]
  30. Zhang, G.; Wu, L.; Jiao, K.; Tian, P.; Wang, B.; Wang, Y.; Liu, Z. Optimization of porous media flow field for proton exchange membrane fuel cell using a data-driven surrogate model. Energ. Convers. Manag. 2020, 226, 113513. [Google Scholar] [CrossRef]
  31. Jiao, D.; Jiao, K.; Du, Q. Two-Phase Flow in Porous Electrodes of Proton Exchange Membrane Fuel Cell. Trans. Tianjin Univ. 2020, 26, 197–207. [Google Scholar] [CrossRef]
  32. Zhou, X.; Wu, L.; Niu, Z.; Bao, Z.; Sun, X.; Liu, Z.; Li, Y.; Jiao, K.; Liu, Z.; Du, Q. Effects of surface wettability on two-phase flow in the compressed gas diffusion layer microstructures. Int. J. Heat Mass Tran. 2020, 151, 119370. [Google Scholar] [CrossRef]
  33. Sadeghi, E.; Djilali, N.; Bahrami, M. Effective thermal conductivity and thermal contact resistance of gas diffusion layers in proton exchange membrane fuel cells. Part 2: Hysteresis effect under cyclic compressive load. J. Power Sources 2010, 195, 8104–8109. [Google Scholar] [CrossRef]
  34. Sadeghi, E.; Djilali, N.; Bahrami, M. Effective thermal conductivity and thermal contact resistance of gas diffusion layers in proton exchange membrane fuel cells. Part 1: Effect of compressive load. J. Power Sources 2011, 196, 246–254. [Google Scholar] [CrossRef]
  35. Tamayol, A.; McGregor, F.; Bahrami, M. Single phase through-plane permeability of carbon paper gas diffusion layers. J. Power Sources 2012, 204, 94–99. [Google Scholar] [CrossRef]
  36. Movahedi, M.; Ramiar, A.; Ranjber, A.A. 3D numerical investigation of clamping pressure effect on the performance of proton exchange membrane fuel cell with interdigitated flow field. Energy 2018, 142, 617–632. [Google Scholar] [CrossRef]
  37. Fabian, T.; Posner, J.D.; O’Hayre, R.; Cha, S.-W.; Eaton, J.K.; Prinz, F.B.; Santiago, J.G. The role of ambient conditions on the performance of a planar, air-breathing hydrogen PEM fuel cell. J. Power Sources 2006, 161, 168–182. [Google Scholar] [CrossRef]
  38. Sun, T.; Xie, B.; Zhang, F.; Wu, L.; Jiao, K. Numerical investigation of GDL compression rate on air-breathing proton exchange membrane fuel cell. In Proceedings of the International Conference on Applied Energy (ICAE2020), Bangkok, Thailand, 1–10 December 2020. [Google Scholar]
Figure 1. Schematic of single air-breathing PEMFC with window and serpentine flow fields.
Energies 17 02501 g001
Figure 2. Model verification. (a) Grid independence test, (b) comparison of simulation results with experimental data under different cathode open ratio rates.
Energies 17 02501 g002
Figure 3. The performance analysis of a single fuel cell with various cathode open area ratios.
Energies 17 02501 g003
Figure 4. The fuel cell stack structures with (a) anode window flow field, (b) anode serpentine flow field.
Energies 17 02501 g004
Figure 5. Performance comparison between two stacks with different anode flow field configurations.
Energies 17 02501 g005
Figure 6. Performance comparison of each single fuel cell in two stacks with different anode flow field configurations: (a) at 100 mA cm−2, (b) at 300 mA cm−2.
Energies 17 02501 g006
Figure 7. Hydrogen concentrations at anode CLs of the fuel cell stack with (a) anode window flow field, (b) anode serpentine flow field.
Energies 17 02501 g007
Figure 8. Oxygen concentration at cathode CLs of the fuel cell stack with (a) anode window flow field, (b) anode serpentine flow field.
Energies 17 02501 g008
Table 1. Model source terms.
Source TermsEquations
O2 (kg m−3 s−1) S O 2 = M O 2 J c / ( 4 F ) ,    CCL
H2 (kg m−3 s−1) S H 2 = M H 2 J a / ( 2 F ) ,    ACL
Liquid water (kg m−3 s−1) S l = S v - l ,   CL ,   GDL   and   MPL  
Gas water (kg m−3 s−1) S H 2 O = { S v - l GDL ,   MPL S v - l + S d - v ACL ,   CCL  
Gas mixture
(kg m−3 s−1)
S g = { S v - l + S d - v J a M H 2 / ( 2 F ) ACL S v - l + S d - v J c M O 2 / ( 4 F ) CCL S v - l Flow   field ,   GDL   and   MPL  
Water evaporates and condenses
(kg m−3 s−1)
S v - l = { γ v - l ε ( 1 s ) ( C H 2 O C sat ) M H 2 O C H 2 O   >   C sat γ l - v ε s ( C H 2 O C sat ) M H 2 O C H 2 O   <   C sat
Electron and ion potential
(A m−3)
S e = { J a ACL J c CCL   S ion = { J a ACL J c CCL
Membrane water content
(mol m−3 s−1)
S mw = { S d - v / M H 2 O S p ACL S d - v / M H 2 O + S p + M H 2 O J c / ( 2 F ) CCL
Membrane water by pressure difference (mol m−3 s−1) S p = ρ l K mem ( P la ¯ P lc ¯ ) μ l M H 2 O δ mem δ CL
Absorption and desorption of membrane water (kg m−3 s−1) S d - v = γ d - v ρ mem / EW ( λ λ eq ) M H 2 O
Energy (W m−3) S T = { φ e 2 κ e eff ABP φ e 2 κ e eff + S v - l h GDL   and   MPL J a | η act a | + φ e 2 κ e eff + φ ion 2 κ ion eff + J a Δ S a T 2 F + ( S v - l S d - v ) h ACL J c | η act c | + φ e 2 κ e eff + φ ion 2 κ ion eff + J c Δ S c T 4 F + ( S v - l S d - v ) h CCL φ ion 2 κ ion eff Membrane S v - l h Flow   field
Table 2. Operating conditions and physical properties.
ParametersValues
Thichnesses of GDL, MPL, ACL, CCL, PEM (μm)200, 20, 5, 10, 50.8
Relative humidity0.1 @ anode; 0.2 @ cathode
Temperature (K)308.15
Stoichiometric ratio1.5 @ anode
Outlet pressure (atm)1.0
Intrinsic permeabilities of MPL, GDL, and CL (m2)1.0 × 10⁻¹², 1.0 × 10⁻¹¹, 1.0 × 10⁻¹³
Porosities of MPL and GDL0.6, 0.78
Contact angles of MPL, GDL, and CL (°)120, 120, 100
Specific heat capacities of BP, GDL, MPL, CL, and PEM (J kg−1 K−1)1580, 568, 3300, 3300, 833
Ionic conductivities of BP, GDL, MPL, and CL (S m−1)20,000, 8000, 5000, 5000
Thermal conductivities of BP, MPL, CL, and PEM (W m−1 K−1) 20, 1, 1, 0.95
Condensation rate in MEA (s−1)100
Condensation rate in flow channel (s−1)5000
Phase change rate of membrane water and vapour (s−1)1.3, 1.3
Evaporation rate (s−1)100
Latent heat of water condensation (J mol−1)40,650
Entropy change (J mol−1 K−1)3255
Working current density (A m−2)16,000
Reference concentration (mol m−3)H2: 56.4, O2: 3.39
Heat transfer coefficient9.0
Density of dry membrane (kg m−3)1980
Liquid water density (kg m−3)970
Volume fraction of ionomer in CL0.3
Equivalent weight of PEM (kg mol−1)1.1
Surface tension coefficient (N m −1)0.0625
Contact angle of interface between GDL and flow channel, flow channel and bipolar plate (°)120, 90
Air composition21% O2, 79% N2
Disclaimer/Publisher’s Note: The statements, opinions and data contained in all publications are solely those of the individual author(s) and contributor(s) and not of MDPI and/or the editor(s). MDPI and/or the editor(s) disclaim responsibility for any injury to people or property resulting from any ideas, methods, instructions or products referred to in the content.

