Article

Jerusalem Artichoke: Energy Balance in Annual and Perennial Cropping Systems—A Case Study in North-Eastern Poland

by
Krzysztof Józef Jankowski
* and
Bożena Bogucka
Department of Agrotechnology and Agribusiness, Faculty of Agriculture and Forestry, University of Warmia and Mazury in Olsztyn, Oczapowskiego 8, 10-719 Olsztyn, Poland
*
Author to whom correspondence should be addressed.
Energies 2024, 17(11), 2511; https://doi.org/10.3390/en17112511
Submission received: 17 April 2024 / Revised: 17 May 2024 / Accepted: 21 May 2024 / Published: 23 May 2024
(This article belongs to the Special Issue Green Energy from Soil Remediation)

Abstract

:
This article presents the results of a three-year experiment (2018–2020) conducted at the Agricultural Experiment Station in Bałcyny (north-eastern Poland) with the aim of determining Jerusalem artichoke (JA) yields and the energy balance of biomass production in (i) a perennial cropping system (only aerial biomass was harvested each year) and (ii) an annual cropping system (both aerial biomass and tubers were harvested each year). When JA was grown as a perennial crop, the demand for energy reached 25.2 GJ ha−1 in the year of plantation establishment and 12.3–13.4 GJ ha−1 in the second and third year of production. The energy inputs associated with the annual cropping system were determined in the range of 31.4–37.1 GJ ha−1. Biomass yields were twice as high in the annual than in the perennial cropping system (20.98 vs. 10.30 Mg DM ha−1). Tuber yield accounted for 46% of the total yield. The energy output of JA biomass was 1.8 times higher in the annual than in the perennial cropping system (275.4 vs. 157.3 GJ ha−1). The average energy gain in JA cultivation ranged from 140 (perennial crop) to 241 GJ ha−1 (annual crop). The energy efficiency ratio of JA biomass production reached 7.7–13.3 in the perennial cropping system, and it was 20% lower in the annual cropping system. These results imply that when JA was grown as an annual crop, an increase in energy inputs associated with plantation establishment (tillage and planting) and the harvest and transport of tubers was not fully compensated by the energy output of tubers.

1. Introduction

Crude oil is the main source of energy worldwide with an estimated 31% share of primary energy consumption [1]. Oil and other fossil fuels (coal and gas) are the leading sources of greenhouse gas emissions which are responsible for the current climate crisis. According to Shafiee and Topal [2], oil is being depleted more rapidly than any other non-renewable energy resource. The decrease in fossil fuel reserves and their uneven distribution pose a threat to global energy security [1,3,4]. In regions deprived of fossil fuel deposits, supply chains can be also disrupted by pandemics and military, political, and trade conflicts [5,6,7].
Security concerns linked with climate change and vanishing energy reserves have prompted many countries to diversify their energy sources [8] and transform their energy sectors [9]. Successful energy transition depends on the growth of the renewable energy market, labor market policies, and changes in consumption patterns. The development of different segments of the renewable energy market is determined mainly by geographic location, climate, and economic and technological factors [9].
Biomass and hydraulic and wind power are the leading sources of renewable energy worldwide [10]. The energy derived from biomass represents 15% of total primary energy supply. The share of biomass energy in the overall energy balance is strongly differentiated (from 2–3% to even 35%) by a region’s economic development (industrialized countries vs. developing countries) [8]. In the European Union (EU), biomass energy accounts for 10% of total primary energy and 60% of renewable energy [11]. Biomass is the leading renewable source of thermal energy (75%) in the EU countries [12]. In Poland, renewable energy is generated predominantly from biomass (80–86%), and the share of solid, liquid, and gaseous biofuels has been estimated at 69–76%, 8%, and 2.5%, respectively [13,14].
The global supply of biomass is estimated at 56 EJ, where solid biomass accounts for 86%, liquid biofuels for 7%, municipal and industrial waste for 5%, and biogas for 2% of total biomass consumption [8]. According to the International Renewable Energy Agency, biomass consumption will increase to 108 EJ in 2030 [15]. Lignocellulosic energy crops are the leading source of biomass, and their supply is fairly balanced around the world (excluding regions with extreme climates that do not support plant growth) [16]. As a result, these crops are a valuable source of renewable energy not only on the regional, but also on the global scale [16]. Lignocellulosic biomass has a number of advantages in renewable energy generation: (i) it can be utilized in distributed energy systems with short supply chains [17], (ii) lignocellulosic crops easily adapt to diverse environments, (iii) lignocellulosic crops sequester large amounts of carbon [18], (iv) effective technologies for the production lignocellulosic biomass have been developed, (v) lignocellulosic biomass can be easily preserved and stored for long periods of time [19], and (vi) low cost of electricity generation compared with other renewable energy sources (photovoltaics and wind turbines) [20]. Research on the sustainable use of energy from agricultural biomass (dedicated lignocellulosic crops) is conducted as part of the United Nations Sustainable Development Goals (SDGs) [21,22,23]. Blair et al. [21] demonstrated that the supply of biomass for bioenergy production could directly contribute to achieving SDG 7 (Affordable and Clean Energy), i.e., ensuring access to safe, affordable, sustainable, and modern energy sources, which is a prerequisite for improving living conditions, public health and education services, and promoting economic growth. In practice, the SDGs can be achieved by increasing the share of renewable energy in the global energy mix, improving energy efficiency, and developing new technologies for supplying sustainable energy services [21,22]. According to Blair et al. [21], the supply of biomass (including agricultural biomass) may also directly contribute to achieving SDGs: 8 (Decent Work and Economic Growth), 9 (Industry, Innovation, and Infrastructure), 12 (Responsible Production and Consumption), and 2 and 6 (Zero Hunger and Clean Water and Sanitation, respectively). In turn, the development of bioenergy systems in areas with a low degree of urbanization/rural areas can indirectly contribute to achieving social SDGs: 1 (No Poverty), 4 (Quality Education), 5 (Gender Inequality), and 10 (Reduced Inequalities) [21]. In the opinion of Güney and Kantar [23], an increase in biomass energy consumption can increase the level of per capita sustainable development.
In the EU countries, forests, organic waste, and dedicated energy crops are the main sources of biomass for renewable energy generation [18,24]. In the production of agricultural biomass, dedicated energy crops have to be characterized by high yields, low soil requirements (plants that can be grown on marginal land to decrease competition with food crops), low agronomic requirements (low demand for agricultural resources), and high energy gain (EG) [19,25,26]. These requirements are met by fast-growing shrubs and trees (willow, Salix spp.; poplar, Populus spp.; black locust, Robinia pseudoacacia L.), perennial grasses (giant miscanthus, Miscanthus × gigantheus Greef et Deu.; Amur silvergrass, Miscanthus sacchariflorus L.; prairie cordgrass, Spartina pectinata Bosc.; switchgrass, Panicum virgatum L./Poiret; big bluestem, Andropogon gerardii Vitman), and herbaceous crops (Virginia fanpetals, Sida hermaphrodita L./Rusby; Jerusalem artichoke, Helianthus tuberosus L.; willowleaf sunflower, Helianthus salicifolius L.; cup plant, Silphium perfoliatum L.; hemp, Cannabis sativa L.; fodder galega, Galega orientalis Lam.; Sakhalin knotweed, Polygonum sachalinense F. W. Schmidt ex Maxim.) [27,28,29,30].
Jerusalem artichoke (JA) is a lignocellulosic herbaceous crop with a high potential for bioenergy generation [31,32,33,34]. This plant species is native to central-eastern North America [31,35], and it has been naturalized within a latitude range of 40° N to 55° N [32]. Jerusalem artichoke is a herbaceous short-day plant and a spring crop with a C3 photosynthesis pathway [31,36]. This geophyte produces tubers that are abundant in inulin (500–860 g kg−1 dry matter, DM; 80–97% total sugar content) [34,37,38,39,40] and highly resistant to low temperatures [35,36,41]. Tubers can persist in soil at temperatures as low as −50 °C [42]. Due to the superior cold resistance of its tubers, JA can be grown as a perennial crop [43,44], even in regions with extreme weather conditions during winter dormancy (Alaska, Siberia, northern Scandinavian regions) [35,37,42,45,46]. Jerusalem artichoke has a lifespan (regrowth capacity of aerial biomass) of up to 15–20 years [43,44]. The growing season of JA lasts from mid-April to mid-November [44,47]. Aerial plant parts dry out and die in fall in early cultivars, but they can persist until winter in late cultivars [48]. Jerusalem artichoke is confined to small areas in nature, and most of its wild relatives are characterized by low yields and are not suitable for cultivation. Jerusalem artichoke occupies large areas only in energy plantations [44].
On average, the dry matter yield (DMY) of JA aerial biomass and tubers is determined at 20–50 and 10–30 Mg ha−1, respectively [46,49,50,51]. Jerusalem artichoke has considerable potential for bioenergy production due to its high biomass yields and diverse sources of raw material (tubers and lignocellulosic aerial biomass which contains 31% of cellulose and hemicellulose, and 16% of lignin) [32,43,50,52]. Aerial biomass is a valuable resource in the production of solid fuels [36,53,54], biogas, and bioethanol [32,36,55,56,57,58]. Tubers are also used in the production of biogas and bioethanol [32,36,44,55,56,57,58]. Aerial biomass and tubers are also processed into bioproducts in biorefineries [34,36,52,56]. The aerial biomass of JA also constitutes valuable alternative raw material in the production of fiberboards and particleboards [36,58].
The energy output (EO) of aerial biomass that can be utilized in the renewable energy sector is estimated at 70–360 GJ ha−1 y−1 [30,33,49,58,59,60]. Under favorable agroecological conditions, the EO of JA aerial biomass can be as high as 495 GJ ha−1 y−1 [61]. According to Jankowski et al. [33,62,63] and Dubis et al. [64], the EO of JA aerial biomass is similar to that noted in sweet sorghum (Sorghum bicolor L./Moench) (194–336 GJ ha−1 y−1), G. orientalis (122–270 GJ ha−1 y−1), S. hermaphrodita (52–212 GJ ha−1 y−1), H. salicifolius (109–175 GJ ha−1 y−1), S. perfoliatum (65–196 GJ ha−1 y−1), P. sachalinense (60–88 GJ ha−1 y−1), and C. sativa (100–296 GJ ha−1 y−1). When JA is grown as an annual crop, the EO of total harvested biomass (aerial biomass and tubers) reaches 185–253 [60] to 360–585 GJ ha−1 y−1 [53,65], which is comparable to that of Salix spp., Populus spp., M. giganteus, and maize (Zea mays L.) (212–565 GJ ha−1 y−1) [25,28,66,67,68,69,70]. The energy efficiency ratio (EER) of the production technology of JA in annual (aerial biomass and tubers) and perennial (aerial biomass only) cropping systems has never been examined in the literature. Due to the absence of published data, it also remains unknown whether the increase in the EO of JA grown as an annual crop exceeds the increase in energy input (EI) associated with plantation establishment (tillage and planting) and tuber harvest in each year. To fill in this knowledge gap, the present study was undertaken to determine a more energy-efficient cropping system (annual vs. perennial) for JA grown in north-eastern Poland (central-eastern Europe). Research on the sustainable use of JA biomass energy can contribute to (i) increasing energy production efficiency by identifying the most effective method of crop management in order to reduce the use of natural resources and greenhouse gas emissions, and (ii) minimizing the negative environmental impact of JA cultivation by identifying energy processes that require less primary energy.
The aim of this study was to determine the influence of perennial (only aerial biomass was harvested) and annual (both aerial biomass and tubers were harvested) cropping systems on the biomass yield (fresh matter yield and DMY) and the energy balance of JA production technology (EI, EO, EG, and EER).

2. Materials and Methods

2.1. Field Experiment

The experiment was conducted from 2018–2020 at the Agricultural Experiment Station (AES) in Bałcyny (53°35′46.4″ N, 19°51′19.5″ E, north-eastern Poland). The station is part of the University of Warmia and Mazury in Olsztyn. The experimental variable was the JA cropping system: (i) perennial (only aerial biomass was harvested) and (ii) annual (both aerial biomass and tubers were harvested). The experiment had a randomized block design (RBD) with three replications, and it was established on Haplic Luvisol originating from boulder clay [71]. Harvested plot size was 13.5 m2 (6.0 m by 2.25 m). The preceding crop was winter oilseed rape (Brassica napus L.). The chemical properties of the soil and the chemical analysis methods are presented in Table S1. Agronomic treatments are briefly described in Table 1.
Weather data (mean daily temperature and total precipitation) were acquired with the use of the PM Ecology automatic weather station (PM Ecology Ltd., Gdynia, Poland) in the AES in Bałcyny. The Selyaninov hydrothermal index was calculated in each growing season [72] (Equation (1)). The Selyaninov hydrothermal index measures effective precipitation in a given period, and it is calculated as the ratio of precipitation to evaporation, which is determined mainly by mean daily temperature.
K = Σ P Σ ( T × 0.1 )
where:
  • K–Selyaninov index (K: 0–0.5—extreme dry spell, 0.6–1.0—dry spell, 1.1–2.0—humid spell, >2.1—wet spell),
  • ΣP—total precipitation in the analyzed period,
  • ΣT—total mean daily temperature in the analyzed period,
  • 0.1—constant.

2.2. Energy Input Analysis

The EIs associated with JA cultivation in the analyzed cropping systems were determined in the experimental fields of the AES in Bałcyny. The fields are situated at a distance of 0.8 km from the AES (and this distance was included in the calculation of EIs associated with transport). Energy inputs were determined based on diesel oil consumption and the performance and operating time of agricultural machines (Table S2). The energy equivalents for calculating EIs in JA production technologies are presented in Table 2. The total EI was defined as the total consumption of energy associated with labor, fuel, tractors and farming machines, and agricultural materials (Equation (2)).
EI = EId + EIf + EIm + EIl
where:
  • EI—total energy input for Jerusalem artichoke production technology (GJ ha−1),
  • EId—energy input for diesel fuel consumption (GJ ha−1),
  • EIf—energy input for fixed assets (GJ ha−1),
  • EIm—energy input for materials (GJ ha−1),
  • EIl—energy input for human labor (GJ ha−1).

2.3. Biomass Yields

The fresh matter yield (FMY) of aerial biomass and tubers was determined by weighing immediately after harvest. The DM content of the harvested aerial biomass and tubers was determined by drying 1 kg samples at a temperature of 105 °C until constant weight in a ventilated oven FD 53 (Binder GmbH, Tuttlingen, Germany). The DM content of the harvested biomass was calculated with the use of Equation (3). The DMY of aerial biomass and tubers was calculated with the use of Equation (4).
W = ( M w M d ) M w × 100
where:
  • W—moisture content (%),
  • Mw—wet sample weight, before drying (g),
  • Md—dry sample weight, after drying (g).
DMY   ( Mg   ha 1 ) = F M Y ( Mh   ha 1 ) × D M ( % ) 100
where:
  • DMY—dry matter yield (Mg ha−1),
  • FMY—fresh matter yield (Mg ha−1),
  • DM—dry matter content (%).

2.4. Energy Output Analysis

To determine EO, 40 g samples of aerial biomass and tubers each were ground in a zero-waste analytical mill A11 basic (IKA-Werke GmbH & Co. KG, Staufen, Germany) [74]. The higher heating value (HHV) of aerial biomass and tubers was determined by adiabatic combustion in a calorimeter C 6000 (IKA-Werke GmbH & Co. KG, Staufen, Germany) with the use of a dynamic method [75]. The lower heating value (LHV) was calculated with the use of the equation proposed by Kopetz et al. [76] (Equation (5)). The EO of aerial biomass and tubers was determined with the use of Equation (6).
LHV = H H V × ( 100 W ) 100 W × 0.0244
where:
  • LHV—lower heating value of aerial biomass or tubers determined on a wet basis (MJ kg−1),
  • HHV—higher heating value of aerial biomass or tubers determined on a dry basis (MJ kg−1),
  • W—moisture content of aerial biomass or tubers (%),
  • 0.0244—correction coefficient for water vaporization enthalpy (MJ kg−1 per 1% moisture content).
EO (GJ ha−1) = LHV (GJ Mg−1) × FMY (Mg ha−1)

2.5. Energy Gain and the Energy Efficiency Ratio

The energy balance in the evaluated JA production technologies was determined by calculating EG (Equation (7)) and the EER (Equation (8)).
EG (GJ ha−1) = EO (GJ ha−1) − EI (GJ ha−1)
ERR = E O ( G J   h a 1 ) E I ( G J   h a 1 )

2.6. Statistical Analysis

The values of FMY, DM, DMY, LHV, EO, EG, and the EER were processed by analysis of the ANOVA randomized block design model. Treatment means were compared by Tukey’s honest significant difference (HSD) test. All analyses were performed in the Statistica 13 program [77]. The F-values in ANOVA are presented in Table S3.

3. Results

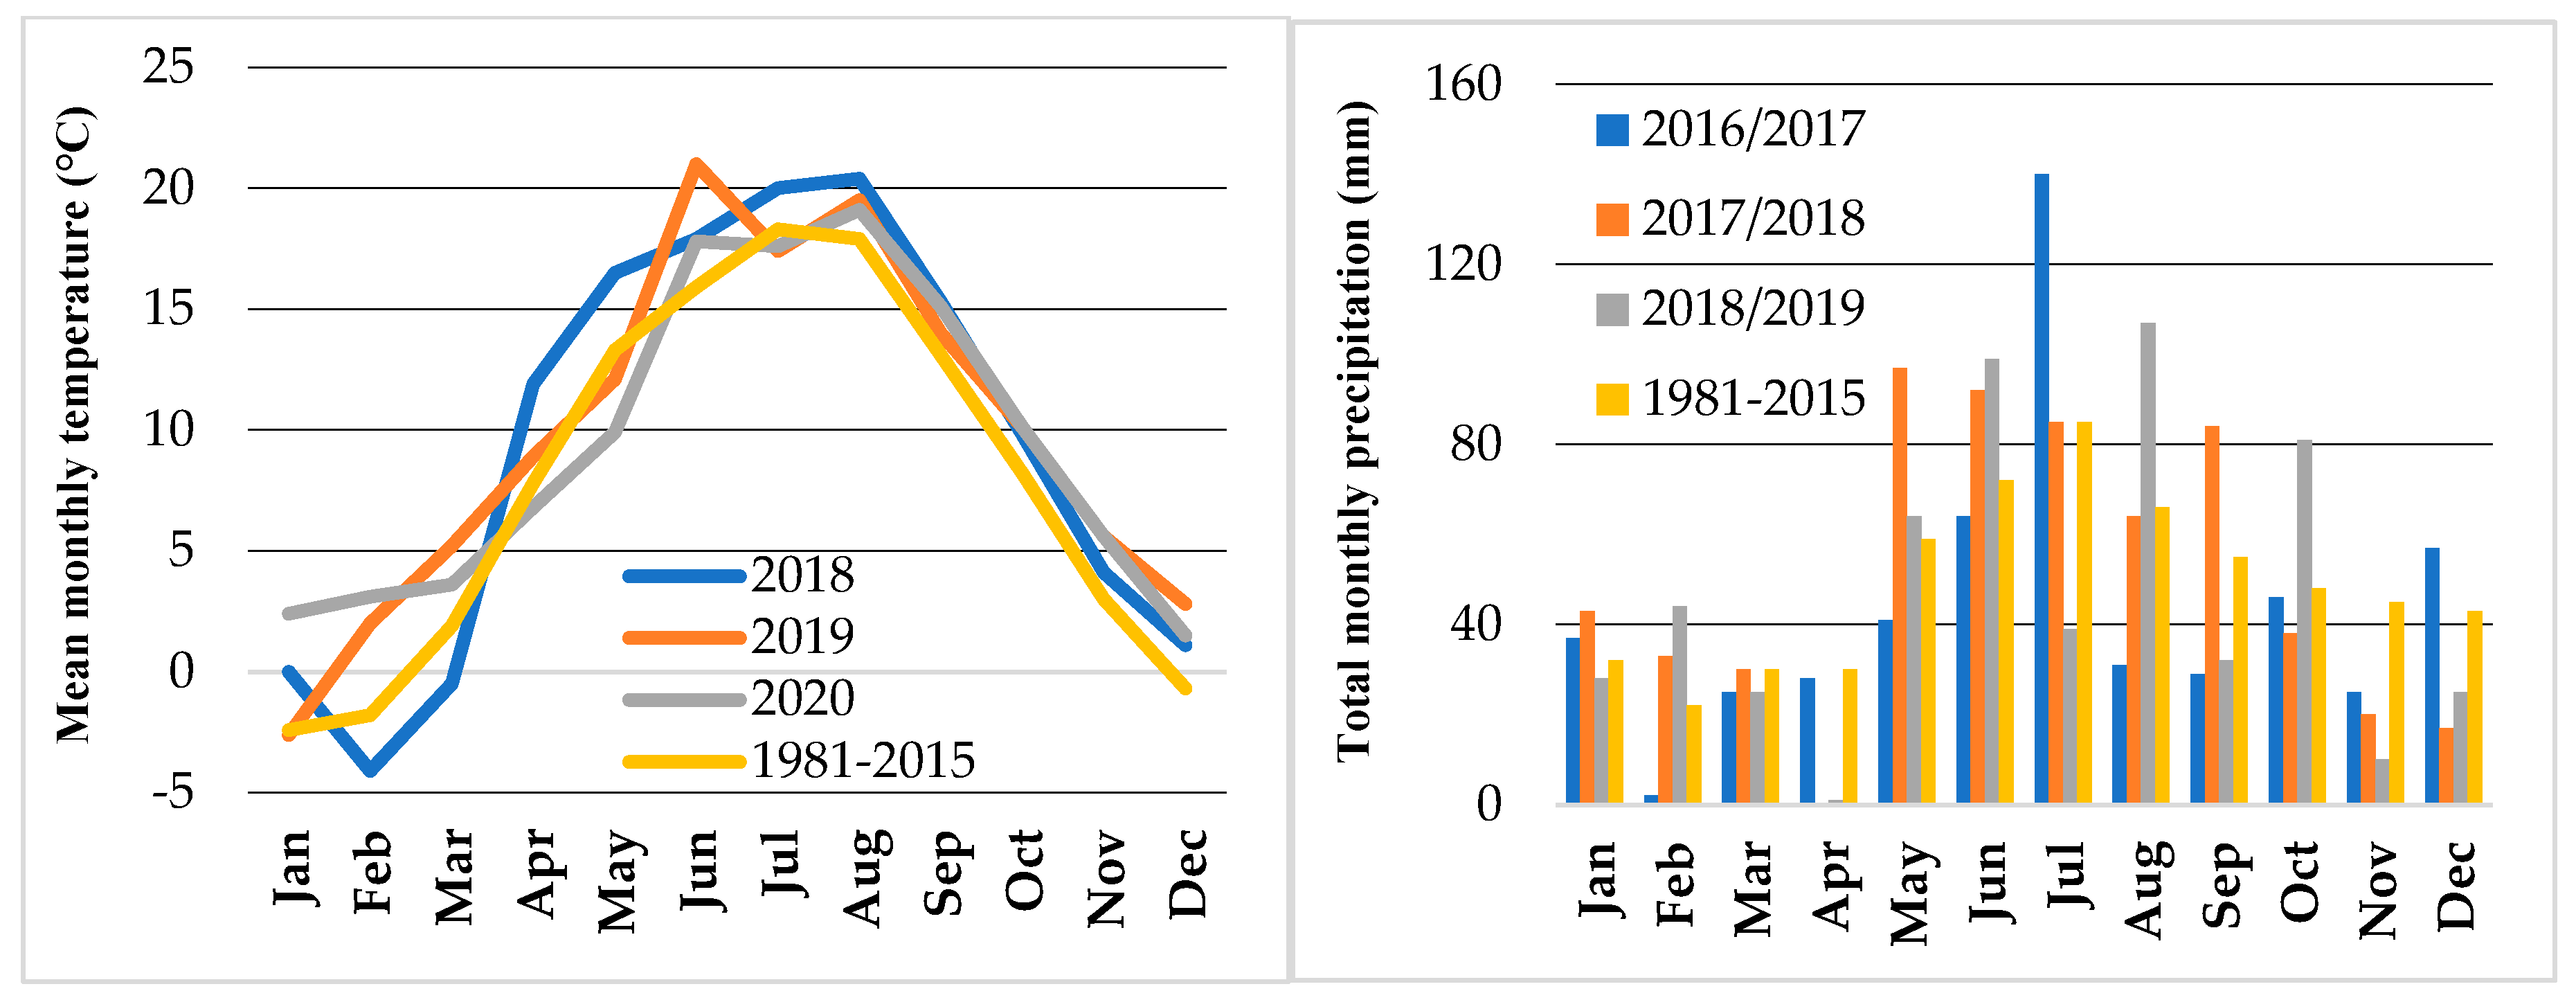
3.1. Weather Conditions

In all years of the study, the mean annual temperature exceeded the long-term average (7.9 °C) by 1.5–1.8 °C (Figure 1). In all growing seasons, annual precipitation approximated the long-term average (587 mm). In the first and third year of the experiment, precipitation levels were 11% and 5% lower than the long-term average, respectively. In the second year of the study, precipitation levels exceeded the long-term average by 10%. Weather conditions during the growing season (April–October) play a very important role in the development of spring crops. In the first and second year of the experiment (2018 and 2019), the mean daily temperature during the growing season exceeded the long-term average by 2.5 °C and 1.2 °C, respectively. In the third year of the study (2020), the mean daily temperature between April and October approximated the long-term average (13.5 °C). The highest precipitation (460 mm) was noted in the second growing season. In the remaining years, precipitation was 9% lower (year 1) or similar (year 3) to the long-term average (415 mm) (Figure 1).
Rainfall distribution in the growing season varied significantly across years (Table 3). The most supportive weather conditions for the development of JA plants were noted in the first two years of the study. In these years, the values of the Selyaninov hydrothermal index were optimal (K = 1.19–1.58) or highly favorable (K = 2.26) in June and July (a period characterized by rapid growth of aerial biomass and tuber formation). In the third growing season, June was an extremely dry month (K = 0.54), and July was a dry month (K = 0.71) (Table 3).

3.2. Energy Inputs

In the year of plantation establishment, the EIs associated with JA cultivation as a perennial crop (only aerial biomass was harvested) reached 25.2 GJ ha−1, where planting and mineral fertilization accounted for 32% and 35% of the total EI, respectively (Table 4). Energy inputs were 47–51% lower in years 2 and 3 (no tillage or planting operations) than in the year of plantation establishment. In these years, mineral fertilization was the predominant agricultural input that accounted for 65–72% of the total EI. The EIs associated with JA cultivation as an annual crop (both aerial biomass and tubers were harvested) reached 31.5–37.1 GJ ha−1 and were from 1.5 (2018) to 2.7 times higher (2019, 2020) than in the perennial cropping system (only aerial biomass was harvested). In the annual cropping system, the most energy-intensive operations were the harvest and transport of aerial biomass and tubers (34–44% of the total EI), followed by fertilization (24–28%) and planting (22–26%) (Table 4).
An analysis of energy fluxes revealed that agricultural materials exerted the greatest influence on the structure of EIs in the JA production technology (43–71% of the total EI), regardless of the cropping system (annual vs. perennial) (Table 5). Agricultural materials had a particularly high share of the total EI (63–71%) when JA was grown as a perennial crop. In JA cultivation as an annual crop (both aerial biomass and tubers were harvested), the predominant EIs were agricultural materials (43–50%), followed by diesel oil (29–34%) and tractors and agricultural machines (19–21%). In this cropping system, the high share of diesel oil and agricultural machines in the total EI can be attributed to tuber harvesting and transport which are highly energy-intensive operations (Table 5).

3.3. Biomass Yield

The FMY of JA aerial biomass was determined in the range of 17.0 to 41.5 Mg ha−1. Total FMY (aerial biomass and tubers) reached 45.0–93.5 Mg ha−1 (Table 6), and tubers accounted for approximately 58% of that value (Figure 2A). The average FMY of JA was 2.4 times higher in the annual than in the perennial cropping system (73.4 vs. 30.2 Mg ha−1) (Table 6). Weather conditions strongly differentiated FMY, regardless of the cropping system (annual vs. perennial) (Table S3). The FMY of aerial biomass and tubers was lowest in the third year of the experiment when June and July were very dry months. The highest FMY was noted in years 1 and 2, which were characterized by favorable weather conditions in critical growth periods (June and July) (Table 3 and Table 6).
The DM content of JA aerial biomass was determined at 345–364 g kg−1, and it was 34–37% lower on average in tubers (Table 7). The DM content of JA biomass was not differentiated by weather conditions across years (Table S3).
The DMY of aerial biomass and total DMY (aerial biomass and tubers) were highest in the first and second year of the study (11.2–13.75 and 23.42–26.65 Mg ha−1 DM, respectively) (Table 8). Biomass yields were 50% lower in year 3 due to a dry spell in June and July. On average, the DMY of biomass harvested during the entire experiment was twice as high in the annual than in the perennial cropping system (20.98 vs. 10.30 Mg ha−1 DM) (Table 8). Tuber DMY accounted for 46% of the total DMY (aerial biomass and tubers) on average (Figure 2B).

3.4. Energy Output

On average, LHV was 2.6 times higher in JA aerial biomass than in tubers (4.01–4.44 vs. 1.63 MJ kg−1) (Table 9). This difference can be attributed to the higher moisture content of tubers relative to aerial biomass (229 vs. 345–364 g kg−1 DM) (Table 7). The LHV of aerial biomass and tubers was not significantly differentiated by weather conditions (Table S3).
The EO of JA biomass was highest in the first and second year of the study, regardless of the cropping system (Table 10). This parameter was 43–48% lower in year 3 (a dry spell in critical growth stages decreased the values of FMY and DMY; Table 3, Table 6 and Table 7). The EO of JA was 1.8 times higher in the annual than in the perennial cropping system (275.4 vs. 157.3 GJ ha−1). The EO of JA tubers accounted for 33% of the total EO (Figure 2C).

3.5. Energy Gain and the Energy Efficiency Ratio

The average EG in JA biomass production ranged from 140 (perennial crop) to 241 GJ ha−1 (annual crop) (Table 11). The first two years of the study were characterized by the highest EG. Energy gain was nearly twice as high in years 1 and 2 than in year 3 (Table 11).
The EER was determined at 7.7–13.3, depending on weather conditions, when JA was grown as a perennial crop, and it was 20% lower when JA was grown as an annual crop (Table 12). This indicates that the increase in EI associated with plantation establishment (tillage and planting) and the harvest and transport of tubers was not fully compensated by an increase in the EO of tubers (Table 4, Table 5 and Table 12).

4. Discussion

4.1. Energy Inputs

In the work of Jankowski et al. [33] and Bogucka and Jankowski [30], the demand for energy in the production of JA aerial biomass ranged from 23.0 to 28.1 GJ ha−1 in the year of plantation establishment. The EIs associated with biomass production were 35–47% lower in the second and third year of cultivation (when tillage and planting operations were not performed). According to Fang et al. [60], the demand for energy in the biomass production of JA as an annual crop can reach 35–45 GJ ha−1 y−1. In the present study, EIs were also considerably lower (by 51% on average) in the perennial than in the annual cropping system (12.2–25.2 vs. 31.5–37.1 GJ ha−1 y−1).
The cropping system induces significant differences not only in the total EI, but also in the structure of EIs [30,33,60]. When JA is grown as a perennial crop, mineral fertilization is the most energy-intensive resource that accounts for 34–53% (year of plantation establishment) to 60–87% (years 2 and 3) of the total EI [30,33]. In the current study, tuber planting (32%) and mineral fertilization (35%) were the most energy-intensive operations in the perennial cropping system in the year of plantation establishment. In the second and third year of the experiment, mineral fertilization had the highest share of the total EI (65–72%) (due to the absence of tillage and planting operations). In the annual cropping system, the most energy-intensive operations were the harvest and transport of aerial biomass and tubers (34–44%), followed by fertilization (24–28%) and tuber planting (22–26%).

4.2. Biomass Yield

The yield potential of JA is largely determined by agroecological conditions [78,79,80,81,82,83,84,85,86,87,88,89]. Aerial biomass yields tend to be lowest (up to 15 Mg DM ha−1 y−1) in cooler regions of North America (Canada) [78], Northern Europe (Finland) [85], Eastern Europe (Lithuania) [82], and North Asia (Russian Federation, Western Siberia) [89]. Aerial biomass yields reach 30 Mg DM ha−1 y−1 in Central Europe [46,52,83,88] and the Middle East (Iran) [86]. The highest yields of JA aerial biomass (up to 40 Mg DM ha−1 y−1) are noted in Western and Southern Europe (Germany, Italy, Spain, Austria) [43,79,80,84] and in Eastern and Central Asia (China) [36,65,81]. The DMY of JA tubers accounts for 27–45% [81,84,86,90] to 72% [41,91] of the total DMY of aerial biomass and tubers. Sawicka [44] found that tuber yields are significantly affected by soil and climatic conditions. In properly managed soils that are abundant in nutrients and water, the DMY of JA tubers can reach 25–30 Mg ha−1. This parameter does not exceed 20 Mg ha−1 when soil conditions are less favorable. According to Sawicka [44], the total DMY of JA biomass (aerial biomass and tubers) can range from 24 to even 80 Mg ha−1. In the present study, the DMY of aerial biomass was determined at 6.0–13.7 Mg ha−1, and it was twice as high (12.9–26.6 Mg ha−1) when JA was grown as an annual crop. Tuber DMY had a 46% share of the total DMY.

4.3. Energy Output

The EO of the aerial biomass of JA grown in medium-input production technologies ranges from 70 to 267 GJ ha−1 y−1 [33,58,60] or even 360 GJ ha−1 y−1 [30,49]. In this study, the EO of aerial biomass was determined at 100 to 193 GJ ha−1. These differences can be largely attributed to varied weather conditions in critical growth stages (June and July). Considerable differences in the EO of JA aerial biomass produced in north-eastern Poland were previously reported by Jankowski et al. [33] and Bogucka and Jankowski [30] (72–224 and 157–360 GJ ha−1, respectively). When JA is grown as an annual crop, the EO of aerial biomass and tubers ranges from 185–253 [60] to 360–585 GJ ha−1 [53,65]. In the present study, the total EO of JA biomass produced in the annual cropping system was determined at 177 to 338 GJ ha−1. The EO of JA tubers accounted for 33% of the total EO (aerial biomass and tubers). In the work of Fang et al. [60], the EO of tubers had a similar share (35–41%) of the total EO of JA biomass.

4.4. Energy Gain and the Energy Efficiency Ratio

The EG of agricultural biomass is determined mainly by the energy intensity of the production process [70]. Intensification of biomass production may be associated with increasing the inputs of agricultural resources [27,33], cropping system (perennial vs. annual) [present study, Table 11], and the harvest strategy (single vs. multiple harvests in the growing season) [30]. In most cases, higher consumption of agricultural materials (such as fertilizers) leads to a considerable increase in FMY, DMY, and EO. The increase in EO generally exceeds the increase in EI, which improves the energy balance in the JA production technology (higher EG) [27,33]. In the work of Jankowski et al. [33], an increase in the N rate (from 100 to 160 kg ha−1) increased EG by 18%. In the current study, EG was 71% higher when JA was grown as an annual crop (both aerial biomass and tubers were harvested) rather than as a perennial crop (only aerial biomass was harvested). Contrary results were reported by Bogucka and Jankowski [30] in a study comparing the EG of JA aerial biomass harvested twice and once during the growing season. Energy gain was 40% lower when aerial biomass was harvested twice (June and October) rather than once (August) during the growing season [30].
The EER of JA grown as a perennial crop ranges from 7–18 [27,33,58] to even 30 [30]. Jankowski et al. [33] reported that agricultural inputs strongly differentiated the EER of the JA production technology. In the cited study, an increase in the N rate from 100 to 160 kg ha−1 decreased the EER by 27%. In the work of Bogucka and Jankowski [30], the EER decreased by 63% when JA was harvested twice rather than once during the growing season. In the present study, the EER was 20% lower in the annual than in the perennial cropping system. The lower value of the EER in JA cultivation as an annual crop can be attributed to a relatively high increase in EI which was not compensated by a proportional increase in the EO of tubers.

5. Conclusions

When JA was grown as a perennial crop (only aerial biomass was harvested), the demand for energy ranged from 25.2 (year of plantation establishment) to 12.2–13.4 GJ ha−1 (years 2 and 3). In the first year of JA cultivation, tuber planting (32% of the total EI) and mineral fertilization (35% of the total EI) were the most energy-intensive operations. In years 2 and 3, mineral fertilization had the highest share of the total EI (65–72%). In the annual cropping system, EIs were determined in the range of 31.4–37.1 GJ ha−1; the highest EIs were associated with the harvest and transport of aerial biomass and tubers (34–44%), fertilization (24–28%), and tuber planting (22–26%). The DMY of aerial biomass ranged from 6.0 to 13.7 Mg ha−1. The total DMY of aerial biomass and tubers reached 12.9–26.5 Mg ha−1, and tuber DMY accounted for 46% of the total DMY. On average, the EG of JA was 1.5 times lower in the annual than in the perennial cropping system (241 vs. 140 GJ ha−1). In turn, the EER was 20% lower when JA was grown as an annual crop. These results indicate that when JA was grown as an annual crop, the numerous EIs associated with plantation establishment (tillage and planting) and the harvest and transport of tubers were not fully compensated by an increase in the EO of tubers. Jerusalem artichoke should be grown as a perennial crop in large-area farms where the main limiting factor is energy (including access to N fertilizers) rather than land. In contrast, small-area farms, where land is the main limiting factor (and access to energy resources, including N fertilizers, is a less important consideration), should produce JA as an annual crop. The annual cropping system is characterized by high energy demand, but the EG per hectare is 1.5 times higher than in the perennial cropping system.

Supplementary Materials

The following supporting information can be downloaded at: https://www.mdpi.com/article/10.3390/en17112511/s1, Table S1: Chemical properties of soil; Table S2: Parameters of agricultural machines used in the production technology of Jerusalem artichoke biomass (2018–2020); Table S3: F-test statistics in ANOVA.

Author Contributions

Conceptualization, K.J.J. and B.B.; methodology, K.J.J. and B.B.; software, K.J.J.; validation, K.J.J. and B.B.; formal analysis, K.J.J. and B.B.; investigation, K.J.J. and B.B.; resources, K.J.J. and B.B.; data curation, K.J.J.; writing—original draft preparation, K.J.J. and B.B.; writing—review and editing, K.J.J.; visualization, K.J.J.; supervision, K.J.J.; project administration, K.J.J.; funding acquisition, K.J.J. and B.B. All authors have read and agreed to the published version of the manuscript.

Funding

The results presented in this paper were obtained as part of a comprehensive study conducted at the University of Warmia and Mazury in Olsztyn (grant No. 30.610.013–110). Funded by the Minister of Science under the “Regional Initiative of Excellence program”.

Data Availability Statement

Data are contained within the article. Dataset available on request from the authors.

Acknowledgments

The authors are grateful to Die Topinambur Manufaktur in Heimenkirch (Bavaria, Germany) for supplying Jerusalem artichoke tubers for the study. We would also like to thank the staff of the AES in Bałcyny for technical support during the experiment.

Conflicts of Interest

The authors declare no conflicts of interest.

References

  1. Ritchie, H.; Rosado, P. Energy Mix. 2024. Available online: https://ourworldindata.org/energy-mix?country=#energy-mix-what-sources-do-we-get-our-energy-from (accessed on 14 March 2024).
  2. Shafiee, S.; Topal, E. When will fossil fuel reserves be diminished? Energy Policy 2009, 37, 181–189. [Google Scholar] [CrossRef]
  3. Madan, K.; Singh, O.K. Second law-based assessment of combined cycle power plant. Evergreen 2023, 10, 356–365. [Google Scholar] [CrossRef]
  4. Zybert, M.; Ronduda, H.; Raróg-Pilecka, W.; Wieczorek, W. Application of rare earth elements as modifiers for Ni-rich cathode materials for Li-ion batteries: A mini review. Front. Energy Res. 2023, 11, 1248641. [Google Scholar] [CrossRef]
  5. Axon, C.J.; Darton, R.C. The causes of risk in fuel supply chains and their role in energy security. J. Clean. Prod. 2021, 324, 129254. [Google Scholar] [CrossRef]
  6. Cui, L.; Yue, S.; Nghiem, X.H.; Duan, M. Exploring the risk and economic vulnerability of global energy supply chain interruption in the context of Russo-Ukrainian war. Res. Policy 2023, 81, 103373. [Google Scholar] [CrossRef]
  7. Szabó, Z.T.; Chuluunbaatar, E.; Alpek, B.L. The shortening of sustainable supply chains in Hungary and Europe. J. Cent. Eur. Green Innov. 2023, 11, 93–110. [Google Scholar] [CrossRef]
  8. Bełdycka-Bórawska, A.; Bórawski, P.; Borychowski, M.; Wyszomierski, R.; Bórawski, M.B.; Rokicki, T.; Ochnio, L.; Jankowski, K.; Mickiewicz, B.; Dunn, J.W. Development of solid biomass production in Poland, especially pellet, in the Context of the World’s and the European Union’s climate and energy policies. Energies 2021, 14, 3587. [Google Scholar] [CrossRef]
  9. Igliński, B.; Pietrzak, M.B.; Kiełkowska, U.; Skrzatek, M.; Kumar, G.; Piechota, G. The assessment of renewable energy in Poland on the background of the world renewable energy sector. Energy 2022, 261, 125319. [Google Scholar] [CrossRef]
  10. WBA (World Bioenergy Association). Global Bioenergy Statistics. 2022. Available online: https://www.worldbioenergy.org/uploads/221223%20WBA%20GBS%202022.pdf (accessed on 27 February 2024).
  11. Janiszewska, D.; Ossowska, L. The role of agricultural biomass as a renewable energy source in European Union countries. Energies 2022, 15, 6756. [Google Scholar] [CrossRef]
  12. Scarlat, N.; Dallemand, J.F.; Taylor, N.; Banja, M.; Sanchez Lopez, J.; Avraamides, M. Brief on Biomass for Energy in the European Union; Publications Office of the European Union: Luxembourg, 2019. [Google Scholar]
  13. Janiszewska, D.; Ossowska, L. Spatial differentiation of agricultural biomass potential in Polish voivodeships. Energies 2023, 16, 6828. [Google Scholar] [CrossRef]
  14. Statistics Poland. Energy from Renewable Sources in 2022; Statistical Analyses: Warszawa, Poland, 2023. (In Polish) [Google Scholar]
  15. IRENA (International Renewable Energy Agency). REmap 2030: A Renewable Energy Roadmap, June 2014. Abu Dhabi. Available online: https://www.irena.org/publications/2014/Jun/REmap-2030-Full-Report (accessed on 14 March 2024).
  16. Lewandowski, I.; Bahrs, E.; Dahmen, N.; Hirth, T.; Rausch, T.; Weidtmann, A. Biobased value chains for a growing bioeconomy. GCB Bioenergy 2019, 1, 4–8. [Google Scholar] [CrossRef]
  17. Elbersen, W.; Gursel, I.V.; Voogt, J.; Meesters, K.; Kulisic, B. To Be or Not to Be a Biobased Commodity: Assessing Requirements and Candidates for Lignocellulosic Based Commodities IEA Bioenergy: Task 43; Food & Biobased Research: Wageningen, The Netherlands, 2022; pp. 2–21. [Google Scholar]
  18. Von Cossel, M. Renewable energy from wildflowers—Perennial wild plant mixtures as a social-ecologically sustainable biomass supply system. Adv. Sustain. Syst. 2020, 4, 2000037. [Google Scholar] [CrossRef]
  19. Jablonowski, N.D.; Kollmann, T.; Nabel, M.; Damm, T.; Klose, H.; Müller, M.; Blasing, M.; Seebold, S.; Krafft, S.; Kuperjans, I.; et al. Valorization of Sida (Sida hermaphrodita) biomass for multiple energy purposes. Glob. Change Biol. Bioenergy 2017, 9, 202–214. [Google Scholar] [CrossRef]
  20. Akter, M.M.; Surovy, I.Z.; Sultana, N.; Faruk, M.O.; Gilroyed, B.H.; Tijing, L.; Arman; Shon, H.K.; Nam, S.Y.; Kabir, M.M. Techno-economics and environmental sustainability of agricultural biomass-based energy potential. Appl. Energ. 2024, 359, 122662. [Google Scholar] [CrossRef]
  21. Blair, M.J.; Gagnon, B.; Klain, A.; Kulišić, B. Contribution of biomass supply chains for bioenergy to Sustainable Development Goals. Land 2021, 10, 181. [Google Scholar] [CrossRef]
  22. United Nations. Agenda for Sustainable Development; United Nations: New York, NY, USA, 2019; Available online: https://www.un.org/sustainabledevelopment/sustainable-development-goals/ (accessed on 2 May 2024).
  23. Güney, T.; Kantar, K. Biomass energy consumption and sustainable development. Int. J. Sustain. Dev. World Ecol. 2020, 27, 762–767. [Google Scholar] [CrossRef]
  24. Von Cossel, M.; Pereira, L.A.; Lewandowski, I. Deciphering substrate-specific methane yields of perennial herbaceous wild plant species. Agronomy 2021, 11, 451. [Google Scholar] [CrossRef]
  25. Jankowski, K.J.; Dubis, B.; Budzyński, W.S.; Bórawski, P.; Bułkowska, K. Energy efficiency of crops grown for biogas production in a large-scale farm in Poland. Energy 2016, 109, 277–286. [Google Scholar] [CrossRef]
  26. Jankowski, K.J.; Dubis, B.; Sokólski, M.M.; Załuski, D.; Bórawski, P.; Szempliński, W. Productivity and energy balance of maize and sorghum grown for biogas in a large-area farm in Poland: An 11-year field experiment. Ind. Crops Prod. 2020, 148, 112326. [Google Scholar] [CrossRef]
  27. Stolarski, M.J.; Krzyżaniak, M.; Warmiński, K.; Tworkowski, J.; Szczukowski, S.; Olba–Zięty, E.; Gołaszewski, J. Energy efficiency of perennial herbaceous crops production depending on the type of digestate and mineral fertilizers. Energy 2017, 134, 50–60. [Google Scholar] [CrossRef]
  28. Dubis, B.; Jankowski, K.J.; Załuski, D.; Bórawski, P.; Szempliński, W. Biomass production and energy balance of Miscanthus over a period of 11 years: A case study in a large-scale farm in Poland. GCB Bioenergy 2019, 11, 1187–1201. [Google Scholar] [CrossRef]
  29. Jankowski, K.J.; Dubis, B.; Sokólski, M.M.; Załuski, D.; Bórawski, P.; Szempliński, W. Biomass yield and energy balance of Virginia fanpetals in different production technologies in north-eastern Poland. Energy 2019, 185, 612–623. [Google Scholar] [CrossRef]
  30. Bogucka, B.; Jankowski, K.J. The effect of harvest strategy on the energy potential of Jerusalem artichoke. Ind. Crops Prod. 2022, 177, 114473. [Google Scholar] [CrossRef]
  31. Kays, S.J.; Nottingham, S.F. Biology and Chemistry of Jerusalem Artichoke: Helianthus tuberosus L.; CRC Press, Taylor and Francis Group: London, UK, 2008; p. 478. [Google Scholar]
  32. Rossini, F.; Provenzano, M.E.; Kuzmanović, L.; Ruggeri, R. Jerusalem artichoke (Helianthus tuberosus L.): A versatile and sustainable crop for renewable energy production in Europe. Agronomy 2019, 9, 528. [Google Scholar] [CrossRef]
  33. Jankowski, K.J.; Dubis, B.; Kozak, M. Sewage sludge and the energy balance of Jerusalem artichoke production—A case study in north-eastern Poland. Energy 2021, 236, 121545. [Google Scholar] [CrossRef]
  34. Mu, Y.; Gao, W.; Lv, S.; Li, F.; Lu, Y.; Zhao, C. The antioxidant capacity and antioxidant system of Jerusalem artichoke (Helianthus tuberosus L.) tubers in relation to inulin during storage at different low temperatures. Ind. Crops Prod. 2021, 161, 113229. [Google Scholar] [CrossRef]
  35. Swanton, C.J.; Cavers, P.B.; Clements, D.R.; Moore, T.M. The biology of Canadian weeds. 101. Helianthus tuberosus L. Can. J. Plant Sci. 1992, 72, 1367–1382. [Google Scholar] [CrossRef]
  36. Long, X.H.; Shaob, H.B.; Liu, L.; Liu, L.P.; Liua, Z.U. Jerusalem artichoke: A sustainable biomass feedstock for biorefinery. Renew. Sustain. Energy Rev. 2016, 54, 1382–1388. [Google Scholar] [CrossRef]
  37. Gunnarsson, I.B.; Svensson, S.E.; Johansson, E.; Karakashev, D.; Angelidaki, I. Potential of Jerusalem artichoke (Helianthus tuberosus L.) as a biorefinery crop. Ind. Crops Prod. 2014, 56, 231–240. [Google Scholar] [CrossRef]
  38. Rubel, I.A.; Iraporda, C.; Manrique, G.D.; Genovese, D.B.; Abraham, A.G. Inulin from Jerusalem artichoke (Helianthus tuberosus L.): From its biosynthesis to its application as bioactive ingredient. Bioact. Carbohydr. Diet. Fibre 2021, 26, 100281. [Google Scholar] [CrossRef]
  39. Sawicka, B.; Danilenko, H.; Jariene, E.; Skiba, D.; Rachoń, L.; Barbaś, P.; Pszczółkowski, P. Nutritional value of jerusalem artichoke tubers (Helianthus tuberosus L.) grown in organic system under Lithuanian and Polish conditions. Agriculture 2021, 11, 440. [Google Scholar] [CrossRef]
  40. Wierzbowska, J.; Cwalina-Ambroziak, B.; Waskiewicz, A.; Bogucka, B. Influence of nitrogen fertilizers on the concentrations of inulin and micronutrients in Jerusalem artichoke tubers and root chicory. J. Elementol. 2023, 28, 793–814. [Google Scholar] [CrossRef]
  41. Lv, S.; Wang, R.; Xiao, Y.; Li, F.; Mu, Y.; Lu, T.; Gao, W.; Yang, B.; Kou, Y.; Zeng, J.; et al. Growth, yield formation, and inulin performance of a non-food energy crop, Jerusalem artichoke (Helianthus tuberosus L.), in a semi-arid area of China. Ind. Crops Prod. 2019, 134, 71–79. [Google Scholar] [CrossRef]
  42. Smekalova, T.N.; Lebedeva, N.V.; Novikova, L.Y. Morphological analysis of Jerusalem artichoke (Helianthus tuberosus L.) accessions of different origin from vir collection. Proc. Latv. Acad. Sci. Sect. B 2019, 73, 502–512. [Google Scholar] [CrossRef]
  43. Englert, H.; Lewandowski, I.; Böhmel, C.; Vetter, A.; Hartmann, H. Biomass production. In Energie aus Biomasse: Grundlagen, Techniken und Verfahren; Kaltschmitt, M., Hartmann, H., Hofbauer, H., Eds.; Springer: Berlin/Heidelberg, Germany, 2009; pp. 75–134. (In Germany) [Google Scholar]
  44. Sawicka, B. Jerusalem artichoke (Helianthus tuberosus L.). In Biology, Culture, the Importance of Utility; University of Life Sciences Publishing House: Lublin, Poland, 2016; p. 241. (In Polish) [Google Scholar]
  45. Slimestad, R.; Seljaasen, R.; Meijer, K.; Skar, S.L. Norwegian-grown Jerusalem artichoke (Helianthus tuberosus L.): Morphology and content of sugars and fructo-oligosaccharides in stems and tubers. J. Sci. Food Agric. 2010, 90, 956–964. [Google Scholar] [CrossRef] [PubMed]
  46. Yaroshevich, M.I.; Gil, T.; Savic, I.M. Study, justification and development of major agrotechnical methods topinambur growing in Belarus. In Proceedings of the International Conference on Jerusalem Artichoke, Moskva, Russia, 24–25 October 2011; pp. 24–27. (In Russian). [Google Scholar]
  47. Lewandowski, I.; Clifton-Brown, J.C.; Scurlock, J.M.O.; Huisman, W. Miscanthus: European experience with a novel energy crop. Biomass Bioenergy 2000, 19, 209–227. [Google Scholar] [CrossRef]
  48. Chekroun, M.B.; Amzile, J.; Yachioui, M.E.E.; Haloui, N.E.E.; Prevost, J. Qualitative and quantitative development of carbohydrate reserves during the biological cycle of Jerusalem artichoke (Helianthus tuberosus L.) tubers. N. Z. J. Crop Horti. Sci. 1994, 22, 31–37. [Google Scholar] [CrossRef]
  49. Sawicka, B.; Skiba, D.; Bienia, B.; Kiełtyka-Dadasiewicz, A.; Danilčenko, H. Jerusalem artichoke (Helianthus tuberosus L.) as energy raw material. In Proceedings of the 9th International Scientific Conference Rural Development, Kovno, Lithuania, 26–28 September 2019; pp. 336–342. [Google Scholar]
  50. Sawicka, B.; Skiba, D.; Pszczółkowski, P.; Aslan, I.; Sharifi-Rad, J.; Krochmal-Marczak, B. Jerusalem artichoke (Helianthus tuberosus L.) as a medicinal plant and its natural products. Cell. Mol. Biol. 2020, 66, 160–177. [Google Scholar] [CrossRef] [PubMed]
  51. Dybek, B.; Anders, D.; Hołaj-Krzak, J.T.; Hałasa, Ł.; Maj, G.; Kapłan, M.; Klimek, K.; Filipczak, G.; Wałowski, G. Assessment of the prospects of Polish non-food energy agriculture in the context of a renewable energy source. Energies 2023, 16, 3315. [Google Scholar] [CrossRef]
  52. Kaszás, L.; Alshaal, T.; El-Ramady, H.; Kovács, Z.; Koroknai, J.; Elhawat, N.; Nagy, E.; Cziáky, Z.; Fári, M.; Domokos-Szabolcsy, E. Identification of bioactive phytochemicals in leaf protein concentrate of Jerusalem artichoke (Helianthus tuberosus L.). Plants 2020, 9, 889. [Google Scholar] [CrossRef]
  53. Piskier, T. A method of estimation of the caloric value of the biomass. Part I—Biomass energy potential. J. Mech. Energy Eng. 2017, 1, 189–194. [Google Scholar]
  54. Mehmood, M.A.; Ahmad, M.S.; Liu, Q.; Liu, C.G.; Tahir, M.H.; Aloqbi, A.A.; Tarbiah, N.I.; Alsufiani, H.M.; Gull, M. Helianthus tuberosus as a promising feedstock for bioenergy and chemicals appraised through pyrolysis, kinetics, and TG–FTIR–MS based study. Energy Convers. Manag. 2019, 194, 37–45. [Google Scholar] [CrossRef]
  55. Matías, J.; Encinar, J.M.; González, J.; González, J.F. Optimisation of ethanol fermentation of Jerusalem artichoke tuber juice using simple technology for a decentralised and sustainable ethanol production. Energy Sustain. Dev. 2015, 25, 34–39. [Google Scholar] [CrossRef]
  56. Qiu, Y.; Lei, P.; Zhang, Y.; Sha, Y.; Zhan, Y.; Xu, Z.; Li, S.; Xu, H.; Ouyang, P. Recent advances in bio-based multi-products of agricultural Jerusalem artichoke resources. Biotechnol. Biofuels. 2018, 11, 151. [Google Scholar] [CrossRef] [PubMed]
  57. Kowalczyk-Juśko, A.; Pochwatka, P.; Zaborowicz, M.; Czekała, W.; Mazurkiewicz, J.; Mazur, A.; Janczak, D.; Marczuk, A.; Dach, J. Energy value estimation of silages for substrate in biogas plants using an artificial neural network. Energy 2020, 202, 117729. [Google Scholar] [CrossRef]
  58. Pędzik, M.; Janiszewska, D.; Rogoziński, T. Alternative lignocellulosic raw materials in particleboard production: A review. Ind. Crops Prod. 2021, 174, 114162. [Google Scholar] [CrossRef]
  59. Piskier, T. The energy potential of Jerusalem artichoke. Probl. Inżynierii Rol. 2009, 1, 133–136. (In Polish) [Google Scholar]
  60. Fang, Y.R.; Liu, J.A.; Steinberger, Y.; Xie, G.H. Energy use efficiency and economic feasibility of Jerusalem artichoke production on arid and coastal saline lands. Ind. Crops Prod. 2018, 117, 131–139. [Google Scholar] [CrossRef]
  61. Ivanova, T.; Muntean, A.; Titei, V.; Havrland, B.; Kolarikova, M. Energy crops utilization as an alternative agricultural production. Agron. Res. 2015, 13, 311–317. [Google Scholar]
  62. Jankowski, K.J.; Sokólski, M.M.; Dubis, B.; Załuski, D.; Szempliński, W. Sweet sorghum—Biomass production and energy balance at different levels of agricultural inputs. A six-year field experiment in north-eastern Poland. Eur. J. Agron. 2020, 119, 126119. [Google Scholar] [CrossRef]
  63. Jankowski, K.J.; Kołodziej, B.; Dubis, B.; Sugier, D.; Antonkiewicz, J.; Szatkowski, A. The effect of sewage sludge on the energy balance of cup plant biomass production. A six-year field experiment in Poland. Energy 2023, 276, 127478. [Google Scholar] [CrossRef]
  64. Dubis, B.; Jankowski, K.J.; Sokólski, M.; Załuski, D.; Bórawski, P.; Szempliński, W. Biomass yield and energy balance of fodder galega in different production technologies: An 11-year field experiment in a large-area farm in Poland. Renew. Energy 2020, 154, 813–825. [Google Scholar] [CrossRef]
  65. Gao, K.; Zhu, T.-X.; Wang, Q.-B. Nitrogen fertilization, irrigation, and harvest times affect biomass and energy value of Helianthus tuberosus L. J. Plant Nutr. 2016, 39, 1906–1914. [Google Scholar]
  66. Angelini, L.G.; Ceccarini, L.; Di Nasso, N.N.; Bonari, E. Comparison of Arundo donax L. and Miscanthus giganteus in a long-term field experiment in Central Italy: Analysis of productive characteristics and energy balance. Biomass Bioenergy 2009, 33, 635–643. [Google Scholar] [CrossRef]
  67. Iqbal, Y.; Gauder, M.; Claupein, W.; Graeff-Höonninger, S.; Lewandowski, I. Yield and quality development comparison between miscanthus and switchgrass over a period of 10 years. Energy 2015, 89, 268–276. [Google Scholar] [CrossRef]
  68. Muylle, H.; Van Hullea, S.; De Vliegher, A.; Baert, J.; Van Bockstaele, E.; Roldán-Ruiz, I. Yield and energy balance of annual and perennial lignocellulosic crops for bio-refinery use: A 4-year field experiment in Belgium. Eur. J. Agron. 2015, 63, 62–70. [Google Scholar] [CrossRef]
  69. Stolarski, M.J.; Krzyżaniak, M.; Warmiński, K.; Olba-Zięty, E.; Penni, D.; Bordiean, A. Energy efficiency indices for lignocellulosic biomass production: Short rotation coppices versus grasses and other herbaceous crops. Ind. Crops Prod. 2019, 135, 10–20. [Google Scholar] [CrossRef]
  70. Dubis, B.; Jankowski, K.J.; Załuski, D.; Sokólski, M. The effect of sewage sludge fertilization on the biomass yield of giant miscanthus and the energy balance of the production process. Energy 2020, 206, 118189. [Google Scholar] [CrossRef]
  71. IUSS Working Group WRB. World Reference Base for Soil Resources. In International Soil Classification System for Naming Soils and Creating Legends for Soil Maps, 4th ed.; FAO: Vienna, Austria, 2022; p. 234. [Google Scholar]
  72. Molga, M. Agricultural Meteorology. PWRiL: Warszawa, Poland, 1958; pp. 550–556. (In Polish) [Google Scholar]
  73. Wójcicki, Z. Equipment, Materials and Energy Inputs in Growth-Oriented Farms; IBMER: Warszawa, Poland, 2000. (In Polish) [Google Scholar]
  74. PN-EN ISO 14780:2017; Solid Biofuels—Sample Preparation. Polish Committee for Standardization: Warszawa, Poland, 2017. (In Polish)
  75. PN-EN ISO 18125:2017; Solid Biofuels—Determination of Calorific Value. Polish Committee for Standardization: Warszawa, Poland, 2017. (In Polish)
  76. Kopetz, H.; Jossart, J.; Ragossnig, H.; Metschina, C. European Biomass Statistics; European Biomass Association (AEBIOM): Brussels, Belgium, 2007. [Google Scholar]
  77. TIBCO Software Inc. Statistica (Data Analysis Software System), Version 13; TIBCO Software Inc.: Palo Alto, CA, USA, 2017.
  78. Labergh, C.; Sackston, W.E. Adaptability and diseases of Jerusalem artichoke (Helianthus tuberosus) in Quebec. Can. J. Plant Sci. 1987, 67, 349–353. [Google Scholar] [CrossRef]
  79. Baldini, M.; Danuso, F.; Turi, M.; Vannozzi, G.P. Evaluation of new clones of Jerusalem artichoke (Helianthus tuberosus L.) for inulin and sugar yield from stalks and tubers. Ind. Crops Prod. 2004, 19, 25–40. [Google Scholar] [CrossRef]
  80. Liebhard, P.; Zeitlhofer, C.; Kaul, H.P.; Amon, T. Methanbildungsvermögen und Biogasqualität bei der Vergärung von Topinamburkraut. In Topinambur—Eine Pflanze Mit Vielen Verwendungsmöglichkeiten; Landwirtschaftliches Technologiezentrum Augustenberg (LTZ): Karlsruhe, Germany, 2009; pp. 2.11–2.17. Available online: http://www.topinambur-verein.de/Download/Wissenswertes/Workshop-Tagungsband.pdf (accessed on 28 March 2024). (In Germany)
  81. Liu, Z.X.; Spiertz, J.H.J.; Sha, J.; Xue, S.; Xie, G.H. Growth and yield performance of Jerusalem artichoke clones in a semiarid region of China. Agron. J. 2012, 104, 1538–1546. [Google Scholar] [CrossRef]
  82. Slepetys, J.; Kadziuliene, Z.; Sarunaite, L.; Tilvikiene, V.; Kryzeviciene, A. Biomass potential of plants grown for bioenergy production. In Growing and Processing Technologies of Energy Crops, Proceedings of the International Scientific Conference Renewable Energy and Energy Efficiency, 28–30 May 2012, Jelgava, Latvia, 2012; Rivža, P., Rivža, S., Eds.; pp. 66–72. Available online: https://www.researchgate.net/profile/Shiplu-Sarker/publication/234033439_Biofuel_from_the_anaerobic_co-digestion_of_the_macro-algae_ulva_lactuca_and_laminaria_digitata/links/0fcfd50e6a3785130d000000/Biofuel-from-the-anaerobic-co-digestion-of-the-macro-algae-ulva-lactuca-and-laminaria-digitata.pdf#page=66 (accessed on 28 March 2024).
  83. Cepl, J.; Kasal, P.; Souckova, H.; Svobodova, A.; Bucher, P. Non-food production of Jerusalem artichoke (Helianthus tuberosus) and possibilities of its energetic utilization. In Proceedings of the Actual Tasks on Agricultural Engineering: Proceedings of the 40th International Symposium on Agricultural Engineering, Opatija, Croatia, 21–24 February 2012; pp. 517–526. [Google Scholar]
  84. Matías, J.; González, J.; Cabanillas, J.; Royano, L. Influence of NPK fertilisation and harvest date on agronomic performance of Jerusalem artichoke crop in the Guadiana Basin (Southwestern Spain). Ind. Crops Prod. 2013, 48, 191–197. [Google Scholar] [CrossRef]
  85. Epie, K.E.; Santanen, A.; Mäkelä, P.S.; Stoddard, F. Fertilizer and intercropped legumes as nitrogen source for Jerusalem artichoke (Helianthus tuberosus L.) tops for bioenergy. Agric. Food Sci. 2018, 27, 199–205. [Google Scholar] [CrossRef]
  86. Farzinmehr, S.; Rezaei, J.H.; Fazaeli, H. Effect of harvesting frequency and maturity stage of Jerusalem artichoke forage on yield, chemical composition and in vitro fermentation of the tubers and forage. Span. J. Agric. Res. 2020, 18, 1–12. [Google Scholar] [CrossRef]
  87. Bogucka, B.; Jankowski, K. Jerusalem artichoke: Quality response to potassium fertilization and irrigation in Poland. Agronomy 2020, 10, 1518. [Google Scholar] [CrossRef]
  88. Bogucka, B.; Pszczółkowska, A.; Okorski, A.; Jankowski, K. The effects of potassium fertilization and irrigation on the yield and health status of Jerusalem artichoke (Helianthus tuberosus L.). Agronomy 2021, 11, 234. [Google Scholar] [CrossRef]
  89. Chupina, M.P.; Stepanov, A.F. Assessment of Photosynthetic Productivity of New Perennial Forage Crops in Forest-Steppe Conditions of Western Siberia. IOP Conf. Ser. Earth Environ. Sci. 2021, 624, 012121. Available online: https://iopscience.iop.org/article/10.1088/1755-1315/624/1/012121/pdf (accessed on 14 March 2024). [CrossRef]
  90. Wierzbowska, J.; Cwalina-Ambroziak, B.; Bogucka, B. The Effect of Nitrogen Fertilization on Yield and macronutrient concentrations in three cultivars of Jerusalem Artichoke (Helianthus tuberosus L.). Agronomy 2021, 11, 2161. [Google Scholar] [CrossRef]
  91. Ruttanaprasert, R.; Jogloy, S.; Vorasoot, N.; Kesmala, T.; Kanwar, R.S.; Holbrook, C.C.; Patanothai, A. Effects of water stress on total biomass, tuber yield, harvest index and water use efficiency in Jerusalem artichoke. Agric. Water Manag. 2016, 166, 130–138. [Google Scholar] [CrossRef]
Figure 1. Weather conditions in 2018–2020 vs. the long-term average (1981–2015).
Energies 17 02511 g001
Figure 2. Proportion of tubers in the fresh matter yield [A], dry matter yield [B], and energy output [C] of total biomass (aerial biomass and tubers) of Jerusalem artichoke.
Energies 17 02511 g002
Table 1. Production technologies of Jerusalem artichoke.
Farming OperationPerennial Cropping SystemAnnual Cropping System
TillageSkimming (5–8 cm); fall plowing
(18–22 cm); two treatments with a cultivation unit (5–8 cm) *
Skimming (5–8 cm); fall plowing
(18–22 cm); two treatments with a cultivation unit (5–8 cm) **
Tuber planting30 April 2018; cv. Medius; row spacing: 75 × 30 cm; planting depth: 6–8 cm; density: 4.4 tubers m−2 *1 May 2018; 19 April 2019; 30 April 2020; cv. Medius; row spacing: 75 × 30 cm; planting depth: 6–8 cm; density: 4.4 tubers m−2 **
Mineral fertilization80 kg N ha−1 (ammonium nitrate, 34%); 70 kg P2O5 ha−1 (enriched superphosphate, 40%); 150 kg K2O ha−1 (potash salt, 60%) **80 kg N ha−1 (ammonium nitrate, 34%); 70 kg P2O5 ha−1 (enriched superphosphate, 40%); 150 kg K2O ha−1 (potash salt, 60%) **
Weed controlTwo disc hilling treatments between rows **Two disc hilling treatments between rows **
HarvestAerial biomass only (26 October 2018; 21 October 2018; 26 October 2020) **Aerial biomass (26 October 2018; 21 October 2018; 26 October 2020) ** and tubers (30 October 2018; 23 October 2019; 28 October 2020) **
* agricultural operations performed only in the year of plantation establishment (2018); ** agricultural operations performed in all years of the study (2018, 2019, and 2020).
Table 2. Energy equivalents of inputs associated with the production technology of Jerusalem artichoke biomass.
SourceUnitInputReferences
LaborMJ hour−180Wójcicki [73]
TractorsMJ kg−1125Wójcicki [73]
MachinesMJ kg−1110Wójcicki [73]
Diesel oilMJ kg−148Wójcicki [73]
Plant material (tubers)MJ kg−13.2Fang et al. [60]
NMJ kg−177Wójcicki [73]
P2O5MJ kg−115Wójcicki [73]
K2OMJ kg−110Wójcicki [73]
Table 3. Selyaninov hydrothermal index during the growing season.
YearMonth
AprilMayJuneJulyAugustSeptemberNovember
20180.780.801.192.260.490.631.51
20190.002.591.461.581.062.001.21
20200.052.090.540.711.810.712.59
K: 0–0.5—extreme dry spell; 0.6–1.0—dry spell; 1.1–2.0—humid spell; >2.1—wet spell.
Table 4. Energy inputs associated with the Jerusalem artichoke production technology, per agricultural operation.
Specification201820192020
Cropping Systems
PerennialAnnualPerennialAnnualPerennialAnnual
GJ ha−1 y−1
Tillage2.642.640.002.640.002.64
Tuber planting8.078.070.008.070.008.07
Fertilization8.778.778.778.778.778.77
Weed management1.261.261.261.261.261.26
Harvest and transport4.4216.333.4115.322.2110.71
Total25.1637.0713.4436.0612.2431.45
%
Tillage10.57.10.07.30.08.4
Tuber planting32.121.80.022.40.025.7
Fertilization34.923.765.224.371.727.9
Weed management5.03.49.43.510.34.0
Harvest and transport17.644.125.442.518.134.1
Total100.0100.0100.0100.0100.0100.0
Table 5. Energy inputs associated with the Jerusalem artichoke production technology, per energy flux.
Specification201820192020
Cropping Systems
PerennialAnnualPerennialAnnualPerennialAnnual
GJ ha−1 y−1
Labor0.650.830.280.790.240.72
Tractors and machines1.837.911.107.640.825.89
Fuel6.9312.583.3511.882.479.09
Materials:15.7515.758.7115.758.7115.75
tubers
7.047.040.007.040.007.04
fertilizers
8.718.718.718.718.718.71
Total25.1637.0713.4436.0612.2431.45
%
Labor2.62.22.12.22.02.3
Tractors and machines7.321.38.221.26.718.7
Fuel27.533.925.032.920.228.9
Materials:62.642.564.843.771.250.1
tubers
28.019.00.019.50.022.4
fertilizers
34.623.564.824.271.227.7
Total100.0100.0100.0100.0100.0100.0
Table 6. Fresh matter yield of Jerusalem artichoke (Mg ha−1).
Year Cropping Systems x ¯
PerennialAnnual
201841.53 b93.53 a67.53 a
201932.00 bc81.83 a56.91 b
202017.03 c44.98 b31.01 c
x ¯ 30.19 b73.45 a
Means with the same letter do not differ significantly at p ≤ 0.05 in Tukey’s HSD test.
Table 7. Dry matter content of Jerusalem artichoke biomass (g kg−1).
YearCropping Systems x ¯
PerennialAnnual
Aerial BiomassAerial BiomassTubers
2018335.44356.36223.70305.17
2019350.00379.73223.86317.86
2020350.30357.27238.47315.35
x ¯ 345.25 a364.46 a228.68 b
Means with the same letter do not differ significantly at p ≤ 0.05 in Tukey’s HSD test. The absence of letters denotes non-significant differences.
Table 8. Dry matter yield of Jerusalem artichoke (Mg ha−1 DM).
Year Cropping Systems x ¯
PerennialAnnual
201813.75 b26.65 a20.20 a
201911.20 b23.42 a17.31 b
20205.97 c12.86 b9.41 c
x ¯ 10.30 b20.98 a
Means with the same letter do not differ significantly at p ≤ 0.05 in Tukey’s HSD test.
Table 9. Lower heating value of Jerusalem artichoke biomass (MJ kg−1).
YearCropping Systems x ¯
PerennialAnnual
Aerial BiomassAerial BiomassTubers
20183.524.041.523.03
20194.134.731.553.47
20204.364.541.833.58
x ¯ 4.01 a4.44 a1.63 c
Means with the same letter do not differ significantly at p ≤ 0.05 in Tukey’s HSD test. The absence of letters denotes non-significant differences.
Table 10. Energy output of Jerusalem artichoke biomass (GJ ha−1).
YearCropping Systems x ¯
PerennialAnnual
2018193.33338.54265.94 a
2019178.29310.98244.63 a
2020100.35176.67138.51 b
x ¯ 157.32 b275.40 a
Means with the same letter do not differ significantly at p ≤ 0.05 in Tukey’s HSD test. The absence of letters denotes non-significant differences.
Table 11. Energy gain in the production technology of Jerusalem artichoke (GJ ha−1 y−1).
YearCropping Systems x ¯
PerennialAnnual
2018168.17301.47234.82 a
2019164.84274.92219.88 a
202088.11145.22116.66 b
x ¯ 140.37 b240.54 a
Means with the same letter do not differ significantly at p ≤ 0.05 in Tukey’s HSD test. The absence of letters denotes non-significant differences.
Table 12. Energy efficiency ratio in the production technology of Jerusalem artichoke.
YearCropping Systems x ¯
PerennialAnnual
20187.68 bc9.13 b8.41 b
201913.26 a8.62 bc10.94 a
20208.20 bc5.62 c6.91 b
x ¯ 9.72 a7.79 b
Means with the same letter do not differ significantly at p ≤ 0.05 in Tukey’s HSD test.
Disclaimer/Publisher’s Note: The statements, opinions and data contained in all publications are solely those of the individual author(s) and contributor(s) and not of MDPI and/or the editor(s). MDPI and/or the editor(s) disclaim responsibility for any injury to people or property resulting from any ideas, methods, instructions or products referred to in the content.

