Article

A Long-Term Power Supply Risk Evaluation Method for China Regional Power System Based on Probabilistic Production Simulation

1
China Renewable Energy Engineering Institute, Power Construction Corporation of China, Beijing 100048, China
2
Center for Strategic Studies, Chinese Academy of Engineering, Beijing 100088, China
3
Department of Electrical Engineering, Tsinghua University, Beijing 100084, China
*
Author to whom correspondence should be addressed.
Energies 2024, 17(11), 2515; https://doi.org/10.3390/en17112515
Submission received: 11 April 2024 / Revised: 12 May 2024 / Accepted: 18 May 2024 / Published: 23 May 2024

Abstract

:
To qualify the risk of extreme weather events for power supply security during the long-term power system transformation process, this paper proposes a risk probability evaluation method based on probabilistic production simulation. Firstly, the internal relationship of extreme weather intensity and duration is depicted using the copula function, and the influences of extreme weather on power security are described using the guaranteed power output ability coefficient, which can provide the extreme scenario basis for probabilistic production simulation. Then, a probabilistic production simulation method is proposed, which includes a typical-year scenario and extreme weather events. Meanwhile, an index system is proposed to qualify the power security level, which applies the loss of load expectation (LOLE) and time of loss of load expectation (TOLE) under different scenarios and other indices to reveal the long-term power security trend. Finally, the long-term power supply risks for the Yunnan provincial power system are analyzed using the proposed method, validating that the proposed method is capable of characterizing the influences of extreme weather on power security. The security level of different long-term power transformation schemes is evaluated.

1. Introduction

Building a new power system dominated by renewables is critical for China to achieve its carbon neutrality goal, which can accelerate the reform of China’s energy system from traditional fossil fuels to renewables [1]. As the largest renewable power owner globally, China has wind power and solar power capacities of 380 GW and 440 GW, and its penetration of renewables has exceeded 30% [2]. However, China’s power system is still dominated by coal-fired power plants (CPPs), which have better operation flexibility than renewables, which are characterized by intermittence and random power output [3]. Therefore, the transformation from the traditional power system toward a new power system poses multiple challenges [4], which include higher supply–demand balance regulation capacity [5], lower system inertia [6], and lower operation resilience [7].
However, the frequent extreme events in recent years have also threatened the safe operation of power systems with higher proportions of renewables [8], and several blackout accidents are summarized as follows: On 28 September 2016, a blackout accident occurred in south Australia due to hurricanes and storms [9], which was the first regional blackout event triggered by severe weather in a system with large amounts of renewable energy that tripped the grid. On 16 June 2019, a large-area blackout occurred in Argentina and Uruguay, caused by a security control system strategy mistake and insufficient load cutting [10]. On 9 August 2019, a U.K. power outage happened due to a technical issue with gas-fired power plants, and the Hornsea offshore wind farm was unexpectedly offline, resulting in the grid frequency dropping below 48.9 Hz, with a combined loss of up to 1136 MW [11]. On 28 December 2020, a blackout in Mexico influenced more than 10 million customers [12], and the load loss was around 26% of the total load because of the transmission lines tripping and the power flow transferring caused by a wildfire. On 15 February 2021, the Texas power grid suffered a severe power outage due to extreme cold weather, affecting more than 4.8 million customers [13]. On 15 August 2023, a large-scale blackout occurred in the Brazil power system, which was caused by multiple factors, including weak power grid structure, insufficient power source support, and unreasonable security control [14]. In August 2022, Sichuan suffered a wide range of long-term and extreme high-temperature and drought weather, which led to a severe emergency electricity curtailment event [15]. In [16], 138 major blackouts from 1991 to 2021 were categorized and analyzed, indicating that more than half of these blackout events were caused by natural disasters. It can be concluded from the above outages that the severity of extreme events, the operation status of the power system, and the security control strategy are three critical factors for outage accidents.
Meanwhile, the power risk events in recent years also indicate different forms of power security threats during the transformation process. In 2021, the rising fossil fuel prices caused power shortage events in India [17], which led to insufficient power output by coal power plants. In 2022, extreme drought weather forced Brazil’s hydropower plants to reduce their output power [18], while hydropower supplies two-thirds of Brazil’s electricity during regular times. Additionally, the rapid growth of power consumption may also threaten the supply-demand balance of national power; extreme electricity shortage events in Pakistan always happen in the summer months, when there is a surge in electricity demand [19]. As an enormous economy, China faces the above challenges due to the different structures of regional power sources and growing electricity demand. In 2021 and 2022, power shortage events happened in northeastern China [20] and southwestern China [21]. In [22], the influence of typhoon weather in power system is analyzed, which indicates that over-load events may happen due to various line breakage conditions. In [23], the trend in power security supply in China during the 14th Five-Year period and for the medium and long terms is analyzed, and suggestions are proposed for constructing a new power supply guarantee system, which includes enhancing power supply capabilities, improving demand side response ability, and optimizing the market system. Therefore, the security of the power supply is a growing concern for the global energy low-carbon transformation process.
To overcome the above challenges, three critical problems must be solved to guarantee the safe transformation of China’s power system: changing the regional power source structure considering both energy endowment and security requirements, optimizing regional connectivity considering resource complementarity, and utilizing new low-carbon technologies. In [24], the evolving tendency of electric supply and demand patterns was analyzed using an economic–energy–electricity prediction analysis model. The prediction results revealed that the annual electricity consumption will grow to 14,800 TWh in 2050, which is 1.7 times the 2022 electricity consumption. In [25], the flexibility of the northwest China power system was investigated considering the uncertainty of renewables. The analysis results showed that the renewable curtailment problem will be severe as the proportion of renewable energy grows. In [26], the future energy system pathway for China’s Greater Bay area was investigated, and the results indicated that regional energy self-sufficiency would slowly rise with increased local renewable installation. In [27], a high-resolution assessment model for quantifying the optimal energy structure on provincial bases was built, which realized 80% renewable penetration by 2050 with large-scale wind, solar, and energy storage installation. In [28], the total inter-regional power exchange was estimated to grow to over 2000 TWh in 2050, triple the size of the value in 2022. However, the designed power system transformation pathways did not consider the influence of extreme events, and the critical factors of power supply security were not provided or discussed.
In [29], the spatiotemporal distribution of power outages in the USA was analyzed, indicating that power outages will likely increase with climate change, the aging electrical grid, and increased energy demand. In [30], a Leontief’s input–output model-based power grid resilience analysis method was proposed, which is capable of analyzing the influences of highly distributed energy resources integrated in a power system. In [31], the authors indicate that flexibility is critical for power security and cost efficiency, and four dimensions of power system flexibility must be considered: time scale, flexible resources set, system operation uncertainty, and cost constraints. In [32], a security assessment methodology is proposed, which can be used for short- term extreme weather event risk analysis. In [33], a Lagrange-multiplier-based reliability assessment method is proposed to improve computation efficiency considering topology and injection uncertainties. In [34], a risk-averse restoration method for coupled power and water system is proposed, which is suitable for improving the operation reliability of distribution networks. In [35], three levels of reliability metrics are proposed for power grids, but the uncertainty of renewable power output is not considered. In [36], the simulation cases indicate that the difficulty of ensuring power supply will gradually increase with growing renewable penetration. The growing number of extreme weather events has proved that a safe and cost-efficient power system transformation pathway must be designed to cope with the growing electricity consumption demand and severe climate change. Meanwhile, the current research on power system transformation security has mainly focused on the power source structure; the influences of power production under extreme events has not been fully considered.
Therefore, this paper proposes a long-term power-supply risk evaluation method based on probabilistic production simulation, and the main contributions are as follows: (1) a high-risk power supply scenario generation method based on Copula function is proposed, which reflects the probability distribution of extreme weather events for increasing the evaluation accuracy of power supply risk; (2) a power production simulation method is constructed, which considers the ability to regulate controllable power sources, the influences of extreme weather on the randomness of power sources, and cross-regional power transmission; (3) a case study of Yunnan’s power system was carried out to compare the power supply risk trend for three typical low-carbon transformation pathways, and the simulation results indicate that a more diverse power source structure, larger energy storage capacity, and cross-regional power support are effective methods for improving the power supply’s security level.
The rest of this paper is organized as follows: In Section 2, the overall structure of the long-term power supply risk evaluation method is proposed. In Section 3, the internal relationship of extreme weather intensity and duration is analyzed, and the guaranteed power output ability coefficient is applied to describe extreme weather’s influence on power supply security. Then, Section 4 proposes a probabilistic production simulation method, which can reflect the performance of a power system under typical extreme weather events. In Section 5, an index system is proposed to qualify the power security level with a probabilistic method. In Section 6, the power supply risks of different power transformation pathways for Yunnan’s provincial power system are compared using the proposed method. Finally, Section 7 gives the study conclusions.

2. Long-Term Power-Supply Risk Evaluation Method

2.1. General Analysis of Extreme Weather Risks to Power Supply in China

The vast expanse of China’s territory spans from east to west and from north to south, resulting in significant regional differences in climate and notable variations in the frequency and intensity of various types of natural disasters. The typical extreme weather events studied in this paper include cold waves, droughts, sand storms, and hurricanes, which may influence the power generation ability of different power sources, especially wind, solar and hydro power. For example, long-term drought may decrease the power output of run-of-river hydropower stations, and the hurricane may trigger large-scale offshore wind farm shut-offs. Meanwhile, there are three aspects of extreme weather that also influence regional power security: the intensity, the duration, and the possible occurrence times. The probability of different extreme weather events also varies in different regions; the related information is listed in Table 1.
As Table 1 shows, cold waves mainly threaten the safe operation of northern-area power systems during cold weather, and droughts pose more significant threats during hot weather. Sand storms and hurricanes influence the inland region and coastal region in China, which are the power-sending and power-receiving regions, respectively. In addition to high-risk areas and when these events occur, the internal relationship between extreme event duration and intensity also need to be considered in high-risk power supply scenario generation.

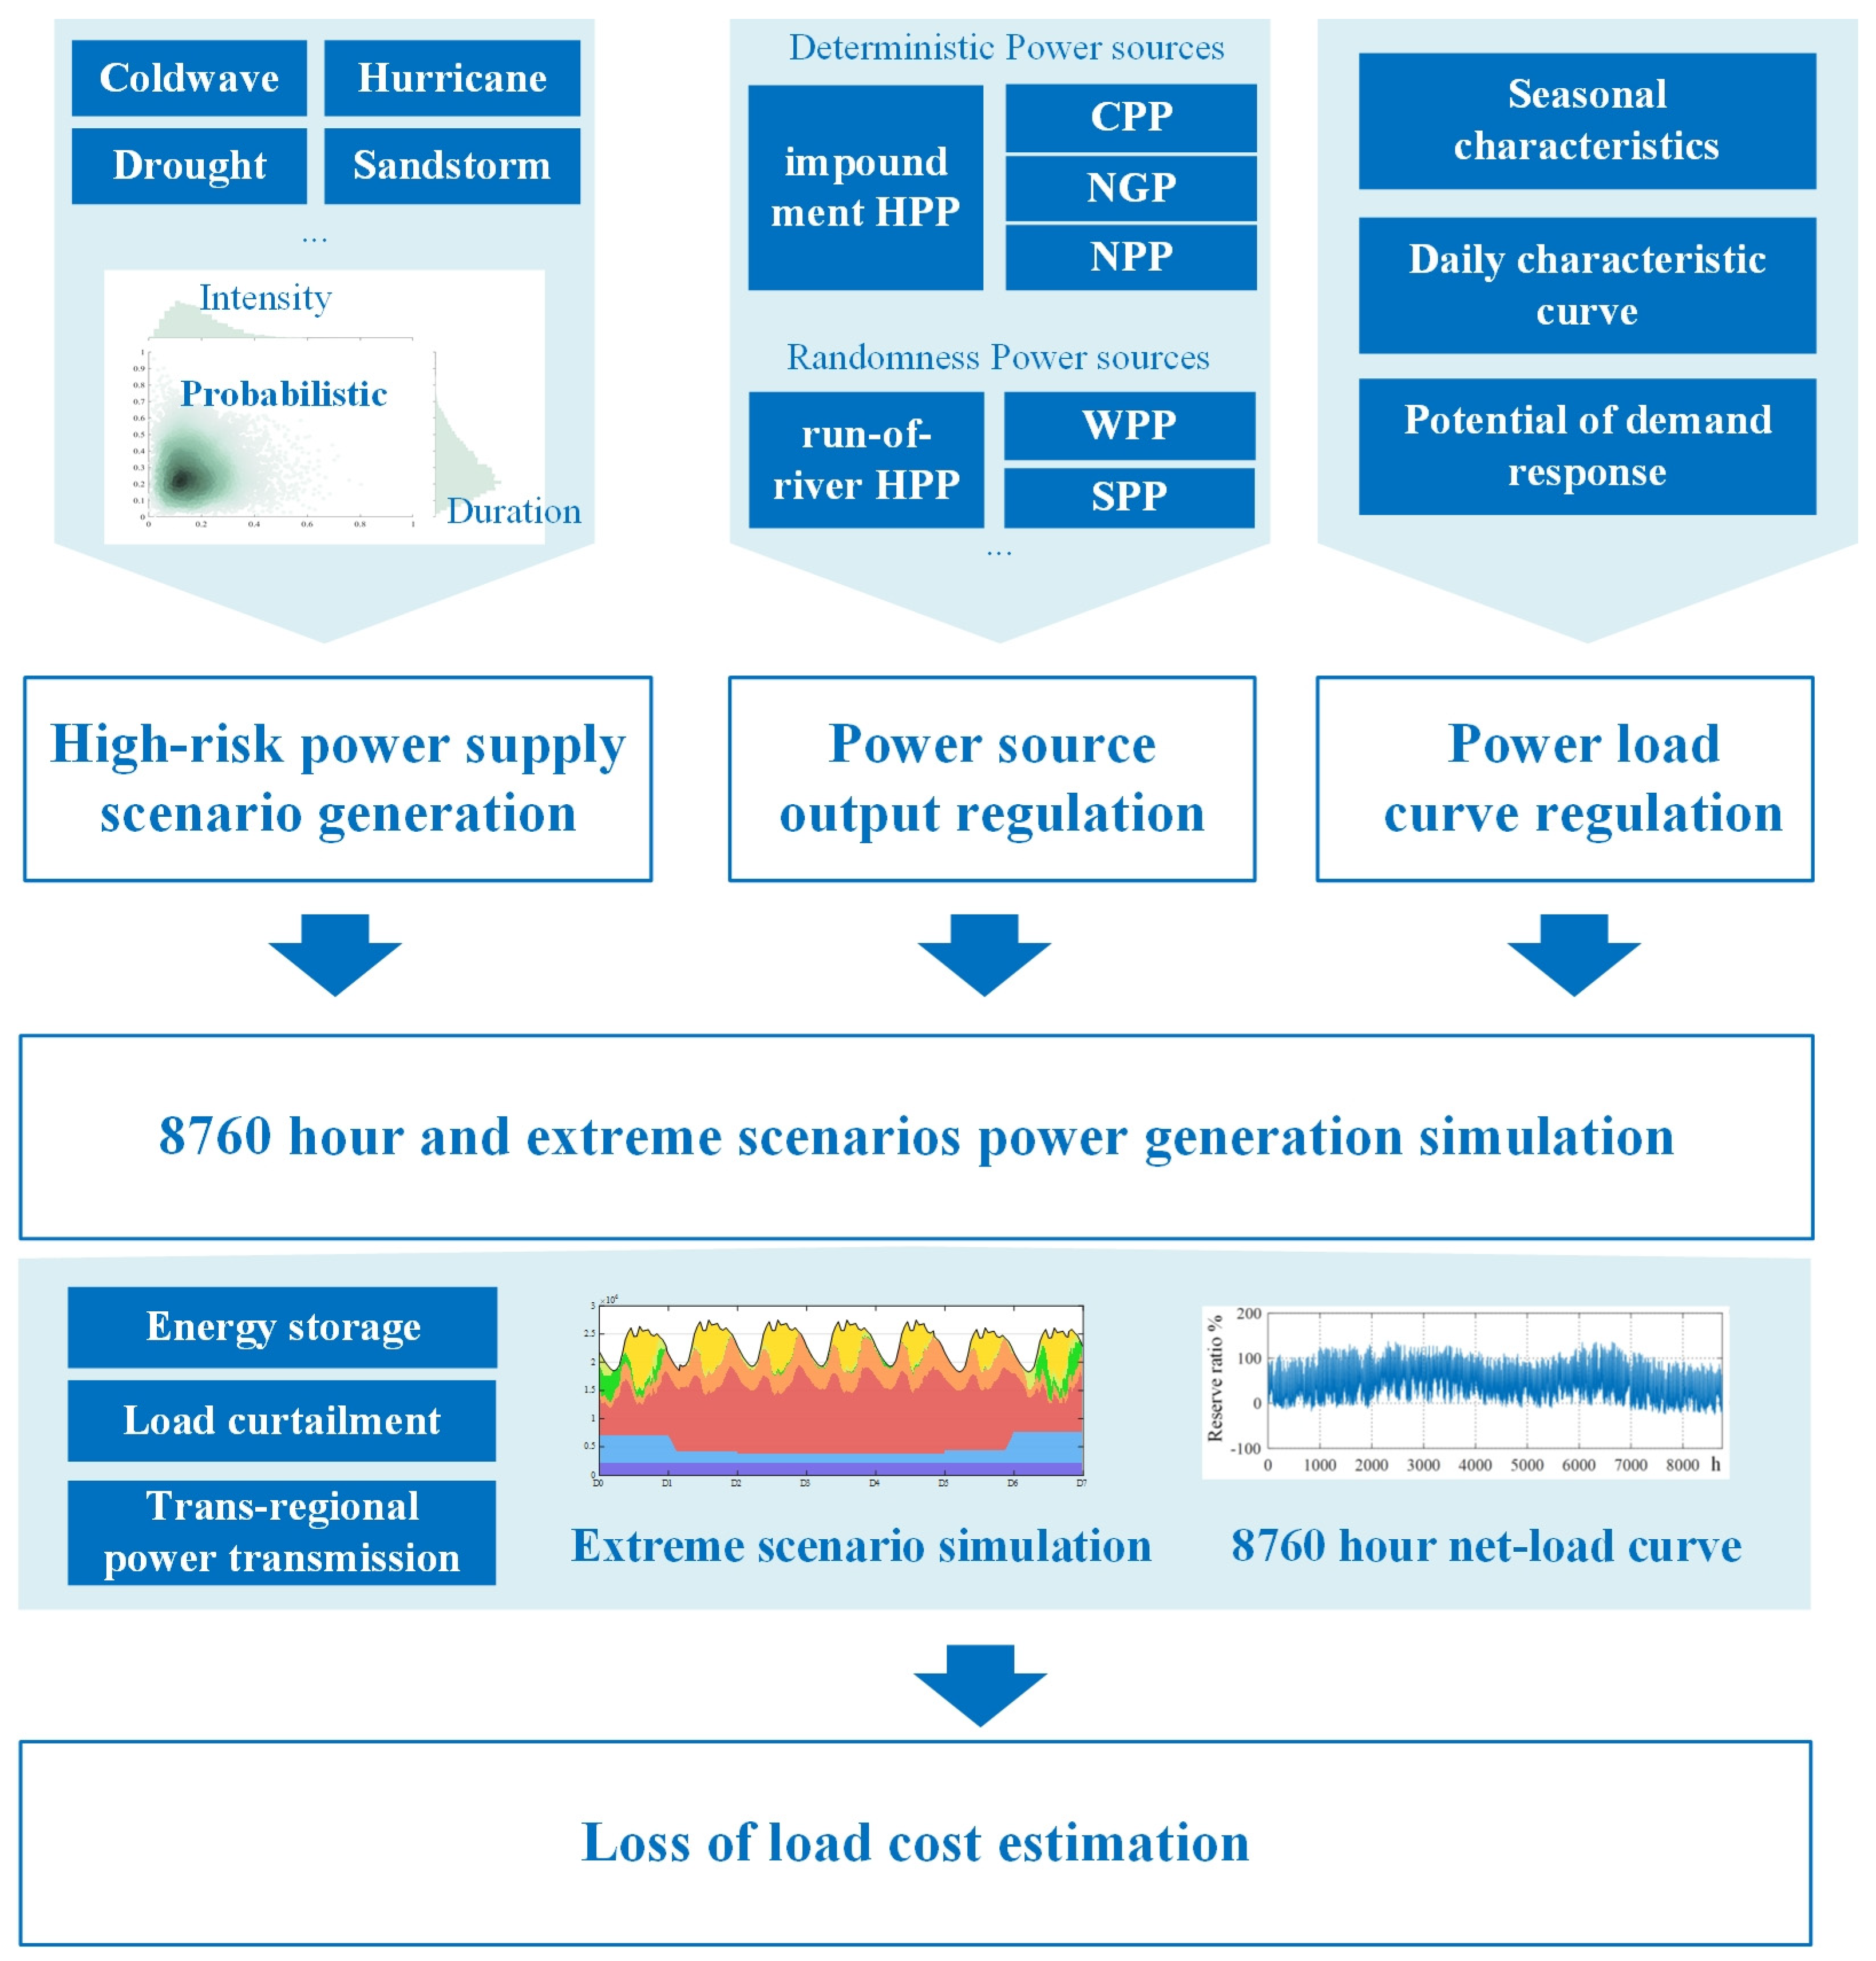
2.2. The Overall Structure of the Probabilistic Production Simulation-Based Long-Term Power-Supply Risk Evaluation Method

To show the long-term trend in regional power security changes, both normal operation status and extreme operation statuses should be considered, as do the flexibility of generation sources, load, and grid side. Therefore, this paper proposes a long-term power supply risk evaluation method based on probabilistic production simulation. The overall structure of the proposed probabilistic production simulation method is depicted in Figure 1, which contains four modules: a high-risk power-supply scenario generation module, a power source and load output regulation module, a power generation simulation module, and a risk estimation module.
To generate the high-risk power supply scenarios, the Copula method was applied to depict the intensity and duration of different extreme weather events that influence power supply security. The relationship between extreme event intensity and duration was drawn by the selection of the Copula function, and the differences in extreme events’ characteristics in different regions were described by setting the relevant parameters. Then, the high-risk power supply scenarios were generated to provide the basic information required for extreme scenario simulation.
Regarding the flexibility of traditional power system resources, the extra generating capacity, known as spinning reserve, is mainly composed of thermal and controllable hydropower plants. For new power systems, load-side resources such as demand response, hydrogen production, storage-side resources, and new types of power generation sources should also be considered. In this paper, power sources are divided into two categories: the deterministic power sources and randomness power sources. The power outputs of deterministic power sources are controllable during the extreme events. Meanwhile, power storage devices and flexible load-side resources are also considered in this paper. To qualify the influences of extreme weather on power generation and load, the randomness of power generation and the load curve are adjusted, which provide the power input for the power generation simulation.
The power generation simulation module contains typical extreme scenarios including high-risk extreme weather scenarios for specific regional power systems, including drought, hurricane, cold waves, and so on. This module provides basic information regarding the power security in a typical year and describes the power system’s security level under certain extreme weather events.
After power generation simulation, the final result is analyzed using the proposed security indices to judge the security levels of different power transformation pathways, and the loss of the load cost under different scenarios is also be given in a probabilistic form.

3. High-Risk Extreme Weather Scenario Generation Method for Power Supply

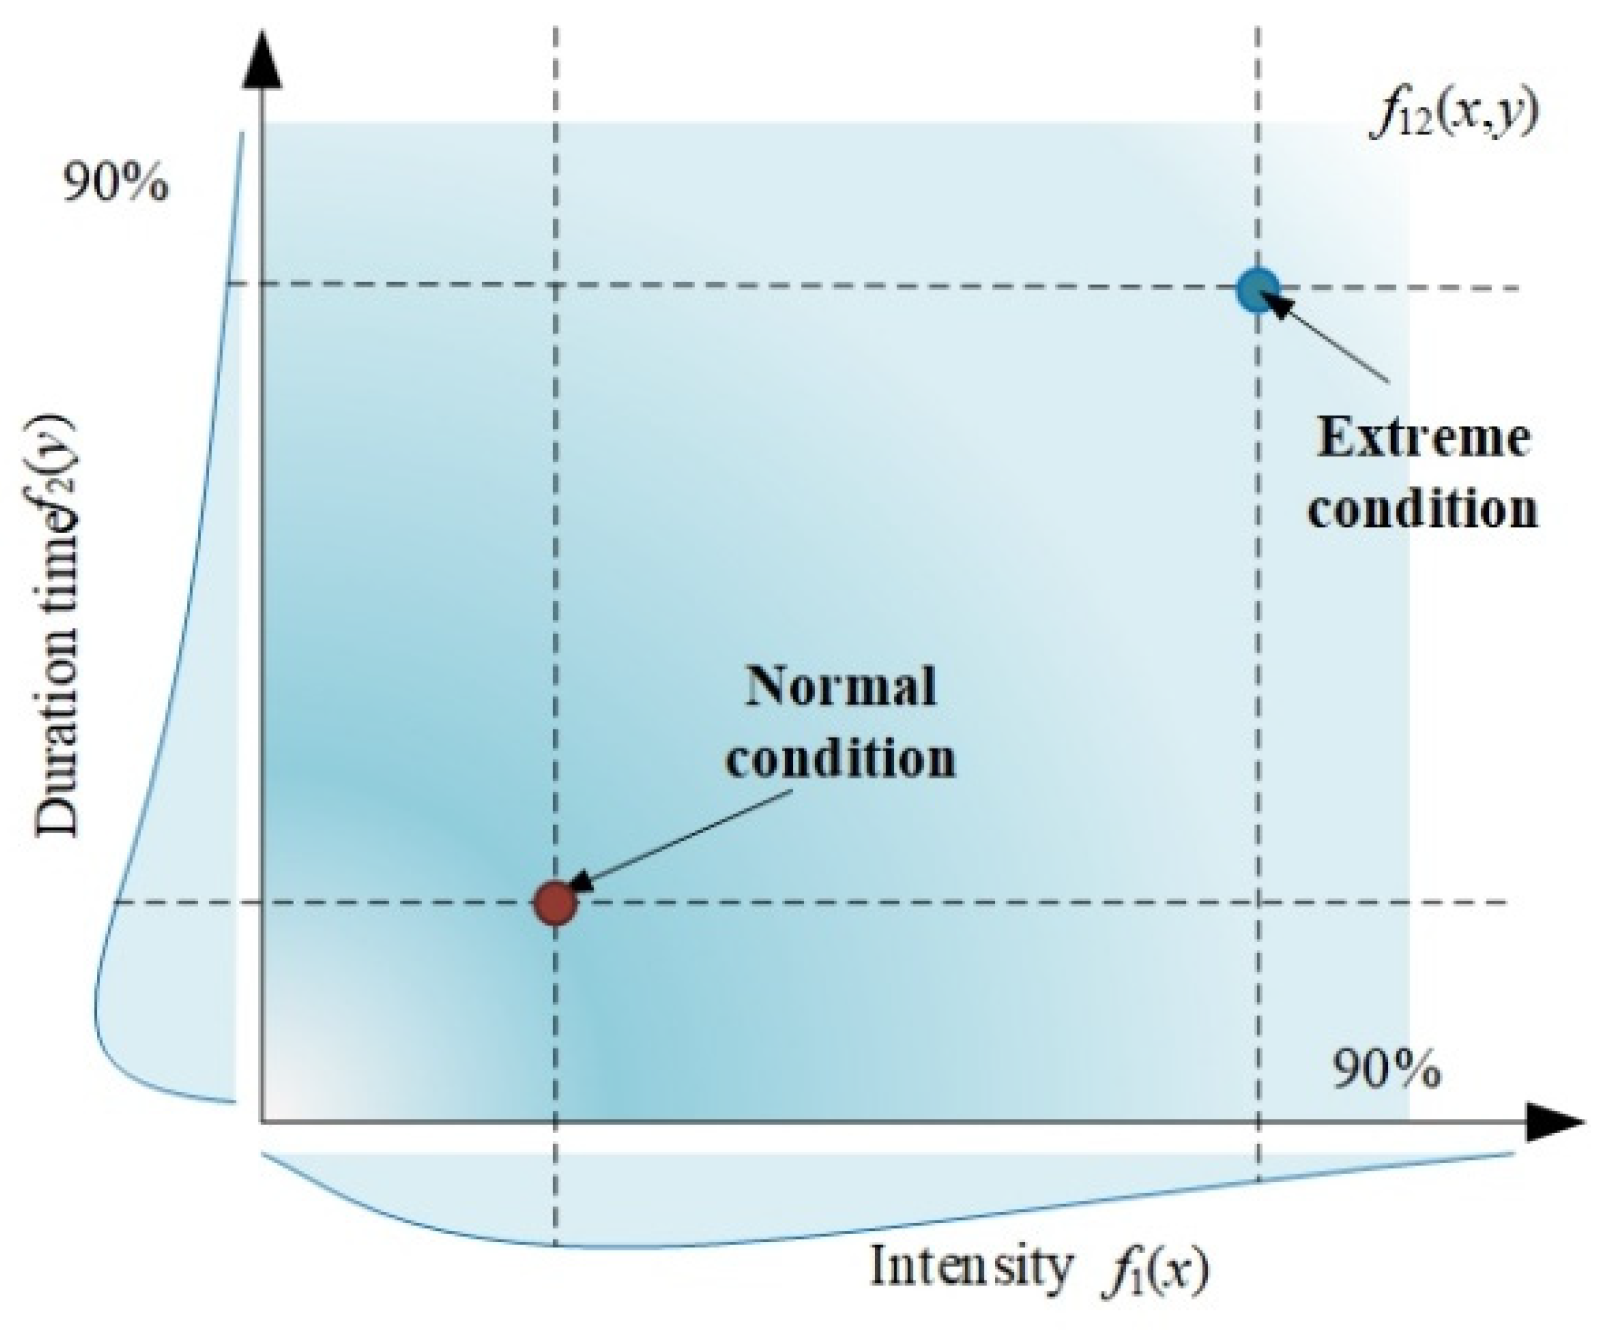
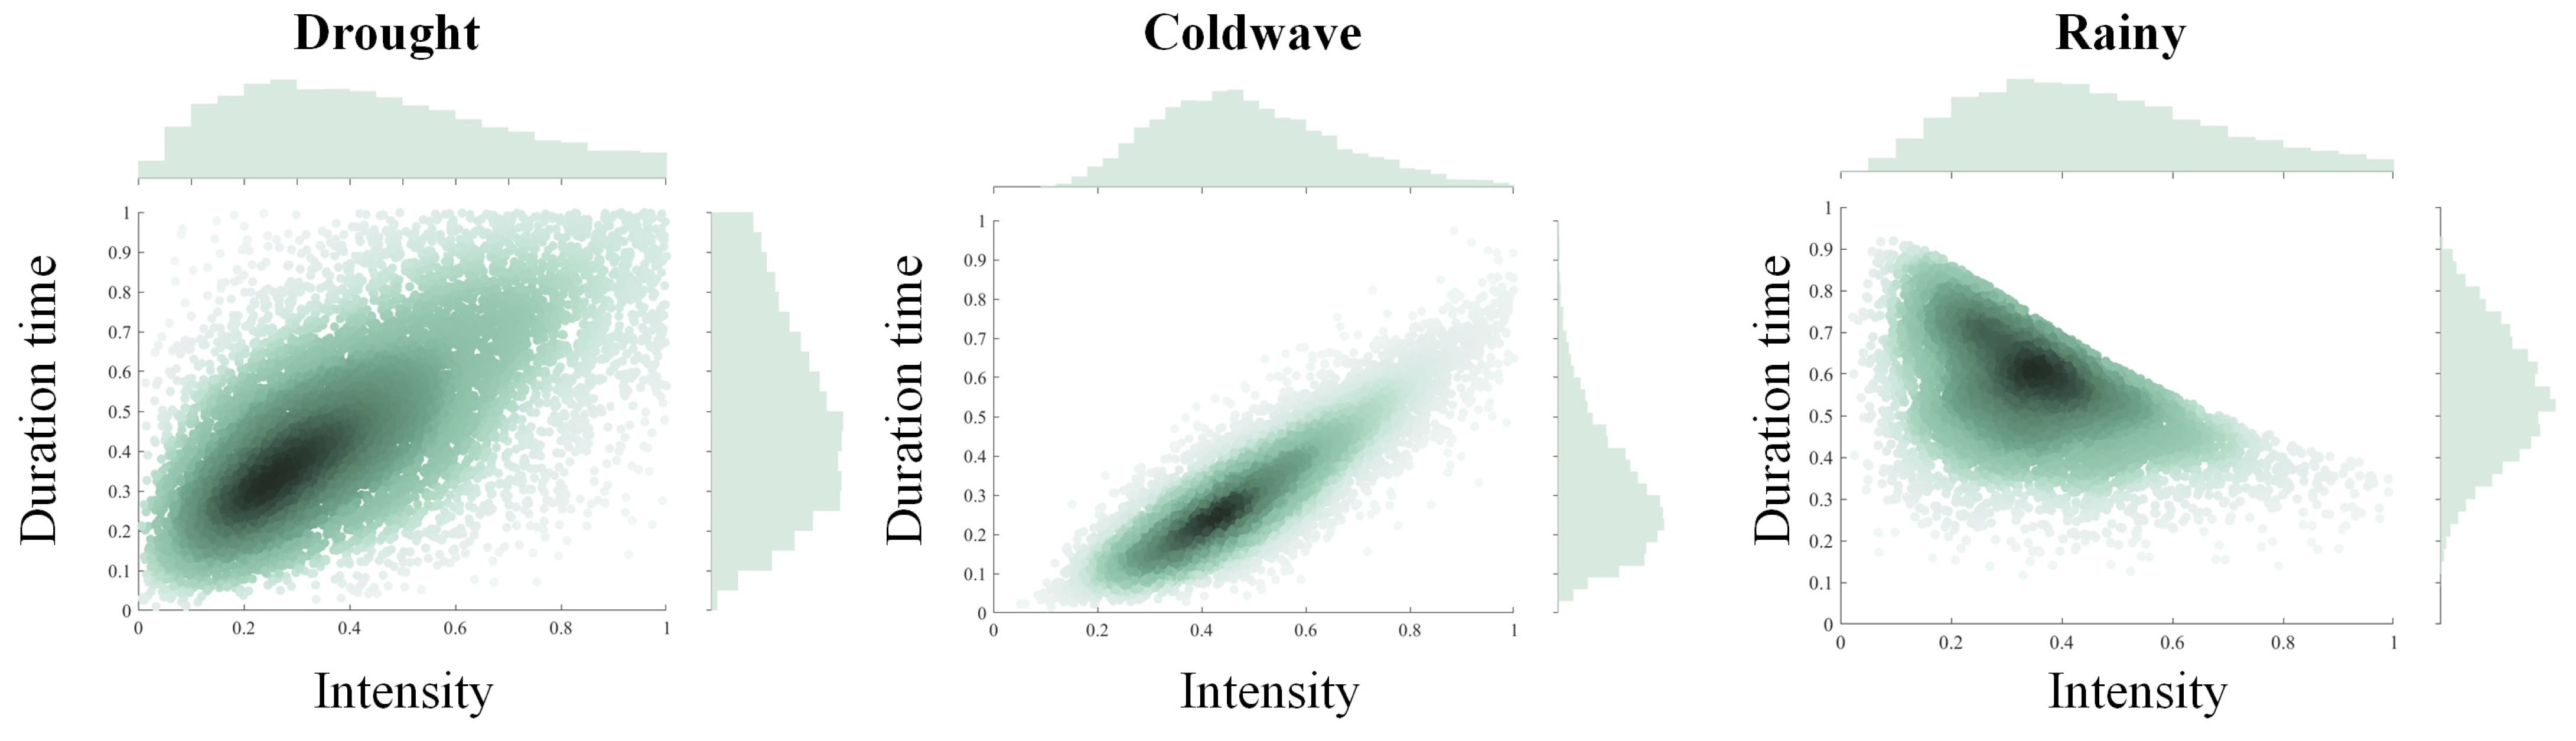
3.1. Probabilistic Model of Extreme Weather Events Based on Copula Function

To define the impact of disasters, two indicators, namely, the duration of the disaster and its intensity, are used for our probabilistic description. This approach helps to determine the probability of disasters occurring in different regions, laying the foundation for further quantitative analyses of disaster impacts. By identifying the probability density functions of disaster duration and intensity, as well as their correlation, a joint probability density function for a particular type of disaster can be obtained, as illustrated in Figure 2.
The duration and intensity of disasters typically exhibit a left-skewed distribution. Therefore, fitting and simulation are often conducted using the gamma distribution, which is a continuous probability function in statistics. The gamma distribution is a significant distribution in probability statistics, with both the exponential distribution and the chi-squared distribution being special cases of the gamma distribution. Its probability density function (PDF) is as follows:
f x = 1 Γ α β α x α 1 e x β x > 0 0 x 0
And, the cumulative density function (CDF) is as follows:
f x = 1 Γ α γ α , β x x > 0 0 x 0
Therefore, through the rational selection of parameters, the characteristics of the distribution of the duration and intensity of a specific disaster in a particular region can be determined, providing a foundation for the probabilistic representation of intensity.
Regarding the duration and intensity of a specific extreme weather event, there is often a certain degree of correlation between the two. For instance, event duration generally exhibits a negative correlation with intensity for rainfall events. On the other hand, high temperature exhibits a positive correlation with rainfall duration, where higher temperatures are generally associated with longer rainfall duration. Consequently, it is necessary to characterize both event intensity and duration using a joint probability density distribution function. Here, the method based on the Copula function was adopted for processing [37], which was firstly introduced by Abe Sklar in 1959 [38], and the details are provided in what follows.
Taking the binary function as an example, if H(x, y) is a binary joint distribution function with continuous marginal distributions F(x) and G(y), then there exists a unique Copula function C, which satisfies
H x , y = C F x , G y
The most commonly used Copula functions include the Archimedean Copula family (Frank Copula, Clayton Copula, and Gumbel Copula) and the elliptical Copula family (t Copula and Gaussian Copula). These Copula functions are widely applied and can be used to address different problems based on their unique characteristics. For instance, the Clayton Copula is capable of characterizing the upper tail behavior of data, the Gumbel Copula is suitable for describing lower tail behavior, and the Frank Copula is capable of capturing the symmetric properties of data.
Considering the internal relationship between duration and intensity for different disasters, the Gumbel Copula, t Copula, and Clayton Copula were selected to describe different weather events, and their CDFs are expressed as
Gumbel-Copula :   C θ u 1 , u 2 = exp log u 1 θ + log u 2 θ 1 / θ t - Copula :   C v , ρ u 1 , u 2 , u d = t v , ρ t v u 1 , t v u 2 , , t v u d Clayton-Copula :   C θ u 1 , u 2 = u 1 θ + u 2 θ 1 1 / θ
where θ is the bivariate Archimedean Copula parameter, where the permitted value range varies for different Copulas; ρ is the correlation coefficient; and ν is the degree of freedom. For the Archimedean Copula, a larger θ indicates a stronger dependency. And, the t Copula parameter ν controls the tail behavior and the level of dependence in the joint distribution, enabling the flexible modeling of a wide range of dependencies between random variables. For the probabilistic model of typical weather events, the corresponding Copula functions are listed in Table 2.

3.2. High-Risk Scenario Generation for Power Supply Based on Monte Carlo Simulation

Based on the above analysis, by combining the different types of weather events in various regions and selecting the appropriate Copula function type and related parameters, we obtained the corresponding distribution functions for event intensity and duration. By incorporating the Copula parameters, we derived the corresponding joint probability distribution through Monte Carlo simulation, which includes the following steps: Firstly, choose the Copula function to simulate specific extreme weather events, and set the relevant parameters for the Copula function. Secondly, generate N pairs of independent uniformly distributed random numbers using Monte Carlo simulation. Thirdly, use the inverse cumulative distribution function (CDF) of the corresponding Copula to generate random numbers from a standard normal distribution. Fourthly, generate correlated standard normal distributed random numbers using the correlation coefficient. Fifthly, obtain the square root of the correlation coefficient matrix using Cholesky decomposition. Finally, transform the standard normally distributed random numbers to gamma-distributed random numbers. The main steps are shown as Figure 3.
It is notable that the last step is not directly related to the previous steps involving Copulas and Cholesky decomposition. The transformation from a standard normal distribution to a gamma distribution would typically involve other methods, such as the Box–Muller transform, followed by appropriate scaling and shaping to match the desired gamma distribution parameters.

4. Probabilistic Production Simulation Method

4.1. The Randomness of Power Sources and Load Regulation under Extreme Weather Events

As mentioned above, the flexible resources from the power source side, load side, and power storage side are applied to stabilize unbalanced power. To measure the influences of different extreme events, the power output matrix M is used to describe the guaranteed power output ability considering the randomness power sources under different extreme weather scenarios:
M = m i j
where mij is the ith random power source coefficient under the jth extreme event, and mij is corelated to the duration and the time-point of the event.
The power output of random power source P x i j can be expressed as
P x i j = m i j P i j
where P i j is the original power output of random power sources.
For wind power, the power output PW is related to wind velocity v W as
P W = 0 0 v W v 0 v W v c o P n v W 3 v 0 3 v n 3 v 0 3 v 0 < v W < v n P n v n v W < v c o
where v 0 ,  v n , and v c o are the cut-in wind velocity, nominal wind velocity, and cut-off wind velocity, respectively. For wind power, low power output may be caused by windless weather as well as storm weather, which result in the large-scale cut-off of wind power. Meanwhile, wind power may also trip due to frost, which is caused by ice buildup on turbine blades or frozen components.
For solar power, the power output PS is related to radiation intensity I S as
P S = I S 2 I C R C P S n η 0 I S R C I S I C P S n η I S > R C
where η is the panel energy transformation efficiency; R C is the specified radiation intensity, usually set as 150 W/m2; I C is the radiation intensity under normal status, set to 1000 W/m2. Therefore, cloudy, heavy rain, stormy, dusty, and snowfall weather may decrease the reliability of solar power.
For run-of-river hydropower, the power output PHR is related to the flow rate of water Q , which is expressed as
P H R = η ( Q ) ρ Q g H
where η is the overall efficiency of the hydroelectric system, which is corelated to the flow rate of water; ρ is the density of water; g is the acceleration due to gravity; H is the net head, which is the difference in elevation between the water source (intake) and the turbine outlet (in meters). It is noteworthy that hydropower production is also related to the interbasin scheduling of cascaded hydropower plants [39] and ecological flow [40], which may have negative effects on hydropower and needs further investigation.
By setting the relevant parameter mij, the power output of random power sources can be adjusted to simulate the influence of extreme weather.
The load curve is generated using the typical daily power load curves and monthly power consumption data. For different regions, the monthly electricity consumption characteristic may vary, with the yearly electricity consumption curves for typical China provinces shown in Figure 4. Thus, the load coefficient should be designed considering when the extreme events happen and the related factors. For instance, it can be seen from Figure 4 that the seasonal difference between summer and winter is more significant for southern than northern provinces in China, which reveals that high temperatures cause larger load increases.

4.2. The Production Simulation of Flexible Resources

As mentioned above, the flexible resources from the power source side, load side, and power storage are applied to stabilize the unbalanced power caused by the randomness of the power source and load. The flexible resources of the power source side include coal-fired power plants (CPPs), natural-gas-fired power plants (NGPs), impoundment hydropower plants (HPPs), and nuclear power plant (NPPs). Randomness power sources are more vulnerable to weather changes, such as run-of-river HPPs, wind power plant (WPPs), and solar power plants (SPPs). And, the flexible resources of the storage side as well as the load side include hydropump storage (HPS), electrochemical energy storage (ESS), compressed air energy storage (CAS), hydrogen production by water electrolysis (HWE), and demand response (DR). The status summary of the above flexible resources is provided in Table 3.
Considering the minimum power output requirement for flexible power sources, the regional power system’s net load is balanced using flexible resources according to following rules: Firstly, the net load curve, which reflects the power difference between random power and load, is calculated:
P n e t l o a d ( t ) = P x i j ( t ) P l o a d ( t )
Then, the minimum power output for controllable power sources under operation should be subtracted from the net load. In (11), ki refers to the minimum power coefficient for controllable power source i, and Si is the operational capacity of controllable power source i.
P u n b a l a n c e d ( t ) = P n e t l o a d ( t ) k i S i
If the unbalanced power is lower than the maximum regulated range of the flexible power sources, the unbalanced power is compensated using, in priority order, impoundment HPP, CPP, and NGP. If the unbalanced power exceeds the maximum regulated range of the flexible power sources P m a x ( t ) , energy storage resources are activated to fill the gap, and the discharge power for energy storage resource P E S ( t ) can be expressed as
P E S t = P u n b a l a n c e d ( t ) P m a x ( t ) 0 < S O C 1 S E S P u n b a l a n c e d ( t ) P m a x ( t ) S E S 0 < S O C 1 S E S < P u n b a l a n c e d ( t ) P m a x ( t ) 0 S O C = 0
When the discharge power for energy storage resources still cannot fill the gap, load-side resources are activated to achieve the final balance. Similarly, when the power output of a random power source and the minimum power output for controllable power sources is larger than the sum of the load and energy storage resources, renewable power is curtailed to maintain system balance, as shown in Equation (13):
P c u r t a i l ( t ) = P u n b a l a n c e d ( t ) S E S
Meanwhile, when flexible power source cannot meet the load requirement under extreme event periods, energy storage resources can be used for energy shifting by cooperating with flexible power sources. In this scenario, the flexible power sources can maintain maximum power output to overcome the daily unbalanced power caused by PV.

4.3. Cross-Regional Power Transmission

Most of mainland China’s regional power systems are interconnected by ultra-high-voltage DC (UHVDC) projects, which can realize asynchronous large-scale power grid interconnection and large-capacity, long-distance power transmission. For example, China’s west–east electricity transfer project, as shown in Figure 5, applies UHVDC lines to transmit northwestern China’s renewable power and southwestern China’s hydropower to the south and to eastern coastal areas, which are load centers. During normal operation, the transmitted UHVDC power follows the power supply curve, which considers the daily operation characteristics of both the sending-end and receiving-end power systems. Meanwhile, there are several lines providing regional interconnection with flexible operation ability enabling mutual aid among regions.
Therefore, the cross-regional lines were divided into two categories: fixed interconnection lines, which follow the power supply curve strictly, and flexible interconnection lines, which provide mutual aid among interconnected regions.

5. Power Security Evaluation Based on Probabilistic Method

5.1. The Power Security Index System

In this paper, two indices are used to represent the power supply risk level for regional power systems: the loss of load expectation (LOLE), and the time of loss of load expectation (TOLE). The first index reflects the local power supply and cross-regional support abilities, and second index represents the power supply’s reliability under certain scenarios.
To depict the regional power system’s transition pathway’s performance in terms of power security, the inter-regional power source abundance index Kinner is proposed, which is the ratio between the expected power capacity Sexp and the maximum load power PL under scenario j, which can be expressed as
K i n n e r = S e x p / P L = M ( : , j ) T S / P L m a x α j
where S is the installed power source capacity vector, PLmax is the maximum load, and αj is the load coefficient under extreme scenario j. Despite the indices reflecting the regional power system’s self-power supply ability, the cross-regional power support ability is evaluated using the cross-regional emergency power supply abundance index Kextra, which can be expressed as
K e x t r a = S e x t r a / P L m a x α j
where Sextra is the extraregional emergency power supply capacity.
The loss of load expectation (LOLE) can quantify the expected number of hours a specific scenario will last, in which load shedding or loss of load may occur in a power system, which is typically expressed as
L O L E = E u n / E L × T s c e n a r i o  
where EUN is the sum of expected unserved energy, EL is the total load energy, and T s c e n a r i o is the duration of the extreme scenario. EUN is expressed as
E u n = i P c o n i · E c o n i
where Pconi is the probability of the contingency occurring, Econi is the energy not supplied during the unsupplied state for that contingency, and i refers to all contingencies.
Another important index is the TOLE, which indicates the average length of time the power system fails to meet the demand for electricity within a given period. TOLE can be expressed as
T O L E = 1 T c o n i
where Tconi is the duration the power system fails to meet the demand for electricity. Both LOLE and TOLE represent the reliability of a power system, where the lower LOLE or the lower the TOLE value, the more reliable the power system.

5.2. The Probabilistic-Based Risk Evaluation Method

Based on the proposed indices and power generation simulation results, the LOLE and TOLE can be calculated. And, the probability density functions of the LOLE and TOLE are estimated using the kernel density estimation (KDE) method, which revolves around the concept of placing a kernel, typically a Gaussian function, at each data point and summing these kernels to obtain a smooth estimate of the density. The Gaussian kernel function K(u) is commonly used:
K ( u ) = 1 2 π e u 2 2
Then, bandwidth h is selected, which determines the width of the kernel. Common methods for bandwidth selection include Scott’s rule or Silverman’s rule. Considering the computational expense, Scott’s rule was applied in this study, and the bandwidth h is expressed as
h = 4 3 n 1 5 σ
where σ is the standard deviation of the data.
Then, place a kernel centered at each data point in the dataset. The kernel function defines the shape of the kernel, and the bandwidth determines its width. The estimated density function f(x) can be expressed as
f ( x ) = 1 n h i = 1 n K ( x x i h )
where n is the dimension of the dataset. Finally, the density estimate f(x) can be evaluated at any point within the domain to obtain an estimate of the probability density at a specific point.

6. Case Study

As shown in Figure 5, Yunnan is a sending end for southern China’s power system, which transmits electricity to Guangdong and Guangxi through UHVDC projects. As a hydropower-dominated sending-end power system, the power balance in Yunnan is related to the runoff of rivers. To compare the performance of different long-term low-carbon transformation pathways for Yunnan’s power system, three schemes are shown in Table 4, and the maximum load and annual electricity consumption prediction data are provided in Figure 6. As Yunnan lacks coal and natural gas resources, the CPP and NGP capacity ratios of Yunnan’s power system are significantly lower than those of southern China’s power system. Meanwhile, the proportion of run-of-river hydropower in the total hydropower in Yunnan is estimated to be 60%, and the remaining 40% is provided by impoundment HPPs, which can provide operation flexibility.
The cross-regional power capacity with scheme 3 involves building new power transmission channels from other power-abundant areas to strengthen the mutual power supply ability, such as in northwest China. The details are provided in [41].

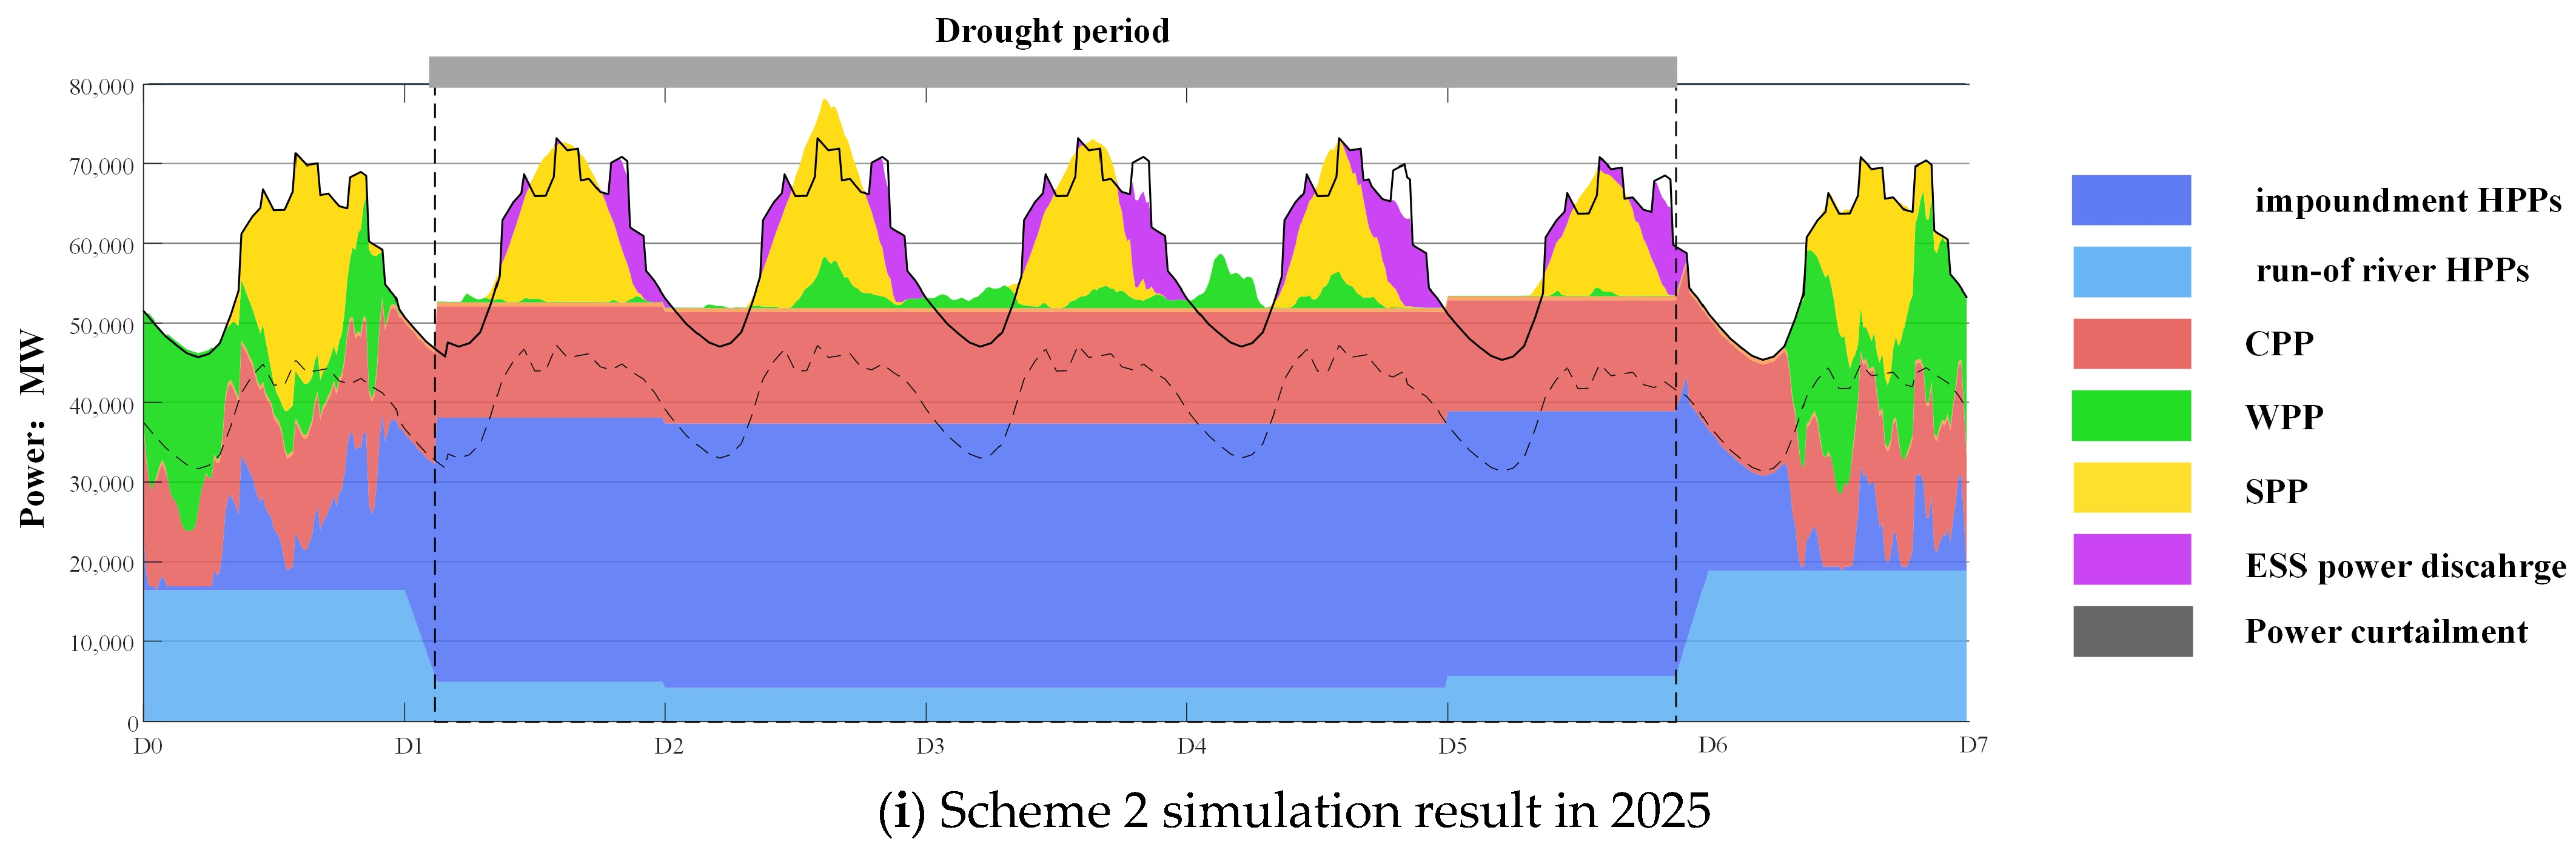
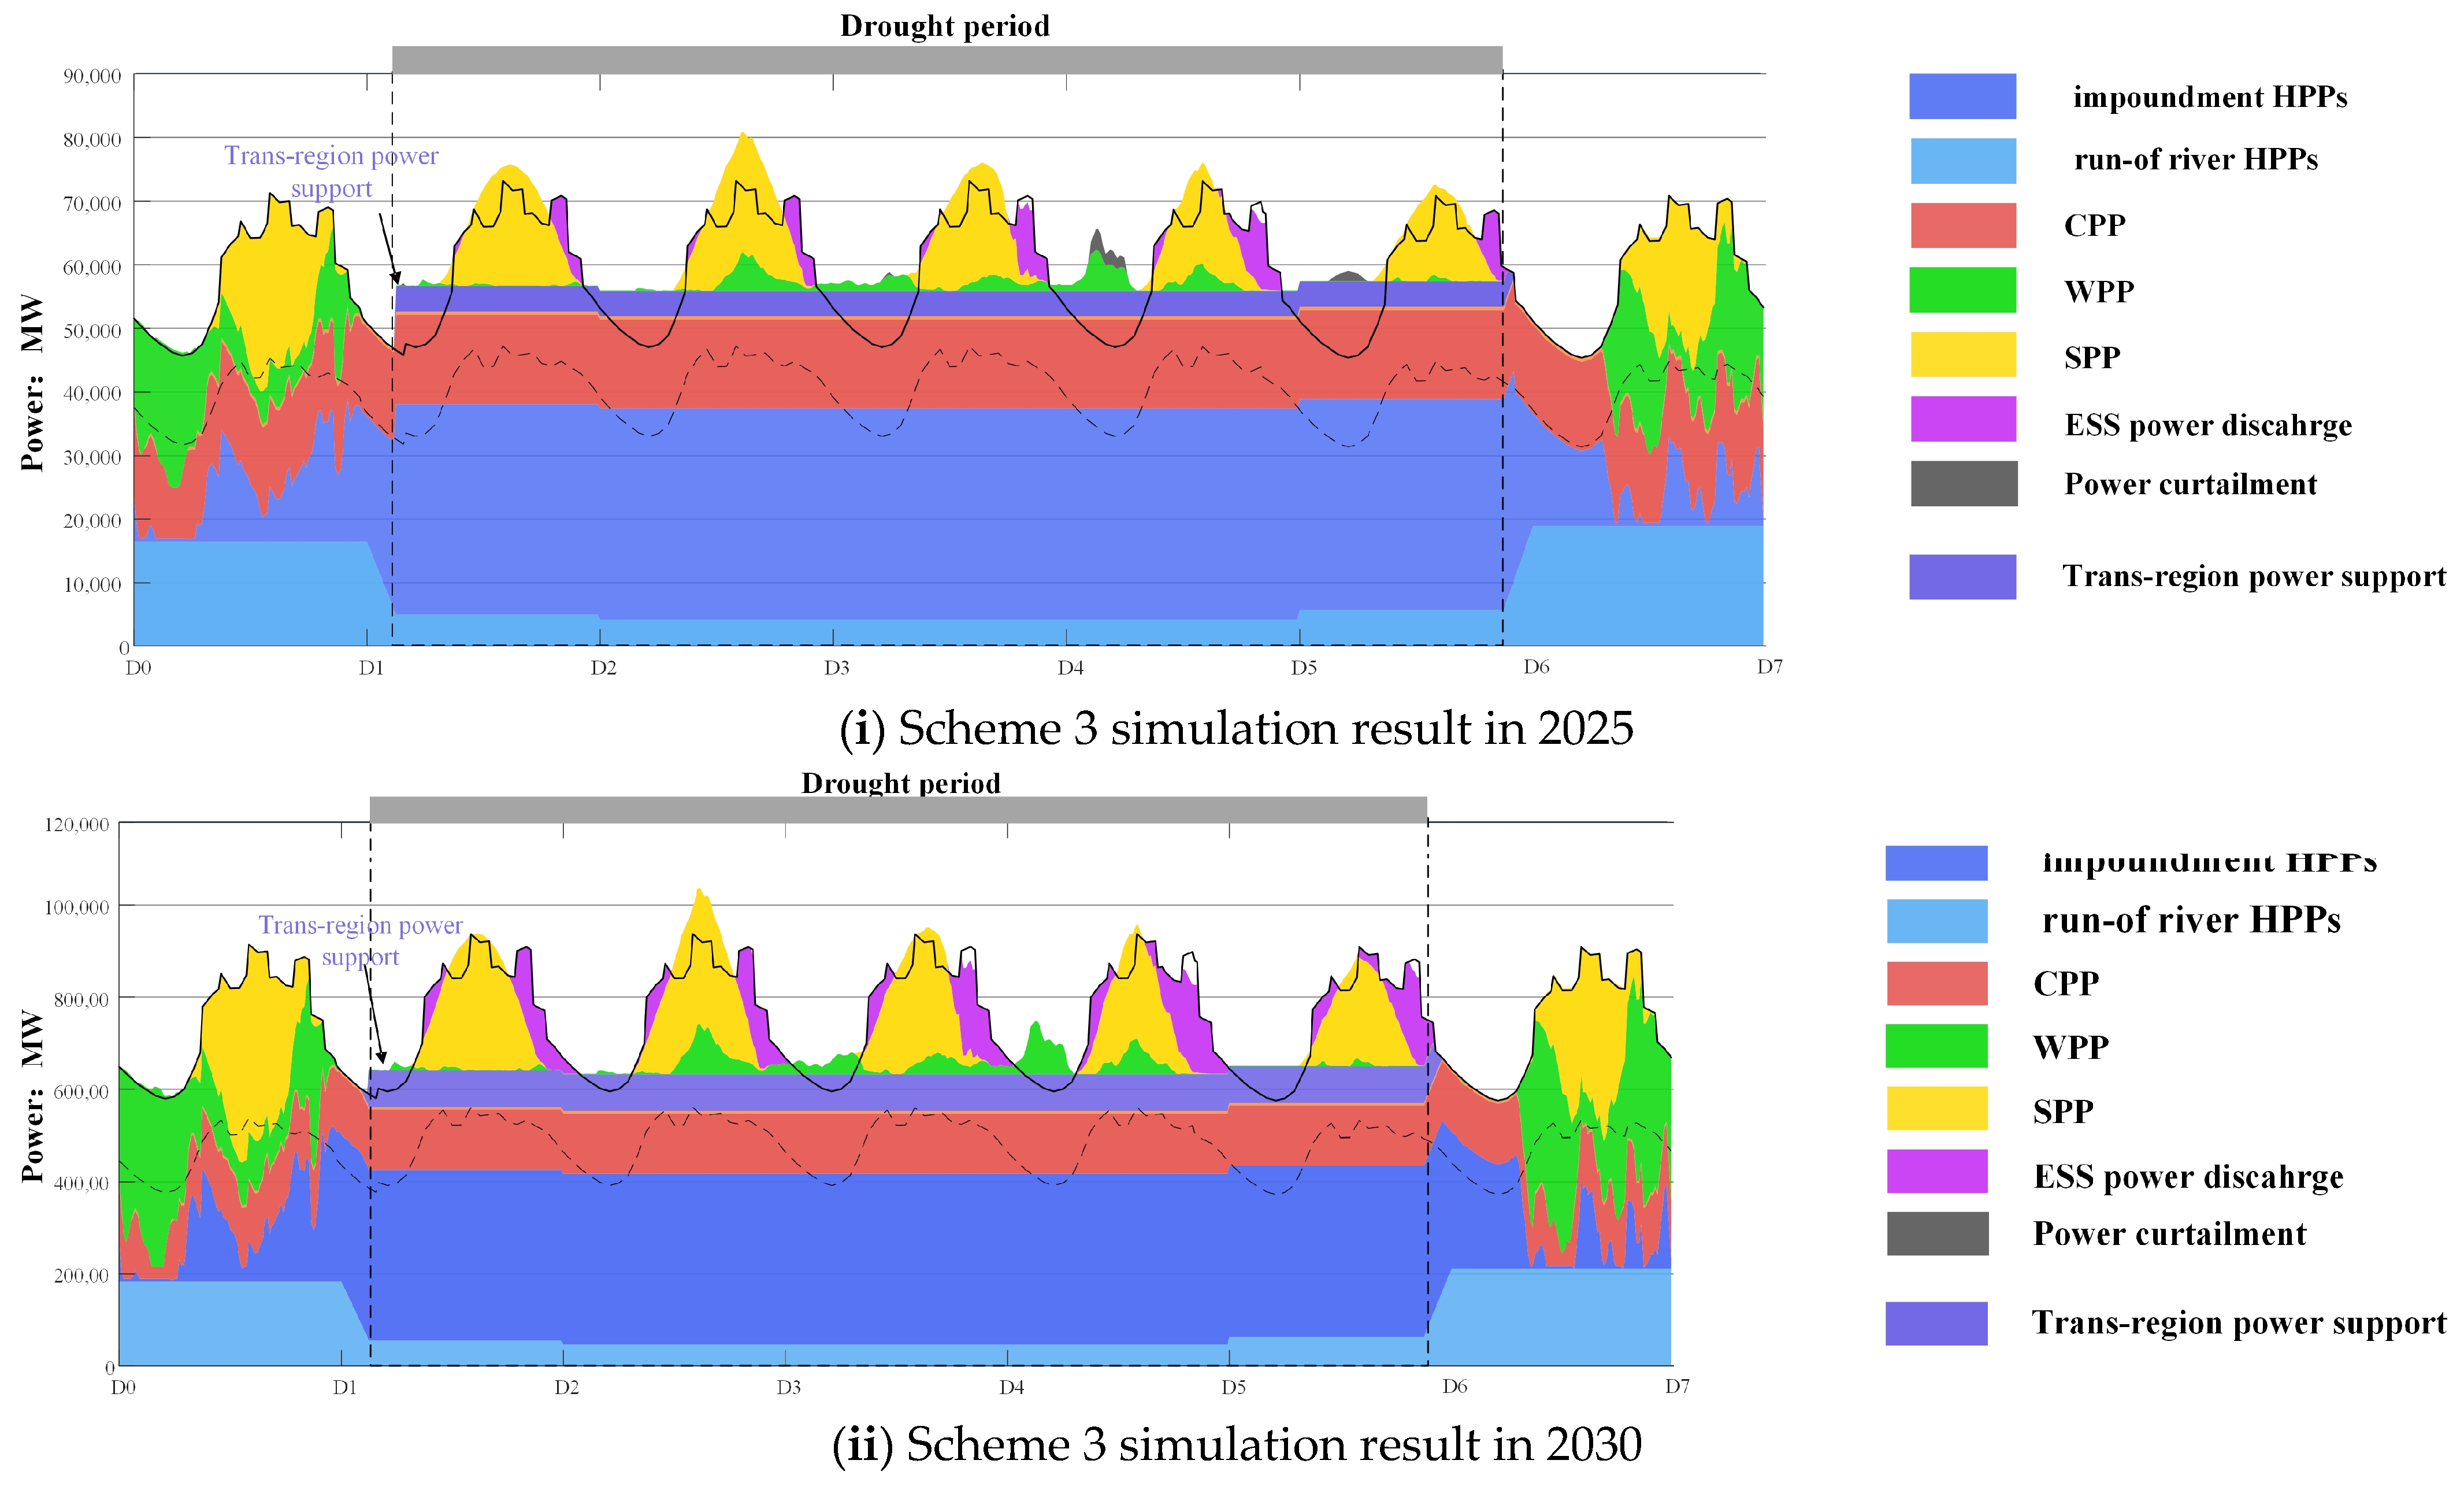
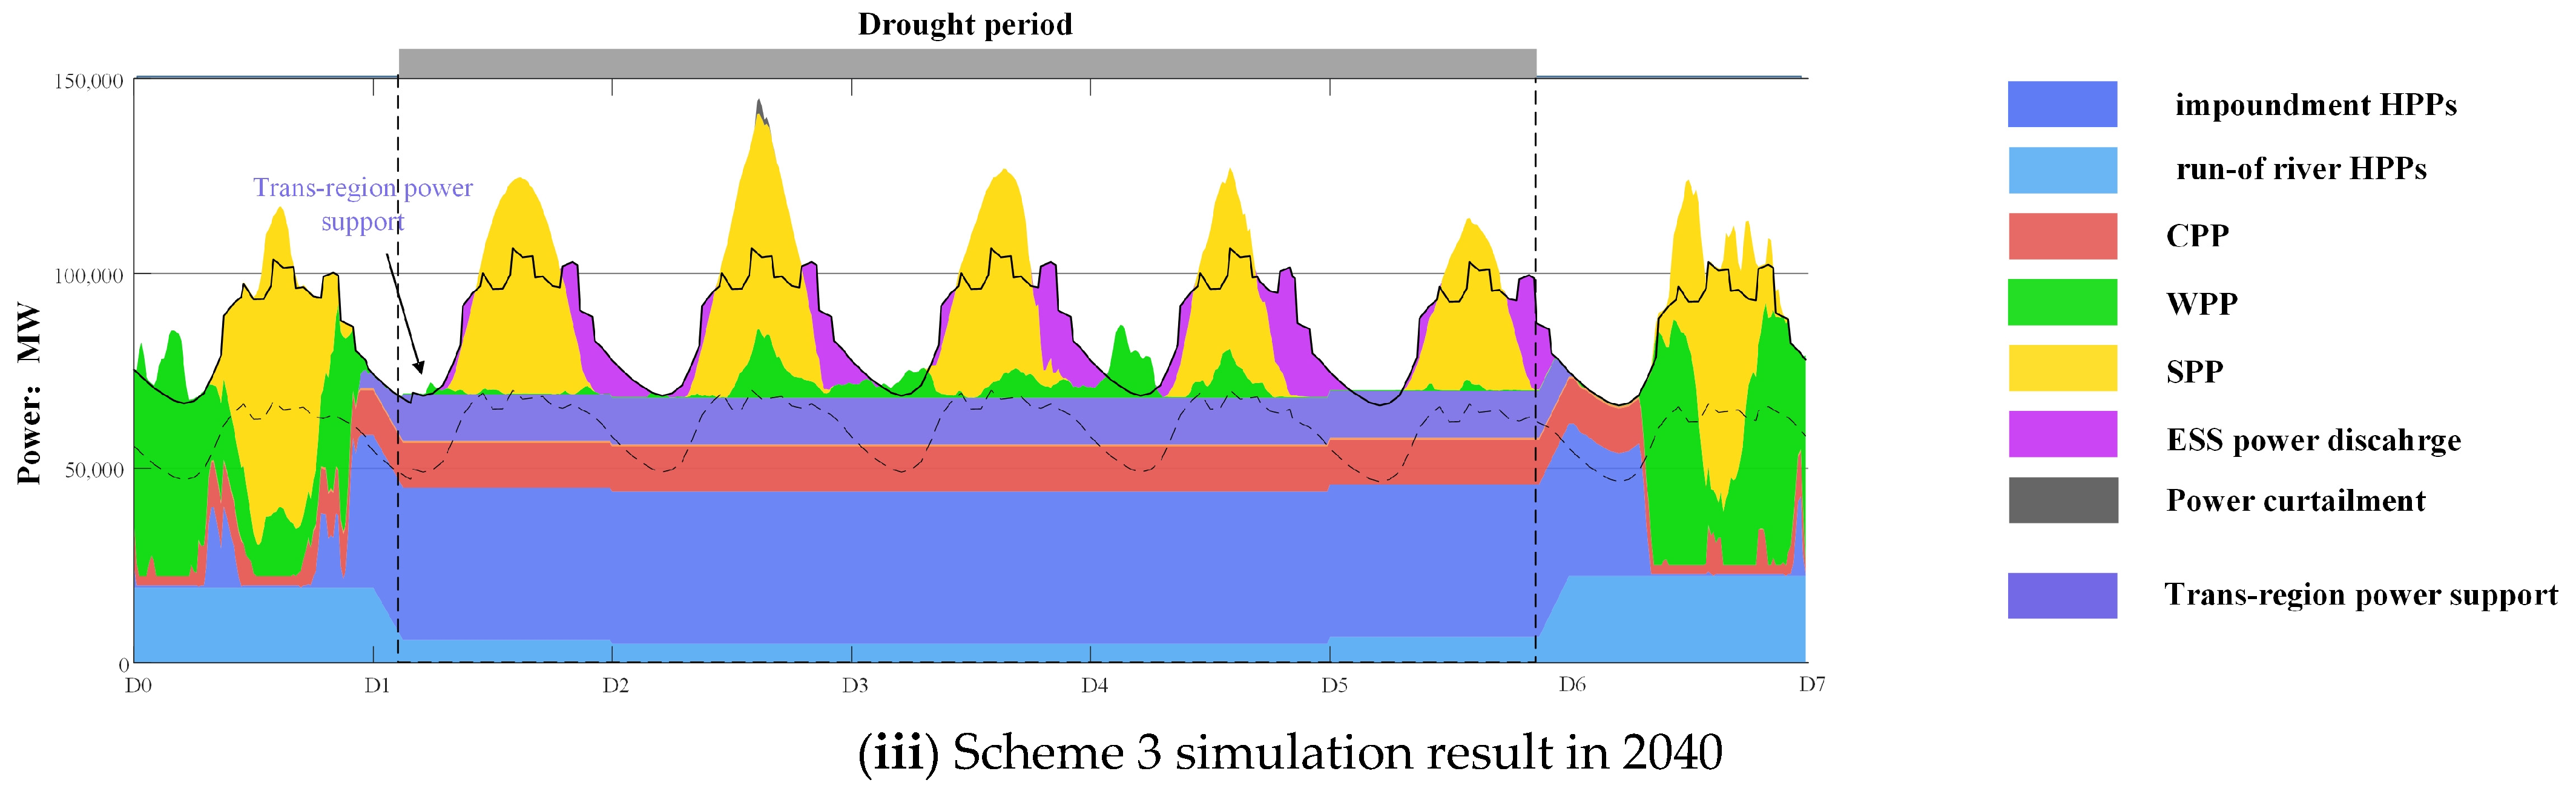
6.1. The Production Simulation Results under Extreme Events

To show the system operation status under similar extreme weather events for different power transformation pathways, the simulation results of energy production under extreme events are provided from Figure 7, Figure 8 and Figure 9. During a 5-day drought, the run-of-river HPP power output drops to 20% of the original level before the end of the event, which requires impoundment HPPs, NGPs, and CPPs to meet the power demand. Meanwhile, energy storage, including HPSs and ESSs, provide power support according to the state of charge. In order to provide energy backup, impoundment HPPs, NGPs, and CPPs output the maximum power during the drought.
The dotted line represents the local power demand on the Yunnan power system, and the solid line is the sum of local power and HVDC sending power. It can be drawn from the simulation results that under the extreme drought scenario, power loss events happen in both scheme 1 and scheme 2. In 2025, loss of load mainly happens in the afternoon when solar power drops. And, compared with 2025, the loss of load is higher in 2030, which is caused by insufficient energy storage and renewable power. In 2040, the daily load peak can be balanced by solar power, but loss of load also happens during the night. After an extreme event ends, load demand can be satisfied using flexible sources in cooperation with renewable energies.
In scheme 3, cross-regional power support more effectively decreases the loss of load electricity compared with the other schemes, especially in 2030 and 2040. Meanwhile, cross-regional power support can also guarantee the supply of energy storage by decreasing the daily electricity peak-to-valley spread. It can be drawn from Figure 11 that power loss event scan be mitigated using renewable, cross-regional power support and energy storage cooperation during droughts.
Therefore, it can be concluded that due to the high penetration of HPP in the Yunnan power system, loss of load events are inevitable under extreme droughts. But, the loss of load can be decreased by implementing reasonable power supply assurance measures.

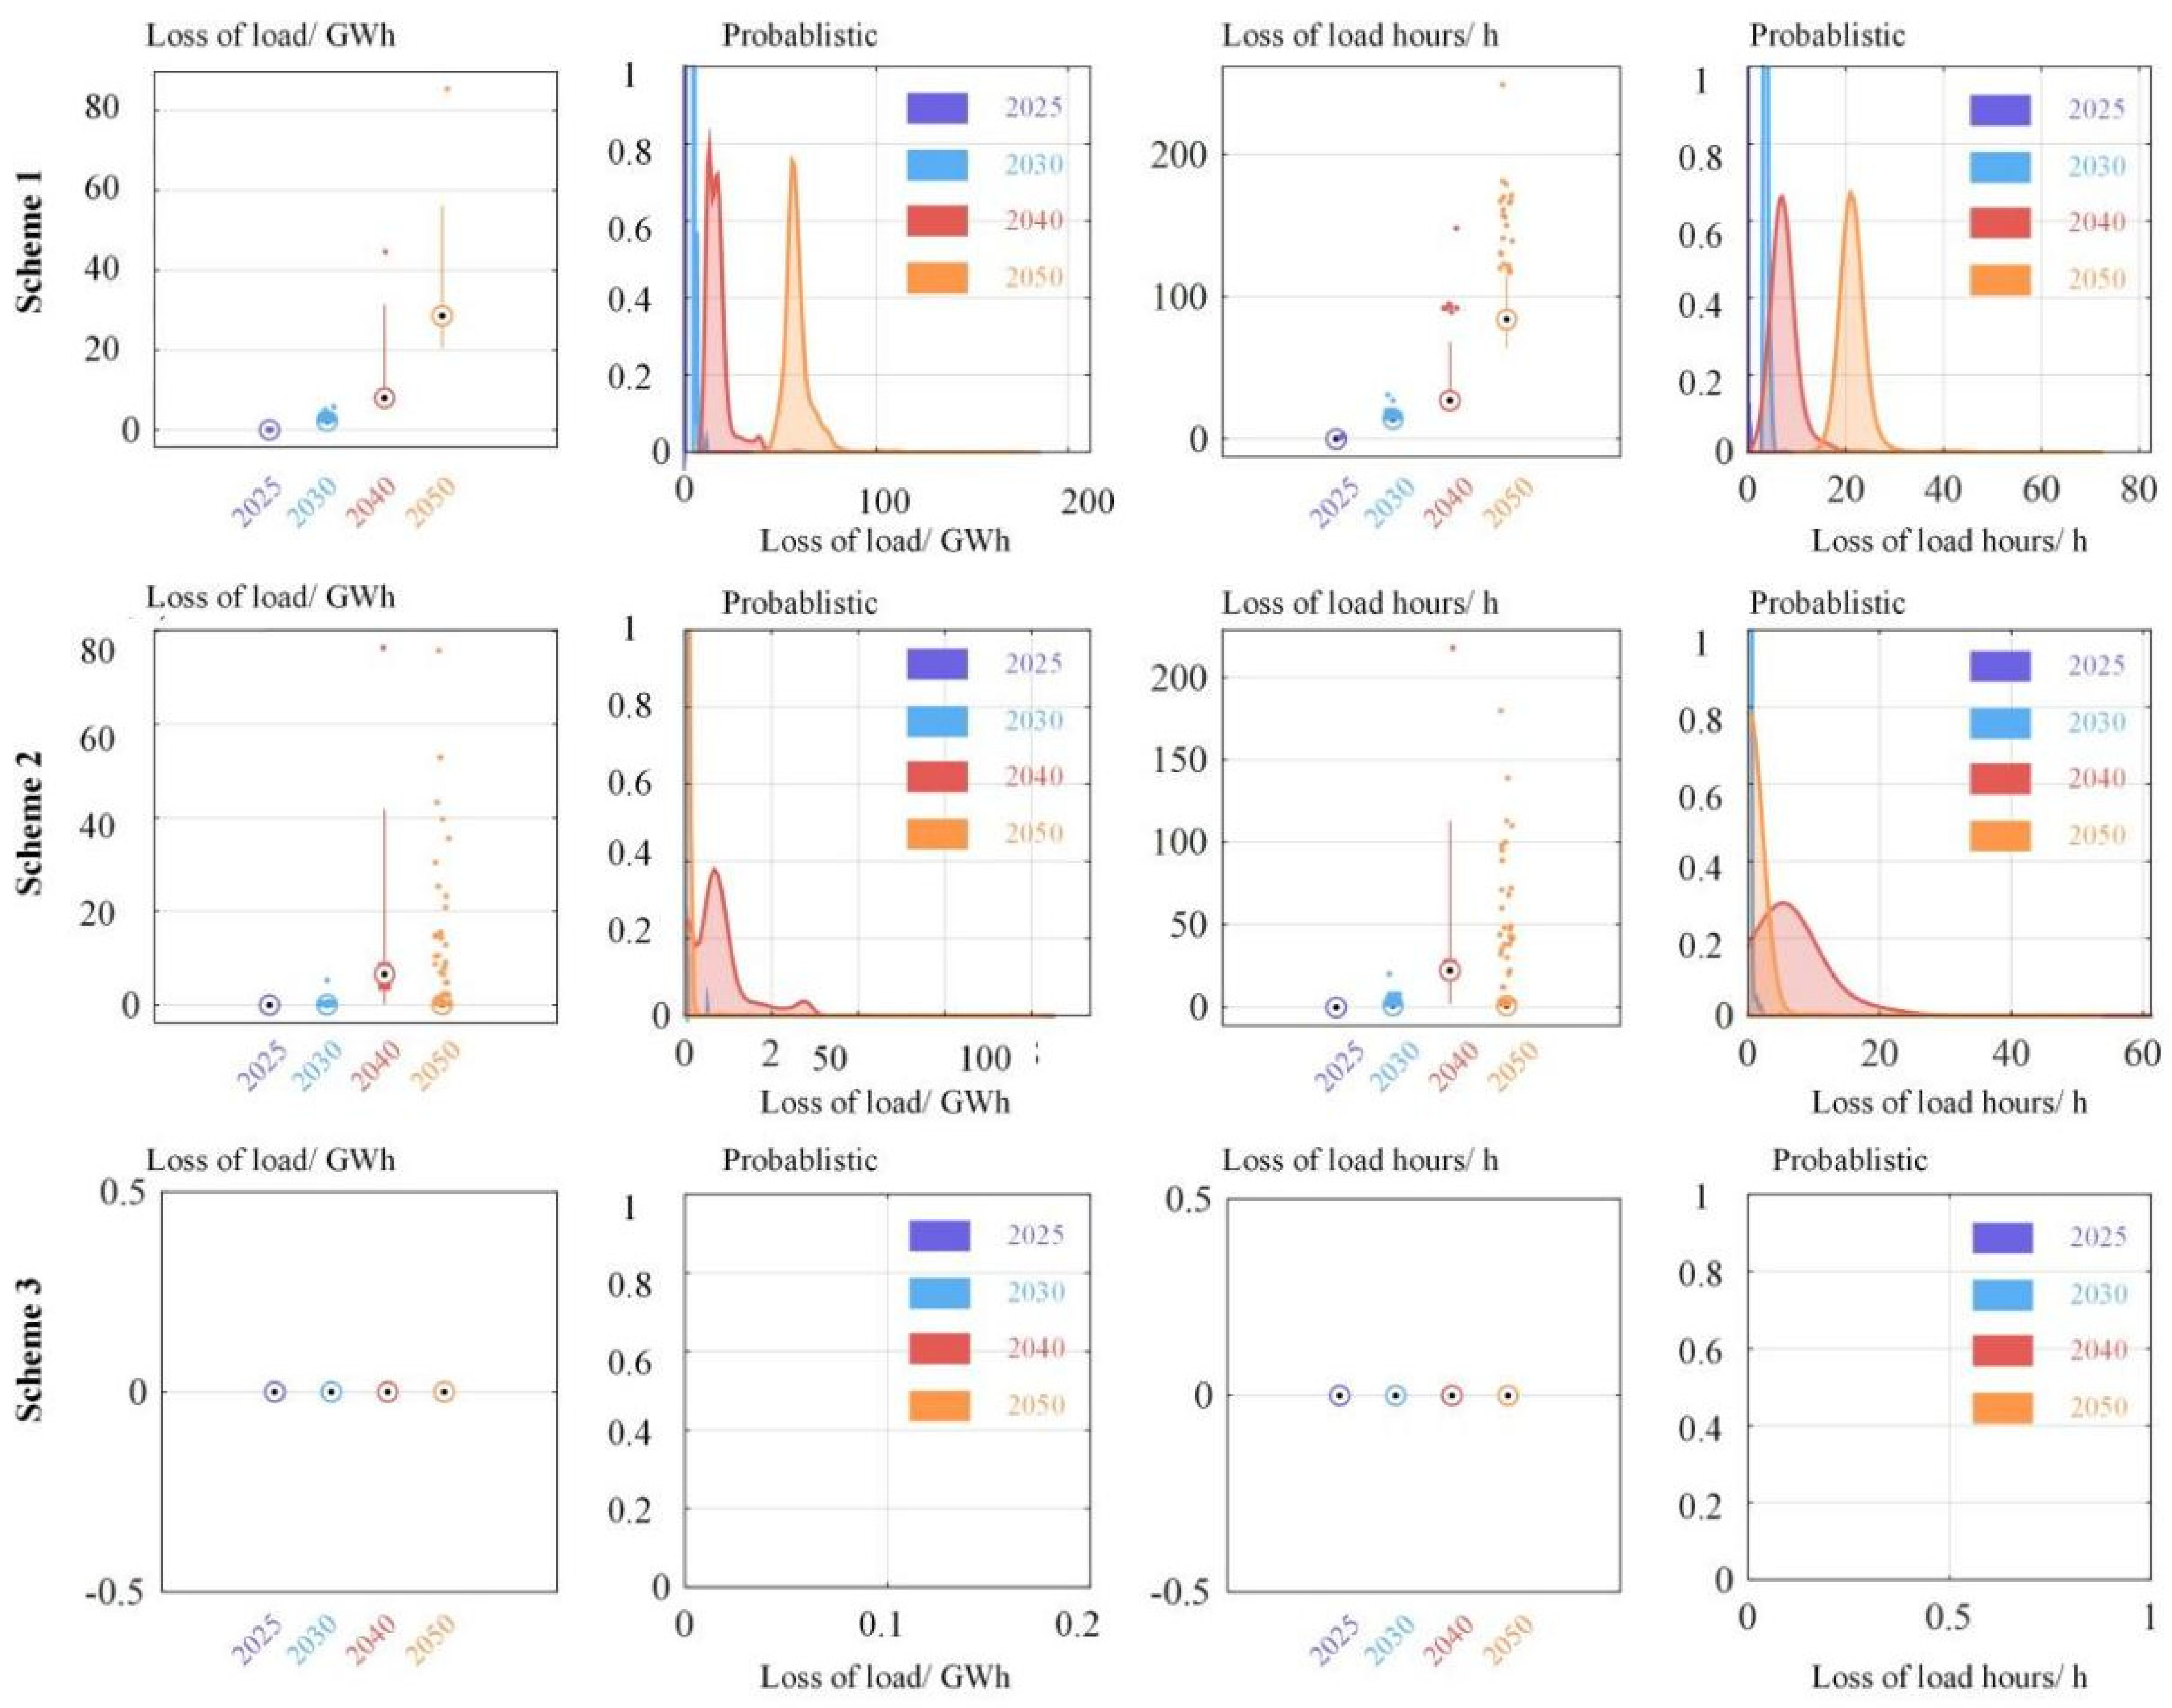
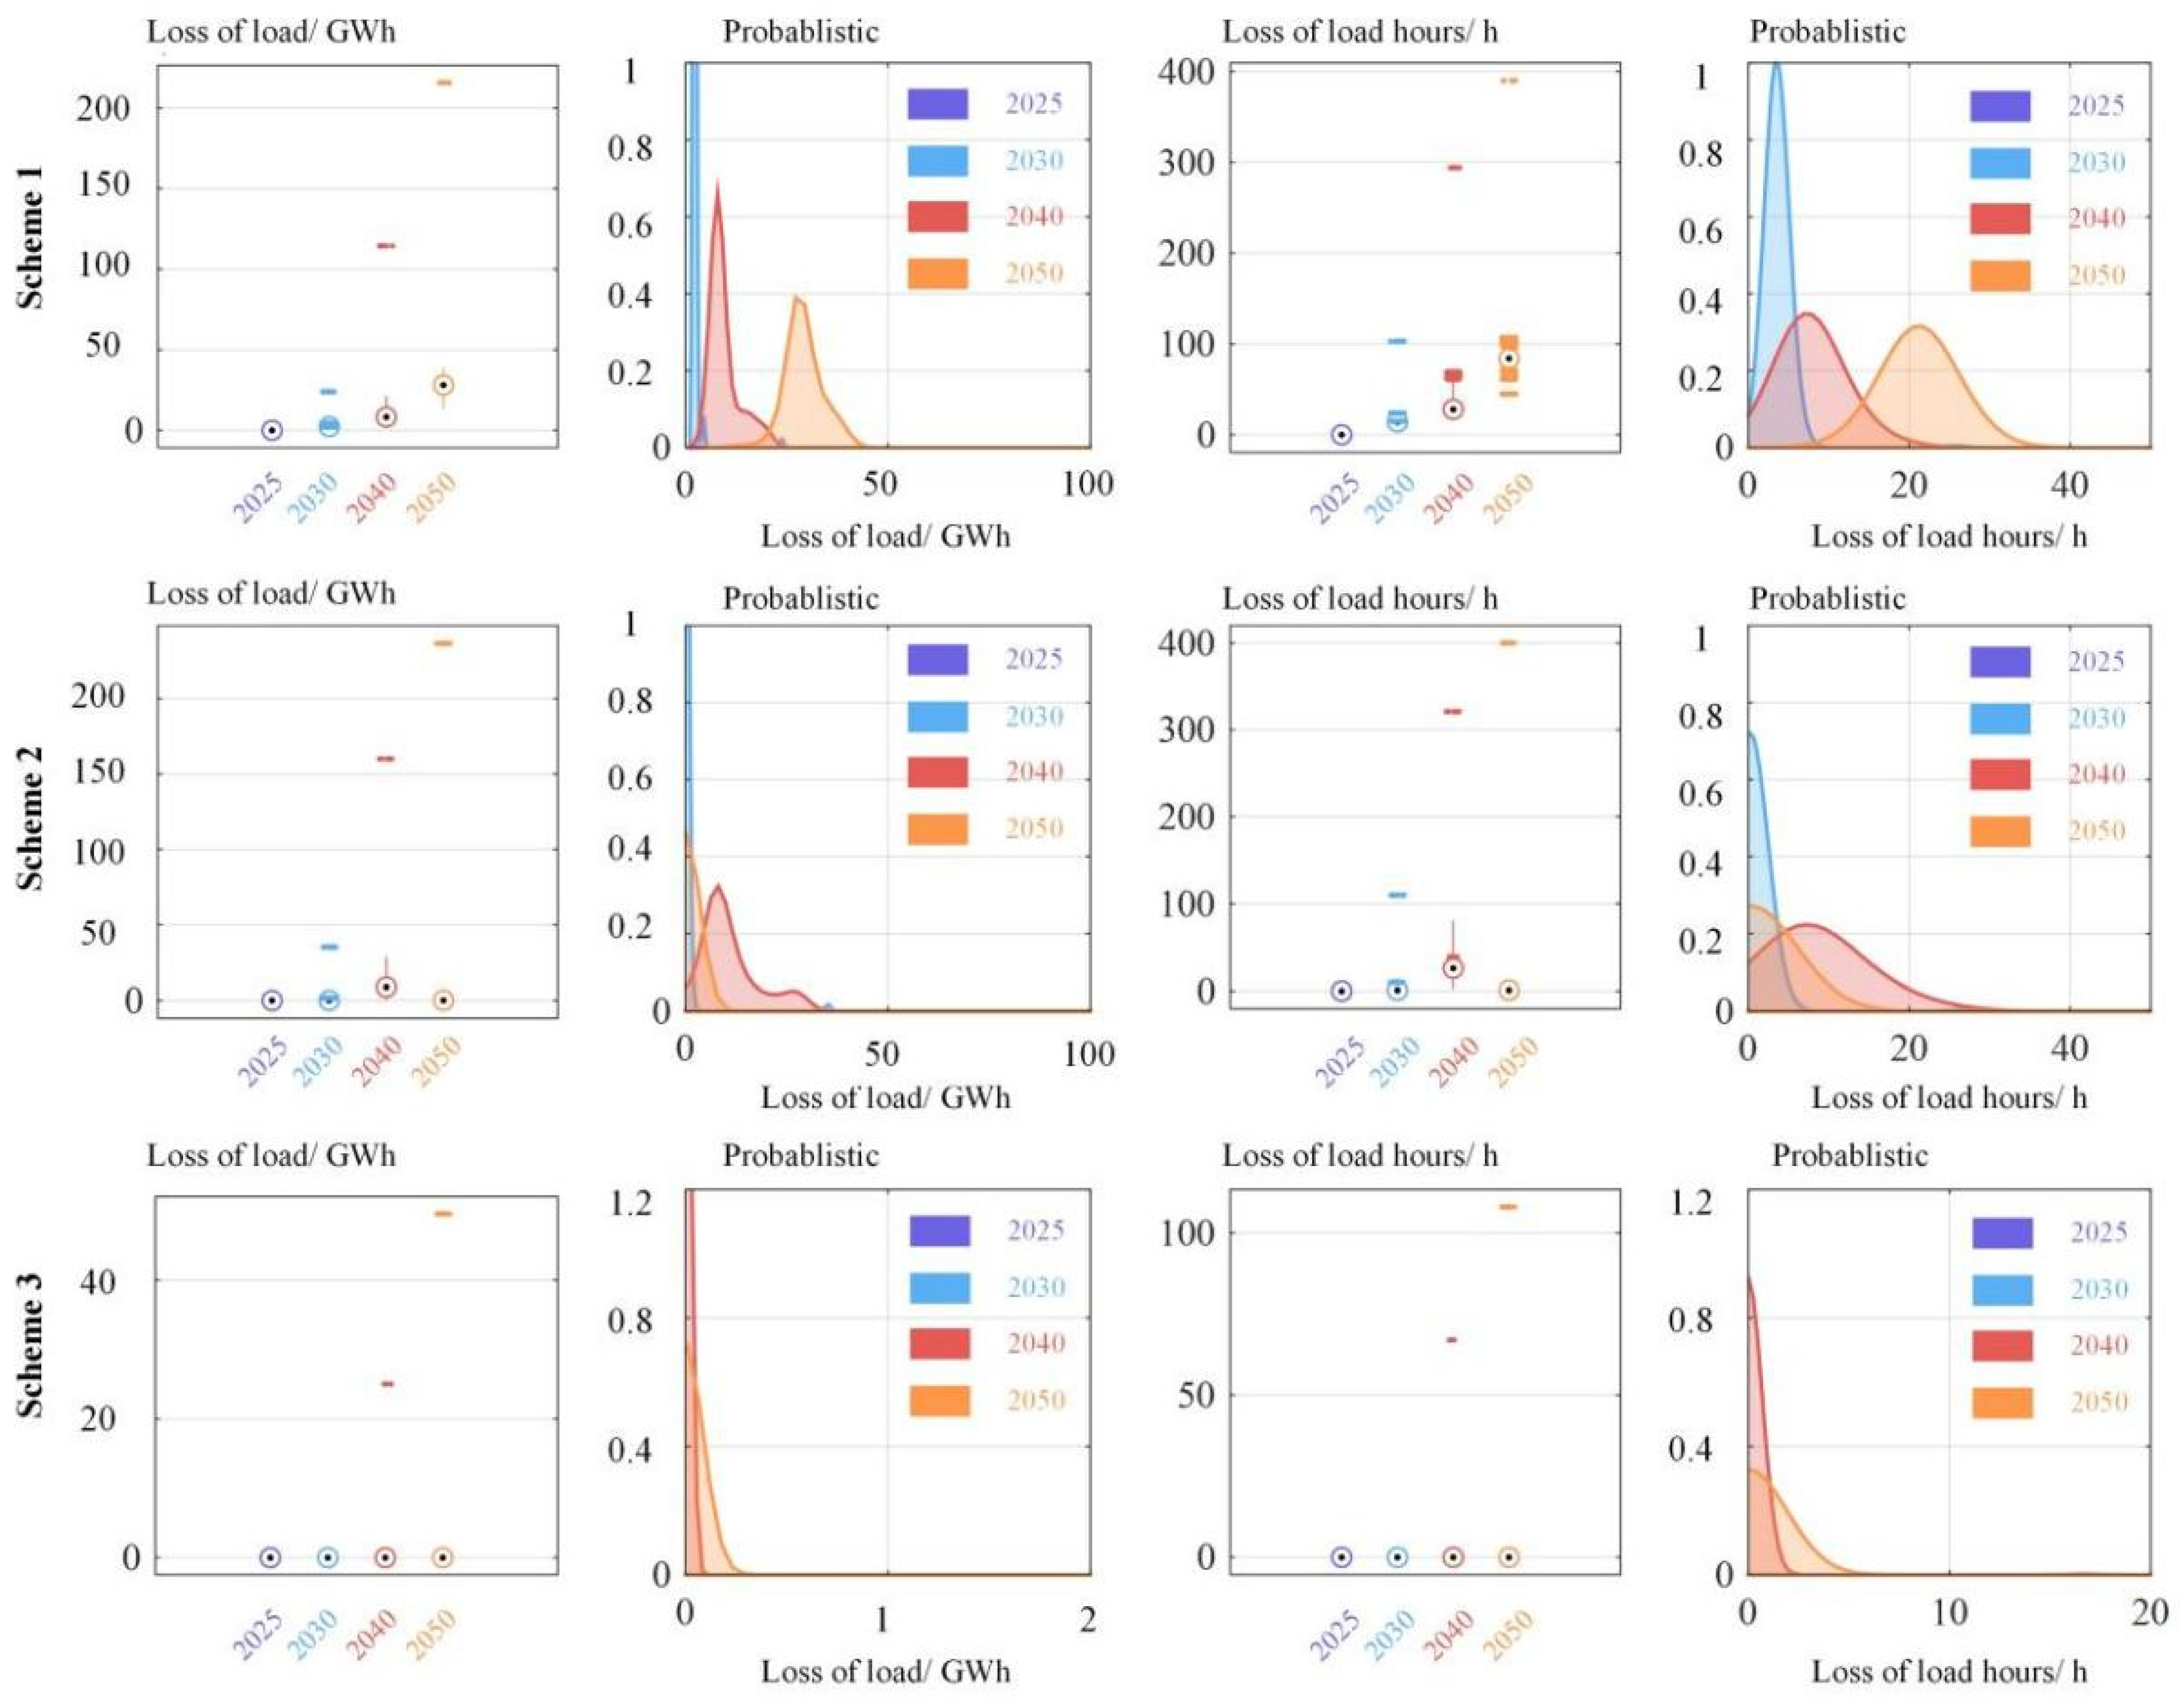
6.2. Probabilistic Analysis of Power Security under Extreme Events

To investigate the trend in power supply security under different weather events, the Monte Carlo-generated scenarios are shown in Figure 10, and the simulation results and KDE estimation results under drought, cold wave, and rainy scenarios are shown in Figure 11, Figure 12 and Figure 13, respectively. The statistical LOLE and TOLE results are presented in the form of box plots, and the data beyond the whiskers are displayed using points. The whisker length is specified as 10.
Although the intensity and duration of specific weather events follow a gamma distribution, the generated scenarios show the differences in the different weather events’ joint probabilistic distribution between duration and intensity. The color depth reflects the probability of occurrence of specific weather events. After inputting the generated scenario’s basic information, the LOLE and TOLE results were calculated via simulation.
The simulation and KDE estimation results both show that with the growth in renewable energy penetration and the decrease in controllable power sources, the power supply risks due to extreme weather events also increase. Among the different extreme weather events, drought is the main threat to power supply before 2030, and the three power transformation pathway schemes all lead to loss of load. However, compared with scheme 1, which has more fired power plant capacity, scheme 2, which has more renewable power sources and energy storage capacity, can effectively reduce the LOLE and TOLE, but the distribution ranges of LOLE and TOLE grow in the mid to long term. Meanwhile, both the LOLE and TOLE in scheme 3 are lower than those in scheme 2 and scheme 1, which show that a larger cross-regional power exchange capacity significantly elevates the emergency power support ability. For LOLE, the value for scheme 1 under the drought scenario increases from 0.04 GWh to 35.4 GWh from 2025 to 2050, and the value for scheme 2 for the same scenario increases from 0.01 GWh to 7.7 GWh from 2025 to 2040, and then drops to 0.76 GWh. In scheme 3, the LOLE remains stable, lower than 0.015 GWh, and the TOLE value for scheme 3 shows a similar trend. Additionally, the maximum LOLE and TOLE values in scheme 3 are also the lowest among the three transformation pathway schemes, which indicates a higher power security level.
Therefore, after the Monte Carlo simulation and KDE analysis, the trend in the influence of different extreme weather events on power supply security was drawn. The power supply security enhancement effect of the remaining controllable power sources is limited for the studied case, which is related to the current power source structure in Yunnan province, which is dominated by hydropower. And, installing more renewable energy and energy storage can also improve the system’s power security level by increasing the diversity of the power sources. Finally, cross-regional power support is an effective and cost-efficient way pf enhancing the system’s power security level, which can significantly decrease the LOLE and TOLE for different weather events. A similar conclusion can be found in [42].

7. Conclusions

This paper proposed a long-term power-supply risk evaluation method based on probabilistic production simulations, in which we applied a Copula-based Monte Carlo weather scenario generation method and production simulation to investigate the influence of extreme weather on power supply security. The following conclusions were drawn:
(1)
The proposed scenario generation method can simulate different weather events through appropriate Copula function selection and related parameter regulation. And, the generated power supply risk scenarios provide basic information for random power input regulation under extreme events, revealing the power shortage level during long-term power transformation under specific extreme weather events.
(2)
The power production simulation method constructed in this study considers the influence of extreme weather on random power sources. The higher penetration of renewable energies deteriorates the system’s power regulation ability with more unbalanced power, while power curtailment also grows due to having insufficient flexible sources.
(3)
The case study of Yunnan’s power system showed that the main power shortage threat is drought, which decreases the power output of the dominant power source: hydropower plants. Meanwhile, the power shortages will overall grow with the retirement of fossil fuel plants, while energy storage will play a critical role in future power supply under extreme weather events, especially long-duration energy storage.
(4)
Compared with the power transformation scheme involving fossil fuel power plant life extension, in scheme 3, which involves larger cross-regional power capacity, can significantly reduce the LOLE and TOLE under different extreme weather scenarios. The case also validated that even large sending-end power systems will experience power shortages under extreme weather events, and power support from other regions will be a more cost-efficient and environmentally friendly method compared with retaining more fossil fuel power plants, as the construction and maintenance costs of power transmission lines is lower than that of extending the life of fossil fuel power plants.
Additionally, the following aspects of the proposed long-term power supply risk evaluation method can be further update to perform more accurate and comprehensive evaluation under different extreme weather events:
(1)
Due to the frequency of the occurrence of extreme weather being affected by multiple factors, such as natural climate patterns, greenhouse gas emissions, atmospheric circulation, land use changes and so on, more studies should be carried out to investigate the influence of climate on power systems with high renewable penetration. In China, the regional power systems most likely to be affected are the northwestern power system, which has high penetration of renewables, and the southwestern power system, which is dominated by hydropower, such as those in Yunnan and Sichuan provinces.
(2)
The proposed extreme weather scenario generation method can be extended to more complicated scenarios, such as long-term drought and low-wind weather, which can cause larger power shortages due to low power output of hydropower and wind power. Meanwhile, Copula functions can also be replicated using a mixed Copula function, which can increase the accuracy of the results. It is noteworthy that the accuracy of the proposed method is high, which is related to the data quality, and high-spatiotemporal-resolution weather data, such as GIS data, would be preferred to improve the evaluation quality.
(3)
If the proposed method is applied to smaller-area power systems, more constraints should be considered, such as unit commitment, availability of units, power source ramping capability, and power grid congestion. Power grid congestion could be the most difficult constraint, due to the status of each power transmission line being strongly related to the power system’s operation status, and the increased randomness caused by the higher penetration of renewables would make the whole model more complicated to solve.
(4)
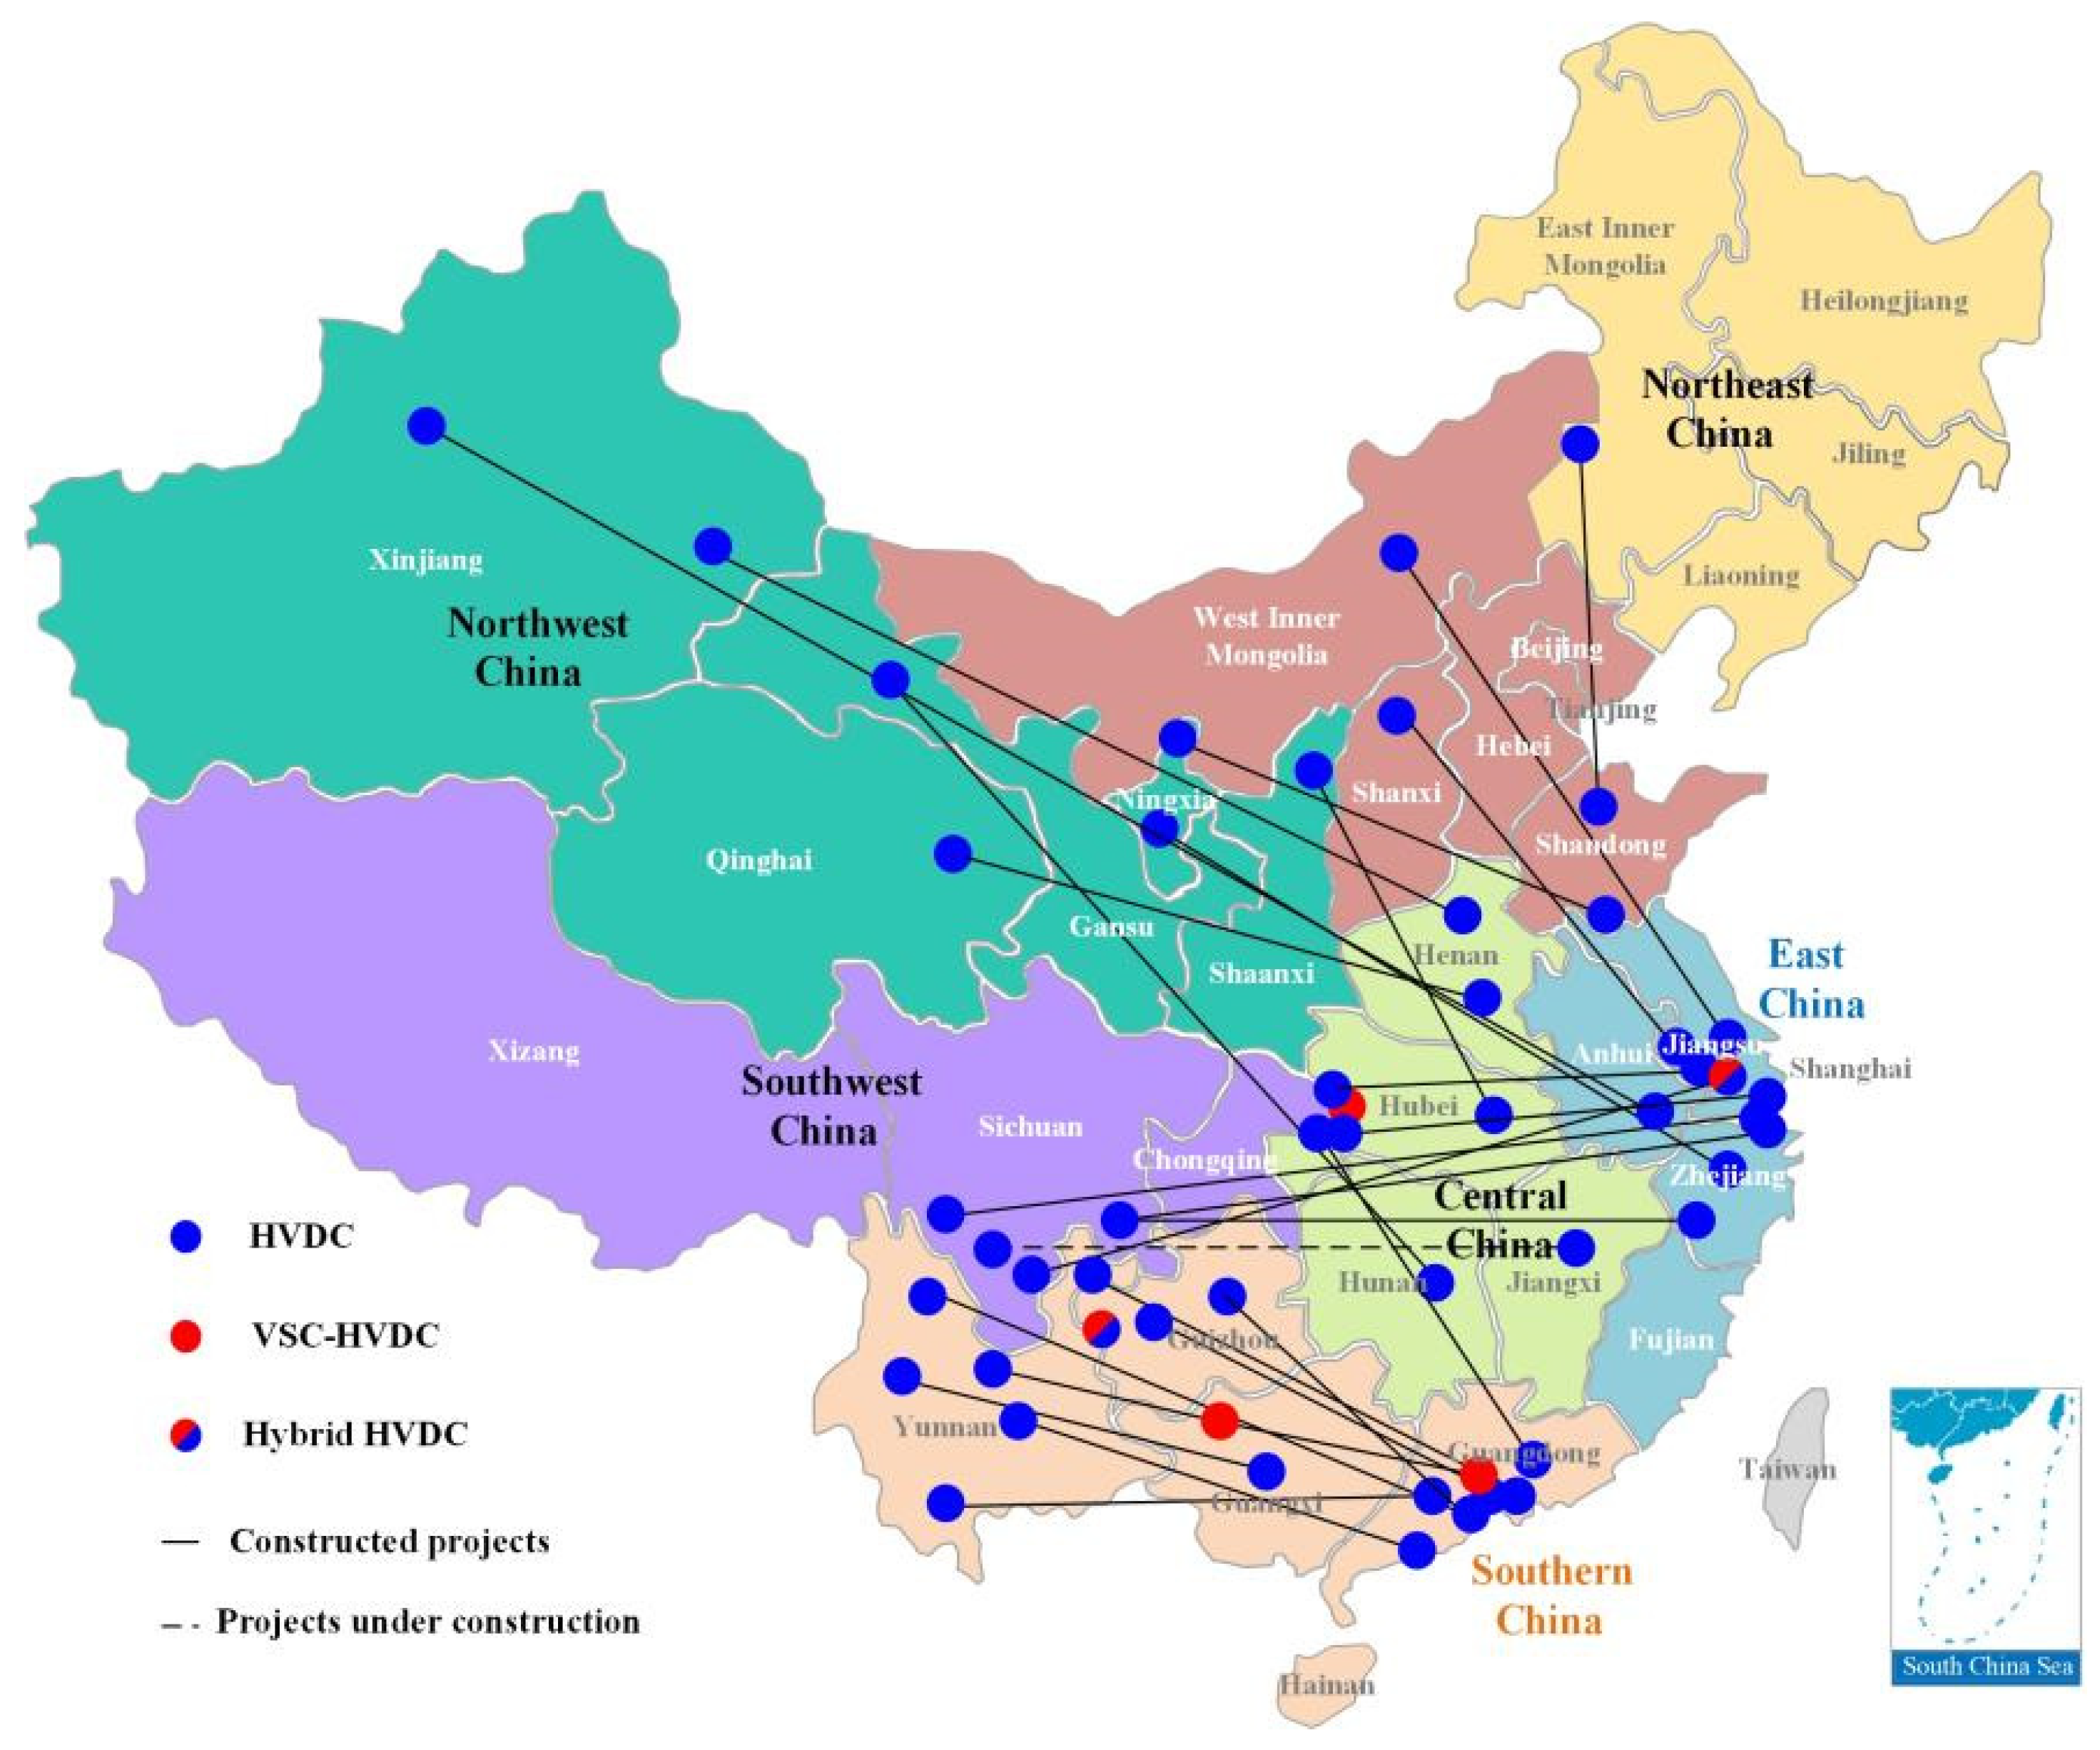
The simulation results indicated that cross-regional power interconnection is critical for the future power grid in China, and sending-end power system interconnection projects can ensure increased mutual aid among regions, such as between northwest and southwest China. The technical scheme is the key for transregional power system interconnection, which includes three main schemes: AC interconnection, HVDC interconnection based on line-commutated converters (LCCs), and HVDC interconnection based on voltage source converters. Further studies should be carried out for choosing the most cost-efficient interconnection scheme.

Author Contributions

Conceptualization, Y.W. and F.C.; methodology, J.H.; validation, J.H., F.C. and H.S.; formal analysis, H.S.; writing—original draft preparation, J.H. and F.C.; writing—review and editing, F.C.; supervision, Y.W.; funding acquisition, J.H. All authors have read and agreed to the published version of the manuscript.

Funding

This research was funded by the Science and Technology Project of China Renewable Energy Engineering Institute “Research on the Low-carbon Transformation Pathway of New Power Systems with Power Supply Risk Constraints Consideration” grant number ZY-KJZN-20230008, Major Science and Technology Special Funding of China Electric Power Construction Group “Research on Key Technologies of New Power Systems Based on NET + GRID + NET” grant number ZS-KJSJ-20210001, and China Postdoctoral Science Foundation “Research on the Path and Resilience Assessment of Power Transformation from the Perspective of ‘Industrial Chain + Supply Chain’ System” grant number 2023M733322. The authors are grateful to professors of engineering Yigo Zhang and Songxu Xin from the China Renewable Energy Engineering Institute for their technical guidance.

Data Availability Statement

The original contributions presented in the study are included in the article, further inquiries can be directed to the corresponding authors.

Conflicts of Interest

Authors Jianzu Hu and Yuefeng Wang was employed by the company Power Construction Corporation of China. The remaining authors declare that the research was conducted in the absence of any commercial or financial relationships that could be construed as a potential conflict of interest.

References

  1. Zhou, X.; Chen, S.; Lu, Z.; Huang, Y.; Ma, S.; Zhao, Q. Technology Features of the New Generation Power System in China. Proc. CSEE 2018, 38, 1893–1904+2205. [Google Scholar]
  2. National Energy Administration of the People’s Republic of China. Available online: http://www.nea.gov.cn/2023-05/25/c_1310721539.htm (accessed on 25 May 2023).
  3. Ghosh, S.; Younes, J.; Mohamed, S. Assessment of Bus Inertia to Enhance Dynamic Flexibility of Hybrid Power Systems with Renewable Energy Integration. IEEE Trans. Power Deliv. 2023, 38, 2372–2386. [Google Scholar] [CrossRef]
  4. Dai, H.; Su, Y.; Kuang, L.; Liu, J.; Gu, D.; Zou, C.; Huang, H. Contemplation on China’s Energy-Development Strategies and Initiatives in the Context of Its Carbon Neutrality Goal. Engineering 2021, 7, 1684–1687. [Google Scholar] [CrossRef]
  5. Xin, B.; Shan, B.; Li, Q.; Yan, H.; Wang, C. Rethinking of the “Three Elements of Energy” Toward Carbon Peak and Carbon Neutrality. Proc. CSEE 2022, 42, 3117–3125. [Google Scholar]
  6. Wu, D.; Milad, J.; John, N. A preliminary study of impact of reduced system inertia in a low-carbon power system. J. Mod. Power Syst. Clean Energy 2015, 3, 82–92. [Google Scholar] [CrossRef]
  7. Younesi, A.; Hossein, S.; Wang, Z.; Siano, P.; Mehrizi, A.; Safari, A. Trends in modern power systems resilience: State-of-the-art review. Renew. Sustain. Energy Rev. 2022, 162, 112397. [Google Scholar] [CrossRef]
  8. Shu, Y.; Tang, Y. Analysis and recommendations for the adaptability of China’s power system security and stability relevant standards. CSEE J. Power Energy Syst. 2017, 3, 334–339. [Google Scholar] [CrossRef]
  9. Yan, R.; Masood, N.; Saha, Y.; Bai, F.; Gu, H. The anatomy of the 2016 South Australia blackout: A catastrophic event in a high renewable network. IEEE Trans. Power Syst. 2018, 33, 5374–5388. [Google Scholar] [CrossRef]
  10. Yuan, P.; Zhang, Q.; Zhang, T.; Chi, C.; Gong, X. Analysis and enlightenment of the blackouts in Argentina and New York. In Proceedings of the 2019 Chinese Automation Congress (CAC), Hangzhou, China, 13 February 2020. [Google Scholar]
  11. Bialek, J. What does the GB power outage on 9 August 2019 tell us about the current state of decarbonised power systems? Energy Policy 2020, 146, 11821. [Google Scholar] [CrossRef]
  12. Zhang, L.; Chen, F.; Chen, K.; Zhang, K.; Chen, S.; Long, Z. A review on emergency response and recovery method for large area outage of power grid. In Proceedings of the 2022 IEEE 6th Information Technology and Mechatronics Engineering Conference (ITOEC), Chongqing, China, 4–6 March 2022; pp. 544–551. [Google Scholar]
  13. Hang, G.; Zhong, H.; Tan, Z.; Cheng, T.; Xia, Q.; Kang, C. Texas electric power crisis of 2021 warns of a new blackout mechanism. CSEE J. Power Energy Syst. 2022, 8, 1–9. [Google Scholar]
  14. Wang, G.; Dong, Y.; Xu, T.; He, J.; Zhang, Y. Analysis and Lessons of Brazil Blackout Event on August 15, 2023. 5. Proc. CSEE 2023, 43, 9461–9469. [Google Scholar]
  15. Gao, H.; Guo, M.; Liu, J.; Liu, J.; He, S. Power Supply Challenges and Prospects in New-generation Power System from Sichuan Electricity Curtailment Events Caused by High-temperature Drought Weather. Proc. CSEE 2023, 43, 4517–4538. [Google Scholar]
  16. Hu, Y.; Xue, S.; Zhang, H.; Zhang, H.; Feng, X.; Tang, C.; Lin, Y.; Zheng, P. Cause Analysis and Enlightenment of Global Blackouts in the Past 30 Years. Electr. Power 2021, 54, 204–210. [Google Scholar]
  17. Zhang, Y.; Zhang, J.; Han, X.; Jin, X.; Xie, G.; Zhu, R. Analysis of Power Shortage in India and Enlightenment on Power Gird Development. In Proceedings of the 2022 IEEE/IAS Industrial and Commercial Power System Asia (I&CPS Asia), Shanghai, China, 13 November 2022. [Google Scholar]
  18. Cuartas, L.A.; Cunha, A.P.M.d.A.; Alves, J.A.; Parra, L.M.P.; Deusdará-Leal, K.; Costa, L.C.O.; Molina, R.D.; Amore, D.; Broedel, E.; Seluchi, M.E.; et al. Recent hydrological droughts in Brazil and their impact on hydropower generation. Water 2022, 14, 601. [Google Scholar] [CrossRef]
  19. Valasai, G.; Uqaili, M.; Memon, H.; Samoo, S.; Mirjat, N.; Harijan, K. Overcoming electricity crisis in Pakistan: A review of sustainable electricity options. Renew. Sustain. Energy Rev. 2017, 72, 734–745. [Google Scholar] [CrossRef]
  20. Gohli, H. High-voltage steering: China’s energy market reforms, industrial policy tools and the 2021 electricity crisis. Energy Res. Soc. Sci. 2022, 93, 102851. [Google Scholar] [CrossRef]
  21. Shen, J.; Cheng, C.; Jia, Z.; Zhang, Y.; Lv, Q.; Cai, H.; Wang, B.; Xie, M. Impacts, challenges and suggestions of the electricity market for hydro-dominated power systems in China. Renew. Energy 2022, 187, 743–759. [Google Scholar] [CrossRef]
  22. Li, D.; Liu, Z.; He, J.; He, L.; Ye, Z.; Liu, Z. Renewable Energy Real-Time Carrying Capacity Assessment Method and Response Strategy under Typhoon Weather. Energies 2024, 17, 1401. [Google Scholar] [CrossRef]
  23. Rao, H.; Han, F.; Chen, Z.; Huang, G.; Wang, D.; Zhang, Y.; Cai, W.; Xu, M.; Jiang, W.; Zhou, B. Strategy for Guaranteeing Power Supply Security of China. Strateg. Study CAE 2023, 25, 100–110. [Google Scholar]
  24. Shan, B.; Ji, X.; Xu, C.; Liu, Z. Evolving Tendency of Electric Supply and Demand Pattern under the Circumstances of High-Quality Energy Development. Electr. Power 2021, 54, 1–9+18. [Google Scholar]
  25. Dong, J.; Chen, Z.; Dou, X. The Influence of Multiple Types of Flexible Resources on the Flexibility of Power System in Northwest China. Sustainability 2022, 14, 11617. [Google Scholar] [CrossRef]
  26. Zhou, Y.; Wei, T.; Chen, S.; Wang, S.; Qiu, R. Pathways to a more efficient and cleaner energy system in Guangdong-Hong Kong-Macao Greater Bay Area: A system-based simulation during 2015–2035. Resour. Conserv. Recycl. 2021, 174, 105835. [Google Scholar] [CrossRef]
  27. Chen, X.; Liu, Y.; Wang, Q.; Lv, J.; Wen, J.; Chen, X.; Kang, C.; Cheng, S.; Micael, B. Pathway toward carbon-neutral electrical systems in China by mid-century with negative CO2 abatement costs informed by high-resolution modeling. Joule 2022, 5, 2715–2741. [Google Scholar] [CrossRef]
  28. Zhuo, Z.; Du, E.; Zhang, N.; Chris, P.; Lu, X.; Xiao, J.; Wu, J.; Kang, C. Cost increase in the electricity supply to achieve carbon neutrality in China. Nat. Commun. 2022, 13, 3172. [Google Scholar] [CrossRef] [PubMed]
  29. Do, V.; McBrien, H.; Flores, N.M.; Northrop, A.J.; Schlegelmilch, J.; Kiang, M.; Casey, J. Spatiotemporal distribution of power outages with climate events and social vulnerability in the USA. Nat. Commun. 2023, 14, 2470. [Google Scholar] [CrossRef]
  30. Aoun, A.; Adda, M.; Ilinca, A.; Ghandour, M.; Ibrahim, H. Centralized vs. Decentralized electric grid resilience analysis using Leontief’s input–output model. Energies 2024, 17, 1321. [Google Scholar] [CrossRef]
  31. Lu, Z.; Li, H.; Qiao, Y. Power System Flexibility Planning and Challenges Considering High Renewable Energy. Autom. Electr. Power Syst. 2016, 40, 147–158. [Google Scholar]
  32. Ciapessoni, E.; Cirio, D.; Pitto, A.; Marcacci, P.; Lacavalla, M.; Massucco, S.; Silvestro, F.; Sforna, M. A Risk-Based Methodology and Tool Combining Threat Analysis and Power System Security. Energies 2018, 11, 83. [Google Scholar] [CrossRef]
  33. Liu, Z.; Tang, P.; Hou, K.; Zhu, L.; Zhao, J.; Jia, H.; Pei, W. A Lagrange-Multiplier-Based Reliability Assessment for Power Systems Considering Topology and Injection Uncertainties. IEEE Trans. Power Syst. 2024, 39, 1178–1189. [Google Scholar] [CrossRef]
  34. Yang, Y.; Li, Z.; Mandapaka, P.; Lo, E. Risk-averse restoration of coupled power and water systems with small pumped-hydro storage and stochastic rooftop renewables. Appl. Energy 2023, 339, 120953. [Google Scholar] [CrossRef]
  35. Stover, O.; Karve, P.; Mahadevan, S. Reliability and risk metrics to assess operational adequacy and flexibility of power grids. Reliab. Eng. Syst. Saf. 2023, 231, 109018. [Google Scholar] [CrossRef]
  36. Li, H.; Jiang, Y.; Song, T.; Liu, Z.; Xia, K.; Chen, Z.; Shi, R. Research on the Characteristics of Power Supply and Demand Balance and Supply Guarantee Strategies in the Context of New Power Systems. Power Syst. Clean Energy 2023, 39, 72–78. [Google Scholar]
  37. Nelsen, R.B. An Introduction to Copulas; Springer: New York, NY, USA, 1999. [Google Scholar]
  38. Sklar, A. Fonctions de répartition à n dimensions et leurs marges. Publ. Inst. Statist. Univ. 1959, 8, 229–231. [Google Scholar]
  39. Wu, X.; Wu, Y.; Cheng, X.; Cheng, C.; Li, Z.; Wu, Y. A mixed-integer linear programming model for hydro unit commitment considering operation constraint priorities. Renew. Energy 2023, 204, 507–520. [Google Scholar] [CrossRef]
  40. Weng, X.; Jiang, C.; Yuan, M.; Zhang, M.; Zeng, T.; Jin, C. An ecologically dispatch strategy using environmental flows for a cascade multi-sluice system: A case study of the Yongjiang River Basin, China. Ecol. Indic. 2021, 121, 107053. [Google Scholar] [CrossRef]
  41. He, Z.; Yang, J.; Wu, Y.; Han, C.; Lu, H.; Dong, A. Investigation on the future AC and DC combined operation form and development trend under energy transition. Proc. CSEE 2023, 43, 99–113. [Google Scholar]
  42. Liu, Z.; Zhou, B.; Li, X.; Meng, J.; Yu, X. The Study on Interconnection of Northwest and Southwest Power Grid in China. J. Glob. Energy Interconnect. 2023, 6, 341–352. [Google Scholar]
Figure 1. The whole structure of the proposed probabilistic production simulation method.
Energies 17 02515 g001
Figure 2. Probabilistic model of extreme weather event considering intensity and duration.
Energies 17 02515 g002
Figure 3. The process for the extreme weather generation method.
Energies 17 02515 g003
Figure 4. The yearly electricity consumption curves for typical Chinese provinces.
Energies 17 02515 g004
Figure 5. The distribution of Chinese HVDC projects.
Energies 17 02515 g005
Figure 6. The prediction for Yunnan’s power system.
Energies 17 02515 g006
Figure 7. The energy production simulation results for scheme 1 under extreme drought scenario.
Energies 17 02515 g007
Figure 8. The energy production simulation results for scheme 2 under extreme drought scenario.
Energies 17 02515 g008aEnergies 17 02515 g008b
Figure 9. The energy production simulation results for scheme 3 under extreme drought scenario.
Energies 17 02515 g009aEnergies 17 02515 g009b
Figure 10. The Monte Carlo-generated power supply risk scenarios.
Energies 17 02515 g010
Figure 11. The Monte Carlo simulation results for different transformation pathways of Yunnan’s power system under a drought scenario.
Energies 17 02515 g011
Figure 12. The Monte Carlo simulation results for different transformation pathways of Yunnan’s power system under a cold wave scenario.
Energies 17 02515 g012
Figure 13. The Monte Carlo simulation results of the different transformation pathways for Yunnan’s power system under a rain scenario.
Energies 17 02515 g013
Table 1. Possible occurrence times for different disasters.
High-Risk AreasPossible Occurrence Times
Cold waveAll areasLate fall, winter, and the beginning of spring
DroughtAll areasHigher possibility in spring in northern areas
Higher possibility in summer and fall in Yangtze River downstream area
RainstormEast and South ChinaHigher possibility in summer half-year in southern areas
Sand stormNorthwest and North ChinaSpring
HurricaneEast and South ChinaFrom late spring to the beginning of winter, high possibility from July to September
Table 2. Copula functions used for probabilistic model for different weather events.
Cold WaveDroughtRain StormSand stormHurricane
Copula functionGumbelGumbelttClayton
Table 3. The operation flexibility of different resources.
Type of ResourcesRegulation RangeRamp RateTypical Unit
Capacity
Start-Up TimeCurrent Scale
Unit%% Pn/minMWHourGW
CPPbefore50~1001~2200~10006~10>550
after30~1003~64~5>100
CHP-CPPbefore80~1001~2220~3306~10>370
after50~1003~64~5>80
NGP20~100850~7002≈120
HPP0~1002025~1000<1≈360
NPP30~1002.5~5300~1750/≈55
HPS−100~10010~5050~300<0.1≈45
ESS−100~10010010~2000<0.1≈12
CAS−100~1003020~3000.1/
HWE0~100/5~200//
DR3~5% of the total load100~200/0≈50
Table 4. Different long-term low-carbon transformation pathways for Yunnan’s power system.
Type of Resource/GW20252030204020502060
Scheme 1CPP11.633311.388311.0466.9093.92
NGP0.51222
HPP (without HPS)8392.73697.872104.192112.992
NPP00000
WPP19.24534.555.7566.9585.375
SPP23.514432.568.64110.422150.722
HPS4.579.510.511.5
ESS23.5579
Scheme 2CPP11108.553
NGP0.50.50.50.50.5
HPP (without HPS)8392.73697.872104.192112.992
NPP00000
WPP23.09441.466.980.34102.45
SPP28.217284482.368132.5064180.8664
HPS610141616
ESS510203030
Scheme 3CPP11108.553
NGP0.50.50.50.50.5
HPP (without HPS)8392.73697.872104.192112.992
NPP00000
WPP21.9942939.4285763.7142976.5142997.57143
SPP26.873641.9047678.44571126.1966172.2537
HPS5.719.5213.3315.2415.24
ESS4.769.5219.0528.5728.57
Cross-region power capacity48121616
Disclaimer/Publisher’s Note: The statements, opinions and data contained in all publications are solely those of the individual author(s) and contributor(s) and not of MDPI and/or the editor(s). MDPI and/or the editor(s) disclaim responsibility for any injury to people or property resulting from any ideas, methods, instructions or products referred to in the content.

