Review

Identification of Both Distortion and Imbalance Sources in Electrical Installations: A Comparative Assessment

by
Reyes Sánchez-Herrera
1,*,
Jesús Clavijo-Camacho
1,
Gabriel Gómez-Ruiz
2 and
Jesús R. Vázquez
1
1
Electrical Engineer Department, University of Huelva, 21007 Huelva, Spain
2
Electronic Engineer Department, University of Huelva, 21007 Huelva, Spain
*
Author to whom correspondence should be addressed.
Energies 2024, 17(11), 2536; https://doi.org/10.3390/en17112536
Submission received: 21 March 2024 / Revised: 30 April 2024 / Accepted: 21 May 2024 / Published: 24 May 2024

Abstract

:
Electric power quality is becoming more critical with time because of the increasing use of electronic devices in all areas of society: in industry, in the household, etc. Many kinds of disturbances can be produced in the grid due to external or internal causes, such as, for example, switching operations. Among them, distortion and imbalance are long-term disturbances, which makes them very dangerous for electric equipment. In addition, the identification of the distortion and/or imbalance sources is quite difficult because they are instantaneously scattered by the grid. This paper presents a study of the algorithms published in the technical literature which identify distortion and imbalance sources in electrical installations and compares the results of applying them to a specific installation constituted by linear and non-linear, balanced and unbalanced loads, and a standard module to inject energy to the grid. Only two algorithms have been found in the review carried out and the results provided by both are presented and discussed. Neither of these algorithms is completely reliable, although one of them is more promising.

1. Introduction

As the prevalence of non-linear loads, particularly power-electronics-based loads, increases, the importance of electric power quality becomes more evident. This trend coincides with the growing penetration of distributed generation systems interfacing with the grid through diverse power converters.
The electric power quality traditionally encompasses three related issues. The first one is the assurance of the energy supply at the different consumption nodes. The second concern pertains to the quality of the current and voltage waveforms within the grid nodes. Finally, the third issue involves ensuring the sustained maintenance and guaranteeing the aforementioned aspects over time. The assurance of the energy supply is an issue that has been overcome in most of the developed countries. Thus, most of the works published in the technical literature, as well as the present work, are framed on the second issue: the quality of current and voltage waveforms.
In this context, two complementary issues must be considered: the kind of non-conformities and the study area of application. With respect to the second issue, it must be considered that the hierarchical structure of the power system is being substituted by an increasing number of microgrids with a certain level of autonomy, mainly based on the distributed generation promoted by the developed countries’ governments. Therefore, the assessment of power quality in the power system could be approached as follows: on the one hand, analyzing the power quality within each microgrid connected to the power system; and, on the other hand, carrying out an analysis from top to bottom, at the different levels, focusing on the nodes where non-conformities are identified. With respect to the first issue, a summary of the non-conformities is presented in this work, in order to focus the study on some of them.

1.1. The Scope of the Measurement

The technical literature involves a variety of research avenues that explore the viability of using pseudo-measurements to reduce the number of smart sensors required to analyze the distribution system’s power quality. This line is a result of two main problems: the first one is the high number of nodes implicated and the distribution network amplitude, and the second is the high cost of smart measurers. With respect to the first, one solution could be the consideration of the distribution network, or any other, as a set of microgrids. In this way, the analysis of the complete network can be carried out as the analysis of each microgrid connected to it. With respect to the second issue, the rise of electronic manufacturing advances in the last decades has made possible the development of numerous and different smart sensors and measurers based on low-cost devices, free software, and open hardware. Thus, with low-cost measurers, the quality of the system could be addressed sequentially at the different levels focusing on the nodes where non-conformities are identified, or in each microgrid connected to the system. This second option represents a way of classifying the loads connected to the system.

1.2. The Scope of the Non-Conformities

There are numerous non-conformities applicable to the voltage and current waveforms and which reduces the electric power quality in an electrical installation and, thus, in the distribution system. Those non-conformities can be first classified into two different kinds: the transitory non-conformities and the quasi-stable non-conformities. The largest number is framed into the first group, as follows:
-
Voltage sag;
-
Voltage swell;
-
Flicker;
-
Frequency variations.
These transitory non-conformities (TNCs) have been widely studied in the technical literature, where many works can be found to identify each one, by means of different algorithms [1,2,3].
Regarding the quasi-stable non-conformities (SNCs), the most relevant are distortion and imbalance. There are also many works in the technical literature focused on SNCs.
There are two main differences between TNCs and SNCs: On the one hand, the TNC mainly concerns the voltage waveform and the SNC the voltage and current waveform. Thus, the way to compensate the TNC is the use of a series power filter, among other similar devices, and the way to compensate the SNC can be the use of a parallel power filter, which is easier to design and connect. On the other hand, the electrical installations are protected from the most usual TNCs, such as the voltage variations, following the electrical regulations and standards. However, there is no protection from the SNCs in the electrical systems, and, thus, their effects are greater than those corresponding to the TNCs.
Therefore, this work is focused on the analysis of SNCs. As indicated above, these non-conformities can be compensated with shunt active power filters (SAPFs). However, the performance of the SAPF can be improved by locating them in the node where the load mainly responsible for the distorting/unbalancing is connected instead of connecting it at the input of the electrical system. Thus, the importance of identifying those distorting and unbalancing loads is evident, and that is the scope of the present paper.

1.3. Identification of Distorting and Unbalancing Loads

The identification of distortion and/or imbalance sources in electrical systems is not easy due to two main reasons. On the one hand, the current distortion and imbalance produced by non-linear loads spread throughout the installation because of the voltage generated by those currents in the source and line impedances. On the other hand, certain components may not directly generate distortion but can amplify existing distortions within the system. Therefore, the distortion and imbalance present in each node could not be produced by the load connected to it but by loads connected to other nodes, or they could come from the source side. Thus, the simple measurement of distortion and imbalance in each node is not enough to identify the distortion and imbalance sources.
Multiple strategies are available in the technical literature for identifying the distorting nodes. A list of the most pertinent is provided in this section with the aim of identifying algorithms that can identify the loads that are distorting and unbalancing using only current and voltage measurements obtained at the input of the nodes, without interfering with the installation’s regular operation or requiring extra information about its structure.
The algorithms presented in the technical literature to identify harmonic sources can be classified according to different criteria. For example, according to the information provided, there are some of them which compare the harmonics supplied by the source and those supplied by the load and conclude if the harmonic source is in the supply side or in the load side. Other sets of algorithms evaluate each node of a microgrid and assign a value to each one corresponding to the distortion injected. This kind of algorithm is named distributed measurements, or multi-point, and the first one single-point.
An algorithm of significant relevance relies on the determination of the harmonic active power’s sign, applicable within single-point systems [4,5,6,7,8,9], or in multi-point systems [10,11,12,13]. In cases where the load being analyzed is linear, the harmonic active power comes from the source to the load. Nevertheless, with distorting loads, this flow may reverse direction. Thus, the load’s contribution to the overall distortion may be measured by taking into account the polarity of the harmonic active power. The significance of this algorithm is underscored by recent reviews and research papers, [14,15,16,17], which further reinforce the harmonic-reactive-power-sign-based technique as a viable solution to the challenge of identifying harmonic sources.
Another method for locating causes of distortion is to depict the harmonic equivalent circuit with a Norton model. Using measurements made at the point of common coupling (PCC), this approach analyzes the Norton equivalent’s characteristics and harmonic source currents to determine the correlation between the harmonic voltage and harmonic impedance source [18,19,20]. An alternative approach is the critical impedance method [21], that chooses the bigger of two harmonic voltage source magnitudes in the Thevenin equivalent circuit as the principal harmonic source. This technique makes it possible to identify the side that gives the PCC the most distortion. But these processes require the awareness of both consumer and network harmonic impedances.
Current decomposition is the approach of a significant cluster of proposals [22,23,24]. The current can be divided into two components: the first one refers to the portion of the load that sustains the system integrity free from distortion, while the distortion generated by part of that actual load is denoted in the second component. In instances involving linear loads, only the first component is present, whereas both components exist in scenarios featuring non-linear loads.
Moreover, it is imperative to examine multi-point indices including the toll-road model [12,17], in which various current or power measures are relied upon, or the Global Power Quality Index [13], amalgamating several single-point indices. These multi-point algorithms necessitate a dedicated index for comparing the values corresponding to measurements taken at each node.
Multi-point algorithms are the only group able to identify the distortion sources in electrical systems. However, they present additional requirements corresponding to the single-point algorithms; i.e., the measurements in each node must be simultaneous. Thus, a perfectly co-ordinated measurement system is needed. In addition, the system should be based on low-cost devices, free software, and open hardware. In this way, all the nodes can be analyzed, instead of considering pseudo-measurements originated by the lack of devices.
All the aforementioned procedures possess their respective advantages and disadvantages. Nevertheless, none of them can accurately identify the true distortion sources in systems where capacitors are present [25]. It is important to note that, while loads producing harmonics are typically non-linear and contribute to system distortion, other elements may play a crucial role in propagating harmonics throughout the installation, even if they cannot be classified as distortion sources. Among these elements, capacitors are particularly significant. In power systems, they are commonly used to compensate the inadequate power factor of inductive loads. Nevertheless, their effectiveness is optimal only under steady-state sinusoidal conditions. In other scenarios, capacitors may induce significant issues [25]. This is primarily attributed to their harmonic impedance, which decreases with increasing frequency, thereby exacerbating the current distortion consumed by the load.
In this paper, works previously published in the technical literature which allow the identification of both distortion and imbalance sources in electrical installations are found. The algorithms found are summarily presented in the paper and compared by applying them to a specific installation. The results provided are presented and discussed. The electrical system chosen for the tests contains all the types of loads necessary to assess if the indices found work properly: a linear balanced inductive load, a linear balanced capacitive load, a linear unbalanced resistive load, a non-linear balanced load, and a non-linear unbalanced load.

2. Materials and Methods

The approach used to perform a Systematic Literature Review (SLR) is mostly used in the social sciences, education, supply chain management, and medical domains. This concept was used in the engineering field in [26], proving to be a successful evidence-based strategy. The four fundamental principles underlying SLR are replicability, exclusivity, aggregation, and algorithmic rigor. The method comprises several sequential steps: Step 1 entails the definition of the problem and its boundaries, Step 2 involves identifying relevant aspects for inclusion in the study, Step 3 specifies the methodology for information acquisition, Step 4 organizes and simplifies the acquired information, Step 5 engages in a discussion of the gathered data, and Step 6 involves the compilation of the final report.
Step 1: The increasing number of non-linear loads and the incorporation of renewable energy sources into the electrical system are causing an increase in Total Harmonic Distortion (THD) at the PCC. Finding the origins of harmonics and imbalance is a serious problem for consumers and power companies alike. Since current approaches are unable to identify harmonics and/or imbalance when numerous customers are linked at the PCC, this problem remains unsolved. As a result, a large portion of studies have only looked at certain consumers linked to the PCC and the distortion that results from it. It is still difficult to identify which consumer contributes more, even when the harmonic source is proven to be coming from them. Addressing industry-wide concerns surrounding the identification of harmonic and/or imbalance sources and resolving customer complaints arising from grid-related issues are imperative. This review aims to offer practical solutions to engineers for discerning the sources of harmonics and/or imbalance at the PCC. It encompasses a literature review focused on harmonic and imbalance source detection.
Stage 2: The literature review concentrates on the methodology employed to pinpoint the sources of harmonics and imbalance.
Stage 3: Information and data are acquired by applying targeted keywords to databases acting as search engines. The Web of Science’s Science Direct, IEEE Xplore, and Scopus databases were searched. End-Note X7 was used to search for direct citations online and Google Scholar to find specific journal publications. After that, we exported the reference information to Mendeley v2.114.0. There is a wealth of literature on the subject of harmonic source identification, with many approaches and strategies. Table 1 lists the keywords used in order to obtain information. In all the searches, the combination of keywords shown in Table 1 were searched in fields “keywords” and “authors keywords”.
Step 4: Using established procedures, the collected literature articles on the area of interest were arranged. The arrangement was made in accordance with the PRISMA 2009 flow diagram [27] as follows: (a) Using the search criteria listed in Table 1, 94 publications were found using database searches on websites like IEEE Xplore, Science Direct, and Scopus. (b) The Google Scholar search engine turned up seven more publications. (c) Ten publications were eliminated because they covered subjects other than harmonic distortion, harmonic filters, and power quality—that is, subjects irrelevant to the main goal of this study, which is the identification of harmonic and imbalance sources. (d) The constraint of having been cited at least once led to the evaluation of 47 works. These 47 papers were categorized based on the methods employed to identify distortion and/or imbalance sources, with the results presented in Table 2.
Step 5: Predetermined inclusion and exclusion criteria were used to choose research articles in order to improve the search process and find the most relevant literature on the subject. Regarding this study, those criteria consist of finding algorithms which boards both distortion and imbalance sources identification.
Step 6: The findings are documented. Two papers have been found which meet the criteria indicated in step 5. I.e., addressing both distortion and imbalance sources identification. In the next sections, they are summarily presented, and the results provided by them when applied to a simulation platform are compared.

3. Methods to Identify Distortion and Imbalanced Sources in Technical Literature

A great difference is noticeable between the algorithms which address the distortion and those which address the imbalance. This can be explained by considering the following:
-
Traditionally, before the distributed generation made necessary the consideration of the microgrids, the distortion was assessed in the distribution systems. And the lines involved in these systems are designed to avoid the propagation of the imbalance.
-
The imbalance can be considered as distortion (multiple of three).
However, with the distribution generation, the imbalance has attained a predominant role at the level of distortion in the microgrids. Thus, both non-conformities have been addressed in this paper. And, as can be seen in Table 2, only two references present algorithms that identify both distortion and imbalance sources. In this section, those algorithms are briefly presented.

3.1. Algorithm to Calculate Thet3

In order to identify sources of imbalance and/or harmonic distortion, reference [71] proposes the development of an index utilizing power parameters related to the IEEE Std. 1459 framework. This standard provides a structured approach to dissecting an apparent power component in the presence of asymmetry and distortion. The algorithm presented in [71] introduces a new method for decomposing apparent power, categorizing it into four different components. These power terms offer clear distinctions between distortion and imbalance, departing from the standardized terminology. By normalizing each term by the total power of the system, the use of power components eliminates the requirement for determining weighting coefficients for every addition.
The index introduced, denoted as T h e t 3 in [71], amalgamates the power terms previously suggested in the technical literature with a modified version of the Harmonic Global Index (HGI), as defined below:
T h e t 3 k = 1 4 S u 1 k S u 1 s + S b H k S b H s + S u H k S u H s + H G I m k H G I m s
where   S u 1 k is the unbalanced fundamental apparent power component corresponding to node k , and S u 1 s is the corresponding to the source. In the same way, S b H is the balanced harmonic apparent power, and S u H is the unbalanced harmonic apparent power. They are calculated as follows:
S u 1 2 = 9 V b 1 2 I u 1 2 + V u 1 2 I b 1 2 + V u 1 2 I u 1 2
S b H 2 = 9 V b 1 2 I b H 2 + V b H 2 I b 1 2 + V b H 2 I b H 2
S u H 2 = S e 2 S b 1 2 S u 1 2 S b H 2
where:
S e 2 = 3 V e I e 2
V e 2 = V b 1 2 + V u 1 2 + V b H 2 + V u H 2
I e 2 = I b 1 2 + I u 1 2 + I b H 2 + I u H 2
And:
S b 1 2 = 9 V b 1 2 I b 1 2
where V b 1 and I b 1 are the fundamental balanced components of voltage and current, V u 1 and I u 1 are the fundamental unbalanced components, V b H and I b H are the balanced harmonic components, and V b H and I b H are the unbalanced harmonic components, according to [71].
Regarding the last term in Equation (1), the HGI introduced here differs slightly from that presented in [4]. The one corresponding to the one proposed in [71] is as follows:
H G I m = I ¯ L I ¯ S
where I ¯ S is the vector of the harmonic powers flowing from the supply towards the load, and I ¯ L is the vector of the three-phase collective root-mean-square (RMS) values of the current components associated to the harmonic active powers flowing back from the load to the supply, as stated in [4].
The concept presented in [71] is innovative in that it takes into account apparent power components that are fundamentally unbalanced, balanced harmonic, and unbalanced harmonic for every consumer with respect to these identical network components. Unlike other indices that are prone to errors in the selection of these variables, this technique allows for the exact registration of the distortion and imbalance condition of the complete energy system without requiring the introduction of weight factors for every T h e t 3 component. But, similar to the remaining two distributed measuring indicators, it is expected that the division result is set to 1 if the denominator of a phrase drops below 10 4 in order to avoid any potential problems that may arise from the division by zero.
The index T h e t 3 reaches a value of 1 if the supply voltages are balanced and sinusoidal and the load attached to a generic branch “k” is balanced and linear. Each term of the T h e t 3 k index indicates the ratio between an index measured in one of the lines supplying each load and the corresponding index measured in the supply line at the PCC. When the T h e t 3 k rises, it means that load “k” is the source of the disturbance; when it falls, it means that the source is the supply. Consequently, T h e t 3 = 1 acts as a threshold between the load that is creating the disturbance ( T h e t 3 > 1 ) and the load that is being disturbed ( T h e t 3 < 1 ).

3.2. Load Characterization Index and Unbalanced Current Ratio

In [70], an algorithm to identify imbalance sources (the unbalanced current ratio, UCR) which is based on the load characterization index (LCI) for identifying perturbation sources [42] is presented. They both are complementary and rely on the decomposition of the current at the input of each node into different components: a non-linear, a balanced linear, and an unbalanced linear one.
The method to calculate the LCI is based on considering two groups of linear models of the load connected to each node. The first one is the corresponding to an inductive linear load, Figure 1, and the second one to a capacitive linear load, Figure 2. Considering that a general load can be non-linear, both models are complemented with a non-linear source (current or voltage according to the model). Each model is tested with a wide range of values of each linear element and the closest to the real load is calculated as the one with a lower non-linear component. If one of them presents a null non-linear component, the LCI value is 0 (and the load is considered linear). Otherwise, the load is considered non-linear and the number assigned to the LCI is as follows:
L C I = I n l I · 100
where I and I n l are shown in Figure 1.
Once LCI has been calculated, the current component I l has also been calculated. It is called the linear current and corresponds to the difference between the total current I and the non-linear current component I n l , all of which correspond to the circuit where the component I n l is minimized. The component I l may be broken down into two parts, the balanced linear I b l and the unbalanced one I u n , according to [70]. Thus, UCR has the next value:
U C R = I u n I · 100
Each current component can be identified in Figure 3, from [70].

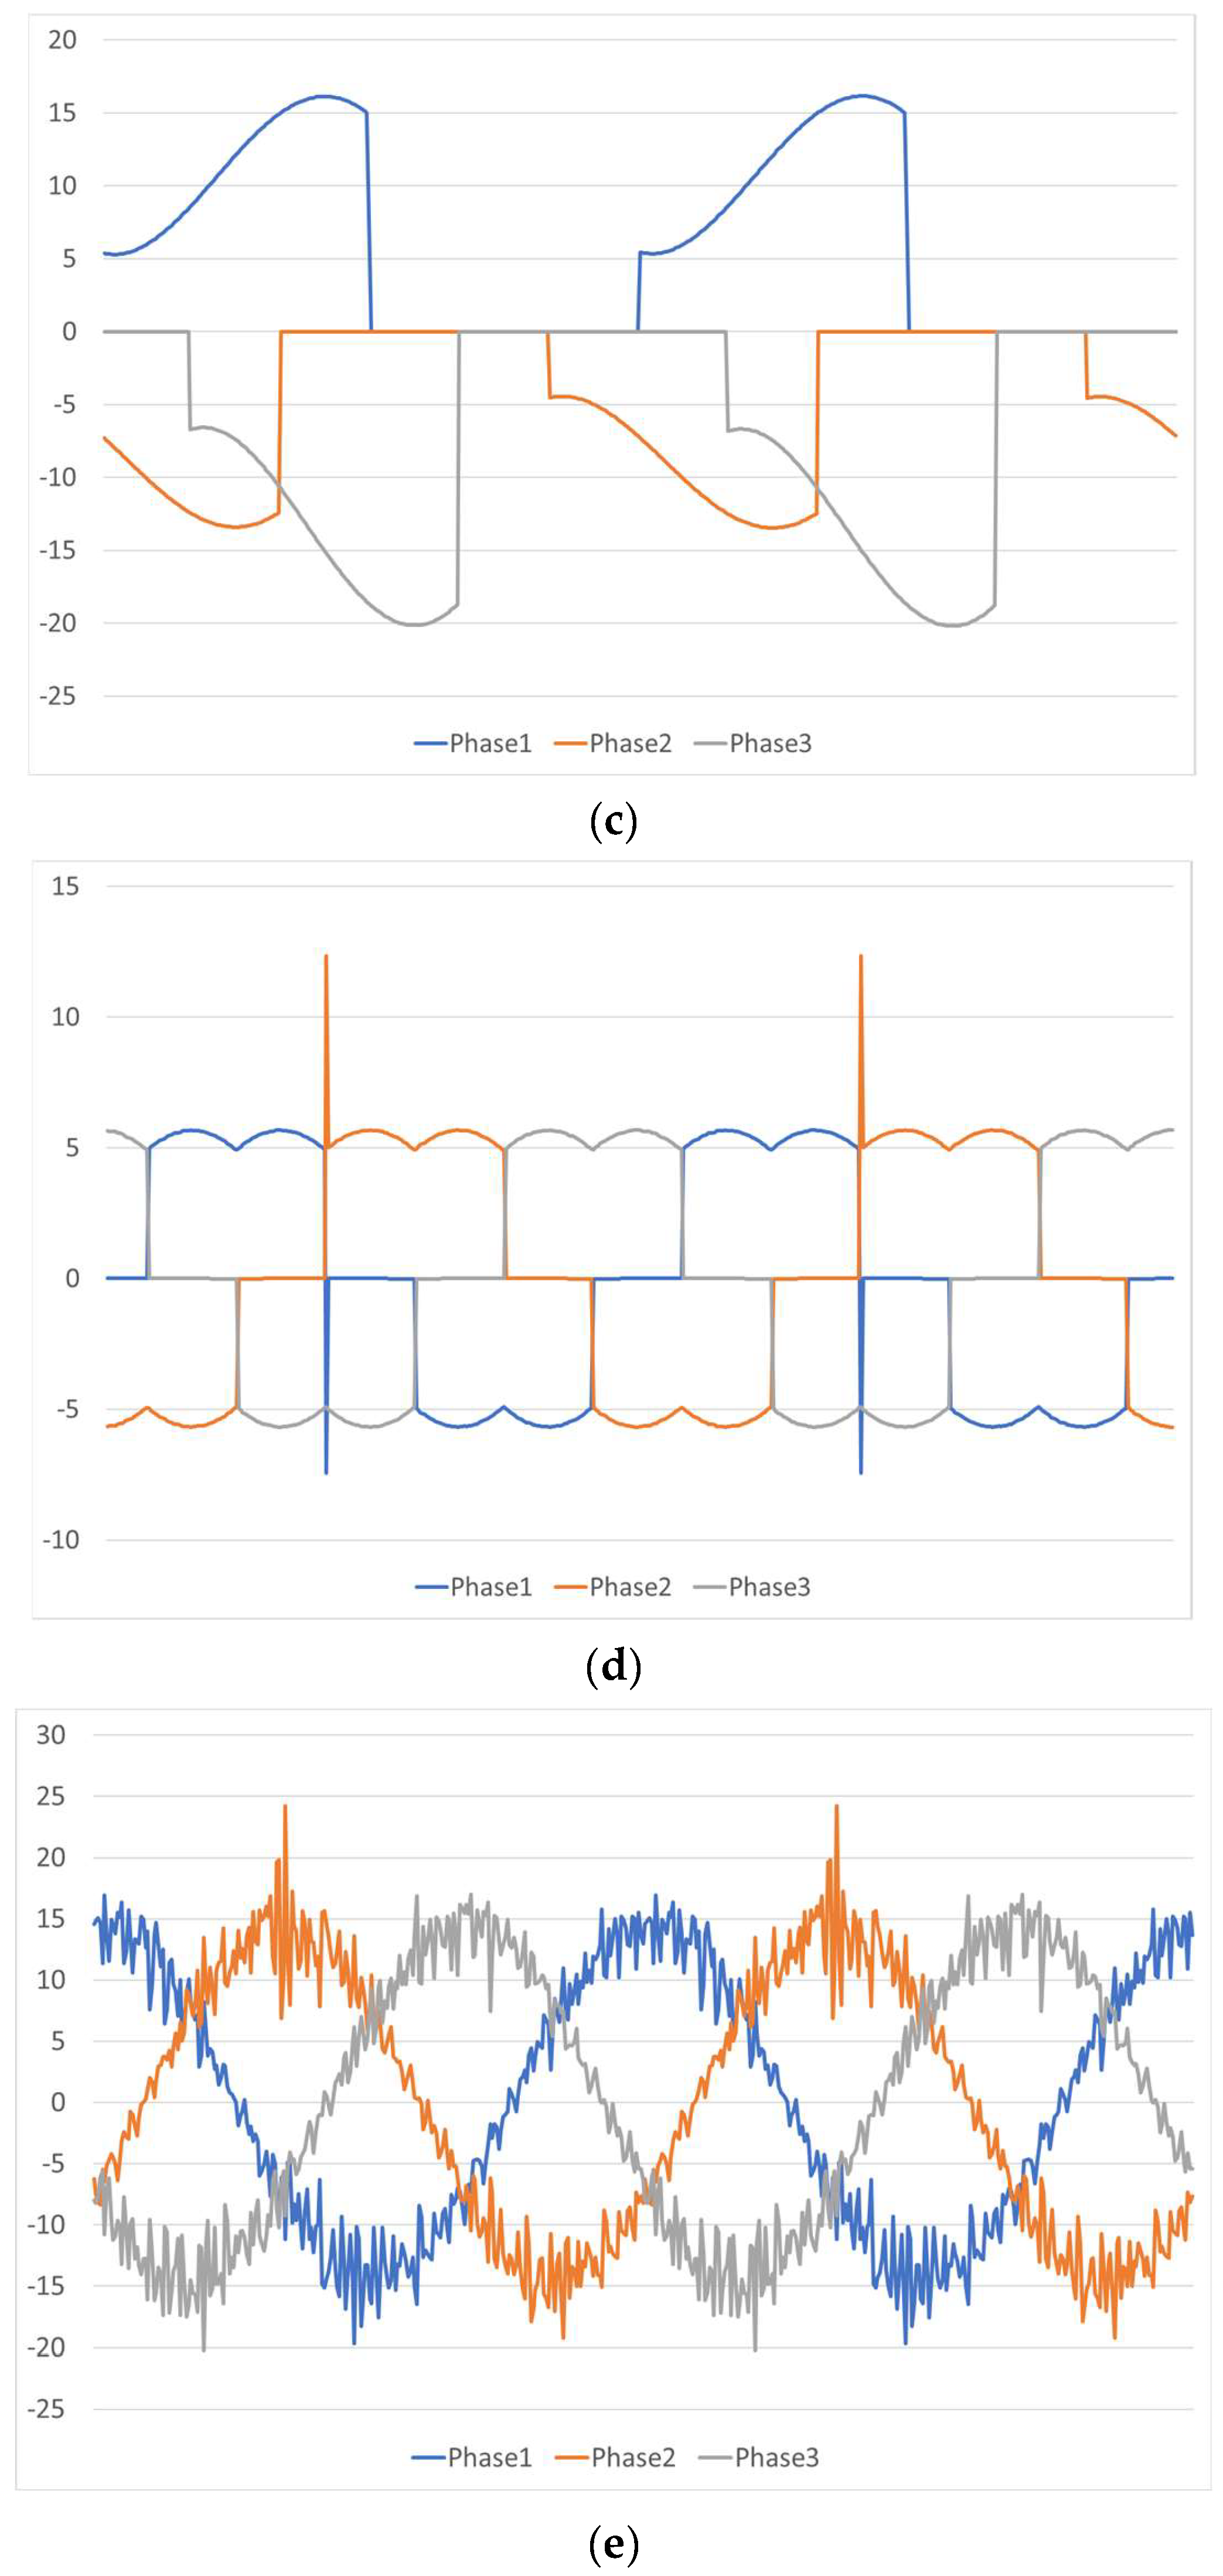
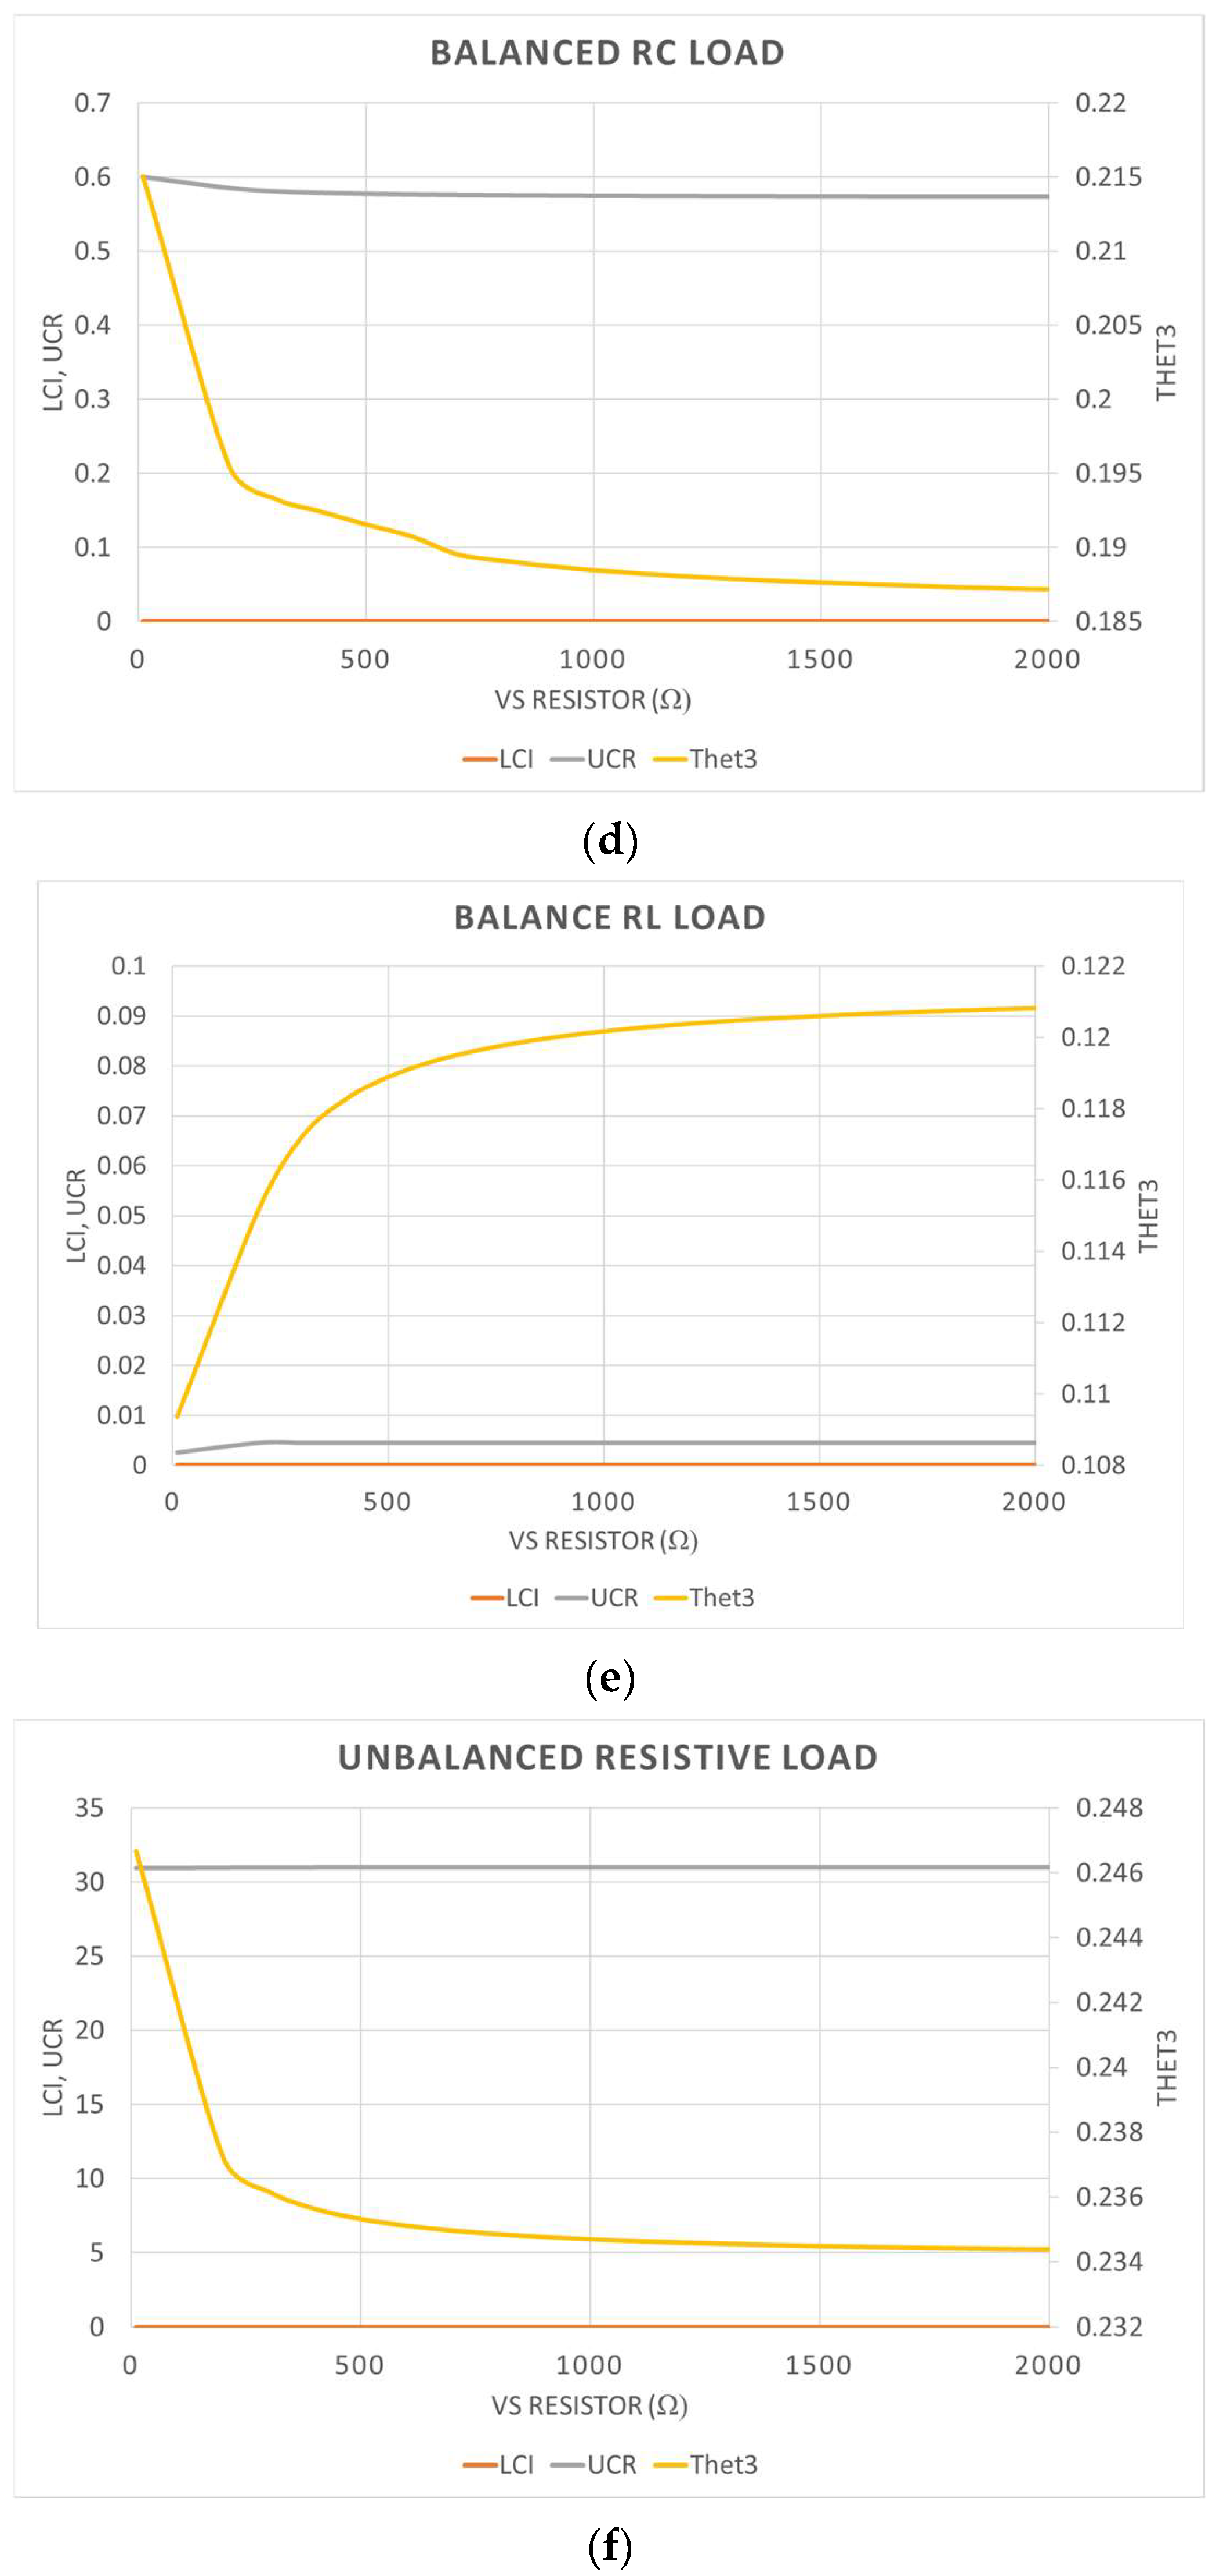
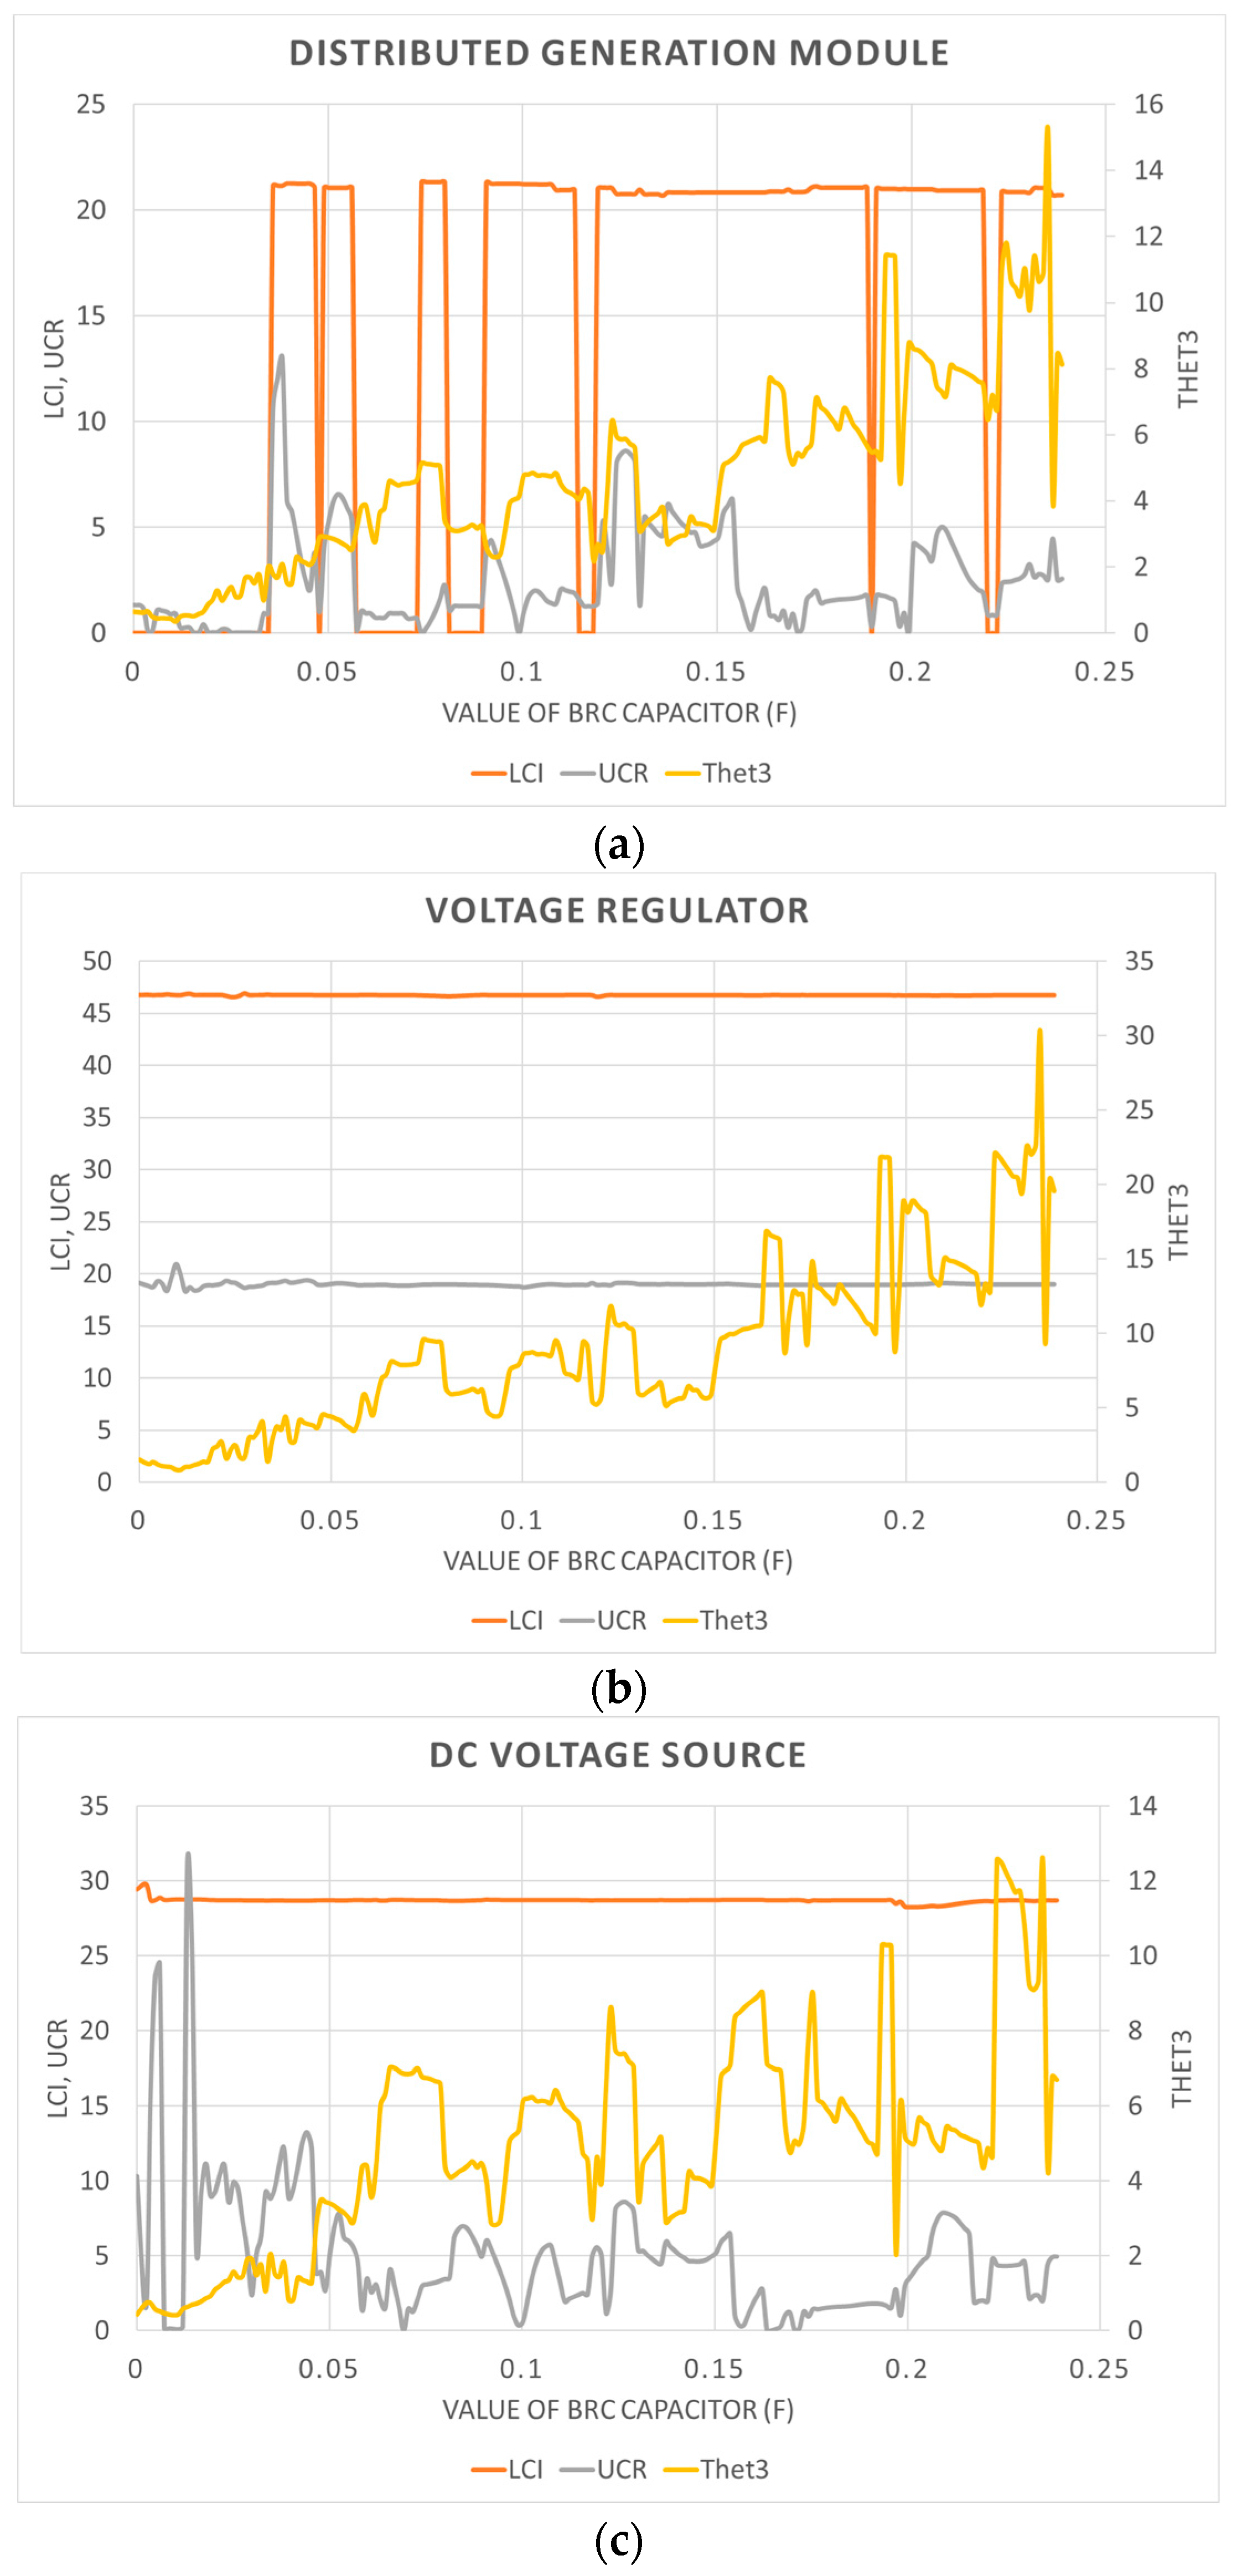
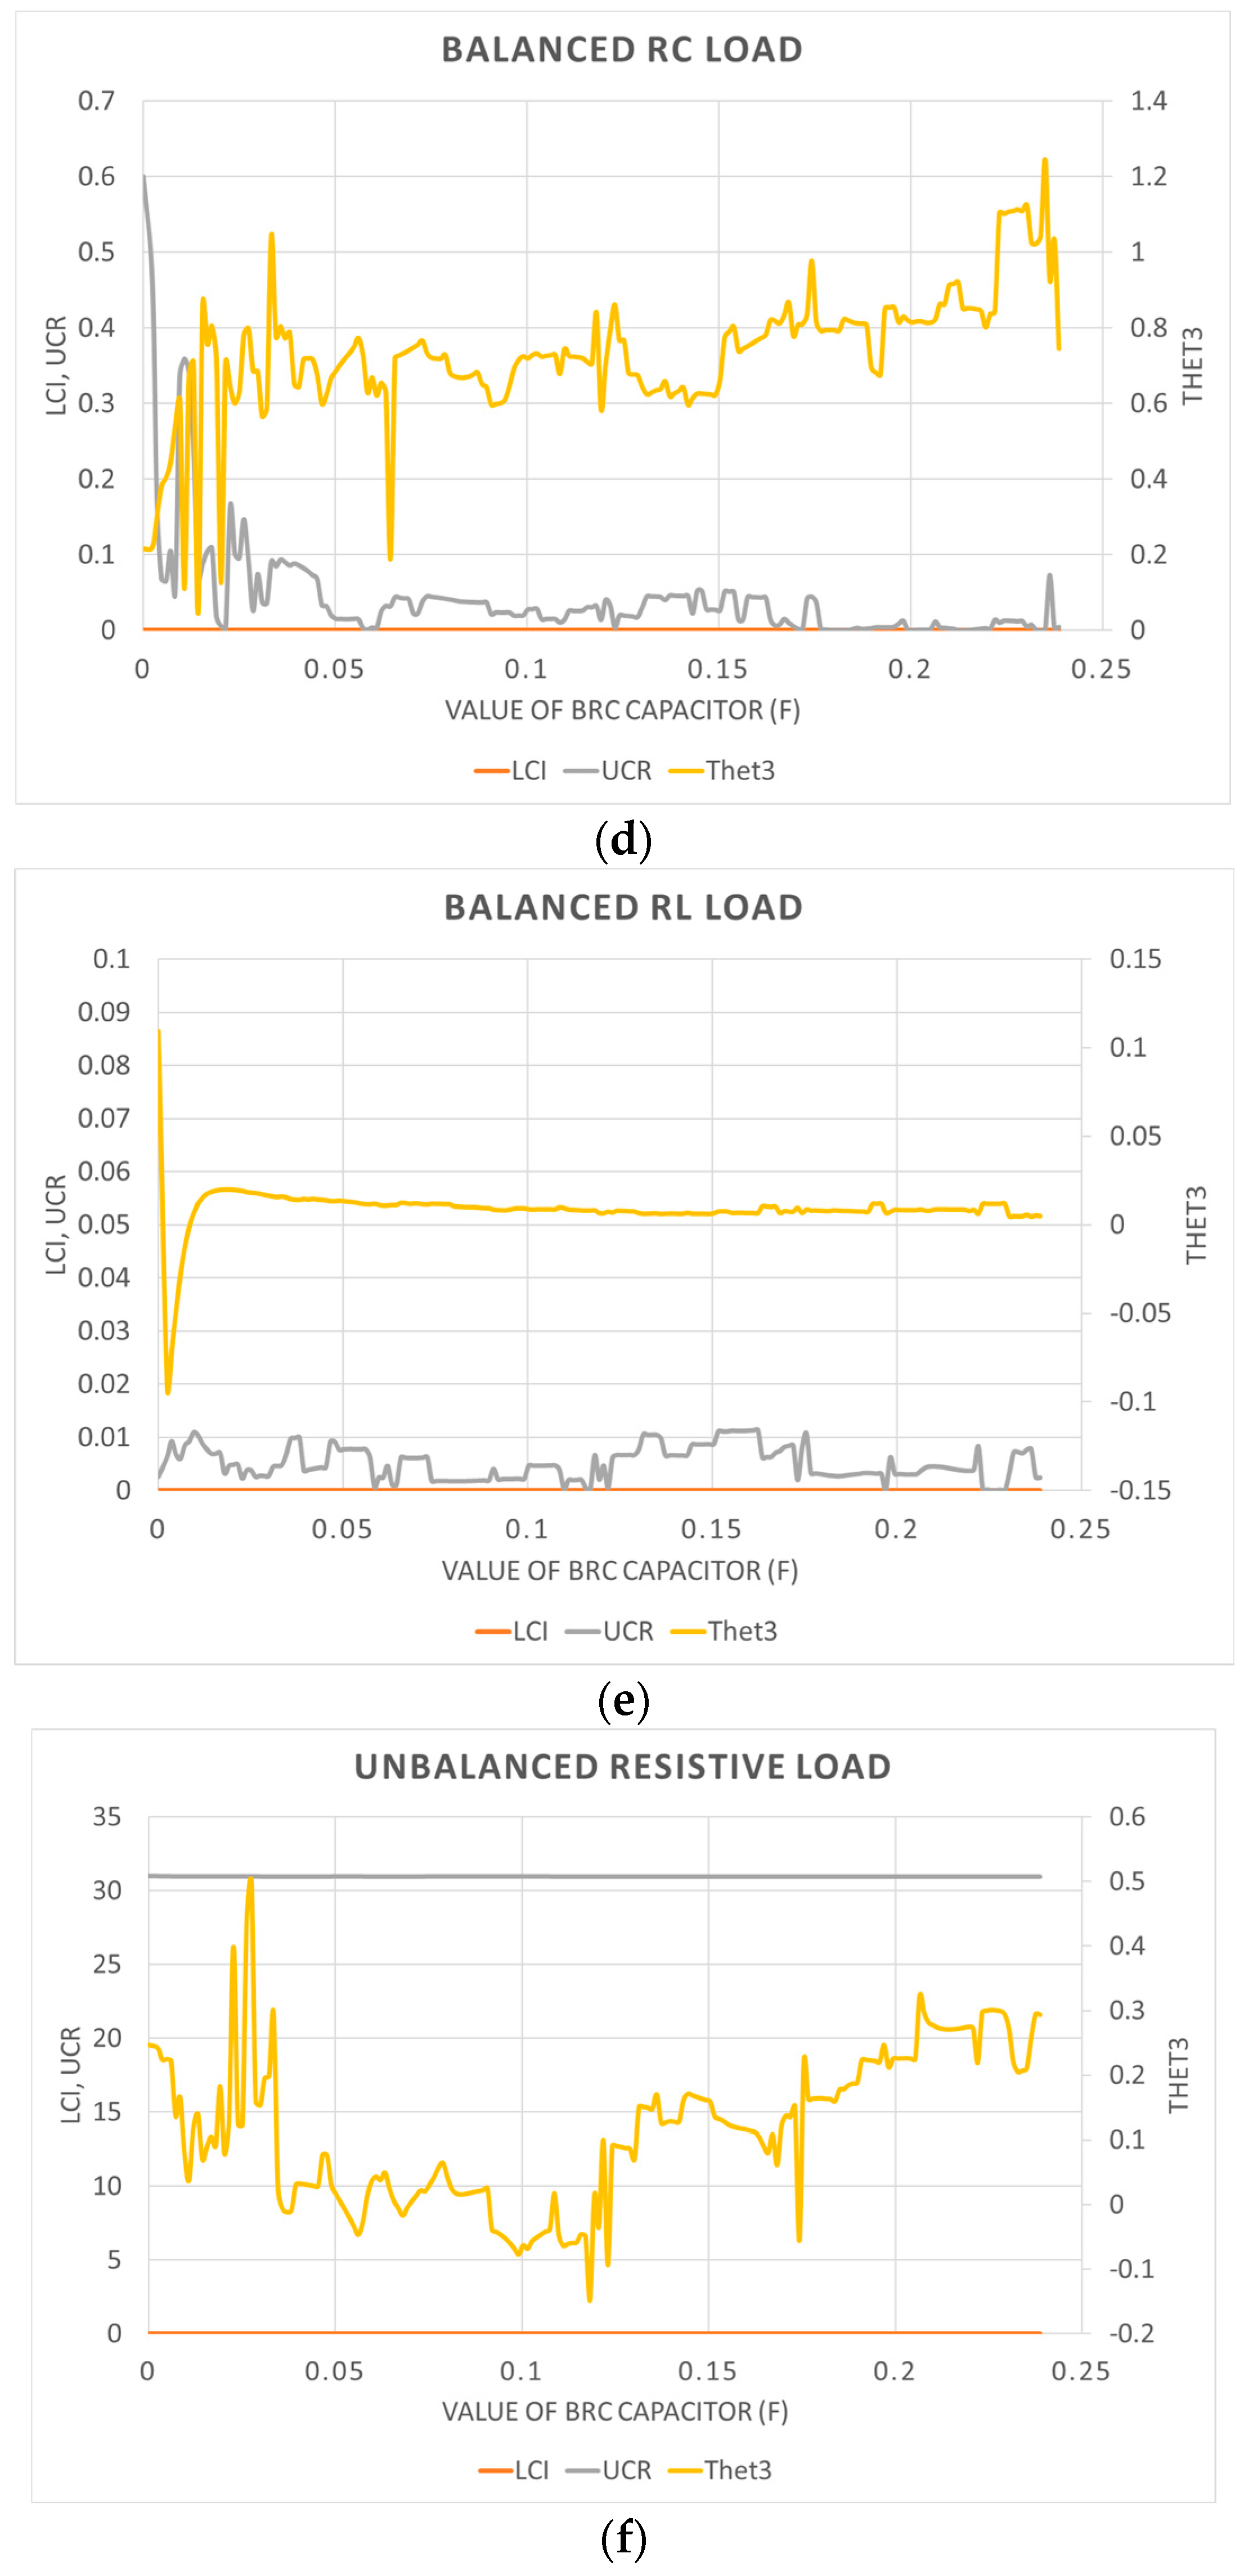
4. Results Obtained from the Application of Both Indices to a Simulation System

Both procedures to identify distorting and unbalancing loads presented in Section 3 have been applied to the system shown in Figure 4, where linear and non-linear loads can be seen, as well as balanced and unbalanced loads. In fact, the first equipment is an inverter injecting power to the system. The second one is constituted by three voltage regulators with an inductive load on the right side. The values of the impedances are different in each phase, and, thus, the load is unbalanced. The third equipment is a three-phase rectifier with a capacitive impedance on the DC side. The fourth is a linear balanced capacitive load. The fifth is a linear and balanced inductive impedance, and the last one is an unbalanced resistive load. The value of each element is presented in Table 3.
This installation represents a microgrid connected to a strong PCC of the power system. Thus, the non-linear and the unbalanced loads do not affect the voltage in the PCC, which remains balanced and sinusoidal. And this installation has been chosen because it represents the simplest conditions in which the indices have to identify the distortion and/or imbalance sources. However, the study would not be complete if the indices were applied to those loads with specific values of their parameters. Thus, the values corresponding to some of those elements have been modified as follows:
-
To assess different levels of the linear capacitive load, the value of the fifth load capacitor has been changed from 2.387 µF to 238.7 mF in 200 steps;
-
To assess the rectifier load with different weights in the global microgrid, the value of its resistor has been changed from 10 to 2000 in 20 steps.
Thus, 220 cases have been analyzed. In Figure 5, waveforms corresponding to the equipment values shown in Table 3 are presented. The waveforms are the voltage in the PCC (a) and the current at the input of each equipment connected to the PCC (b to g). The current at the input of UR (g) presents the same form as the voltage, corresponding to a resistive linear load, and the imbalance can clearly be observed. The current at the input of BRI (f) is balanced and sinusoidal and that at the input of VR and DCVS (c and d) are clearly non-sinusoidal, although with very different waveforms in each one. In addition, the one corresponding to VR (c) shows imbalance. Regarding the current at the input of the equipment which injects power to the microgrid, DGM (b), the waveform looks sinusoidal with high-order harmonics. Finally, with respect to the BRC load (e), the corresponding waveform looks non-sinusoidal because, although the capacitor is a linear load, it amplifies the voltage harmonics at its input. This is one of the facts that make it really difficult to find an index which does not identify a linear capacitive load as non-linear and, thus, distorting. Therefore, the electrical installation chosen for the tests contains all the types of loads necessary to confirm whether the indices work correctly: a linear balanced inductive load, a linear balanced capacitive load, a linear unbalanced resistive load, a non-linear balanced load, and a non-linear unbalanced load.
To assess the behavior of the different indices with changing values of some parameters, the results corresponding to the 220 cases indicated above are presented in Figure 6 and Figure 7. Specifically, in Figure 6, the evolution of the indices corresponding to the different loads with a changing vale of the DCVS resistor is shown. The rest of the parameters keep the value shown in Table 3. In Figure 7, the evolution of the indices corresponding to the different loads with a changing value of the capacitor in the BRC is presented. As in the earlier case, the rest of parameters keep the value shown in Table 3.
In all the graphs presented in Figure 6 and Figure 7, LCI and UCR refer to the main vertical axis and Thet3 to the secondary. This is because LCI and UCR are concentrated indices which provide absolute values and Thet3 is a distributed index which provides a value which refers to the same value at the PCC. If the load evaluated is balanced and linear, the Thet3 value is lower than the unity and higher otherwise.
It can be seen that LCI and UCR properly identify the voltage regulator; i.e., they provide a constant value of 47 and 20, respectively (Figure 6 and Figure 7b). These indices also identify the BRC and BRL as linear and balanced. LCI provides a null value in both cases, and UCR an almost null value (Figure 6 and Figure 7d,e). With respect to the UR load (Figure 6 and Figure 7f), UCR gives a value of 30 and LCI 0, which correspond to an unbalanced linear load. Regarding the DC Voltage Source (Figure 6 and Figure 7c), LCI provides a value of 30, which means that the equipment connected to this node introduces distortion in the installation. However, UCR gives a changing value from 0 to 30 as if the load would introduce imbalance. However, the actual load is non-linear and balanced.
With respect to the index Thet3, the value provided by this index in all the cases is very variable, with a low stability. In the case of the voltage regulator (Figure 6 and Figure 7b), the value provided by Thet3 varies from 1 to 30 and it does not present any regular evolution. Regarding the linear loads (Figure 6 and Figure 7d,e), Thet3 provides a value less than 1 in almost all the cases assessed. Finally, with respect to the DC voltage source, Thet3 provides a value less than one in Figure 6c and higher in Figure 7c. The imbalance in the resistive load is not identified by Thet3 (Figure 6 and Figure 7f).
Finally, regarding the distributed generation module (Figure 6 and Figure 7a), the behavior of the indices is difficult to evaluate because it is not a linear load, although it is not a traditional non-linear one. The results are not clear and cannot be easily interpreted.
In summary, LCI identifies the distortion sources in all the cases studied and UCR identifies the unbalanced linear loads, although it identifies them as unbalanced non-linear loads when they are actually balanced. However, with respect to Thet3:
-
It does not identify the unbalanced loads when they are linear; i.e., the value of this index assigned to the unbalanced resistive load is less than 1 in all the studied cases.
-
It identifies as the distortion source the capacitive linear load in some of the cases studied.
-
It identifies as distortion sources the voltage regulator in all the cases studied. However, it does not identify the DC voltage source as a distortion source (see Figure 6c). In addition, it cannot be corroborated if the index identifies the imbalance in the non-linear load because the value provided is higher than one without providing additional information.

5. Discussion

A technical review has been carried out in this work to identify from the technical literature the indices which identify distortion and imbalance sources in an electrical installation. From the technical review, two indices were found: the pair LCI/UCR and the denominated Thet3. Both are published in the literature as indices able to identify distortion and imbalance sources. LCI and UCR are complementarily calculated. They are concentrated indices and provide a value as high as the distortion/imbalance injected by the assessed load to the installation. In addition, the existence of two separated indices makes possible the identification of both distortion and imbalance because the value of one corresponds to the distortion and the other to the imbalance.
With respect to Thet3, it is presented in the technical literature as a distributed index to identify distortion and imbalance sources in a microgrid. Thus, this index provides a number lower than the unity if the load analyzed is not a balanced linear load, and higher than unity otherwise. However, it is not possible to conclusively determine if the index identifies both distortion and imbalance sources, as only a singular value is provided, rendering it uncertain whether it corresponds to distortion or imbalance. Consequently, the values exceeding unity obtained in the instances of unbalanced and non-linear loads (the voltage regulator) cannot be thoroughly analyzed.
The results presented in the previous section show that LCI identifies the distortion sources in all the cases studied, although UCR identifies as unbalanced loads those that are actually balanced in some cases of non-linear loads; see the figures corresponding to the DC voltage source in Figure 6 and Figure 7. LCI and UCR identify the unbalanced loads if they are linear (resistive, inductive, or capacitive). Those results also show that Thet3 identifies as distortion/imbalance sources some loads (the voltage regulator), although not all of them (the DC voltage regulator is not identified as a distortion source) in all the cases studied. In addition, Thet3 identifies as linear balanced the unbalanced resistive load and as a distortion/imbalance source the balanced linear capacitive load. In addition, the values provided by LCI/UCR are much more stable than those provided by Thet3.
Finally, it must be considered that a concentrated index can be converted into a distributed one, relativizing the value corresponding to each load to the same value corresponding to the PCC.

6. Conclusions

In this paper, the algorithms previously published in the technical literature to identify distortion and imbalance sources in an electrical installation have been chosen and compared. Two algorithms have been found: the first is concentrated and the other is distributed. Both algorithms have been applied to an electrical system constituted by different kinds of loads and the results have been presented and discussed. As a summary, it can be said that none of them manage to identify distortion and imbalance sources in all the cases, although one of them, the pair LCI/UCR, presents a good performance because the ratio of fails is smaller and because the values provided for each kind of load remain constant with changes in the parameters of other loads. Considering that none of the indices in the technical literature considered in the review are able to identify both the distortion and imbalance source in a basic electrical installation with a strong point of common connection to the power system, the next step in this research would be the study of new indices which provide better results. In any case, taking into account the good results presented by LCI, the next step could be improve UCR and testing both in installations with challenging loads and with distorted and/or unbalanced voltage. These conditions would represent electrical microgrids and more common installations in the power system.

Author Contributions

Conceptualization, R.S.-H. and J.R.V.; methodology, R.S.-H.; software, R.S.-H., G.G.-R. and J.C.-C.; validation, G.G.-R. and J.C.-C.; formal analysis, R.S.-H.; investigation, R.S.-H. and J.R.V.; resources, G.G.-R. and J.C.-C.; data curation, R.S.-H., G.G.-R. and J.C.-C.; writing—original draft preparation, R.S.-H.; writing—review and editing, R.S.-H.; visualization, G.G.-R. and J.C.-C.; supervision, R.S.-H.; project administration, R.S.-H. and J.R.V. All authors have read and agreed to the published version of the manuscript.

Funding

This paper is framed in the project “Development of a system based on Industrial IoT for the analysis of electrical power in power systems” funded by the European Commission (EU), the University of Huelva (Q7150008F) and the Andalusia Government. The author Gabriel Gómez-Ruiz is enjoying a FPU grant funded by the Spanish Ministry of Universities for training of university teaching staff in his PhD period. Additionally, the author Jesus Clavijo-Camacho is currently benefiting from an “INVESTIGO” research fellowship funded by the European Union - NextGenerationEU.

Conflicts of Interest

The authors declare no conflicts of interest.

References

  1. Zhu, K.; Wang, Y.; Yin, P.; Ni, J. Voltage sag source location technology based on corresponding sequence components. IET Gener. Transm. Distrib. 2015, 9, 820–827. [Google Scholar] [CrossRef]
  2. Kuwałek, P. Selective Identification and Localization of Voltage Fluctuation Sources in Power Grids. Energies 2021, 14, 6585. [Google Scholar] [CrossRef]
  3. Tee, W.; Yusoff, M.R.; Abdullah, A.R.; Yaakub, M.F. Voltage Variation Signals Source Identification and Diagnosis Method. Int. J. Adv. Comput. Sci. Appl. (IJACSA) 2019, 10, 170–180. [Google Scholar] [CrossRef]
  4. Muscas, C. Assessment of electric power quality: Indices for identifying disturbing loads. Eur. Trans. Electr. Power 1998, 8, 287–292. [Google Scholar] [CrossRef]
  5. Tanaka, T.; Akagi, H. A new method of harmonic power detection based on the instantaneous active power in three-phase circuits. IEEE Trans. Power Deliv. 1995, 10, 1737–1742. [Google Scholar] [CrossRef]
  6. Emanuel, A.E. On the assessment of harmonic pollution [of power systems]. IEEE Trans. Power Deliv. 1995, 10, 1693–1698. [Google Scholar] [CrossRef]
  7. Swart, P.H.; Case, M.J.; Van Wyk, J.D. On techniques for localization of sources producing distortion in electric power networks. Eur. Trans. Electr. Power 1994, 4, 485–489. [Google Scholar] [CrossRef]
  8. Swart, P.H.; van Wyk, J.D.; Case, M.J. On techniques for localization of sources producing distortion in three-phase networks. Eur. Trans. Electr. Power 1996, 6, 391–396. [Google Scholar] [CrossRef]
  9. Rens, A.P.J.; Swart, P.H. On techniques for the localisation of multiple distortion sources in three-phase networks: Time domain verification. Eur. Trans. Electr. Power 2001, 11, 317–322. [Google Scholar] [CrossRef]
  10. Farach, J.E.; Grady, W.M.; Arapostathis, A. An optimal procedure for placing sensors and estimating the locations of harmonic sources in power systems. IEEE Trans. Power Deliv. 1993, 8, 1303–1310. [Google Scholar] [CrossRef]
  11. Heydt, G.T. Identification of harmonic sources by a state estimation technique. IEEE Trans. Power Deliv. 1989, 4, 569–576. [Google Scholar] [CrossRef]
  12. Davis, E.J.; Emanuel, A.E.; Pileggi, D.J. Harmonic pollution metering: Theoretical considerations. IEEE Trans. Power Deliv. 2000, 15, 19–23. [Google Scholar] [CrossRef]
  13. Cristaldi, L.; Ferrero, A.; Salicone, S. A distributed system for electric power quality measurement. IEEE Trans. Instrum. Meas. 2002, 51, 776–781. [Google Scholar] [CrossRef]
  14. Sinvula, R.; Abo-Al-Ez, K.M.; Kahn, M.T. Harmonic Source Detection Methods: A Systematic Literature Review. IEEE Access 2019, 7, 74283–74299. [Google Scholar] [CrossRef]
  15. Safargholi, F.; Malekian, K.; Schufft, W. On the Dominant Harmonic Source Identification— Part I: Review of Methods. IEEE Trans. Power Deliv. 2018, 33, 1268–1277. [Google Scholar] [CrossRef]
  16. Safargholi, F.; Malekian, K.; Schufft, W. On the Dominant Harmonic Source Identification—Part II: Application and Interpretation of Methods. IEEE Trans. Power Deliv. 2018, 33, 1278–1287. [Google Scholar] [CrossRef]
  17. de Andrade, G.V., Jr.; Naidu, S.R.; Neri, M.G.G.; da Costa, E.G. Estimation of the Utility’s and Consumer’s Contribution to Harmonic Distortion. IEEE Trans. Instrum. Meas. 2009, 58, 3817–3823. [Google Scholar] [CrossRef]
  18. Pyzalski, T.; Lukomski, R.; Wilkosz, K. Utilization of the voltage rate to localization of harmonic sources in a power system. In Proceedings of the 12th IEEE Mediterranean Electrotechnical Conference (IEEE Cat. No.04CH37521), Dubrovnik, Croatia, 12–15 May 2004; IEEE: Dubrovnik, Croatia, 2004; Volume 3, pp. 1091–1094. [Google Scholar] [CrossRef]
  19. Thunberg, E.; Soder, L. A Norton approach to distribution network modeling for harmonic studies. IEEE Trans. Power Deliv. 1999, 14, 272–277. [Google Scholar] [CrossRef]
  20. Tsukamoto, M.; Ogawa, S.; Natsuda, Y.; Minowa, Y.; Nishimura, S. Advanced technology to identify harmonics characteristics and results of measuring. In Proceedings of the Ninth International Conference on Harmonics and Quality of Power. Proceedings (Cat. No. 00EX441), Orlando, FL, USA, 1–4 October 2000; Volume 1, pp. 341–346. [Google Scholar] [CrossRef]
  21. Chen, C.; Liu, X.; Koval, D.; Xu, W.; Tayjasanant, T. Critical impedance method—A new detecting harmonic sources method in distribution systems. IEEE Trans. Power Deliv. 2004, 19, 288–297. [Google Scholar] [CrossRef]
  22. Srinivasan, K. On separating customer and supply side harmonic contributions. IEEE Trans. Power Deliv. 1996, 11, 1003–1012. [Google Scholar] [CrossRef]
  23. Srinivasan, K.; Jutras, R. Conforming and non-conforming current for attributing steady state power quality problems. IEEE Trans. Power Deliv. 1998, 13, 212–217. [Google Scholar] [CrossRef]
  24. Dell’Aquila, A.; Marinelli, M.; Monopoli, V.G.; Zanchetta, P. New power-quality assessment criteria for supply systems under unbalanced and nonsinusoidal conditions. IEEE Trans. Power Deliv. 2004, 19, 1284–1290. [Google Scholar] [CrossRef]
  25. Locci, N.; Muscas, C.; Sulis, S. On the Measurement of Power Quality Indexes for Harmonic Distortion in the Presence of Capacitors. In Proceedings of the 2005 IEEE Instrumentationand Measurement Technology Conference Proceedings, Ottawa, ON, Canada, 16–19 May 2005; Volume 3, pp. 1600–1605. [Google Scholar] [CrossRef]
  26. Torreglosa, J.P.; García-Triviño, P.; Fernández-Ramirez, L.M.; Jurado, F. Control strategies for DC networks: A systematic literature review. Renew. Sustain. Energy Rev. 2016, 58, 319–330. [Google Scholar] [CrossRef]
  27. Moher, D.; Liberati, A.; Tetzlaff, J.; Altman, D.G. PRISMA Group Preferred reporting items for systematic reviews and meta-analyses: The PRISMA statement. PLoS Med. 2009, 6, e1000097. [Google Scholar] [CrossRef] [PubMed]
  28. Zang, T.; He, Z.; Fu, L.; Wang, Y.; Qian, Q. Adaptive method for harmonic contribution assessment based on hierarchical K-means clustering and Bayesian partial least squares regression. IET Gener. Transm. Distrib. 2016, 10, 3220–3227. [Google Scholar] [CrossRef]
  29. Farhoodnea, M.; Mohamed, A.; Shareef, H.; Zayandehroodi, H. An enhanced method for contribution assessment of utility and customer harmonic distortions in radial and weakly meshed distribution systems. Int. J. Electr. Power Energy Syst. 2012, 43, 222–229. [Google Scholar] [CrossRef]
  30. Nassif, A.B.; Yong, J.; Mazin, H.; Wang, X.; Xu, W. An Impedance-Based Approach for Identifying Interharmonic Sources. IEEE Trans. Power Deliv. 2011, 26, 333–340. [Google Scholar] [CrossRef]
  31. Farhoodnea, M.; Azah, M.; Shareef, H.; Jabbar Khan, R. An Improved Method for Determining Contribution of Utility and Customer Harmonic Distortions in a Power Distribution System. Int. J. Electr. Eng. Inform. 2010, 2, 204–215. [Google Scholar] [CrossRef]
  32. Park, J.-I.; Lee, H.; Yoon, M.; Park, C.-H. A Novel Method for Assessing the Contribution of Harmonic Sources to Voltage Distortion in Power Systems. IEEE Access 2020, 8, 76568–76579. [Google Scholar] [CrossRef]
  33. Safargholi, F.; Malekian, K. Relevant Factors for Evaluation of the Harmonic Responsibility of Utility and Customer. IEEE Trans. Power Deliv. 2021, 36, 124–134. [Google Scholar] [CrossRef]
  34. dos Santos, A.C.; Santos, I.N.; de Oliveira, J.C. Capacitor switching methodology for responsibility sharing of harmonic voltage distortions. Int. Trans. Electr. Energy Syst. 2019, 29, e12135. [Google Scholar] [CrossRef]
  35. Fernandes, R.A.S.; Oleskovicz, M.; Da Silva, I.N. Harmonic Source Location and Identification in Radial Distribution Feeders: An Approach Based on Particle Swarm Optimization Algorithm. IEEE Trans. Ind. Inform. 2022, 18, 3171–3179. [Google Scholar] [CrossRef]
  36. D’Antona, G.; Muscas, C.; Pegoraro, P.A.; Sulis, S. Harmonic source estimation in distribution systems. In Proceedings of the 2010 IEEE International Workshop on Applied Measurements for Power Systems, Aachen, Germany, 22–24 September 2010; pp. 59–63. [Google Scholar] [CrossRef]
  37. D’Antona, G.; Muscas, C.; Sulis, S. Localization of nonlinear loads in electric systems through harmonic source estimation. In Proceedings of the 2009 IEEE Instrumentation and Measurement Technology Conference, Singapore, 5–7 May 2009; pp. 390–395. [Google Scholar] [CrossRef]
  38. Carta, D.; Muscas, C.; Pegoraro, P.A.; Solinas, A.V.; Sulis, S. Compressive Sensing-Based Harmonic Sources Identification in Smart Grids. IEEE Trans. Instrum. Meas. 2021, 70, 1–10. [Google Scholar] [CrossRef]
  39. Tang, K.; Shen, C. Method for detecting harmonic responsibility misjudgements based on waveform correlation analysis. IET Gener. Transm. Distrib. 2019, 13, 1545–1554. [Google Scholar] [CrossRef]
  40. Dağ, O.; Uçak, C.; Usta, Ö. Harmonic source location and meter placement optimization by impedance network approach. Electr. Eng. 2012, 94, 1–10. [Google Scholar] [CrossRef]
  41. Beites, L.F.; Alvarez, M.; Díaz, A. Sensor optimum location algorithm for estimating harmonic sources injection in electrical networks. In Proceedings of the International Conference on Renewable Energies and Power Quality (ICREPQ’14), Cordoba, Spain, 8–10 April 2014. [Google Scholar]
  42. Herrera, R.S.; Salmerón, P. Harmonic disturbance identification in electrical systems with capacitor banks. Electr. Power Syst. Res. 2012, 82, 18–26. [Google Scholar] [CrossRef]
  43. Moradifar, A.; Akbari Foroud, A.; Fouladi, M. Identification of multiple harmonic sources in power system containing inverter-based distribution generations using empirical mode decomposition. IET Gener. Transm. Distrib. 2019, 13, 1401–1413. [Google Scholar] [CrossRef]
  44. Safargholi, F.; Malekian, K.; Schufft, W. “Voltage-Current Ratio Difference” Concept for identifying the dominant harmonic source. Int. J. Electr. Power Energy Syst. 2020, 121, 106147. [Google Scholar] [CrossRef]
  45. Nath, S.; Sinha, P.; Goswami, S.K. A wavelet based novel method for the detection of harmonic sources in power systems. Int. J. Electr. Power Energy Syst. 2012, 40, 54–61. [Google Scholar] [CrossRef]
  46. Xu, F.; Yang, H.; Zhao, J.; Wang, Z.; Liu, Y. Study on Constraints for Harmonic Source Determination Using Active Power Direction. IEEE Trans. Power Deliv. 2018, 33, 2683–2692. [Google Scholar] [CrossRef]
  47. Wang, B.; Ma, G.; Xiong, J.; Zhang, H.; Zhang, L.; Li, Z. Several Sufficient Conditions for Harmonic Source Identification in Power Systems. IEEE Trans. Power Deliv. 2018, 33, 3105–3113. [Google Scholar] [CrossRef]
  48. Ferrero, A.; Prioli, M.; Salicone, S. Fuzzy Metrology-Sound Approach to the Identification of Sources Injecting Periodic Disturbances in Electric Networks. IEEE Trans. Instrum. Meas. 2011, 60, 3007–3017. [Google Scholar] [CrossRef]
  49. Moradifar, A.; Akbari Foroud, A.; Gorgani Firouzjah, K. Comprehensive identification of multiple harmonic sources using fuzzy logic and adjusted probabilistic neural network. Neural Comput. Appl. 2019, 31, 543–556. [Google Scholar] [CrossRef]
  50. Tian, M.; Wang, Y.; Li, J. Comprehensive Harmonic Responsibility Calculation Based on Different Weighting Methods. Energies 2019, 12, 4449. [Google Scholar] [CrossRef]
  51. Cataliotti, A.; Cosentino, V. A New Measurement Method for the Detection of Harmonic Sources in Power Systems Based on the Approach of the IEEE Std. 1459–2000. IEEE Trans. Power Deliv. 2010, 25, 332–340. [Google Scholar] [CrossRef]
  52. Stevanović, D.; Petković, P. A single-point method based on distortion power for the detection of harmonic sources in a power system. Metrol. Meas. Syst. 2014, 21, 3–14. [Google Scholar] [CrossRef]
  53. Karimzadeh, F.; Esmaeili, S.; Hosseinian, S.H. Method for determining utility and consumer harmonic contributions based on complex independent component analysis. IET Gener. Transm. Distrib. 2016, 10, 526–534. [Google Scholar] [CrossRef]
  54. Mohamed, A. Identification of Multiple Harmonic Sources in Power Systems Using Independent Component Analysis and Mutual Information. 2010. Available online: https://www.academia.edu/14323279/Identification_of_multiple_harmonic_sources_in_power_systems_using_independent_component_analysis_and_mutual_information (accessed on 10 December 2023).
  55. Du, Y.; Yang, H.; Ma, X. Multi-Harmonic Source Localization Based on Sparse Component Analysis and Minimum Conditional Entropy. Entropy 2020, 22, 65. [Google Scholar] [CrossRef] [PubMed]
  56. Saxena, D.; Bhaumik, S.; Singh, S.N. Identification of Multiple Harmonic Sources in Power System Using Optimally Placed Voltage Measurement Devices. IEEE Trans. Ind. Electron. 2014, 61, 2483–2492. [Google Scholar] [CrossRef]
  57. D’Antona, G.; Muscas, C.; Sulis, S. State Estimation for the Localization of Harmonic Sources in Electric Distribution Systems. In Proceedings of the 2008 IEEE Instrumentation and Measurement Technology Conference, Victoria, BC, Canada, 12–15 May 2008; pp. 865–869. [Google Scholar] [CrossRef]
  58. Martinez, R.; Castro, P.; Arroyo, A.; Manana, M.; Galan, N.; Moreno, F.S.; Bustamante, S.; Laso, A. Techniques to Locate the Origin of Power Quality Disturbances in a Power System: A Review. Sustainability 2022, 14, 7428. [Google Scholar] [CrossRef]
  59. Carta, D.; Muscas, C.; Pegoraro, P.A.; Sulis, S. Identification and Estimation of Harmonic Sources Based on Compressive Sensing. IEEE Trans. Instrum. Meas. 2019, 68, 95–104. [Google Scholar] [CrossRef]
  60. Ujile, A.; Ding, Z. A dynamic approach to identification of multiple harmonic sources in power distribution systems. Int. J. Electr. Power Energy Syst. 2016, 81, 175–183. [Google Scholar] [CrossRef]
  61. Ye, G.; Xiang, Y.; Cuk, V.; Cobben, J.F.G. Harmonic disturbance location by applying Bayesian inference. Electr. Power Syst. Res. 2016, 140, 886–894. [Google Scholar] [CrossRef]
  62. Sinha, P.; Goswami, S.K.; Nath, S. Wavelet-based technique for identification of harmonic source in distribution system. Int. Trans. Electr. Energy Syst. 2016, 26, 2552–2572. [Google Scholar] [CrossRef]
  63. Hamzah, N.; Mohamad, A.; Hussain, A. A New Method for Separating Utility and Customer Harmonic Contribution at The Point of Common Coupling. Int. Energy J. 2005, 6. Available online: http://www.rericjournal.ait.ac.th/index.php/reric/article/view/109 (accessed on 10 December 2023).
  64. Shojaie, M.; Mokhtari, H. A method for determination of harmonics responsibilities at the point of common coupling using data correlation analysis. IET Gener. Transm. Distrib. 2014, 8, 142–150. [Google Scholar] [CrossRef]
  65. de Matos, E.O.; Mota Soares, T.; Bezerra, U.H.; Tostes, M.E.; Manito, A.R.A.; Costa, B.C., Jr. Using linear and non-parametric regression models to describe the contribution of non-linear loads on the voltage harmonic distortions in the electrical grid. IET Gener. Transm. Distrib. 2016, 10, 1825–1832. [Google Scholar] [CrossRef]
  66. Melo, I.D.; Pereira, J.L.R.; Variz, A.M.; Garcia, P.A.N. Harmonic state estimation for distribution networks using phasor measurement units. Electr. Power Syst. Res. 2017, 147, 133–144. [Google Scholar] [CrossRef]
  67. Bentley, E.C.; Putrus, G.A.; McDonald, S.; Minns, P. Power quality disturbance source identification using self-organising maps. IET Gener. Transm. Distrib. 2010, 4, 1188–1196. [Google Scholar] [CrossRef]
  68. Sun, Y.; Xie, X.; Li, P. Unbalanced source identification at the point of evaluation in the distribution power systems. Int. Trans. Electr. Energy Syst. 2018, 28, e2460. [Google Scholar] [CrossRef]
  69. An Adjustment Scheme of Rewarding and Penalizing Electricity Charges Considering Unbalanced Responsibility–ProQuest. Available online: https://www.proquest.com/openview/fbedac51bae3ebfcecf61060517b0642/1?pq-origsite=gscholar&cbl=406310 (accessed on 10 December 2023).
  70. Herrera, R.S.; Vázquez, J.R. Identification of unbalanced loads in electric power systems. Int. Trans. Electr. Energy Syst. 2014, 24, 1232–1243. [Google Scholar] [CrossRef]
  71. Pérez Vallés, A.; Salmerón Revuelta, P. A new distributed measurement index for the identification of harmonic distortion and/or unbalance sources based on the IEEE Std. 1459 framework. Electr. Power Syst. Res. 2019, 172, 96–104. [Google Scholar] [CrossRef]
Figure 1. Inductive model of a generic load.
Energies 17 02536 g001
Figure 2. Capacitive model of a generic load.
Energies 17 02536 g002
Figure 3. Model of a generic load.
Energies 17 02536 g003
Figure 4. Microgrid designed to assess the indices.
Energies 17 02536 g004
Figure 5. Voltage and current corresponding to the base case. (a) Voltage at PCC. (b) Current at the input of DGM. LCI = 0; UCR = 1.33; Thet3 = 0.64. (c) Current at the input of VR. LCI = 46.77; UCR = 19.13; Thet3 = 1.71. (d) Current at the input of DCVS. LCI = 29.43; UCR = 10.32; Thet3 = 0.42. (e) Current at the input of BRC. LCI = 0; UCR = 0.6; Thet3 = 0.22. (f) Current at the input of BRI. LCI = 0; UCR = 0; Thet3 = 0.01. (g) Current at the input of UR. LCI = 0; UCR = 31; Thet3 = 0.25.
Energies 17 02536 g005aEnergies 17 02536 g005bEnergies 17 02536 g005c
Figure 6. Evolution of the indices of the different loads with the value of VS resistor.
Energies 17 02536 g006aEnergies 17 02536 g006b
Figure 7. Evolution of the indices of the different loads with the value of the capacitor in the capacitive linear load.
Energies 17 02536 g007aEnergies 17 02536 g007b
Table 1. Searches’ keywords.
SearchKeywords
1Power quality & distortion sources identification & distortion sources detection
2Power quality & harmonic sources identification & distortion sources detection
3Power quality & imbalance sources identification & imbalance sources detection
4Power quality & unbalance sources identification & unbalance sources detection
Table 2. Assessed papers’ classification.
Distortion/Imbalance IdentificationMethodPapers
DistortionNorton equivalent[28,29,30,31,32,33,34,35]
Measurer optimal location[36,37,38,39,40,41]
Current decomposition[42,43,44]
Active power direction[45,46,47]
Artificial intelligence[48,49,50]
IEEE Standard[51,52]
Independent component analysis[53,54,55]
Particle swarm[35,56,57]
Review[14,15,58]
State estimation[59,60,61]
Reactive power direction[62,63]
Data correlation[64]
Different weighting methods[50]
Power complex harmonic[58]
Regression method[65]
Safety barrier interior point method[66]
Self-organizing maps[67]
V/I ratio[44]
ImbalanceUnbalance factor[68]
IEEE Standard[69]
BothCurrent decomposition[42,70]
IEEE Standard[71]
Table 3. Values corresponding to each equipment connected to the PCC.
EquipmentAcronymDescriptionValues
1DGMInverter injecting power to the PCC
2VRThree regulators connected in star with inductive impedance on the right side (unbalanced)Phase 1: R = 10 Ω, L = 0.1 H
Phase 1: R = 12 Ω, L = 0.12 H
Phase 3: R = 8 Ω, L = 0.08 H
3DCVSThree-phase rectifier with a capacitive impedance on the DC sideR = 100 Ω
C = 0.2 µF
4BRCThree balanced capacitive loads (a resistor in parallel to a capacitor) connected in starR = 26.67 Ω
C = 1.19 mF
5BRIThree balanced inductive loads (a resistor in series to an inductance) connected in starR = 6.67 Ω
L = 21.22 mH
6URThree unbalanced resistors connected in starPhase 1: R = 80 Ω
Phase 1: R = 64 Ω
Phase 3: R = 160 Ω
Disclaimer/Publisher’s Note: The statements, opinions and data contained in all publications are solely those of the individual author(s) and contributor(s) and not of MDPI and/or the editor(s). MDPI and/or the editor(s) disclaim responsibility for any injury to people or property resulting from any ideas, methods, instructions or products referred to in the content.

