Article

Improvement of Economic Integration of Renewable Energy Resources through Incentive-Based Demand Response Programs

by
Reza Jalilzadeh Hamidi
1,* and
Ailin Asadinejad
2
1
ECE Department, College of Engineering and Computing, Georgia Southern University, Statesboro, GA 30458, USA
2
Hitachi Energy, Raleigh, NC 27606, USA
*
Author to whom correspondence should be addressed.
Energies 2024, 17(11), 2545; https://doi.org/10.3390/en17112545
Submission received: 3 April 2024 / Revised: 21 May 2024 / Accepted: 22 May 2024 / Published: 24 May 2024
(This article belongs to the Section C: Energy Economics and Policy)

Abstract

:
The integration of renewable generation presents a promising venue for displacing fossil fuels, yet integration remains a challenge. This paper investigates Demand Response (DR) as a means of economically integrating Renewable Energy Resources (RERs). We propose Incentive-Based DR (IBDR) programs, particularly suitable for small customers. The uncertainties in the electricity market price pose a challenge to IBDR programs, which is addressed in this paper through a novel and robust IBDR approach that considers both the electricity market price uncertainties and customer responses to incentives. In this paper, scenarios are simulated premised on the Western Electricity Coordinating Council (WECC) 240-bus system in which coal-fired power plants become inactivated, while the RER contribution increases in the span of one year. The simulation results indicate that the proposed IBDR program mitigates the issues associated with renewable expansion, such as utility benefit loss and market price volatility. In addition, the proposed IBDR effectively manages up to 30% of errors in day-ahead wind forecasts that significantly reduce financial risks linked to IBDR programs.

1. Introduction

The necessity of an electric power infrastructure capable of managing high penetration of alternative energy resources is evident, considering the global concerns about energy resources and the environment. Traditionally, hydroelectric and nuclear power plants are considered as electricity sources with low carbon emissions. However, deployment of such types of resources faces several constraints, such as economic and environmental conditions [1,2,3]. In fact, several countries are gradually retiring nuclear power plants. Power generation based on biomass and natural gas seems to be a solution for emission reduction; however, they are not sustainable solutions since natural gas is not available worldwide and biomass production is, to some extent, a challenging process [3].
Conversely, utilization of wind energy is a promising approach to displacing carbon-intensive power plants [4]. Wind energy is widely distributed across the globe, and as wind energy harnessing technologies have already become mature, wind power is economically viable [5]. Consequently, many power systems around the world have begun to incorporate a substantial amount of wind power into their energy generation portfolios. For instance, it is projected that wind energy will contribute to twenty percent of the total energy generation in the USA by 2030. However, as the availability of wind energy is quite intermittent, its negative effects on the economic operation of power systems should be addressed, and these effects are still under investigation [6,7,8].
Power system operators face the ongoing challenge of balancing demand and generation, especially during the peak hours. Most power systems currently function according to the well-known policy of utilizing all available wind energy and allowing the supply-side reserves to compensate for the variations in wind energy, but at a high cost [9,10]. This often results in high electricity costs that the end users need to pay. Despite the substantial contribution of small customers in residential sectors, the existing literature predominantly focuses on larger customers participating in the wholesale market.
DRs are broadly categorized into two categories: Incentive-Based Demand Response (IBDR) and Price-Based Demand Response (PBDR) [11]. PBDRs are efficient in peak shaving and reducing the cost of the electricity. Following PBDRs, the electricity’s price is dynamically determined as a function of several parameters, such as the Time Of Use (TOU) and load profile. Then, customers adjust their consumption with respect to the prevailing electricity price [12,13]. However, pursuing IBDRs, the utility requests the customers to reduce or increase their consumption to a certain amount and provides compensation for the consumers’ cooperation by introducing incentives. While IBDRs are effective in peak shaving and balancing the electricity market in such a way that both Load Serving Entities (LSEs) and customers gain profits, it appears that IBDRs are more acceptable to the public and are gaining research and application interest [11,14,15].
This paper explores residential Demand Response (DR) as a potential solution for balancing load and generation in high penetration of Renewable Energy Resources (RERs) using Incentive-Based DR (IBDR). Small customers are typically risk averse and reluctant to make frequent decisions necessary for Price-Based DR Programs (PBDR). Our findings demonstrate that IBDR is promising in mitigating renewable output variations while appealing to small customers. Moreover, IBDR can be easily integrated into LSEs [16,17]. Some examples of IBDR programs taking the residential customers into account are as follows: In [18], an IBDR is proposed that establishes an energy management system for a community of the domestic load and allows the participants to schedule their own appliances with no need to acquire the permission of the system collaborator, while the collaborator manages an energy storage for the entire community to purchase electricity when the electricity price is low. In [19], a bi-level framework for decision-making is proposed in which several DR providers compete in a multi-leader and multi-follower game. Although this method considers the domestic loads, it does not consider an aggregation of them as followers. In contrast to the above-mentioned works, the proposed method in this article lets each individual consumer decide to take advantage of the incentives or simply follow the fixed or seasonal electricity tariffs.
The errors in wind forecasting add uncertainties to the electricity market price, which is the main challenge in the application of IBDR under the high penetration of RERs. For example, in the Western Electricity Coordinating Council (WECC), wind forecast error can result in more than $30/MWh variations in the real-time market price. In PBDR, financial consequences are mainly transferred to customers. However, in IBDR, the LSEs face greater market risk. The prior work in this regard can be reviewed as follows: one of the major economic barriers to the large-scale integration of RERs is the high costs related to ensuring the backup reserves for securing demand response. Stochastic unit commitment models serve as valuable tools for quantifying reserve requirements and assessing the impacts of renewable integration on operation costs. There are numerous studies in the prior literature [20,21,22,23,24] proposing methods for renewable integration relying on unit commitment. These works primarily focus on the effects of the uncertainties in renewable generation on power system operations. However, the benefits of IBDR are neglected.
In the literature, DR is often represented through demand functions [25]. For instance, Sioshansi [21] employs this approach within a unit commitment model, and similar methodologies are adopted by Borenstein and Holland [26], as well as Joskow and Tirol [27,28], in their analyses of retail pricing. However, there are many energy-consuming tasks that can be postponed since they require a specified amount of energy during a specific time frame. Examples of such tasks include electric vehicle charging, water pumping in agriculture, pre-cooling or pre-heating the premises, and some residential activities, such as laundry. In [29], the state-of-the-art process is improved through incorporating electric vehicle energy demand explicitly into a unit commitment model, albeit in a deterministic framework that overlooks the uncertainty associated with RERs. The use of electric vehicles for covering the uncertainties related to RERs is also addressed in a number of works through different methods. In [30], a peer-to-peer energy sharing method is proposed in which the vehicle owners trade their excessive stored energy with others at a lower electricity price that financially benefits both the energy buyer and seller. Although the existence of electric vehicles able to discharge to the grid is a random variable, its probability distribution is quite different than that of wind energy. Therefore, the solutions in the literature employing electric vehicles cannot be amended and utilized for integration of IBDR-based wind integration.
Real-time DR programs seem to be a remedy; however, they encounter institutional barriers, limiting their effectiveness. The full potential of demand-side bidding necessitates real-time pricing at the retail level, an idea first proposed by Schweppe and further developed by Borenstein [31,32]. However, this approach faces criticism from political points of view due to concerns about exposing retail consumers to wholesale electricity price volatility. Moreover, real-time electricity pricing may not adequately capture the economic significance of demand response because of the non-convex costs associated with system operations, which is highlighted by Sioshansi [29]. An alternative DR model is suggested in [33] that involves flexible loads to provide services to the ancillary service market in which an aggregator bids on behalf of load aggregations. In [34], the feasibility of demand-side aggregation for a spinning reserve is explored, and it is concluded that this solution may be profitable for users willing to respond to power system operators’ instantaneous needs. In [35], a hybrid incentive program is proposed to encourage the owners of electric vehicles to sell their excessive charge to the charging stations. This method benefits the owners of electric vehicles and charging stations. However, in none of the mentioned hybrid DR programs are the LSEs allowed to use their own sources of information and make decisions individually.
Despite the potential for IBDRs to address challenges posed by high renewable penetration, it is less explored in the literature as a solution. The authors initially considered such uncertainties in [36], and, in this paper, they extend the incentive-based demand response proposed in [37] for minimizing the generation costs and electricity price to maximize the benefits for both the end users and the generating units. As the main contribution, a robust IBDR is proposed in this study that is able to capture the uncertainty of market price due to the errors in wind forecast. The proposed robust IBDR formula utilizes day-ahead market prices as well as a customer elasticity range for minimizing the probable financial risks of the DR program for LSEs. The proposed method is applied to the data given by WECC 240-bus in a one-year duration. RERs are expanded in this data set from less than 5% to 30%, which results in price volatility and higher costs for the LSEs. The proposed robust IBDR limits sharp price changes and provides benefits for all the market participants.
This paper adds to the previous work of the authors in the following ways: the benefits of small end-users are directly considered in the objective function to guarantee their interests and the LSEs are allowed to utilize their own weather forecast to diversify the data sources and forecast methods. Therefore, possible errors or inaccuracies in one data source do not affect all the participants in the proposed IBDR. Therefore, the electricity market will be safeguarded against possible issues arising from the forecast errors. The improvements in the optimization problem and its constraints make the proposed IBDR method capable of handling a 30% error in day-ahead wind forecasts without financial risks to either generating units or end customers. Moreover, the proposed IBDR can be readily integrated into LSEs.
The remainder of this paper is organized as follows: In Section 2, the methodology is described, and the optimization problem is defined. In Section 3, the test case is described, different scenarios for evaluation of the proposed IBDR are defined, and simulation results are presented and discussed in detail. Finally, the conclusion overviews the major contributions and achievements of this work.

2. Methodology

In this section, first the principles used in the development of the proposed IBDR are described and then formulations ending with the proposed objective function are presented. In the beginning, it should be explained that it is common in robust optimization to include uncertain parameters as a convex uncertainty set. Then, the performance of the optimization is evaluated with respect to the worst-case scenario within the uncertainty set. However, this approach increases the problem’s complexity, to a large extent.
Alternatively, uncertain quantities (parameters with random values) can be modeled as a pre-defined interval. The center value of the interval is the actual forecast, and the possibilities are places around it in a symmetric form. An essential concept in robust optimization is the level of conservativeness that should also be explained. Please assume a linear program with a general feasibility region of u = { ( A 0 ,   b 0 ) + ρ ( A 1 ,   b 1 ) } in which A 0 , A 1 , b 0 , and b 1 are real-valued constants constituting two two-dimensional vectors and ρ     1 is the level of conservativeness. When ρ exceeds 1, the feasible region contracts and eventually ends in the original feasible region. The minimum value of ρ for which this occurs is called the level of conservativeness [38,39].

2.1. Ellipsoidal Uncertainty

Another concept that should be described before the development of the optimization problem is the Ellipsoidal uncertainty set. This set offers several advantages which are as follows [38,39]: (1) Simple geometries of uncertainties. (2) Straightforward parametric representation and favorable numerical characteristics. (3) Many stochastic uncertainties can be effectively substituted with ellipsoidal deterministic uncertainties. Please assume that f ( x ) = a T x + b is an uncertain linear programming problem with some random inputs in its constraints. a and b are vectors of real-valued coefficients and x is the vector of decision variables. If the i-th condition, as a random variable, is a i T x + b i 0 with an expectation of E ( x ) = a i T x + b i and the standard deviation of v ( x ) = x T Ω x   where Ω is the covariance matrix, then the values of f ( x ) are E x ± O ( v ( x ) ) where O ( · ) indicates the error. For random variables with light-tail distribution, the lower bound is f x = E x θ v ( x ) in which θ is the safety parameter which is a real-valued number close to 1. This results in the likely reliable version as E x θ v x 0 . This constraint is the robust form of the original constraint with uncertainty. Therefore, the constraint can be added to the linear program as
a i T x + b i 0 ,   a u i
and u i is specific as the ellipsoid set as
u i = a : a a i T Ω 1 a a i θ
Based on the above explanations, the proposed robust IBDR is explained in the next section.

2.2. Proposed Robust IBDR

The main role of LSEs in restructured electricity markets is to ensure that generation and demand stay balanced. Then, they also make sure that there are enough transmission services for transferring the generated power to the end users. In fact, LSEs mediate between the retail customers and the wholesale electricity market to maximize the total expected payoffs and to retain the risks below the acceptable limit [40]. Accordingly, with respect to the primary role of LSEs, the objective function can be defined for LSEs as follows:
max b = 1 N B t = 1 T D b t ( C b t L M P b t )
where D b t indicates that the electricity demand at bus b and time t , C b 0 t is the flat rate tariff that the customers at bus b should pay at any given time t , L M P b t is the electricity marginal price at bus b at time t , N B is the number of buses in the area that participate in the proposed IBDR program, and T is the time period that the IBDR is followed by the program participants.
It is evident from Equation (3) that the LSE gains a profit whenever the charged price exceeds the market price. Conversely, the LSE incurs a loss during other periods. As demand–response programs generate benefits by altering the load, the objective function of the LSE can be formulated as Equation (4) to design an incentive payment.
max   b = 1 N B t = 1 T D b t Δ D ¯ b t C b t L M P b t Δ D ¯ b t C b i n c t S u b j e c t   t o : Δ D ¯ b t = j = 1 D T Δ D b j t Δ D b j m i n t Δ D b j t Δ D b j m a x t Δ D b j t = R i C b i n c t T T m a x
where D ¯ b t is the total change in the load at bus b and time t , Δ D b j t is the change in load related to customer j at bus b and time t , R i is the response type- j customer to incentives, C b i n c t is the incentive at bus b and time t which is given to the customers, D T is the type of customers, and T m a x is the maximum hours that customers are comfortable to follow the proposed IBDR. After including uncertainty, elasticity, and market price, (4) can be rewritten as follows:
max   b = 1 N B t = 1 T D b t L M P b t Δ D ¯ b t C b t + Δ D ¯ b t L M P b t Δ D ¯ b t C b i n c t S u b j e c t   t o : Δ D ¯ b t = j = 1 D T R i C b i n c t Δ D b j m i n t Δ D b j t Δ D b j m a x t T T m a x
Plugging the equality condition in the objective function leads to
max   b = 1 N B t = 1 T D b t L M P b t R i C b i n c t j = 1 D T 1 + j = 1 D T L M P b t j = 1 D T C b i n c t S u b j e c t   t o : Δ D b j m i n t Δ D b j t Δ D b j m a x t
However, this is a maximization problem which, by introducing the auxiliary variable Z (6), is converted to its equivalent minimization problem as follows:
min Z S u b j e c t   t o : Z + R i C b i n c t b = 1 N B t = 1 T j = 1 D T 1 + j = 1 D T L M P b t j = 1 D T C b i n c t b = 1 N B t = 1 T D b t L M P b t Δ D b j m i n t Δ D b j t Δ D b j m a x t
The obtained optimization problem in the form of linear programming is utilized for the application of the IBDR in several scenarios in the next section.

3. Test Cases and Discussion

In this section, the effects of the proposed IBDR on various stakeholders in the power market, including LSEs, end-users, and the Independent System Operator (ISO) are studied through several different scenarios as described in the following subsections. Matlab is used for the implementation of the proposed IBDR and running the simulations. In the following subsections, the test system is first described, and then different scenarios are elaborated, and their corresponding results are discussed.

3.1. WECC System Information

The proposed IBDR approach is applied to an adjusted version of the Western Electricity Coordinating Council (WECC) available in [41]. The hourly data on the generation and demand throughout a year are available and considered in the simulations. The test grid contains 11 load areas. It is assumed that exactly one LSE is allocated to each area, and the same electricity tariff is applied to all the buses in the area. There are also different types of generating units supplying the whole system, as given in Table 1.
The properties of generators and transmission lines are also available in [41] and utilized in the simulations. It should be noted that the available load profiles are used for determining LMPs throughout the year. In the next subsection, an RER expansion scenario is detailed.

3.2. RER Expansion in WECC

The California’s Renewable Portfolio Standard dictates that 30% of all electricity retail sales must be purchased from eligible RERs by 2030. However, such capacity is not still available and a significant amount of RERs should be integrated with the grid to meet the abovementioned target [42,43]. Since coal-fired generation is the chief source of CO2 emissions, it is reasonable to first replace them with RERs with the highest priority. There are seven buses hosting both coal and RERs at the same time in the test grid, which are located in Arizona, British Columbia, Colorado, Idaho, Nevada, Oregon, and Wyoming. In this scenario, the coal-fired generating units in those buses are replaced with RERs because this replacement has the least effect on the other aspects of the power grid, and issues such as line congestion or protection system failures are less probable [44].

3.2.1. Impact of RER Expansion on Market Price

It is quite expectable that the replacement of coal-fired power plants with RERs affects LMP and LSE’s benefits. Three conditions are generally defined in the electric grids to study the effects of RER expansion as follows:
Condition 1: High load and low RER generation, which often happens in summertime around the peak hours. It is predictable that LMP will be significantly high during these periods. This condition may also occur during summer nights when there is low wind, while the need for electricity to control the temperature of business and domestic buildings is considerable.
Condition 2: Low load and high RER generation that can occur during spring and fall when the weather is moderate. Therefore, the residential load is lower, and, at the same time, wind power is abundant. As RERs are supposed to generate as much as possible, the LMP reduces. In some cases, a negative LMP is allowed to be utilized for increasing the demand.
Condition 3: The load and RER generation are both moderate. It is possible that this condition occurs at any time of year. However, it is more probable to occur during winter. In some areas, the average LMP increases after RER expansion, while in some other areas, the average LMP decreases. Therefore, a specific prediction towards LMP is impossible and it can be determined only through comprehensive analysis.
However, it should be noted that the overall LMP variations increase in the grid, at large, after RER expansion, and the pattern of LMP variation mainly follows the changes in RER generation, not the demand. However, in the first condition, demand variations affect LMP most. It is also unacceptable for LSEs to either lose or gain benefits with no obvious correlation with the LMP fluctuations.

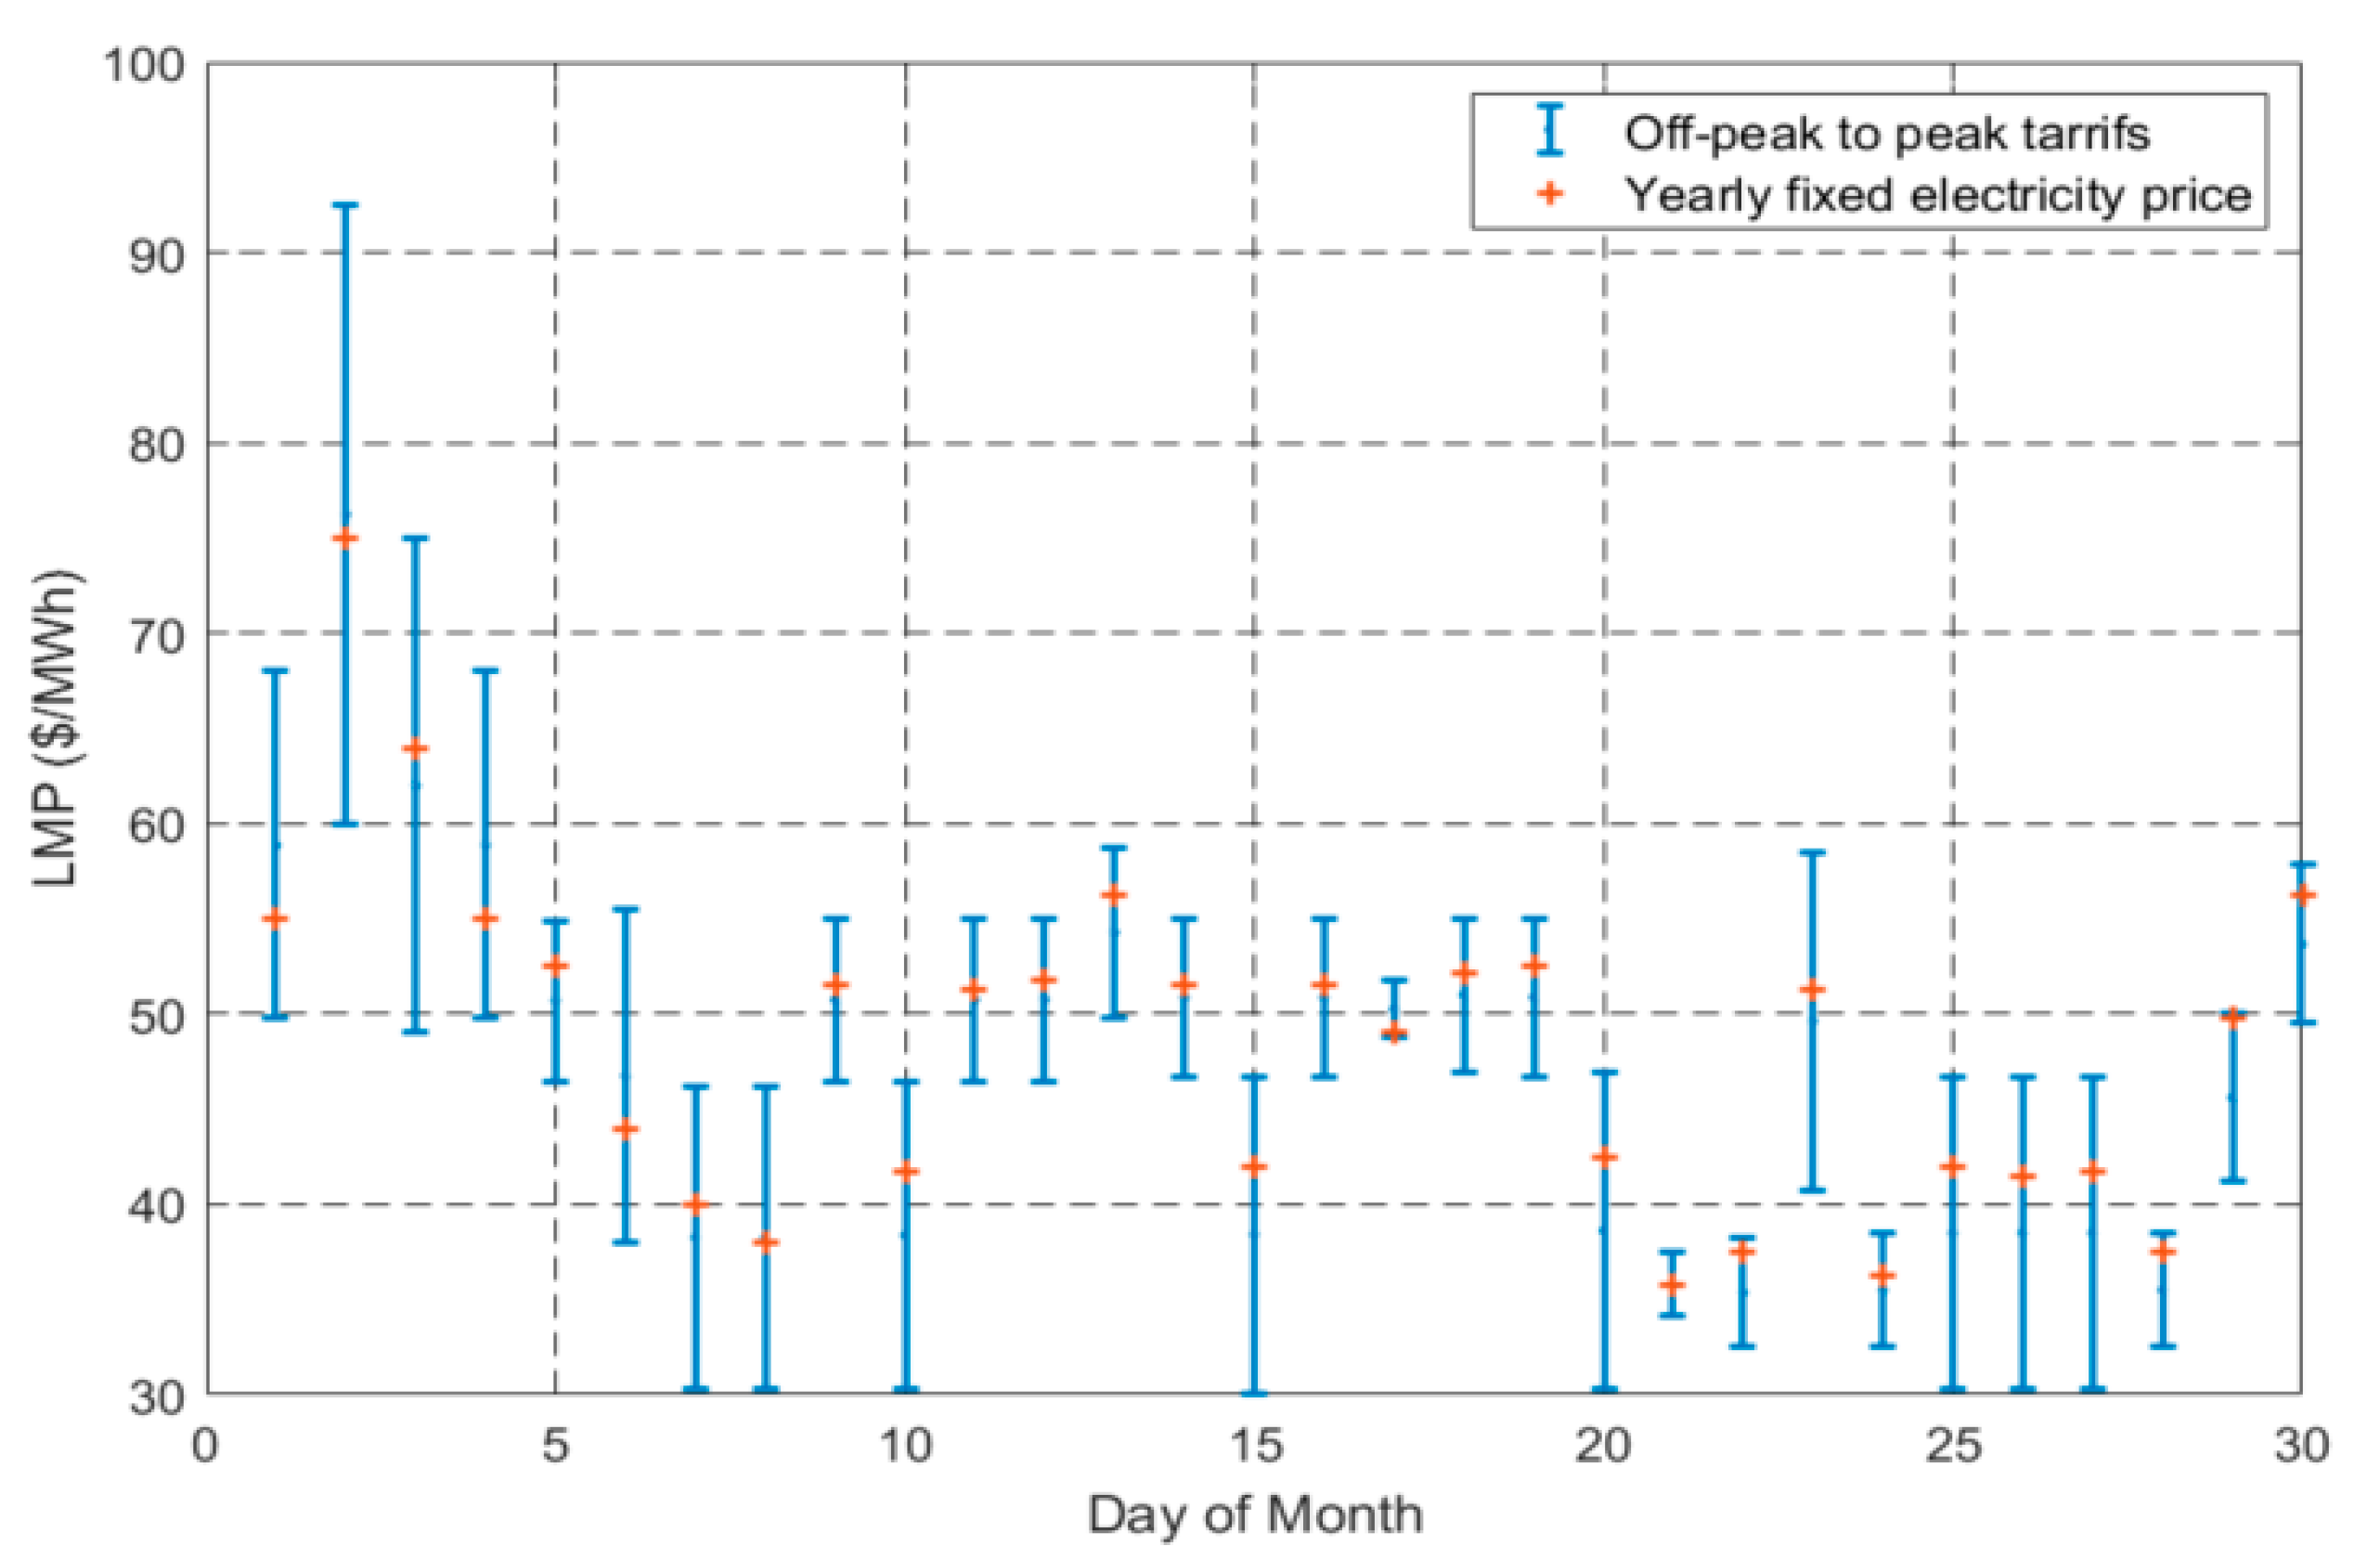
3.2.2. Effects of the Errors in Wind Forecast on the Electricity Price

The real-time electricity price is influenced by a number of factors, such as load or RER forecast errors as well as unscheduled outages. The California ISO day-ahead load forecast is generated using a neural network-based forecasting software that utilizes multiple weather data sources for increasing its accuracy. Continuous monitoring and revision of weather forecasts by the California ISO aim to minimize average load forecast errors. However, the error is still effective in the electricity price.
The prediction of hourly load is crucial for scheduling purposes in the day-ahead market. Therefore, LSEs forecast the hourly load [5]. However, the forecasted hourly load includes some errors, but it typically falls within an acceptable range of accuracy (i.e., no greater than 2%) [43]. As a matter of fact, uncertainties in the day-ahead schedules are inevitable due to inherent volatility in weather and load [45]. As RER expands, the aggregate errors associated with their forecast increase and can cause financial risks and, in severe cases, reliability issues arise [46].
Accordingly, a scenario-based economic dispatch is developed in this paper to analyze the effects of wind forecast errors on real-time market prices. Wind forecast errors are obtained from [43]. Another point in the definition of the scenario is that unit commitment results remain unchanged when renewable output deviates from scheduled values. Therefore, the available dispatchable generating units (e.g., hydropower or gas-fired) must compensate for the imbalance in demand and generation. Based on this scenario, the impact of wind forecast errors on market prices is studied and formulated.
Using the defined scenario-based economic dispatch and design of experiment approach, the uncertainty range of prices is calculated for various areas throughout the year in this paper. Examples of peak and off-peak tariffs in different seasons are presented in Figure 1 and Figure 2 for the San Francisco and Rocky Mountain areas, respectively. The upper bounds show the peak, and the lower bounds show the off-peak tariffs. In addition, the yearly fixed electricity price is indicated with a red dash.
In general, uncertainties are smaller when LMP is low compared to when LMP is high since prices are more sensitive to changes in load or generation when LMP is high. This can be explained by the fact that the range of price uncertainty is directly influenced by fluctuations in load and generation levels depending on load consumption and available renewable generation. In cases of high demand and low renewable generation, the forecast error may significantly affect the electricity price. However, when the load is low or renewable output is sufficiently high, the forecast error should not result in considerable price variations.

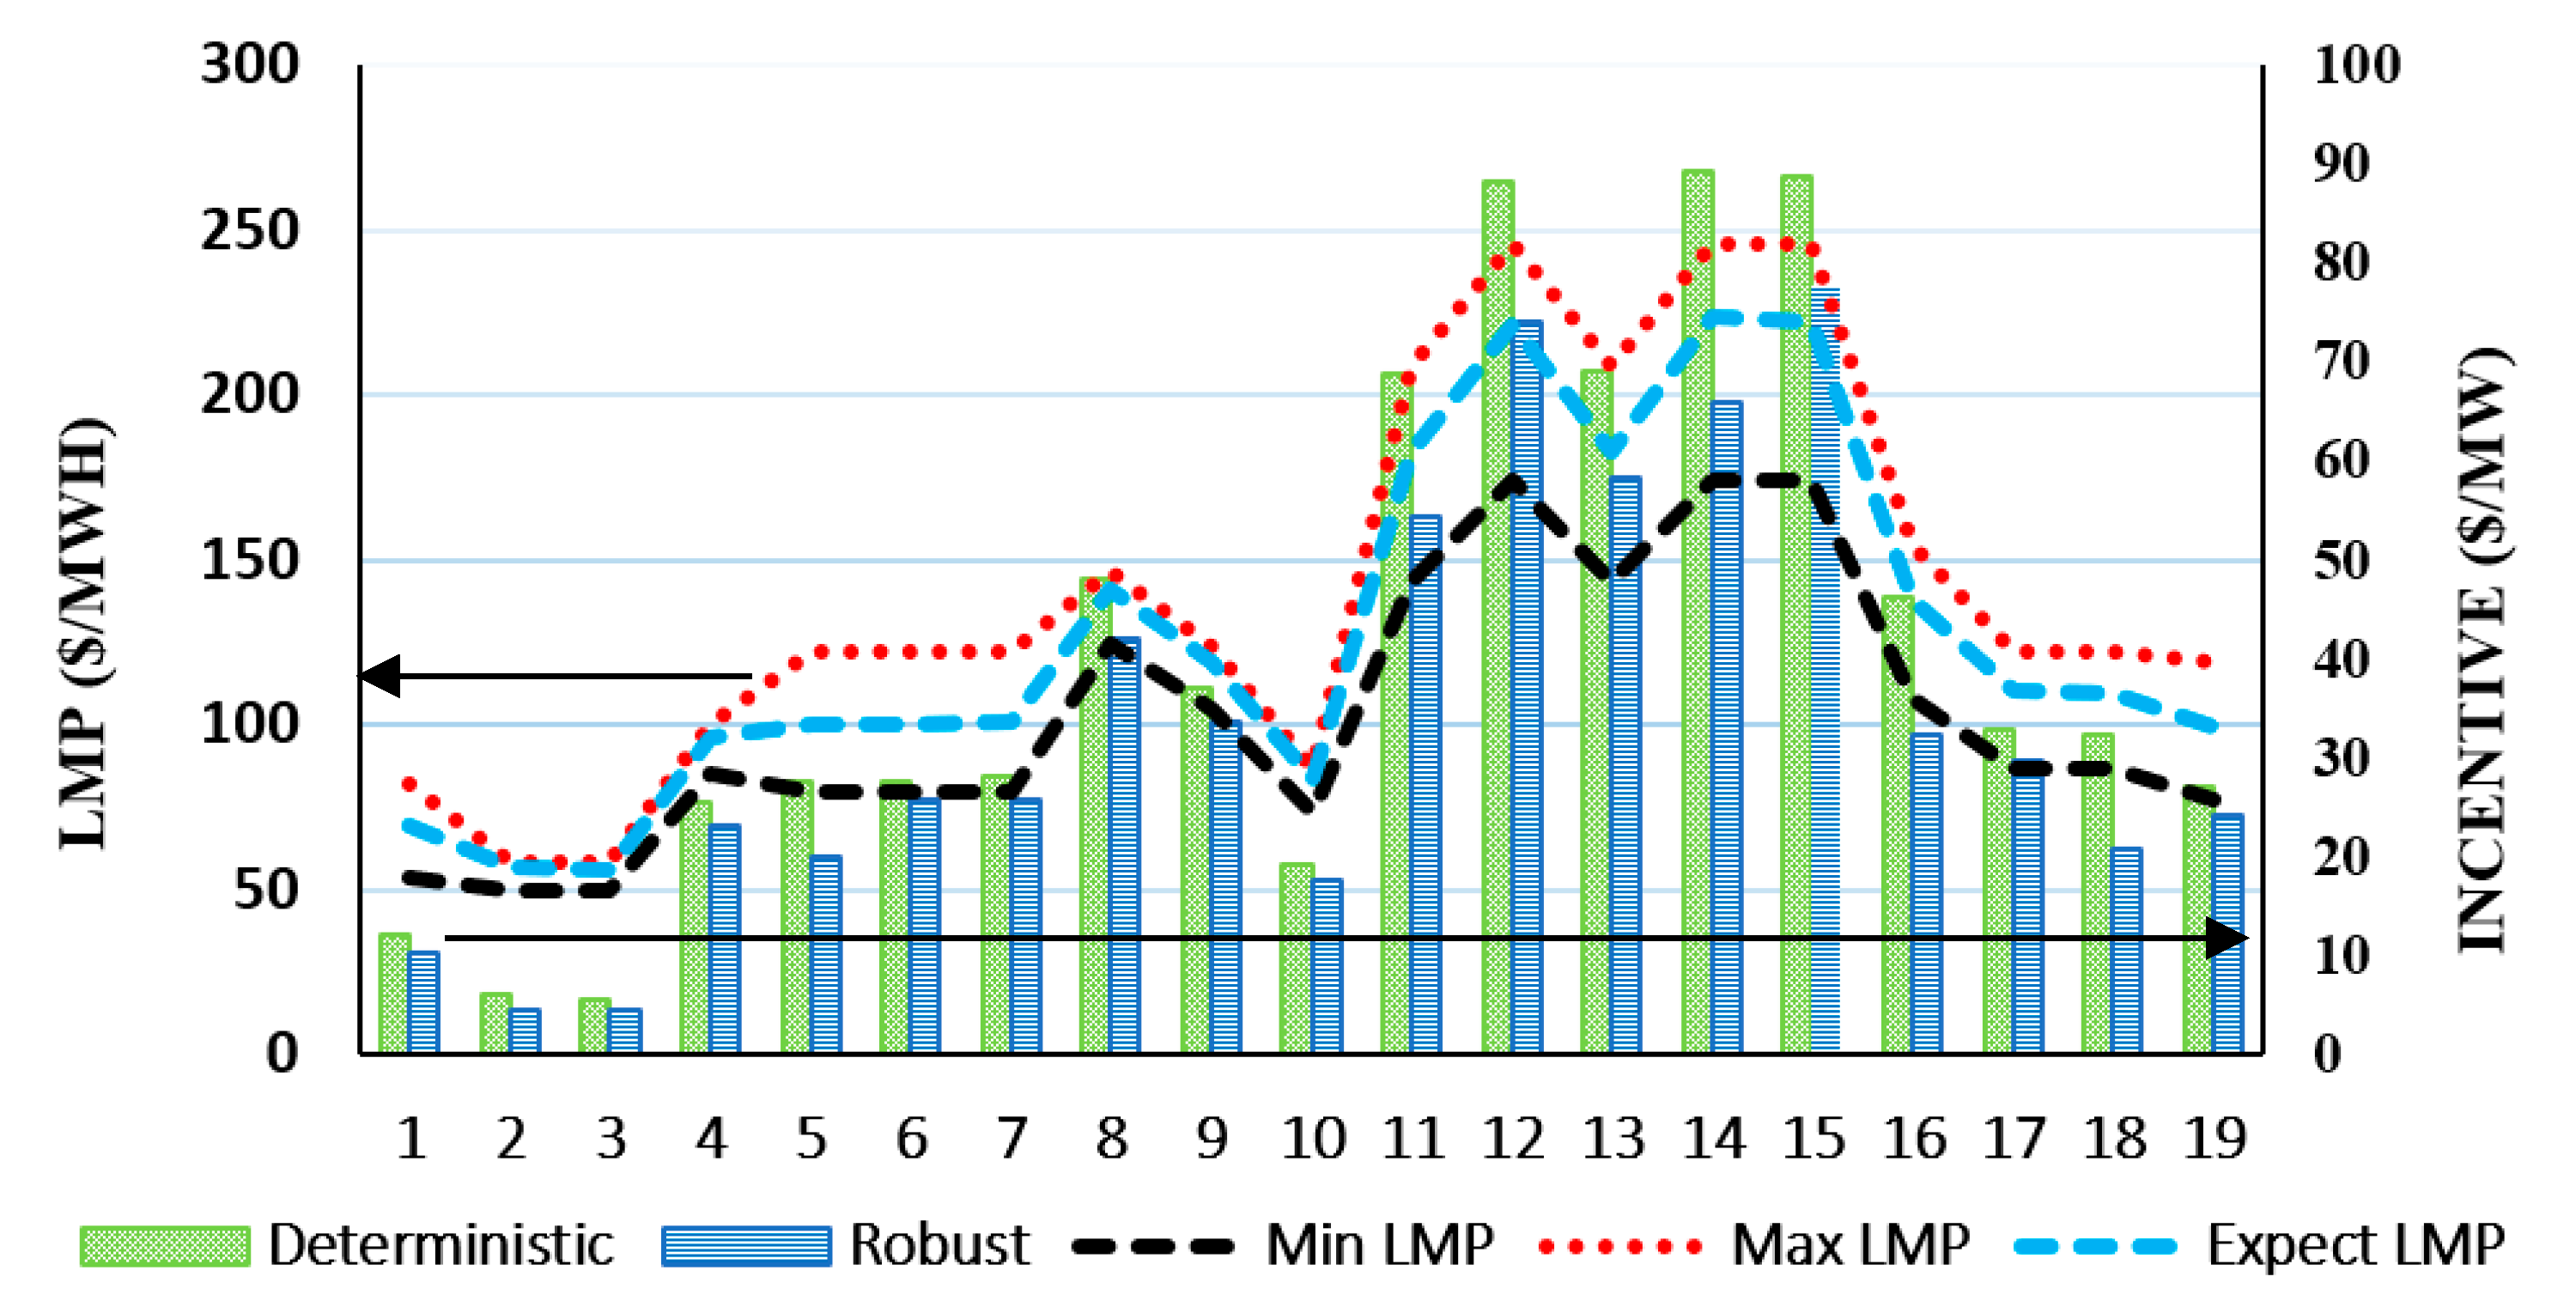
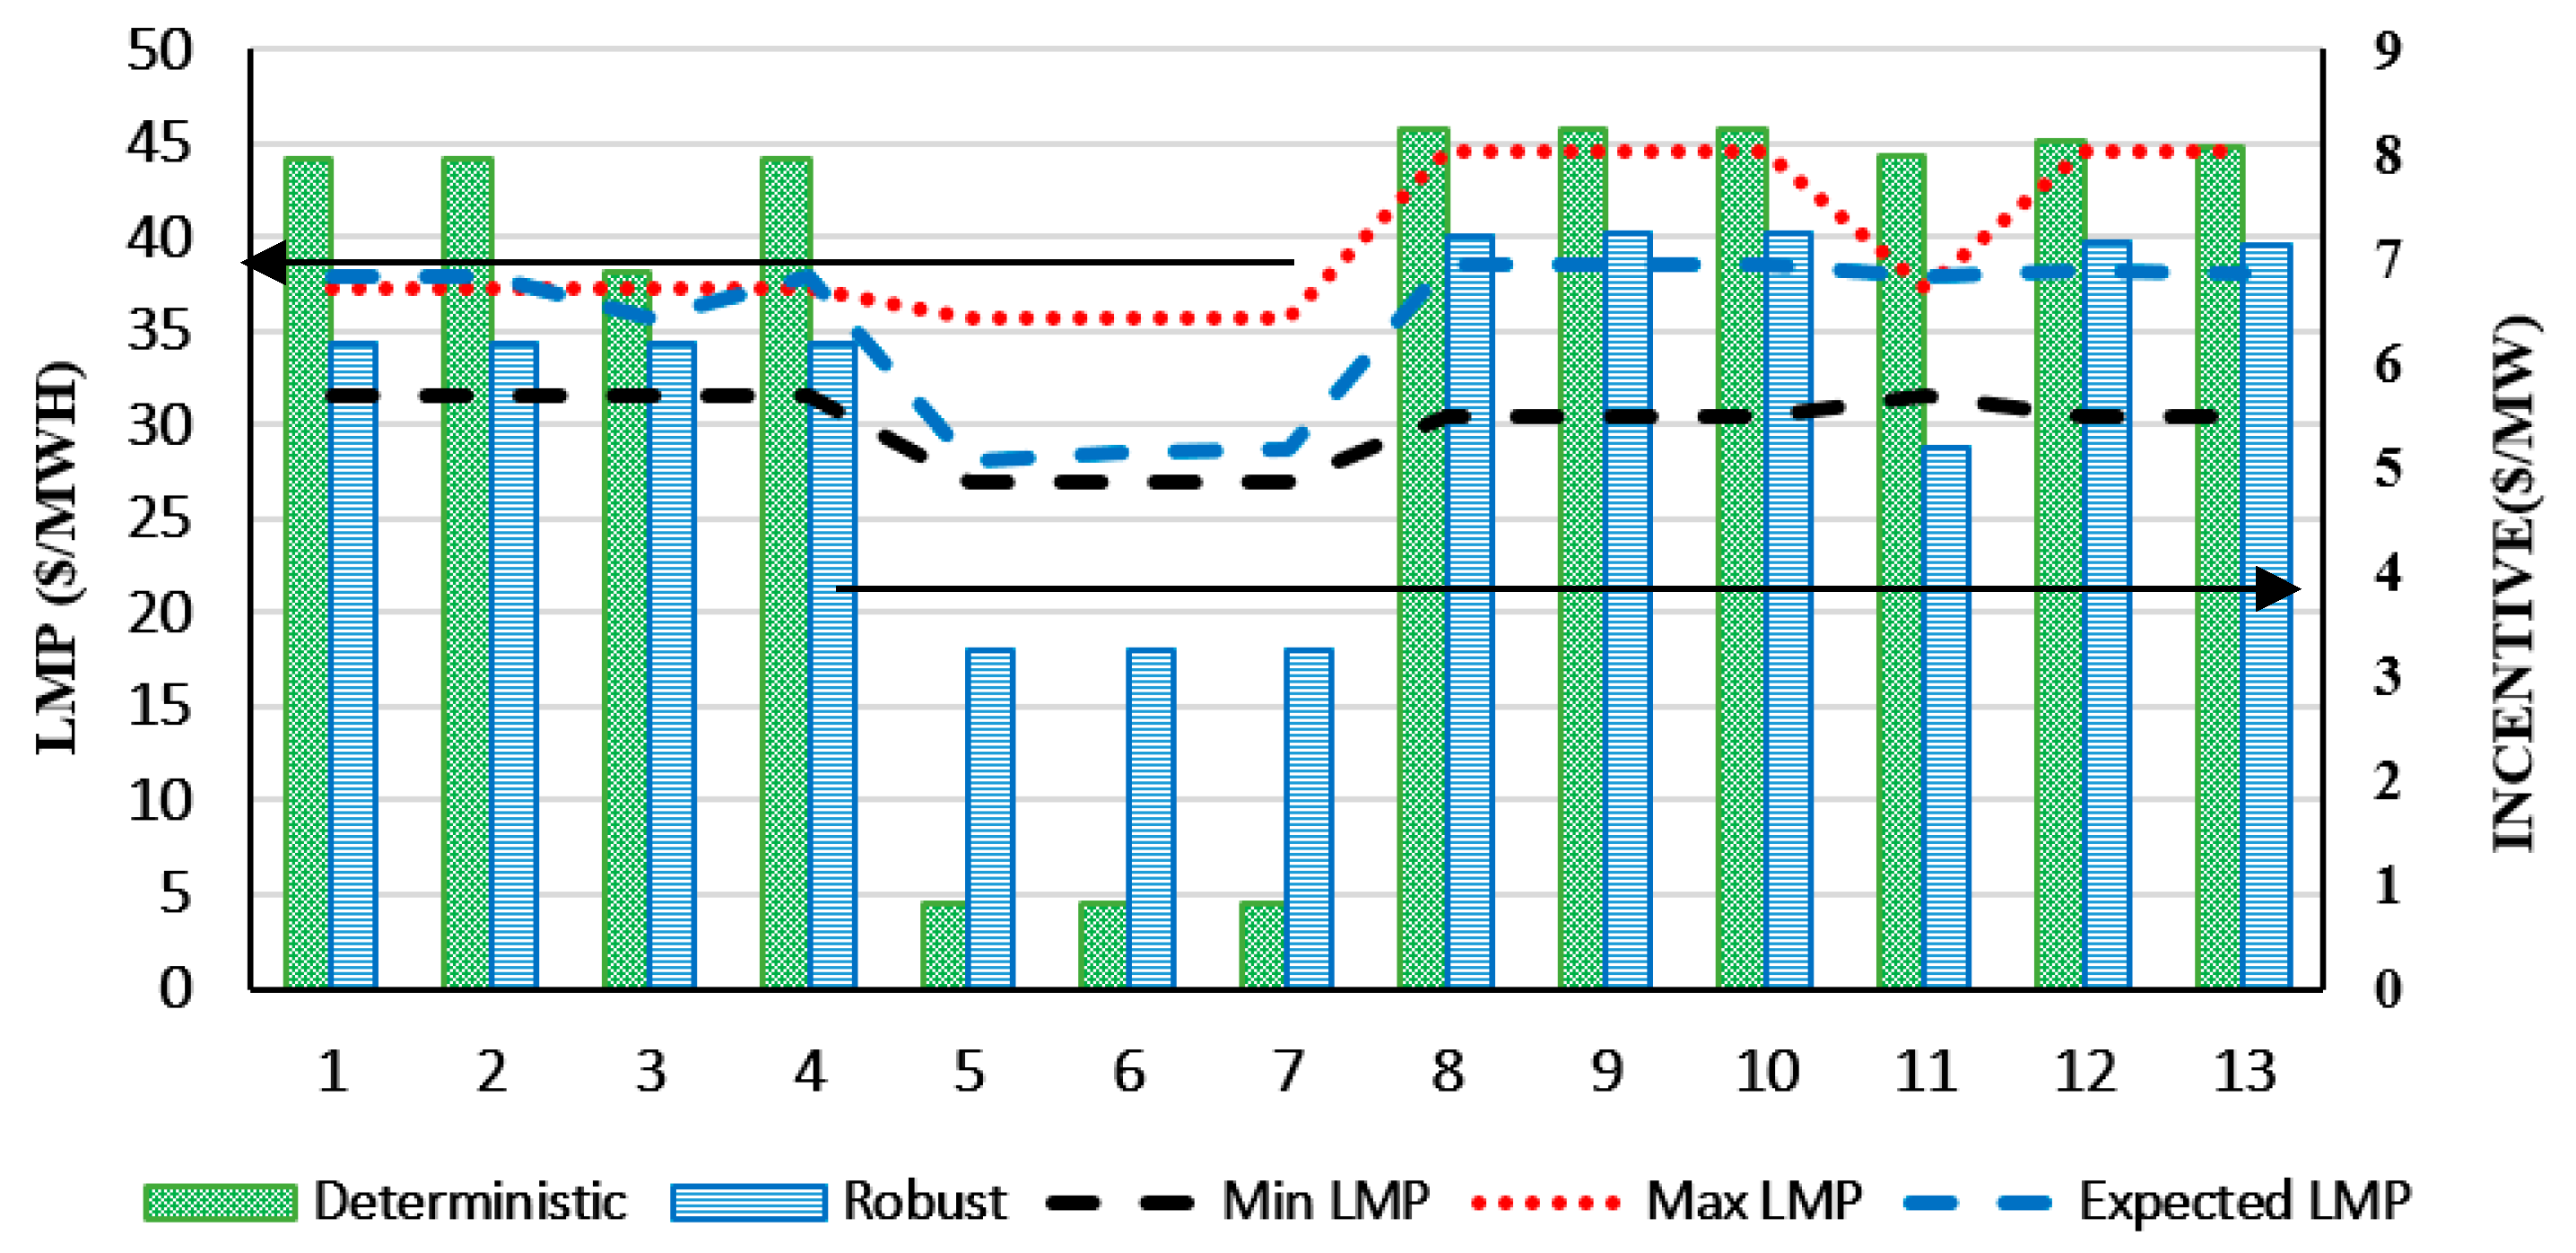
3.2.3. Comparison of Deterministic and Robust Program

From the perspective of LSEs, the IBDR program brings two primary risks to real-time market prices: (1) the risk of higher LMP or (2) the risk of lower LMP in the real-time market compared to the forecasted LMPs in the day-ahead market.
When a higher LMP is determined in real-time markets, LSEs may miss out on potential loads and, consequently, experience a cut in selling opportunities. This can lead to underpayment compared to the day-ahead DR programs. Conversely, when there is a risk of an LMP lower than the forecasted one, the deterministic DR program may result in underpayment, which leads to a worst-case scenario from a financial standpoint.
In the WECC 240-bus model, variations in day-ahead LMP are typically balanced between the lowest and highest possible LMPs for most of the hours. Although both the robust and deterministic programs somehow result in similar outcomes, the risks associated with both programs are heightened during certain hours each month. It is crucial to examine the behavior of the robust program under these conditions.
Two examples are provided as follows: In Figure 3, the hourly incentive payments for the deterministic and robust programs are plotted against the range of market prices for peak hours during one week of July. The graph illustrates that when the risks of low and high LMPs are equal, the incentive payments are comparable. However, as the risks become skewed, noticeable differences in incentive values emerge.
Figure 4 depicts results in the Southwest area for one week of October. It is obvious that, during these hours, the risk of higher LMP is predominant; the robust approach tends to offer higher incentive payments to customers in order to capitalize on market opportunities. Conversely, it is obvious that, between hours five and seven, in which the risk of a higher LMP is low (as the expected LMP is close to the minimum LMP), the robust approach offers higher incentives to the customers compared to the deterministic approach. The deterministic approach, by introducing lower incentives, retains the benefits of the LSEs in this situation. However, when the risk of a higher LMP is high, during hours one to three (as the expected LMP is close to the maximum LMP), the robust approach introduces fewer incentives to the customers compared to the deterministic approach. Therefore, it is probable that the deterministic approach, by introducing higher incentives, reduces the demand more effectively compared to the robust approach. In general, it is observed that when the expected LMP is close to the maximum or minimum LMPs, the deterministic approach results in more favorable incentives.
If the real-time price remains close to its forecasted price, the proposed IBDR program is expected to yield lesser benefits for LSEs since none of the risks materializes. However, any revenue loss during these instances should be offset during hours when forecast errors are significant.
The aggregate profits that an LSE makes in each area following the robust and deterministic approaches are compared in Table 2, which shows the differences between the LSE benefits following the robust approach minus the benefits obtained by the deterministic approach are provided for a specific area and month (July and February). Three scenarios, including average case, worst case, and missed opportunity, are provided. It is noteworthy that the loss of benefit under the average case persists for an entire month, while savings in the other two cases occur only for a few hours. This underscores the realization that the benefit loss due to robust design is tangible even if LMP deviates from the forecast for only a few hours.
The remaining comparison between the robust and deterministic programs pertains to their impact on the market price. Higher incentive payments typically induce greater changes in load [47,48,49]. Consequently, in the worst-case scenario, where the robust program offers lower incentives, it leads to load reduction. Consequently, there are fewer effects on the electricity market price. Conversely, in the missed opportunity case, the robust program offers higher incentives. This results in a more significant impact on the LMP.
Figure 5 illustrates LMP variations in the Bay area for one day in July, showcasing both abovementioned conditions. In hour 10, the robust program’s effect on the market price is more. However, in hours 11 to 16, the deterministic program leads to a greater reduction in LMP. For the rest of the hours, both LMPs are negligibly different.

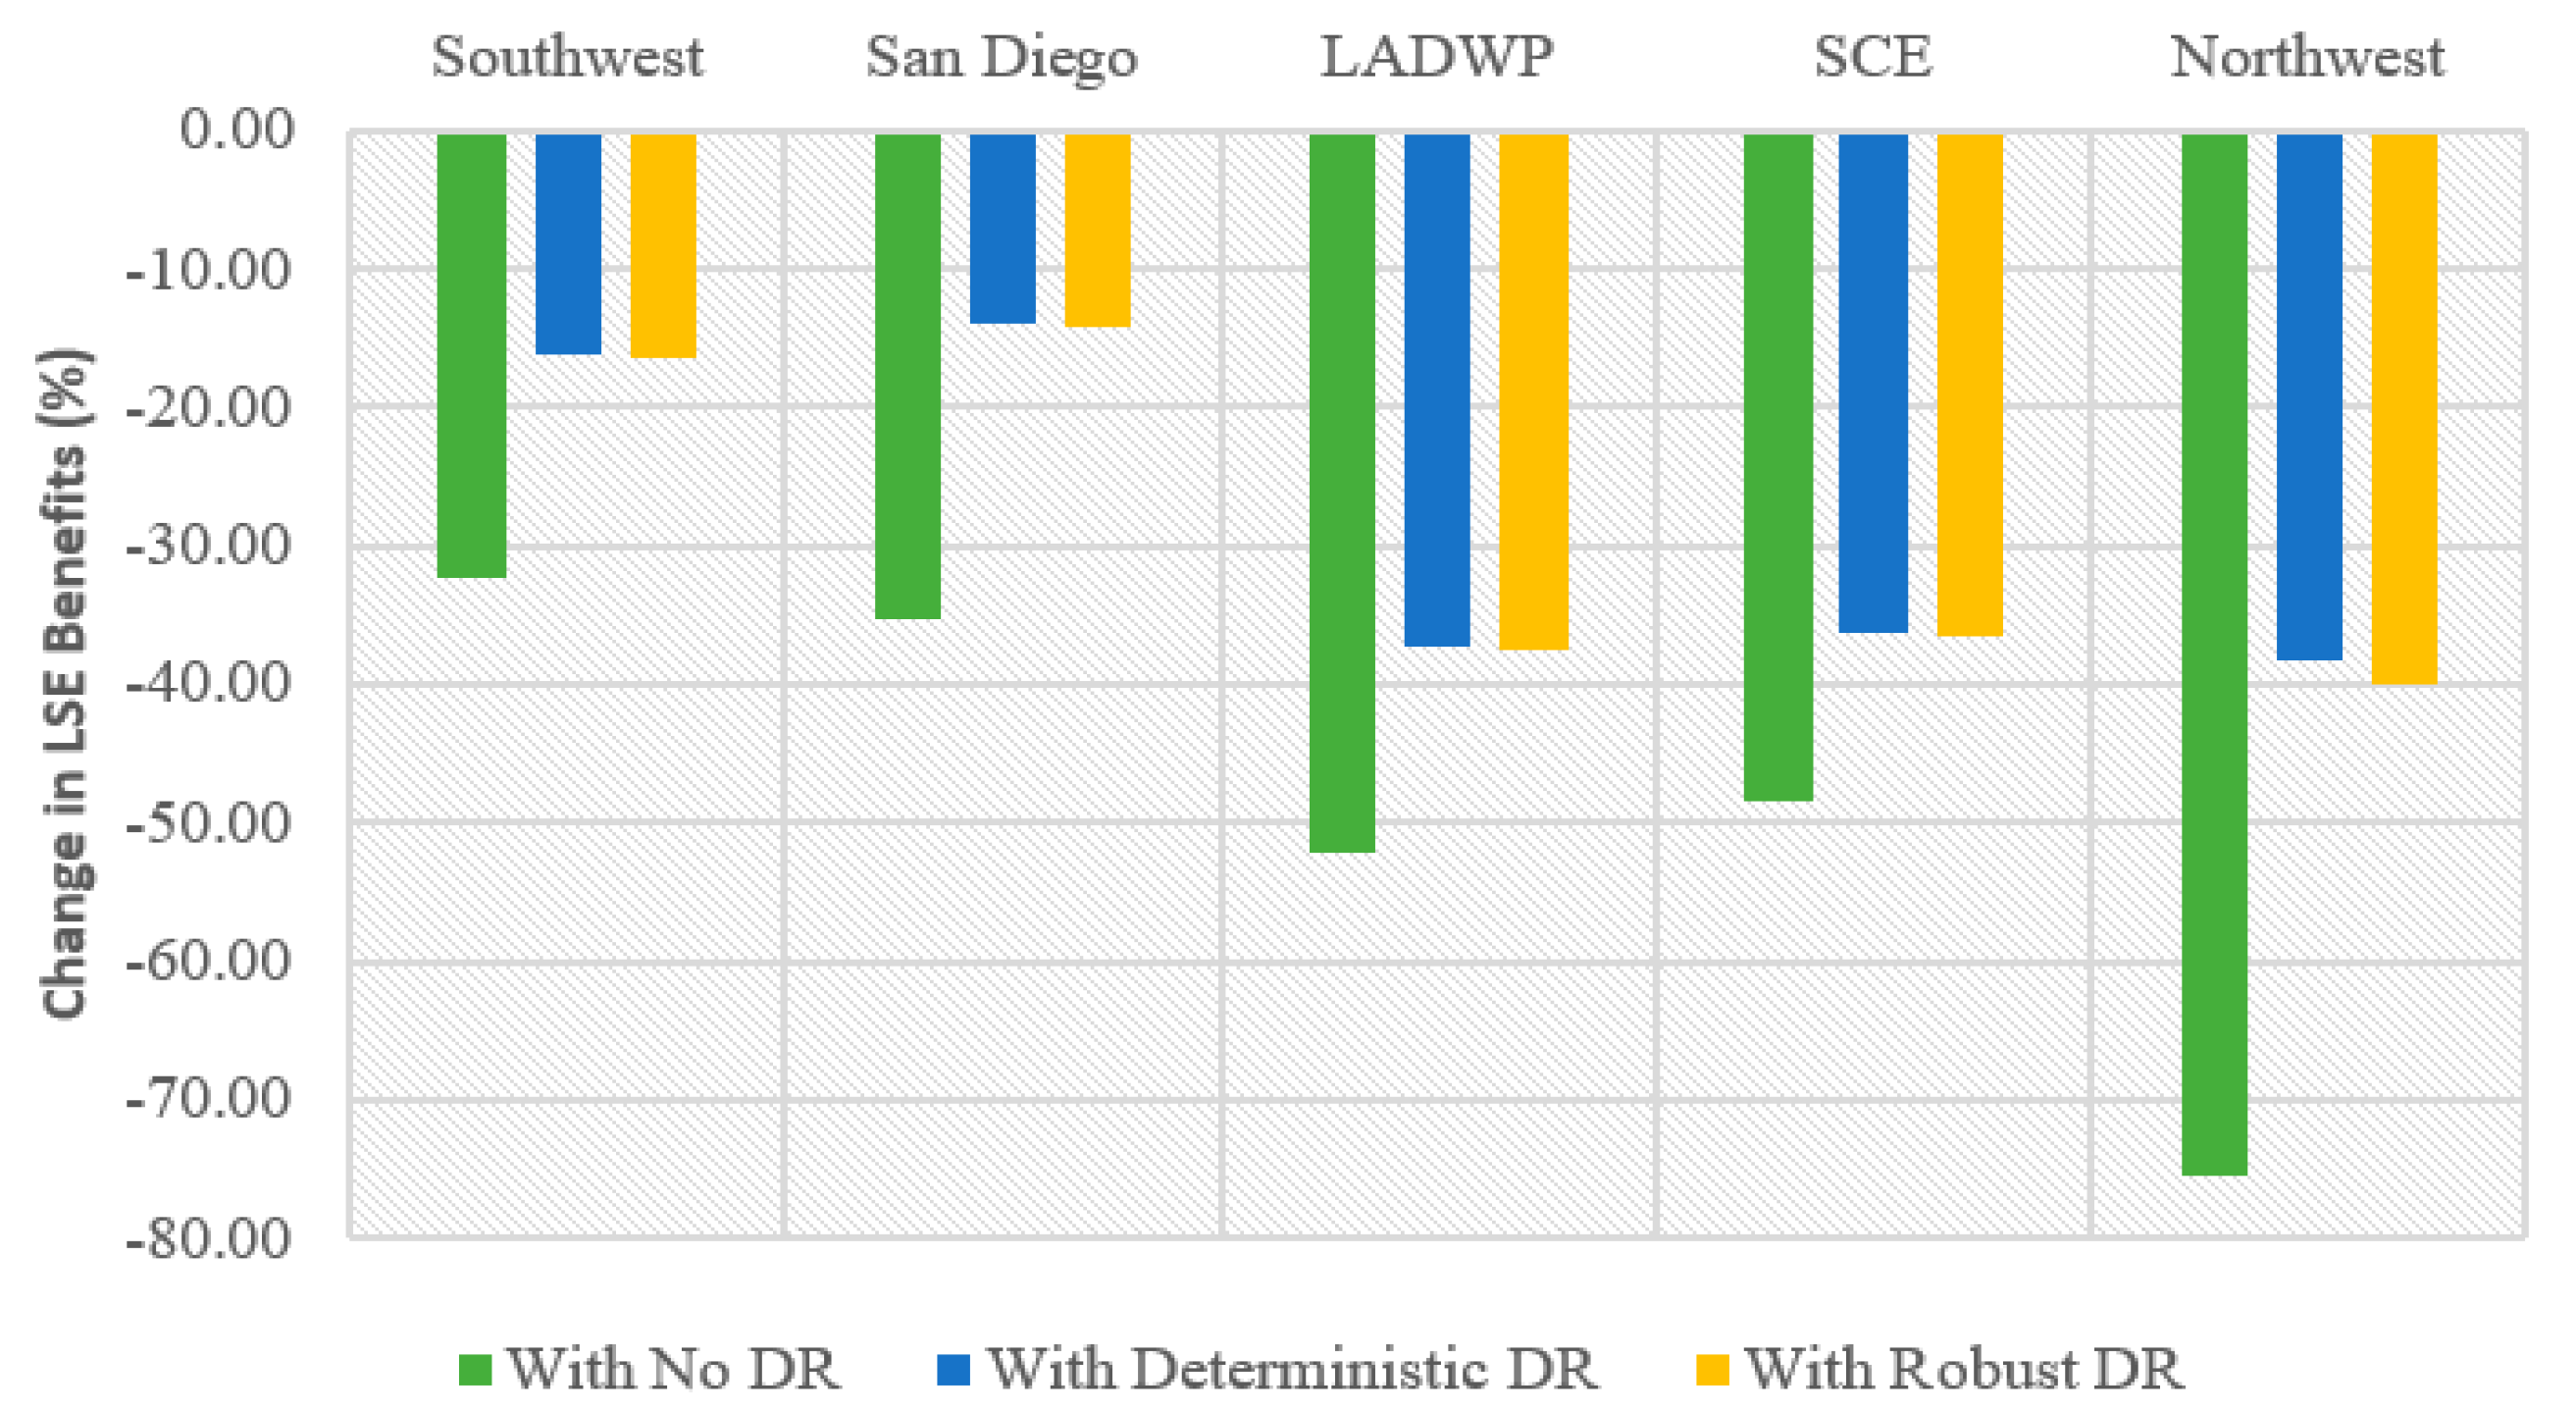
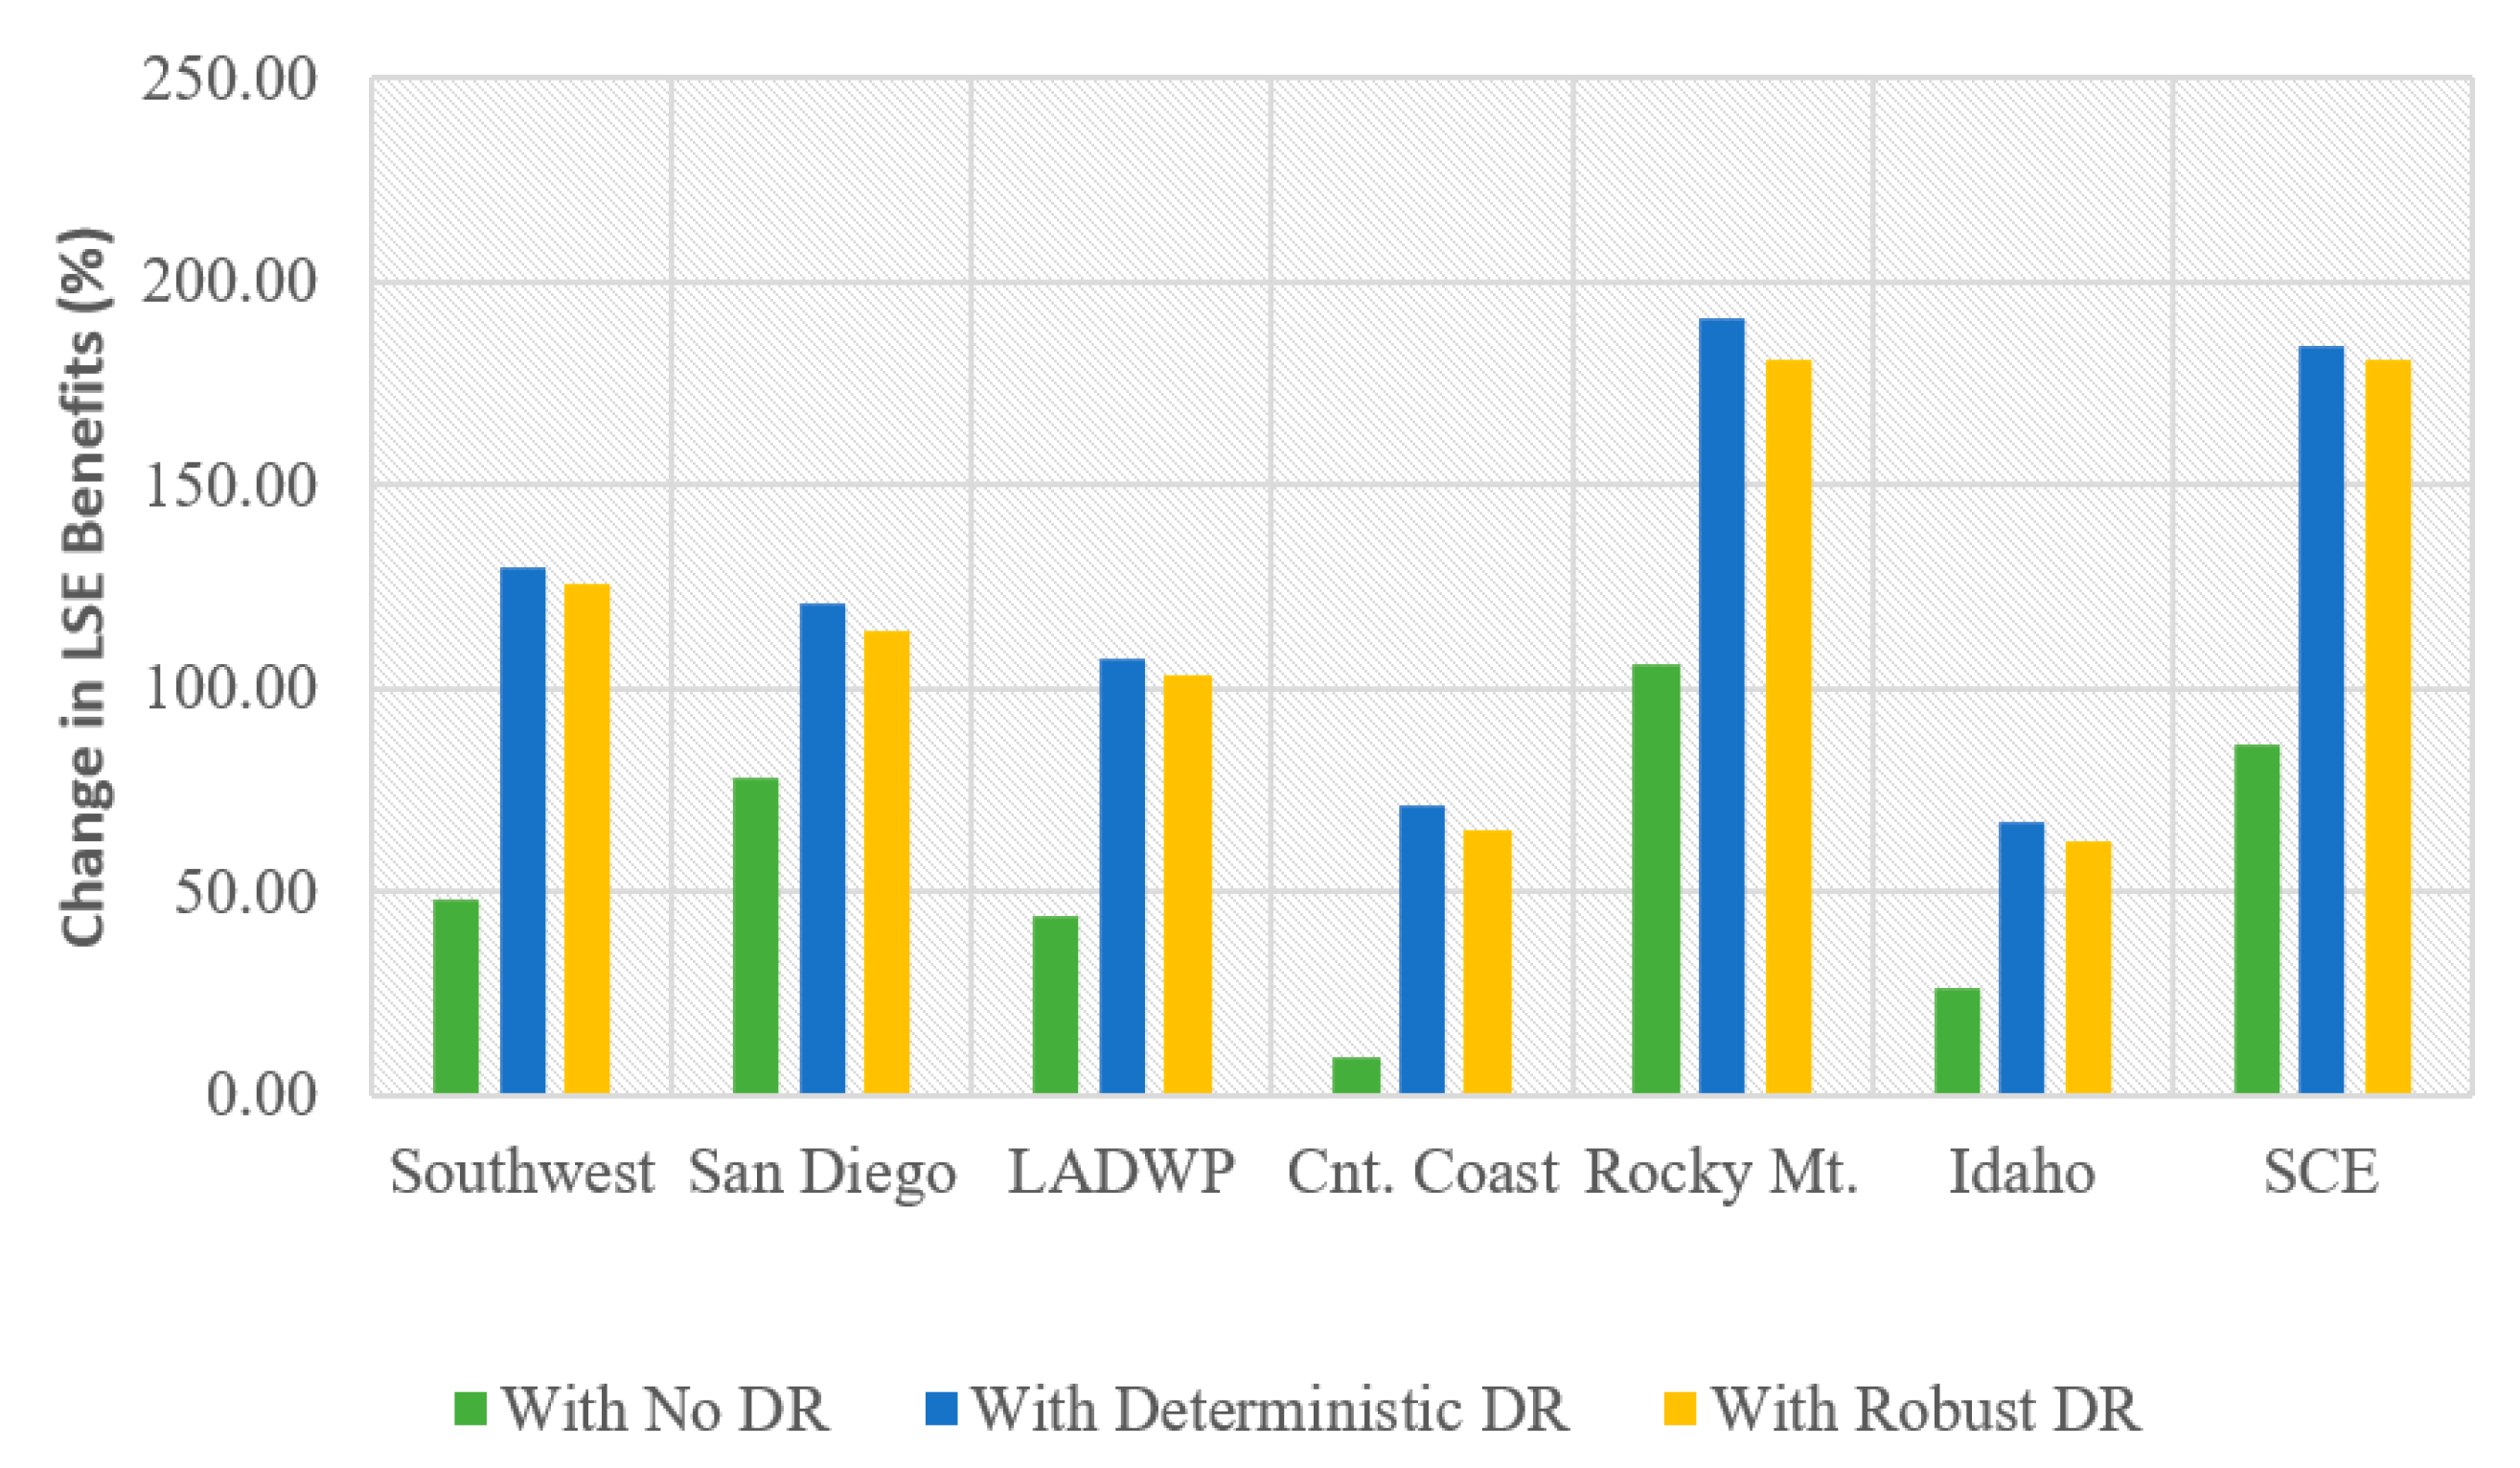
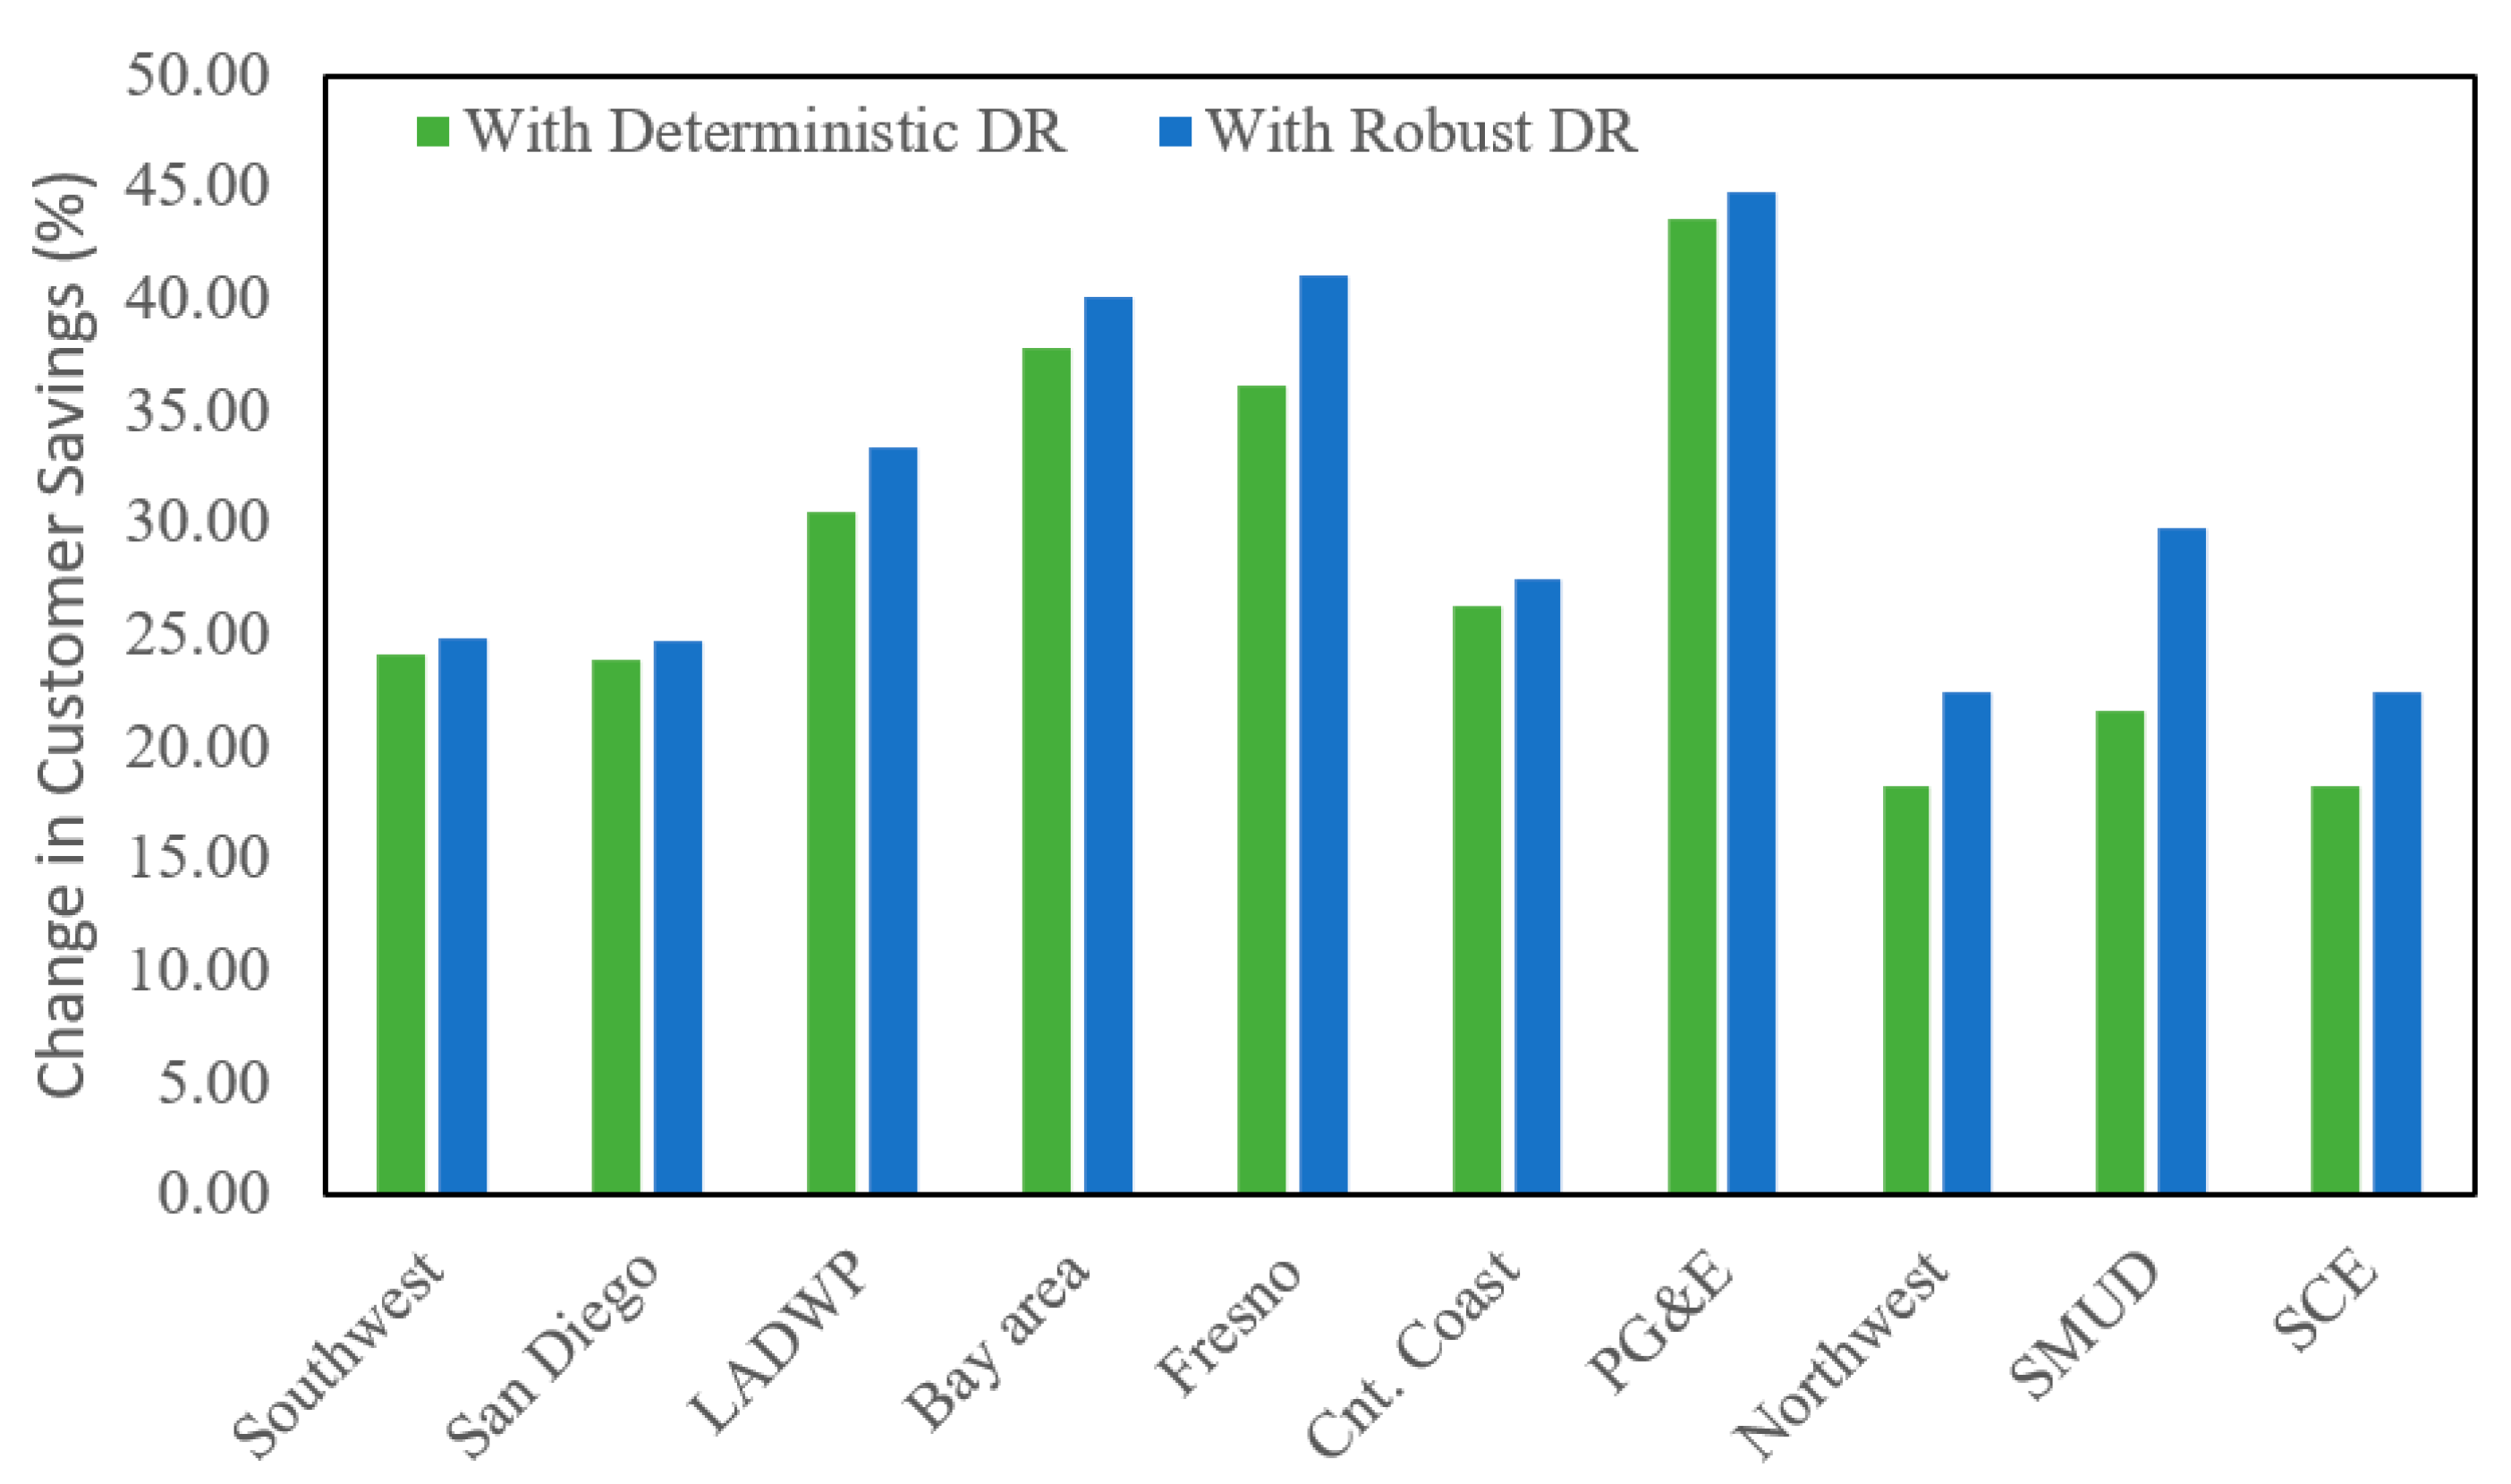
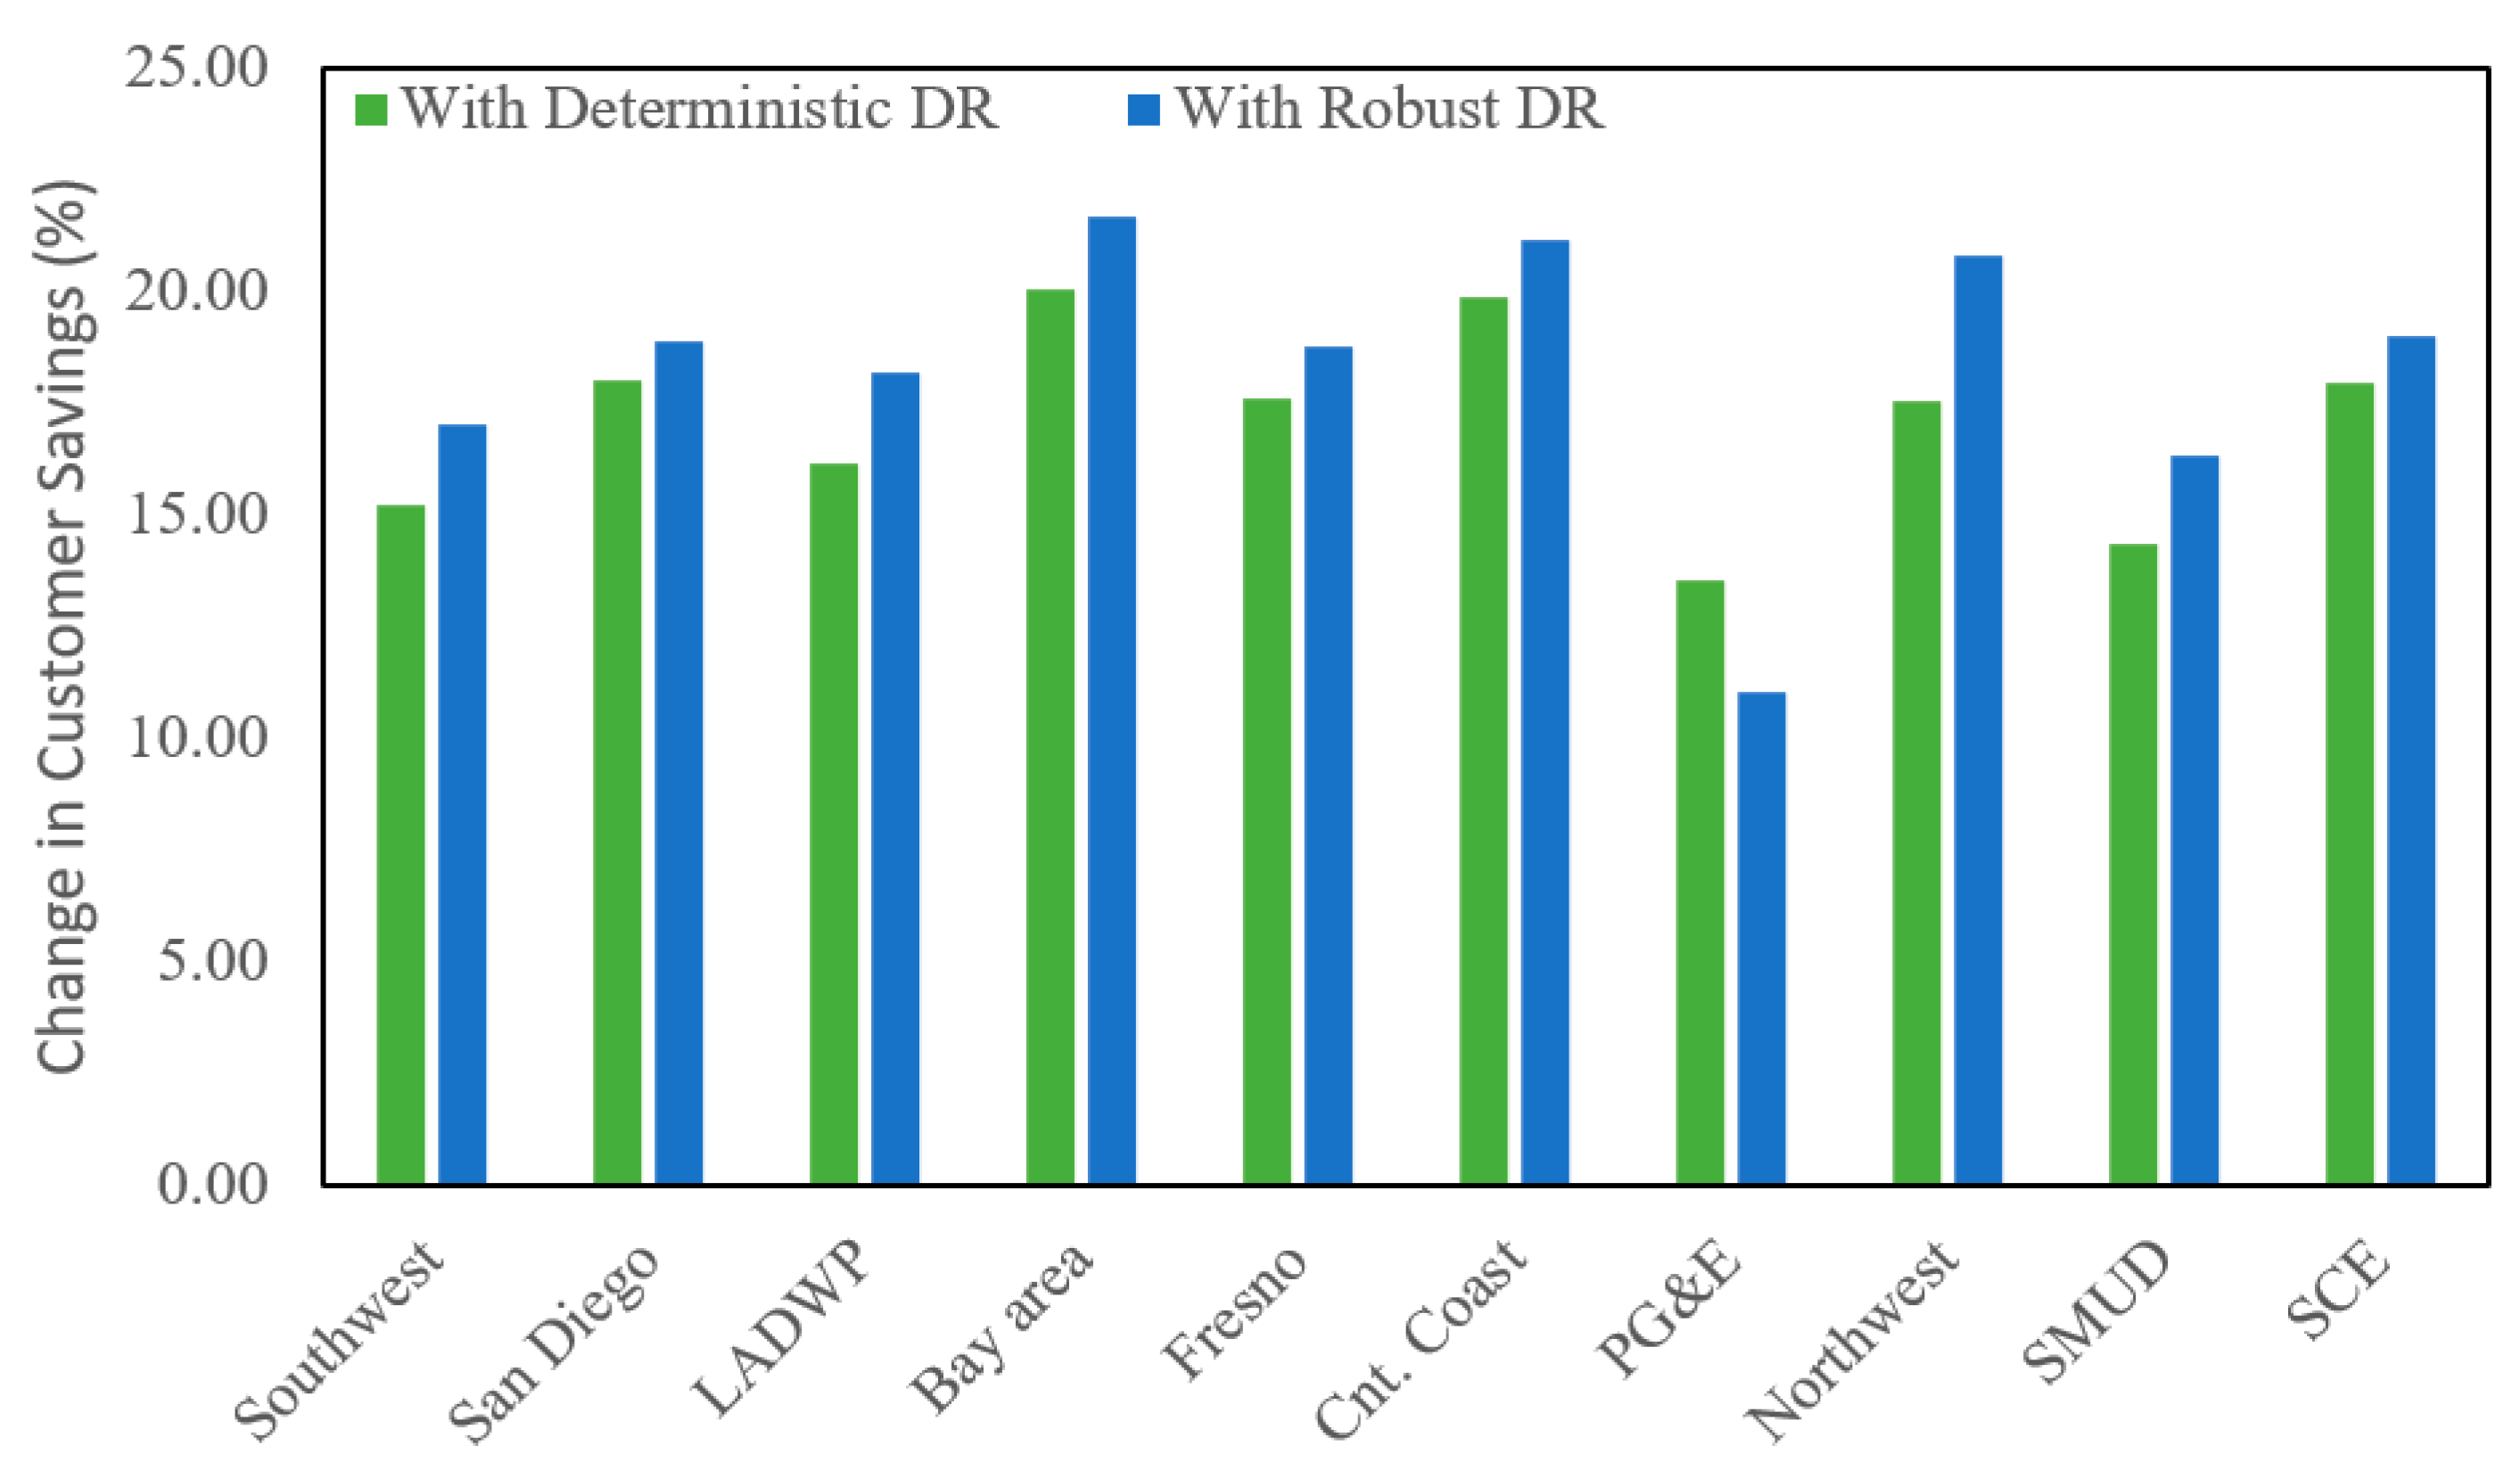
3.2.4. The Benefit of IBDR for Participants

Irrespective of whether renewable expansion leads to profit gains or losses for LSEs, IBDR remains an effective tool for mitigating peak prices and offering potential benefits to all participants. In this study, the IBDR program is designed on a regional basis, implying that each area implements the demand response program independently. Notably, the aggregation of demand response across different areas can lead to significant changes in market prices, even if the load variations within each area are relatively small. Two examples are provided in this subsection. Figure 6 depicts an example in which the LSE benefit changes. In all the shown areas, renewables are integrated to the grid, but the green bar shows the situation in which no DR is utilized, while the other bars show the results when DR programs are utilized. In the shown areas, LSEs incur losses due to RER expansion as all the values are negative. However, it is obvious that the losses corresponding to the robust DR are slightly higher (i.e., the orange bars). But DR programs help mitigate the impact, and the losses under DR programs are drastically less than in a situation without any DR (i.e., the green bar).
Figure 7 shows the results related to the second scenario showing the areas with LSEs gaining profit. It is obvious that the gains are drastically higher under the DR programs in comparison to the situation in which there is no DR program utilized (i.e., green bar).
Figure 8 and Figure 9, respectively, illustrate customer savings per unit of demand change in summer and winter. As expected, higher benefits for customers are available in summer, given that load variations during the peak season are more significant. It is also obvious that the robust DR enables the customers to gain more savings in general. The amount of customer savings is larger in the Northwest, SMUD, and SCE compared to the other regions. This is due to the fact that IBRD reduces the LSE benefit (to the benefits of the customers) to a larger extent since a larger incentive is offered to these participants. However, the incentive proposed to the PG&E Area during winter is not satisfactory enough to inspire a large portion of the customers to participate in the proposed IBDR, and, therefore, as shown in Figure 9, the customer savings in this area are less with the robust DR during winter.
It should be noted that the summer periods demonstrate the greatest impact on prices, which is attributed to both the higher sensitivity of LMP to load changes and the larger incentive payments made by LSEs.

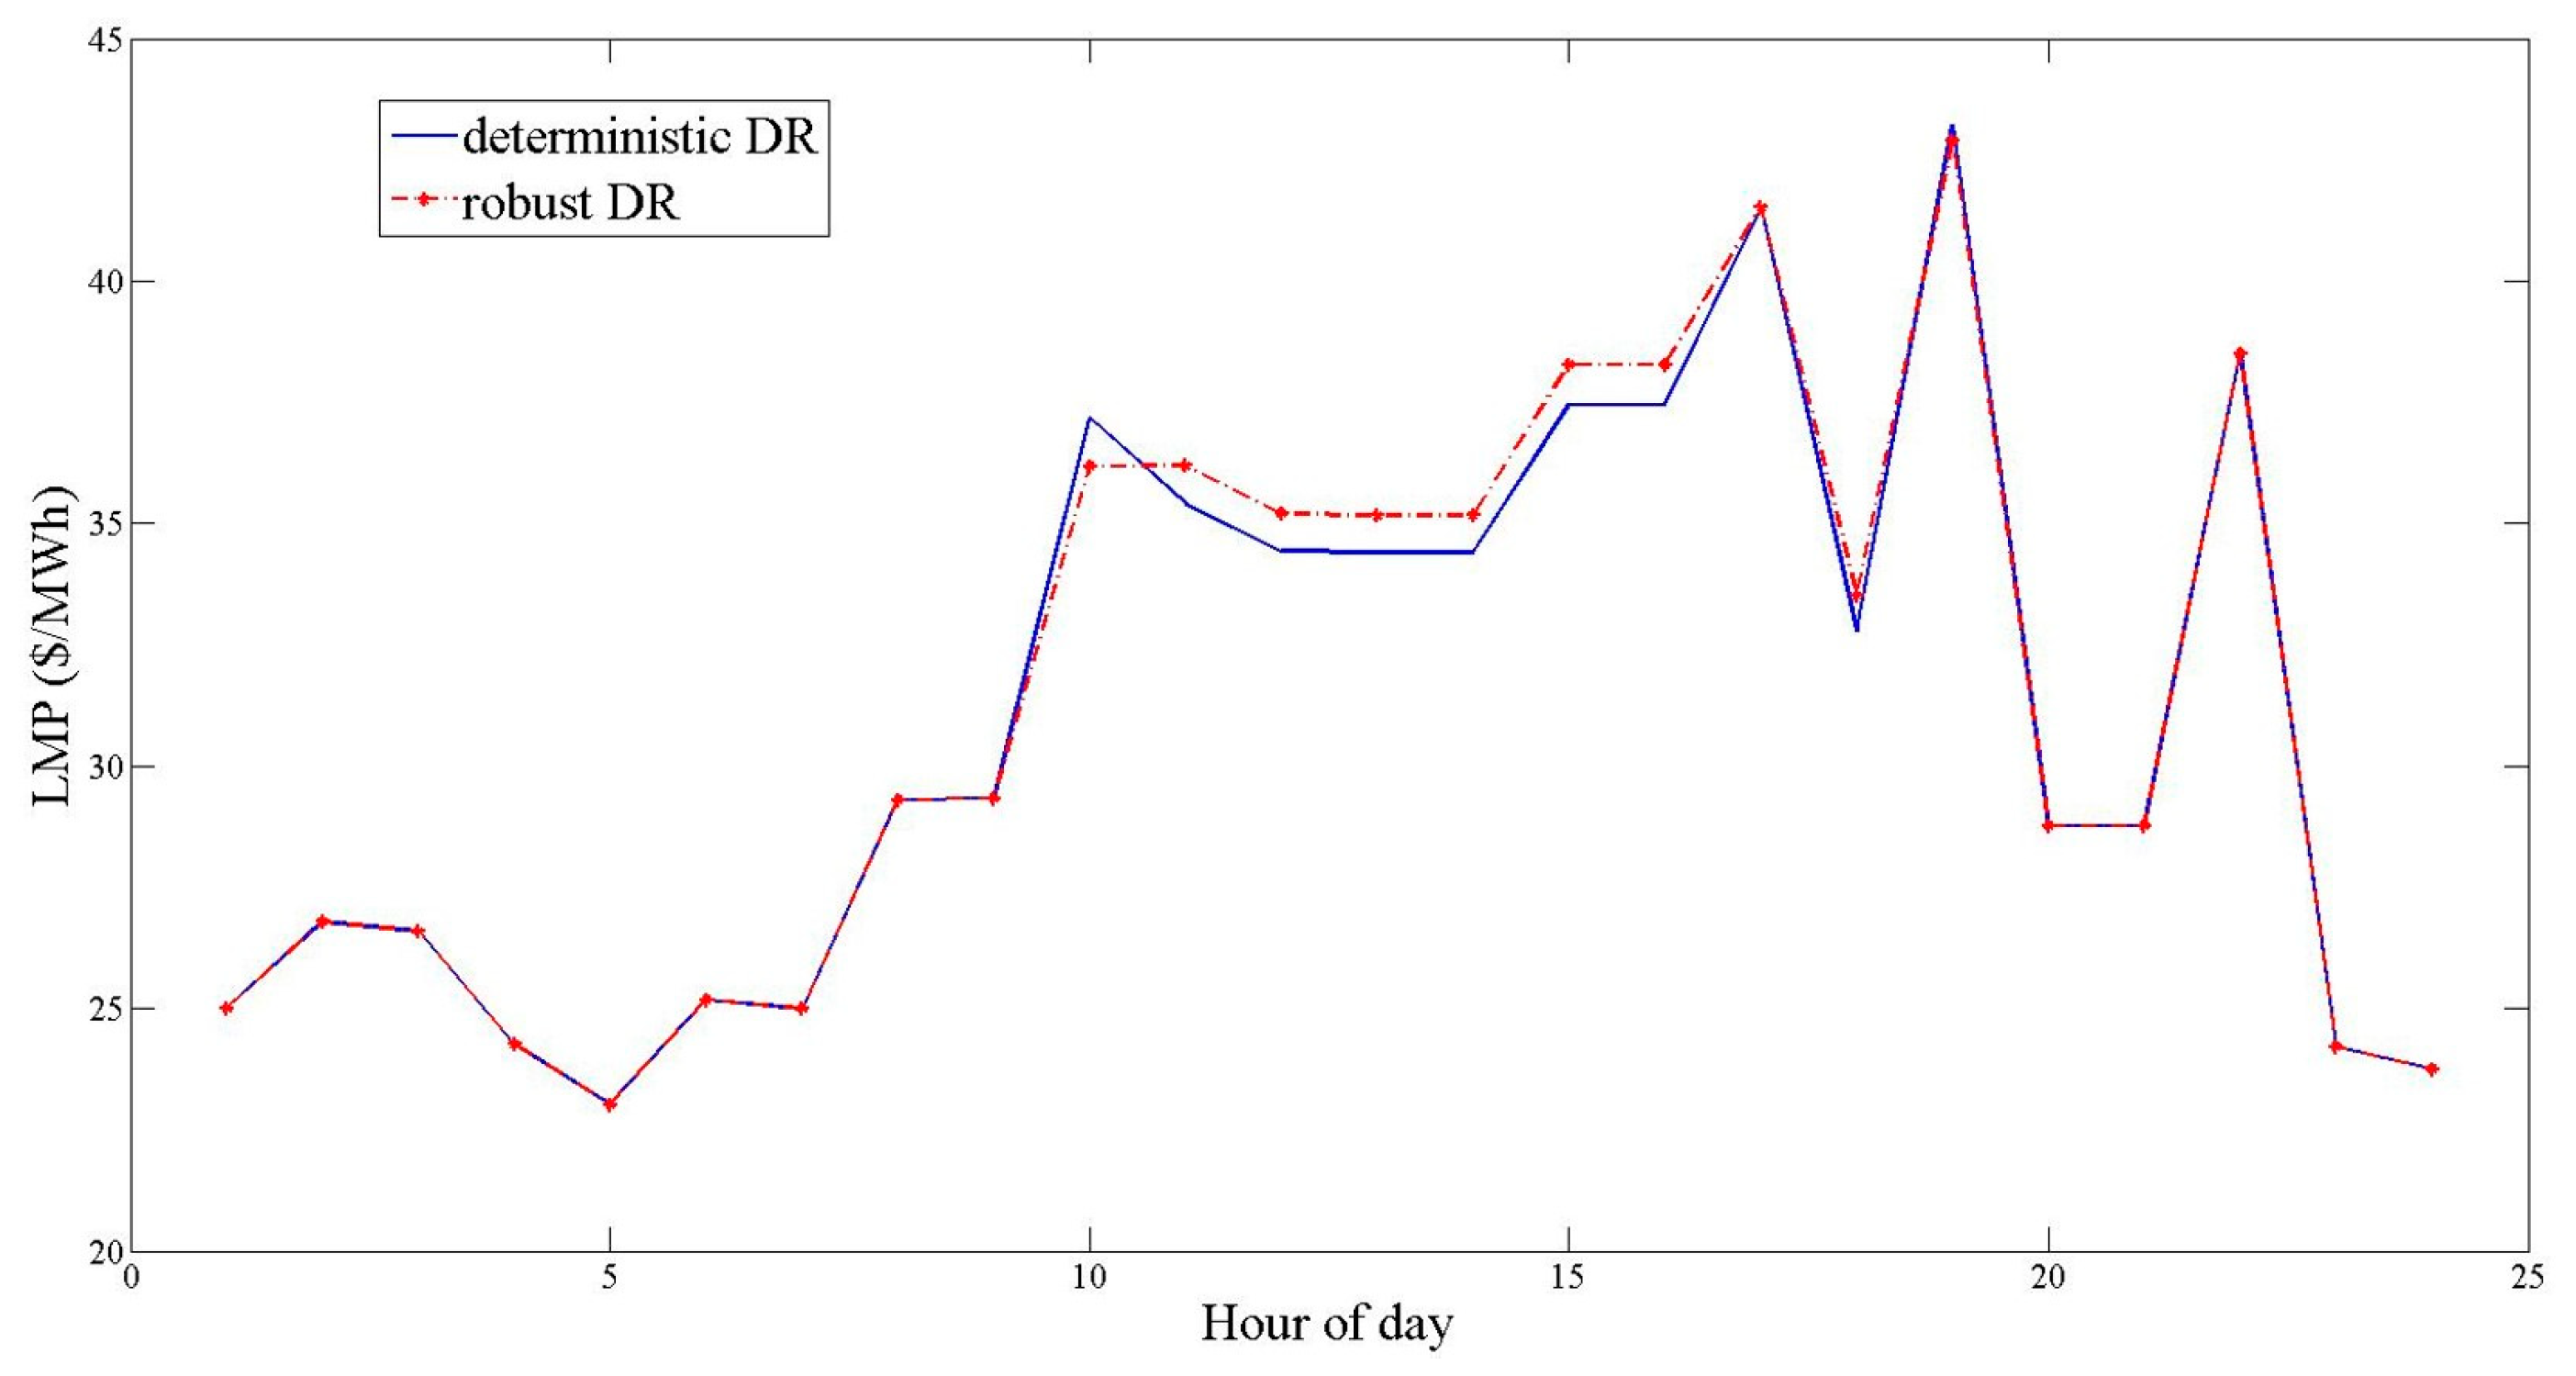
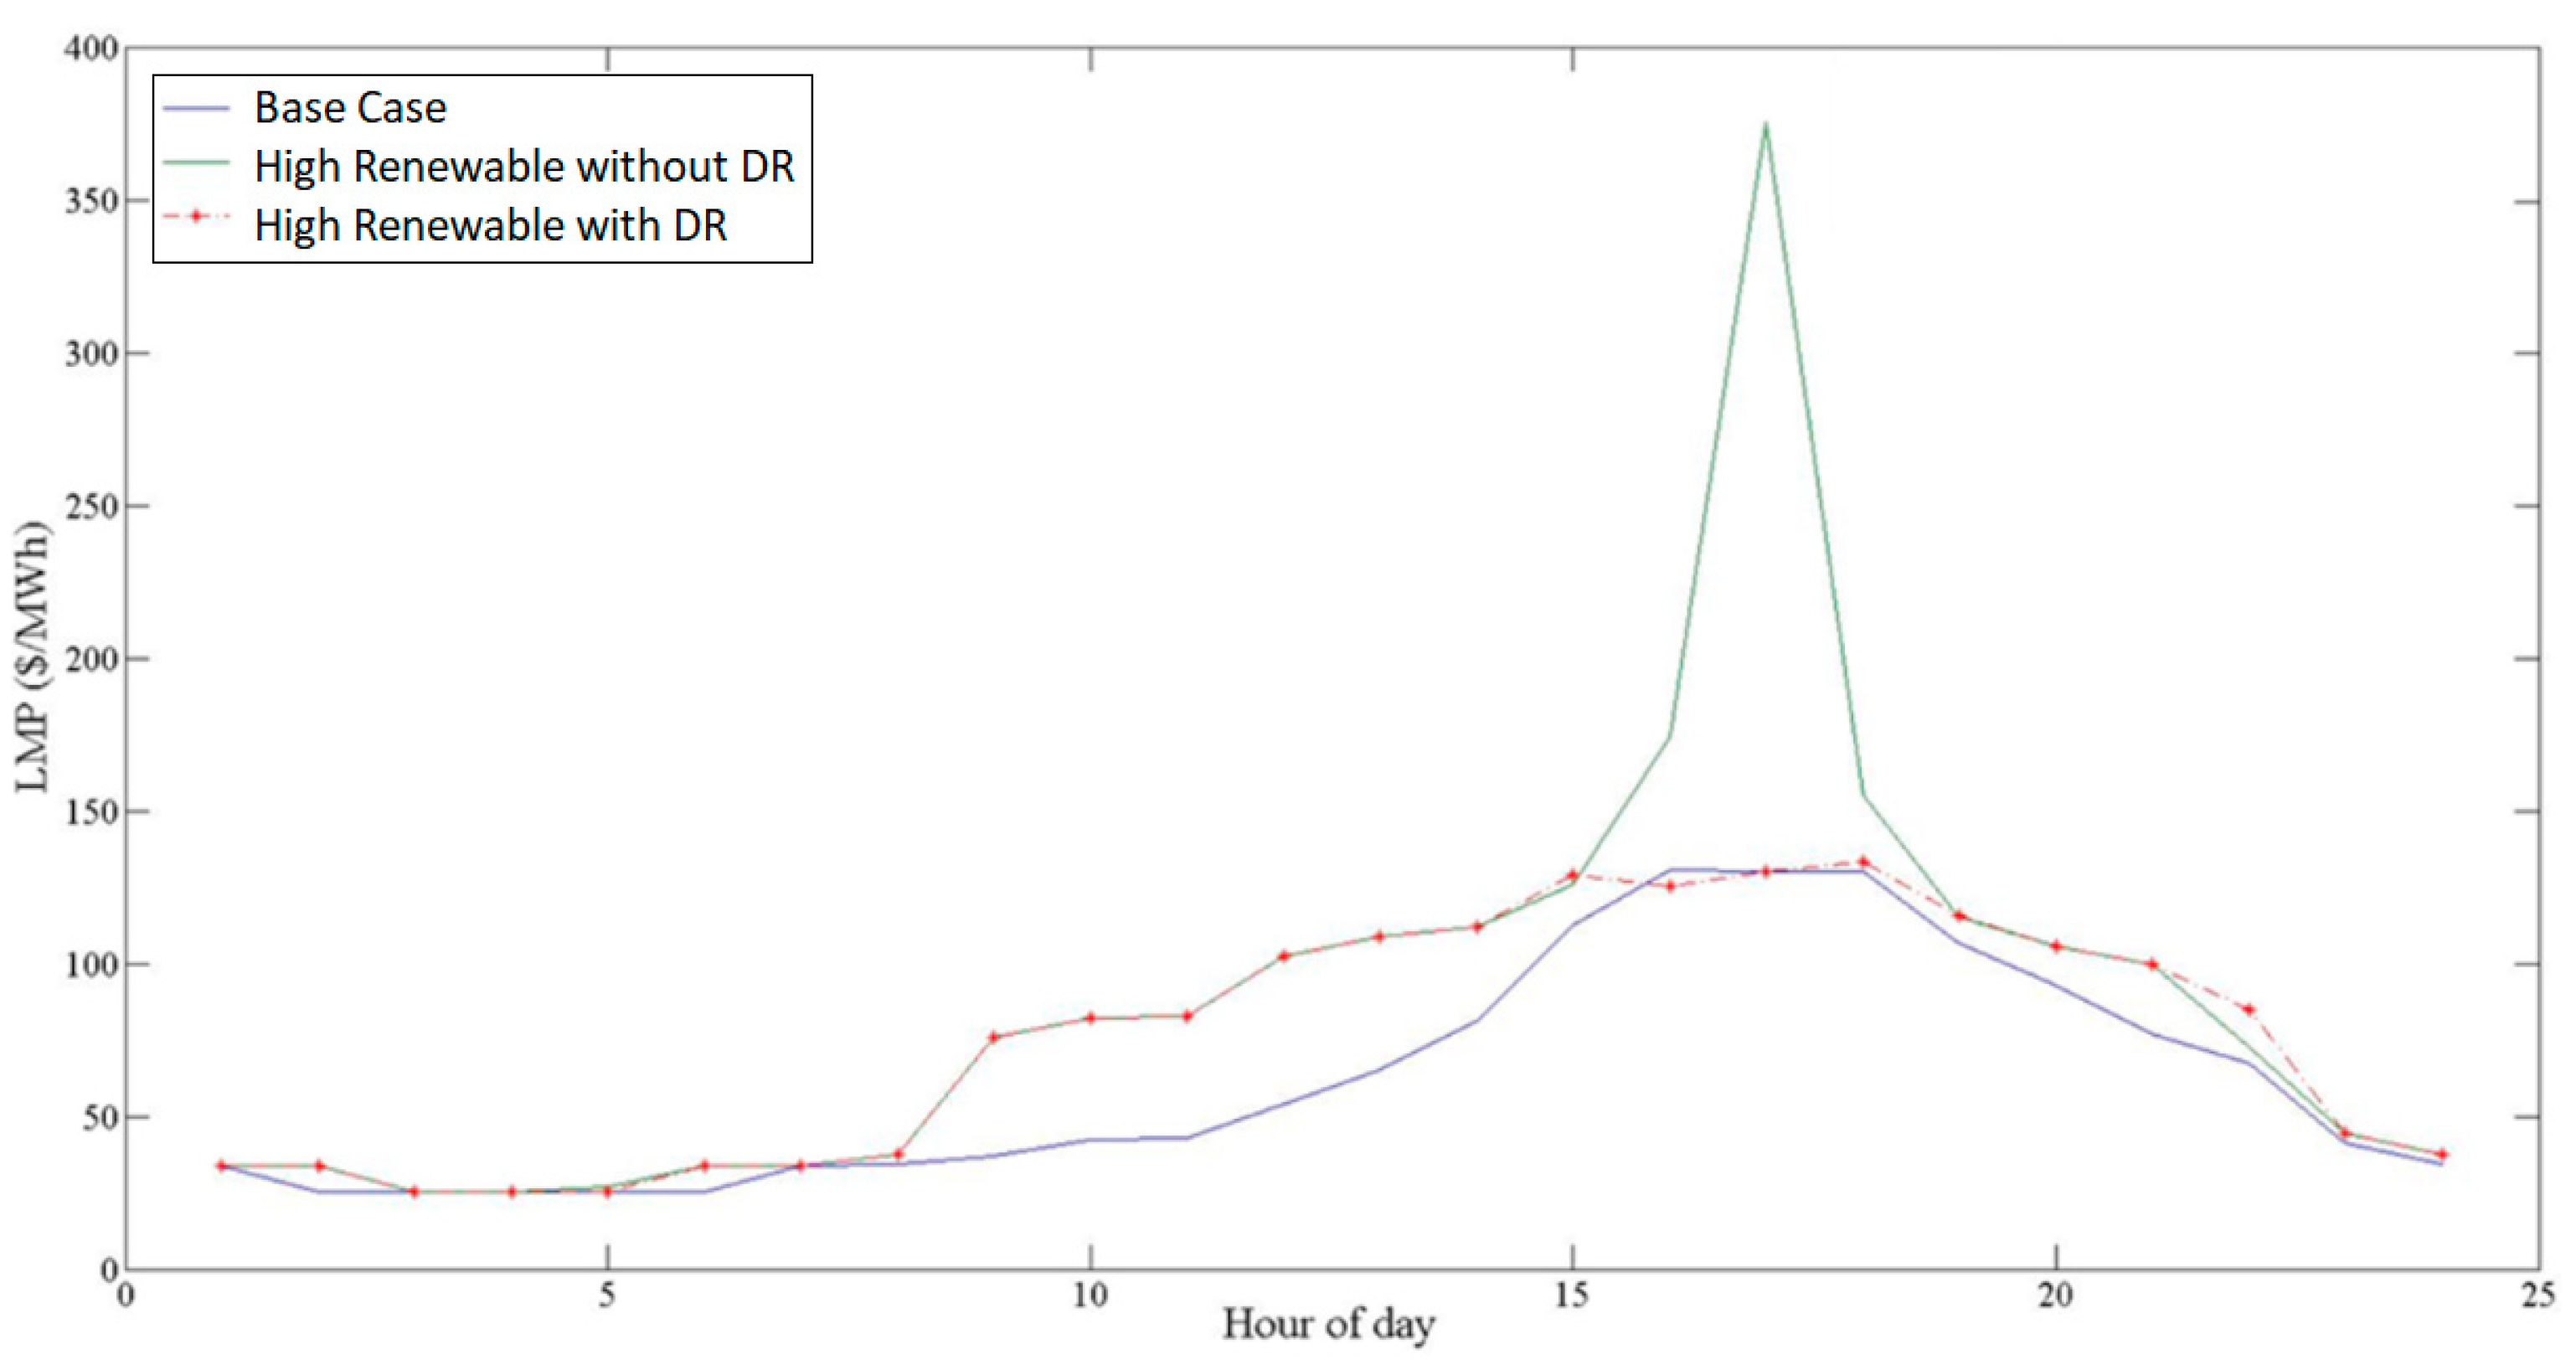
3.2.5. Effects of the Proposed IBDR on Electricity Price

The proposed IBDR program is expected to influence electricity market prices, particularly during peak periods. In addition, it should be noted that it benefits both LSEs and small customers. While the individual load changes and interruptions at each bus may be limited and have a minor impact on individual customers, the aggregation of these small changes across each area can significantly impact the overall load and, consequently, market price changes. Figure 10, Figure 11 and Figure 12 illustrate the LMP variation for the worst day in selected areas and time periods. It is obvious in all figures that LMP sharply rises at least once when no DR program is employed (green curve). However, the rise in the LMP is milder when DR programs are utilized. In Figure 10, the largest difference happens near the peak hour. The same pattern also happens in Figure 11 and Figure 12, but with a smoother deviation. In general, it can be concluded that the proposed IBDR increases LMP to some extent, which is beneficial to the sellers.

4. Conclusions

In this study, the impact of Demand Response (DR) programs on facilitating the high penetration of Renewable Energy Resources (RERs) is analyzed. While much of the literature emphasizes Price-Based Demand Response (PBDR) as the preferred approach for improving market operation, our results demonstrate that Incentive-Based Demand Response (IBDR) holds significant potential as well. IBDR can help mitigate sharp price fluctuations during peak load periods and offer additional benefits to all market participants.
The robust optimization with variations in the electricity market price and elasticity is employed for modeling the risks associated with renewable forecast uncertainty. As the number of different price scenarios covering various renewable forecast errors is extensively large, a design of experiment approach is utilized to make the analysis possible in a reasonable amount of time. The analysis following a deterministic approach raised a red flag in two cases: (1) when unexpected high Locational Marginal Prices (LMPs) cause opportunities to be missed and (2) when unexpected low LMPs cause economic losses. The comparison between robust and deterministic results reveals that although the robust design may result in some loss of benefit for Load Serving Entities (LSEs) under normal conditions, the robust approach becomes valuable when a large price deviation occurs.
One of the limitations of the proposed IBDR is that it cannot guarantee considerable incentives for the domestic users when there is a lower price risk.
Further studies can consider domestic consumer equipped local energy storage systems in the proposed method. These participants are able to purchase electricity when incentives are interesting in order to increase their savings. It is predicted that this behavior further shaves the peak demand since the LMP usually increases during peak times and, therefore, utilizing the stored energy will be beneficial to the end users.

Author Contributions

Conceptualization, R.J.H. and A.A.; methodology, R.J.H. and A.A.; software, A.A.; validation, R.J.H. and A.A.; formal analysis, R.J.H. and A.A.; investigation, A.A.; resources, R.J.H. and A.A.; data curation, R.J.H. and A.A.; writing—original draft preparation, A.A.; writing—review and editing, R.J.H.; visualization, R.J.H. and A.A.; supervision, R.J.H.; project administration, R.J.H. and A.A. All authors have read and agreed to the published version of the manuscript.

Funding

This research received no external funding.

Data Availability Statement

Restrictions apply to the datasets.

Conflicts of Interest

Author Ailin Asadinejad was employed by the company Hitachi Energy. The remaining authors declare that the research was conducted in the absence of any commercial or financial relationships that could be construed as a potential conflict of interest.

References

  1. Wigley, T.M.L. Coal to gas: The influence of methane leakage. Clim. Chang. 2011, 108, 601–608. [Google Scholar] [CrossRef]
  2. McKechnie, J.; Colombo, S.; Chen, J.; Mabee, W.; MacLean, H.L. Forest Bioenergy or Forest Carbon? Assessing Trade-Offs in Greenhouse Gas Mitigation with Wood-Based Fuels. Environ. Sci. Technol. 2011, 45, 789–795. [Google Scholar] [CrossRef]
  3. Li, X.; Qian, J.; Yang, C.; Chen, B.; Wang, X.; Jiang, Z. New Power System Planning and Evolution Path with Multi-Flexibility Resource Coordination. Energies 2024, 17, 273. [Google Scholar] [CrossRef]
  4. The White House. Fact Sheet: President Biden Sets 2030 Greenhouse Gas Pollution Reduction Target Aimed at Creating Good-Paying Union Jobs and Securing U.S. Leadership on Clean Energy Technologies; The White House: Washington, DC, USA, 2021.
  5. van Kooten, G.C. Wind power: The economic impact of intermittency. Lett. Spat. Resour. Sci. 2010, 3, 1–17. [Google Scholar] [CrossRef]
  6. Chen, H.; Pilong, C.; Rocha-Garrido, P.; Frogg, D.; Jayachandran, M.; Manno, D.; Sexauer, J.; Callagha, C.; Dropkin, R.; Mulhern, J.; et al. Grid Resilience With High Renewable Penetration: A PJM Approach. IEEE Trans. Sustain. Energy 2023, 14, 1169–1177. [Google Scholar] [CrossRef]
  7. Reulein, D.; Tiwari, S.; Hestvik, B.; Kvannli, A.; Pinel, D.; Andresen, C.A.; Farahmand, H. Large-scale Offshore Wind Development and Decarbonization Pathways of the Norwegian Energy System. In Proceedings of the 2023 19th International Conference on the European Energy Market (EEM), Lappeenranta, Finland, 6–8 June 2023; pp. 1–5. [Google Scholar] [CrossRef]
  8. Wilczak, J.M.; Akish, E.; Capotondi, A.; Compo, G.P. Evaluation and Bias Correction of the ERA5 Reanalysis over the United States for Wind and Solar Energy Applications. Energies 2024, 17, 1667. [Google Scholar] [CrossRef]
  9. Callaway, D.S. Tapping the energy storage potential in electric loads to deliver load following and regulation, with application to wind energy. Energy Convers. Manag. 2009, 50, 1389–1400. [Google Scholar] [CrossRef]
  10. Callaway, D.S.; Hiskens, I.A. Achieving Controllability of Electric Loads. Proc. IEEE 2011, 99, 184–199. [Google Scholar] [CrossRef]
  11. Lal, D.C.; Vineeth, V.; Devesh, S.; Chakrabarti, S.; Singh, S.N.; Ankush, S.; Alamgir, H.M. An improved decentralized scheme for incentive-based demand response from residential customers. Energy 2023, 284, 128568. [Google Scholar] [CrossRef]
  12. Gupta, S.K.; Ghose, T.; Chatterjee, K. Coordinated control of Incentive-Based Demand Response Program and BESS for frequency regulation in low inertia isolated grid. Electr. Power Syst. Res. 2022, 209, 108037. [Google Scholar] [CrossRef]
  13. Sarker, E.; Seyedmahmoudian, M.; Jamei, E.; Horan, B.; Stojcevski, A. Optimal management of home loads with renewable energy integration and demand response strategy. Energy 2020, 210, 118602. [Google Scholar] [CrossRef]
  14. Zheng, S.; Sun, Y.; Li, B.; Qi, B.; Shi, K.; Li, Y.; Tu, X. Incentive-Based Integrated Demand Response for Multiple Energy Carriers Considering Behavioral Coupling Effect of Consumers. IEEE Trans. Smart Grid 2020, 11, 3231–3245. [Google Scholar] [CrossRef]
  15. Yaghmaee, M.H. Incentive-Based Demand Response Program for Blockchain Network. IEEE Syst. J. 2024, 18, 134–145. [Google Scholar] [CrossRef]
  16. International Energy Agency IEA. Net Zero by 2050, A Roadmap for the Global Energy Sector. October 2021. Available online: https://www.iea.org/reports/net-zero-by-2050 (accessed on 1 April 2024).
  17. Halder, A.; Geng, X.; Kumar, P.R.; Xie, L. Architecture and Algorithms for Privacy Preserving Thermal Inertial Load Management by a Load Serving Entity. IEEE Trans. Power Syst. 2017, 32, 3275–3286. [Google Scholar] [CrossRef]
  18. Yao, L.; Teo, J.C.; Wang, C.-H. Resident-Centric Distributed Community Energy Management System. IEEE Trans. Sustain. Energy 2023, 14, 849–863. [Google Scholar] [CrossRef]
  19. Pandey, V.C.; Gupta, N.; Niazi, K.R.; Swarnkar, A.; Rawat, T.; Konstantinou, C. A Bi-Level Decision Framework for Incentive-Based Demand Response in Distribution Systems. IEEE Trans. Energy Mark. Policy Regul. 2023, 1, 211–225. [Google Scholar] [CrossRef]
  20. Ruiz, P.A.; Philbrick, C.R.; Sauer, P.W. Wind power day-ahead uncertainty management through stochastic unit commitment policies. In Proceedings of the 2009 IEEE/PES Power Systems Conference and Exposition, Seattle, WA, USA, 15–18 March 2009; pp. 1–9. [Google Scholar] [CrossRef]
  21. Sioshansi, R.; Short, W. Evaluating the Impacts of Real-Time Pricing on the Usage of Wind Generation. IEEE Trans. Power Syst. 2009, 24, 516–524. [Google Scholar] [CrossRef]
  22. Constantinescu, E.M.; Zavala, V.M.; Rocklin, M.; Lee, S.; Anitescu, M. A Computational Framework for Uncertainty Quantification and Stochastic Optimization in Unit Commitment With Wind Power Generation. IEEE Trans. Power Syst. 2011, 26, 431–441. [Google Scholar] [CrossRef]
  23. Mena, R.; Catalán, C.; Viveros, P.; Zio, E. A Two-Stage Stochastic Unit Commitment Model for Wind-integrated Power Systems Flexibility Assessment. In Proceedings of the 2022 17th International Conference on Probabilistic Methods Applied to Power Systems (PMAPS), Manchester, UK, 12–15 June 2022; pp. 1–6. [Google Scholar] [CrossRef]
  24. Zhang, X.; Ding, T.; Zhang, H.; Zeng, Z.; Siano, P.; Shahidehpour, M. A Two-Stage Stochastic Unit Commitment With Mixed-Integer Recourses for Nuclear Power Plants to Accommodate Renewable Energy. IEEE Trans. Sustain. Energy 2024, 15, 859–870. [Google Scholar] [CrossRef]
  25. Danish, M.; Ashraf, I.; Kirmani, S. Demand Side Management in Smart Home using Grey Wolf Optimization. In Proceedings of the 2023 International Conference in Advances in Power, Signal, and Information Technology (APSIT), Bhubaneswar, India, 9–11 June 2023; pp. 560–565. [Google Scholar] [CrossRef]
  26. Borenstein, S.; Holland, S. On the Efficiency of Competitive Electricity Markets with Time-Invariant Retail Prices. RAND J. Econ. 2005, 36, 469–493. [Google Scholar]
  27. Joskow, P.; Tirole, J. Retail electricity competition. RAND J. Econ. 2006, 37, 799–815. [Google Scholar] [CrossRef]
  28. Joskow, P.; Tirole, J. Reliability and Competitive Electricity Markets. Natl. Bur. Econ. Res. 2004, 38, 60–84. [Google Scholar]
  29. Sioshansi, R. OR Forum—Modeling the Impacts of Electricity Tariffs on Plug-In Hybrid Electric Vehicle Charging, Costs, and Emissions. Oper. Res. 2012, 60, 506–516. [Google Scholar] [CrossRef]
  30. Alfaverh, F.; Denai, M.; Sun, Y. A Dynamic Peer-to-Peer Electricity Market Model for a Community Microgrid With Price-Based Demand Response. IEEE Trans. Smart Grid 2023, 14, 3976–3991. [Google Scholar] [CrossRef]
  31. Schweppe, F.C. (Ed.) Spot pricing of electricity. In The Kluwer International Series in Engineering and Computer Science; Power Electronics & Power Systems, No. SECS 46; Kluwer Academic: Boston, MA, USA, 1988. [Google Scholar]
  32. Borenstein, S.; Jaske, M.; Rosenfeld, A. Dynamic Pricing, Advanced Metering, and Demand Response in Electricity Markets; UC Berkeley, Center for the Study of Energy Markets: Berkeley, CA, USA, 2002. [Google Scholar]
  33. Hirst, E.; Kirby, B. Ancillary Service Details: Dynamic Scheduling; ORN/CON-438; Oak Ridge National Laboratory: Knoxville, TN, USA, 1997; Available online: https://digital.library.unt.edu/ark:/67531/metadc699085/m2/1/high_res_d/631228.pdf (accessed on 1 April 2024).
  34. Chen, S.; Cheng, R.S. Operating Reserves Provision From Residential Users Through Load Aggregators in Smart Grid: A Game Theoretic Approach. IEEE Trans. Smart Grid 2019, 10, 1588–1598. [Google Scholar] [CrossRef]
  35. Wang, H.; Jia, Y.; Shi, M.; Xie, P.; Lai, C.S.; Li, K. A Hybrid Incentive Program for Managing Electric Vehicle Charging Flexibility. IEEE Trans. Smart Grid 2023, 14, 476–488. [Google Scholar] [CrossRef]
  36. Mohajeryami, S.; Doostan, M.; Asadinejad, A.; Schwarz, P. Error Analysis of Customer Baseline Load (CBL) Calculation Methods for Residential Customers. IEEE Trans. Ind. Appl. 2017, 53, 5–14. [Google Scholar] [CrossRef]
  37. Asadinejad, A.; Tomsovic, K. Optimal use of incentive and price based demand response to reduce costs and price volatility. Electr. Power Syst. Res. 2017, 144, 215–223. [Google Scholar] [CrossRef]
  38. Ben-Tal, A.; Nemirovski, A. Robust solutions of Linear Programming problems contaminated with uncertain data. Math. Program. 2000, 88, 411–424. [Google Scholar] [CrossRef]
  39. Li, Z.; Wu, W.; Zhang, B.; Wang, B. Robust Look-Ahead Power Dispatch With Adjustable Conservativeness Accommodating Significant Wind Power Integration. IEEE Trans. Sustain. Energy 2015, 6, 781–790. [Google Scholar] [CrossRef]
  40. Asadinejad, A.; Tomsovic, K.; Varzaneh, M.G. Examination of incentive based demand response in western connection reduced model. In Proceedings of the 2015 North American Power Symposium (NAPS), Charlotte, NC, USA, 4–6 October 2015; pp. 1–6. [Google Scholar] [CrossRef]
  41. Price, J.E.; Goodin, J. Reduced network modeling of WECC as a market design prototype. In Proceedings of the 2011 IEEE Power and Energy Society General Meeting, Detroit, MI, USA, 24–28 July 2011; pp. 1–6. [Google Scholar] [CrossRef]
  42. 20% Wind Energy by 2030 Increasing Wind Energy’s Contribution to U.S. Electricity Supply. U.S. Department of Energy; DOE/GO-102008-2578; December 2008. Available online: https://www.nrel.gov/docs/fy09osti/42864.pdf (accessed on 1 April 2024).
  43. Asadinejad, A. Electricity Market Designs for Demand Response from Residential Customers; University of Tennessee: Knoxville, TN, USA, 2017; Available online: https://trace.tennessee.edu/utk_graddiss/4378/ (accessed on 1 April 2024).
  44. Hamidi, R.J.; Bhadra, A.B. Protection and Monitoring of Digital Energy Systems Operation. In Energy Systems Transition: Digitalization, Decarbonization, Decentralization and Democratization; Vahidinasab, V., Mohammadi-Ivatloo, B., Eds.; Springer International Publishing: Cham, Switzerland, 2023; pp. 131–162. [Google Scholar] [CrossRef]
  45. You, X.; Wu, H.; Zhang, J.; Jin, S.; Ding, Y.; Siano, P. Optimal day-ahead and intra-day scheduling of energy and operating reserve considering fluctuating wind power. In Proceedings of the 2017 IEEE International Conference on Environment and Electrical Engineering and 2017 IEEE Industrial and Commercial Power Systems Europe (EEEIC/I&CPS Europe), Milan, Italy, 6–9 June 2017; pp. 1–6. [Google Scholar] [CrossRef]
  46. Li, Y.; Sun, Y.; Shandong Electric Power Research Institute; Li, N.; Han, Y.; Lin, J.; Pan, Z.; Hu, B. Day-ahead to intraday optimization model for power systems with reliability constraints. In Proceedings of the 2023 IEEE Sustainable Power and Energy Conference (iSPEC), Chongqing, China, 28–30 November 2023; pp. 1–5. [Google Scholar] [CrossRef]
  47. Shi, Q.; Chen, C.-F.; Mammoli, A.; Li, F. Estimating the Profile of Incentive-Based Demand Response (IBDR) by Integrating Technical Models and Social-Behavioral Factors. IEEE Trans. Smart Grid 2020, 11, 171–183. [Google Scholar] [CrossRef]
  48. Mohammadi, J.; Mosadeghi, M.; Rahimi-Kian, A.; Ghazizadeh, M.S. Impacts of load reduction offers on load profile. In Proceedings of the 2011 10th International Conference on Environment and Electrical Engineering, Rome, Italy, 8–11 May 2011; pp. 1–4. [Google Scholar] [CrossRef]
  49. Panapakidis, I.P.; Bouhouras, A.S.; Christoforidis, G.C. Utilizing Short-Term Load Forecasts in the Assessment of Demand Response Programs. In Proceedings of the 2019 8th International Conference on Modern Power Systems (MPS), Cluj Napoca, Romania, 21–23 May 2019; pp. 1–6. [Google Scholar] [CrossRef]
Figure 1. Price uncertainty in the daily peak hour of July in San Francisco from [43].
Energies 17 02545 g001
Figure 2. Price uncertainty in the daily peak hour of May in the Rocky Mountain area from [43].
Energies 17 02545 g002
Figure 3. Comparison of the deterministic and robust methods in San Diego in July. The minimum, maximum, and expected LMPs are shown with differently patterned lines in connection with the left axis (LMP), and the incentive bars are linked to the right axis (incentives).
Energies 17 02545 g003
Figure 4. Comparison of the deterministic and robust methods in the Southwest in October. The minimum, maximum, and expected LMPs are shown with differently patterned lines in connection with the left axis (LMP), and the incentive bars are linked to the right axis (incentives).
Energies 17 02545 g004
Figure 5. Comparison between the effects of robust and deterministic programs in Bay area in the month of June.
Energies 17 02545 g005
Figure 6. The variations in LSE benefit caused by RER expansion or the proposed IBDR during summertime.
Energies 17 02545 g006
Figure 7. The variations in LSE benefit caused by RER expansion or the proposed IBDR during wintertime.
Energies 17 02545 g007
Figure 8. Comparison between customer savings when the proposed IBDR is utilized and when it is not in use during summer.
Energies 17 02545 g008
Figure 9. Comparison between customer savings when the proposed IBDR is utilized and when it is not in use during winter.
Energies 17 02545 g009
Figure 10. Comparison of LMP variations during a day in August in Fresno area.
Energies 17 02545 g010
Figure 11. Comparison of LMP variations during a day in February in PG&E area.
Energies 17 02545 g011
Figure 12. Comparison of LMP variations during a day in October in Nevada area.
Energies 17 02545 g012
Table 1. Types and the number of generating units in the test grid.
Generation TypeNumber of UnitsGeneration TypeNumber of Units
Solar4Nuclear4
wind16Hydropower27
Gas-fired50Geothermal6
Coal-fired17Biomass3
Table 2. Comparison of LSE benefits following robust and deterministic IBDRs in different areas and months.
AreaAverage Case ($)Worst Case ($)Missed Case ($)AreaAverage Case ($)Worst Case ($)Missed Case ($)
JulyFebruary
Fresno−928334802511Fresno−67,22574345246
Nevada−938757536038Nevada−58,67311,49210,754
San Diego−10,02216,9026362San Diego−18,32744102519
Idaho−13,14751304559Idaho−209,91715,81814,758
Bay area−20,15266842939Bay area−193,07323,86320,679
SMUD−27,720872211,583SMUD−196,41219,16112,026
Rocky Mt.−43,850867716,102Rockey Mt.−269,84157,31282,120
Southwest−109,95355,27732,276Southwest−160,33651,14147,221
Disclaimer/Publisher’s Note: The statements, opinions and data contained in all publications are solely those of the individual author(s) and contributor(s) and not of MDPI and/or the editor(s). MDPI and/or the editor(s) disclaim responsibility for any injury to people or property resulting from any ideas, methods, instructions or products referred to in the content.

