Abstract
The railway transport system is a key factor supporting industrialization in all aspects of human activity. However, in order not to lose its importance, it must meet the challenge of modern civilization. The safety, reliability, and efficiency of railway transport, to a large degree, depend on using highly integrated electronics, which are very sensitive to various disturbances generated in the electric traction system and train or coming from the environment. One of the sources of electromagnetic disturbances are high-voltage (HV) power lines running close to the railway infrastructure. The purpose was to assess the electromagnetic impact of overhead HV transmission lines on buried signaling cables of the railway traffic control system crossbreeding with them. The levels of voltage induced in the cable under steady state and the earth fault in the HV line at various soil resistivity were estimated. A software tool based on a hybrid numerical method that combines circuit theory and electromagnetic field theory was used for computations. It was found that very high voltages may be induced in the signaling cables during earth faults in the HV lines, which may lead to serious interference or damage to the equipment. The results provide useful knowledge for implementing modern railway traffic control systems and protection measures.
1. Introduction
The railway transport system is a key factor supporting industrialization in all aspects of human activity. However, in order not to lose its importance, it must meet the challenge of modern civilization.
The functioning of railway traffic control devices seems easy to use: the train is running—it has a safe route set out through automation devices. These devices correctly indicate the location of trains, the location of turnouts, and signals on semaphores either automatically or by traffic dispatchers providing the drivers with appropriate signals. These signals also activate warning signals at rail-road crossings. However, it is enough that one of these elements works incorrectly and does not provide proper working conditions is damaged or disturbed by incompatible rolling stock, following which everything changes. The most important requirement for RTC (Railway Traffic Control) devices is that the devices or systems, after each failure, go into a safe state [1,2,3,4,5] without causing a threat. Active safety systems have been used in rail transport since its inception. It is impossible to ensure the safety, reliability, and efficiency of railway transport without such railway traffic control systems because the braking distance is greater than the distance at which the driver can observe the track, even when the train is traveling in a straight line with good visibility conditions. Active safety systems based on digital data transmission from trackside equipment to on-board equipment have been used for about seventy years. They are used on main lines with high traffic and are very diverse, both in terms of functions and technical solutions.
The train safety systems, especially active systems that incorporate highly integrated electronic devices or equipment, may be very sensitive to various disturbing signals generated in the electric traction system and train as well as electromagnetic signals coming from the environment, like being the result of lightning strikes, or the operation of electric power lines or radio-communication systems.
In the widely used insulated circuits on lines and stations with 3 kV DC electric traction, which are characterized by very high return currents, the most common cause of disturbances is the incorrect flow of traction currents. It results from the insufficient quality of electrical contact in traction connections. Train drivers, for example, feel that they may freely change the images of the lights on the semaphores. However, they cannot cause the display of an enable signal in front of the occupied circuit. In fact, by “suddenly moving the steering dial”, they can cause the current flow in the range of 700–1000 A and the temporary indication that the control circuit behind the semaphore is occupied. The control devices then immediately change the image from permitting to “red”. On a semi-automatic semaphore (with a red-and-white striped mast), changing the image then requires the traffic dispatcher to give an enabling signal again. On the automatic semaphore (with a white mast), after the strong current disturbance ceases, the free vacancy control circuit will show a vacancy. Then, a gradual change in images takes place automatically, restoring the correct signal [1,6]. The 3 kV traction network was designed for traction vehicles with a total power consumption of up to 3 MW. Electric locomotives EP07, EP08, and EU07 take up to 2 MW; newer passenger and heavy freight locomotives EP09 and ET22—3 MW; and the set ET41—4 MW. Irregularities in the maintenance of the return system can also cause disturbances in 700 kW EN57 units. The newest multi-system locomotives from Bombardier and Siemens must have a power limitation in Poland because their maximum power reaches a value of 6 MW. For example, the ELF, with a capacity of 3.25 MW, is adapted to a quick start-up and achieves the highest possible speed over a short distance. However, starting from the station, we can pass the turnout in the reverse direction, and in Poland, over 95% of turnouts, due to the large slant, have a speed limit of 40 km/h [1,6].
An obstacle in the work of the railway traffic control services was the need to supplement stolen traction chokes, temporary improvements to the insulation condition and traction connections, for which traction workers or road workers were responsible. Without traction connections with resistance values close to 6 μΩ, it is very difficult to provide the insulated circuits with the correct operating conditions. Also important in this regard was the introduction, from 1993, of jointless cable and station track circuits. To a large extent, the traction disturbances were eliminated, but the dependence on the low resistance of the trackbed still remained. The condition of the traction connections, indirectly controlled by isolated circuits, ceased to be of interest to power engineers. Contactless rails also began to be used. However, the lack of proper traction connections can damage SOT (Station Track Circuits). It can also cause energy and material losses through the harmful flow of return current through cable screens, structures, and metal elements. Junctionless SOT circuits use amplitude modulation and have a low level of noise immunity. A serious problem is their susceptibility to overvoltages of an atmospheric origin.
The introduction of electronic overlay circuits (EOCs) and jointless SOT circuits to the track caused their frequent failures as a result of overvoltages caused by lightning strikes. Better and better electronic solutions introduced since 1972—EIC-1 (electronic imposed circuits), 1990—EIC-6, 1996—EIC-3, and 1995—EDC (electronic digital circuits) are working to this day thanks to better protection against overvoltages and numerous repairs. However, they have low-power, local, compliant protections and are unprepared for high-energy impacts. The solutions of the overhead contact line structure used in Poland and its insufficient protection against storms create a very hostile environment for trackside electronic devices [1,2,6,7,8,9,10,11]. For example, a voltage exceeding 30 kV is introduced into the track through the horn spark gap during the lightning discharge from the overhead contact line [12,13,14,15]. Atmospheric surges appearing in the track can travel even several dozen kilometers. Technical requirements were developed in order to ensure appropriate levels of traction and local protection for RTC track-side devices. PKP also uses the available lightning discharge data from various available lightning location systems. This allows the nature of the discharge, location, time, and peak value to be assessed and put together with the recorded behavior of electronic trackside devices, i.e., disturbances and damage to various sensors and occupancy control circuits. This should facilitate the cooperation of the specialists on surge protection and h infrastructure and manufacturers of trackside equipment in the development of more effective technical solutions [6,13,16,17,18,19,20,21].
In general, the circuits of the RTC devices subjected to the influence of disturbances of the variable component of the traction current can be grouped as follows:
- Signal current circuits galvanically connected or magnetically coupled with traction return current circuits:
- Track occupancy control circuits;
- Train axle sensors;
- Circuits for continuous or temporary transmission of information.
- Circuits mechanically connected to the rails and galvanically isolated from the traction return current:
- Drive circuits;
- Switch position control circuits.
- Circuits located in the vicinity of rails, i.e., all circuits using cables arranged along the tracks, e.g., information transmission circuits in railway traffic control devices. The most common continuous current track circuits with insulated connectors are:
- Single-track track circuits;
- Two-track track circuits;
- Track circuits with a transformer reactor;
- Track circuits fed at the center [1,7].
The common feature of these circuits is the power supply with a frequency of 50 Hz, and the element of connection with railway traffic control devices is a phase-sensitive JRV (track relay type) relay. The safety criterion of these circuits’ operation is based on the amplitude and phase of the voltage supplying the track circuit. Another group of track circuits that are used in PKP are circuits without insulated joints, such as the following [22]:
- Electronic superimposed circuits (EON3);
- Junctionless station track circuits (SOT-2);
- Jointless line track circuits (SOT-1);
- Train passage sensor (EON-6 and EOC-1, 2, and 3).
The devices mentioned above work in different frequency ranges and have different parameters. In accordance with the requirements for the rolling stock, the used wheelsets should have a resistance level up to 0.05 Ω [1,6]. The overlapping circuits EON and EOC are checked by a shunt with an impedance of 0.2 Ω, and they also work correctly when this value is exceeded. These solutions are adapted to the very poor condition of the subgrade, of 1 Ω/km, and often work properly below this limit.
Additionally, increasing the speed of rail vehicles generates high traction currents with high harmonic content. These disturbances couple galvanically or inductively to the circuits of devices for transmitting track information—KHP-type vehicle (Train Braking Control)—used as part of safe train running control (BKJP).
Proper functioning of the RTC devices and systems can also be affected by phenomena occurring in overhead high-voltage (OHV) power lines running in common right-of-ways or crossing the railway infrastructure. The impact of power lines on railway devices is evident when some electricity is transferred from the overhead power lines to the coexisting cable lines and circuits of traffic control and telecommunication equipment. Such transmission of electric energy occurs as a result of the interaction between the electromagnetic field and galvanic coupling [23,24,25,26,27,28,29,30,31,32,33,34,35,36,37,38,39]. Usually, the impacts of the high voltages and the currents in power lines are considered separately. According to Maxwell’s theory, both of these effects occur simultaneously.
Inductive coupling between a power line and a signal cable results in exciting a longitudinal voltage (electromotive force) along the cable. The voltage is proportional to the derivative of the current in the power line and the mutual impedance between the power line and the signal cable. This impedance depends on the geometry of the cable and the power line, as well as the electrical properties of the systems and the environment. Long-term mutual inductive interaction during normal operation of power lines results from the geometric asymmetry in the arrangement of individual phase conductors of power lines in relation to the cable line. The potential excited in a cable can reach values of several dozen volts [23,26]. Even more dangerous are accidental single-phase earth faults in high-voltage networks with an effectively earthed neutral, which cause short-term inductive interactions. In such cases, single-phase earth fault currents can reach values up to several dozen kilo-amperes [23,24,25]. Even though the emergency state is normally switched off within about 0.5 s, the potential induced in cables may be very high as to cause damage to the cables and devices connected to them.
The impact of overhead high-voltage power lines on underground or aboveground metallic pipelines has been studied by many researchers [23,24,40,41,42,43,44,45,46,47,48]. The main concern in such cases is that the induced voltages may reach values high enough to cause electric shocks to the operating personnel as well as affect the operation of the equipment connected to the pipeline and the cathodic protection systems. Different methods of modeling and simulation have been used, ranging from analytical solutions of inductive coupling equations [47] or electric and magnetic field equations solved numerically [23,24,40,46], through numerical calculations based on circuit theory in ATP-EMTP [45] and on special methods like charge simulation or efficient simulation coupled with genetic algorithms [44], ending on numerical calculations based on full electromagnetic field theory equations solved with the finite element method in ANSYS Maxwell [48], the finite element and boundary element method [41,43], or using an artificial neural network [42]. Usually, a parallel direction of the power line and pipeline is considered in the studies, which is the worst case condition. Other arrangements were taken into account in [23,24,40] only. In the normal operation of the power line, the voltage distributions induced on the pipelines located symmetrically along the power line length exhibit the maximum value at the ends and the minimum value in the middle of the pipeline [41,42,43,45]. The induced current distributions show inverse behavior [42,43]. During power line faults to ground, the induced voltage distributions may look much different, depending on where the fault takes place [41,42,43,45,47]. The reported maximum values of the voltages induced in pipelines range from a few to several dozen volts during the normal operation of the power line [40,41,42,43,45,47], or a few volts per kilometer of pipeline length [47], and from several hundred volts to several kilovolts during fault conditions [41,42,43,45,47]. Some works [44,46] reported the maximum values of a few kilovolts for voltages induced in pipelines located aboveground directly under the HV power line in normal operation conditions. All of those analyses have been carried out in similar working conditions, like the length of parallel running the pipeline and the HV line, the distance to the power line, power line currents, and ground resistivity. No detailed parametric analysis of the influence of these factors on the induced voltages is provided. However, the effects of using technical solutions to reduce the voltages induced in pipelines are demonstrated [40,44,45,46,47]. The maximum permissible value of voltages induced in the pipeline due to personnel safety and pipeline integrity is regarded as 60 V [44] or 50 V (acc. to CIGRE) [46] in the steady-state condition. According to the ANSI/IEEE 80 standard [49], the safe touch potential limit is 15 V under normal load conditions and 350 V under fault current conditions [45,48]. In cathodically protected pipelines, the maximum permissible voltage limits are even lower, e.g., below 10 V or 4 V [40].
Other research concerns the impact of overhead HV transmission lines on underground HV cables [50] or aboveground distribution lines [51] running within the transmission lines right-of-ways. Similar methods of simulation may be used, as in the cases of coupling to pipelines described above. In [50,51], a professional CDEGS software package was used. The numerical modeling implemented in the software uses electromagnetic field theory based on full Maxwell equations and the method of moments. The voltages induced in the sheaths of a HV underground cable of different lengths (1 km, 3 km, and 5 km) running parallel to the overhead HV transmission line was calculated for three cases: when only the HV underground cable is energized; when only the overhead HV power line is energized; and when both the HV cable and line are energized [50]. It was shown that in the case of the HV cable and line both being energized, the sheath-induced voltage in the HV cable of 1 km length stays below the permissible limit of 65 V. The HV cables of 3 km and 5 km lengths result in the induced voltage being higher than the limit value. In order to lower these voltages, the use of additional earth wires located under the lowest phase conductors along the overhead HV transmission line and ground continuity conductor along the HV underground cable was proposed [50]. The analysis of voltages induced in the neutral conductor of the 25 kV distribution line located aboveground under the 110 kV transmission line shows that the capacitive coupling can effectively be reduced through multiple groundings of the neutral conductor at each distribution pole with a ground resistance of 25 Ω [51]. The voltage induced in the neutral conductor due to inductive coupling still remains as high as around 15 V, even if the neutral conductor is well grounded. It was also shown that a significant reduction in the magnetically induced voltage can be obtained by balancing the HV transmission line phase conductor geometry or the transposition of the three-phase HV transmission line [51].
Relatively little research can be found on the impact of high-voltage lines on the railway signal cables [52,53]. Article [52] presented the simulation of a longitudinal voltage induced magnetically (through inductive coupling) in the railway signal lines due to a short circuit current in the HV power transmission lines, in case the power and signal lines are laid in parallel along the rail-road bridge. The longitudinal induction electromotive force in the railway signal line was from 3.4 V to 4.5 V per meter of the parallel path of the lines in case the signal lines are laid in vacuum, concrete, or reinforcement, and around 0.3 V per meter when they are laid in the protective tray [52]. A multi-conductor transmission line theory was used in [53] to model the 30 km long AC traction network during normal operation in order to study the influence of locating the protective wire (overhead versus on the ground) on the traction return current (in the system: rail—protective wire—ground wire) and on the voltage induced in the railway signal cable core located on the ground. The voltage induced in the railway signal cable core, depending on the train’s position, reached values from 13.7 V to 55.3 V for the protective wire laid overhead and from 16.1 V to 84.7 V for the protective wire laid on the ground [53]. The higher values of the voltage induced in the signal cable when the protective wire is laid on the ground result from the fact that this position of the protective wire causes an increase in the traction return current in the rail and ground wire, which are located close to the signal cable. According to the Chinese standard on the tolerance limits of threat to telecommunication lines, applied in this study, the allowable value of the voltage induced in the railway signal cable core is 60 V [53].
The aim of the present study is to assess the electromagnetic impact of an overhead high-voltage transmission line on a buried signaling cable of a railway traffic control system running along the railway track. Unlike most of the research that can be found in the literature, for example, reported above, where the worst-case condition of the parallel location of the source and the exposed line are considered, the present study is concerned with assessing the threat in the real case, when the HV transmission line crosses with the railway at an angle of around 60°. Different operation conditions of the overhead HV transmission line are analyzed:
- Normal, steady-state operation with symmetrical and asymmetrical loads. In this case, the inductive coupling is considered. The capacitive coupling may be neglected, as it is of concern mainly when the exposed circuit is located aboveground [46].
- Phase-to-ground fault. Inductive and conductive couplings to the railway signaling cable are considered.
The influence of factors such as the asymmetry of phase currents, distance of the fault place from crossbreeding the HV power line with the railway signaling cable, and ground resistivity was determined.
In the presented research, the electromagnetic effects of the HV transmission line on the buried signaling cables in the low-frequency range only are considered. The electromagnetic effects of transient processes, such as lightning, switching overvoltages, and overcurrents, are also very important. The analyses of such high-frequency electromagnetic phenomena generally require more rigorous simulation and numerical methods as well as much more computational time and power. Hence, the low- and high-frequency phenomena are usually considered by researchers separately, which means that the results of both of these analyses usually cannot be compared for the same case studies. Taking the above into account, in order to complete the assessment of the threat related to the electromagnetic influence of the HV transmission lines on the signaling cables, the analyses of lightning, transient phenomena, and switching phenomena have also been planned for the future.
2. Case Simulation and Methods
In order to solve the problem under study, the professional software tool SESTLC (Transmission and Distribution Line Calculator) [54] was used. This software is a numerical tool developed to estimate the exposure of metallic infrastructure, typically pipelines or railways, to inductive and conductive electromagnetic disturbances from nearby electric power lines (not necessarily parallel to them) as well as the electric and magnetic fields associated with arbitrary configurations of parallel transmission and distribution lines. The main functions of SESTLC are as follows:
- Electric and magnetic field calculations;
- Calculation of inductively coupled disturbances in the steady-state condition;
- Calculation of inductively and conductively coupled disturbances in the fault condition;
- Modeling a jagged line (pipeline, railroad, etc.);
- Line parameter calculation.
The analysis in SESTLC is carried out in the following steps [54]:
- The line parameter matrix is determined. The conductor-based line parameters are computed, taking into account the presence of a uniform soil. If the phase or shield wire is a bundle of conductors, a bundle reduction procedure is applied to retrieve the phase-based line parameters. If the sequence components are requested, a neutral wire elimination procedure is applied.
- The current induced in the neutral wire is computed, assuming the transmission line is infinitely long.
- In the steady-state conditions, the potentials induced in the exposed line due to the currents flowing in the phase and shield wires are calculated.
- During a single phase-to-ground fault on a transmission line (or a substation), the faulted structure discharges a large current into the earth and raises the soil potential in its vicinity. The fault current distribution in the neutral wire and the towers is calculated. The ground potential distribution is computed by assuming point sources (or hemispherical electrodes if close enough to the pipe). If the pipeline is coated, the coating stress voltages (difference between the pipe ground potential rise and the soil potential at the coating surface) are also computed.
- The electric and magnetic fields produced by the phase and neutral wires are computed. The presence of transmission line towers is taken into account in the computation of the electric field.
2.1. Computational Method Implemented in SESTLC
The computational method implemented in the software is a hybrid method that uses a combination of circuit theory (“long conductor” numerical approach) and electromagnetic field theory (“short conductor” numerical approach). At first, the space where the considered physical phenomena occur is subdivided into spatial zones for which the circuit theory or field theory may be used exclusively, depending on the zone considered. Then, the zones for which the field theory is applied are converted into equivalent zones described by appropriate circuit theory equations [55]. Thus, the problem solution comes from using the classical circuit theory. The computation goes as follows:
- Based on field theory, determine the ground impedances of all grounding systems and the impedance to earth per unit length of long buried conductors. These values constitute shunt impedances for the circuit theory model.
- Based on simplified field theory formulas, determine the self and mutual impedances of all long conductors, such as phase wires, skywires, pipelines, and mitigation wires (a mitigation wire is any long, bare, buried wire that, by default, is bonded neither to the transmission towers nor pipelines).
- Use the impedance values determined in steps 1–2 to create a circuit model representing the long conductors. The model should also include the source voltages, the impedances of transmission line conductors, and any ground impedances specified by the user.
- Solve the circuit model created in step 3 using the generalized double-sided elimination method. The potentials and currents computed in the pipelines, other exposed lines, and mitigation wires are the result of electromagnetic coupling termed as “inductive interference effects”.
- Once the currents in all the conductors are known, including those injected into the grounding systems made up of short conductors, use the field theory to calculate the earth potentials as well as the electrical potentials and currents in nearby long conductors, being the result of the currents flowing from the grounding systems to the earth. These potentials and currents in the long conductors are due to conductive effects in close proximity, which are neglected by the circuit model created in step 3. They can be termed as “conductive interference effects”.
- Summate the inductive and conductive interference effects determined in steps 4 and 5 to obtain the final results. If pipeline coatings have been specified to maintain a constant resistance for varying stress voltages, the computation ends. Otherwise, subsequent iterations are performed (starting with step 1 and skipping step 2) with new coating resistance values corresponding to the computed stress voltages, until successive iterations produce similar results.
The computational methods for each step are described in detail in [55], and an example of the application of the computation algorithm for parametric analysis is shown in [56].
2.2. Description of the Case under Study
The case under study is composed of a 30 km long underground signaling cable of the railway traffic control (RTC) system, running along the railway track, which crosses with a 110 kV overhead transmission line at an angle of 60°. The situation is presented in Figure 1.
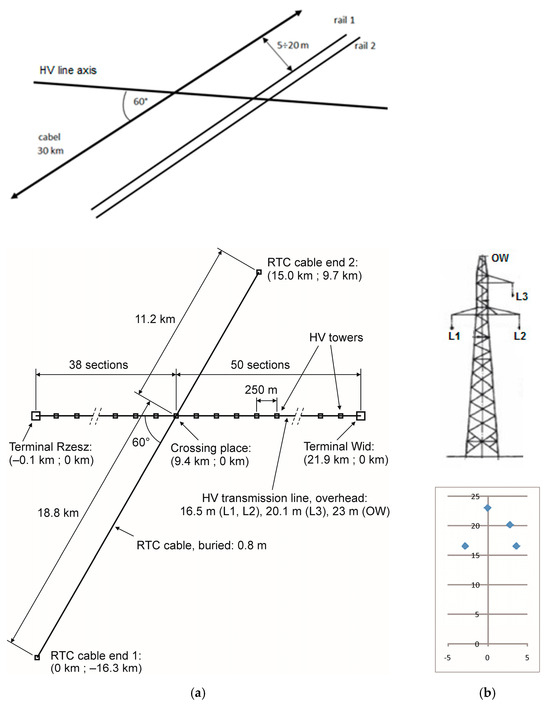
Figure 1.
Sketch of the case under study: (a) location of the RTC signaling cable running along the railway track in relation to the HV transmission line; (b) silhouette of the HV line tower with marked positions of the phase conductors (L1, L2, and L3) and the overhead (ground/neutral) wire (OW).
The 110 kV transmission line is located between substations Rzesz and Wid in the southeastern part of Poland. The line is composed of phase conductors (L1, L2, and L3) of the ACSR type (steel–aluminum) with a 240 mm2 cross-section (22 mm diameter), and an overhead (ground/neutral) wire (OW) made of copper (12 mm diameter). The long-term current carrying capability of the phase conductors is 634 A (for each phase).
Each terminal substation is modeled using an equivalent circuit composed of a 3-phase current source, a neutral connection impedance, and an earth impedance, as shown in Figure 2a. The earth impedance of each terminal substation is assumed to be equal to 0.5 Ω and each transmission line tower 10 Ω.
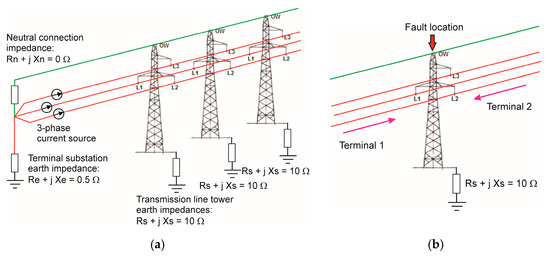
Figure 2.
Modeling (a) the HV transmission line and the terminal substation; (b) the fault-to-ground condition at one of the HV line towers.
In the case of the normal, steady-state operation of the HV transmission line under symmetrical load condition, the 3-phase current source generates phase currents with the values equal to the nominal current IN (long-term current carrying capability) of 634 A and with the phase angles of 0° (phase 1), −120° (phase 2), and +120° (phase 3). During the unbalanced condition, with an asymmetrical load, the value of the current in one of the phases is changed to 90% or 110% of the nominal current, i.e., 0.9 IN = 571 A or 1.1 IN = 697 A, respectively.
During the phase-to-ground fault conditions, the fault current flows to the fault location from both sides, where each side is represented with the terminal substation, as shown in Figure 2b. The phase-to-ground fault is represented with a short circuit of one of the phase conductors to the grounded overhead wire (OW) at one of the HV line towers. The fault current of 5 kA is assumed to flow in the faulted phase L1 from each terminal substation to the HV line tower from which the fault happened (Figure 2b).
The fault-to-ground analysis was carried out for 3 different locations of the fault: at the HV line tower located closest to the RTC signaling cable, i.e., 80 m distance to the cable axis, and at the towers located at a 5 km distance from the tower nearest to the signaling cable left and right (Figure 3).
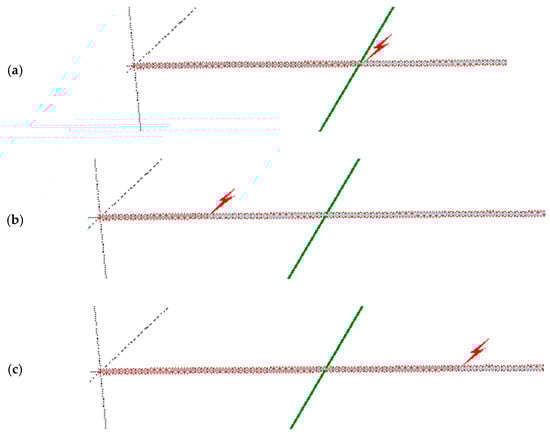
Figure 3.
View of the considered earth fault places in the HV transmission line relative to the crossbreeding place of the line with the RTC signaling cable: (a) HV line tower located closest to the RTC signaling cable; (b) HV line tower located at a 5 km distance to the left from the tower closest to the cable; (c) HV line tower located at a 5 km distance to the right from the tower closest to the cable.
In both steady-state and earth-fault conditions in the overhead HV transmission line, the inductive coupling effect with the underground RTC signaling cable was primarily estimated. For the assessment of the inductive coupling effects on the signaling cable, the voltage distribution (potential to reference earth) along the cable was calculated.
Additionally, in the case of the earth fault condition, the conductive coupling effect for the worst case of fault at the HV line tower closest to the crossbreeding of the line with the RTC cable was also determined. To assess the conductive coupling effects, the earth potential distribution around the HV line tower, and above the RTC cable in particular, was computed. The computation was carried out under the assumption that the grounding system of the HV line tower has the form of a ring earth electrode of 10 × 10 m dimensions.
The signaling cable of the YKSY type, which is typically used to connect the devices in the railway traffic control system, was adopted in the analysis. The cable insulation resistance for the assumed humidity of 95% and the temperature of 20 °C should be greater than 1 MΩ [57]. The following calculation data for the signaling cable were used [13,20,57]:
- Burial depth: 0.8 m;
- Length: 30 km;
- Diameter: 10 mm;
- Material: copper;
- Coating resistance: 1 MΩ;
- Ground impedance: 1 MΩ at both ends.
The soil resistivity of 100 Ωm, as typical for most regions of Poland, was taken as a base value for the computations. However, the analysis was also carried out for a wider range of soil resistivity from 10 Ωm to 1000 Ωm.
The adopted homogeneous soil model does not reproduce natural, layered soil structures. It may affect the accuracy of calculations, particularly for earth fault conditions, where at least a two-layer soil model is generally required. A stratified soil model may also be necessary in the case of calculating inductive coupling effects. Such a soil model takes into account the boundary phenomena described by the reflection coefficient, which may vary from −1 to +1, depending on the resistivity and thickness of particular layers.
For the purposes of the article, no actual ground resistivity measurements were available, and in such a large considered area (around 30 km), even a two-layered structure would not be enough to take into account regions with different resistivities. Moreover, the selection of a specific two-layer soil structure that would allow for generalizations of the assessment of the influence of stratification is not easy due to the very large number of variants: the resistivity and thickness of both layers. Therefore, first, the parametric analysis of the influence of soil resistivity on the induced voltages for various operating conditions of the HV transmission line was carried out. However, in the future, it is planned to carry out research taking into account the layered soil structure.
3. Results
In order to assess the threats resulting from the inductive effect of the HV transmission line to the RTC signaling cable, the voltage distributions along the cable were computed and analyzed in the following operation conditions of the HV transmission line:
- Normal operation of the HV transmission line under a symmetrical load, with phase currents equal to the nominal current IN = 634 A.
- Normal operation of the HV transmission line under asymmetrical load, with one of the phase currents equal to 0.9 IN = 571 A or 1.1 IN = 697 A.
- Phase-to-ground fault at the tower closest to the place of crossing the signaling cable with the HV line and at the towers located 5 km left and right from that tower, with fault current IF = 5 kA.
For the above cases, the influence of soil resistivity on the voltage distributions in the signaling cable were also determined.
The threat resulting from the conductive effect of the HV transmission line to the RTC signaling cable during the earth fault was assessed based on the computed earth potential distribution around the HV line tower on which the fault happened and which is located closest to the crossbreeding the HV line with the signaling cable.
3.1. Normal, Steady-State Operation of the HV Power Line at Nominal Load—Inductive Coupling Effect
3.1.1. Symmetrical Load with Phase Currents Equal to the Nominal Current IN
The distribution of voltage induced along the RTC signaling cable (rms values of potential with respect to the reference earth), calculated for the normal operation of the HV transmission line at the rated symmetrical load of 634 A and soil resistivity of 100 Ωm, is presented in Figure 4a. An important factor that may influence the level of the induced voltage is soil resistivity. A parametric analysis was performed for the typical Polish soil resistivity range of 10 Ωm to 1000 Ωm. Some of the obtained voltage distributions are presented in Figure 4b.
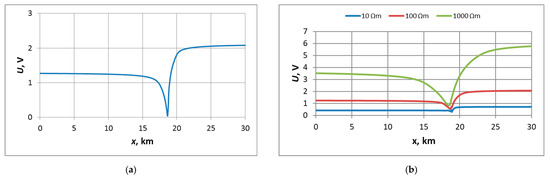
Figure 4.
Distributions of voltage induced along the RTC signaling cable (rms values of potential with respect to the reference earth) during the normal operation of the 110 kV transmission line at the rated symmetrical load IN = 634 A, calculated for (a) 100 Ωm soil resistivity; and (b) variable soil resistivity.
The induced voltage distributions in the signaling cable during the normal operation of the HV transmission line resemble those observed in pipelines [41,42,43,45,47], underground power cables [50], and overhead power lines [51]. However, the minimum value of voltage is located at the place where the signaling cable crosses with the HV transmission line (18.8 m, Figure 1a), unlike in the cases of parallel running the source and the exposed line reported in the literature [41,42,43,45,47,50,51], where the minimum values were observed in the middle of the exposed line. The reason why the crossing place of the signaling cable with the HV line results in the minimum value of induced voltage is that that part of the signaling cable is located nearest to the grounded HV line tower.
The highest values of voltages are observed at the ends of the signaling cable, which is in agreement with the results reported in the literature [41,42,43,45,47,50,51]. It should be noted that the obtained results, presented in rms values, do not contain information about the phase. However the potentials of the cable ends are in anti-phase since the electromotive force is induced along the cable. The observed asymmetry of the voltage distribution along the signaling cable on the left and right sides from the crossing place with the HV power line is due to the asymmetrical layout and unparallel position of the cable with respect to the HV power line, as shown in Figure 1a.
Another difference between the induced voltage distribution in the signaling cable (Figure 4) and the voltage distributions presented in the literature [41,42,43,45,47,50,51] is that the voltage distribution in the signaling cable exhibits a saturation when increasing the distance from the point where it reaches its minimum value. The results reported in [41,42,43,45,47,50,51] do not show this effect, probably due to the fact that the exposed lines considered therein are relatively short (about few kilometers). In the considered situation for a base soil resistivity of 100 Ωm (Figure 4a), the voltage achieves values near the saturation level at a distance of about few kilometers.
The value of voltage induced in the signaling cable in the normal operation condition of the HV transmission line at rated symmetrical load is a result of the asymmetrical locations of the three phases with regard to the signaling cable (Figure 1b). The voltages induced along the signaling cable reach their maximum value at end 2 (right). For a moderate soil resistivity of 100 Ωm, the maximum value of voltage is rather low, around 2.1 V (Figure 4a).
The voltage distributions in the RTC signaling cable for variable soil resistivity (Figure 4b) look quite similar, although they tend to be more even and smoother for higher soil resistivity. It can also be noted that increasing soil resistivity 10 times caused an increase in the voltage induced in the RTC cable nearly three times (2.9 and 2.8 for low and high soil resistivity, respectively). However, even in the case of the highest considered value of soil resistivity, the maximum values of the induced voltage did not exceed 6 V.
Additional computations carried out at 100 Ωm soil resistivity for different burial depths of the signaling cable of 0.8 m and 0.3 m resulted in very similar voltage distributions. Thus, one can conclude that the cable burial depth is practically irrelevant for the threat to the railway traffic control system, at least in the case of moderate soil resistivity.
3.1.2. Asymmetrical Load with One of the Phase Currents Equal to 0.9 IN
The distributions of voltage induced along the RTC signaling cable, calculated for the steady-state operation of the HV transmission line at the rated symmetrical load of 634 A and at asymmetrical load at which one of the phase currents was equal to 0.9 of the rated current (571 A), for a soil resistivity of 100 Ωm, are presented in Figure 5a. The dependency of the voltage distribution in the cable for an asymmetrical load with decreased current in phase L3 (to 0.9 IN) on soil resistivity is shown in Figure 5b.
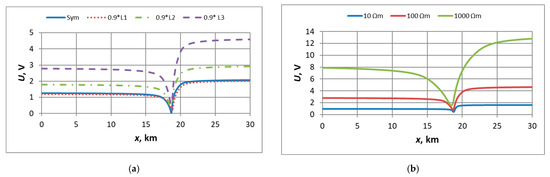
Figure 5.
Voltage distributions in the RTC signaling cable (rms values) calculated for the steady-state operation of the 110 kV transmission line at (a) nominal symmetrical load IN = 634 A and asymmetrical load with 0.9 IN = 571 A in one of the phases for a soil resistivity of 100 Ωm; (b) asymmetrical load with 0.9 IN = 571 A in phase L3 for variable soil resistivity.
The highest values of voltages induced in the signaling cable is observed in the case of decreased current in phase L3 (to 0.9 IN). In this case, the maximum voltage has increased about 2.2 times, i.e., up to around 4.6 V, compared with the case of symmetrical load. This may be due to the fact that the wire of phase L3 is located farther from the signaling cable than the wires of phases L1 and L2, hence decreasing the current in phase L3 causes amplification of the inductive interaction of phases L1 and L2, whose wires are located closer to the cable.
Similarly, as in the case of the symmetrical load, increasing the soil resistivity 10 times caused an increase in the voltage induced in the cable around 2.8–2.9 times. The maximum induced voltage for the 1000 Ωm soil resistivity was about 12.8 V.
3.1.3. Asymmetrical Load with One of the Phase Currents Equal to 1.1 IN
The distributions of voltage induced along the RTC signaling cable, calculated for the steady-state operation of the HV transmission line at the rated symmetrical load of 634 A and at the asymmetrical load at which one of the phase currents was equal to 1.1 of the rated current (697 A), for soil resistivity of 100 Ωm, are presented in Figure 6a. The dependency of the voltage distribution in the cable for asymmetrical load with increased current in phase L1 (to 1.1 IN ) on soil resistivity is shown in Figure 6b.
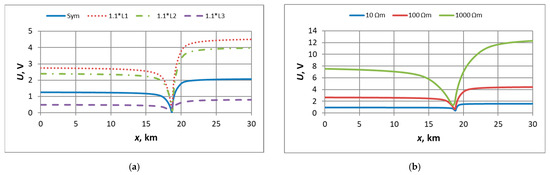
Figure 6.
Voltage distributions in the RTC signaling cable (rms values), calculated for the steady-state operation of the 110 kV transmission line at (a) the nominal symmetrical load IN = 634 A and the asymmetrical load with 1.1 IN = 697 A in one of the phases for soil resistivity 100 Ωm; (b) asymmetrical load with 1.1 IN = 697 A in phase L1 for variable soil resistivity.
The highest values of voltages induced in the signaling cable are observed in the case of the increased current in phase L1 (1.1 IN). In this case, the maximum voltage has increased about 2.1 times, i.e., up to around 4.5 V, compared with the case of the symmetrical load. Taking in mind the observations in the case of the decreased current in phase L3 (Section 3.1.2; Figure 5), it can be noted that a similar increase in the voltage induced in the cable is obtained either by 10% increasing the current in phase L1 wire located closer to the cable or by 10% decreasing the current in the phase L3 wire located farther from the cable.
Similarly, as in the cases of the symmetrical load and asymmetrical load with decreased current in phase L3, increasing the soil resistivity 10 times caused an increase in the voltage induced in the signaling cable around 2.8 times. The maximum induced voltage for the 1000 Ωm soil resistivity was about 12.3 V.
3.2. Operation of the HV Transmission Line under the Earth Fault Condition—Inductive Coupling Effect
3.2.1. Earth Fault at the HV Line Tower Nearest to the RTC Signaling Cable
The distribution of voltage induced along the RTC signaling cable for the earth fault in phase L1 of the HV transmission line at the tower located closest to the signaling cable (80 m distance, near the crossbreeding place of the line with the cable) for the fault current of 5 kA and soil resistivity of 100 Ωm is presented in Figure 7a. The dependency of the voltage distribution in the cable on soil resistivity is shown in Figure 7b.
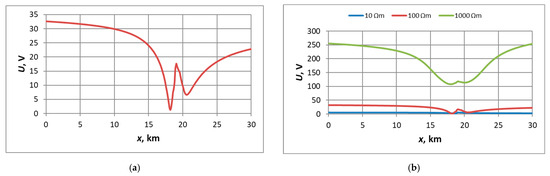
Figure 7.
Voltage distributions in the RTC signaling cable (rms values), calculated for the earth fault in phase L1 of the 110 kV transmission line at the tower nearest to the signaling cable for the fault current of 5 kA and soil resistivity: (a) 100 Ωm; (b) variable.
It should be noted that the voltage distribution in the signaling cable during the earth fault in the HV transmission line is somewhat different than the voltage distribution obtained for the normal operation of the HV line (Figure 4a). In particular, it reaches the maximum value at end 1 (left end, Figure 1) instead of end 2, as observed under the normal operation of the HV line. This may be caused by the fact that under the earth fault condition, the fault current flows from both directions (terminal substations) to the HV line tower from which the fault happened and which is located nearest to the crossbreeding place of the line with the signaling cable. During the normal operation of the HV power line, the rated current flows in the same direction through the entire length of the line.
The values of voltage induced in the signaling cable under the earth fault condition are much higher than under the steady-state operation of the HV line. This is not only because of the increase in the current in the faulted phase to 5 kA, i.e., nearly eight times, but also due to the different directions of current flow in the HV line during the fault. The maximum voltage in the signaling cable (at end 1) during the fault condition in the HV line was 32.6 V, which is around 15.7 times higher than the maximum voltage in the cable (at end 2) under the normal operation of the HV line (Figure 4a).
In comparison to the steady-state operation of the HV transmission line (Figure 4b), the voltage distributions in the signaling cable under the earth fault condition become more leveled and smoother with increased soil resistivity (Figure 7b). Moreover, the same increase in soil resistivity, by 10 times, resulted in a much higher increase in the induced voltage in comparison to the case of the normal operation of the HV line. This increase in voltage was also higher for higher soil resistivity. The increase in soil resistivity by 10 times for low-resistivity soils, i.e., from 10 Ωm to 100 Ωm, caused the increase in the maximum voltage induced in the cable about 5.9 times (from 5.5 V to 32.6 V), whereas the 10 times increase in soil resistivity for high-resistivity soils, i.e., from 100 Ωm to 1000 Ωm, caused the increase in the maximum voltage induced in the cable until 7.8 times (from 32.6 V to 255.2 V). In the case of the normal operation of the HV line, the increase in the maximum voltage was only around three times both for low- and high-resistivity soils.
3.2.2. Earth Fault at the HV Line Tower Distant from the Signaling Cable to the Left (Rzesz)
The distribution of voltage induced along the RTC signaling cable for the earth fault in phase L1 of the HV transmission line at the tower located 5 km left (Rzesz direction) from the tower closest to the signaling cable, for the fault current of 5 kA and soil resistivity of 100 Ωm, is presented in Figure 8a. The dependency of the voltage distribution in the cable on soil resistivity is shown in Figure 8b.
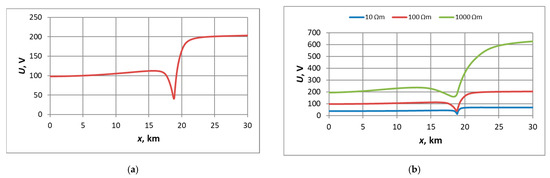
Figure 8.
Voltage distributions in the signaling cable (rms values), calculated for the earth fault in phase L1 of the 110 kV transmission line at the tower located 5 km left (direction Rzesz) from the tower closest to the cable, for the fault current of 5 kA and soil resistivity: (a) 100 Ωm; (b) variable.
The voltage distribution during the earth fault distant from the reference place (crossbreeding the HV transmission line with the signaling cable) resembles the voltage distribution calculated for the normal operation of the HV line more (Figure 4a) than the voltage distribution calculated for the nearby fault (Figure 7a). In particular, it reaches the maximum value at end 2 (right end, Figure 1) not at end 1. This may be explained by the fact that in the case of the distant earth fault, the fault current flows in the same direction through both parts of the HV transmission line located left and right from the reference place, where the inductive coupling is the strongest, similarly to the case of the normal operation of the HV line, when the rated current flows in the same direction through the entire length of the line.
The maximum value of voltage induced in the signaling cable (at end 2) is 203 V. It is around 6.2 times higher than for the nearby earth fault (at end 1, Figure 7a), and about 97.8 times higher than in the normal operation of the HV line (Figure 4a).
The voltage distributions calculated for various soil resistivities again resemble more the voltage distributions under the normal operation of the HV line (Figure 4b) than the voltage distributions calculated for the nearby fault (Figure 7b). Similarly, like in the normal operation of the HV line, increasing the soil resistivity 10 times resulted in an increase in the maximum voltage induced in the signaling cable by about 2.9 times (from 68.8 V to 203 V) and 3.1 times (from 203 V to 627.8 V) for low- and high-resistivity soil, respectively.
3.2.3. Earth Fault at the HV Line Tower Distant from the Signaling Cable to the Right (Wid)
The distribution of voltage induced along the RTC signaling cable for the earth fault in phase L1 of the HV transmission line at the tower located 5 km right (direction Wid) from the tower closest to the signaling cable, for the fault current of 5 kA and soil resistivity of 100 Ωm, is presented in Figure 9a. The dependency of the voltage distribution in the cable on soil resistivity is shown in Figure 9b.
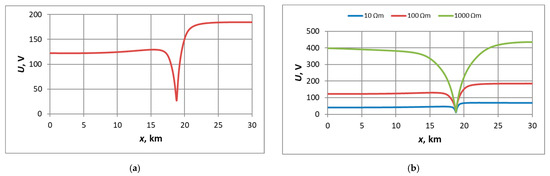
Figure 9.
Voltage distributions in the signaling cable (rms values), calculated for the earth fault in phase L1 of the 110 kV transmission line at the tower located 5 km right (direction Wid) from the tower closest to the cable, for the fault current of 5 kA and soil resistivity: (a) 100 Ωm; (b) variable.
The voltage distribution in the signaling cable induced by the distant earth fault located right from the reference place (Figure 9a) was similar as for the distant fault located left (Figure 8a), except that it took a little higher values along the left side and a little lower values along the right side of the signaling cable. The maximum value of voltage observed at end 2 of the cable was 184.6 V. It is around 5.7 times higher than for the nearby earth fault (end 1, Figure 7a) and about 88.9 times higher than under the normal operation of the HV line (Figure 4a).
For high-resistivity soil, the voltages in the signaling cable induced by the distant earth fault located at right in the HV line (Figure 9b), compared to the case of the distant fault located at left (Figure 8b), took much higher values along the left part and much lower values along the right part of the cable. Increasing the soil resistivity 10 times resulted in an increase in the maximum voltage induced in the signaling cable of about 2.7 times (from 67.9 V to 184.6 V) and 2.4 times (from 184.6 V to 436.1 V) for low- and high-resistivity soil, respectively.
3.3. Operation of the HV Transmission Line under the Earth Fault Condition—Conductive Coupling Effect
Earth potential distribution around the HV transmission line tower located nearest to the RTC signaling cable (80 m distance to the cable axis) during the earth fault at this tower for the fault current of 5 kA and soil resistivity of 100 Ωm was computed (Figure 10a). It was assumed that the grounding system of the tower has the form of a ring earth electrode of 10 × 10 m. The ground voltage of the tower (GPR—Ground Potential Rise), determined as the product of the fault current and the ground impedance, was 4.4 kV.
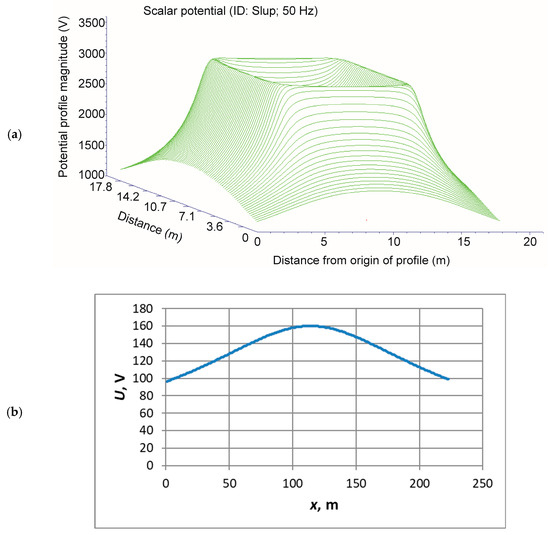
Figure 10.
Distribution of the earth potential around the HV transmission line tower located nearest to the RTC signaling cable (80 m distance to the cable axis) during the earth fault in phase L1 at this tower for the fault current of 5 kA and soil resistivity of 100 Ωm: (a) on a plane in the 3D perspective; (b) along a linear profile above the signaling cable.
Based on the obtained potential distribution (Figure 10a), a linear profile of the earth potential distribution above the signaling cable was determined by intersecting the 3D diagram with the vertical plane along which the cable is located. The obtained potential distributions are shown in Figure 10.
The highest value of the earth potential above the signaling cable of 160 V was observed at the place nearest to the HV transmission line tower from which the fault occurred. This value of voltage is not capable of breaking the insulation of the signaling cable; hence, it does not pose a threat. However, it should be noted that the potential in close proximity of the HV line tower grounding may reach values around 3–4 kV. Hence, it is necessary to locate the cables at a sufficiently large distance from the HV line towers.
4. Discussion
The summary of the maximum values of the voltages induced in the RTC signaling cable due to inductive coupling effects from the HV transmission line during normal operation and the earth fault in the line are presented in Figure 11 and Table 1.
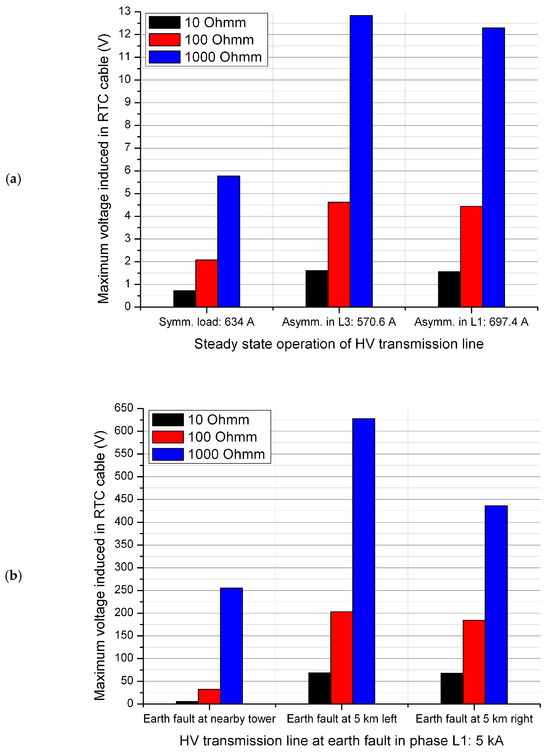
Figure 11.
Maximum values of voltages induced in the RTC signaling cable due to inductive coupling effects from the HV transmission line during: (a) the steady-state operation; (b) earth fault.

Table 1.
Maximum values of voltages induced in the RTC signaling cable due to inductive coupling effects from the HV transmission line.
Under the steady-state operation of the HV transmission line, the maximum value of voltage induced in the signaling cable exhibits quite a regular or proportional dependency on soil resistivity and on the occurrence of current asymmetry caused by decreased or increased current in one of the phases. In particular, it may be observed that:
- A ten-fold higher soil resistivity leads to around 2.7–3 times higher maximum values of the induced voltage;
- A 10% decrease in current in the phase L3 wire located farther from the signaling cable or a 10% increase in the current in the phase L1 wire located closer to the cable causes the increase of the maximum value of the induced voltage around 2.1–2.3 times with respect to the reference case of normal operation with symmetrical load.
It should also be noticed (Table 1) that a 1.1-times increase in the current in phase L1, with respect to the reference case of normal operation with symmetrical load, caused a twice-as-high increase in the maximum value of the induced voltage, i.e., around 2.2 times, in the whole range of soil resistivity.
Under the earth fault state in the HV transmission line, the situation changes dramatically. The maximum values of voltages induced in the signaling cable are many times higher than in the reference case of normal operation with a symmetrical load. The reason for that is not purely much higher, i.e., a 7.9-times increase in the current in the faulted phase L1, because for an asymmetrical load, the 1.1-times current increase in the same phase caused regular, two-times higher increase in the induced voltage. Unlike for the asymmetrical load with increased current in phase L1, this 7.9-times increase in the current in the faulted phase L1 caused a very different increase in the maximum value of the induced voltage, from 7.9 up to around 108.2 times depending on the fault location and soil resistivity. The large increase, with respect to the cases of the normal, steady-state operation of the HV transmission line, and irregularities or disproportionalities observed in the maximum values of the voltage induced in the signaling cable during an earth fault result mainly from different directions of fault current flows, in comparison to the normal, steady-state operation of the HV line with symmetrical and asymmetrical loads, as discussed in Section 3.
Nevertheless, for the cases of the earth fault state in the HV transmission line, some regularities may also be observed:
- The earth fault at the HV line tower nearest to the signaling cable results in much lower maximum values of the voltages induced in the cable than the distant earth faults. This is due to the fact that the fault current flows to the fault place on the tower nearest to the cable from both directions, which causes the cancellation of voltage components originating from the HV line sections located left and right to that place, whereas in the case of a distant fault, the current flows in one direction over that place;
- In the case of a nearby earth fault, unlike in all the other cases, the maximum value of the induced voltage occurs at end 1 of the signaling cable, which is mainly due to the different directions of the fault currents at both sides of the fault place and the asymmetry of the layout of the HV transmission line with respect to the signaling cable;
- The highest maximum values of the voltages induced in the signaling cable occurred in the case of a distant earth fault located left (direction Rzesz) from the tower nearest to the cable, which again might be explained by the asymmetry of the layout of the HV transmission line with respect to the signaling cable;
- In the case of the distant earth fault located right (direction Wid) from the tower nearest to the signaling cable, the maximum values of the voltages induced in the cable are comparable to those obtained for the case of the distant earth fault located left. However, unlike the other fault places, the increase in voltage with respect to the reference case of the normal operation of the HV line with symmetrical load is getting lower with increasing soil resistivity;
- In the case of the nearby earth fault, 10 times increase in soil resistivity for low-resistivity soils, i.e., from 10 Ωm to 100 Ωm, caused an increase in the maximum voltage induced in the signaling cable of about 5.9 times, whereas a 10 times increase in soil resistivity for high-resistivity soils, i.e., from 100 Ωm to 1000 Ωm, caused an increase in the maximum voltage induced in the cable of 7.8 times;
- In the cases of distant earth faults, the increase in the maximum value of the voltage induced in the signaling cable with increasing soil resistivity is similar to that in normal operation of the HV line, i.e., increasing the soil resistivity 10 times resulted in the increase of the voltage about 2.9 times and 3.1 times for low- and high-resistivity soil, respectively, in the case of a fault located left, and about 2.7 times and 2.4 times for low- and high-resistivity soil, respectively, in the case of a fault located right.
The maximum values of the voltages induced in the signaling cable during the normal, steady-state operation of the HV transmission line under symmetrical load (Figure 11a) do not exceed 6 V in the broad range of soil resistivity. Such values shall be regarded as low, hence not posing a serious threat to the personnel. The voltages induced in the cable under asymmetrical load with a 10% decrease or increase in the current in one of the phases for low and moderate soil resistivity are also below or near the same level. Only for the highest considered soil resistivity of 1000 Ωm are the obtained maximum induced voltages, around 12–13 V, close to the safe touch potential limit of 15 V under normal load conditions, according to the recommendations of the ANSI/IEEE 80 standard [45,48,49].
During the nearby earth fault in the HV transmission line, the maximum voltages induced in the signaling cable for the considered range of soil resistivity are below the safe touch potential limit of 350 V under fault conditions, according to the ANSI/IEEE 80 standard [45,48,49]. Hence, they should not pose a threat, assuming that the fault will be switched off in a sufficiently short period of time. Only for a soil resistivity higher than 1000 Ωm may the voltage induced reach values higher than 250 V, and hence, being close to the safe limit, may pose some threat to the personnel.
On the contrary, the distant earth faults in the HV transmission line at the towers located either left or right from the tower nearest to the signaling cable result in the induction of much higher voltages in this cable. The maximum values of the induced voltages reach around 200 V already for a moderate soil resistivity of 100 Ωm and increase significantly with increasing soil resistivity up to around 450–650 V at 1000 Ωm. This suggests that for moderate values of soil resistivity, 100 Ωm and higher, the voltages induced in the signaling cable may reach the safe touch potential limit of 350 V recommended by the ANSI/IEEE 80 standard [45,48,49].
Transmitting information via a signaling cable is primarily used for the needs of linear RTC devices located on the route between stations [2]. Installed devices of this type, e.g., line locks or crossing signaling systems, are made using relay or electronic technologies. Measurements of voltages induced in the signaling cable, performed as part of study [2], showed a strong dependence on frequency. Each receiver of the RTC devices is made for appropriate sensitivity ranges. The amplitude, frequency, pulse duration, and pulse repetition time are taken into account.
In the case of relay devices, the signal transmitted via the signal cable is in analog form (amplitude level). For linear interlocks, the amplitude reaches 36 V. A disturbance consisting of superimposing an interfering signal from a power line on an analog signal may cause permanent damage to the signal receiver systems in the device, which will cause the device to switch to safe emergency mode. In the devices made using electronic technology (microcontrollers, PLC controllers, or computers), information between devices is sent in the form of current transmission of digital data. Disturbances from the power line may cause distortion of the digital transmission signal. However, once this disruption stops, data transmission resumes, and the devices operate in normal mode.
The maximum values of voltages induced in the RTC signaling cable under the normal, steady-state operation of the HV transmission line are already in the range of 2 V to around 13 V for moderate soil resistivity of 100 Ωm and higher. This is a substantial level that may cause interference for the transmission of signals, both analog (36 V amplitude) and digital (a few volts).
The maximum voltages induced in the signaling cable during earth faults already reach values of around 200 V or higher for moderate soil resistivity around 100 Ωm. Such voltages may result in serious interference or damage of the RTC devices connected at the cable ends, even if these voltages last for a short period of time. Particularly dangerous are the earth faults located further, around 5 km, from the crossbreeding place of the HV transmission line with the signaling cable, which may cause inducing voltages of 200–650 V at moderate- and high-soil resistivity.
The estimation of threats related to conductive coupling effects from the HV transmission line to the RTC signaling cable during the earth fault at the tower located nearest to the cable revealed that the earth potential directly above the signaling cable does not exceed 160 V. Such a voltage level is not able to cause the breakdown of the cable insulation, so it does not pose a threat to the cable. However, in the considered case, the signaling cable is located quite far, around 80 m, from the grounding of the tower from which the fault occurred. In close proximity to the tower grounding system, the earth potential may reach values of around 3–4 kV. Hence, the minimum separation distance should be maintained between the RTC signaling cable and HV line towers.
As previously mentioned in Section 1, relatively little research was published in the literature on the impact of high-voltage lines on railway signaling cables. Most of the published studies concentrate on the impact of HV lines on pipelines, and the analyzed cases are mostly limited to the parallel running of the source and victim lines and a single value of soil resistivity, usually around 100 Ωm. Therefore, the comparison of the obtained results with other published works can only be general. Indeed, as indicated in Section 3, the obtained voltage distributions are consistent with those reported in other published works; however, the maximum values could be different. The comparison of maximum values of induced voltages is presented in Table 2.
Table 2.
Comparison of maximum values of voltages induced in the lines exposed to inductive coupling interference from HV lines, obtained in the present study and reported in other works, for soil resistivity of around 100–150 Ωm.
Taking into account the different conditions, the routing, and the horizontal distance between the HV line and the victim line or cable, the obtained maximum values of voltages are comparable to those previously reported, e.g., in [41,42,43,45]. Generally, the values of voltages in the railway signaling cable obtained within this work correspond with the voltages induced in buried pipelines located along short parallel routes or at larger distances from the HV lines [45]. It may be justified by unparallel running of the railway cable and the HV line.
The results of other works for longer parallel routes of running the pipelines and HV power lines (10–16 km), however, are to some extent irregular. In particular, works [41,43] reported clearly lower voltages in the steady-state condition of the HV line (in spite of the small distance between the pipeline and HV line) and works [41,43,47] reported much higher voltages in the earth fault in the HV line. This implies that the problem is not trivial, and many other factors may significantly influence the results. The results shown in Table 2 also reveal that the voltages induced in the aboveground pipelines [44,46] might be much higher than in the buried ones [40,41,42,43,45,47].
The voltages induced in underground and aboveground power lines, obtained for various cases, exhibit similarities, i.e., the maximum values range from tens to hundreds of volts in the steady-state condition [50,51]. This is justified by similar regularities of running the disturbing and exposed lines within the same right-of-ways.
The cases of voltages induced in railway signal lines are hard to compare since they generally differ in route directions, their lengths, or the convention of presenting the results; e.g., [53] reported the longitudinal electromotive force along the cable instead of potential with respect to reference ground as in the other works. However, the values of voltages obtained in all the cases shown in Table 2 look logically reasonable.
5. Conclusions
Modern electronics are nowadays constantly being introduced to control traffic in vast areas, high-power traction vehicles, and rolling stock equipped with high-power impulse converters. A maintenance organization based on cooperation with specialist services and manufacturers becomes necessary. For the maintenance of devices used by rail traffic control centers, it is important to prepare your own maintenance staff and link them to the service so that it is possible to ensure short repair times.
Hence, the selection of control systems that ensure the highest standards of reliability and availability of devices is also important. As shown in this paper, the disturbances caused by the influence of high-voltage lines are one of the threats to the proper operation of railway devices. The purpose of estimating the values and levels of these disturbances is to indicate the severity of the problem and ensure that designed and implemented protection measures and/or solutions will be optimal for avoiding or eliminating this problem. The presented results showed a significant influence of the selected factors on the voltages induced in the signaling cable, similar to the results of the measurements [3,4,5,22,58]. The estimated levels of the induced voltages may cause interference or damage to the railway traffic control or telecommunication devices connected to the cable or line.
The maximum values of voltages induced in the signaling cable under the steady-state operation of the HV transmission line, reaching the level of 13 V or higher (for a moderate soil resistivity of 100 Ωm or higher), may likely cause interference in the transmission of both analog and digital signals. The maximum voltages induced in the signaling cable during earth faults, reaching much higher values of around 200 V or higher (already for a moderate soil resistivity of around 100 Ωm), may result in serious interference or damage to the RTC devices connected at the cable ends, even if they last a short period of time. Particularly dangerous are the earth faults located further from the crossbreeding place of the HV transmission line with the signaling cable, which may result in inducing voltages of 200–650 V at moderate and high soil resistivity.
The estimation of threats caused by conductive coupling effects from the HV transmission line to the signaling cable during the earth fault at the tower nearest to the cable revealed that the earth potential directly above the signaling cable does not exceed 160 V. Such a voltage level is not able to cause a breakdown of cable insulation, so it does not pose a threat to the cable, at least for the considered distance of the cable to the tower.
Due to the limitations of the used software, which enables analyzing only single-core cables, the results should be assessed as approximate. In the case of multi-core cables, some shielding against the electromagnetic field might potentially be observed, which could reduce the induced voltages. However, shielding against low-frequency magnetic fields by thin non-magnetic materials is generally regarded as minimally effective. Hence, the reduction in voltages should not be significant. A greater reduction in voltages could be expected when using concentric or twisted-pair cables, particularly shielded ones. The other cable parameters should not influence the results very much. Hence, the results obtained for the single-wire cable will correspond to the worst-case condition, and using this cable type for estimating the level of threat will provide a kind of safety margin.
As a general conclusion, one can say that the obtained results provide general theoretical knowledge difficult to gain with exploitation practice or experimental research, which can be useful while implementing railway traffic control systems and/or protection measures and solutions. The demonstrated capabilities of the software package may be useful for performing analyses in the event of problems related to electromagnetic disturbances in the work of railway traffic control devices or their sudden failures due to causes that are difficult to determine. This is of particular importance, especially in the case of computer devices, due to their high cost.
Practice shows that similar propagation mechanisms of disturbances frequently occur during switching in power devices. Due to the variety of devices used in PKP Polish Railway Lines, a detailed analysis requires taking into account many factors:
- A variety of RTC devices;
- Multi-parameter dependence of the system: traction network, return network, and cable network.
The analysis may be hampered by the ignorance of summation of disturbing signals originating from various sources. However, deliberate omission of these risks in the overall assessment of the causes of disturbances may result in their not being eliminated.
Author Contributions
Conceptualization, Z.W., R.Z., R.M. (Renata Markowska) and R.M. (Ryszard Mielnik); methodology, Z.W., R.Z. and R.M. (Renata Markowska); software, R.Z.; validation, Z.W., R.Z., R.M. (Renata Markowska) and R.M. (Ryszard Mielnik); formal analysis, Z.W., R.Z., R.M. (Renata Markowska) and R.M. (Ryszard Mielnik); investigation, Z.W., R.Z. and R.M. (Renata Markowska); resources, Z.W., R.Z., R.M. (Renata Markowska) and R.M. (Ryszard Mielnik); data curation, Z.W., R.Z. and R.M. (Renata Markowska); writing—original draft preparation, Z.W., R.Z., R.M. (Renata Markowska) and R.M. (Ryszard Mielnik); writing—review and editing, Z.W., R.Z., R.M. (Renata Markowska) and R.M. (Ryszard Mielnik); visualization, Z.W., R.Z. and R.M. (Renata Markowska); supervision, Z.W.; project administration, Z.W.; funding acquisition, R.Z. and R.M. (Renata Markowska). All authors have read and agreed to the published version of the manuscript.
Funding
This research and the APC were funded by the Minister of Science and Higher Education of the Republic of Poland: Maintain the research potential of the discipline of automation, electronics, electrical engineering and space technologies. Grant numbers: PB22.ET.24.001 Rzeszow University of Technology, and WZ/WE-IA/2/2023 Bialystok University of Technology.
Data Availability Statement
The original contributions presented in the study are included in the article. Further inquiries can be directed to the corresponding authors.
Conflicts of Interest
The authors declare no conflicts of interest. The funders had no role in the design of the study; in the collection, analyses, or interpretation of data; in the writing of the manuscript; or in the decision to publish the results.
References
- Dąbrowa-Bajon, M. Podstawy Sterowania Ruchem Kolejowym; Oficyna Wydawnicza Politechniki Warszawskiej: Warszawa, Poland, 2002. [Google Scholar]
- Białoń, A.; Zając, W. Badanie zakłóceń lokomotyw tyrystorowych dużych mocy na urządzenia sterowania ruchem. In Proceedings of the Konferencja Naukowo-Techniczna Oddziaływanie Trakcji Elektrycznej na Środowisko i Pierwsza Szkoła Kompatybilności Elektromagnetycznej w Transporcie Szynowym, Zakopane, Poland, 14–16 October 1999. [Google Scholar]
- Laskowski, M.; Malesa, R.; Wróbel, Z. Określenie Istniejących Poziomów Zakłóceń Elektromagnetycznych w Ruchomych i Stacjonarnych Obiektach Kolejowych; Praca CNTK (Zakład Telekomunikacji) nr 1049/24: Warszawa, Poland, 1997. [Google Scholar]
- Laskowski, M.; Wróbel, Z. Poziomy zaburzeń elektromagnetycznych w energetycznej sieci pokładowej niskiego napięcia pojazdów trakcyjnych i wagonów pasażerskich. In ”Problemy Kolejnictwa”, 50 lat Problemów Kolejnictwa; Zeszyt 143; Centrum Naukowo-Techniczne Kolejnictwa: Warszawa, Poland, 2006. [Google Scholar]
- Laskowski, M.; Wróbel, Z. Poziomy zaburzeń radioelektrycznych i impulsowych zaburzeń elektromagnetycznych w energetycznej sieci niskiego napięcia, zasilającej stacjonarne obiekty kolejowe. In Problemy Kolejnictwa; Zeszyt 145; Centrum Naukowo-Techniczne Kolejnictwa: Warszawa, Poland, 2007. [Google Scholar]
- Michna, S. Kłopotliwe zakłócenia obwodów kontroli niezajętości–czyli kompatybilność taboru z urządzeniami przytorowymi. In Infrastruktura Transportu; Elamed MEDIA GROUP: Katowice, Poland, 2011; Volume 5. [Google Scholar]
- Zabłocki, W. Modelowanie stacyjnych systemów sterowania ruchem kolejowym. In Prace Naukowe TRANSPORT; Zeszyt 65; Oficyna Wydawnicza Politechniki Warszawskiej: Warszawa, Poland, 2008. [Google Scholar]
- EN 50129:2003/AC:2010; Zastosowania Kolejowe—Systemy Łączności, Przetwarzania Danych i Sterowania ruchem—Elektroniczne Systemy Sterowania Ruchem Związane z Bezpieczeństwem. Available online: https://www.globalspec.com/ (accessed on 17 May 2024).
- EN 50159:2010; Zastosowania Kolejowe—Systemy Łączności, Sterowania Ruchem i Przetwarzania Danych—Łączność Bezpieczna w Systemach Transmisyjnych. Available online: https://www.globalspec.com/ (accessed on 17 May 2024).
- Pawlik, M. (Ed.) Interoperacyjność Systemu Kolei UE, Infrastruktura, Sterowanie, Energia, Tabor; KOW: Warszawa, Poland, 2015; ISBN 978-83-943085-0-6. [Google Scholar]
- Pawlik, M. Europejski System Zarządzania Ruchem Kolejowym, Przegląd Funkcji i Rozwiązań Technicznych—OD idei do Wdrożeń i Eksploatacji; KOW: Warszawa, Poland, 2015; ISBN 978-83-943085-1-3. [Google Scholar]
- Napolitano, F.; Borghetti, A.; Nucci, C.A.; Rachidi, F.; Paolone, M. Use of the full-wave Finite Element Method for the numerical electromagnetic analysis of LEMP and its coupling to overhead lines. Electr. Power Syst. Res. 2013, 94, 24–29. [Google Scholar] [CrossRef]
- Wróbel, Z. The Horn Gap Arresters Modelling in a Lightning Discharge Analysis. In Proceedings of the 13th Scientific Conference on Selected Issues of Electrical Engineering and Electronics (WZEE), Rzeszow, Poland, 4–8 May 2016; Analysis and Simulation of Electrical and Computer Systems; Lecture Notes in Electrical Engineering. Volume 452, pp. 289–303. [Google Scholar]
- Wróbel, Z. Surge threats appear in railway devices feeding lines. In Proceedings of the 34th International Conference on Lightning Protection, ICLP2018, Rzeszow, Poland, 2–7 September 2018; p. 8503380. [Google Scholar]
- Wróbel, Z. The Group and Individual Connection to the Rail System Modelling in a Lightning Discharge Analysis. In Proceedings of the 11th Scientific Conference on Selected Issues of Electrical Engineering and Electronics (WZEE), Rzeszow, Poland, 27–30 September 2013; Analysis and Simulation of Electrical and Computer System; Book Series: Lecture Notes in Electrical Engineering, 2015. Volume 324, pp. 393–410. [Google Scholar]
- Wróbel, Z. Simulation Possibility of Performance of Avalanche Diode Using a Combination Wave Generator. In Proceedings of the 20th IEEE International Symposium on Industrial Electronics (ISIE), Gdansk, Poland, 27–30 June 2011. [Google Scholar]
- Wróbel, Z. The use of the PN-EN 62305-2 standard to the risk assessment of losses in the equipped object in station-devices of the railway traffic controlling. In Proceedings of the 13th International Conference Modern Electrified Transport (MET), Warsaw, Poland, 5–7 October 2017; Book Series: MATEC Web of Conferences, 2018. Volume 180, p. 05006. [Google Scholar]
- Wróbel, Z.; Jagiełło, A.S. The Risk of Lightning Losses in a Structure Equipped with RTC Devices According to the Standard EN 62305-2.2008.2021. Energies 2021, 14, 1704. [Google Scholar] [CrossRef]
- Markowska, R.; Wróbel, Z. Selected Issues of Safe Operation of the Railway Traffic Control System in the Event of Exposition to Damage Caused by Lightning Discharges. Energies 2021, 14, 5808. [Google Scholar] [CrossRef]
- Mielnik, R.; Wróbel, Z. Integrated power supply system for station equipment of rail traffic control. In Proceedings of the 13th International Conference Modern Electrified Transport (MET), Warsaw, Poland, 5–7 October 2017; Book Series: MATEC Web of Conferences, 2018. Volume 180, p. 05004. [Google Scholar]
- Mielnik, R.; Wróbel, Z. The use of renewable energy sources in the power supply systems of selected level crossings devices. In Proceedings of the 34th International Conference on Lightning Protection, ICLP2018, Rzeszow, Poland, 2–7 September 2018. [Google Scholar] [CrossRef]
- Mickiewicz, T. Oddziaływanie Trakcji Elektrycznej na Urządzenia Zabezpieczenia Ruchu Kolejowego; Wydawnictwa Komunikacji i Łączności: Warszawa, Poland, 1968. [Google Scholar]
- Machczyński, W. Oddziaływania Elektromagnetyczne na Obwody Ziemnopowrotne–Rurociągi Podziemne; Wydawnictwo Politechniki Poznańskiej: Poznań, Poland, 1998. [Google Scholar]
- Machczyński, W.; Sokolski, W. Oddziaływanie Indukcyjne Linii Elektroenergetycznych Wysokiego Napięcia na Gazociągi–Część I. In Ochrona Przed Korozją; SIGMA-NOT: Warsaw, Poland, 2005; Volume 8, pp. 267–271. Available online: https://sigma-not.pl/ (accessed on 17 May 2024).
- Bąchorek, W.; Kot, A.; Nowak, W.; Szpyra, W.; Tarko, R. Problemy projektowania i eksploatacji napowietrznych linii elektroenergetycznych w aspekcie pól elektromagnetycznych. In Proceedings of the V Konferencja Naukowo-Techniczna Elektroenergetyczne Linie Napowietrzne, PTPiREE, Dźwirzyno, Poland, 15 May 2012; pp. 6-1–6-11. [Google Scholar]
- Nowak, W.; Tarko, R.; Jaglarz, A.; Kozioł, J. Analiza warunków eksploatacyjnych linii 110 kV Klikowa–Połaniec i 220 kV Klikowa–Niziny w aspekcie oddziaływania elektromagnetycznego. Energetyka 2006, 2, 118–123. [Google Scholar]
- PSE Operator SA. Linia Napowietrzna 400 kV, Standardowe Specyfikacje Techniczne; Konstancin-Jeziorna, Poland, 2009. Available online: https://www.pse.pl/home (accessed on 17 May 2024).
- Nowak, W.; Tarko, R. Analysis of the feasibility of locating 110 kV line in 400 kV right-of-way in terms of electromagnetic interaction. Acta Energetica 2013, 1, 102–113. [Google Scholar]
- Nowak, W.; Tarko, R. Analiza możliwości lokalizacji linii 110 kV w pasie technologicznym linii 400 kV w aspekcie oddziaływań elektromagnetycznych. Zesz. Nauk. Wydziału Elektrotechniki I Autom. Politech. Gdańskiej 2013, 19–22. [Google Scholar]
- PN-E-05100-1: 1975; Elektroenergetyczne Linie Napowietrzne. Projektowanie i Budowa. Available online: https://sklep.pkn.pl/ (accessed on 17 May 2024).
- PN-EN 50341-1:2013; Elektroenergetyczne Linie Napowietrzne Prądu Przemiennego Powyżej 1 kV. Część 1: Wymagania Ogólne—Specyfikacje Wspólne. Available online: https://sklep.pkn.pl/ (accessed on 17 May 2024).
- PN-EN 50341-2-22:2016; Elektroenergetyczne linie napowietrzne prądu przemiennego powyżej 1 kV. Część 2-22: Krajowe Warunki Normatywne (NNA) dla Polski (oparte na EN 50341-1:2012). Available online: https://sklep.pkn.pl/ (accessed on 17 May 2024).
- PN-EN 50388:2006; Zastosowania Kolejowe: Zasilanie Energią a Tabor. Kryteria Techniczne Dotyczące Koordynacji Zasilania Energią (Podstacja) z Taborem w Celu Uzyskania Interoperacyjności. Available online: https://sklep.pkn.pl/ (accessed on 17 May 2024).
- Rozporządzenie Ministra Środowiska z Dnia 30 Października 2003 r. w Sprawie Dopuszczalnych Poziomów Pól Elektromagnetycznych w Środowisku Oraz Sposobów Sprawdzania Dotrzymania tych Poziomów. Dz.U. nr 192, poz. 1883, Warszawa, Poland, 14 Novermber 2003. Available online: https://isap.sejm.gov.pl/isap.nsf/home.xsp (accessed on 17 May 2024).
- Zeńczak, M. Analiza pola elektrycznego i magnetycznego wokół linii elektroenergetycznych i wybranych urządzeń elektroenergetycznych. Autom. W Energetyce—Napędy I Sterow. 2011, 9, 148–153. Available online: http://beta.nis.com.pl/userfiles/editor/nauka/92011_n/Zeczak_09-2011.pdf (accessed on 17 May 2024).
- Zeńczak, M. Analiza Technicznych Problemów Związanych z Dozymetrią Pól Elektromagnetycznych o Częstotliwości Przemysłowej; Prace Naukowe Politechniki Szczecińskiej: Szczecin, Poland, 1998. [Google Scholar]
- Krakowski, M. Obwody Ziemno Powrotne; Wydawnictwa Naukowo-Techniczne: Warszawa, Poland, 1979. [Google Scholar]
- FFTSES User’s Manual, Fast Fourier Transforms; Safe Engineering Services & Technologies Ltd.: Montreal, Canada, 1997.
- Linie i Stacje Elektroenergetyczne w Środowisku Człowieka (Power Lines and Power Stations in the Human Environment); Informator (Register); PSE–Operator: Warszawa, Poland, 2008; Available online: https://docplayer.pl/7544474-Linie-i-stacje-elektroenergetyczne-w-srodowisku-czlowieka.html (accessed on 17 May 2024).
- Sokólski, W.; Machczyński, W.; Rozwadowski, J. Oddziaływanie indukcyjne linii elektroenergetycznych wysokiego napięcia na gazociągi–Część II. In Ochrona Przed Korozją; SIGMA-NOT: Warsaw, Poland, 2006; Volume 8, pp. 244–248. Available online: https://sigma-not.pl/ (accessed on 17 May 2024).
- Racasan, A.; Munteanu, C.; Topa, V.; Pop, I.T.; Merdan, E. 3D electromagnetic field model for numerical analysis of the electromagnetic interferences between overhead power lines and pipelines. In Proceedings of the 11th International Conference on Electrical Power Quality and Utilisation, Lisbon, Portugal, 17–19 October 2011; pp. 1–6. [Google Scholar] [CrossRef]
- Czumbil, L.; Micu, D.D.; Stet, D.; Ceclan, A. A neural network approach for the inductive coupling between overhead power lines and nearby metallic pipelines. In Proceedings of the 2016 International Symposium on Fundamentals of Electrical Engineering (ISFEE), Bucharest, Romania, 30 June–2 July 2016; pp. 1–6. [Google Scholar] [CrossRef]
- Munteanu, C.; Topa, V.; Mates, G.; Purcar, M.; Racasan, A.; Pop, I.T. Analysis of the electromagnetic interferences between overhead power lines and buried pipelines. In Proceedings of the International Symposium on Electromagnetic Compatibility-EMC EUROPE, Rome, Italy, 17–21 September 2012; pp. 1–6. [Google Scholar] [CrossRef]
- Rabah, D.; Chafik, H.A.; Bessedik, S.A. Electrostatic and electromagnetic effects of HV overhead power line on above metallic pipeline. In Proceedings of the 2017 5th International Conference on Electrical Engineering-Boumerdes (ICEE-B), Boumerdes, Algeria, 29–31 October 2017; pp. 1–6. [Google Scholar] [CrossRef]
- Al Shahri, A.S.; Nair, N.-K.C. Mitigation system for protecting buried pipeline located close to HV OHTL/power cable. In Proceedings of the 2016 IEEE International Conference on Power System Technology (POWERCON), Wollongong, NSW, Australia, 28 September–1 October 2016; pp. 1–6. [Google Scholar] [CrossRef]
- Nourredine, T.; Rabah, D.; Abdechafik, H. Modeling of inductive coupling on aerial metallic Pipeline from HV overhead power line. In Proceedings of the 2022 19th International Multi-Conference on Systems, Signals & Devices (SSD), Sétif, Algeria, 6–10 May 2022; pp. 1813–1819. [Google Scholar] [CrossRef]
- Al Shahri, A.S.; Nair, N.-K.C. Overhead shielding wire and induced potential on pipeline located close to high voltage transmission. In Proceedings of the 2016 Australasian Universities Power Engineering Conference (AUPEC), Brisbane, QLD, Australia, 25–28 September 2016; pp. 1–4. [Google Scholar] [CrossRef]
- Chai, C.S.; Abidin Ab Kadir, M.Z.; Izadi, M.; Jasni, J.; Gomes, C. The effect of electromagnetic fields due to hv line on the parallel pipeline. In Proceedings of the 2014 IEEE International Conference on Power and Energy (PECon), Kuching, Malaysia, 1–3 December 2014; pp. 21–26. [Google Scholar] [CrossRef]
- ANSI/IEEE 80:2013; IEEE Guide for Safety in AC Substation Grounding. IEEE: Piscataway, NJ, USA, 2013. [CrossRef]
- Harun, Z.A.; Osman, M.; Ariffin, A.M.; Zainal Abidin Ab Kadir, M. Effect of AC Interference on HV Underground Cables Buried Within Transmission Lines Right of Way. In Proceedings of the 2021 IEEE International Conference on the Properties and Applications of Dielectric Materials (ICPADM), Johor Bahru, Malaysia, 11–15 July 2021; pp. 73–76. [Google Scholar] [CrossRef]
- Shen, M.; Shah, S.; Eftekhari, R. Study of electromagnetic interference on distribution conductors from parallel transmission line and practical mitigation solutions. In Proceedings of the 2014 IEEE PES T&D Conference and Exposition, Chicago, IL, USA, 14–17 April 2014; pp. 1–9. [Google Scholar] [CrossRef]
- Xing, L.; Wen, Y.; Xiao, J.; Chen, S.; Zhang, D.; Ma, C. Low frequency magnetic protection design of railway signal lines on rail-road bridge. In Proceedings of the 2017 7th IEEE International Symposium on Microwave, Antenna, Propagation, and EMC Technologies (MAPE), Xi’an, China, 24–27 October 2017; pp. 268–272. [Google Scholar] [CrossRef]
- Zhang, L.; Zhu, Y.; Chen, S.; Zhang, D. Research on the Magnetic Effect of Ground-laid Traction Net Protective Wire on the Signal Cable. In Proceedings of the 2020 6th Global Electromagnetic Compatibility Conference (GEMCCON), Xi’an, China, 20–23 October 2020; pp. 1–4. [Google Scholar] [CrossRef]
- How to… Engineering Guide: SESTLC–EM Field and AC Interference Study; Safe Engineering Services & Technologies Ltd.: Laval, QC, Canada, 2017.
- Dawalibi, F.P.; Southey, R.D. Analysis of electrical interference from power lines to gas pipelines, Part I: Computation methods. IEEE Trans. Power Deliv. 1989, 4, 1840–1846. [Google Scholar] [CrossRef]
- Dawalibi, F.P.; Southey, R.D. Analysis of electrical interference from power lines to gas pipelines, Part II: Parametric analysis. IEEE Trans. Power Deliv. 1990, 5, 415–421. [Google Scholar] [CrossRef]
- Łapiński, T.; Perkowski, Z. Przewody Telekomunikacyjne; WKŁ: Warszawa, Poland, 1972. [Google Scholar]
- IEEE Std 1410-2004; IEEE Guide for Improving the Lightning Performance of Electric Power Overhead Distribution Lines. IEEE: Piscataway, NJ, USA, 2004.
Disclaimer/Publisher’s Note: The statements, opinions and data contained in all publications are solely those of the individual author(s) and contributor(s) and not of MDPI and/or the editor(s). MDPI and/or the editor(s) disclaim responsibility for any injury to people or property resulting from any ideas, methods, instructions or products referred to in the content. |
© 2024 by the authors. Licensee MDPI, Basel, Switzerland. This article is an open access article distributed under the terms and conditions of the Creative Commons Attribution (CC BY) license (https://creativecommons.org/licenses/by/4.0/).