
Viscosity Reduction Behavior of Carbon Nanotube Viscosity Reducers with Different Molecular Structures at the Oil–Water Interface: Experimental Study and Molecular Dynamics Simulation

 and
and
Abstract
:1. Introduction
2. Materials and Methods
2.1. Materials
2.2. Preparation of Carbon Nanotubes with Different Molecular Structures
2.2.1. Synthesis of Carbon Nanotubes
2.2.2. Preparation of Nanofluids
2.3. Fourier-Transform Infrared Spectroscopy (FTIR), Scanning Electron Microscopy (SEM), and Contact Angle
2.4. Evaluation of Dispersion Properties of Nanofluids
2.5. Viscosity Reduction Experiment
- (1)
- Conductivity experiment
- (2)
- Emulsion viscosity
- (3)
- Emulsion stabilization experiment
2.6. Interfacial Tension Experiment
2.7. Molecular Dynamics Simulation
3. Results and Discussion
3.1. FTIR
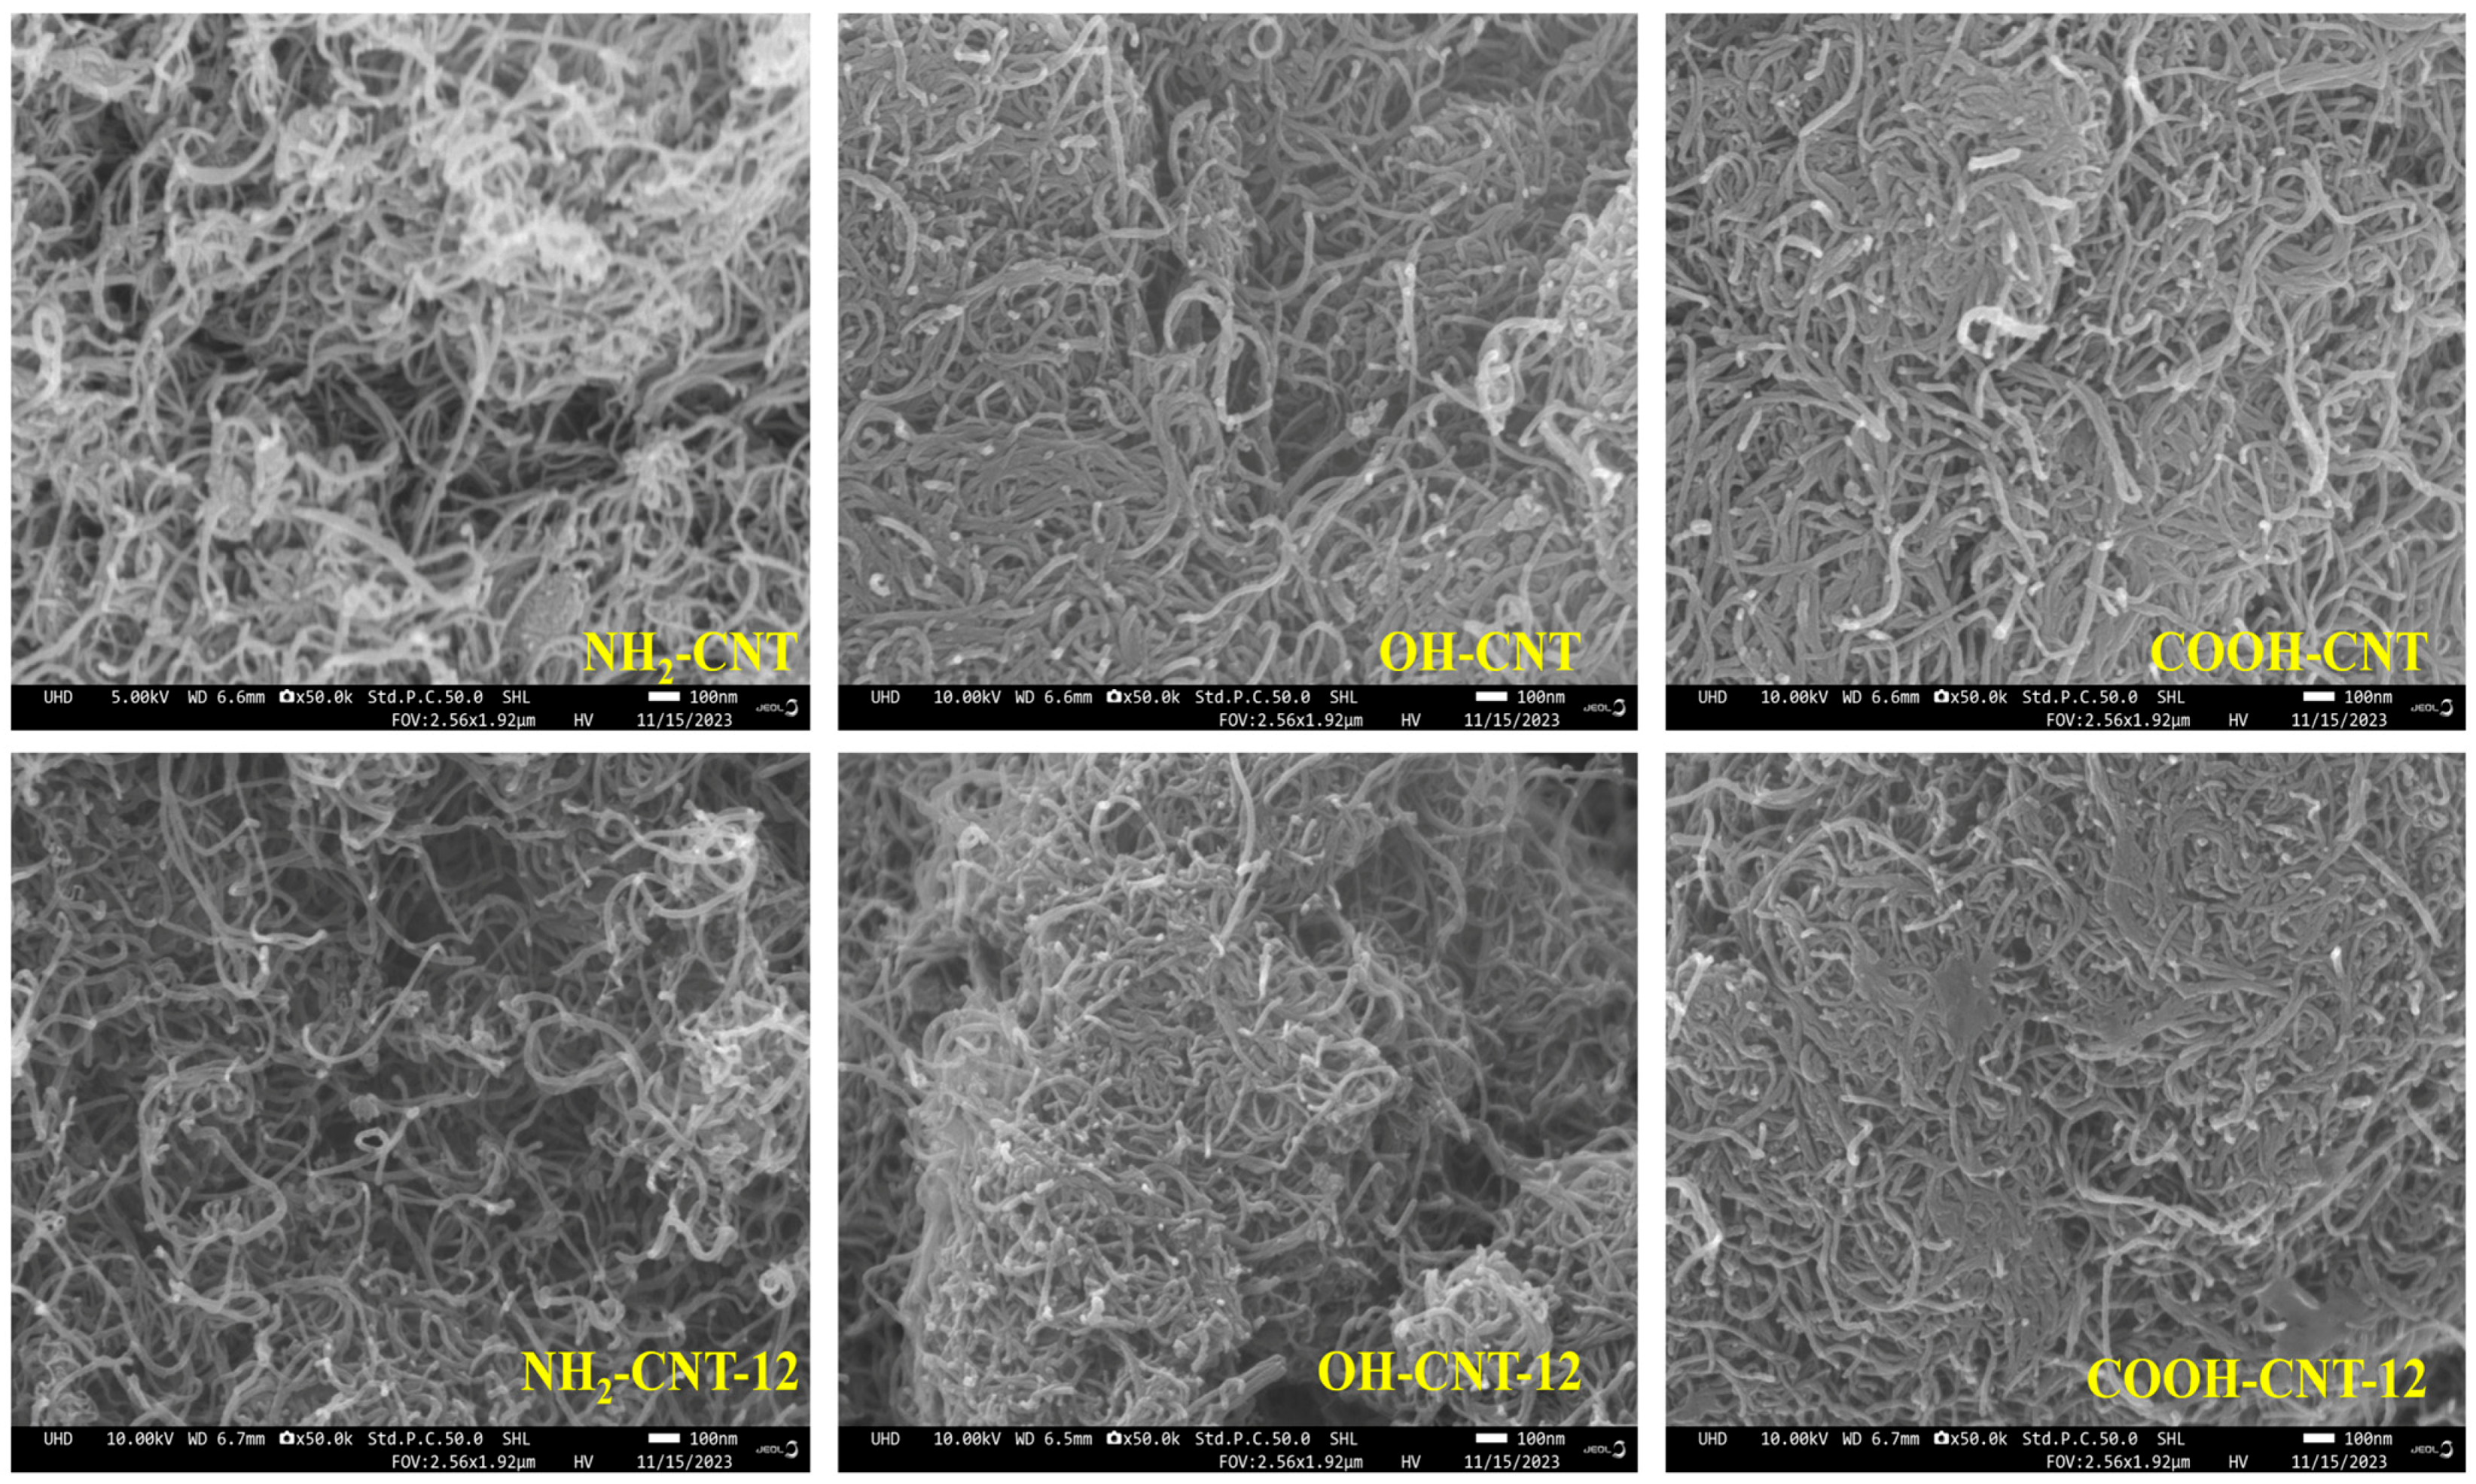
3.2. SEM
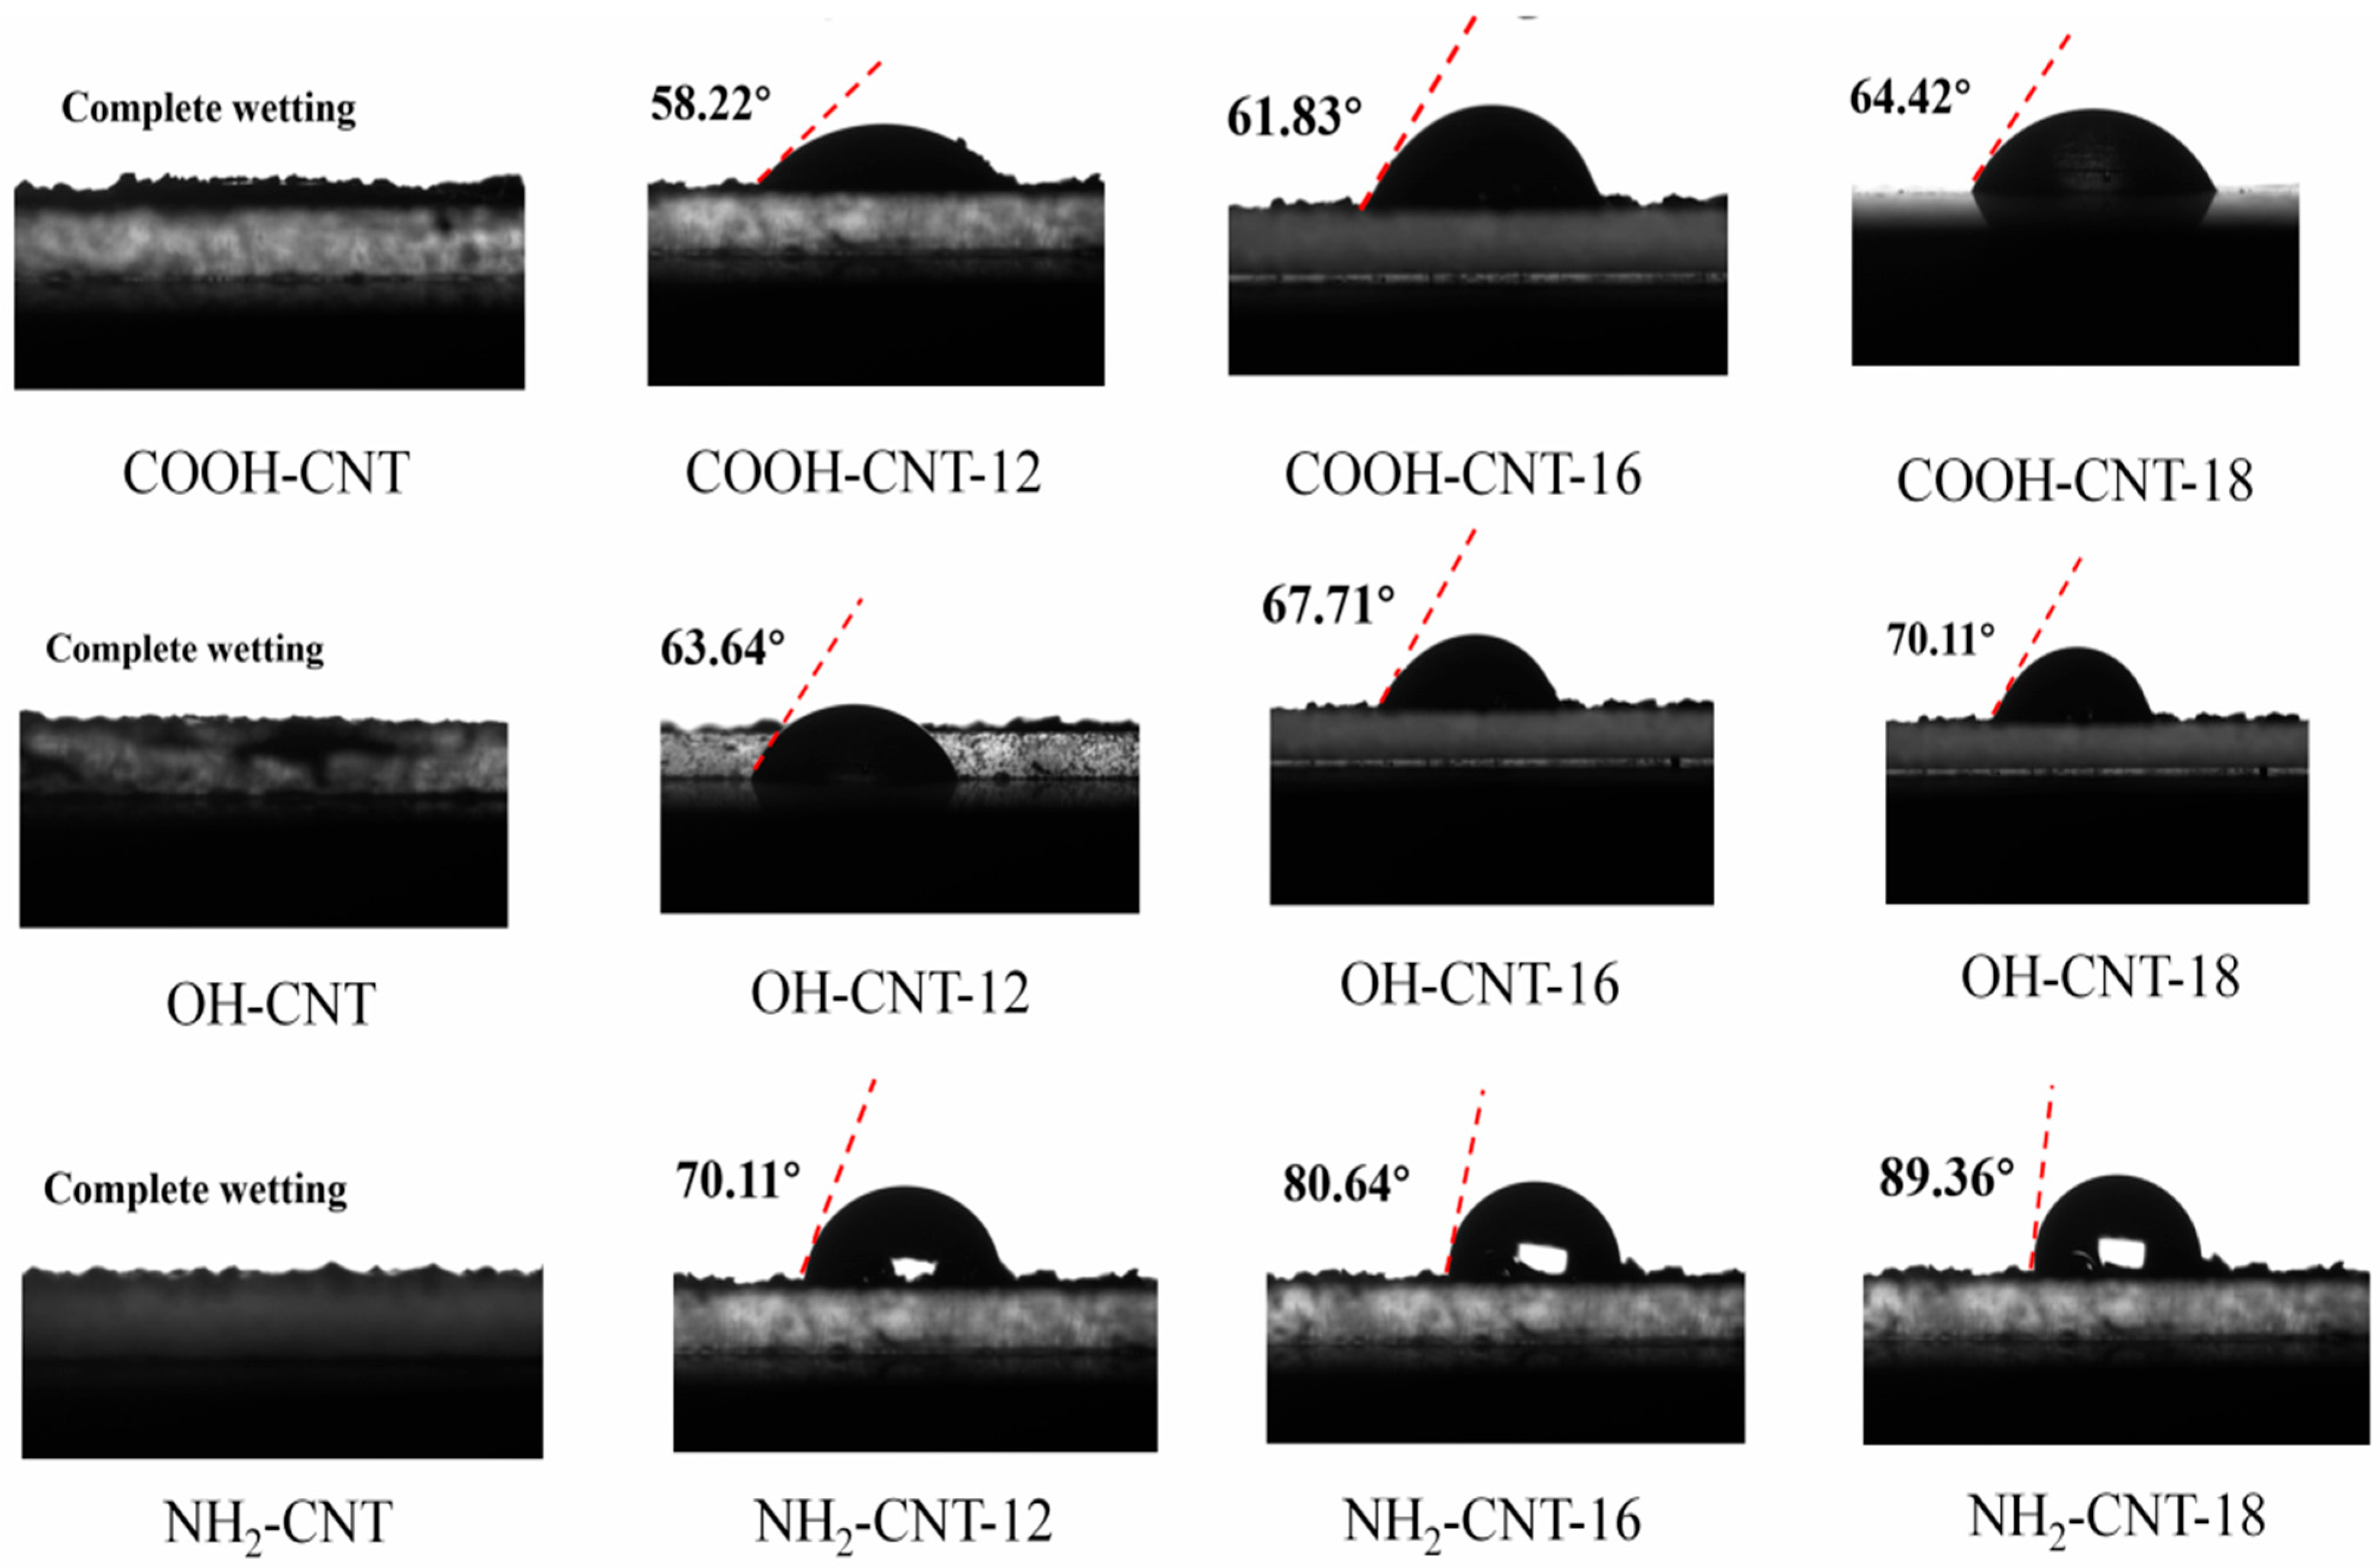
3.3. Contact Angle
3.4. Dispersion Properties of Nanofluids
3.5. Viscosity Reduction Experiment
3.5.1. Emulsion Type
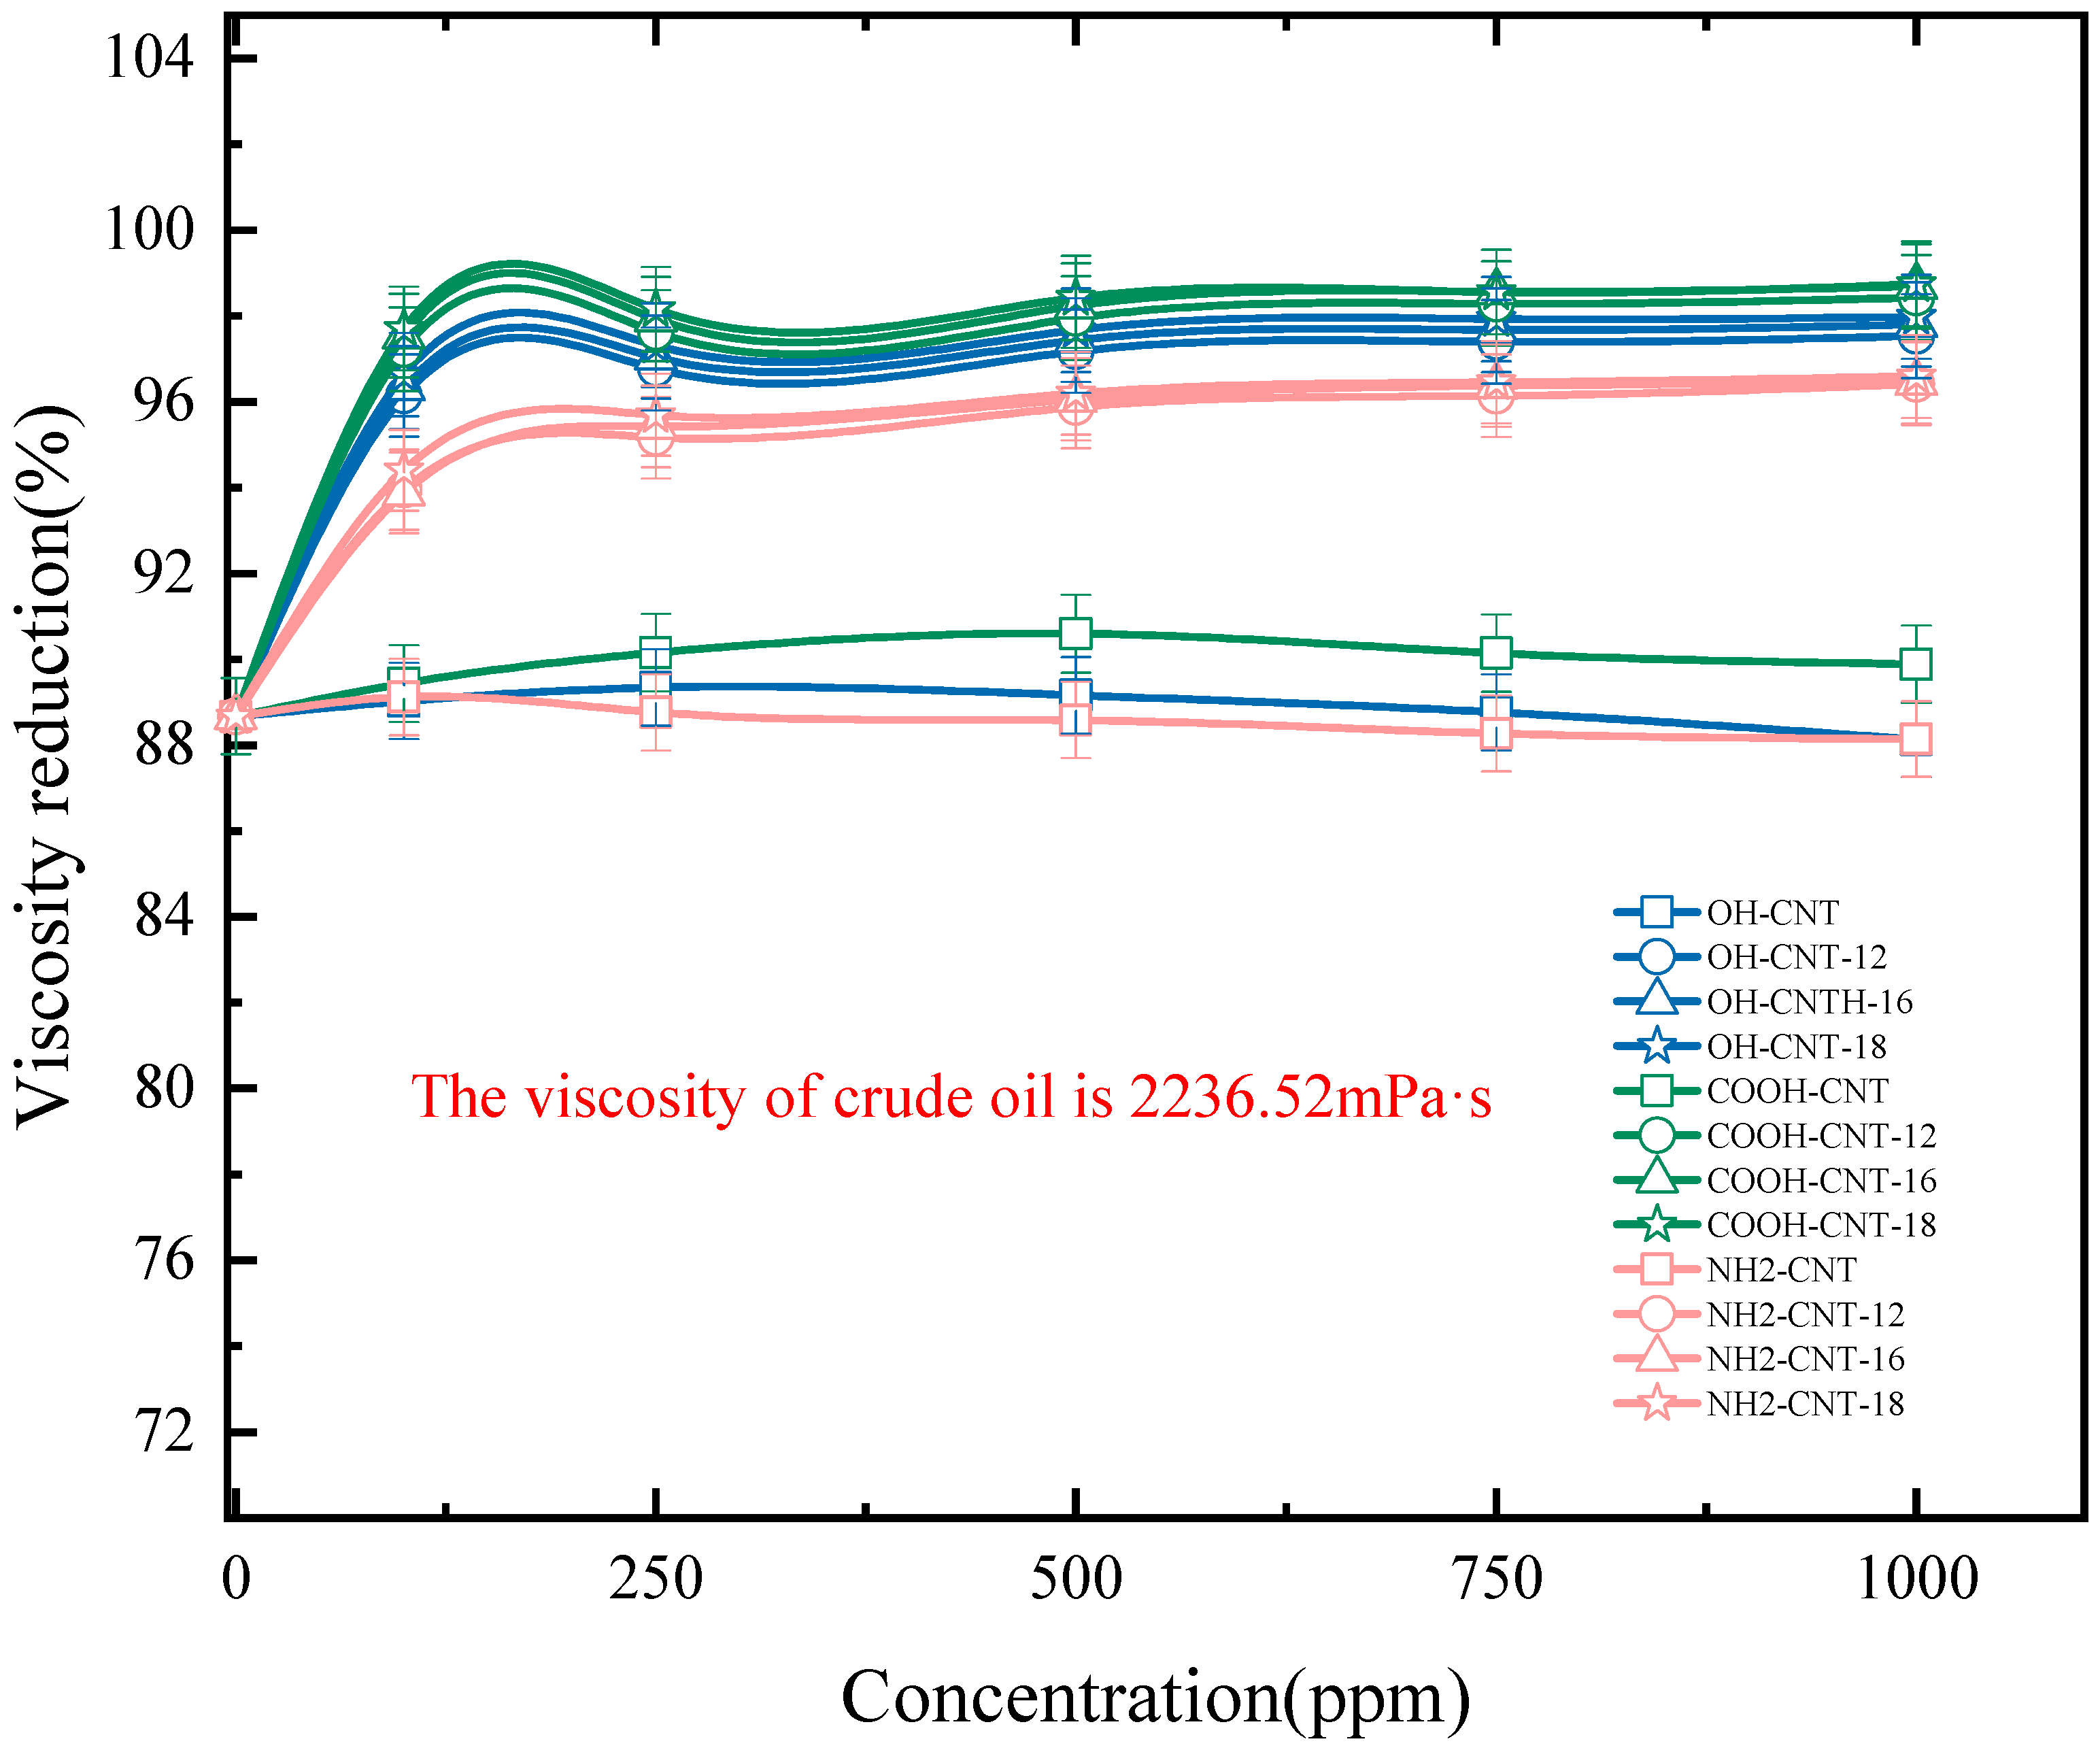
3.5.2. Emulsion Viscosity
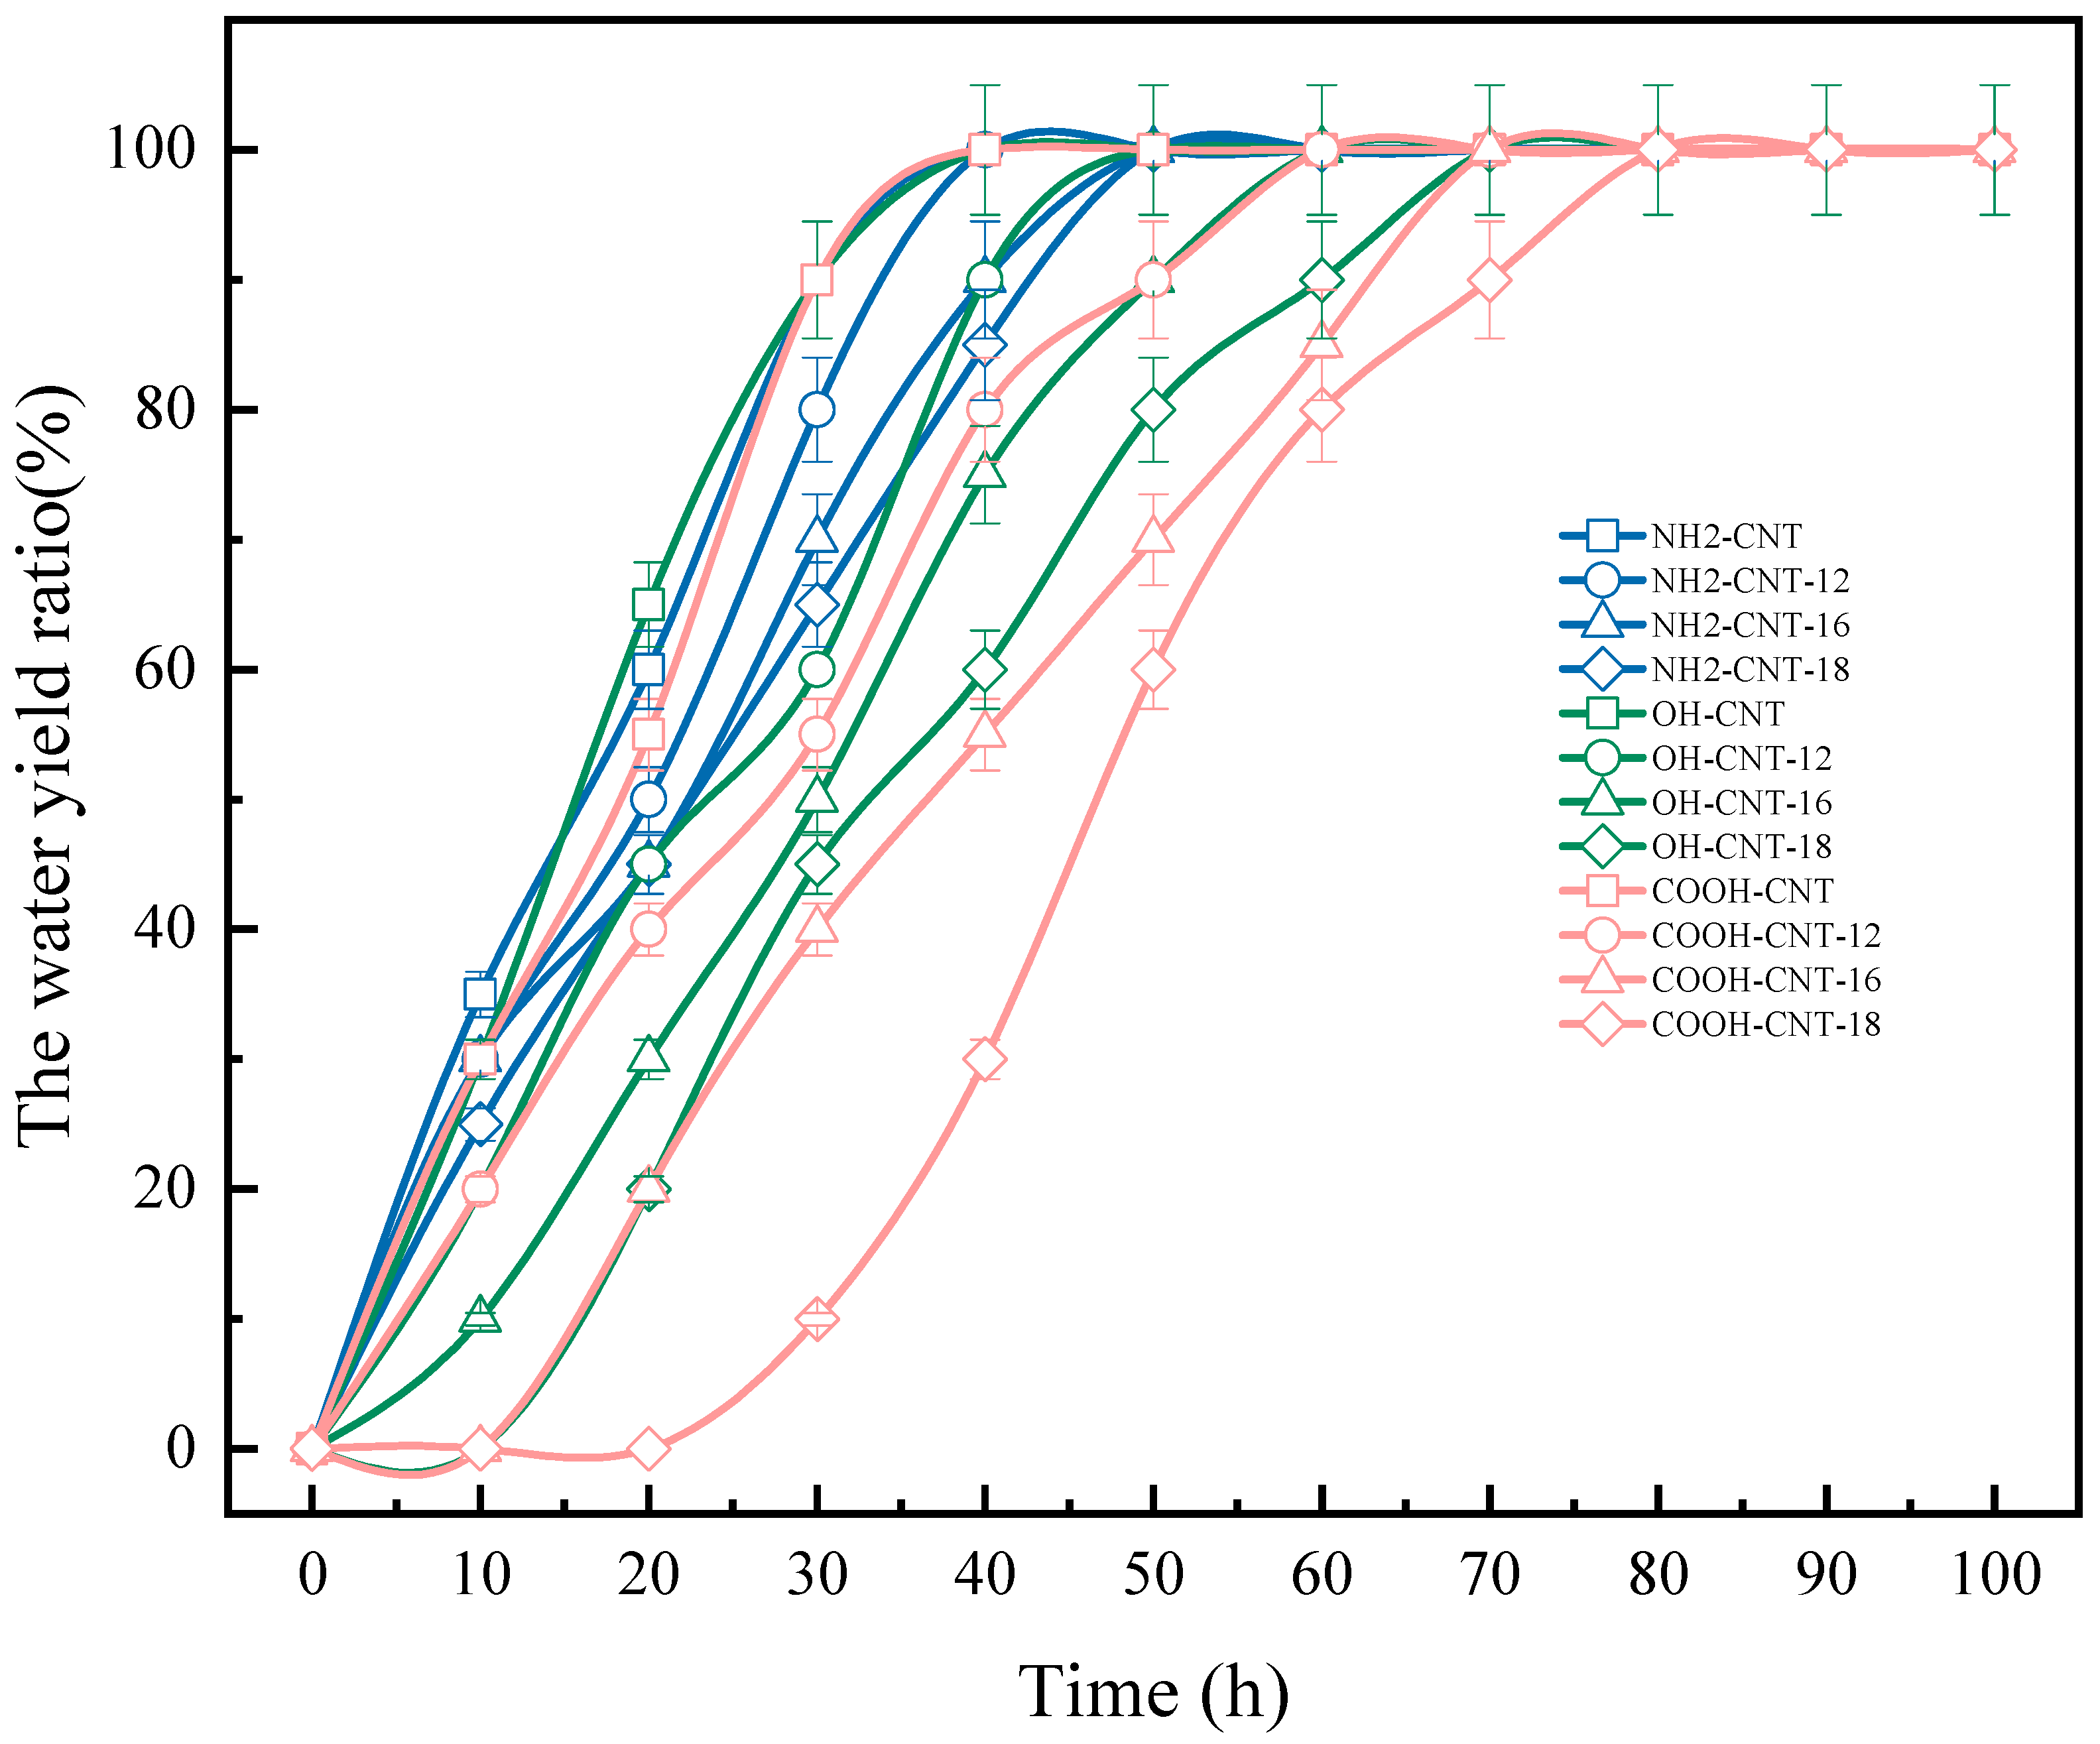
3.5.3. Emulsion Stability
3.6. Interfacial Tension Experiment
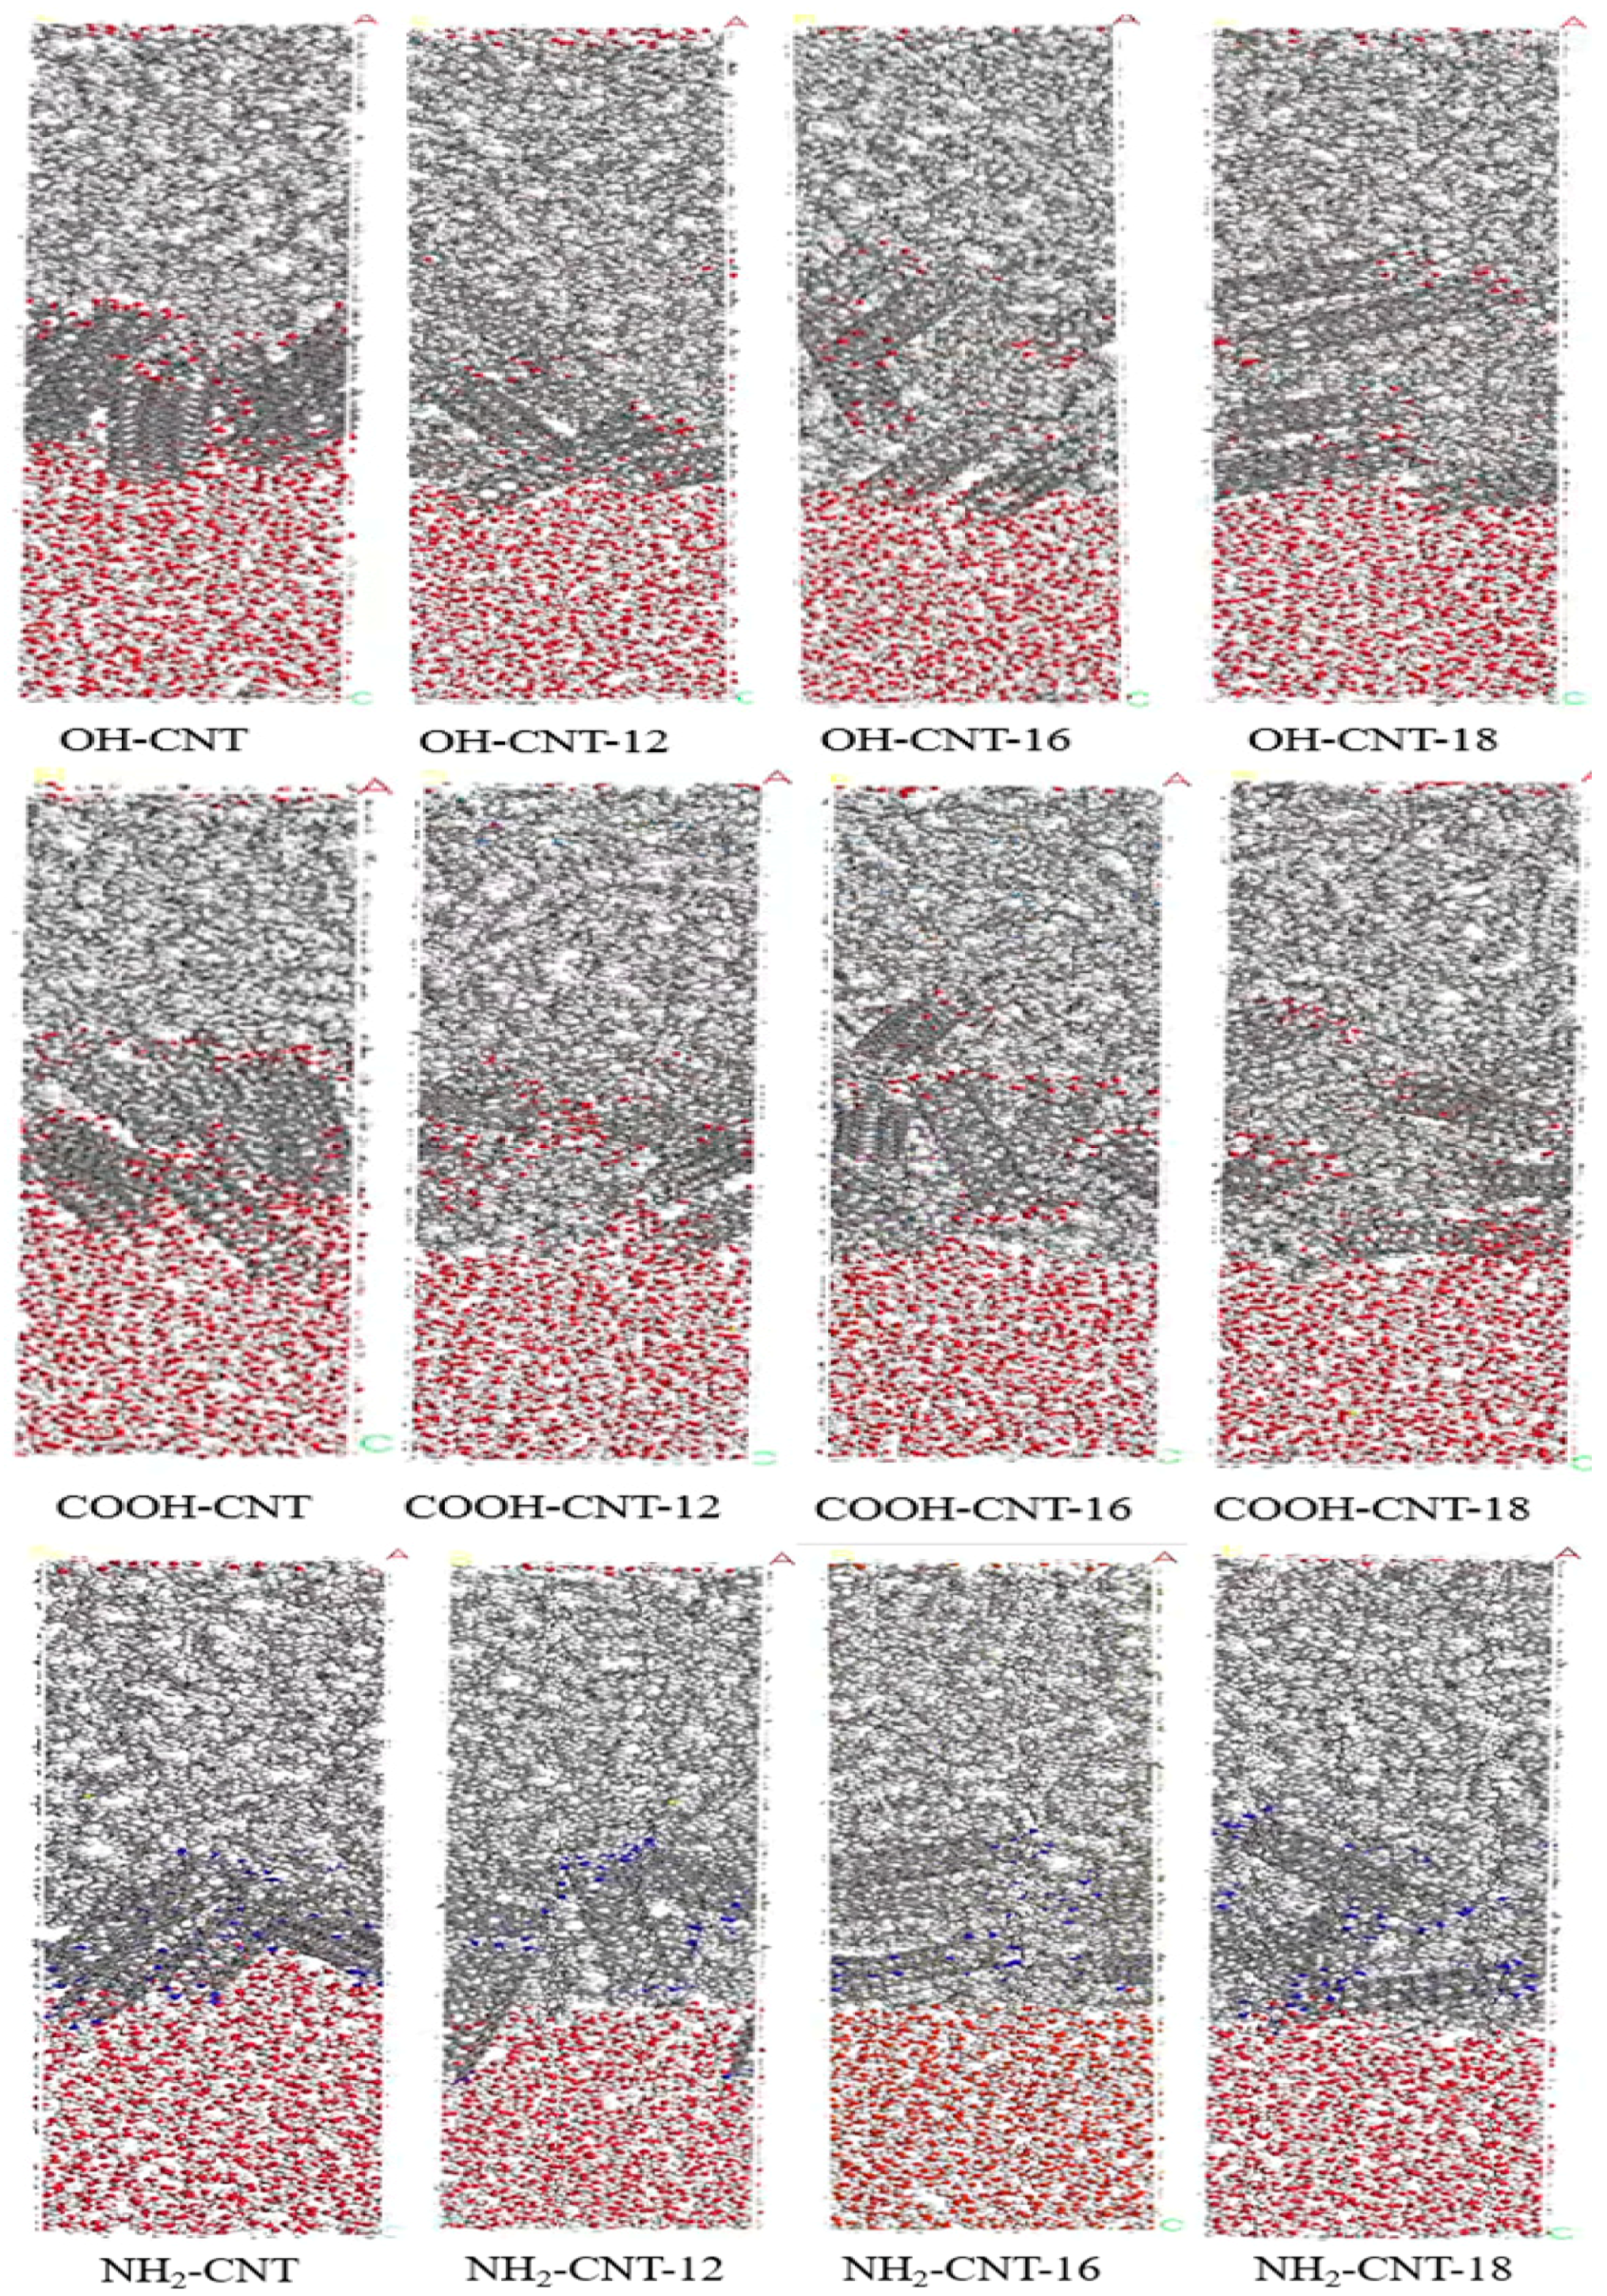
3.7. Molecular Dynamics Simulation
4. Conclusions
Author Contributions
Funding
Data Availability Statement
Conflicts of Interest
References
- Kapustin, N.O.; Grushevenko, D.A. Global prospects of unconventional oil in the turbulent market: A long term outlook to 2040. Oil Gas Sci. Technol. 2018, 73, 67. [Google Scholar] [CrossRef]
- Zou, C.; Yang, Z.; Zhu, R.; Zhang, G.; Hou, L.; Wu, S.; Tao, S.; Yuan, X.; Dong, D.; Wang, Y. Progress in China’s Unconventional Oil & Gas Exploration and Development and Theoretical Technologies. Acta Geol. Sin.-Engl. Ed. 2015, 89, 938–971. [Google Scholar]
- Xue, L.; Liu, P.; Zhang, Y. Development and Research Status of Heavy Oil Enhanced Oil Recovery. Geofluids 2022, 2022, 5015045. [Google Scholar] [CrossRef]
- Fakher, S.; Ahdaya, M.; Elturki, M.; Imqam, A. Critical review of asphaltene properties and factors impacting its stability in crude oil. J. Pet. Explor. Prod. Technol. 2020, 10, 1183–1200. [Google Scholar] [CrossRef]
- He, X.; Liu, H.; Liu, X.; Jiang, W.; Zheng, W.; Zhang, H.; Lv, K.; Chen, H. Experimental study and numerical simulation of heavy oil viscosity reduction device based on jet cavitation. Pet. Sci. Technol. 2023, 1–23. [Google Scholar] [CrossRef]
- Pu, W.; He, M.; Yang, X.; Liu, R.; Shen, C. Experimental study on the key influencing factors of phase inversion and stability of heavy oil emulsion: Asphaltene, resin and petroleum acid. Fuel 2022, 311, 122631. [Google Scholar] [CrossRef]
- He, M.; Pu, W.; Yang, X. Experimental study on the effect of high water cut on the emulsifying properties of crude oil. Colloids Surf. A Physicochem. Eng. Asp. 2023, 674, 131917. [Google Scholar] [CrossRef]
- He, M.; Pu, W.; Yang, X.; Liu, R. Predicting the emulsion phase inversion point during self-emulsification using an improved free energy model and determining the model applicability. J. Mol. Liq. 2023, 369, 120869. [Google Scholar] [CrossRef]
- Xu, J.; Xue, S.; Zhang, J.; Han, Y.; Xia, S. Molecular Design of the Amphiphilic Polymer as a Viscosity Reducer for Heavy Crude Oil: From Mesoscopic to Atomic Scale. Energy Fuels 2021, 35, 1152–1164. [Google Scholar] [CrossRef]
- Kumar, R.; Bora, G.S.; Banerjee, S.; Mandal, A.; Naiya, T.K. Application of naturally extracted surfactant from Madhuca longifolia to improve the flow properties of heavy crude oil through horizontal pipeline. J. Pet. Sci. Eng. 2018, 168, 178–189. [Google Scholar] [CrossRef]
- Li, N.; Ma, H.; Wang, T.; Sun, C.; Xia, S. Effect of molecular weight on the properties of water-soluble terpolymers for heavy oil viscosity reduction. J. Taiwan Inst. Chem. Eng. 2023, 144, 104738. [Google Scholar] [CrossRef]
- Bao, L.; Wang, H.; Wu, Y.; Li, X.; Qiao, W. Synthesis of a Series of Anionic Surfactants Derived from NP and their Properties as Emulsifiers for Reducing Viscosity of Highly Viscous Oil via Formation of O/W Emulsions. J. Surfactants Deterg. 2016, 19, 979–987. [Google Scholar] [CrossRef]
- Wang, S.; Tian, Z.; Du, Y.; Ma, J.; Guo, S.; Zhao, M.; Zhu, J.; Li, X.; Sun, K. Studies on reducing viscosity of extra-heavy crude oil through O/W emulsion formation with alkylphenoxypolyoxyethylenepolyoxypropylene. Oilfield Chem. 2003, 20, 7–9, 42. [Google Scholar]
- Chen, Q.; Liu, Y.; Hou, J.; Li, X.; Wei, B.; Du, Q. Phase Transition Characteristics of Heavy Oil-Viscosity Reducer-Water Emulsion Systems. J. Mol. Liq. 2023, 397, 121638. [Google Scholar] [CrossRef]
- Chen, M.; Wang, Y.; Chen, W.; Ding, M.; Zhang, Z.; Zhang, C.; Cui, S. Synthesis and evaluation of multi-aromatic ring copolymer as viscosity reducer for enhancing heavy oil recovery. Chem. Eng. J. 2023, 472, 144220. [Google Scholar] [CrossRef]
- Zhai, M.; Zhou, K.; Sun, Z.; Du, Q.; Wei, Y.; Hou, J. Study on the matching relationship between dispersed droplet size in O/W emulsion and reservoir permeability. Int. J. Multiph. Flow 2022, 150, 104025. [Google Scholar] [CrossRef]
- Liu, J.; Zhong, L.; Ren, L.; Hao, T.; Wang, C.; Liu, Y.; Jiang, Y.; Zhou, Y. Laboratory Evaluation of Fluidity of Heavy Oil Emulsions in Formation Pores Medium. ACS Omega 2021, 6, 623–632. [Google Scholar] [CrossRef]
- Feng, S.; Jiang, Z.; Tang, S.; Hu, R.; Jin, L.; Wang, S.; Wang, R. Synthesis, interfacial activity and rheological properties of low interfacial tension viscoelastic Gemini surfactants. J. Pet. Sci. Eng. 2022, 209, 109845. [Google Scholar] [CrossRef]
- Zhang, F.; Zhang, Q.; Zhou, Z.; Sun, L.; Zhou, Y. Study on the Effect of Different Viscosity Reducers on Viscosity Reduction and Emulsification with Daqing Crude Oil. Molecules 2023, 28, 1399. [Google Scholar] [CrossRef]
- Wang, Y.; Li, M.; Hou, J.; Zhang, L.; Jiang, C. Design, synthesis and properties evaluation of emulsified viscosity reducers with temperature tolerance and salt resistance for heavy oil. J. Mol. Liq. 2022, 356, 118977. [Google Scholar] [CrossRef]
- Ribeiro, A.; Manrique, Y.A.; Ferreira, I.C.F.R.; Barreiro, M.F.; Lopes, J.C.B.; Dias, M.M. Nanohydroxyapatite (n-HAp) as a pickering stabilizer in oil-in-water (O/W) emulsions: A stability study. J. Dispers. Sci. Technol. 2022, 43, 814–826. [Google Scholar] [CrossRef]
- Jiang, Y.; Wang, C.; Zhang, F.; Qi, Z.; Liu, G.; Zhao, J.; Zhou, Y.; Wang, B.; Lian, G.; Liu, P. Microscopic Visualization Experimental Study on the Effect and Mechanism of Viscosity Reducer on Emulsification of Heavy Oil. Energies 2023, 16, 2538. [Google Scholar] [CrossRef]
- Liu, J.; Zhong, L.; Yuan, X.; Liu, Y.; Zou, J.; Wang, Q.; Zhang, W.; Zhang, H. Study on the Re-emulsification Process of Water in Heavy Oil Emulsion with Addition of Water-Soluble Viscosity Reducer Solution. Energy Fuels 2019, 33, 10852–10860. [Google Scholar] [CrossRef]
- Sun, X.; Ge, J. Synergism between lipophilic surfactant and lipophilic SiO2 nanoparticles enhances self-emulsification performance. J. Pet. Sci. Eng. 2022, 216, 110760. [Google Scholar] [CrossRef]
- Gou, R.; Pu, W.; Liu, R.; Chen, Y.; Zhang, T.; Lin, X. A novel hybrid hyperbranched nanowire CNTs for enhancing oil recovery through increasing viscoelasticity and high-viscous emulsions to compensate reservoir heterogeneity. Colloids Surf. A Physicochem. Eng. Asp. 2022, 654, 130118. [Google Scholar] [CrossRef]
- Maurya, N.K.; Mandal, A. Investigation of synergistic effect of nanoparticle and surfactant in macro emulsion based EOR application in oil reservoirs. Chem. Eng. Res. Des. 2018, 132, 370–384. [Google Scholar] [CrossRef]
- Hassan, Y.M.; Guan, B.H.; Chuan, L.K.; Halilu, A.; Adil, M.; Adam, A.A.; Abdulkadir, B.A. Interfacial tension and wettability of hybridized ZnOFe2O3/SiO2 based nanofluid under electromagnetic field inducement. J. Pet. Sci. Eng. 2022, 211, 110184. [Google Scholar] [CrossRef]
- Tian, K.; Pu, W.; Wang, Q.; Li, S.; Liu, S.; Xie, M.; Wang, Y. Effect of Amphiphilic CaCO3 Nanoparticles on the Plant Surfactant Saponin Solution on the Oil–Water Interface: A Feasibility Research of Enhanced Oil Recovery. Energy Fuels 2023, 37, 12854–12864. [Google Scholar] [CrossRef]
- Joshi, D.; Maurya, N.K.; Kumar, N.; Mandal, A. Experimental investigation of silica nanoparticle assisted Surfactant and polymer systems for enhanced oil recovery. J. Pet. Sci. Eng. 2022, 216, 110791. [Google Scholar] [CrossRef]
- Pillai, P.; Saw, R.K.; Singh, R.; Padmanabhan, E.; Mandal, A. Effect of synthesized lysine-grafted silica nanoparticle on surfactant stabilized O/W emulsion stability: Application in enhanced oil recovery. J. Pet. Sci. Eng. 2019, 177, 861–871. [Google Scholar] [CrossRef]
- Peng, B.; Zhang, L.; Luo, J.; Wang, P.; Ding, B.; Zeng, M.; Cheng, Z. A review of nanomaterials for nanofluid enhanced oil recovery. RSC Adv. 2017, 7, 32246–32254. [Google Scholar] [CrossRef]
- Yue, L.; Pu, W.; Zhao, T.; Zhuang, J.; Zhao, S. A high performance magnetically responsive Janus nano-emulsifier: Preparation, emulsification characteristics, interfacial rheology, and application in emulsion flooding. J. Pet. Sci. Eng. 2022, 208, 109478. [Google Scholar] [CrossRef]
- Tian, K.; Pu, W.; Wang, Q.; Liu, S.; Li, S. An amphiphilic nano calcium carbonate: Preparation, emulsification, interface properties, and displacement mechanism in low permeability reservoir. Colloids Surf. A Physicochem. Eng. Asp. 2023, 676, 132172. [Google Scholar] [CrossRef]
- Tian, K.; Pu, W.; Li, S.; Wang, Q.; Liu, S. An amphiphilic nano titanium dioxide based nanofluid: Preparation, dispersion, emulsion, interface properties, wettability and application in enhanced oil recovery. Chem. Eng. Res. Des. 2023, 197, 685–696. [Google Scholar] [CrossRef]
- Pu, W.; Chang, J.; Jiang, R.; Shen, C. Study on the influence of heavy oil group components on the formation and stability of W/O emulsion. J. Dispers. Sci. Technol. 2023, 44, 1671–1679. [Google Scholar] [CrossRef]
- Shi, P.; Yu, A.; Zhang, H.; Duan, M.; Pu, W.; Liu, R. A study on the contribution of the intermolecular forces to the stabilization of the high internal phase emulsion: A combined experimental and molecular dynamics study. J. Pet. Sci. Eng. 2023, 220 Pt B, 111188. [Google Scholar] [CrossRef]


| Oil Species | Density (g/cm3) | Viscosity (mPa·s) | Saturates | Aromatics | Resins | Asphaltenes | API |
|---|---|---|---|---|---|---|---|
| BO-1 | 0.943 | 2236.52 | 40.85% | 28.99% | 24.18% | 5.98% | 14.6° |
| Sample Name | Potential Value | Sample Name | Potential Value | Sample Name | Potential Value |
|---|---|---|---|---|---|
| NH2-CNT | 6.88 | OH-CNT | 6.75 | COOH-CNT | 10.66 |
| NH2-CNT-12 | 16.77 | OH-CNT-12 | 20.96 | COOH-CNT-12 | 25.56 |
| NH2-CNT-16 | 20.15 | OH-CNT-16 | 26.25 | COOH-CNT-16 | 32.44 |
| NH2-CNT-18 | 23.98 | OH-CNT-18 | 31.78 | COOH-CNT-18 | 38.78 |
| Sample Name | Particle Size | Sample Name | Particle Size | Sample Name | Particle Size |
|---|---|---|---|---|---|
| NH2-CNT | 1097.8 | OH-CNT | 930.5 | COOH-CNT | 836.2 |
| NH2-CNT-12 | 709.3 | OH-CNT-12 | 862.1 | COOH-CNT-12 | 555.8 |
| NH2-CNT-16 | 685.12 | OH-CNT-16 | 768.2 | COOH-CNT-16 | 485.7 |
| NH2-CNT-18 | 679.3 | OH-CNT-18 | 607.4 | COOH-CNT-18 | 436.6 |
| Sample | Conductivity Value (μs/cm) | Sample | Conductivity Value (μs/cm) | Sample | Conductivity Value (μs/cm) | Sample | Conductivity Value (μs/cm) |
|---|---|---|---|---|---|---|---|
| NH2-CNT | 1356 | OH-CNT | 1723 | COOH-CNT | 2234 | Water | 2234 |
| NH2-CNT-12 | 1224 | OH-CNT-12 | 1643 | COOH-CNT-12 | 2188 | BO-1 | 0.01 |
| NH2-CNT-16 | 1185 | OH-CNT-16 | 1522 | COOH-CNT-16 | 2126 | BO-2 | 0.01 |
| NH2-CNT-18 | 1136 | OH-CNT-18 | 1467 | COOH-CNT-18 | 2059 | BO-3 | 0.01 |
| Sample | Diffusion Coefficient (A2/ps) | Sample | Diffusion Coefficient (A2/ps) | Sample | Diffusion Coefficient (A2/ps) |
|---|---|---|---|---|---|
| NH2-CNT | 0.0212 | OH-CNT | 0.0508 | COOH-CNT | 0.0594 |
| NH2-CNT-12 | 0.0080 | OH-CNT-12 | 0.0142 | COOH-CNT-12 | 0.0410 |
| NH2-CNT-16 | 0.0059 | OH-CNT-16 | 0.0117 | COOH-CNT-16 | 0.0352 |
| NH2-CNT-18 | 0.0014 | OH-CNT-18 | 0.0014 | COOH-CNT-18 | 0.0341 |
Disclaimer/Publisher’s Note: The statements, opinions and data contained in all publications are solely those of the individual author(s) and contributor(s) and not of MDPI and/or the editor(s). MDPI and/or the editor(s) disclaim responsibility for any injury to people or property resulting from any ideas, methods, instructions or products referred to in the content. |
© 2024 by the authors. Licensee MDPI, Basel, Switzerland. This article is an open access article distributed under the terms and conditions of the Creative Commons Attribution (CC BY) license (https://creativecommons.org/licenses/by/4.0/).
Share and Cite
Hua, Z.; Zhang, J.; Zhu, Y.; Huang, B.; Chen, Q.; Pu, W. Viscosity Reduction Behavior of Carbon Nanotube Viscosity Reducers with Different Molecular Structures at the Oil–Water Interface: Experimental Study and Molecular Dynamics Simulation. Energies 2024, 17, 2564. https://doi.org/10.3390/en17112564
Hua Z, Zhang J, Zhu Y, Huang B, Chen Q, Pu W. Viscosity Reduction Behavior of Carbon Nanotube Viscosity Reducers with Different Molecular Structures at the Oil–Water Interface: Experimental Study and Molecular Dynamics Simulation. Energies. 2024; 17(11):2564. https://doi.org/10.3390/en17112564
Chicago/Turabian StyleHua, Zhao, Jian Zhang, Yuejun Zhu, Bo Huang, Qingyuan Chen, and Wanfen Pu. 2024. "Viscosity Reduction Behavior of Carbon Nanotube Viscosity Reducers with Different Molecular Structures at the Oil–Water Interface: Experimental Study and Molecular Dynamics Simulation" Energies 17, no. 11: 2564. https://doi.org/10.3390/en17112564
APA StyleHua, Z., Zhang, J., Zhu, Y., Huang, B., Chen, Q., & Pu, W. (2024). Viscosity Reduction Behavior of Carbon Nanotube Viscosity Reducers with Different Molecular Structures at the Oil–Water Interface: Experimental Study and Molecular Dynamics Simulation. Energies, 17(11), 2564. https://doi.org/10.3390/en17112564