Article

Viscosity Reduction Behavior of Carbon Nanotube Viscosity Reducers with Different Molecular Structures at the Oil–Water Interface: Experimental Study and Molecular Dynamics Simulation

1
State Key Lab of Offshore Oil & Gas Exploitation, Beijing 100028, China
2
CNOOC Research Institute Co., Ltd., Beijing 100028, China
3
College of Chemistry and Chemical Engineering, Southwest Petroleum University, Chengdu 610500, China
4
State Key Laboratory Oil & Gas Reservoir Geology & Exploration, Chengdu 610500, China
*
Author to whom correspondence should be addressed.
Energies 2024, 17(11), 2564; https://doi.org/10.3390/en17112564
Submission received: 20 March 2024 / Revised: 12 May 2024 / Accepted: 22 May 2024 / Published: 25 May 2024
(This article belongs to the Topic Petroleum and Gas Engineering)

Abstract

:
Effectively enhancing oil recovery can be achieved by reducing the viscosity of crude oil. Therefore, this paper investigated the viscosity reduction behavior of carbon nanotube viscosity reducers with different molecular structures at the oil–water interface, aiming to guide the synthesis of efficient viscosity reducers based on molecular structure. This study selected carbon nanotubes with different functional groups (NH2-CNT, OH-CNT, and COOH-CNT) for research, and carbon nanotubes with varying carbon chain lengths were synthesized. These were then combined with Tween 80 to form a nanofluid. Scanning electron microscopy analysis revealed an increased dispersibility of carbon nanotubes after introducing carbon chains. Contact angle experiments demonstrated that -COOH exhibited the best hydrophilic effect. The experiments of zeta potential, conductivity, viscosity reduction, and interfacial tension showed that, under the same carbon chain length, the conductivity and viscosity reduction rate sequence for different functional groups was -NH2 < -OH < -COOH. The dispersing and stabilizing ability and interfacial tension reduction sequence for different functional groups was -COOH < -OH < -NH2. With increasing carbon chain length, conductivity and interfacial tension decreased, and the viscosity reduction rate and the dispersing and stabilizing ability increased. Molecular dynamics simulations revealed that, under the same carbon chain length, the diffusion coefficient sequence for different functional groups was -NH2 < -OH < -COOH. The diffusion coefficient gradually decreased as the carbon chain length increased, resulting in better adsorption at the oil–water interface. This study holds significant importance in guiding viscosity reduction in heavy oil to enhance oil recovery.

1. Introduction

Petroleum plays a crucial role in China’s energy security and the daily lives of its people. With the continuous extraction of conventional oil resources, the proportion of heavy oil, rich in reserves, in oil field development has been increasing year by year [1,2]. Global geological reserves of heavy oil are estimated at approximately 815 billion tons, accounting for roughly 70% of the global oil reserves [3]. According to confirmed reserves, medium-to-high-viscosity crude oil (underground crude viscosity greater than 50 mPa·s) constitutes over half of the Bohai oil field reserves. However, the current extraction rate of water flooding in the Bohai oil field is less than 20%, indicating immense untapped potential. Viscosity increase in crude oil is often attributed to large molecules such as resins and asphaltenes in heavy oil, leading to increased viscosity [4,5,6]. Moreover, heavy oil contains significant amounts of natural emulsifiers like resins and asphaltenes, which exhibit strong emulsifying synergy. The natural emulsifiers and water easily form high-viscosity water/oil (W/O) emulsions (where water is dispersed in the oil in the form of small droplets with an inner phase of water and an outer phase of oil) during water flooding processes, further amplifying the viscosity difference between water and oil, resulting in suboptimal effects in exploiting viscous oil reservoirs [7,8,9].
Reducing the viscosity of heavy oil primarily involves physical and chemical methods. Among these, heating and dilution with light hydrocarbons are the most commonly employed physical techniques. However, they pose issues such as high costs and increased fuel consumption. Chemical methods primarily involve adding viscosity-reducing agents to decrease the viscosity of crude oil [9,10,11]. These agents enable the emulsification of crude oil with injected water under shear forces, forming an oil-in-water (O/W) emulsion (where oil is dispersed in the water in the form of small droplets with an inner phase of oil and an outer phase of water) [12,13]. Through intermolecular forces and hydrogen bonding, friction between the dispersed fluid droplets (oil) and the continuous phase (water) and even between the oil droplets themselves decreases, resulting in enhanced mobility, which is macroscopically observed as reduced viscosity [14]. Upon reducing the viscosity of heavy oil, there are advantages in improving the oil–water flow ratio, reducing water bypassing, and enhancing oil displacement efficiency [15,16,17]. Additionally, the molecules of viscosity-reducing agents possess both hydrophilic and lipophilic groups on their surfaces. This property allows them to spontaneously migrate to the oil–water interface, with the hydrophilic groups oriented toward the water phase and the lipophilic groups toward the oil phase. Through intermolecular forces, these groups counteract a portion of the repulsive forces between oil and water, lowering the interfacial tension between them and improving the efficiency of water flooding [18,19,20]. Viscosity reducers lower the viscosity of crude oil by emulsifying at the oil–water interface. However, after emulsion destabilization, the viscosity of crude oil quickly reverts, leading to a decline in the effectiveness of viscosity reduction. Thus, ensuring the emulsification efficiency of viscosity-reducing agents is crucial for viscosity reduction and oil recovery from heavy oil [21,22,23].
Due to their smaller size and robust surface activity, numerous scholars have extensively studied nanoparticles to enhance the stability of oil–water interfaces and improve emulsification effects [24,25,26,27]. Tian et al. [28] investigated the impact of modified nano-calcium carbonate on soapberry solution at the oil–water interface. The results indicated that adding modified nano-calcium carbonate was advantageous in enhancing the O/W emulsification effect and emulsion stability of the soapberry solution. Joshi et al. [29] studied how nano-silica assisted surfactants in increasing water flooding recovery rates. Their experiments demonstrated that nanoparticles could further reduce the interfacial tension between surfactants and crude oil while promoting the emulsification effect of surfactants, consequently enhancing the recovery rate. Prathibha et al. [30] synthesized a lysine-grafted silica nanoparticle (LGS) and prepared both water-in-oil and oil-in-water emulsions. Through experiments, it was observed that when nanoparticles and surfactants coexisted, the interfacial tension between them and crude oil was lower compared to nanoparticles alone or surfactants alone, and the prepared emulsions were more stable, resulting in higher oil recovery efficiency. Hence, nanoparticles play a significant role in emulsifying crude oil with surfactants [31]. However, nanoparticles with different properties exhibit varying effects on oil emulsification. Nanoparticles with lipophilic groups form W/O emulsions, while those with hydrophilic groups form O/W emulsions. Therefore, the molecular structure of nanoparticles determines the emulsification effect [32,33]. Yet, research on how the distinct molecular structures of nanoparticles affect the viscosity reduction of crude oil is currently limited.
This study synthesized carbon nanotubes containing amino, carboxyl, and hydroxyl groups and varying carbon chain lengths as nano-viscosity reducers. The structure–property relationship of carbon nanotubes in reducing viscosity with crude oil was analyzed through a series of experiments, including emulsification viscosity reduction, interfacial tension, and contact angle. Additionally, molecular dynamics simulations were employed to study the interfacial behavior of carbon nanotubes with different molecular structures at the oil–water interface. The research conducted in this study provides design principles for the molecular structure of high-efficiency nano-viscosity reducers in the future.

2. Materials and Methods

2.1. Materials

Amino carbon nanotubes, carboxyl carbon nanotubes, and hydroxyl carbon nanotubes, with nano dimensions of 10–15 nm in diameter and 3–12 μm in length, were obtained from Da Zhan Nanometer Co., Ltd. (Binzhou, China). Dodecyl bromide, hexadecyl bromide, and octadecyl bromide were acquired from Bai Ling Wei Co., Ltd. (Shanghai, China). Sodium hydroxide, hydrochloric acid, and anhydrous ethanol were sourced from Chengdu Kolon Reagent Chemical Factory (Chengdu, China). All chemicals were of analytical grade. The simulated formation water comes from the laboratory (total salinity: 11,247.3 mg/L; NaCl: 11,247.3 mg/L; CaCl2: 404.0 mg/L; MgCl2: 1204.1 mg/L; Na2CO3: 765.2 mg/L). The crude oil was obtained from the Bohai Oilfield, and the specific properties of the crude oil are detailed in Table 1. All properties of the crude oil were tested at 65 °C. In addition, all tests were measured in parallel three times, and the results were averaged.

2.2. Preparation of Carbon Nanotubes with Different Molecular Structures

2.2.1. Synthesis of Carbon Nanotubes

NH2-CNT (1 g) was added to 50 mL of anhydrous ethanol and subjected to ultrasound at 30 °C for 30 min using a KH-250 Ultrasonic cleaner (Kunshan Hechuang Ultrasonic Instrument Co., Ltd. (Kunshan, China)) to achieve a uniformly dispersed nano solution. Subsequently, 0.5 g of bromododecane was added to another 50 mL of anhydrous ethanol and sonicated at 50 °C for 30 min until dissolved. This solution was then poured into the nano solution. A NaOH solution was introduced into the mixed solution, adjusting the pH to 12, and allowing the reaction to occur at 65 °C and 400 rpm for 20 h. The pH value was neutralized by adding HCl to the mixed solution. NH2-CNT-12 was obtained through filtration, drying, and crushing, as illustrated in Figure 1, outlining the ANCC preparation process.
Using the same method, dodecyl bromide and octadecyl bromide were reacted with NH2-CNT to obtain NH2-CNT-16 and NH2-CNT-18, respectively. Additionally, other carbon nanotubes (OH-CNT and COOH-CNT) were reacted with alkyl bromides to produce COOH-CNT-12, COOH-CNT-16, COOH-CNT-18, OH-CNT-12, OH-CNT-16, and OH-CNT-18.

2.2.2. Preparation of Nanofluids

Tween-80 (0.05 g) was added to 100 mL of deionized water, and a 500 ppm Tween-80 solution was obtained by stirring at 30 °C and 400 rpm for 10 min. Different concentrations of modified CNTs were added to the Tween-80 solution, and nanofluids were produced by means of ultrasound treatment at 30 °C for 1 h. Adjustments in the concentrations of Tween-80 and ANCC were made in accordance with subsequent experiments.

2.3. Fourier-Transform Infrared Spectroscopy (FTIR), Scanning Electron Microscopy (SEM), and Contact Angle

The analysis of sample functional groups was conducted using a Thermo Scientific Nicolet iS5 FTIR spectrometer (Thermo Fisher Scientific company, Waltham, MA, USA). The experimental procedure involved combining the sample and KBr in an agate bowl at a mass ratio of 1:100. A slice was pressed by an infrared spectrum tablet press under 10 MPa and normal temperature. These pancakes were then subjected to spectral analysis within the wavelength range of 4000–5000 cm−1 to ascertain successful modifications by analyzing the functional groups [34]. At the same time, the microstructures of the modified CNTs were characterized using a Quanta 450 scanning electron microscope (American FEI company, Hillsboro, OR, USA). All samples were sprayed with gold and then placed in a vacuum device. The surface microstructure of the samples was observed using electron microscopy at different multiples. Experimental conditions: acceleration voltage: 0.6~30 kV; electron gun type: tungsten wire. In addition, the contact angles of the modified CNTs were determined using a German KRUSS excellent contact Angle instrument (DSA100, KRUSS company, Hamburg, Germany). The sample powder was placed flat on a slide (0.5 mm thickness) and anhydrous ethanol was dripped on the sample powder to make its distribution more uniform. Then, it was placed in the oven, dried at 50 °C, and placed on the automatic interface tensiometer test platform. Finally, the contact Angle of the sample was measured and photographed using the software-controlled instrument. Test conditions: temperature: normal temperature; image resolution: 1216 × 1216.

2.4. Evaluation of Dispersion Properties of Nanofluids

A total of 0.1 g Tween 80 was added to 99.9 g tap water to get a Tween 80 solution with a concentration of 0.05%. The 0.05 g sample was added into 100 mL Tween 80 solution, and subjected to ultrasound for 10 min to make them more uniform. Then, the potential of the nanofluid was measured using a Zetaprobe Zeta potentiometer (European and American land Science and technology Group, Cambridge, MA, USA). Finally, the nanosize in solution was measured using a BI-200SM wide-angle laser light-scattering instrument (Brooke, Lexington, KY, USA), and the dispersion stability of carbon nanotubes in the dispersant was analyzed. The configured nanofluid was pipetted 500 μL into the cuvette with a pipette gun, and the cuvette was placed into a dynamic light-scattering instrument for analytical measurement. The experimental measurement time was 2 min, the test temperature was 25 °C, and the wavelength was 678 nm.

2.5. Viscosity Reduction Experiment

A 0.05% Tween-80 solution was used as a dispersant to prepare nanofluids of various concentrations (100 ppm, 250 ppm, 500 ppm, 750 ppm, and 1000 ppm). The nanofluids were combined with crude oil at a 5:5 volume ratio in a special measuring cylinder and stirred at 1000 rpm and 65 °C for 1 h to obtain emulsions.
(1)
Conductivity experiment
The emulsion types were determined by measuring the emulsion’s electrical conductivity. A total of 50 mL of the prepared emulsion was placed in a beaker, and the electrode of the DDS-307A conductivity meter (Shanghai Yishan Electrical Scientific Instrument Co., Ltd., Shanghai, China) was placed in the emulsion to test its conductivity. The experimental temperature was normal temperature. When the outer phase of the emulsion was oil, the conductivity was smaller, and when the outer phase of the emulsion was water, the conductivity was greater and easier to achieve.
(2)
Emulsion viscosity
The viscosity of the emulsion was tested using a NJ-5S Brookfield Rotational viscometer (Shenzhen Yongda instrument equipment Co., Ltd., Shenzhen, China), and the viscosity reduction rate was calculated using Formula (1). During viscosity testing, the viscosity value of a liquid was obtained by using the relationship between the shear and resistance generated between the cylindrical rotor and the fluid. The viscometer was equipped with a high-temperature measuring system, through which the temperature was controlled to 65 °C during the whole viscosity testing experiment. The rotor of the viscosimeter was a No. 18 rotor, the shear rate was 7.34 s−1, the emulsion could keep emulsifying during the shear flow process, and the emulsion was very stable. In the viscosity test, each set of data was tested 3 times, and the average value was obtained to reduce the error. All the solutions used are the simulated formation.
η = μ oil μ e μ oil × 100 %
where η is the viscosity reduction, %; μoil is the crude oil viscosity, mPa·s; and μe is the emulsion viscosity, mPa·s.
(3)
Emulsion stabilization experiment
A total of 50 mL of the emulsion was placed in a beaker, and the beaker was placed in a vacuum drying oven (Shanghai Shanzhi Instrument Equipment Co., Ltd., Shanghai, China) for aging at 65 °C. The emulsion was taken out every 10 h and its water yield ratio was calculated according to Formula (2).
ω = V cw V co × 100 %
where ω —the water yield ratio, %; V cw —the volume of water yield in the emulsion, mL; and V co —the total volume of water in the initial emulsion, mL.

2.6. Interfacial Tension Experiment

A 0.05% Tween-80 solution was utilized as a dispersant to prepare nanofluids of varying concentrations (100 ppm, 250 ppm, 500 ppm, 750 ppm, and 1000 ppm). These nanofluids were introduced into sample tubes, and a drop of crude oil (volume: 1–1.5 μL) was added. The interfacial tension was measured using an SDT Rotary interface tensiometer (KRUSS, Hamburg, Germany) at 6000 rpm and 65 °C [35]. All solutions used are the simulated formation. Each group of data was measured three times, and the average value was taken to reduce the error.

2.7. Molecular Dynamics Simulation

This model is used for determining the diffusion coefficient of nanoparticles dispersed in a matrix whose rheological behavior is Newtonian, which is intended to explain phenomena in which both heavy oil and oil-in-water emulsions exhibit non-Newtonian behavior (heavy crude). The simulated oil blend comprises n-heptane and toluene. A periodic cell was constructed by arranging 1000 H2O molecules to represent the water phase and 65 tetradecane-toluene molecules to represent the oil phase. Subsequently, various models of CNTs (5 carbon nanotube molecules) were individually placed within an amorphous cell and inserted at the interface of the water and oil setup. Experimental conditions included an initial cell width and length of 30 Å, utilizing the Forcite module. The forcefield employed was COMPASS, utilizing an NPT ensemble at a temperature of 298.15 K. The total simulation duration was set to 1000 ps with a time step of 1 fs [36].
D = 1 6 N lim t d t = 1 N r t r o 2 d t a 6
where a is the linear slope of the root-mean-square displacement with time.

3. Results and Discussion

3.1. FTIR

FTIR analysis was performed on selected modified samples (NH2-CNT, OH-CNT, COOH-CNT, NH2-CNT-12, COOH-CNT-12, and OH-CNT-12), as shown in Figure 2. The results indicated that before modification, NH2-CNT, OH-CNT, and COOH-CNT displayed broad peaks between 3500 and 3400 cm−1, possibly attributed to -NH2 and -OH groups. The same peaks of all samples occurred at 1600 cm−1 and 1300 cm−1, which were attributed to a strong strain sensitive peak of C-C bond vibration and tensile vibration peaks of noise and lattice defects, respectively. However, compared to NH2-CNT, OH-CNT, and COOH-CNT, NH2-CNT-12, COOH-CNT-12, and OH-CNT-12 exhibited new peaks at 2919 cm−1 and 2848.23 cm−1, arising from -CH3 and -CH2- on the long-chain alkyl. This evidence confirms the successful introduction of long-chain alkyl into the carbon nanotubes.

3.2. SEM

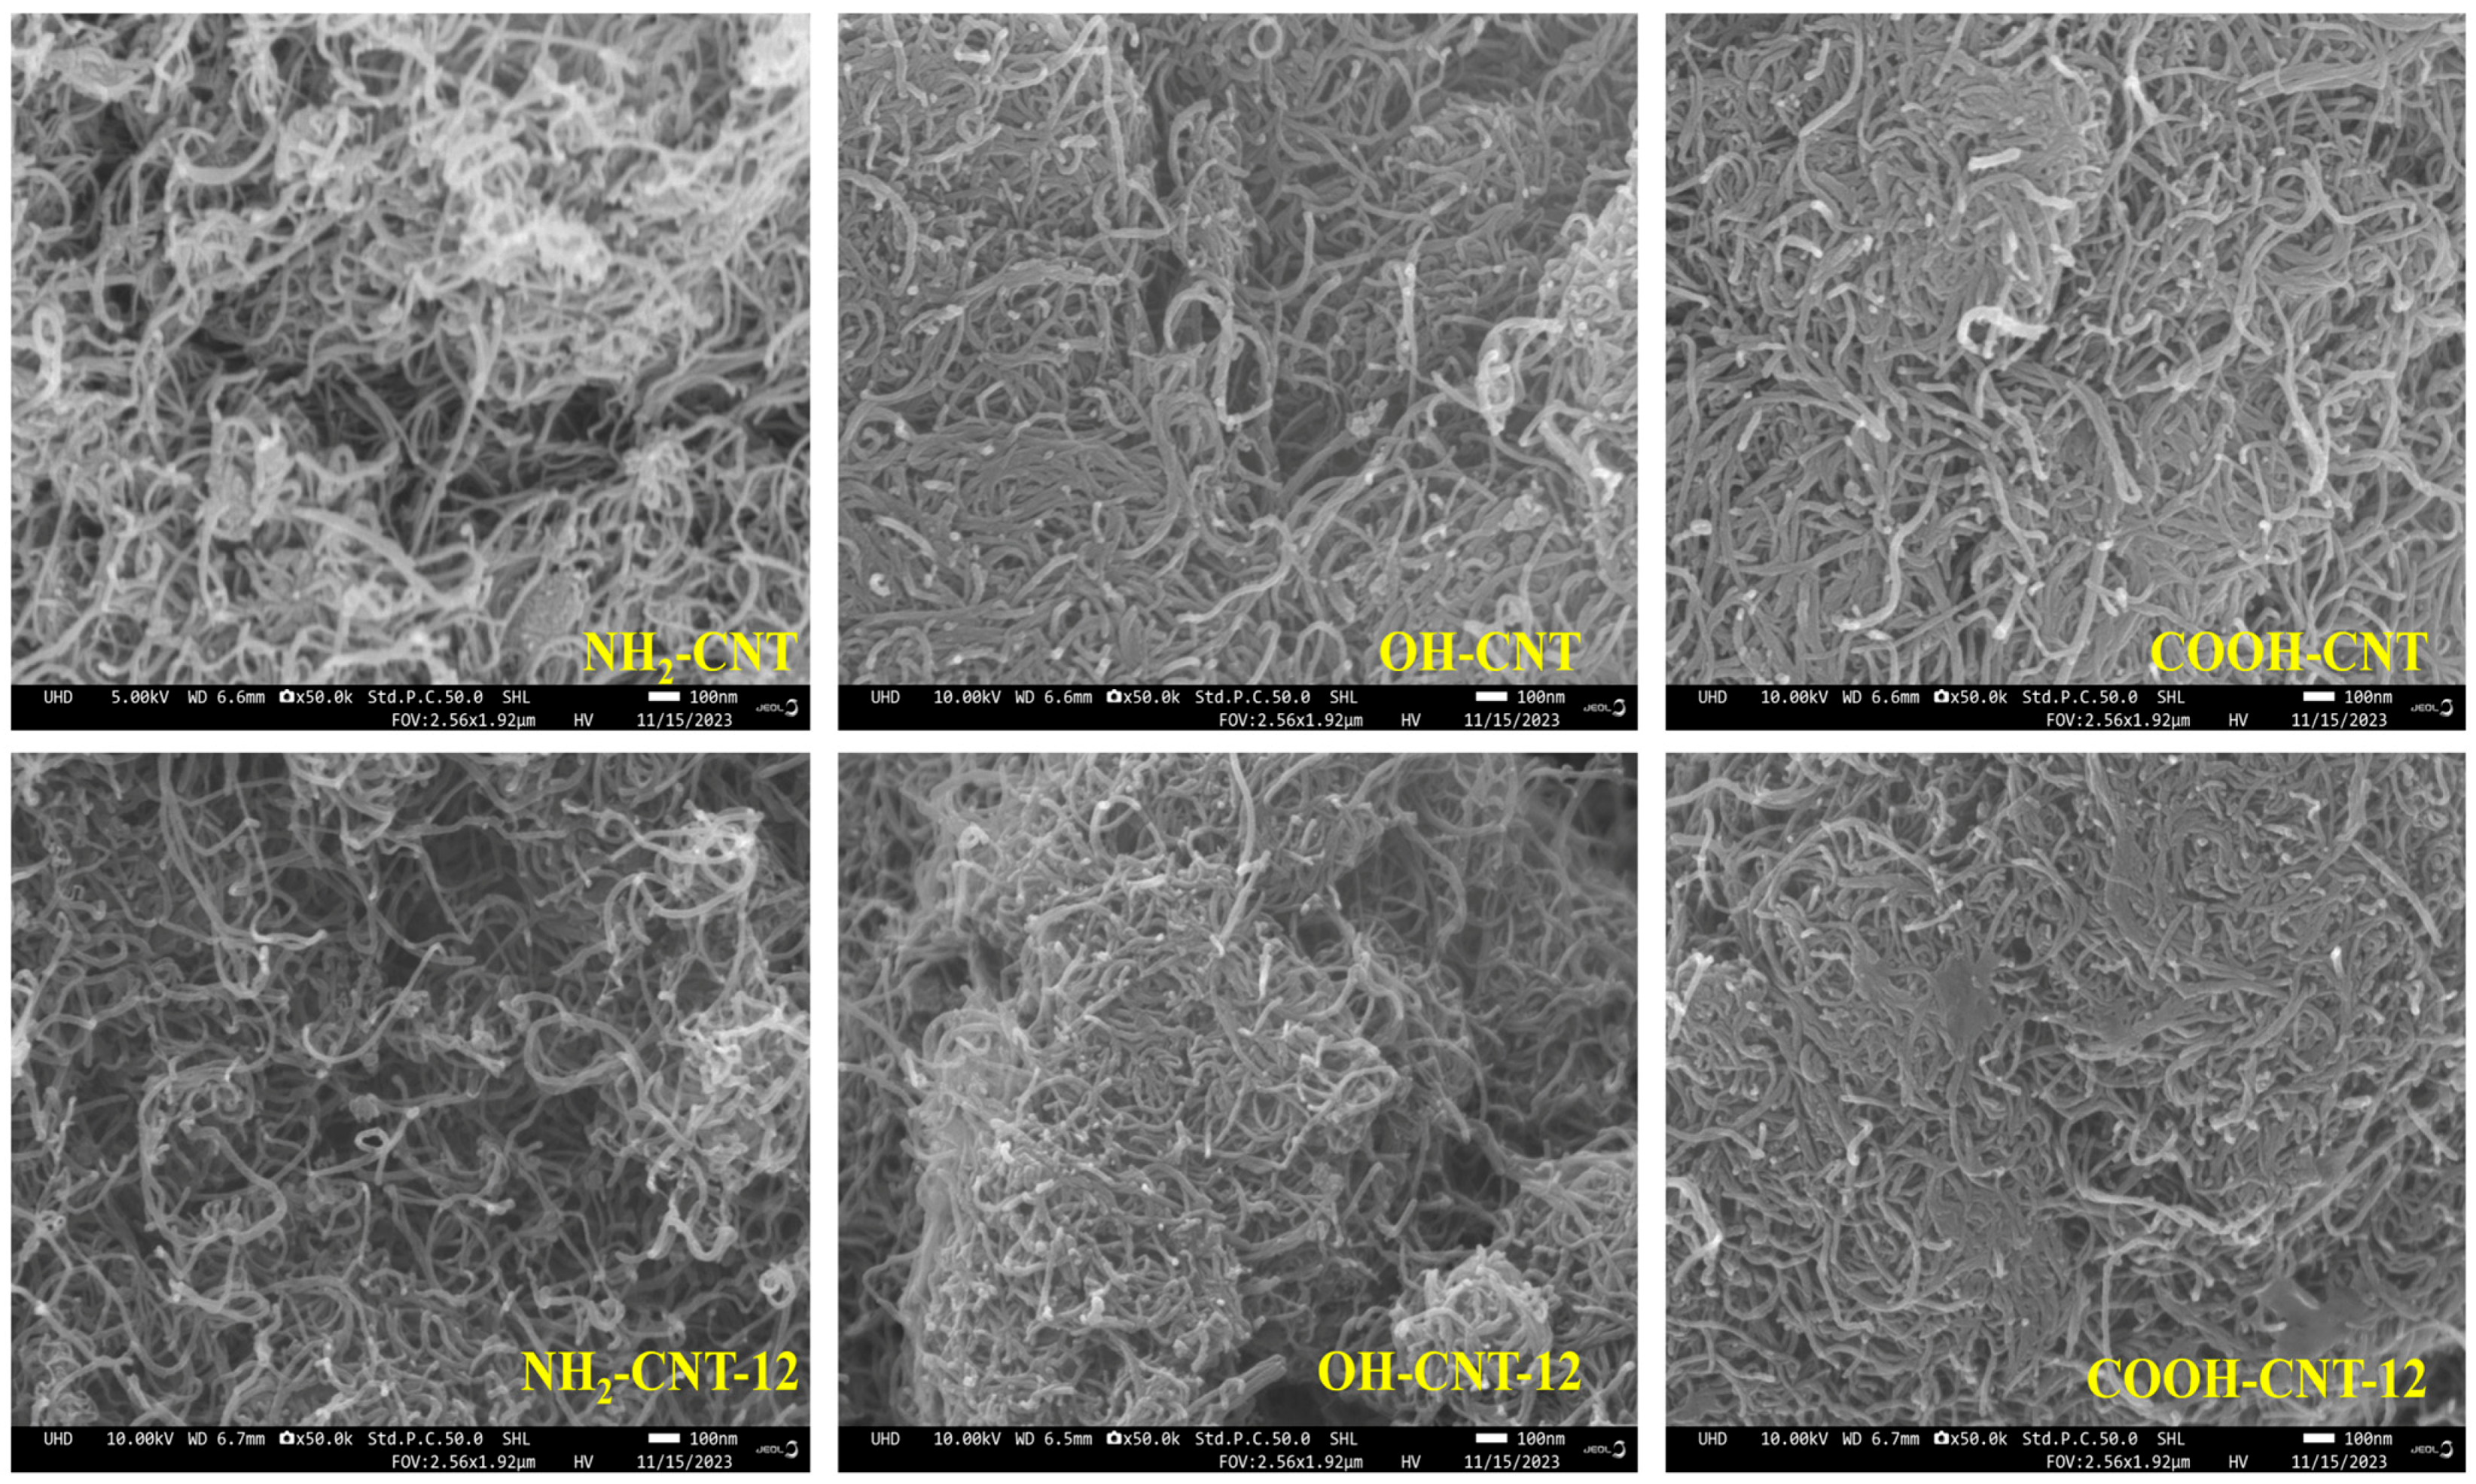
A SEM analysis of selected modified samples (NH2-CNT, OH-CNT, COOH-CNT, NH2-CNT-12, COOH-CNT-12, and OH-CNT-12) was conducted, as depicted in Figure 3. The images showed NH2-CNT as clustered, while OH-CNT and COOH-CNT appeared as aggregations of rod-shaped particles. After introducing the carbon chain, all carbon nanotubes exhibited improved dispersion. Initially, the surface functional groups of carbon nanotubes were hydrophilic, promoting moisture adsorption and subsequent aggregation in the presence of hydrogen bonding. However, post modification, the elongation of the carbon chains increased hydrophobicity, preventing water molecule adsorption and thereby enhancing dispersion.

3.3. Contact Angle

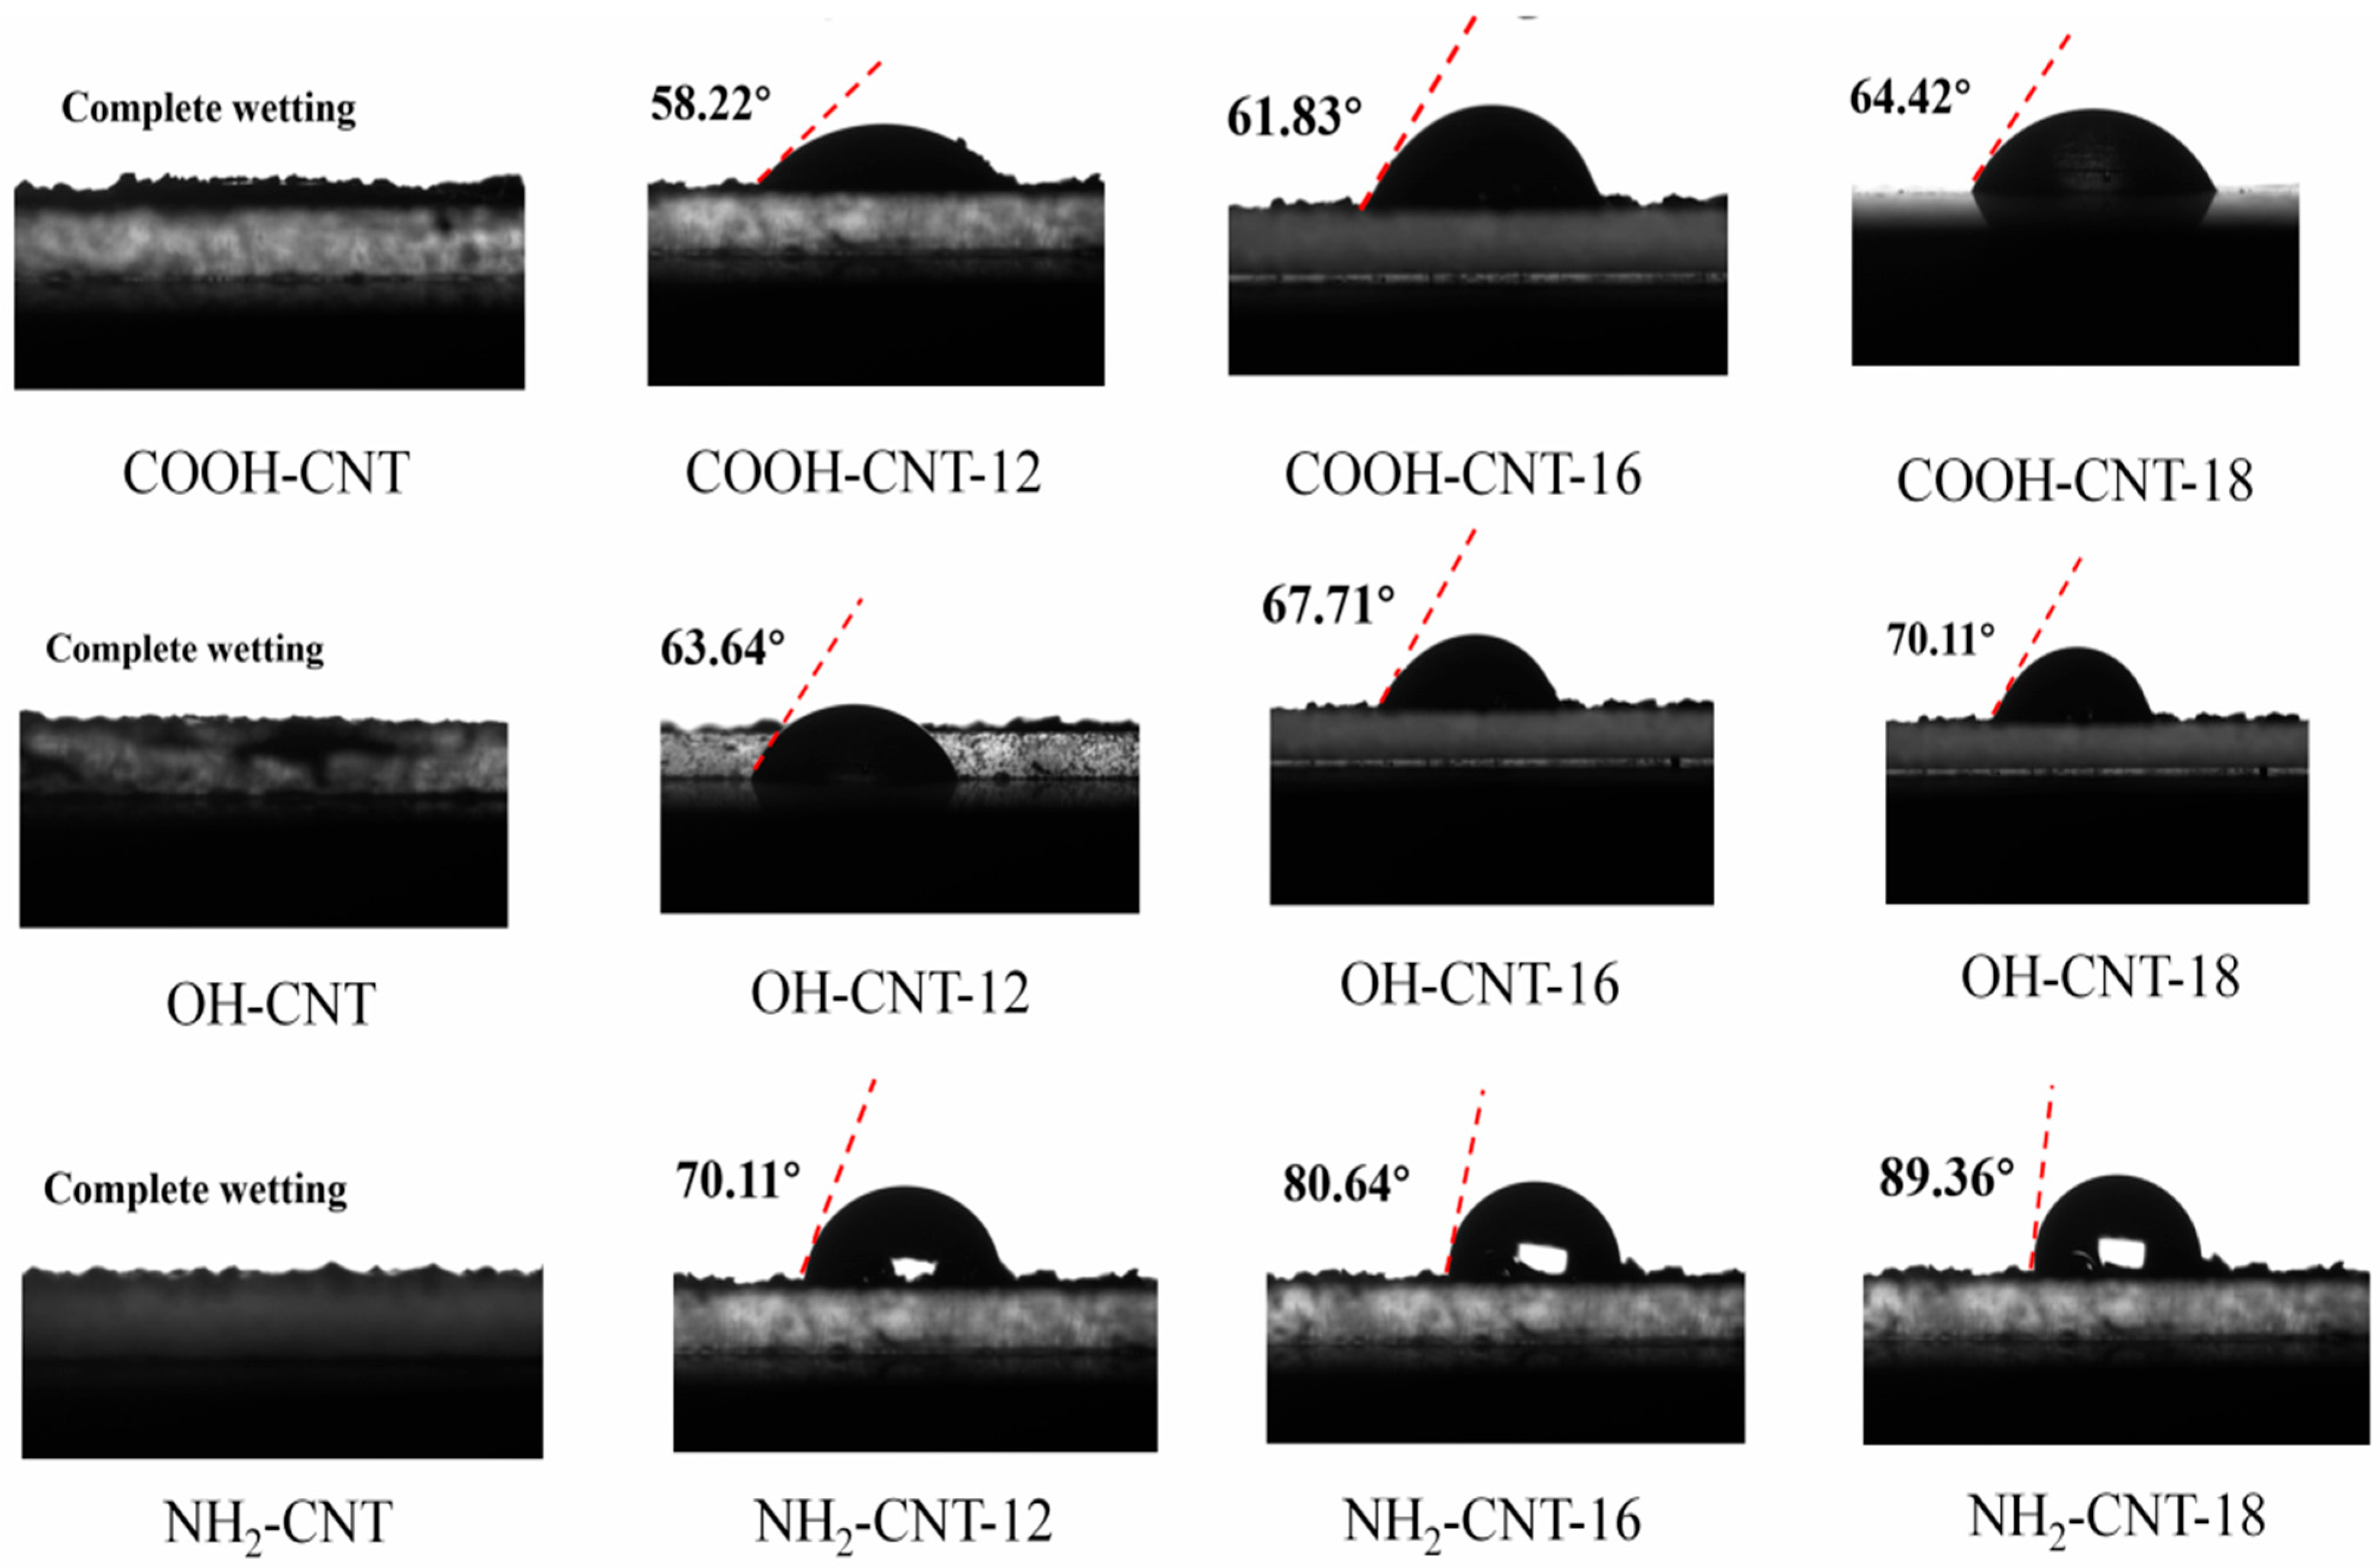
Contact angle measurements were conducted before and after modification for all samples. The results in Figure 4 indicate increased contact angles after modification. Furthermore, under the same carbon chain length, the contact angle sequence for different functional groups was -NH2 > -OH > -COOH, signifying better hydrophilic effects of the carboxyl group. Increasing the carbon chain length under the same functional group conditions led to gradually larger contact angles, indicating increased hydrophobicity. Nevertheless, all nanomaterials exhibited contact angles smaller than 90°, thus classifying them as hydrophilic nanomaterials, tending to form an O/W emulsion.

3.4. Dispersion Properties of Nanofluids

The larger the Zeta potential absolute value, the smaller the dispersed particle size in the nanoparticle solution and the more stable the nanoparticle fluid. The Zeta potential value and nanoparticle particle size of different nanoparticle fluids are shown in Table 2 and Table 3, respectively. It can be seen from the tables that with the increase in carbon chain length, the Zeta potential gradually increased, and the particle size of the nanoparticles gradually decreased, indicating that the nanofluid was becoming more and more stable. This was because there were only active hydrophilic groups on the surface of carbon nanotubes before modification, and there was intermolecular force with hydrophilic groups on Tween 80 molecules in solution, so it was easy to adsorb and agglomerate. When the lipophilic group was introduced on the surface of the carbon nanotubes, the two ends of the carbon nanotubes were attracted by the Tween 80 molecule, which made the nanoparticles balanced by force and evenly dispersed in the aqueous solution. In addition, compared with the same carbon chain, the dispersing and stabilizing ability of nanoparticles by different groups was COOH > OH > NH2, which may be related to the hydrophilic properties of different groups.

3.5. Viscosity Reduction Experiment

3.5.1. Emulsion Type

Electrical conductivity tests were performed on emulsions prepared using nanofluids (500 ppm Tween-80 + 500 ppm carbon nanotubes) with crude oil as the subject of study. The results are shown in Table 4. It was observed that the electrical conductivity of the three crude oils was identical at 0.01 μs/cm due to their non-conductive nature. The water exhibited an electrical conductivity of 2234 μs/cm. However, the electrical conductivity of all emulsions formed by nanofluids and crude oil exceeded 1000 μs/cm, far surpassing the conductivity of crude oil. This observation indicated that the emulsion’s external phase was water, and the internal phase was oil, classifying them as O/W emulsions, hence their conductivity. Additionally, under the same carbon chain conditions, the sequence of conductivity for different functional groups was -NH2 < OH < COOH, possibly associated with their hydrophilicity. Moreover, as the carbon chain length increased, the conductivity gradually decreased.

3.5.2. Emulsion Viscosity

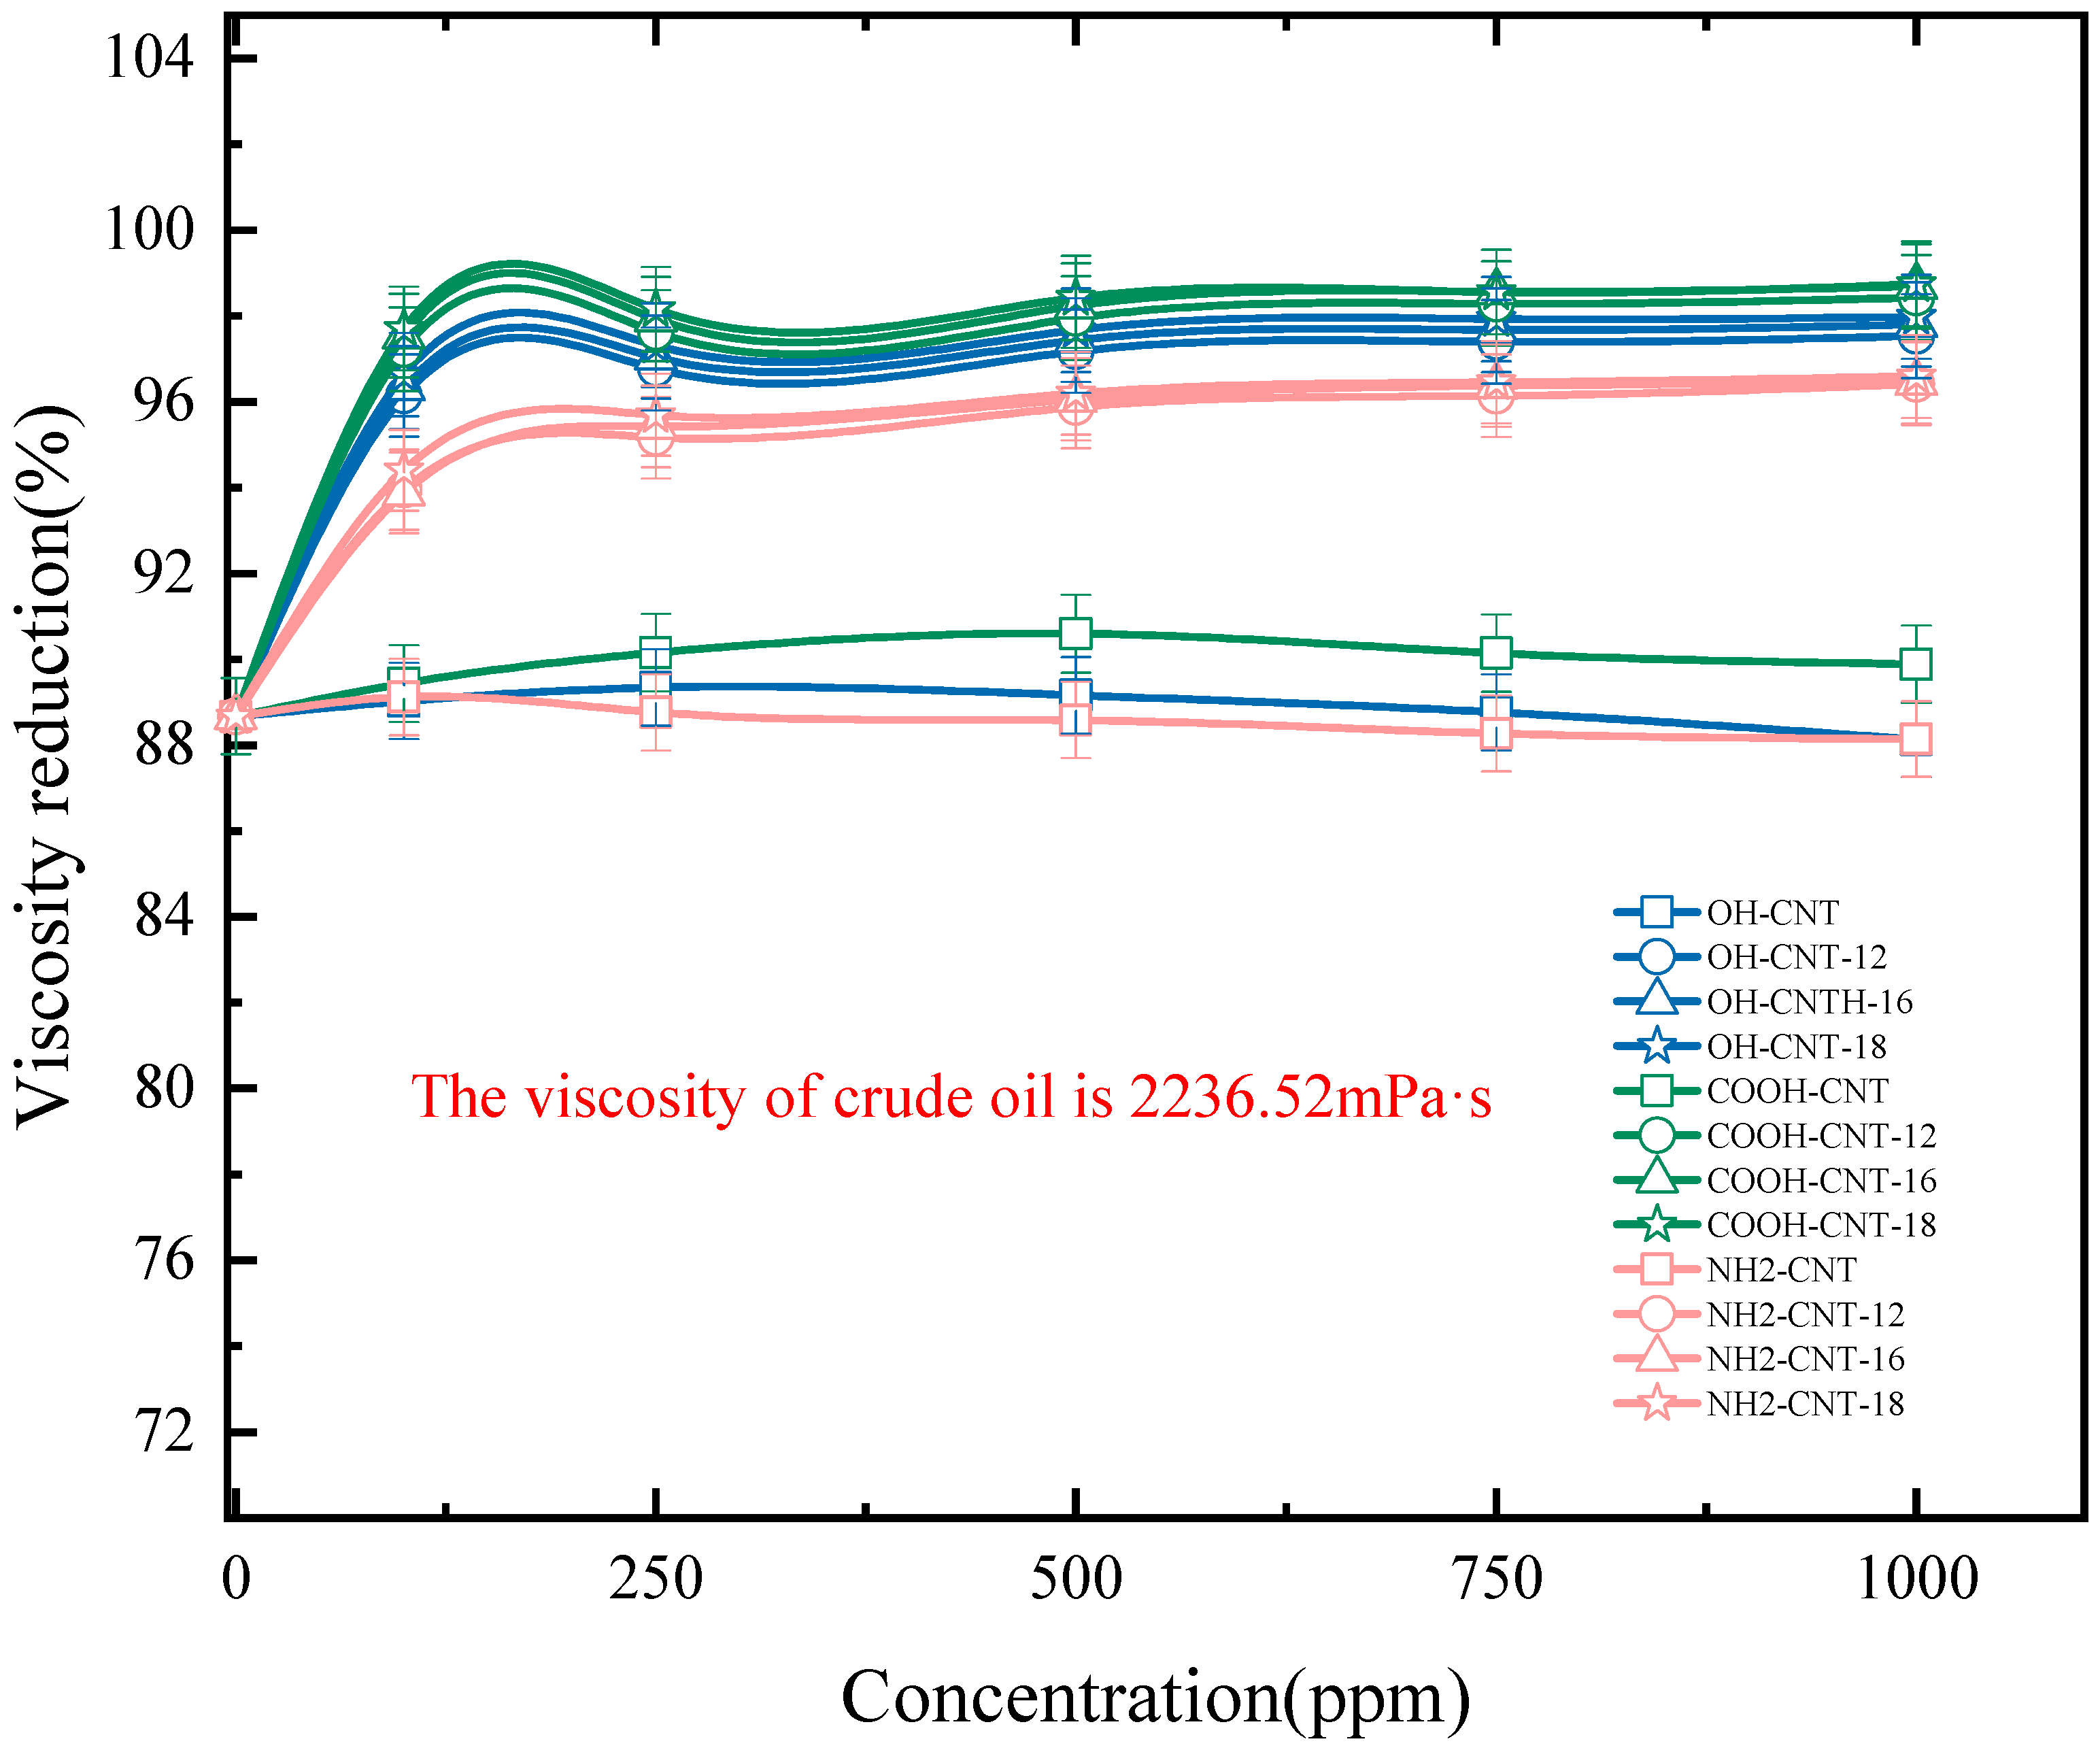
Different concentrations of nanofluids were prepared to observe the viscosity reduction after emulsification with crude oil. The results are depicted in Figure 5. Without the addition of nanoparticles, the viscosity reduction rate of the Tween 80 solution was 88.67%. As the concentration of nanoparticles increased, the viscosity reduction rate of carbon nanotube fluids without carbon chains (NH2-CNT, OH-CNT, and COOH-CNT) remained almost unchanged, closely resembling the viscosity reduction rate without added nanoparticles. The result suggested that carbon nanotubes lacking carbon chains essentially exhibit no viscosity reduction effect. However, carbon nanotube fluids containing carbon chains exhibited an increasing viscosity reduction rate with higher nanoparticle concentrations. This was primarily due to the modified carbon nanotubes containing hydrophilic groups (-OH, -NH2, and -COOH) and hydrophobic groups (long-chain alkyl hydrocarbons). These modified nanoparticles can adsorb at the oil–water interface, facilitating the emulsification of crude oil with Tween 80 solution to form O/W emulsions. Consequently, this process reduces the viscosity of crude oil. On the other hand, the unmodified nanoparticles, which possess only hydrophilic groups, tend to aggregate and adsorb in water and cannot attach to the oil–water interface, resulting in poorer performance. Furthermore, upon comparison, it was noted that for the same carbon chain length, the sequence of viscosity reduction rates for different groups is -NH2 < OH < COOH. Under identical group conditions, the viscosity reduction rate gradually increases with increasing carbon chain length. This phenomenon might be associated with the adsorption characteristics of nanoparticles at the oil–water interface.

3.5.3. Emulsion Stability

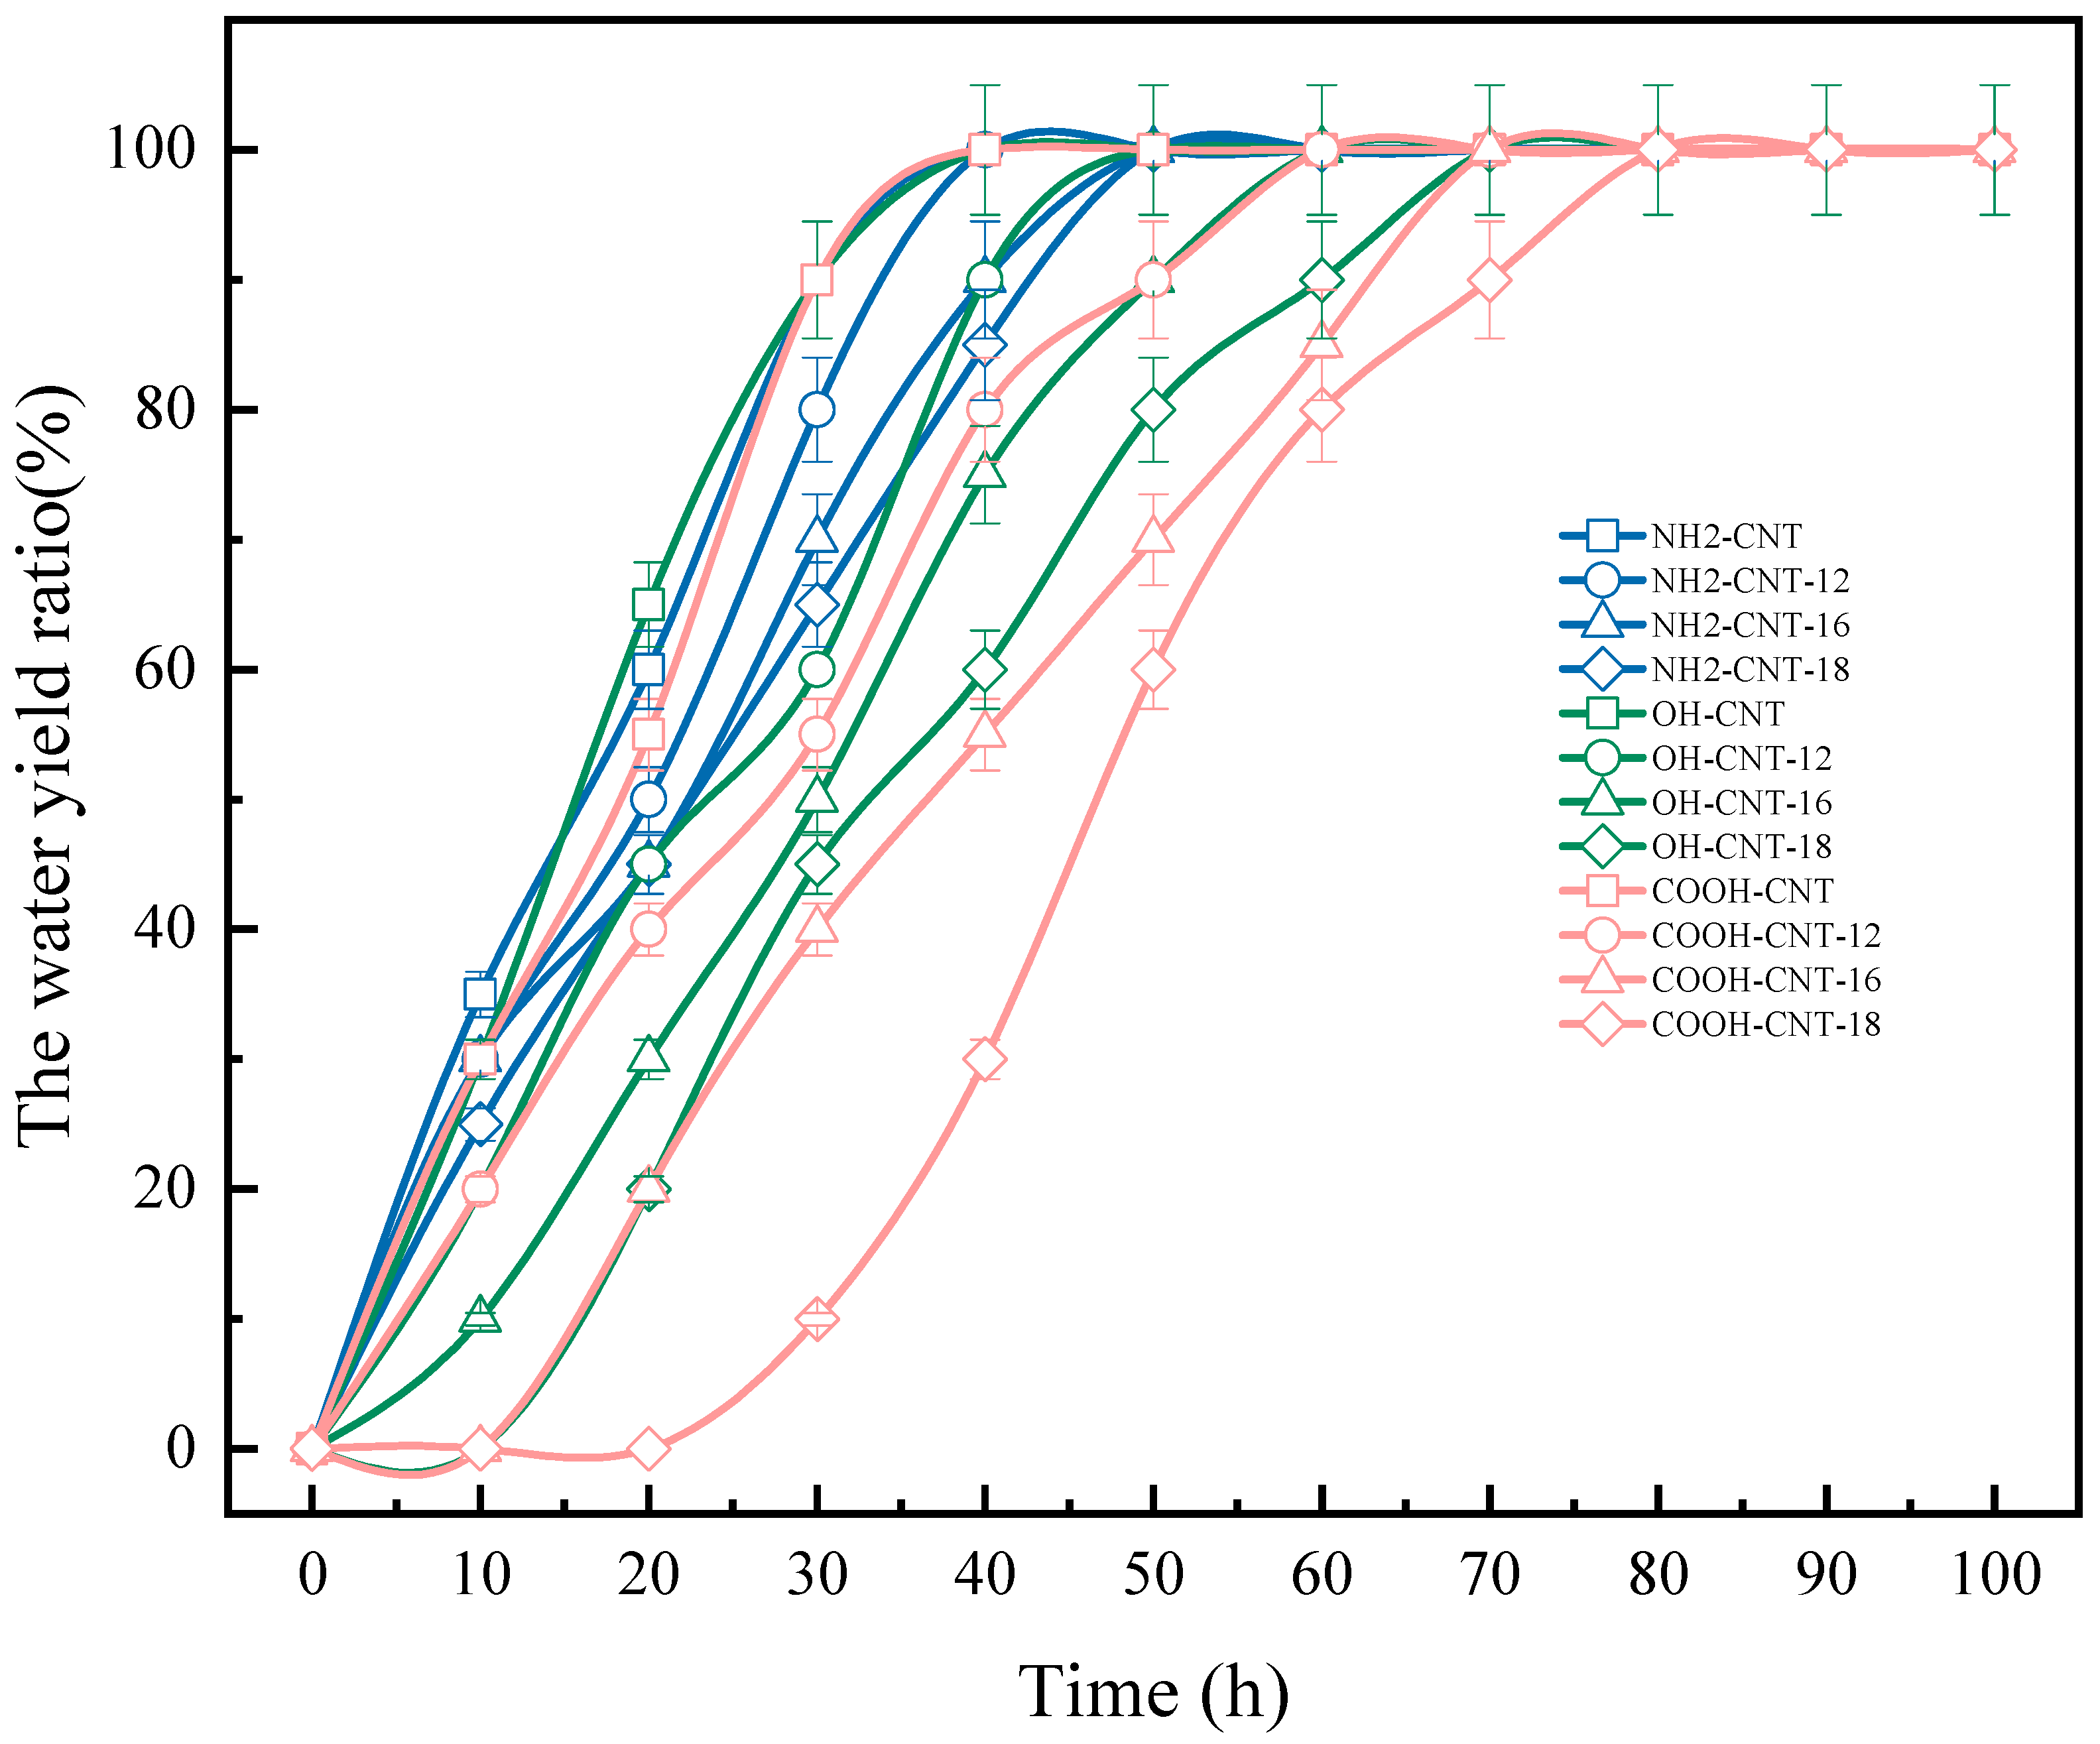
Different concentrations of nanofluids were prepared to observe the viscosity reduction after emulsification with crude oil. The results are depicted in Figure 5. The water yield ratios of all emulsions were tested, and the results are shown in Figure 6. It can be seen from the figure that under the same group, as the carbon chain length increases, the water yield ratio gradually increases, and the emulsion becomes more stable. This may be because the longer the carbon chain, the more adsorbed at the oil–water interface, the more stable the interface, and therefore the more stable the emulsion. Under the same carbon chain, the water evolution rate of COOH-CNT was the largest, and the water evolution rate of NH2-CNT was the smallest. This is due to the fact that COOH-CNT has the best dispersibility and is more orderly and dense at the emulsion interface, while NH2-CNT is easy to agglomerate and loosely arranged at the oil–water interface. Therefore, emulsions containing COOH-CNT are more stable.

3.6. Interfacial Tension Experiment

The interfacial tension between different nanofluids and crude oil is depicted in Figure 7. The graph shows that the interfacial tension between crude oil and water is 26.38 mN/m, whereas, after the introduction of nanofluids, the interfacial tension decreases significantly by 20 times. In the absence of carbon nanotubes, the interfacial tension between the Tween 80 solution and crude oil is 1.067 mN/m. Upon introducing carbon nanotubes without carbon chains (NH2-CNT, OH-CNT, and COOH-CNT), the interfacial tension rises with an increase in nanoparticle concentration. However, with carbon chain-containing carbon nanotubes, the interfacial tension decreases as the nanoparticle concentration rises. This is primarily due to surfactant molecules containing hydrophilic and hydrophobic groups. These molecules generate an attractive force at the oil–water interface, reducing the interfacial tension between oil and water (Figure 8). Conversely, when carbon nanotubes solely possess hydrophilic groups, they aggregate in water, impeding the movement of surfactants towards the oil–water interface. Consequently, the quantity of surfactant molecules at the interface reduces, increasing interfacial tension. However, modified carbon nanotubes with both hydrophilic and hydrophobic groups can adsorb onto the oil–water interface, synergistically interacting with surfactants to reduce the interfacial tension between oil and water, resulting in lower interfacial tension. Additionally, the interfacial tension gradually decreases under the same functional group as the carbon chain length increases. The interfacial tension order among different groups for the same carbon chain length is -COOH < -OH < -NH2.

3.7. Molecular Dynamics Simulation

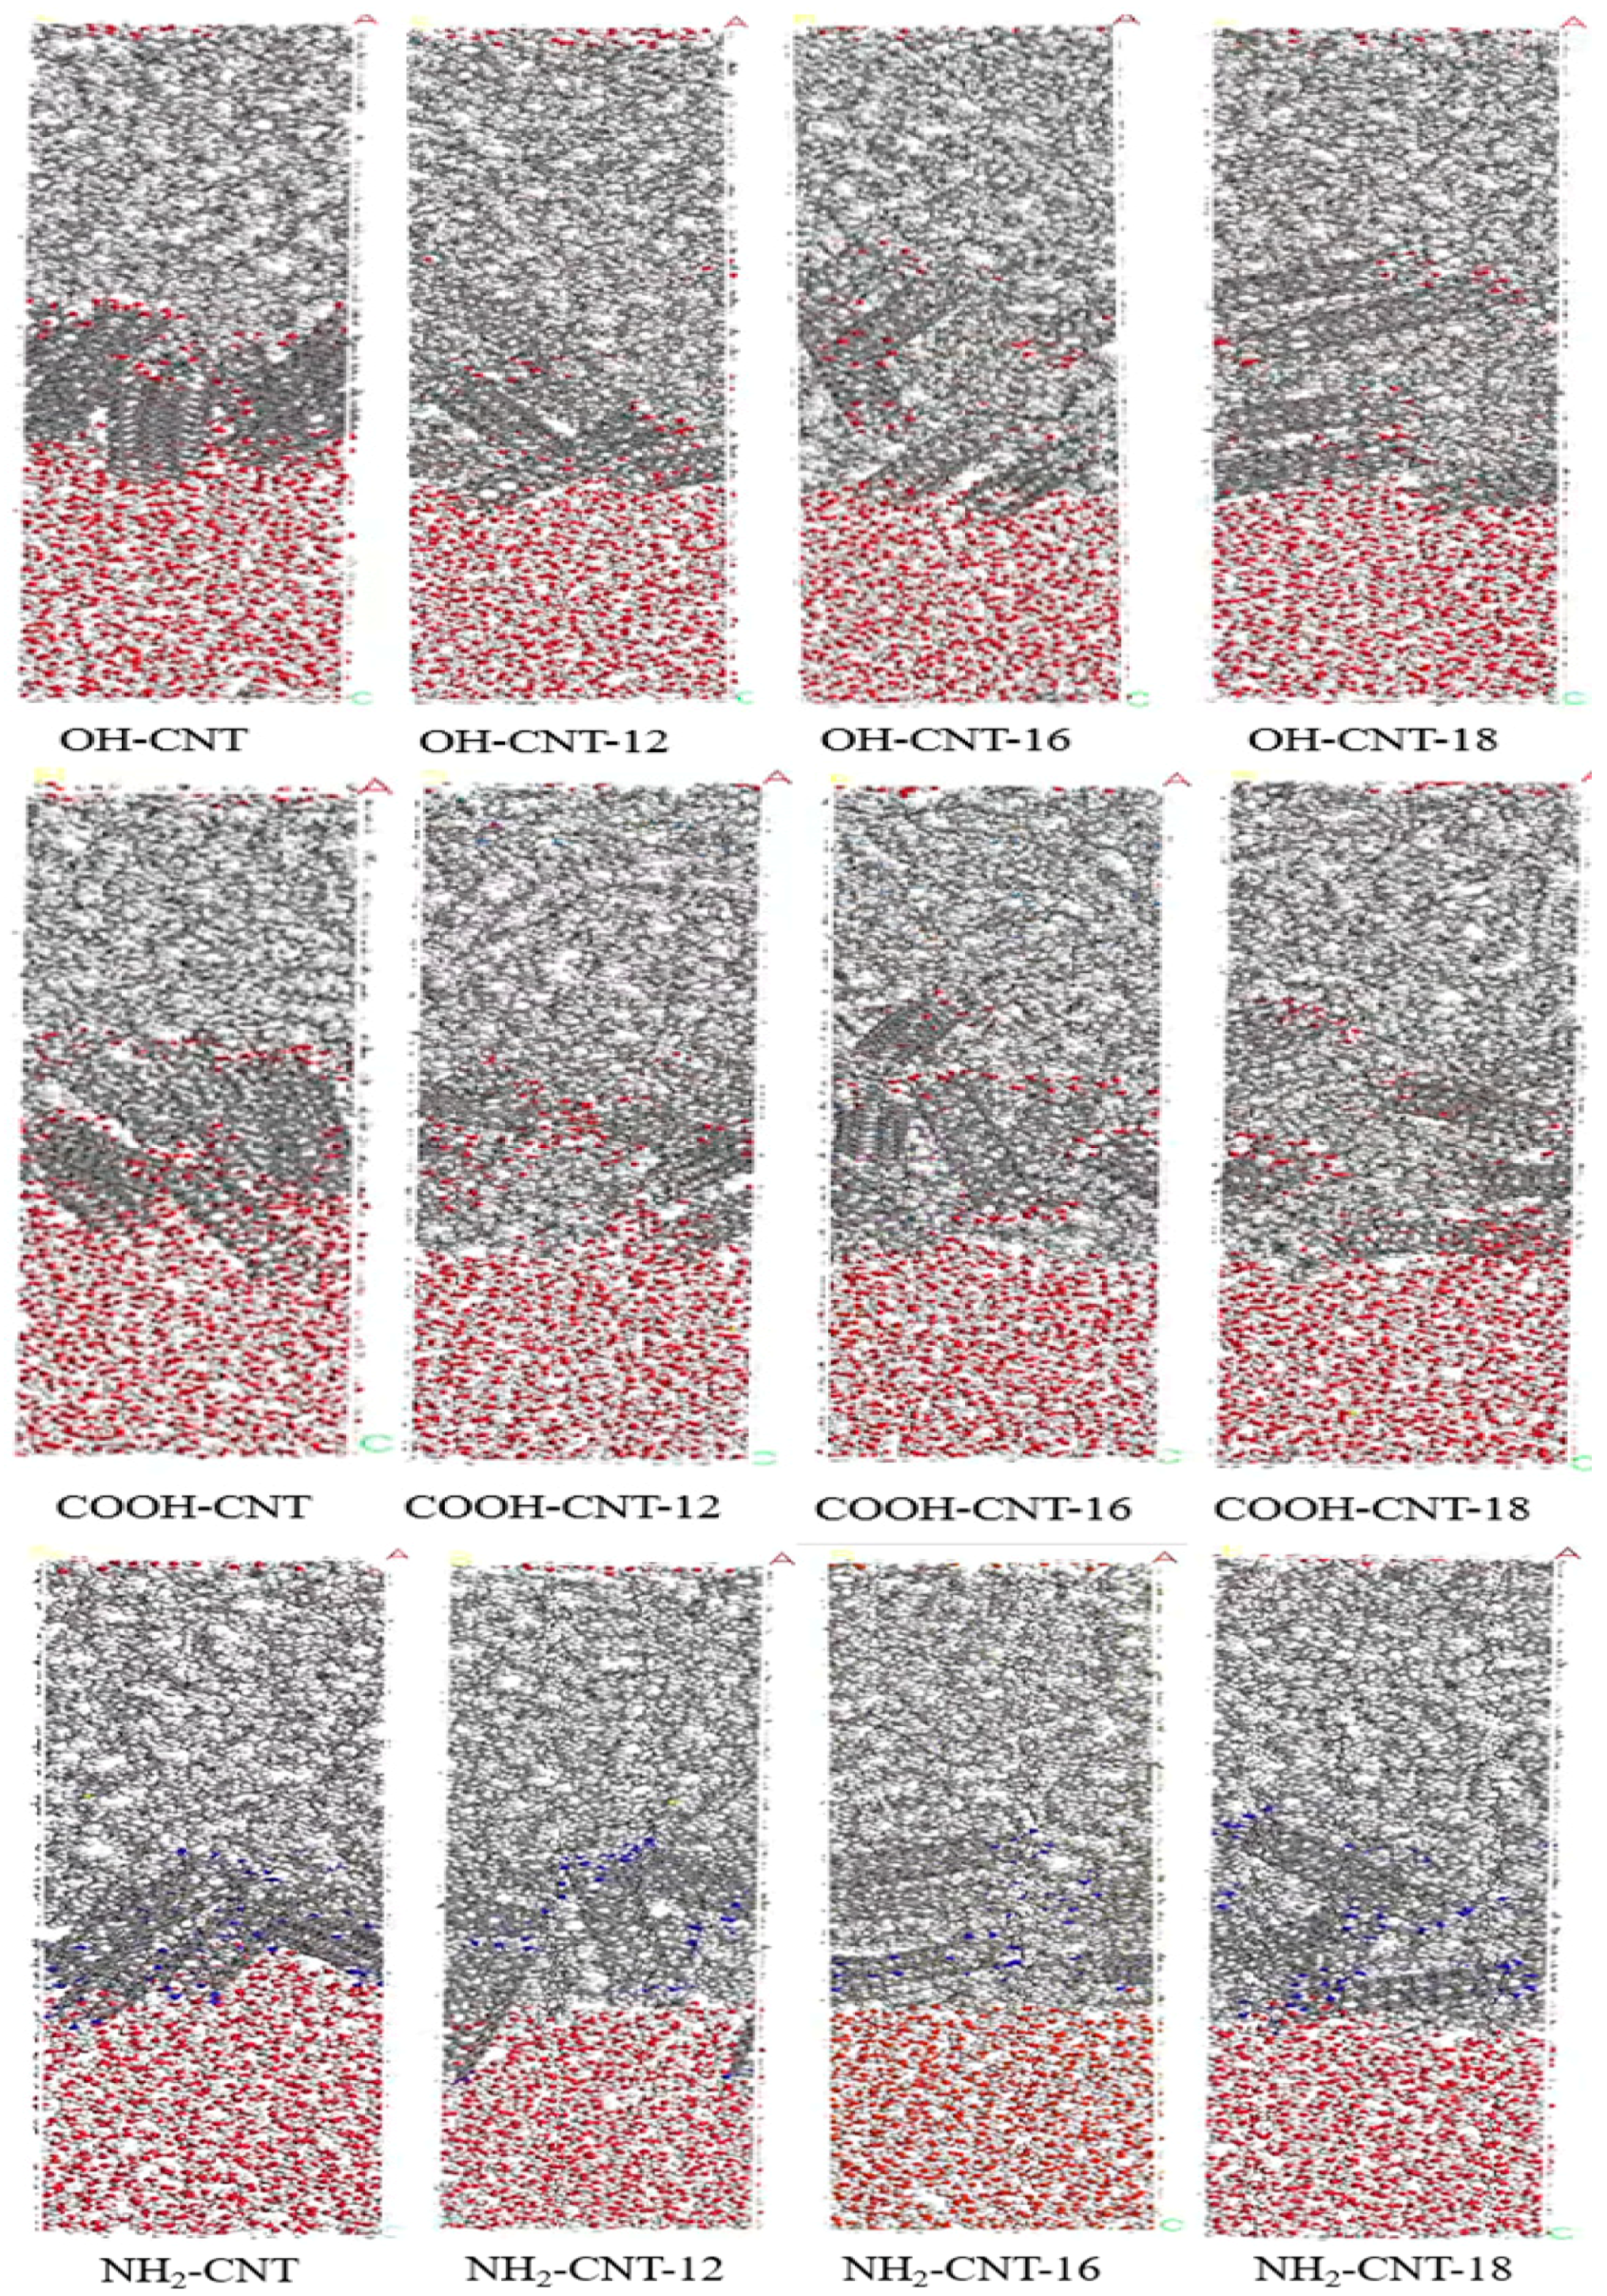
Models of carbon nanotubes with various structural compositions were established using Version 8.0 MS software (see Figure 9), and their diffusion adsorption behaviors at the oil–water interface were studied through molecular dynamics simulation. The molecular morphologies after simulation are depicted in Figure 10. The simulated carbon nanotubes can be observed diffusing towards both sides of the oil–water interface. With an increase in carbon chain length, the diffusion range of carbon nanotubes expands. The MSD diffusion coefficients of carbon nanotubes at the oil–water interface calculated from the simulation graph are presented in Table 5. It was observed that under the same functional group, the diffusion coefficient gradually decreases with an increase in carbon chain length, indicating better adsorption at the oil–water interface. Moreover, the diffusion coefficient order among different groups is -NH2 < -OH < -COOH for the same carbon chain length. Thus, carbon nanotubes containing -NH2 exhibit better adsorption at the oil–water interface.

4. Conclusions

This study synthesized carbon nanotubes (NH2-CNT, OH-CNT, and COOH-CNT) with different functional groups and carbon chain lengths. An SEM analysis revealed an improved dispersion of carbon nanotubes with added carbon chains. Contact angle experiments confirmed the superior hydrophilic effect of COOH. Through conductivity experiments, viscosity reduction tests, interfacial tension experiments, and molecular dynamics simulations, it was found that under the same carbon chain length, the dispersing and stabilizing ability of nanoparticles by different groups was COOH > OH > NH2; the conductivity order among different groups was -NH2 < -OH < -COOH; the viscosity reduction order for different groups was -NH2 < -OH < -COOH; the interfacial tension reduction order for different groups was -COOH < -OH < -NH2; and the diffusion coefficient order for different groups was -NH2 < -OH < -COOH. Furthermore, as the carbon chain length increased, the conductivity, interfacial tension, and diffusion coefficient decreased, and the viscosity reduction and the dispersing and stabilizing ability increased, signifying better adsorption at the oil–water interface.

Author Contributions

Conceptualization, Z.H. and J.Z.; methodology, Y.Z.; software, Y.Z.; validation, Y.Z., Q.C. and W.P.; formal analysis, Q.C.; investigation, Q.C. and B.H.; resources, Q.C.; data curation, Q.C.; writing—original draft preparation, Z.H. and J.Z.; writing—review and editing, Q.C. and B.H.; visualization, Z.H.; supervision, Z.H.; project administration, Z.H.; funding acquisition, Q.C. All authors have read and agreed to the published version of the manuscript.

Funding

The authors would like to acknowledge the open fund project from State Key Lab of Offshore Oil & Gas Exploitation in China (grant no. CCL2023RCPS0163RQN) for providing financial support.

Data Availability Statement

The data that support the findings of this study are available from the corresponding author, upon reasonable request.

Conflicts of Interest

Author Zhao Hua, Jian Zhang, Yuejun Zhu, Bo Huang were employed by the company CNOOC Research Institute Co., Ltd. The remaining authors declare that the research was conducted in the absence of any commercial or financial relationships that could be construed as a potential conflict of interest.

References

  1. Kapustin, N.O.; Grushevenko, D.A. Global prospects of unconventional oil in the turbulent market: A long term outlook to 2040. Oil Gas Sci. Technol. 2018, 73, 67. [Google Scholar] [CrossRef]
  2. Zou, C.; Yang, Z.; Zhu, R.; Zhang, G.; Hou, L.; Wu, S.; Tao, S.; Yuan, X.; Dong, D.; Wang, Y. Progress in China’s Unconventional Oil & Gas Exploration and Development and Theoretical Technologies. Acta Geol. Sin.-Engl. Ed. 2015, 89, 938–971. [Google Scholar]
  3. Xue, L.; Liu, P.; Zhang, Y. Development and Research Status of Heavy Oil Enhanced Oil Recovery. Geofluids 2022, 2022, 5015045. [Google Scholar] [CrossRef]
  4. Fakher, S.; Ahdaya, M.; Elturki, M.; Imqam, A. Critical review of asphaltene properties and factors impacting its stability in crude oil. J. Pet. Explor. Prod. Technol. 2020, 10, 1183–1200. [Google Scholar] [CrossRef]
  5. He, X.; Liu, H.; Liu, X.; Jiang, W.; Zheng, W.; Zhang, H.; Lv, K.; Chen, H. Experimental study and numerical simulation of heavy oil viscosity reduction device based on jet cavitation. Pet. Sci. Technol. 2023, 1–23. [Google Scholar] [CrossRef]
  6. Pu, W.; He, M.; Yang, X.; Liu, R.; Shen, C. Experimental study on the key influencing factors of phase inversion and stability of heavy oil emulsion: Asphaltene, resin and petroleum acid. Fuel 2022, 311, 122631. [Google Scholar] [CrossRef]
  7. He, M.; Pu, W.; Yang, X. Experimental study on the effect of high water cut on the emulsifying properties of crude oil. Colloids Surf. A Physicochem. Eng. Asp. 2023, 674, 131917. [Google Scholar] [CrossRef]
  8. He, M.; Pu, W.; Yang, X.; Liu, R. Predicting the emulsion phase inversion point during self-emulsification using an improved free energy model and determining the model applicability. J. Mol. Liq. 2023, 369, 120869. [Google Scholar] [CrossRef]
  9. Xu, J.; Xue, S.; Zhang, J.; Han, Y.; Xia, S. Molecular Design of the Amphiphilic Polymer as a Viscosity Reducer for Heavy Crude Oil: From Mesoscopic to Atomic Scale. Energy Fuels 2021, 35, 1152–1164. [Google Scholar] [CrossRef]
  10. Kumar, R.; Bora, G.S.; Banerjee, S.; Mandal, A.; Naiya, T.K. Application of naturally extracted surfactant from Madhuca longifolia to improve the flow properties of heavy crude oil through horizontal pipeline. J. Pet. Sci. Eng. 2018, 168, 178–189. [Google Scholar] [CrossRef]
  11. Li, N.; Ma, H.; Wang, T.; Sun, C.; Xia, S. Effect of molecular weight on the properties of water-soluble terpolymers for heavy oil viscosity reduction. J. Taiwan Inst. Chem. Eng. 2023, 144, 104738. [Google Scholar] [CrossRef]
  12. Bao, L.; Wang, H.; Wu, Y.; Li, X.; Qiao, W. Synthesis of a Series of Anionic Surfactants Derived from NP and their Properties as Emulsifiers for Reducing Viscosity of Highly Viscous Oil via Formation of O/W Emulsions. J. Surfactants Deterg. 2016, 19, 979–987. [Google Scholar] [CrossRef]
  13. Wang, S.; Tian, Z.; Du, Y.; Ma, J.; Guo, S.; Zhao, M.; Zhu, J.; Li, X.; Sun, K. Studies on reducing viscosity of extra-heavy crude oil through O/W emulsion formation with alkylphenoxypolyoxyethylenepolyoxypropylene. Oilfield Chem. 2003, 20, 7–9, 42. [Google Scholar]
  14. Chen, Q.; Liu, Y.; Hou, J.; Li, X.; Wei, B.; Du, Q. Phase Transition Characteristics of Heavy Oil-Viscosity Reducer-Water Emulsion Systems. J. Mol. Liq. 2023, 397, 121638. [Google Scholar] [CrossRef]
  15. Chen, M.; Wang, Y.; Chen, W.; Ding, M.; Zhang, Z.; Zhang, C.; Cui, S. Synthesis and evaluation of multi-aromatic ring copolymer as viscosity reducer for enhancing heavy oil recovery. Chem. Eng. J. 2023, 472, 144220. [Google Scholar] [CrossRef]
  16. Zhai, M.; Zhou, K.; Sun, Z.; Du, Q.; Wei, Y.; Hou, J. Study on the matching relationship between dispersed droplet size in O/W emulsion and reservoir permeability. Int. J. Multiph. Flow 2022, 150, 104025. [Google Scholar] [CrossRef]
  17. Liu, J.; Zhong, L.; Ren, L.; Hao, T.; Wang, C.; Liu, Y.; Jiang, Y.; Zhou, Y. Laboratory Evaluation of Fluidity of Heavy Oil Emulsions in Formation Pores Medium. ACS Omega 2021, 6, 623–632. [Google Scholar] [CrossRef]
  18. Feng, S.; Jiang, Z.; Tang, S.; Hu, R.; Jin, L.; Wang, S.; Wang, R. Synthesis, interfacial activity and rheological properties of low interfacial tension viscoelastic Gemini surfactants. J. Pet. Sci. Eng. 2022, 209, 109845. [Google Scholar] [CrossRef]
  19. Zhang, F.; Zhang, Q.; Zhou, Z.; Sun, L.; Zhou, Y. Study on the Effect of Different Viscosity Reducers on Viscosity Reduction and Emulsification with Daqing Crude Oil. Molecules 2023, 28, 1399. [Google Scholar] [CrossRef]
  20. Wang, Y.; Li, M.; Hou, J.; Zhang, L.; Jiang, C. Design, synthesis and properties evaluation of emulsified viscosity reducers with temperature tolerance and salt resistance for heavy oil. J. Mol. Liq. 2022, 356, 118977. [Google Scholar] [CrossRef]
  21. Ribeiro, A.; Manrique, Y.A.; Ferreira, I.C.F.R.; Barreiro, M.F.; Lopes, J.C.B.; Dias, M.M. Nanohydroxyapatite (n-HAp) as a pickering stabilizer in oil-in-water (O/W) emulsions: A stability study. J. Dispers. Sci. Technol. 2022, 43, 814–826. [Google Scholar] [CrossRef]
  22. Jiang, Y.; Wang, C.; Zhang, F.; Qi, Z.; Liu, G.; Zhao, J.; Zhou, Y.; Wang, B.; Lian, G.; Liu, P. Microscopic Visualization Experimental Study on the Effect and Mechanism of Viscosity Reducer on Emulsification of Heavy Oil. Energies 2023, 16, 2538. [Google Scholar] [CrossRef]
  23. Liu, J.; Zhong, L.; Yuan, X.; Liu, Y.; Zou, J.; Wang, Q.; Zhang, W.; Zhang, H. Study on the Re-emulsification Process of Water in Heavy Oil Emulsion with Addition of Water-Soluble Viscosity Reducer Solution. Energy Fuels 2019, 33, 10852–10860. [Google Scholar] [CrossRef]
  24. Sun, X.; Ge, J. Synergism between lipophilic surfactant and lipophilic SiO2 nanoparticles enhances self-emulsification performance. J. Pet. Sci. Eng. 2022, 216, 110760. [Google Scholar] [CrossRef]
  25. Gou, R.; Pu, W.; Liu, R.; Chen, Y.; Zhang, T.; Lin, X. A novel hybrid hyperbranched nanowire CNTs for enhancing oil recovery through increasing viscoelasticity and high-viscous emulsions to compensate reservoir heterogeneity. Colloids Surf. A Physicochem. Eng. Asp. 2022, 654, 130118. [Google Scholar] [CrossRef]
  26. Maurya, N.K.; Mandal, A. Investigation of synergistic effect of nanoparticle and surfactant in macro emulsion based EOR application in oil reservoirs. Chem. Eng. Res. Des. 2018, 132, 370–384. [Google Scholar] [CrossRef]
  27. Hassan, Y.M.; Guan, B.H.; Chuan, L.K.; Halilu, A.; Adil, M.; Adam, A.A.; Abdulkadir, B.A. Interfacial tension and wettability of hybridized ZnOFe2O3/SiO2 based nanofluid under electromagnetic field inducement. J. Pet. Sci. Eng. 2022, 211, 110184. [Google Scholar] [CrossRef]
  28. Tian, K.; Pu, W.; Wang, Q.; Li, S.; Liu, S.; Xie, M.; Wang, Y. Effect of Amphiphilic CaCO3 Nanoparticles on the Plant Surfactant Saponin Solution on the Oil–Water Interface: A Feasibility Research of Enhanced Oil Recovery. Energy Fuels 2023, 37, 12854–12864. [Google Scholar] [CrossRef]
  29. Joshi, D.; Maurya, N.K.; Kumar, N.; Mandal, A. Experimental investigation of silica nanoparticle assisted Surfactant and polymer systems for enhanced oil recovery. J. Pet. Sci. Eng. 2022, 216, 110791. [Google Scholar] [CrossRef]
  30. Pillai, P.; Saw, R.K.; Singh, R.; Padmanabhan, E.; Mandal, A. Effect of synthesized lysine-grafted silica nanoparticle on surfactant stabilized O/W emulsion stability: Application in enhanced oil recovery. J. Pet. Sci. Eng. 2019, 177, 861–871. [Google Scholar] [CrossRef]
  31. Peng, B.; Zhang, L.; Luo, J.; Wang, P.; Ding, B.; Zeng, M.; Cheng, Z. A review of nanomaterials for nanofluid enhanced oil recovery. RSC Adv. 2017, 7, 32246–32254. [Google Scholar] [CrossRef]
  32. Yue, L.; Pu, W.; Zhao, T.; Zhuang, J.; Zhao, S. A high performance magnetically responsive Janus nano-emulsifier: Preparation, emulsification characteristics, interfacial rheology, and application in emulsion flooding. J. Pet. Sci. Eng. 2022, 208, 109478. [Google Scholar] [CrossRef]
  33. Tian, K.; Pu, W.; Wang, Q.; Liu, S.; Li, S. An amphiphilic nano calcium carbonate: Preparation, emulsification, interface properties, and displacement mechanism in low permeability reservoir. Colloids Surf. A Physicochem. Eng. Asp. 2023, 676, 132172. [Google Scholar] [CrossRef]
  34. Tian, K.; Pu, W.; Li, S.; Wang, Q.; Liu, S. An amphiphilic nano titanium dioxide based nanofluid: Preparation, dispersion, emulsion, interface properties, wettability and application in enhanced oil recovery. Chem. Eng. Res. Des. 2023, 197, 685–696. [Google Scholar] [CrossRef]
  35. Pu, W.; Chang, J.; Jiang, R.; Shen, C. Study on the influence of heavy oil group components on the formation and stability of W/O emulsion. J. Dispers. Sci. Technol. 2023, 44, 1671–1679. [Google Scholar] [CrossRef]
  36. Shi, P.; Yu, A.; Zhang, H.; Duan, M.; Pu, W.; Liu, R. A study on the contribution of the intermolecular forces to the stabilization of the high internal phase emulsion: A combined experimental and molecular dynamics study. J. Pet. Sci. Eng. 2023, 220 Pt B, 111188. [Google Scholar] [CrossRef]
Figure 1. Schematic of carbon nanotube synthesis.
Energies 17 02564 g001
Figure 2. Infrared spectra of carbon nanotubes with different structures.
Energies 17 02564 g002
Figure 3. Microscopic morphology of carbon nanotubes with different structures.
Energies 17 02564 g003
Figure 4. Contact angles of different carbon nanotubes.
Energies 17 02564 g004
Figure 5. Viscosity reduction of different nanofluids.
Energies 17 02564 g005
Figure 6. The water yield ratio of the emulsions.
Energies 17 02564 g006
Figure 7. Interfacial tension of different nanofluids.
Energies 17 02564 g007
Figure 8. Mechanism of nanofluids at the oil–water interface.
Energies 17 02564 g008
Figure 9. Initial models of carbon nanotubes with different molecular structures.
Energies 17 02564 g009
Figure 10. Diffusion morphology of carbon nanotubes with different molecular structures at the oil–water interface.
Energies 17 02564 g010
Table 1. Properties of crude oil.
Oil SpeciesDensity (g/cm3)Viscosity (mPa·s)SaturatesAromaticsResinsAsphaltenesAPI
BO-10.9432236.5240.85%28.99%24.18%5.98%14.6°
Table 2. Zeta potential values of different nanofluids (absolute value; unit: mV).
Sample NamePotential ValueSample NamePotential ValueSample NamePotential Value
NH2-CNT6.88OH-CNT6.75COOH-CNT10.66
NH2-CNT-1216.77OH-CNT-1220.96COOH-CNT-1225.56
NH2-CNT-1620.15OH-CNT-1626.25COOH-CNT-1632.44
NH2-CNT-1823.98OH-CNT-1831.78COOH-CNT-1838.78
Table 3. The average particle size of nanoparticles in different nanofluids (unit: nm).
Sample NameParticle SizeSample NameParticle SizeSample NameParticle Size
NH2-CNT1097.8OH-CNT930.5COOH-CNT836.2
NH2-CNT-12709.3OH-CNT-12862.1COOH-CNT-12555.8
NH2-CNT-16685.12OH-CNT-16768.2COOH-CNT-16485.7
NH2-CNT-18679.3OH-CNT-18607.4COOH-CNT-18436.6
Table 4. Electrical conductivity values of different samples.
SampleConductivity Value (μs/cm)SampleConductivity Value (μs/cm)SampleConductivity Value (μs/cm)SampleConductivity Value (μs/cm)
NH2-CNT1356OH-CNT1723COOH-CNT2234Water2234
NH2-CNT-121224OH-CNT-121643COOH-CNT-122188BO-10.01
NH2-CNT-161185OH-CNT-161522COOH-CNT-162126BO-20.01
NH2-CNT-181136OH-CNT-181467COOH-CNT-182059BO-30.01
Table 5. Diffusion coefficient results of carbon nanotubes with different structures.
SampleDiffusion Coefficient (A2/ps)SampleDiffusion Coefficient (A2/ps)SampleDiffusion Coefficient (A2/ps)
NH2-CNT0.0212OH-CNT0.0508COOH-CNT0.0594
NH2-CNT-120.0080OH-CNT-120.0142COOH-CNT-120.0410
NH2-CNT-160.0059OH-CNT-160.0117COOH-CNT-160.0352
NH2-CNT-180.0014OH-CNT-180.0014COOH-CNT-180.0341
Disclaimer/Publisher’s Note: The statements, opinions and data contained in all publications are solely those of the individual author(s) and contributor(s) and not of MDPI and/or the editor(s). MDPI and/or the editor(s) disclaim responsibility for any injury to people or property resulting from any ideas, methods, instructions or products referred to in the content.