Abstract
Experimental measurements and modeling have been performed in the chimney of a biomass boiler to study the gaseous and particulate matter (PM) emissions during the combustion of wood pellets. A 10 kW boiler with an underfeed burner is equipped with different sensors located in the chimney (anemometer, thermocouples). The PM emissions were measured in the chimney through the engine exhaust particle sizer (EEPS) technique. Moreover, the gaseous emissions (CO2, CO, total hydrocarbons THC, O2) were obtained through infrared (IR) spectroscopy and flame ionization detector (FID). The emissions were recorded during the steady phase of the boiler and averaged over several tests. Four locations were investigated in the chimney to evaluate the evolution of the particle size and the potential deposition on the surface. The experimental results were compared with a CFD model with particle transportation. The modeling of turbulent flow in the chimney is based on a Reynolds-averaged Navier–Stokes (RANS) approach with turbulent viscosity closure. To account for flow anisotropy, the turbulence model was selected for this study. The effect of turbulent fluctuations on the discrete phase is considered by the discrete random walk (DRW) turbulent dispersion model. The results obtained provide access to the topology of the carrier phase flow as well as the complete distribution of the particle field within the chimney enclosure. Advanced measurement of pollutant emissions and modeling of the PM transportation are developed for the first time in a domestic biomass boiler operating in real conditions. Experimental results demonstrate several relevant information. The CO and THC emissions show a similar evolution versus time. The PM granulometric distribution measured along the chimney highlights the particle agglomeration phenomena. Moreover, the CFD model and experimental results give similar results in terms of flow characteristics and PM granulometry.
1. Introduction
In the present energy and environmental crisis, biomass energy could be an interesting alternative solution. It presents many economic and environmental benefits such as reducing waste, worldwide availability, and a neutral carbon balance [1]. Biomass combustion already provides a significant amount of world energy consumption and is the first supplier of renewable energy [2], but its use should be increased in the future. Furthermore, biomass combustion is known to cause major emission of multiple gaseous pollutants, such as carbon monoxide (CO), nitrogen oxides (NOx), and polycyclic aromatic hydrocarbons (PAHs) [3], resulting in incomplete combustion. In addition, biomass combustion produces high amounts of particulate matter (PM). These particles could be divided into three ranges: coarse (d > 1 µm), fine (0.1 µm < d < 1 µm) [4], and ultrafine (d < 0.1 µm). The last two are known to be emitted by biomass combustion and are studied in this work. Moreover, there are three kinds of fine particles, with their own way of forming [5]:
- Soot, formed in the flame by complex reactions of surface, coagulation, and agglomeration of gaseous hydrocarbons, with PAHs being precursor for soot;
- Fly ashes, which are volatile metals (Zn, Pb, Ni, Cd, Cu, As, etc.) encased and unburnt in wood;
- Organic materials, issued from the decomposition of biomass during the heating process.
All these pollutant emissions have a significant effect on air quality and human health [6], with biomass combustion being one of the main sources of air pollution in Europe [7]. Many investigations have shown that the boiler characteristics, the nature of biomass, and the combustion operating conditions have a great influence on the formation of pollutants [8,9,10].
Some numerical studies have been carried out on particle-laden flows, such as boiler chimneys. Accurate simulation of the deposition and distribution of fine particles in turbulent-laden flows requires correct modeling of both the carrier flow and the dispersion of micro and nanoparticles. One of the key challenges lies in capturing the complex interplay between turbulent fluid motion and particle dispersion.
Modeling of particle dispersion in particle-laden flows typically falls into two main categories: Eulerian–Eulerian and Eulerian–Lagrangian approaches [11,12,13]. In the Eulerian–Eulerian approach, particles are considered to be a continuous phase, and conservation equations, such as continuity, momentum, and energy, are solved similarly to the carrier gas flow field. Hence, the motions of individual particles are not considered, and the formulation of boundary conditions for the second phase is challenging [14]. This approach is well-suited for denser suspensions where particle–particle interactions are significant and the feedback from particles on the flow cannot be ignored. Nevertheless, accurately specifying inter-phase exchange rates presents a challenge. On the other hand, the Eulerian–Lagrangian approach treats particles as discrete entities dispersed in the continuous carrier flow phase. It is preferred over the Eulerian–Eulerian method because it accounts for the discrete nature of particles and thus enables a more accurate management of turbulent diffusion. Particle trajectories are determined by integrating Newton’s second law, accounting for relevant forces such as gravity, drag, lift, etc. In the present work, Lagrangian particle tracking methodology is employed, assuming the dispersed phase does not significantly affect the continuous flow field (one-way coupling).
Presently, three primary approaches exist for simulating turbulent flows. Direct numerical simulation (DNS) resolves all spatial and temporal turbulent scales, which makes it the most accurate approach, although its application in industrial contexts is very challenging due to its prohibitive computational cost. On the other hand, large eddy simulation (LES) resolves turbulent scales larger than the grid cell size, while subgrid-scale fluctuations are modeled. Despite being less computationally intensive than DNS, LES still poses challenges for simulating complex flows in high Reynolds number environments due to the drastic increase in computational costs with the Reynolds number. In the context of industrial applications, the most commonly used alternative to DNS/LES is the Reynolds-averaged Navier–Stokes (RANS) approach, which models the entire turbulence spectrum. In this study, the turbulence closure model is used for its ability to represent flow anisotropy near the wall [14].
In contrast to the DNS/LES methods, the RANS approach evaluates only the ensemble-averaged flow fields. Consequently, the RANS equations lack the instantaneous fluid velocity vector at the particle position. It becomes essential to model instantaneous fluctuations in order to consider the complex coupling between turbulent flow motion and particle dispersion. This approach, inspired by stochastic models, aims to simulate turbulence fluctuations by employing additional equations in order to calculate instantaneous turbulent velocities using local computed quantities such as distance to the wall, mean turbulent kinetic energy, and Eulerian time scale. Random walk models are significant examples of this approach, known for their moderate computational costs and ease of implementation. The DRW model [15], also known as the Eddy interaction model (ETM), emerges as a robust approach, originally proposed for homogeneous turbulent flows.
The aim of this work is to experimentally investigate the gaseous and PM emissions in the chimney of a domestic-scale boiler with a nominal power of 10 kW, during the combustion of natural wood pellets. This boiler is equipped with an underfeed burner, instrumented with several sensors (thermocouples, flowmeters, etc.) located in strategic areas and several points of measurement. These sensors allow for a complete characterization of the laden flow in terms of temperature and velocity, a measurement of gaseous pollutants, and a study of the evolution of the emitted PM characteristics along the chimney and at the outlet. Additionally, a numerical model of the carrier flow and particle transportation was developed and validated by experimental data.
2. Experimental and Numerical Setup
2.1. Experimental Setup
2.1.1. Solid Biomass Description
The measurements were conducted using 100% resinous natural wood pellets. Wood pellets are cylinders of wood with a diameter of 6 to 8 mm and a length between 3 and 40 mm. Pelletization is used to rectify some drawbacks of biomass as fuel, with its lower heating value compared to fossil fuels due to a higher moisture content and properties heterogeneity [16]. The pelletizing process involves applying high pressure and high temperature to semi-dry biomass and passing it through holes of specific size to produce cylinders, increasing the bulk density of the materials. This process provides fuel with a higher density and more homogenous properties, characterized by a higher energy density [17]. Also, wood pellets are known to cause less pollutant emissions than classic wood stoves [18]. Moreover, some studies compare the pollutant emissions according to the type of wood, hardwood or resinous, and have shown that resinous wood emit less particles, with higher diameter [19,20]. The physical characteristics of wood pellets are assured, with caution [21], by European standards: a density of 650 kg/m3, a heating value above 16.5 MJ/kg, and a humidity rate below 10%.
See Table 1 for the characteristics of the wood pellets used for the experiments.

Table 1.
Wood pellets characteristics.
2.1.2. Boiler Description
The experiments are carried out in a domestic 10 kW boiler, equipped with an underfeed boiler. The wood pellets are supplied automatically and regularly by an infinite screw under the flame, with an injection of pellets for 4 s every 10 s. The air intake at the underfeed burner is assured by a fan.
Figure 1 is a schematic representation of the boiler with the different points of interest. Both the air intake and the chimney of the boiler are fully instrumented, which allows for good knowledge of the operating conditions of the boiler. For the different fluids (air, water, flue gases), the temperature T, the relative humidity (RH), and the flow rates (q) are measured over time, at a frequency of 1 Hz. The boiler is also equipped with a burnt gas–water heat exchanger, made up of tubes distributed all around the flame. A hydraulic circuit drives the transmitted heat to the water to an external exchanger, which dissipates the stored thermal energy and ensuring the energetic balance of the entire facility. The experimental setup is equipped with sensors (thermocouples and flowmeters), which allows for the calculation of the value of the power transmitted to the water.
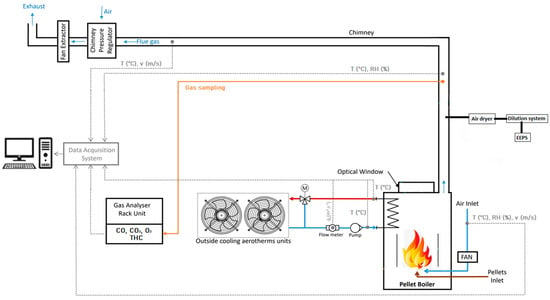
Figure 1.
Schematic diagram of the experimental setup.
Furthermore, Figure 2 focuses on the chimney of the boiler, showing its dimensions and specific positions where experimental and simulation results are compared. There are several geometrical shapes that are relevant for the study: T-shape at position P2, pipe bend before position P3, and shrinkage between D1 (130 mm) and D2 (110 mm).
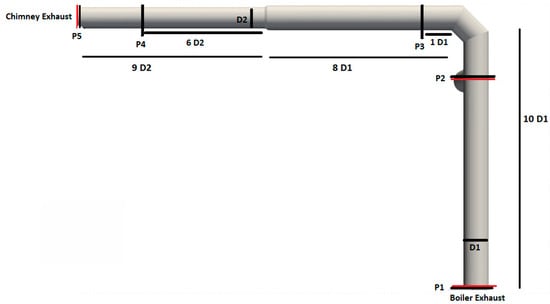
Figure 2.
Measurements points in the chimney.
Table 2 below summarizes all the measurements performed in the different positions in the chimney. Temperatures are recorded with T-type thermocouples (measurement range: −40 to 350 °C, accuracy: 0.5 °C) at P1 and P2 and with a PT100 (measurement range: −40 to 180 °C, accuracy: 0.1 °C) at P5. A propeller anemometer was used for air velocimetry measurements (measurement range: 0.3 to 35 m/s, accuracy: 0.1 m/s).

Table 2.
Measurements performed in the chimney.
2.1.3. PM Emissions Measurement Technique
To characterize the PM emissions, an engine exhaust particle sizer (EEPS) from TSI is used to measure, at the same time, the total volume concentration, the median diameter, and the granulometric distribution of the emitted particles.
The measurement technic is based on the electrical charging of particles, applied for decades [22]. Particles are sampled by this device at a 10 L/min flowrate, and then are separated into different electrometers according to their electrical mobility. Particles are saturated with an electrical charging and are conducted to a column of electrometers. The smallest particles, with less inertia, will hit the first electrometers, and the big particles will hit the last ones [23]. Thanks to these signals, granulometric information can be obtained. The device measures particle sizes from 6 to 523 nm, spread out into 32 size channels. An operating frequency of 1 Hz is chosen to conduct the experiments.
The EEPS has already been used to several experimental measurements of PM emissions [24,25] and has also been compared to other reference devices like condensation particle counters (CPCs) [26] or scanning mobility particle sizers (SMPSs) [27,28].
Moreover, a dilutor with a ratio of 1 to 100 is used to avoid EEPS saturation. The concentration is then corrected according to the dilution ratio. An air dryer is also connected upward to the test line to prevent condensation in the device.
2.1.4. Gaseous Emissions Measurement Techniques
Gas analyzers are used to characterize the gaseous emissions. The measure of mole fraction of CO, CO2, and O2 is obtained by infrared spectroscopy and the mole fraction of total hydrocarbons (THC, equivalent to mole fraction of CH4) by flame ionization detector (FID). The gaseous pollutants are sampled at the same location in the chimney, at position P2. A heated line is used to avoid condensation. A system composed of a water trap and a filter separates water drop and particles, respectively, before the analysis of gases.
The accuracy is 2% of the full scale for the measurement by IR spectroscopy and 1% of full scale for the measurement by FID. To ensure the quality of the data, the analyzers were calibrated regularly with standard gas bottles of specific concentration.
The analyzers have an operating frequency of 1 Hz, with data averaged each minute.
2.2. Numerical Setup
2.2.1. Model Description
In this work, we used the open source CFD toolkit OpenFOAM v9.
The flow is modeled by the compressible Favre-averaged Navier–Stokes equations:
where and denote the velocity components and total energy, and are the density and pressure, and and are the total (viscous and turbulent parts) heat flux and the total stress tensor. The overline and the wide tilde represent the averaged Reynolds and Favre, respectively. The turbulent stress tensor is calculated by the model used to model the turbulence [29]. It extends traditional first order two-equation turbulence models by incorporating near-wall turbulence anisotropy and non-local pressure–strain effects. This makes it a versatile turbulence model, eliminating the need for wall functions as it remains valid up to solid walls. The model uses a velocity scale (), representing velocity fluctuations normal to streamlines. This choice enables the model to accurately represent the damping of turbulent transport near the wall, without the need for additional assumptions. Furthermore, the model accounts for anisotropic wall effects by introducing an elliptic relaxation function (f), which is solved through a separate elliptic equation. This comprehensive approach allows the model to effectively capture turbulence behavior near solid boundaries, making it suitable for a wide range of flow scenarios.
The solid phase is modeled by the Lagrangian discrete parcel method (DPM) considering the drag, lift, Brownian, and thermophoresis effects on particles. The implementation of these different effects is described in [30]. The particle-laden flow is sufficiently diluted to assume the one-way coupling method between the flow and the particles. The turbulent dispersion effect is modeled by the conventional discrete random walk (DRW) method. This model is favored for its simplicity and computational efficiency in modeling the particle phase. The dispersion of particles in turbulent flows is represented in the model as a series of interactions between turbulent eddies and the particles. According to this model, a particle is entrained by an eddy moving with a velocity composed of the mean fluid velocity, along with a random “instantaneous” component that remains constant over short time intervals. Once the lifetime of the turbulent eddy expires or the particle exits the eddy, it interacts with another eddy, and this process continues iteratively.
2.2.2. Computational Domain
The computational domain represents the geometry shown in Figure 3. The inlet boundary condition is set by a precursor calculation allowing for the obtainment of the same velocity profile as the measured one, and the temperature is the measured temperature. The outlet condition is a constant pressure. A no-slip condition is applied on solid walls where a thermal flux is fixed to model the external air.
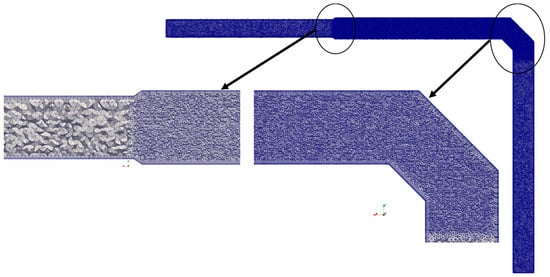
Figure 3.
Computational mesh.
The heat transfer coefficients on the walls are obtained from correlations. The internal convective parameter is calculated with [31] considering a turbulent flow (Re ≈ 6000). The external convective coefficients on the horizontal and vertical sections are obtained, respectively, with the correlations [32,33]. A mean transfer coefficient is deduced for each part considering the internal and external convection. The thermal resistance of the tube is neglected according to the thickness and the thermal conductivity of steel. The heat transfer along the chimney is modeled with a convective coefficient h = 4.1 W·m−2·K−1 on the vertical part and h = 4.9 W·m−2·K−1 on the horizontal part.
The computational domain is discretized using tetrahedral elements, see Figure 3. A mesh sensitivity analysis was conducted in order to choose the best compromise between accuracy and computational cost. The retained mesh consists of 5 million cells. The boundary layer mesh guarantees a y+ value below 1.
3. Experimental Results
All the experiments were conducted during the steady phase of the boiler. To ensure the reproducibility of the system, four tests of about 1 h of recording were performed to monitor the evolution of the operating parameters of the boiler.
In Table 3, the results show that the boiler functioning is repeatable, with maximum variation to the mean, over the four tests, around 5%.

Table 3.
Operating parameters of the boiler.
3.1. Measurement of Gaseous Pollutant
For the gaseous emissions, eight tests were recorded at position P2. The results are shown in Table 4.

Table 4.
Gaseous emissions.
The main result of these measurements is that, even if the boiler functioning is stable and reproducible, this is not the case for pollutant emissions, especially for gaseous pollutants, with a maximal variation to the mean of 41% around a mean value of 465.3 ppm for the CO mole fraction, and a variation of 52% around 32.6 ppm for the THC mole fraction. The CO2 mole fraction also shows a significant variation but around a low value of concentration. Only the O2 levels stay rather stable over the different tests.
Comparisons are made with French standards, and to other similar studies [34,35] in Table 5, showing that the results are in the order of magnitude of the literature review for other studies using wood pellets.

Table 5.
Comparison of gaseous emissions from wood pellet combustion in a boiler (PL = partial load).
Moreover, Figure 4 shows an example of the temporal evolution of gaseous concentration levels. It is important to note that CO and THC emissions are unstable over time but are temporally coherent.
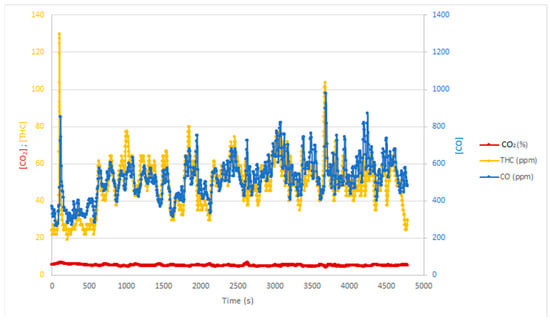
Figure 4.
Evolution of gaseous pollutants versus time.
These temporal fluctuations could be explained by the fluctuation of the flame, visible through the optical window of the boiler, even during the steady phase, due to the geometry of the burner: more than 20 air intakes, distributed around the burner, leading to an asymmetric distribution of the air through the flame.
3.2. Evolution of PM Levels along the Chimney
One of the aims of this study was to highlight the evolution of PM granulometry and concentration along the chimney of the boiler. Six tests were performed at several positions (P1 to P4 in Figure 2), to check reproducibility. The results are presented in Figure 5 and Table 6.
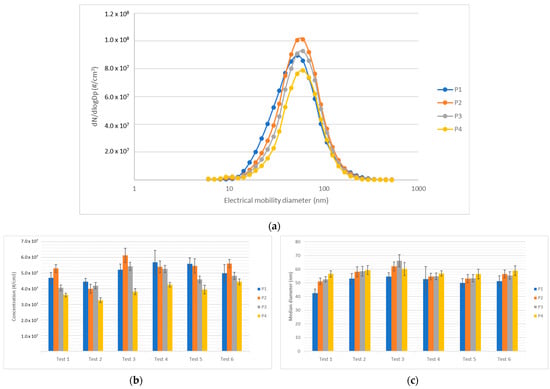
Figure 5.
Evolution of PM emissions along the chimney for 4 positions: (a) mean granulometric distribution over the six tests; (b) evolution of PM concentration according to the position and to the test; (c) evolution of PM median diameter according to the position and to the test (with temporal standard deviation as error bar).

Table 6.
PM emissions.
Except for position P2, where measurements could be disturbed by the T-shape of the chimney (noticeable on Figure 2), the data show, in one side, a decrease in the concentration, from 5.1 × 10⁷ particles/cm3 at P1 to 3.9 × 10⁷ at P4, and in another side a slight increase in the median diameter, from 50.7 to 58.0 nm.
These results endorse the theory of a deposition of the emitted PM, which contribute to the decrease in the concentration, but also of an agglomeration of these particles which could explain the increase in the median diameter.
Two remarks can be made from these results:
- There is only a small decrease in the PM concentration between P1 and P3, with a great increase in the median diameter. Moreover, Figure 5a shows a decrease in the concentration of the smaller particles (with diameter < 80 nm) and an increase in the concentration for particles with higher diameter. It may be presumed that the predominant phenomenon between positions P1 and P3 is the agglomeration of particles.
- Between the positions P3 and P4, the median diameter shows only a slight evolution, but there is an important decrease in the particles’ concentration. It could be assumed that the predominant phenomenon between position P3 and P4 is the particles’ deposition.
To investigate furthermore these experimental results, a CFD modeling of the particles’ transportation in the chimney was performed, particularly to confirm the hypothesis of the deposition.
4. Numerical Results and Comparison with Experimental Results
Before analyzing the particle distribution, validation work was performed on the carrying flow. The numerical and experimental sampling of the velocity profiles, in Figure 6, shows a good agreement, at position P3, where the flow is strongly disturbed by the pipe bend.
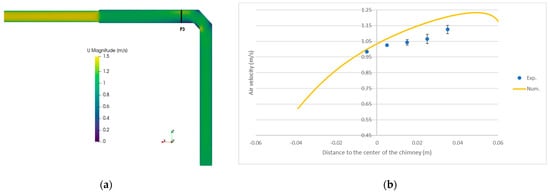
Figure 6.
(a) Numerical velocity field distribution inside the chimney. (b) Comparison between experimental and numerical axial velocity profile at P3 (with maximum variation to the mean as error bars).
The temperature is obtained along the chimney as shown in Figure 7. The temperature of the fluid is imposed at location P1 and is compared to experimental data at locations P2 and P5. Table 7 gives the comparison of the measured values and the simulated temperatures. At position P2, there is a difference of approximately 4% between the mean measured temperature and the numerical ones. At position P5, the temperature is measured with a PT100 sensor with a higher accuracy. The difference between the numerical value and the experimental value is less than 1 °C. These results give confidence in the prediction of the temperature field, then on the thermophoresis effect, considered in the particle transportation model.
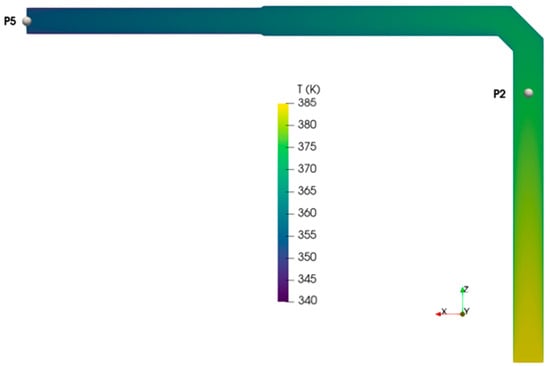
Figure 7.
Simulated temperature field in the chimney with the positions of the probes (P2 and P5) used for the comparison with the experiments.

Table 7.
Comparison between measured and simulated temperature in the chimney.
In Figure 8, the particle concentration obtained with the CFD simulation are plotted according to the particle’s diameter for positions P1, P3, and P4. The concentration imposed in the numerical model at the location P1 is taken from the experimental measurement. A Gaussian distribution is used on the most encountered diameters [5]. The range of diameter, [6–124 nm], has been chosen according to experimental measurement. Each parcel of the DPM model contains 1 million of particles.
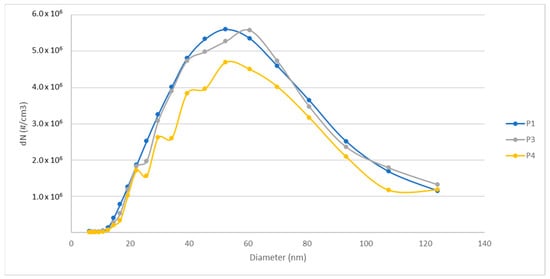
Figure 8.
Simulated granulometric distribution according to the position in the chimney.
For location P3, the particle concentration is very similar to the imposed condition at position P1. A significant difference is observed at location P4, with a decrease in the particle number on all the ranges of diameters.
In Figure 9, the experimental and numerical results are compared at locations P3 and P4. For both positions, the numerical results predict quite well the measurements. The maximum concentration is in the same range around 6 × 10⁶ particles/cm3 (P3) and 5 × 10⁶ particles/cm3 (P4). However, the model overestimates the particle numbers in the range 20–50 nm and underestimates the particle numbers in the range 60–120 nm. One consistent assumption to explain these differences can be the agglomeration of particles along the chimney. The current CFD model does not consider the agglomeration of ultrafine particles. Nevertheless, soot particles are known to agglomerate. The size of the particles may change along the chimney. For the experimental results, it has been highlighted that the median diameter is growing along the chimney.

Figure 9.
Comparison between measured and simulated granulometric distribution: (a) at P3; (b) at P4.
Finally, the total number of particles are compared in Figure 10. The total numbers of particles at position P1 are equal to the mean measured value, as this is the imposed condition in the chimney inlet. At locations P3 and P4, the same tendency is observed regarding the decrease. At location P3, the simulated total number decreases about 3.8% compared to 6.8% for the experimental measurement. At this point, there is a non-negligible dispersion of the experimental data. At location P4, the simulated and experimental total numbers of particles are closer. A decrease of 20.9% is observed for the numerical simulation between P1 and P4. For the experimental data, the decrease is about 23.3%.
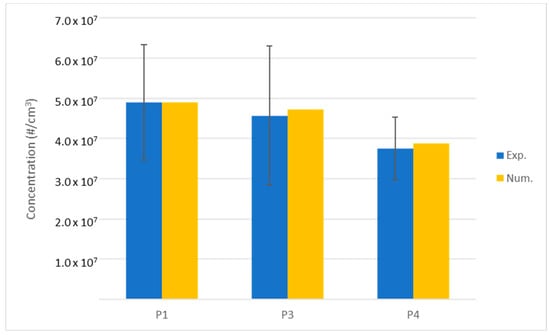
Figure 10.
Comparison between measured and simulated total concentration of PM according to the position in the chimney (with maximum variation to the mean as error bars).
5. Conclusions
The paper deals with the characterization of gaseous and solid pollutants emitted from a 10 kW wood pellet boiler and with the prediction of particle matter transport in the chimney. One of the aims of this work was to predict the modification of the granulometry of the particles along the chimney and at the outlet. In this work, advanced measurement systems (EEPS for PM, spectroscopy and FID for gases) are applied on a domestic-scale installation, instrumented with several sensors. Moreover, numerical CFD simulations were applied on the geometry of the chimney, considering heat transfer phenomena, using a turbulence closure model and a DRW turbulent particles dispersion model. These simulations take into account the operating conditions of the boiler. The novelty of this work is to study experimentally and numerically a domestic biomass boiler in real operating conditions and to compare the measured and modeled PM emissions.
The obtained results show that the following:
- The emissions of the main gaseous pollutants (CO and THC) are variable over the different tests, even if the boiler operating parameters stay stable. However, the concentration levels of CO and THC versus time show a really similar evolution.
- The PM level evolves significantly on the different measured locations: the concentration decreases along the chimney while the median diameter increases. The evolution of the median diameter can be associated with a particle agglomeration, as biomass soot are known to form agglomeration of nanoparticles.
- Additionally, the decrease in the total number of particles along the chimney can be explained by the deposition. Some deposits are observed inside, especially in the horizontal part.
- A comparison with a CFD model gives similar results on the deposition regarding the decrease in the total number of particles along the chimney.
However, the particle–particle interaction is not taken into account in the used model. The particles’ adhesion and agglomeration are not simulated, and some differences are observed for the granulometric distribution. Integrating these behaviors will be the next aim to improve the forecast. This will bring richer information regarding the numerical simulation to understand the causes of the evolution of the particle’s concentration along the chimney.
Author Contributions
Conceptualization, C.M.; formal analysis, F.D.; investigation, F.D. and A.I.; writing—original draft, F.D., D.M., F.B., and D.U.; writing—review and editing, D.M., F.B., D.U., and C.M.; software, A.I., F.B., and D.U.; methodology, F.D., F.B., D.U., D.M., and C.M.; validation, all authors; resources, C.M.; data curation, F.D. and A.I.; visualization, F.D. and A.I.; supervision, C.M.; project administration, C.M.; funding acquisition, C.M. All authors have read and agreed to the published version of the manuscript.
Funding
A.I. was supported by a joint PhD grant from Carnot Arts Institute and Région Hauts-de-France. This work was also supported by the project FLUIDAPART, funded by Carnot Arts Institute (laboratories LAMIH and LIFSE) and by Carnot ESP Institute (laboratory CORIA).
Data Availability Statement
Data are contained within the article.
Conflicts of Interest
The authors declare no conflicts of interest.
References
- Antar, M.; Lyu, D.; Nazari, M.; Shah, A.; Zhou, X.; Smith, D.L. Biomass for a sustainable bioeconomy: An overview of world biomass production and utilization. Renew. Sustain. Energy Rev. 2021, 139, 110691. [Google Scholar] [CrossRef]
- IEA. World Energy Output 2023. Available online: https://www.iea.org/reports/world-energy-outlook-2023 (accessed on 23 April 2024).
- Williams, A.; Jones, J.M.; Ma, L.; Pourkashanian, M. Pollutants from the combustion of solid biomass fuels. Prog. Energy Combust. Sci. 2012, 38, 113–137. [Google Scholar] [CrossRef]
- Sippula, O.; Hokkinen, J.; Puustinen, H.; Yli-Pirila, P.; Jokiniemi, J. Comparison of particles from small heavy fuel oil and wood-fired boilers. Atmos. Environ. 2009, 32, 4855–4864. [Google Scholar] [CrossRef]
- Sippula, O. Fine Particle Formation and Emissions in Biomass Combustion. Academic Dissertation, University of Eastern Finland, Kuopio, Finland, 2010. No. 108. [Google Scholar]
- Ma, X.; Zhang, T.; Ji, C.; Zhai, Y.; Shen, X.; Hong, J. Threats to human health and ecosystem: Looking for air-pollution related damage since 1990. Renew. Sustain. Energy Rev. 2021, 145, 111146. [Google Scholar] [CrossRef]
- Boman, B.C.; Forsberg, A.B.; Jarvholm, B.G. Adverse health effects from ambient air pollution in relation to residential wood combustion in modern society. Scand. J. Work Environ. Health 2003, 29, 251–260. [Google Scholar] [CrossRef] [PubMed]
- Pełka, G.; Jach-Nocoń, M.; Paprocki, M.; Jachimowski, A.; Luboń, W.; Nocoń, A.; Wygoda, M.; Wyczesany, P.; Pachytel, P.; Mirowski, T. Comparison of Emissions and Efficiency of Two Types of Burners When Burning Wood Pellets from Different Suppliers. Energies 2023, 16, 1695. [Google Scholar] [CrossRef]
- Ciupek, B.; Urbaniak, R.; Kinalska, D.; Nadolny, Z. Flue Gas Recirculation System for Biomass Heating Boilers—Research and Technical Applications for Reductions in Nitrogen Oxides (NOx) Emissions. Energies 2024, 17, 259. [Google Scholar] [CrossRef]
- Křůmal, K.; Mikuška, P.; Horák, J.; Hopan, F.; Krpec, K. Comparison of emissions of gaseous and particulate pollutants from the combustion of biomass and coal in modern and old-type boiler used for residential heating in the Czech Republic, central Europe. Chemosphere 2019, 229, 51–59. [Google Scholar] [CrossRef] [PubMed]
- Gouesbet, G.; Berlemont, A. Eulerian and Lagrangian approaches for predicting the behaviour of discrete particles in turbulent flows. Prog. Energy Combust. Sci. 1999, 25, 133–159. [Google Scholar] [CrossRef]
- Xu, Z.; Han, Z.; Qu, H. Comparison between Lagrangian and Eulerian approaches for prediction of particle deposition in turbulent flows. Powder Technol. 2020, 360, 141–150. [Google Scholar] [CrossRef]
- Wu, J.; Li, L.; Yin, Z.; Li, Z.; Wang, T.; Tan, Y.; Tan, D. Mass transfer mechanism of multiphase shear flows and interphase optimization solving method. Energy 2024, 292, 130475. [Google Scholar] [CrossRef]
- Patro, P.; Dash, S.K. Computations of particle-laden turbulent jet flows based on Eulerian model. J. Fluids Eng. 2014, 136, 011301. [Google Scholar] [CrossRef]
- Durbin, P.A. Separated flow computations with the k-ε-v2 model. AIAA J. 1995, 33, 659–664. [Google Scholar] [CrossRef]
- Miranda, T.; Montero, I.; Sepulveda, F.J.; Arranz, J.I.; Rojas, C.V.; Nogales, S. A review of Pellets from different sources. Materials 2015, 8, 1413–1427. [Google Scholar] [CrossRef] [PubMed]
- Sà, J.; Curt, D.; Sanz, M. A proposal for pellets production from residual woody biomass in the island of Majorca (Spain). AIMS Energy 2015, 3, 480–504. [Google Scholar]
- Johansson, L.S.; Leckner, B.; Gustavsson, L.; Cooper, D.; Tullin, C.; Potter, A. Emissions characteristics of modern and old-type residential boilers fired with wood logs and wood pellets. Atmos. Environ. 2015, 38, 4183–4195. [Google Scholar] [CrossRef]
- Cereceda-Balic, F.; Toledo, M.; Vidal, V.; Guerrero, F.; Diaz-Robles, L.A.; Petit-Breuilhl, X.; Lapuerta, M. Emission factor for PM2.5, CO, CO2, NOx, SO2 and particle size distributions from the combustion of wood species using a new controlled combustion chamber 3CE. Sci. Total Environ. 2017, 584, 901–910. [Google Scholar] [CrossRef] [PubMed]
- Amaral, S.S.; de Carvalho Junior, J.A.; Costa, M.A.M.; Neto, T.G.S.; Dellani, R.; Leite, L.H.S. Comparative study for hardwood and softwood forest biomass: Chemical characterization, combustion phases and gas and particulate matter emissions. Bioresour. Technol. 2014, 164, 55–63. [Google Scholar] [CrossRef] [PubMed]
- Choiński, B.; Szatyłowicz, E.; Zgłobicka, I.; Ylidiz, M.J. A Critical Investigation of Certificated Industrial Wood Pellet Combustion: Influence of Process Conditions on CO/CO2 Emission. Energies 2023, 16, 250. [Google Scholar] [CrossRef]
- Flagan, R.C. History of electrical aerosol measurements. Aerosol Sci. Technol. 1998, 28, 301–380. [Google Scholar] [CrossRef]
- Johnson, T.; Caldow, R.; Pöcher, A.; Mirme, A.; Kittleson, D. A new electrical mobility particle sizer spectrometer for engine exhaust particle measurements. In SAE 2004 World Congress & Exhibition; SAE Technical Paper No. 2004-011341; SAE International: Warrendale, PA, USA, 2004. [Google Scholar]
- Barrios, C.C.; Dominguez-Sàez, A.; Rubio, J.R.; Pujadas, M. Development and evaluation of on-board measurement system for nanoparticles from diesel engine. Aerosol Sci. Technol. 2011, 45, 570–580. [Google Scholar] [CrossRef]
- Jasiński, R.; Przysowa, R. Evaluating the Impact of Using HEFA Fuel on the Particulate Matter Emissions from a Turbine Engine. Energies 2024, 17, 1077. [Google Scholar] [CrossRef]
- Zimmerman, N.; Pollitt, K.J.G.; Jeong, C.-H.; Wang, J.M.; Jung, T.; Cooper, J.M.; Wallace, J.S.; Evans, G.J. Comparison of three nanoparticle sizing instruments: The influence of particles morphology. Atmos. Environ. 2014, 86, 140–147. [Google Scholar] [CrossRef]
- Leskinen, J.; Joutsensaari, J.; Lyyränen, J.; Koivisto, J.; Ruusunen, J.; Järvelä, M.; Tuomi, T.; Hämeri, K.; Auvinen, A.; Jokiniemi, J. Comparison of nanoparticle measurement instruments for occupational health applications. J. Nanoparticle Res. 2012, 14, 718. [Google Scholar] [CrossRef]
- Zimmerman, N.; Jeong, C.-H.; Wang, J.M.; Ramos, M.; Wallace, J.S.; Evans, G.J. A source-independent empirical correction procedure for the fast mobility and engine exhaust particle sizers. Atmos. Environ. 2015, 100, 178–184. [Google Scholar] [CrossRef]
- Durbin, P.A. Near-wall turbulence closure modeling without “damping functions”. Theor. Comput. Fluid Dyn. 1991, 3, 1–13. [Google Scholar] [CrossRef]
- He, Y.; Men, Y.; Zhao, Y.; Lu, H.; Ding, Y. Numerical investigation into the convective heat transfer of TiO2 nanofluids flowing through a straight tube under the laminar flow conditions. Appl. Therm. Eng. 2009, 29, 1965–1972. [Google Scholar] [CrossRef]
- Gnielinski, V. New Equations for Heat and Mass Transfer in Turbulent Pipe and Channel Flow. Int. Chem. Eng. 1976, 16, 359–368. [Google Scholar]
- Churchill, S.W.; Chu, H.H.S. Correlating Equations for Laminar and Turbulent Free Convection from a Horizontal Cylinder. Int. J. Heat Mass Transf. 1975, 18, 1049. [Google Scholar] [CrossRef]
- Churchill, S.W.; Chu, H.H.S. Correlating Equations for Laminar and Turbulent Free Convection from a Vertical Plate. Int. J. Heat Mass Transf. 1975, 18, 1323. [Google Scholar] [CrossRef]
- Martinez, A.A.; Lacour, C.; Yon, J.; Coppale, A. Influence of operation mode of a drop-feed-pellet domestic boiler on gaseous and particulate emission. In Proceedings of the 12th European Conference on Industrial Furnaces and Boiler, Porto, Portugal, 14–17 April 2020. [Google Scholar]
- Schmild, C.; Luisser, M.; Padouvas, E.; Lasselsberger, L.; Rzaca, M.; Cruz, C.R.-S.; Handler, M.; Peng, G.; Bauer, H.; Puxbaum, H. Particulate and gaseous emissions from manually and automatically fired small scale combustion systems. Atmos. Environ. 2011, 45, 7443–7454. [Google Scholar]
Disclaimer/Publisher’s Note: The statements, opinions and data contained in all publications are solely those of the individual author(s) and contributor(s) and not of MDPI and/or the editor(s). MDPI and/or the editor(s) disclaim responsibility for any injury to people or property resulting from any ideas, methods, instructions or products referred to in the content. |
© 2024 by the authors. Licensee MDPI, Basel, Switzerland. This article is an open access article distributed under the terms and conditions of the Creative Commons Attribution (CC BY) license (https://creativecommons.org/licenses/by/4.0/).