Article

Sustainable Transport in the European Union: Exploring the Net-Zero Transition through Confirmatory Factor Analysis and Gaussian Graphical Modeling

by
Mirela Sichigea
1,
Daniel Cîrciumaru
1,*,
Valeriu Brabete
2 and
Cătălin Mihail Barbu
3
1
Department Finance, Banking and Economic Analysis, Faculty of Economics and Business Administration, University of Craiova, 200585 Craiova, Romania
2
Department of Economics, Accounting and International Affairs, Faculty of Economics and Business Administration, University of Craiova, 200585 Craiova, Romania
3
Department of Management, Marketing and Business Administration, Faculty of Economics and Business Administration, University of Craiova, 200585 Craiova, Romania
*
Author to whom correspondence should be addressed.
Energies 2024, 17(11), 2645; https://doi.org/10.3390/en17112645
Submission received: 30 April 2024 / Revised: 24 May 2024 / Accepted: 27 May 2024 / Published: 30 May 2024
(This article belongs to the Section B: Energy and Environment)

Abstract

:
The sustainability of the transport sector is targeted by various policies adopted by the European Union, and their impact must be constantly monitored in order to maximize the desired objective. This paper, through a two-stage investigation, aims to present a systemic approach of the sustainability dimensions in transport and to introduce an innovative technique to analyze the interdependencies between them. In the first stage, relevant indicators were selected from the Eurostat database for the content of four dimensions: economic, environmental, social and technological. The robustness of the developed dimensions was assessed and validated through a confirmatory factor analysis. In the second stage, a Gaussian graphical model was estimated as a technique integrating graphical and statistical modeling to identify complex structures of linkages between variables (as components of each dimension of sustainability). The structure of the network clearly highlights the dependence of transport on fossil fuel consumption as the main determinant of pollution in the sector (CO2 emissions). In addition, the central role of railways in decarbonizing transport is highlighted, in contrast to the limited, and isolated at one end of the network, role of electric vehicles. The findings support that affordability of this new technology plays an important role in its impact on zero-emission transition. Concentrating on the period 2013–2022, at EU27 level, the results are relevant in the context of decarbonization policies, offering useful insights both for future research and policy makers.

1. Introduction

Transportation within the European Union (EU) has a critical role, both from a social and an economic perspective. It ensures the mobility of people as well as goods, supplying and connecting all the other sectors of activity. With a contribution of around 5% of the EU GDP and 10 million workers directly employed in transport activities [1], this sector is a key link in the sustainable development of the Member States (MS). However, its transition to climate neutrality is quite difficult to achieve. The transport sector is responsible for a quarter (25%) of greenhouse gas (GHG) emissions at the EU level [2], and its rate refuses to decrease, despite the measures implemented. In fact, transport “is the only sector in the EU where GHG emissions have increased since 1990” [3] (p. 1).
The negative resilience of the transport sector to EU policies may put at risk not only the achievement of the intermediate targets of at least 55% emission reductions by 2030 [4] but, implicitly, the net-zero-emission target set by the Green Deal [5] and closely in line with the Paris Agreement. This “Achilles’ heel” of the Green Deal calls for more effort both from the policy makers and scholars in order to identify vital solutions for the decarbonization of transport modes.
Strongly committed to the climate-neutrality objective, the European Commission (EC) has made consistent efforts to promote policies aimed at creating a sustainable European transport system that ensures effective and resilient mobility and low environmental impact. The main directions of the European transport policies are set out in the White Paper ‘Roadmap to a Single European Transport Area’ [6], and their objectives have been constantly monitored and reinforced as outlined in the Sustainability Smart Mobility Strategy [1].
The transition to sustainable transport has materialized through “many policies, voluntary commitments, strategies, and regulations, with the fundamental principle to curb the energy consumption and carbon emissions, through technological improvements” [7] (p. 4). In this regard, the Directives of renewable energy [8,9], the Directives of energy efficiency [10,11] and the Directive of clean vehicles [12] stand out.
The latest projects are incorporated in the ‘Fit for 55’ package [4] built as the first stage in delivering the Green Deal. More than legal regulations, these projects are strengthening the path towards decarbonization of the transport sector in a smart and fair way by supporting (i) the transition to a transport system consisting of low- and zero-emission vehicles, along with a phase-out of the sale of new vehicles consuming CO2-emitting fuels by 2035 [13]; (ii) an increase in the use of renewable and low-emission fuels in road transport [14], maritime transport [15] and air transport [16]; (iii) improving the efficiency of energy use in transport modes [17] by raising the share of renewable electricity consumed in transport [18] as well as increasing the number of electric vehicles on road, rail and maritime transport and boosting the development of electric charging infrastructure [14]; (iv) expanding rail infrastructure and capacity in order to shift transport of goods and people to a more sustainable mode [19]; and (v) streamlining the transition to a cleaner transport system, at the level of each MS, through additional taxation of transport pollution [20].
A review of European transport decarbonization policies suggests that they are designed to take systematic and simultaneous action across transport modes (road, rail, air, maritime) rather than individual (isolated) action. The same effect (emission reduction) is targeted through different legislative regulations that address its multiple causes (determinants). Moreover, a rebalancing between modes of transport is desired in order to achieve clean mobility. In simple factor analysis terms, all these mean that the causal factors (determinants) can have both a direct influence on the effect and one or more indirect influences generated by the interactions between them, produced by the regulations.
In order to achieve emission reduction from transport, a sector difficult to decarbonize due to its heavy dependence on fossil fuels [7,21], the behavior of its sustainability determinants needs to be monitored using advanced scientific methods capable of taking into account the multiple interactions between factors. Therefore, this research aims to investigate the connection and interdependencies between the dimensions of sustainability and its determinants (as content-related indicators) through an advanced network analysis technique, namely the Gaussian graphical model (GGM). The whole scientific approach is carried out in the context of European policies on decarbonization of transport.
Interest in assessing the sustainability of the transport sector has constantly increased over the past decade, this interest being even higher, at the EU level, as sustainability allows monitoring progress in achieving climate targets [22]. To address this challenge, many studies have approached the sustainability of transport modes in relation to its economic, environmental and social dimensions [3,23]; other papers have included additional dimensions of sustainability, related to political and spatial issues [24,25] or technology aspects [26]; meanwhile, some studies have focused exclusively on its social and environmental pillars [22,27]. With the concept of sustainable development at its core, most commonly in line with the definition of the Brundland Commission report in 1987 [28], a “special attention has been paid to sustainable transport” [29] (p. 1).
Taking into consideration its different dimensions, the progress of transport sustainability has been assessed, from a systemic perspective, through a collection of indicators [3,23] or a composite index [22,29], while another part of the literature has focused on transport emissions as the core of sustainability and investigated the influence exerted on gas emissions by different determinants, such as policies, environmental technologies, value-added and infrastructure investments [30], energy efficiency and decarbonization policies [7], innovations in transport, green taxes and trade globalization [31], GDP, environmental technologies and renewable energy [32]; and economic growth, energy consumption and urbanization [33]. It should be noted that previous studies have approached transport sustainability in a predominantly classical manner, with investigations aimed at identifying appropriate measures for monitoring and improving transport performance [3,22,23,29] or at quantifying the isolated influence of different factors on transport emissions [7,30,31,32,33].
This research offers a new perspective, as it lies at the intersection of the two areas from the literature. By reviewing both fields of knowledge about transport sustainability, this paper draws on the dimensions content in order to investigate the connectivity and linkages between sustainability determinants. Thus, this paper approaches the dimensions of sustainability as component parts of a complex system, whose functioning and evolution, including towards decarbonization, depend on the interdependence and interaction between its components and sub-components. A total of 4 dimensions of sustainability (economic, environment, social and technological) are defined and expressed by a total of 18 indicators extracted from the Eurostat database. The compliance of the indicators with the nature and content of each dimension of sustainability is validated by a confirmatory factor analysis (CFA). In-depth investigation of the direct, indirect and total interdependencies between the 4 dimensions of sustainability (expressed by 18 variables) is carried out through a network analysis based on estimation of Gaussian graphical models (GGMs). The GGM “has become increasingly popular in the social and behavioral sciences” [34] (p. 1) due to its “capacity to estimate complex patterns of relationships, and to reveal core features” [35] (p. 1) of the dependencies structure. The GGM goes beyond classical conditional dependence methods, both in its ability to investigate direct and indirect (mediated) dependencies between variables and in its technique of simultaneously displaying the estimated results in a network structure. Hence, GGM estimation enhances the originality of this paper.
This paper is structured in distinct sections covering the following issues: literature review (Section 2), materials and methodology employed in the research (Section 3), results obtained (Section 4) and discussion of the results (Section 5), followed by conclusions (Section 6).

2. Literature Review

Net-zero transition of the transport sector is an intensely debated issue among scholars, its achievement being appreciated as a growing challenge, in the context of increasing the need for mobility, its significant impact on economic development and the associated negative environmental consequences [29]. In fact, the gap between the importance of transport system development and its negative consequences is rapidly widening [36], with scholars working to identify solutions to limiting the environmental degradation and threat to human health. The concept of sustainable development, which emphasizes the need for balance between the well-being of the present generation and the basic needs of future generations, ref. [28] is the benchmark for assessing progress in this sector. As [23] noted, “a sustainable transport must reflect the various economic, social and environmental objectives in a balanced way” [23] (p. 4). The author approached these three dimensions “from a systemic perspective, in an attempt to identify elements of the sustainable development models, in transport service sector” [23] (p. 1). The dimensions of sustainability have been detailed in six focus areas, reflected by specific actions, according to their importance and positive/negative impact on economy/business, society and environment.
Ref. [3] analyzed the sustainability of EU rail transport by developing a set of indicators corresponding to the economic, environmental and social dimensions. The authors considered their model as a benchmark for monitoring the sustainability of railways, as the key indicators included correspond to the content of each dimension, and the results of the tests performed (Pearson correlation and data envelopment analysis—DEA) showed a “strong correlation between the indicators and their mutual impacts” [3] (p. 1).
A system of indicators to assess sustainability in transport was also proposed by [27]. The research focused on reviewing the literature in the field of urban and regional mobility, selecting the most relevant topic, intelligible and transparent indicators, and with the higher measurable thresholds corresponding to the socio-ecological dimensions of sustainability [27]. They have developed a “strong sustainability framework, by connecting the social and environmental thresholds for the transport sector” [27] (p. 1).
Transport sustainability across the 28 EU countries was assessed, by [22], through a composite index obtained from the aggregation of seven sub-indicators corresponding to the environmental dimension. The analysis carried out through DEA and the Benefit of the Doubt model covered the period 2015–2018 and showed an improvement in environmental performance by the end of the time frame (12 efficient units targeting 6 countries and their environmental performance in different years) [22].
Moving further in the assessment of transport sustainability, refs. [24,25,29] have proposed an extension of the classical dimensions (economic, social, environmental) by including additional categories related to political and spatial aspects of the transport system [29] and, in particular, urban freight transport [24,25]. The same approach was followed by [26] in assessing the sustainability of rail transport. They proposed an integrated performance assessment framework (PAF) by adding to the traditional dimensions new issue related to advanced technologies in transport. The results of the sensitivity analysis performed showed that the technological dimension was the most representative dimension of sustainability in rail transport [26].
For any number of sustainability dimensions taken under consideration, they “must be interconnected and combined to create a stable base” [25] (p. 253) in order to support the net-zero transition. Achieving the ambitious target of reducing transport emissions by 90% by 2050 [1] requires close monitoring of progress or deviations through key indicators and robust modeling. For a sustainable future in transport, it is “crucial to find all factors that are significant determinants of transportation sector emissions” [31] (p. 2). To assist such efforts, there are scholars who approach sustainability through its central point, i.e., emissions from transport modes, and look for solutions to reduce them. The same concept of sustainability is explored from a different perspective.
To support the achievement of the carbon neutrality SDGs, ref. [31] investigated the influence of six determinants (innovation; traffic on road, rail and air; infrastructure development; green taxes, R&D and trade globalization) on demand, transport emissions and greenhouse gas emissions (as dependent variables). Also, “the policy impact of innovation and taxes and renewables are estimated using their interactions” [31] (p. 1). The results of the analysis, based on panel corrected standard errors (PCSEs) and Granger causality, indicated that eco-innovations in transport contribute to reducing pollutant emissions, and traffic increases emissions by 17.5%, while green taxes limit them in the long term to 15.3% and 39.3% in the short term. The research was carried out at the EU25 level and covered the period 1994–2020 [31].
The research of [32] aimed to identify patterns and determinants of decreasing CO2 emissions for a sustainable European transport system. To this end, the scholars investigated the impact of GDP, environmental technologies and renewable energy on CO2 levels. The investigation was performed based on corrected standard error and feasible generalized least squares methods and showed “a significant and variable effect of environmental technologies and renewable energy on CO2 emissions in the EU transport sector, emphasizing the positive correlation between increased renewable energy adoption and emission reduction” [32] (p. 1). Additionally, the study promoted electric vehicles, hydrogen fuel cells, and biofuels as solutions for sustainable transport. On the contrary, ref. [33] found that technological investments have a statistically insignificant impact on CO2 emissions in the EU15 countries (1997–2015), while economic growth and energy consumption lead to an increase in emissions. Another observation of the study indicates that the level of urbanization of the EU countries also did not have a statistically significant influence on pollution from the transport sector [33].
Ref. [7] investigated the impact that key determinants of energy efficiency and decarbonization policies have on energy consumption in European road transport. Within the category of road transport sustainability determinants were included “GDP per capita, population growth, vehicles stock, fleet characteristics, travelled distance, passengers and tonne-kilometres, fuel price” [7] (p. 13). In particular, the research focused on how European transport decarbonization policies have affected the trend in energy consumption and emissions in this sector during the period 2000–2018. The results of the causality tests between variables and the decomposition analysis confirmed the role of increasing energy efficiency in reducing gas emissions from road transport. The scholars have concluded that “overall, the decreases of final energy consumption, and emissions intensity show that the already implemented policies have had an impact even if limited on road transport efficiency and transport overall sustainability” [7] (p. 24).
A summary of the key elements of the literature on which this paper is based and its original contribution to the broadening of knowledge is provided in Table 1.
Examining both areas of the literature has provided us with valuable insights that allow us to investigate the sustainability of European transport in a multifaceted manner, with a focus on the connectivity and interdependencies between variables assessed within decarbonization policies.

3. Materials and Methods

3.1. The Dimensions of Transport Sustainability Included in the Analysis

Summarizing the relevant literature, we can state that sustainability of the transport system has been approached, traditionally, through economic, environmental and social dimensions. The interaction and interdependencies between these three make it “possible to reach a compromise between economic efficiency, social equity and ecological sustainability” [25] (p. 252). We agree with this statement, but, similarly to [26], we aim to go beyond the traditional approach and investigate whether the behavior of the three dimensions, and hence overall sustainability, are also influenced by the state of technology. In fact, even the Brundtlands report (1987), considered the cornerstone of the classical dimensions, stipulates the concept of “new technology, which has the potential for mainspring of economic growth, but also entails high risks, including new forms of pollution” [28] (p. 13). Therefore, technology, as an important factor influencing economic development, rising social standards, but also environmental degradation, must be included in the analysis of sustainability. This is even more necessary in the case of the transport sector, which follows an unprecedented transition towards a “system for future generation” [1], during which technological progress sets the path towards net-zero destination [37].
Considering this background, this research proposes an analysis of transport sustainability in relation to four dimensions: economic, environmental, social and technological. We make the assumption that the four key dimensions are complementary and interconnected. To support this assumption, the literature [24] strongly suggests the existence of a substantial connection between the content of each dimension and the indicators used to express it. Closely related to the connectivity challenge, we have reviewed the definitions given for the sustainability dimensions [3,25,26,27,37] and identified the main content-related issues used in the construction of dimensions for sustainability in the transport sector (Figure 1).
In addition, assessing transport sustainability requires indicators that reflect “different impact, objectives and goals” [3] (p. 3) without omitting “their relative importance and mutual causality” [38] (p. 20).

3.2. Data

Taking into account the fundamental characteristics for the sustainability content-related indicators, together with the “most frequently used method” [24] (p. 3) of starting from previous research knowledge (indicators included in relevant studies), we proceeded to interrogate the Eurostat database in order to construct the sustainability dimensions used in this research. We developed a selection procedure (Figure 2) and applied it in the selection of representative indicators for the transport sustainability in the context of decarbonization policies adopted by the EU.
The Eurostat database, as the body responsible for official statistics of the EC, publishes indicators for five types of transport modes (air, inland waterway, rail, road, maritime-sea) covering aspects related to “infrastructure, transport equipment, investments and maintenance, traffic, transport measurements, and accidents” [39,40]. Given the close relationship between transport and the Sustainable Development Goals (SDGs) [21,31], statistical information on transport is also included in several SD indicators at the EU level: G7–G9, G11, G13, G15 [5,40]. Such a spread of transport indicators underlines the importance of the sector for the EU policy and objectives and supports our decision to extract information from this database in order to obtain a uniform dataset.
The final set of selected indicators, shown in Table 2, is organized into the four dimensions of transport sustainability included in the analysis, based on the conclusion drawn from the literature review (Figure 1).
Data availability was an important criterion in the indicator selection process. For this reason, the period included in the research was standardized to the range 2013–2022, corresponding to the information published by Eurostat. In addition, this timeframe is considered appropriate for the purpose of the present investigation to assess the sustainability of European transport in the context of the net-zero transition. The 18 indicators included in the final dataset represent the variables used in the analysis of European transport sustainability.

3.3. Methodology

In order to assess the sustainability of European transport in relation to its dimensions and the determinants of its progress, this research employs Gaussian graphical models (GGMs) as a particular technique of network analysis. To estimate the total, direct and indirect interdependencies between variables by GGM, we formulate the following scientific hypotheses:
H1: 
All four dimensions of sustainability (economic, environmental, social, technological) are adequately and robustly constructed (contain indicators appropriate to their nature and content).
H2: 
The dimensions of sustainability are complementary, interdependent and strongly interlinked in a meaningful model.
H3: 
The interactions/interdependencies developed between variables reflect the main directions set by decarbonization policies in the transport sector.
Confirmatory factor analysis (CFA) is employed to test the first hypothesis, while Hypotheses 2 and 3 are investigated by GGM estimation.
Confirmatory factor analysis (CFA) is a statistical method that examines the validity of the relationship between a latent variable and the indicators, or factors (observed variables), used in its construction [41]. In the current research, each of the four dimensions of sustainability represents a latent variable that has been defined by a number of observed variables (see Table 1). By using CFA, the degree of fit of the indicators (observed variables) with the content of the corresponding dimension, as they have been placed in each latent variable, will be analyzed. For this purpose, four criteria for testing the fit index [41,42] are mainly used: chi-square test (x2, df and p < 3.00); comparative fit index (CFI) > 0.90; root mean square error of approximation (RMSEA) < 0.1; parsimony normed fit index > 0.50.
The Gaussian graphical model (GGM) is an econometric method that integrates graphical and statistical modeling to identify complex structures of linkages between analyzed data. For this purpose, a GGM models the structure of correlations between a set of variables by estimating the regularized partial correlation between them and displays it as a graph network [43]. Within the network, the observed variables are considered nodes and the links between them are plotted by edges (in classical version, the blue edges indicate positive links and red edges indicate negative links). As the edges represent “the partial correlation left between two nodes after conditioning on all other nodes” [44] (p. 4), the network “maps out multicollinearity and predictive mediation, and allow one to model unique interactions between variables” [45] (p. 4). The GGM provides an intuitive visualization of the direct links between each pair of variables but also reveals indirect pathways of connections, or mediated connection, such as A is correlated with B and B is correlated with C, meaning that A is indirectly correlated with C, or the relationship is mediated by B [44,45]. Another advantage of the method derives from its capacity to organize the network based on the connectivity strength between nodes, thereby allowing robust results. This property of network analysis allows researchers the opportunity to analyze the dependencies between a set of variables “in a manner that other statistical approaches cannot provide” [35] (p. 303). In contrast to classical methods of conditional dependency of relationship analysis (Granger causality, Pannel analysis: corrected standard errors, random and fixed effects, ordinary last square) the GGM provides clear and valuable insights into the structure of dependencies, based on its capacity to explore the overall relationships between a set of items as parts of a “dynamic system that mutually influence and interact with one another” [34] (p. 2). From this perspective, the network structure consists of the estimated partial correlation between a pair of variables derived from the joint distribution of all variables, capturing conditional dependencies and implicit mutual association, which is different and above traditional methods [45]. These advantages have led to a wide use of the method in the social sciences [43,44,45] and implicitly in addressing sustainability issues [46].
An important limitation of the method is represented by its dependence on the normal distribution of the variables, to which are added the difficulties in estimating the correlation coefficient matrix and interpreting the displayed networks in the case of datasets with a large number of variables [45].
Both methods, CFA and GGM, were performed using Jeffreys’ Amazing Statistics Program (JASP) version 0.18.30. JASP is an easy-to-use [43,44], open-source statistical program that relies on R bootnet (version 1.5.5) and qgraph (version 0.3.0.2) packages for performing network analysis and, particularly, Gaussian graphical models [47].

4. Results

The first important aspects to reveal concern the descriptive statistics, which give us an overview of the mean, the standard deviation and the distribution of the 18 variables through the skewness and kurtosis coefficients (Table 3).
Based on these 18 variables, we construct the 4 dimensions of sustainability, i.e., economic, environmental, social and technological, to investigate the progress made by the European transport sector in the context of the transport decarbonization policy adopted at EU level.
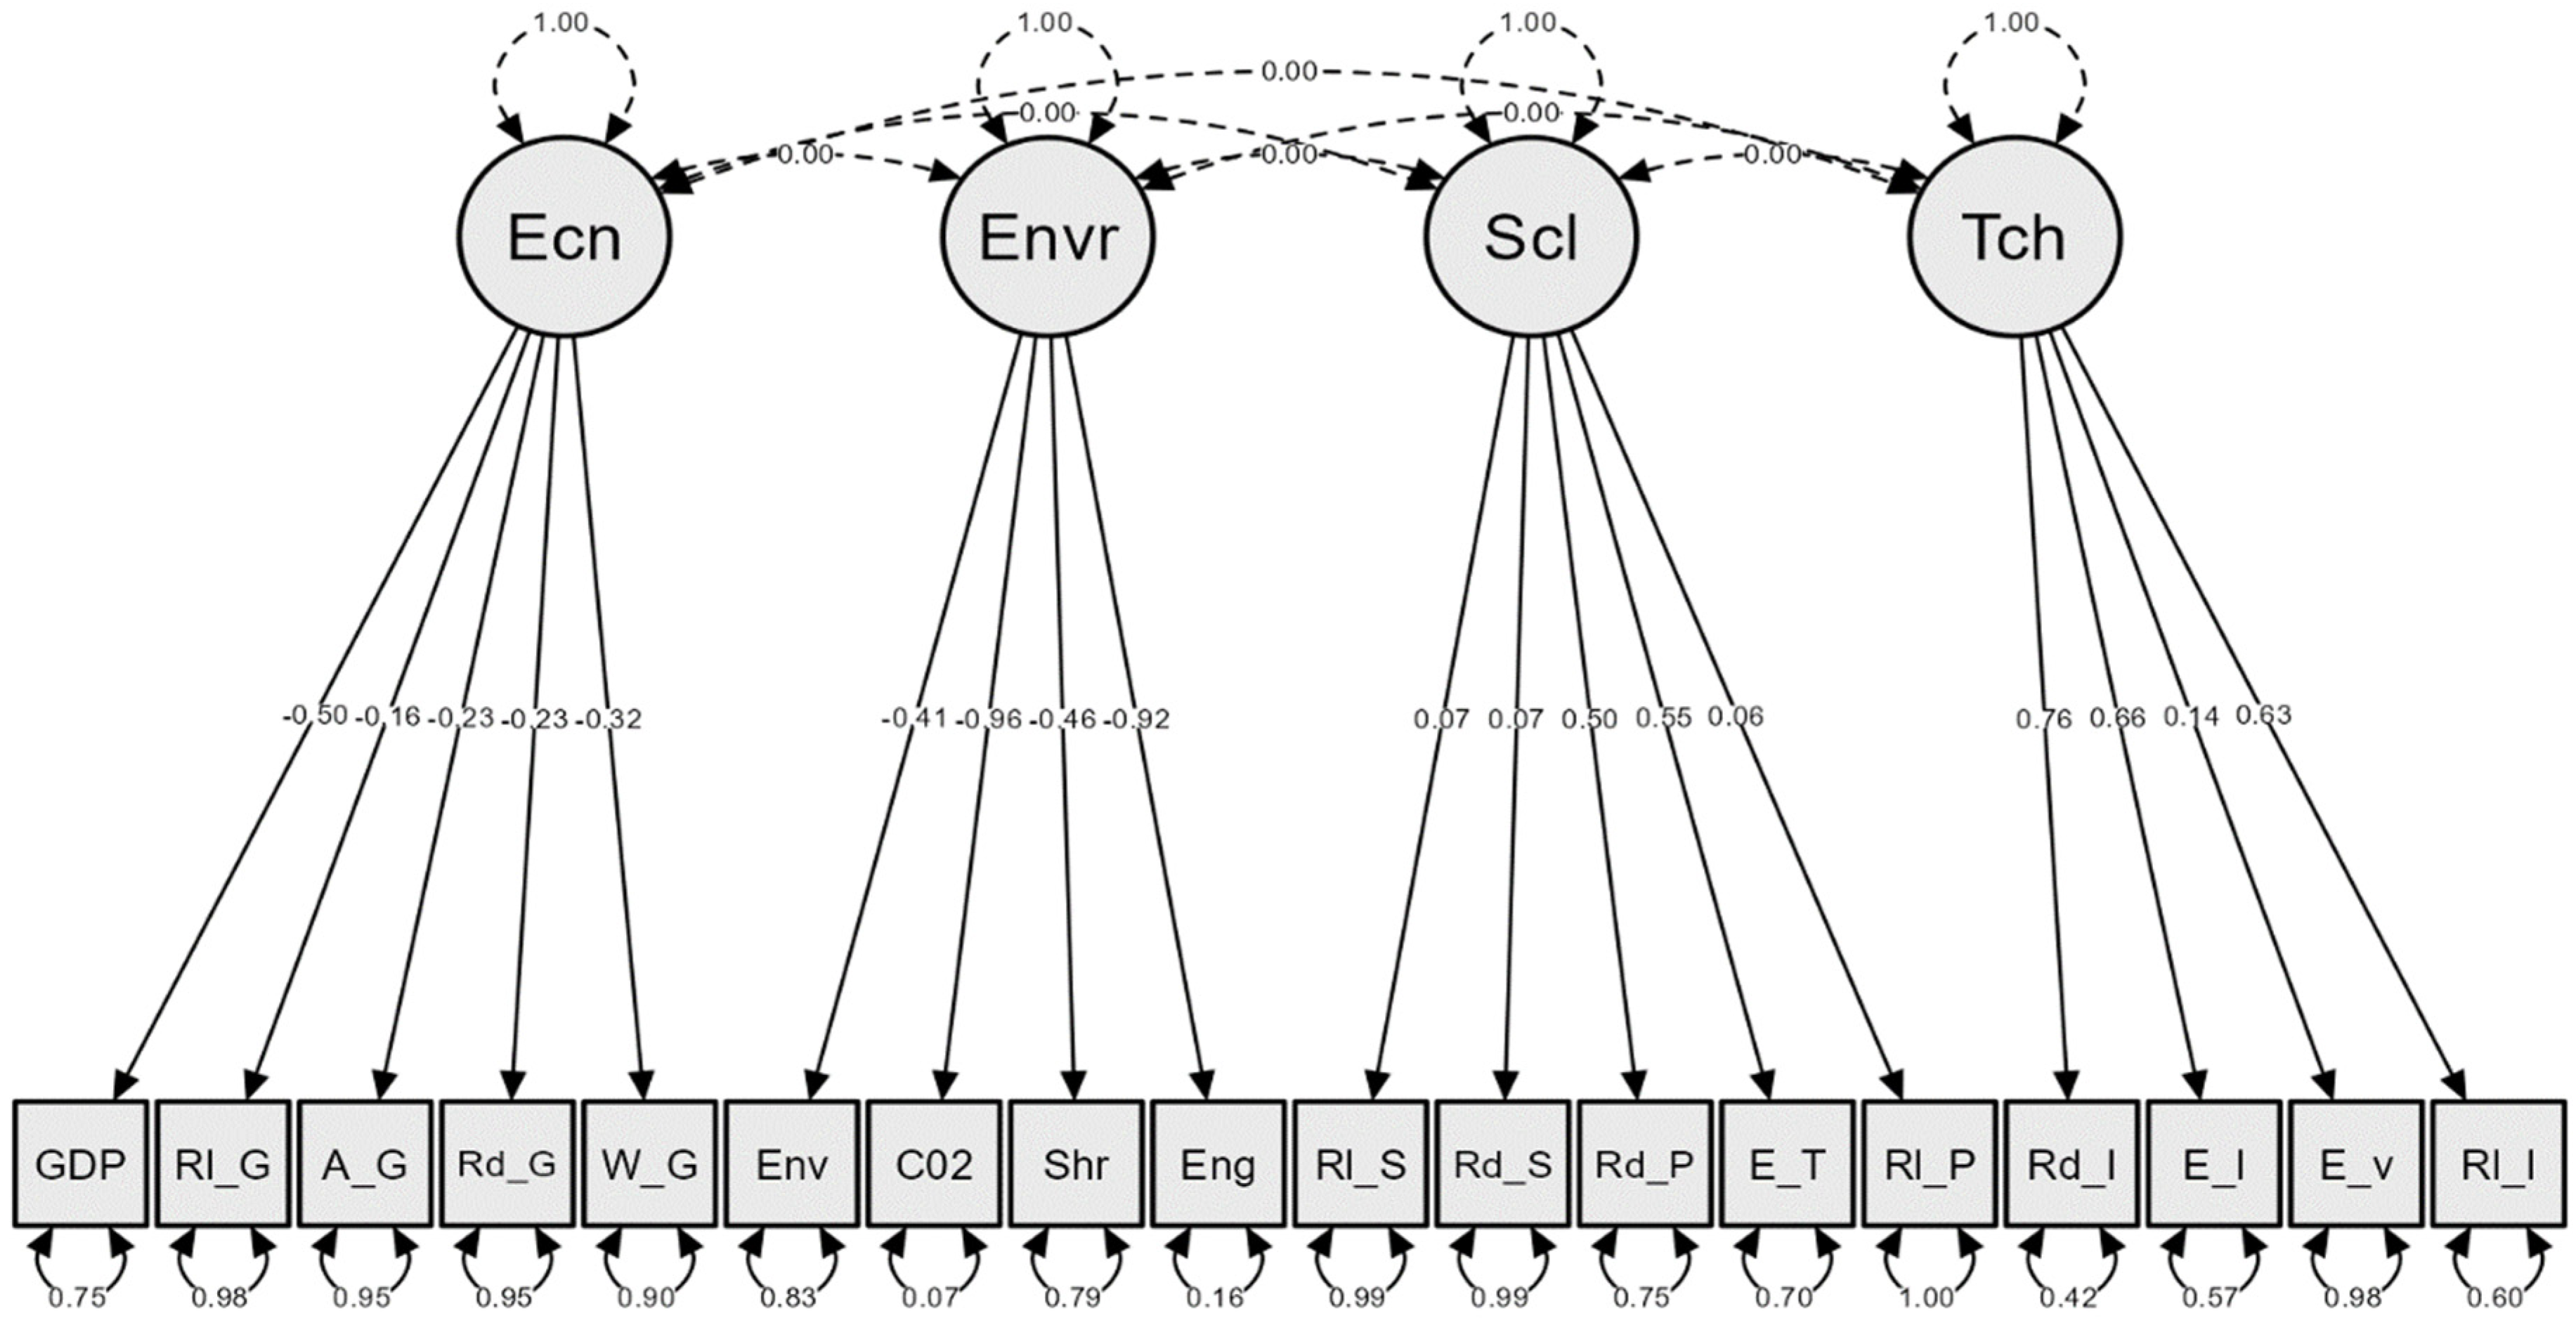
The interconnectivity, or closeness, between the observed variables and the content of the sustainability dimensions (latent variables) to which they have been assigned (see Table 3) is controlled by confirmatory factor analysis (CFA). The outputs of the CFA (Table 4 and Figure 3) support the developed sustainability dimensions with a small adjustment, in terms of moving one variable between two dimensions. The data centralized in Table 4 show an improvement in the fit indices of the sustainability dimensions as a result of moving the E_T variable from the economic dimension to the social dimension.
The values of the fit tests (Table 4) and the additional standardized parameters displayed in the model plot (Figure 3) confirm study hypothesis number 1. We note that the CFA method indicates a better placement of the percentage of transport expenditure in total household expenditure (E_T) in the social category than in the economic one, as in the base model, where it was originally integrated. The components of the four dimensions of sustainability, obtained from the CFA application, are shown in the following Figure.
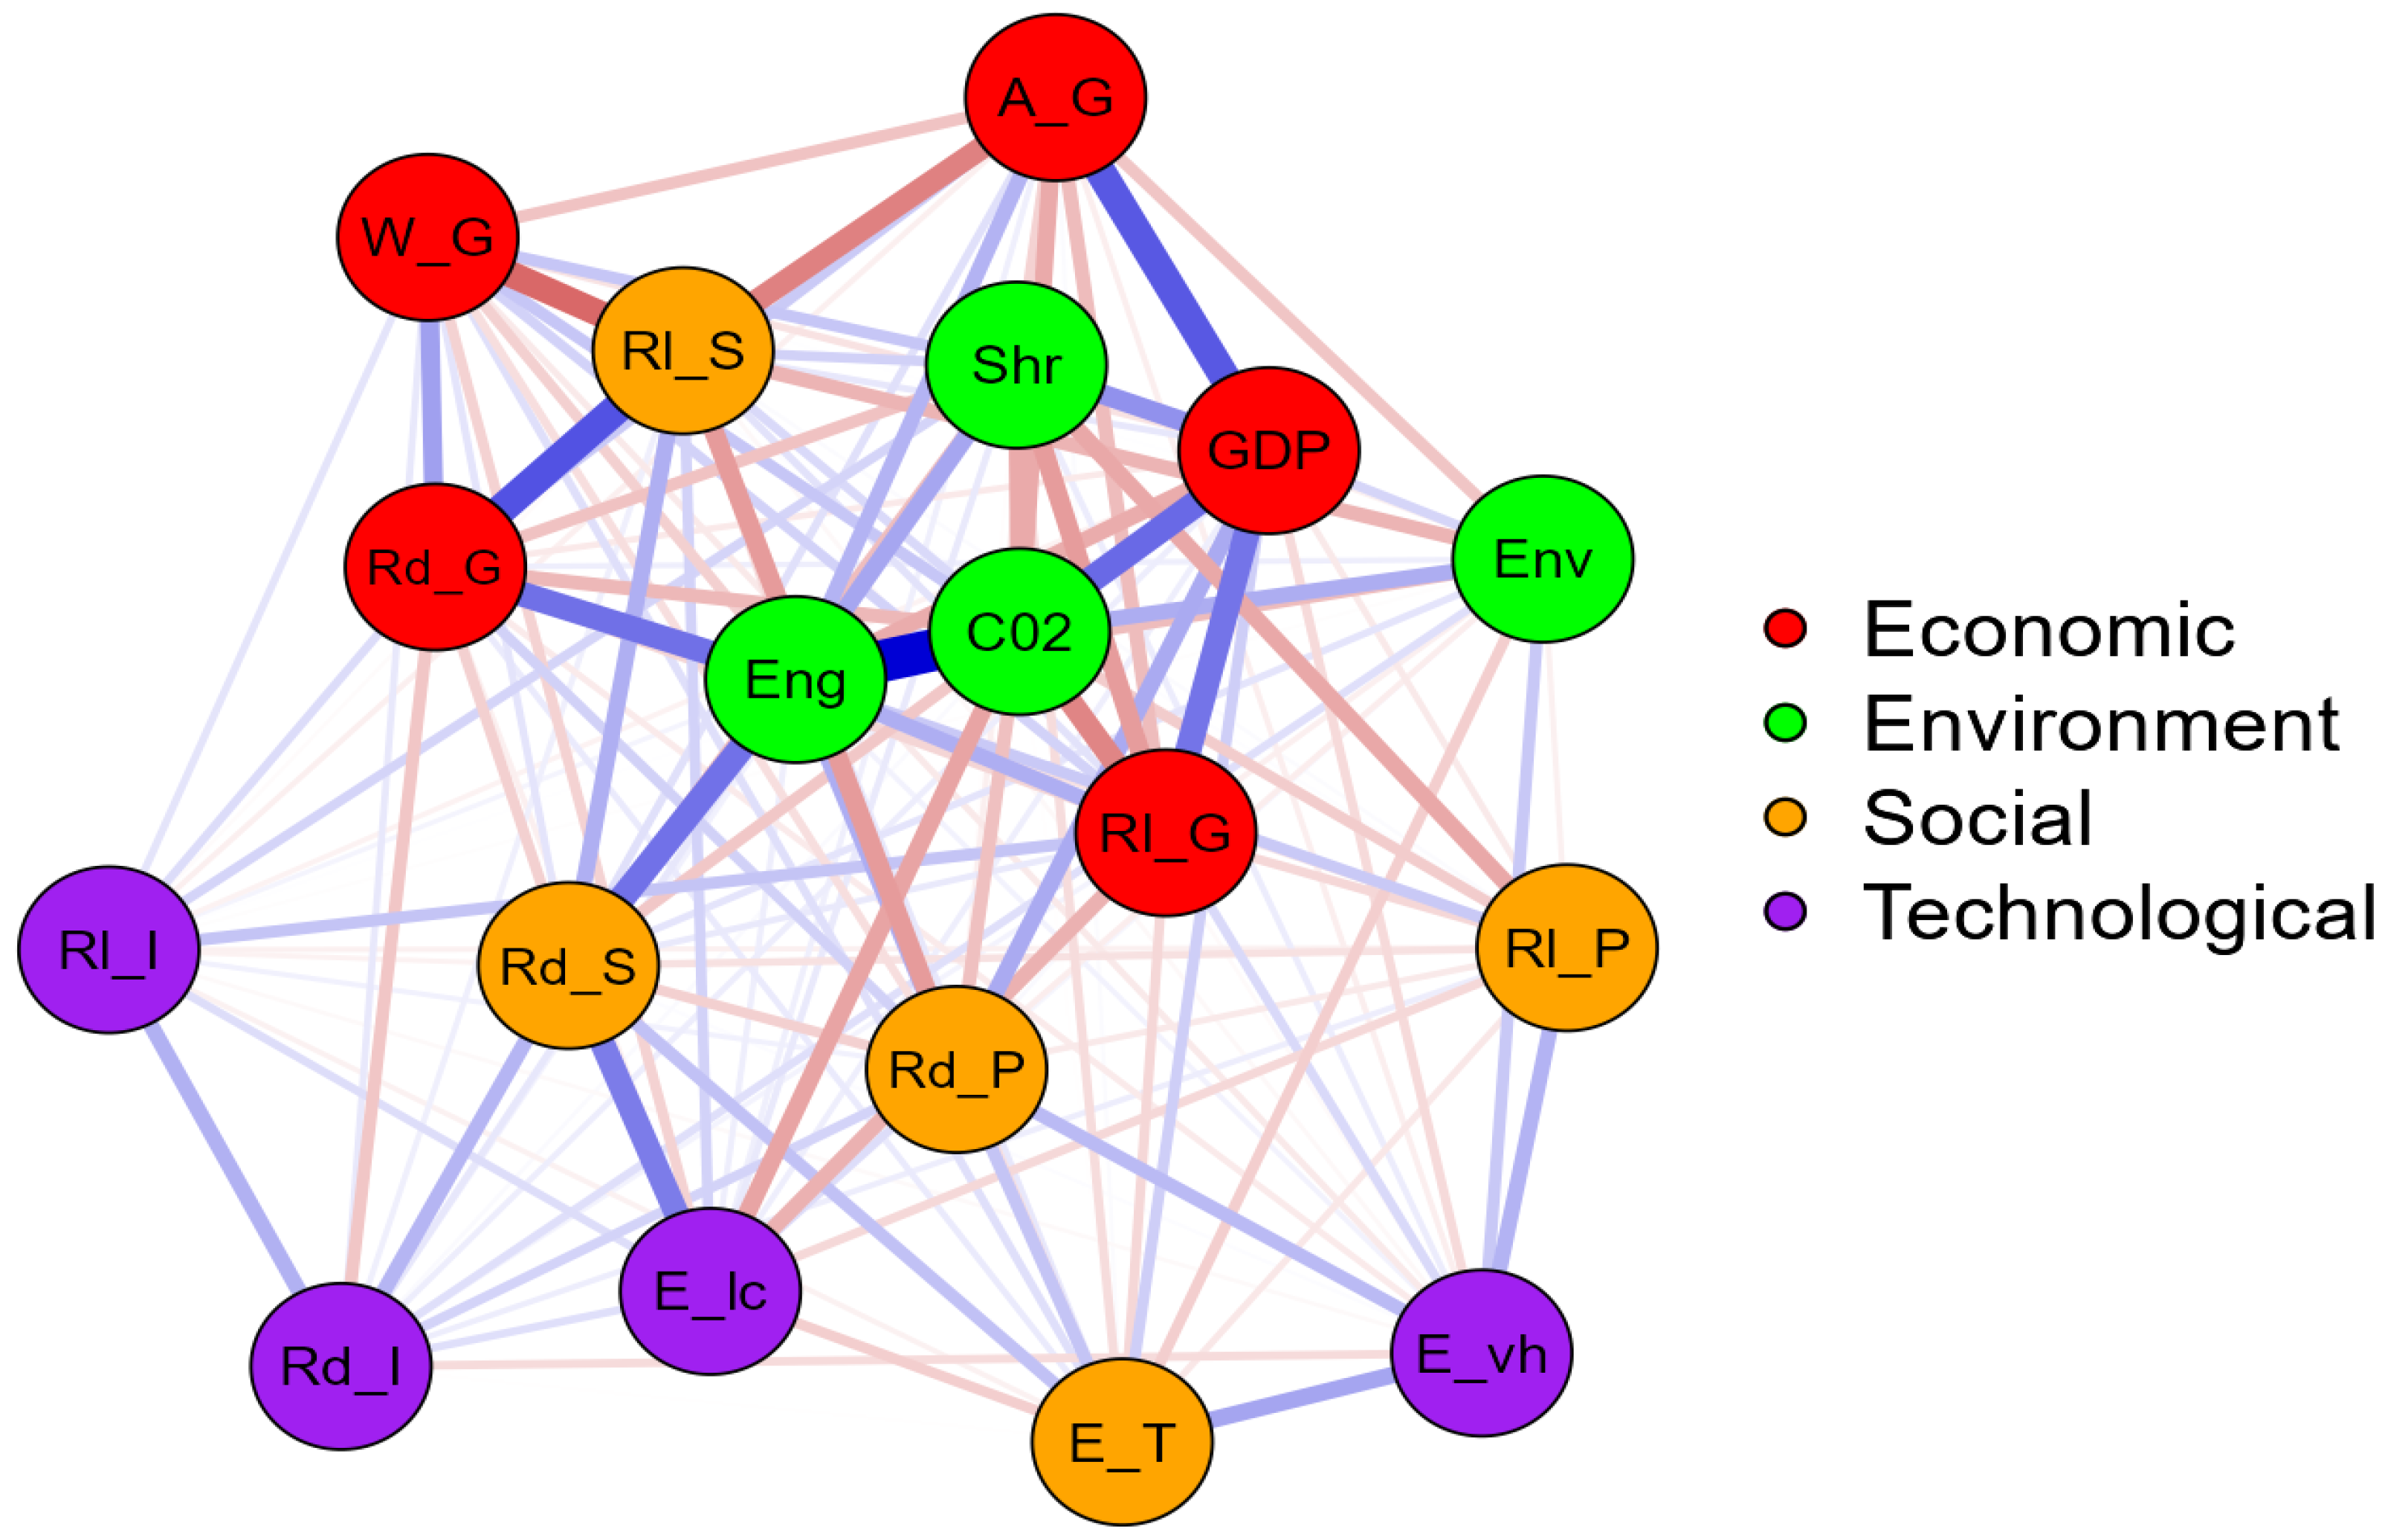
Based on these results, we proceeded to the network analysis by estimating Gaussian graphical models (GGMs) in order to capture in detail the behavior of the four dimensions considered (economic, environmental, social and technological) of the transport sustainability in terms of connectivity, intensity and interdependencies between specific variables. For this purpose, the 18 variables are considered as nodes of the network, the analysis consisting mainly of estimating, in the form of partial correlation coefficients (Appendix A), all the interdependencies established between nodes and representing them simultaneously as a network (Figure 4).
In the network structure of the GGM (Figure 4), the positive links between variables are drawn in blue edges and the negative links in red edges. Also, the strong, or statistically significant, relationships between two variables are graphically represented by thicker edges and displayed in the main plane; meanwhile weak, or statistically insignificant, relationships are represented by thinner edges between nodes and displayed in the secondary plane of the network.
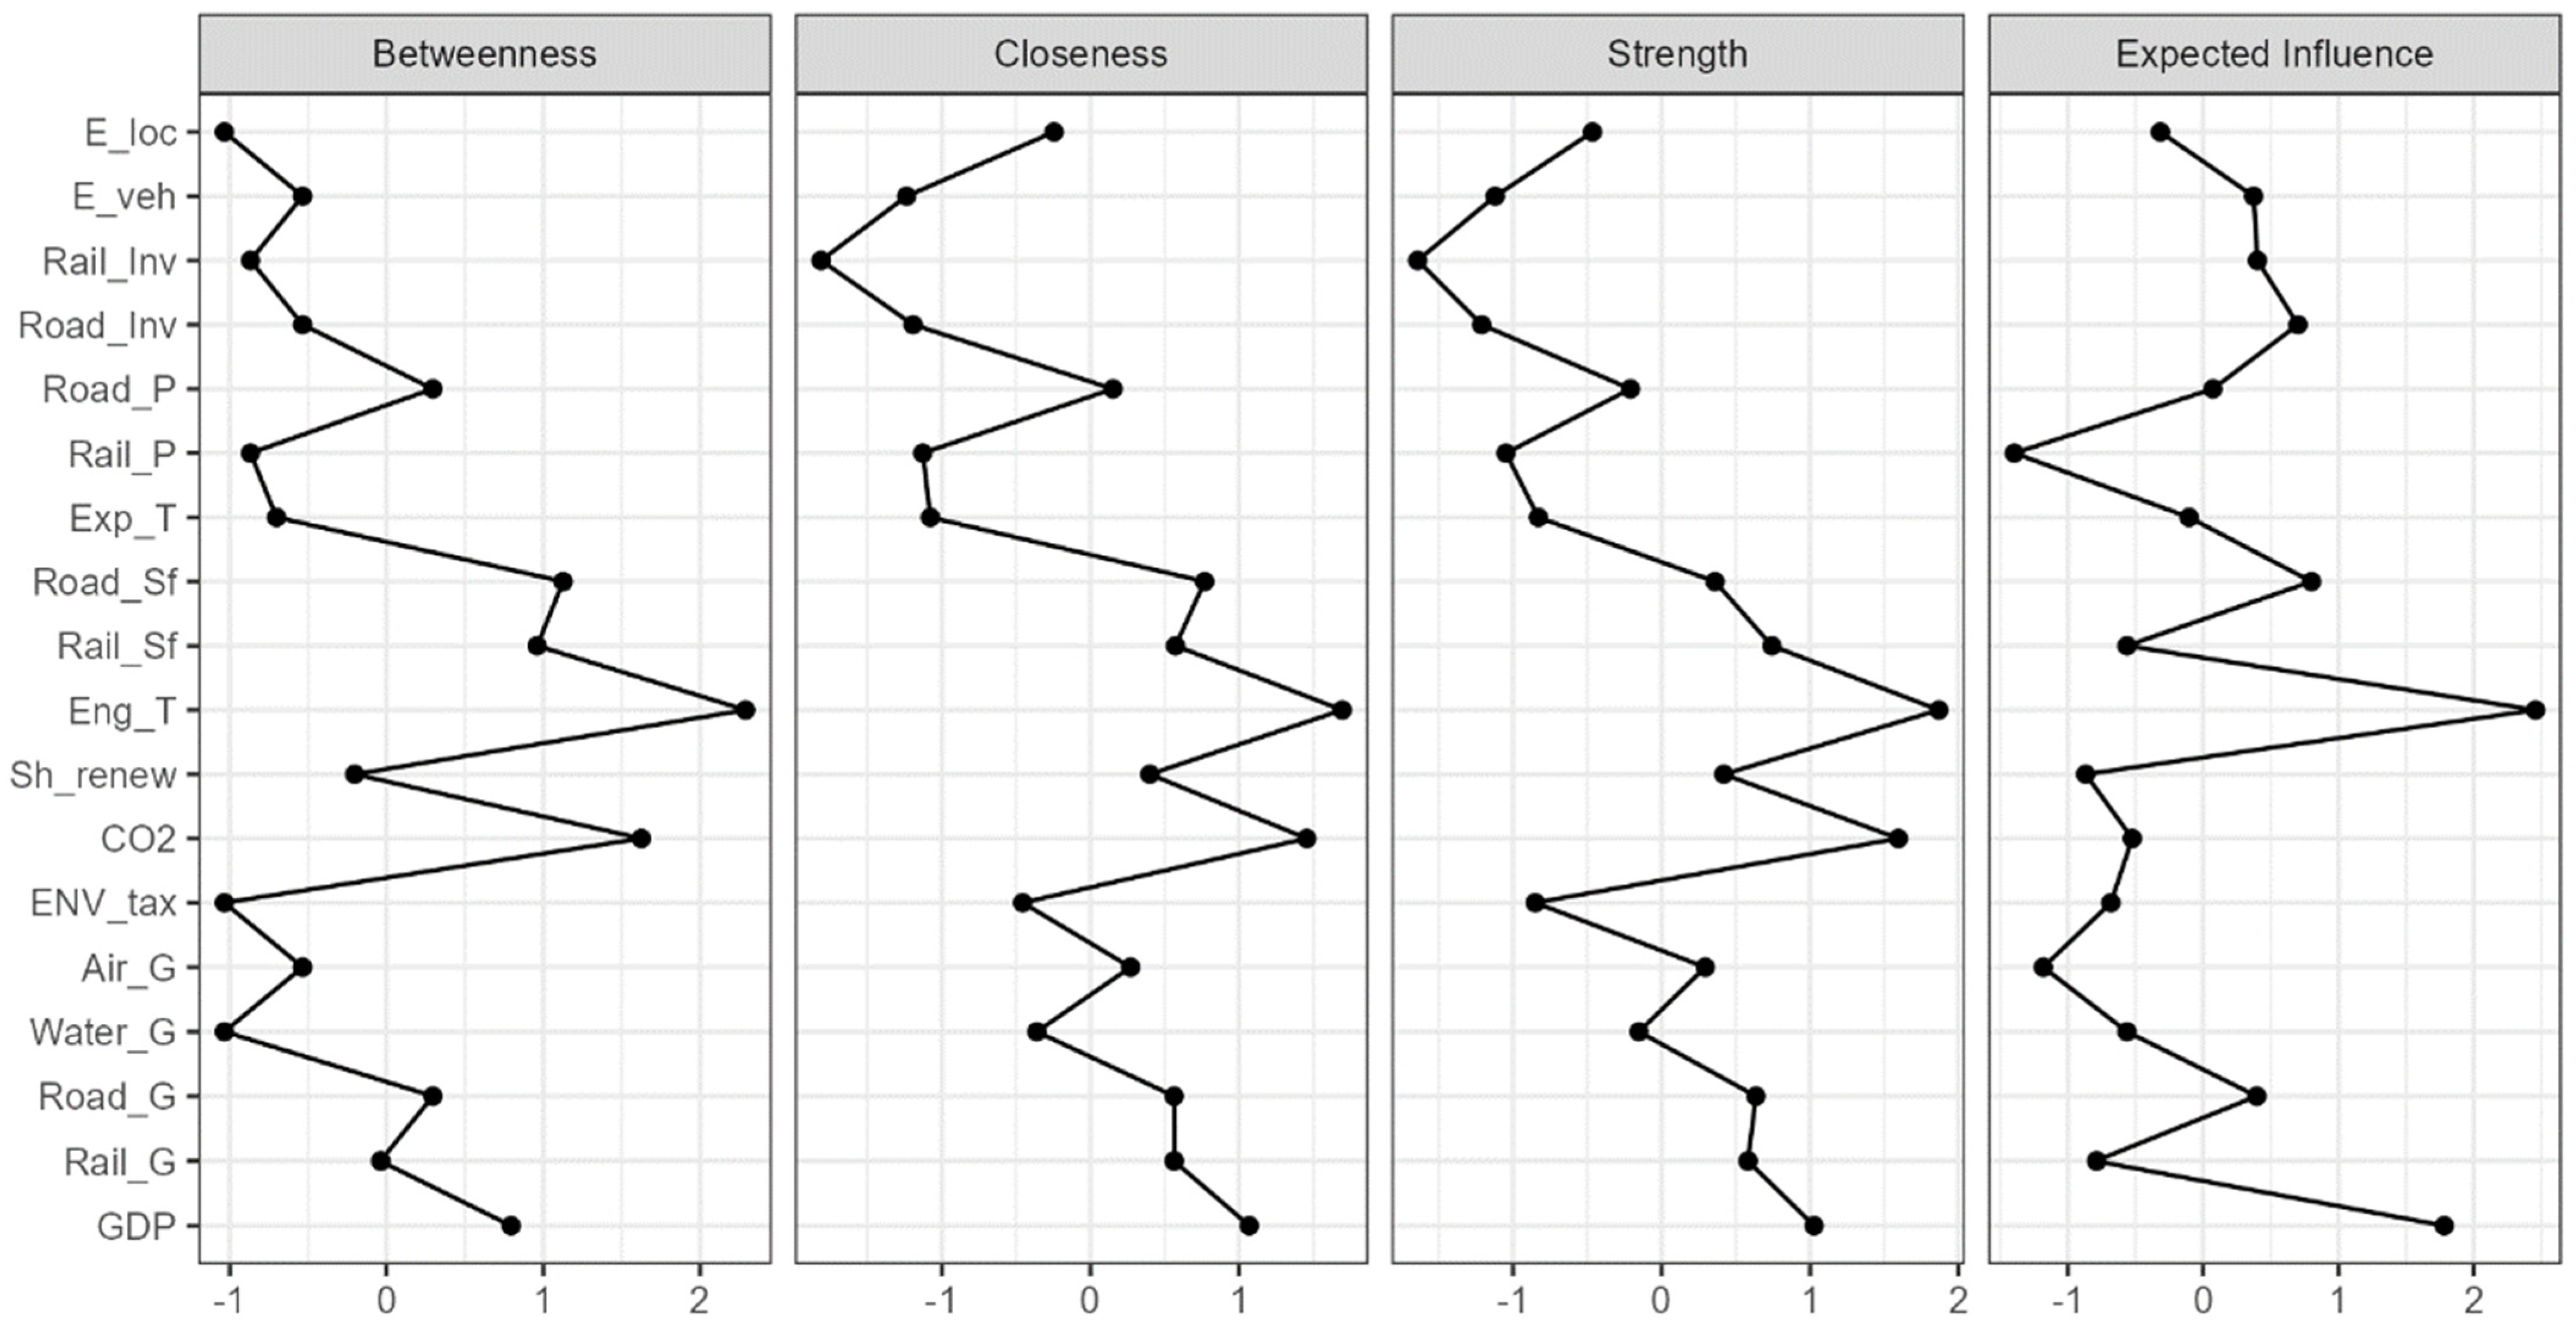
The distribution and positioning of the 18 variables analyzed within the network provide us with relevant information about their power of connection and, implicitly, of influencing the evolution of the sustainability of the European transport system. The more central a variable is in the network, the more important it is in the context of the transition to a green transport system. In this respect, the centrality of the environmental dimension (through the variables Eng, CO2 and Shr), the economic dimension (through Rl_G, and, to a smaller degree, through GDP and Rd_G) and the social dimension (through the variables Rd_P, Rd_S and Rl_S) are clearly distinguished in the network structure and supported by the centrality plot (Appendix B). These positions confirm the importance of the three classical dimensions of sustainability and also the practical connection between them.
The fourth dimension proposed by the present research for transport sustainability, namely the technological dimension, is positioned towards the network extremity through all its four variables (Rl_I, Rd_I, E_vh and E_lc), a position corresponding to a rather low power of influence. However, considering that the technological efforts and therefore the stock of low-emission transport equipment are at an early stage, their position is appreciated as normal. In addition, the location of the technology dimension variables in proximity to the social dimension, especially to the E_T variable, draws attention to the fact that the affordability of new technologies is an important factor in increasing their influence and hence the success of decarbonization policies.
The links between variables and their implications, in the context of the transition to climate neutrality, are analyzed from the center of the network towards the extremities, in relation to the intensity of direct and indirect connections.
In the center of the network structure (Figure 4), the intensity of the linkage between the Eng–CO2 variables stands out. The positive relationship between them indicates that energy consumption from fossil sources (Eng) is the main determinant of CO2 emissions in transport. The second determinant of CO2 increase is economic growth (positive GDP–CO2 link suggesting that any increase in economic welfare at the MS level entails negative consequences on air quality). At the same time, there is also a factor with a negative, or inverse, influence on CO2 levels, namely the share of renewable energy in total transport energy consumption (Shr). The negative CO2–Shr link confirms the direction of the Renewable Energy Directive and the Energy Efficiency Directive, with favorable implications for the intensification of efforts to use green energy in transport.
Further, the variables in the vicinity of the grid center are mainly identified as direct drivers of energy consumption (Rl_G, Rd_P, Rd_S, Rd_G, Rl_S) and indirect drivers of CO2 emissions, but each link must be analyzed in relation to each of its implications.
Thus, the transport of goods by rail (Rl_G) develops a negative relationship with CO2 (Rl_G-CO2), identifying itself as a cleaner mode of transport, but we can appreciate that its contribution to limiting pollution is currently low. We argue this assertion by the fact that it is still based on fossil energy consumption (positive link Eng-Rl_G) and, implicitly, by the practical discrepancy between electrified rail infrastructure capacity and energy from renewable sources, as the negative statistical link with Shr (Rl_G–Shr) suggests. Moreover, the positive link between Rl_G–GDP, generated by the fact that any economic growth implies an increase in the volume of goods (million ton-kilometers) transported, confirms that rail freight transport is still an indirect driver of CO2 growth (its impact being mediated by Eng and GDP). Despite the low progress observed for the period 2013–2022, it should be noted that rail freight transport plays a central role in the greening of the transport sector. However, efforts are needed in order to increase renewable energy technologies and infrastructure. The same cannot be said, however, for rail passenger transport (Rl_P), which is a variable at the periphery of the network and has developed statistically weak dependencies.
Passenger transport on the road (Rd_P), by cumulating transport by cars, motorcycles, buses and trolleybuses, suggests that for a more environmentally friendly mobility, the number of passengers transported simultaneously per kilometer of road should be increased. In other words, public transport is a sustainable mode, with the potential to reduce fossil fuel consumption (Rd_P–Eng negative link) and thus CO2 pollution (Rd_P–CO2 negative link, but with lower statistical significance). At the same time, the sustainability of road passenger transport depends, as indicated by the direct relationships developed in the network, also on the living standards of the population quantified by GDP per capita (Rd_P–GDP positive link) and, implicitly, on the availability to allocate a higher share of transport expenditure in total household expenditure (Rd_P–E_T positive link) but also on the accessibility of new clean technologies (Rd_P–E_vh positive link and Rd_P–E_lc negative link). Judging from these statistical links, it can be appreciated that decarbonization of road transport remains a major challenge for policy makers due to its strong connection with the social aspects and the implications for social status and the right to free mobility. At present, zero-emission vehicles have a low impact on this mode of transport, which is supported by their position at the end of the network and the fact that their CO2 impact is mediated by the variable Rd_P.
Road safety (Rd_S) develops two strong positive relationships in the network: (1) with energy consumption (Rd_S–Eng), suggesting that safer vehicles are also high energy consumers, with indirect implications on CO2 emissions (Rd_S–Eng–CO2, the impact on pollution is mediated by its dependence on fossil fuels); and (2) a link with electric locomotives (Rd_S–E_lc) suggesting that a shift of traffic to rail will lead to an increase in road safety and indirectly to a reduction in CO2 emissions (negative link E_Lc–CO2). Two other positive links can be noted, but with lower statistical significance: the direct association of traffic safety with investments and road maintenance works (Rd_S–Ed_I); and with rail safety (Rd_S–Rl_S) as a reconfirmation of the need to move part of the passenger traffic to rail.
The transport of goods by road (Rd_G) is positively related to the central variable Eng concerning energy consumption from fossil fuels (Ed_G–Eng), a dependency that is an indirect factor on the increase in CO2 emissions (Ed_G–Env–CO2); and there are positive links with the variables on rail safety (Rd_G–Rl_S) and on maritime freight transport (Rd_G–W_G) both pointing to rail transport (Rl_S) as a mediating point towards a reduction in fossil fuel consumption (Rl_S–Eng negative link).
Variables at the extremes of the GGM structure are of low importance in the network context and therefore develop weak relationships from a statistical point of view. A single boundary variable develops more statistically significant relationships. This is the air freight variable which develops a positive link with GDP (A_G–GDP) and a negative link with rail safety (A_G–Rl_S).
We consider that these statistical links confirm, through the dependencies captured between the dimensions and variables (determinants of sustainability), the strong dependence on fossil fuels, doubled by the complexity of the system and its social and economic ambivalence. In some cases, there is a slight framing of these determinants in the direction set by the decarbonization policies for European transport as a validation of the future efforts.

5. Discussion

Meeting the European climate targets depends only on “the ability to make the transport system as a whole more sustainable” [20] (p. 1). To address transport sustainability as a whole, it is useful to have a deeper image of the interdependence between its dimensions and, moreover, to understand the relationships between its relevant sub-components. Even if the components that make up the whole can form a complex system [48], there is a need for research to capture the overall dependencies of the sustainability determinants; there is a need to “understand the relationship between the parts, the way that parts move, what drives the behaviour of the parts” [23] (p. 2). The GGM estimated in this paper allowed such an analysis by simultaneous visualization of total, direct and indirect interdependencies established between the components of the economic, environmental, social and technological dimensions of transport sustainability. The findings not only characterize the state of European transport sustainability but also provide insights into its determinants in relation to decarbonization policies. The relevance of the conclusions drawn is furthermore supported by the results of the CFA test for the development robustness of the four dimensions of sustainability.
The first observation from the overall GGM network analysis is that the variables related to the four dimensions of sustainability do not show a strong clustering tendency. They are distributed in the network in a slightly independent way, determined by their importance and relevance to the topic (the degree of centralization) and the intensity of the links between variables. Such behavior confirms that the analyzed dimensions are independent but also complementary. Complementarity and strong interdependencies were formed, especially between the classical dimensions: economic, environmental and social. These results confirm not only study hypothesis number two but, implicitly, the fact that the transport sector “is a key factor in the European economy” [22] (p. 2) and society, “both in terms of fostering human connectivity as well as acting as a source of significant ecological impact” [27] (p. 2).
The centrality and strong positive link between the variables Eng and CO2 confirm the findings of many previous studies [7,21,33] that, due to its high dependence on fossil energy consumption, transport is a major polluter, as CO2 is the main component of the greenhouse gases causing global warming [49]. Similar to [7], it was observed that road transport is the largest energy consumer and an important determinant of the level of CO2 emissions (through variables related to transport of goods and passenger safety on the road). In addition to the measures taken to increase the standards regarding vehicle pollution [13], more specific attention should be given to the green energy vehicles transition. The current stock of electric vehicles does not play an important role in the network and, therefore, neither in decarbonization. It is particularly important to note that this variable (E_vh) is at the very end of the network and is closely related to the social variable E_T, which reflects the share of transport expenditure in total household expenditure. The positive relationship between these two variables clearly suggests that the new technology needs to be accessible to the broad mass of the population in order to have an impact on reducing transport pollution. Therefore, contrary to the findings of studies [31,32], electric vehicles must be not only efficient technologies but also affordable to cut pollution in the sector. Solving these problems raises difficulties both for car manufacturers (in terms of innovation and production costs) and for the implementation of the clean vehicles directive, which stipulates that the MS will not allow the sale of fossil-fuel-consuming cars from 2035 [13]. Addressing such challenges related to the affordability of clean vehicles, together with gradually limiting the sale of polluting vehicles until 2035, are seen as important directions for future research. To this end, it is necessary to identify appropriate measures to quantify the opportunities and efforts of electrical vehicles manufacturers (such as legislative support, cost structure, R&D expenditure, raw material logistics), consumer behavior (preferences/limits related to price, facilities, access to charging infrastructure), public investment for infrastructure development and pollution taxes. Due to data availability limitations, this paper did not consider variables related to these issues, but they may be included in future investigations aimed at expanding decarbonization pathways. Even in the context of this research limitation, the estimated interdependencies between the analyzed variables represent a robust review of the sustainability of European transport over the period 2013–2022 and a starting point for both researchers and policy makers in their future actions on green transition.
Further, unlike [31], these findings do not support a significant influence of environmental taxes or infrastructure investments on the sustainability of transport modes. However, the results are in strong agreement with previous conclusions regarding the importance of increasing renewable energy for accelerating the transport transition towards climate neutrality [7,32,33], as well as the positive impact of GDP on increasing transport emissions [7,33]. Summarizing all the observed findings based on the interdependencies between variables, hypothesis number 3 of our study is partially confirmed.

6. Conclusions

The transition to clean mobility is a difficult but important process for the future of European societies and economies. The multifaceted approach undertaken in this paper, in terms of connectivity, interdependencies and behavior, of transport sustainability provides both researchers and policy makers with an important perspective and a useful basis for managing the complex information involved in the decarbonization process. The findings support the still very high dependence of transport on fossil fuels, which keeps this sector among the major polluters in the EU. Moreover, this dependence also contributes to the negative resilience of transport to decarbonization policies. Despite a steady increase in vehicle emission standards, additional taxation of pollution and efforts to increase the use of green energy in powering transport vehicles, and thus in the development of electric vehicles, progress over the period 2013–2022 is slow. The impact of decarbonization policies is visible in the behavior of the variables analyzed, but in a random and not consistent way. Although the EU’s aim is for these policies to act simultaneously on the determinants of transport pollution, the visible effect has been isolated, implying a reinforcement of future efforts. The analysis of the GGM structure shows that many aspects need to be improved, in particular the development of the technologies needed for such a transition and the related infrastructure. Even if the interdependencies developed in the network do not support important changes in the transition towards clean mobility, the complementarity and the distribution of the variables analyzed contain key information about the socio-economic aspects that need to be taken into account in the implementation of decarbonization policies.
The simultaneous analysis and the display in a suggestive and easy-to-understand manner of all the interdependencies between the dimensions of European transport sustainability, provided by the GGM network estimation, is a major contribution of this paper through the originality and information provided. It extends the knowledge in the field while reinforcing the conclusions of previous studies on the harmful dependence of transport on fossil fuels [7,21,33] and contradicting the results [31,32] on the significant positive impact of electric vehicles, environmental taxes or infrastructure investments on reducing CO2 emissions from transport.
In addition to the new approach of sustainability through the GGM network estimation, it is worth mentioning the first part of the research aimed at building the dimensions of European transport sustainability and validating, through CFA, the consistency of the chosen indicators with the economic, environmental, social and technological content used in the analysis. However, in spite of these scientific contributions, this paper also has certain limitations. One of the most important is determined by the availability of data, the research being limited to the 18 indicators due to the lack of data availability. The 10-year period included in the analysis can be considered a limit, but the 2013–2022 period concentrates the impact of policies adopted in the context of the Green Deal and European climate neutrality.
Nevertheless, the research represents a starting point for future studies, which can extend both the timeframe and the number of indicators analyzed. Moreover, the relevance of the indicators for transport sustainability and their interdependencies can be further investigated by integrating other techniques and methods alongside those used here.

Author Contributions

M.S.: conceptualization, methodology, software, validation, formal analysis, investigation, resources, data curation, writing—original draft preparation, visualization, supervision, project administration. D.C.: conceptualization, validation, formal analysis, writing—review and editing. V.B.: visualization, writing—review and editing, validation. C.M.B.: supervision. All authors have read and agreed to the published version of the manuscript.

Funding

This research received no external funding.

Data Availability Statement

Data will be made available on request.

Acknowledgments

This work was carried out within and with the support of the Centre for Interdisciplinary Research in Economic and Social Sciences, INCESA (Research Hub for Applied Sciences), University of Craiova.

Conflicts of Interest

The authors declare no conflicts of interest.

Appendix A

Table A1. Weights matrix.
VariablesNetwork
GDPRl_GRd_GW_GA_GEnvCO2ShrEngRl_SRd_SE_TRl_PRd_PRd_IRl_IE_vhE_lc
GDP0.0000.438−0.069−0.0910.5280.1340.4730.349−0.2630.074−0.1770.155−0.0120.2680.058−0.042−0.1180.055
Rl_G0.4380.000−0.1330.142−0.213−0.051−0.385−0.3140.2580.0900.070−0.127−0.1260.0170.0370.1870.121−0.247
Rd_G−0.069−0.1330.0000.3010.1670.054−0.225−0.1920.4520.547−0.1480.066−0.0920.144−0.1810.109−0.068−0.050
W_G−0.0910.1420.3010.000−0.1890.0040.1800.181−0.149−0.4760.0850.1020.007−0.1050.0720.087−0.070−0.143
A_G0.528−0.2130.167−0.1890.000−0.183−0.269−0.1420.240−0.3980.0970.012−0.069−0.052−0.019−0.051−0.0530.051
Env0.134−0.0510.0540.004−0.1830.0000.259−0.048−0.210−0.2370.085−0.154−0.048−0.0570.103−0.0070.1730.031
CO20.473−0.385−0.2250.180−0.2690.2590.000−0.2690.8060.120−0.074−0.004−0.162−0.1980.0170.003−0.015−0.287
Shr0.349−0.314−0.1920.181−0.142−0.048−0.2690.0000.2820.144−0.208−0.111−0.275−0.0060.0430.1350.0610.070
Eng−0.2630.2580.452−0.1490.240−0.2100.8060.2820.000−0.1110.450−0.1050.1720.2580.0770.0340.0410.055
Rl_S0.0740.0900.547−0.476−0.398−0.2370.1200.144−0.1110.0000.2530.0760.013−0.3160.052−0.012−0.0230.141
Rd_S−0.1770.070−0.1480.0850.0970.085−0.074−0.2080.4500.2530.0000.195−0.095−0.1500.233−0.0420.0100.413
E_T0.155−0.1270.0660.1020.012−0.154−0.004−0.111−0.1050.0760.1950.000−0.0750.185−0.004−0.0450.283−0.154
Rl_P−0.012−0.126−0.0920.007−0.069−0.048−0.162−0.2750.1720.013−0.095−0.0750.000−0.0710.057−0.0470.239−0.123
Rd_P0.2680.0170.144−0.105−0.052−0.057−0.198−0.0060.258−0.316−0.1500.185−0.0710.0000.1400.0440.2190.109
Rd_I0.0580.037−0.1810.072−0.0190.1030.0170.0430.0770.0520.233−0.0040.0570.1400.0000.247−0.1140.102
Rl_I−0.0420.1870.1090.087−0.051−0.0070.0030.1350.034−0.012−0.042−0.045−0.0470.0440.2470.000−0.0200.107
E_vh−0.1180.121−0.068−0.070−0.0530.173−0.0150.0610.041−0.0230.0100.2830.2390.219−0.114−0.0200.000−8.867
E_lc0.055−0.247−0.050−0.1430.0510.031−0.2870.0700.0550.1410.413−0.154−0.1230.1090.1020.107−8.867 0.000

Appendix B

Figure A1. Centrality plot.
Energies 17 02645 g0a1

References

  1. European Commission. Sustainable & Smart Mobility Strategy, Factsheet-The Transport and Mobility Sector, PDF ISBN 978-92-76-27370-7. 2020. Available online: https://ec.europa.eu/commission/presscorner/api/files/attachment/867229/Factsheet%20-%20The%20Transport%20and%20Mobility%20Sector.pdf.pdf (accessed on 4 March 2024).
  2. European Environmental Agency Database. Available online: https://www.eea.europa.eu/en/analysis/indicators/greenhouse-gas-emission-intensity-of (accessed on 4 March 2024).
  3. Djordjević, B.; Mane, A.S.; Krmac, E. Analysis of dependency and importance of key indicators for railway sustainability monitoring: A new integrated approach with DEA and Pearson correlation. Res. Transp. Bus. Manag. 2021, 41, 100650. [Google Scholar] [CrossRef]
  4. European Commission. Press Release Brussels, 9 October 2023, Commission Welcomes Completion of Key ‘Fit for 55’ Legislation, Putting EU on Track to Exceed 2030 Targets. IP/23/4754. 2023. Available online: https://ec.europa.eu/commission/presscorner/detail/en/IP_23_4754 (accessed on 4 March 2024).
  5. European Commission. Communication from the Commission to the European Parliament, the European Council, the Council, the European Economic and Social Committee and the Committee of the Regions; COM (2019) 640 Final; European Commission: Brussels, Belgium, 2019; pp. 1–24. [Google Scholar]
  6. European Commission. White Paper-Roadmap to a Single European Transport Area—Towards a Competitive and Resource Efficient Transport System; COM (2011) 144 Final; European Commission: Brussels, Belgium, 2011; pp. 1–31. [Google Scholar]
  7. Tzeiranaki, S.T.; Economidou, M.; Bertoldi, P.; Thiel, C.; Fontaras, G.; Clementi, E.L.; De Los Rios, C.F. The impact of energy efficiency and decarbonisation policies on the European road transport sector. Transp. Res. Part A Policy Pract. 2023, 170, 103623. [Google Scholar] [CrossRef]
  8. European Parliament. Directive 2009/28/EC of the European Parliament and of the Council of 23 April 2009 on the promotion of the use of energy from renewable sources and amending and subsequently repealing Directives 2001/77/EC and 2003/30/EC. Off. J. Eur. Union 2009, 140, 16–62. [Google Scholar]
  9. European Parliament. Directive (EU) 2018/2001 of the European Parliament and of the Council of 11 December 2018 on the promotion of the use of energy from renewable sources. Off. J. Eur. Union 2018, 328, 82–209. [Google Scholar]
  10. European Parliament. Directive 2012/27/EU of the European Parliament and of the Council of 25 October 2012 on energy efficiency, amending Directives 2009/125/EC and 2010/30/EU and repealing Directives 2004/8/EC and 2006/32/EC. Off. J. Eur. Union 2012, 315, 1–56. [Google Scholar]
  11. European Parliament. Directive (EU) 2018/2002 of the European Parliament and of the Council of 11 December 2018 amending Directive 2012/27/EU on energy efficiency. PE/54/2018/REV/1. Off. J. Eur. Union 2018, 328, 210–230. [Google Scholar]
  12. European Parliament. Directive 2009/33/EC of the European Parliament and of the Council of 23 April 2009 on the promotion of clean and energy-efficient road transport vehicles. Off. J. Eur. Union 2009, 120, 5–12. [Google Scholar]
  13. European Parliament. Regulation (EU) 2023/851 of the European Parliament and of the Council of 19 April 2023 amending Regulation (EU) 2019/631 as regards strengthening the CO2 emission performance standards for new passenger cars and new light commercial vehicles in line with the Union’s increased climate ambition. Off. J. Eur. Union 2023, 110, 5–20. [Google Scholar]
  14. European Parliament. Regulation (EU) 2023/1804 of the European Parliament and of the Council of 13 September 2023 on the deployment of alternative fuels infrastructure, and repealing Directive 2014/94/EU. Off. J. Eur. Union 2023, 234, 1–47. [Google Scholar]
  15. European Parliament. Regulation (EU) 2023/1805 of the European Parliament and of the Council of 13 September 2023 on the use of renewable and low-carbon fuels in maritime transport, and amending Directive 2009/16/EC. Off. J. Eur. Union 2023, 234, 48–100. [Google Scholar]
  16. European Parliament. Regulation (EU) 2023/2405 of the European Parliament and of the Council of 18 October 2023 on ensuring a level playing field for sustainable air transport (ReFuelEU Aviation). Off. J. Eur. Union 2023, 1–30. [Google Scholar]
  17. European Parliament. Directive (EU) 2023/1791 of the European Parliament and of the Council of 13 September 2023 on energy efficiency and amending Regulation (EU) 2023/955 (recast). Off. J. Eur. Union 2023, 231, 1–111. [Google Scholar]
  18. European Parliament. Directive (EU) 2023/2413 of the European Parliament and of the Council of 18 October 2023 amending Directive (EU) 2018/2001, Regulation (EU) 2018/1999 and Directive 98/70/EC as regards the promotion of energy from renewable sources, and repealing Council Directive (EU) 2015/652. Off. J. Eur. Union 2023, 1–77. [Google Scholar]
  19. European Commission. Proposal for a Regulation of the European Parliament and of the Council on the Use of Railway Infrastructure Capacity in the Single European Railway Area, Amending Directive 2012/34/EU and Repealing Regulation (EU) No 913/2010; COM (2023) 443/2; European Commission: Brussels, Belgium, 2023. [Google Scholar]
  20. European Commission. Proposal for a Council Directive Restructuring the Union Framework for the Taxation of Energy Products and Electricity (Recast); COM/2021/563 Final; European Commission: Brussels, Belgium, 2021. [Google Scholar]
  21. Vir’ag, D.; Wiedenhofer, D.; Baumgart, A.; Matej, S.; Krausmann, F.; Min, J.; Haberl, H. How much infrastructure is required to support decent mobility for all? An exploratory assessment. Ecol. Econ. 2022, 200, 107511. [Google Scholar] [CrossRef]
  22. Gruetzmacher, S.B.; Vaz, C.B.; Ferreira, A.P. Sustainability performance assessment of the transport sector in European countries. Rev. Fac. Ing. Univ. Antioq. 2022, 104, 42–52. [Google Scholar] [CrossRef]
  23. Sztangret, I. Systemic Sustainable Development in the Transport Service Sector. Sustainability 2020, 12, 9525. [Google Scholar] [CrossRef]
  24. Ayadi, H.; Benaissa, M.; Hamani, N.; Kermad, L. Selecting Indicators to Assess the Sustainability of Urban Freight Transport Using a Multi-Criteria Analysis. Logistics 2024, 8, 12. [Google Scholar] [CrossRef]
  25. Ayadi, H.; Benaissa, M.; Hamani, N.; Kermad, L. Conceptual Framework for Assessing Sustainability of Urban Freight Transport. IFAC-Pap. 2022, 55, 251–256. [Google Scholar] [CrossRef]
  26. Pathak, D.K.; Shankar, R.; Choudhary, A. Performance assessment framework based on competitive priorities for sustainable freight transportation systems. Transp. Res. Part D Transp. Environ. 2021, 90, 102663. [Google Scholar] [CrossRef]
  27. Dillman, K.J.; Heinonen, J.; Davíðsdottir, B. A development of intergenerational sustainability indicators and thresholds for mobility system provisioning: A socio-ecological framework in the context of strong sustainability. Environ. Sustain. Indic. 2023, 18, 100240. [Google Scholar] [CrossRef]
  28. World Commission on Environment and Development. Our Common Future; Oxford University Press: Oxford, UK, 1987; pp. 1–247. ISBN 019282080X. [Google Scholar]
  29. Ayadi, H.; Benaissa, M.; Hamani, N.; Kermad, L. Assessing the Sustainability of Transport Systems through Indexes: A State-of-the-Art Review. Sustainability 2024, 16, 1455. [Google Scholar] [CrossRef]
  30. Georgatzi, V.; Stamboulis, Y.; Vetsikas, A. Examining the determinants of CO2 emissions caused by the transport sector: Empirical evidence from 12 European countries. Econ. Anal. Policy 2020, 65, 11–20. [Google Scholar] [CrossRef]
  31. Khurshid, A.; Khan, K.; Cifuentes, F.J. Agenda of sustainable transport: Can current progress lead towards carbon neutrality? Transp. Res. Part D Transp. Environ. 2023, 122, 103869. [Google Scholar] [CrossRef]
  32. Kwilinski, A.; Oleksii, L.; Pimonenko, T. Reducing transport sector CO2 emissions patterns: Environmental technologies and renewable energy. J. Open Innov. Technol. Mark. Complex. 2024, 10, 100217. [Google Scholar] [CrossRef]
  33. Alataş, S. Do environmental technologies help to reduce transport sector CO2 emissions? Evidence from the EU15 countries. Res. Transp. Econ. 2022, 91, 101047. [Google Scholar] [CrossRef]
  34. Williams, D.R. Bayesian Hypothesis Testing for Gaussian Graphical Models: Conditional Independence and Order Constraints. J. Math. Psychol. 2020, 99, 102441. [Google Scholar] [CrossRef]
  35. Hevey, D. Network analysis: A brief overview and tutorial. Health Psychol. Behav. Med. 2018, 6, 301–328. [Google Scholar] [CrossRef]
  36. Heidari, I.; Eshlaghy, A.T.; Hoseini, S.M.S. Sustainable transportation: Definitions, dimensions, and indicators—Case study of importance-performance analysis for the city of Tehran. Heliyon 2023, 9, e20457. [Google Scholar] [CrossRef]
  37. Schroten, A.; Van Grinsven, A.; Tol, E.; Leestemaker, L.; Schackmann, P.P.; Vonk-Noordegraaf, D.; Van Meijeren, J.; Kalisvaart, S. Research for TRAN Committee—The Impact of Emerging Technologies on the Transport System; European Parliament, Policy Department for Structural and Cohesion Policies: Brussels, Belgium, 2020. [Google Scholar]
  38. Janic, C. Sustainable Transport in the European Union: A Review of the Past Research and Future Ideas. Transp. Rev. 2006, 26, 81–401. [Google Scholar] [CrossRef]
  39. European Commission. Glossary for Transport Statistics, 5th ed.; European Commission: Brussels, Belgium, 2019; ISSN 2315-0815. [Google Scholar] [CrossRef]
  40. Eurostat Database. 2024. Available online: https://ec.europa.eu/eurostat/ (accessed on 5 March 2024).
  41. Juhari, M.L.; Arifin, K. Validating measurement structure of materials and equipment factors model in the MRT construction industry using Confirmatory Factor Analysis. Saf. Sci. 2020, 131, 104905. [Google Scholar] [CrossRef]
  42. Hair, J.F.; Black, W.C.; Babin, B.J.; Anderson, R.E. Multivariate Data Analysis, 7th ed.; Pearson Education Limited: Edinburgh Gate, UK, 2014. [Google Scholar]
  43. Suwartono, C.; Bintamur, D. Validation of the Emotion Regulation Questionnaire (ERQ): Network Analysis as an Alternative of Confirmatory Factor Analysis (CFA). ANIMA Indones. Psychol. J. 2019, 34, 115–1124. [Google Scholar] [CrossRef]
  44. Zoccolotti, P.; Angelelli, P.; Marinelli, C.V.; Romano, D.L. A network analysis of the relationship among reading, spelling and maths skills. Brain Sci. 2021, 11, 656. [Google Scholar] [CrossRef] [PubMed]
  45. Epskamp, S.; Fried, E.I. A Tutorial on Regularized Partial Correlation Networks. Psychol. Methods 2018, 23, 617–634. [Google Scholar] [CrossRef] [PubMed]
  46. Noja, G.G.; Cristea, M.; Panait, M.; Trif, S.M.; Ponea, C.S. The Impact of Energy Innovations and Environmental Performance on the Sustainable Development of the EU Countries in a Globalized Digital Economy. Front. Environ. Sci. 2022, 10, 934404. [Google Scholar] [CrossRef]
  47. Goss-Sampson, M.A. Statistical Analysis in JASP 0.16.1: A Guide for Students. 2022. Available online: https://jasp-stats.org/wp-content/uploads/2022/04/Statistical-Analysis-in-JASP-A-Students-Guide-v16.pdf. (accessed on 18 March 2024).
  48. De Flander, K.; Brugmann, J. Pressure-Point Strategy: Leverages for Urban Systemic Transformation. Sustainability 2017, 9, 99. [Google Scholar] [CrossRef]
  49. Pyra, M. Simulation of the Progress of the Decarbonization Process in Poland’s Road Transport Sector. Energies 2023, 16, 4635. [Google Scholar] [CrossRef]
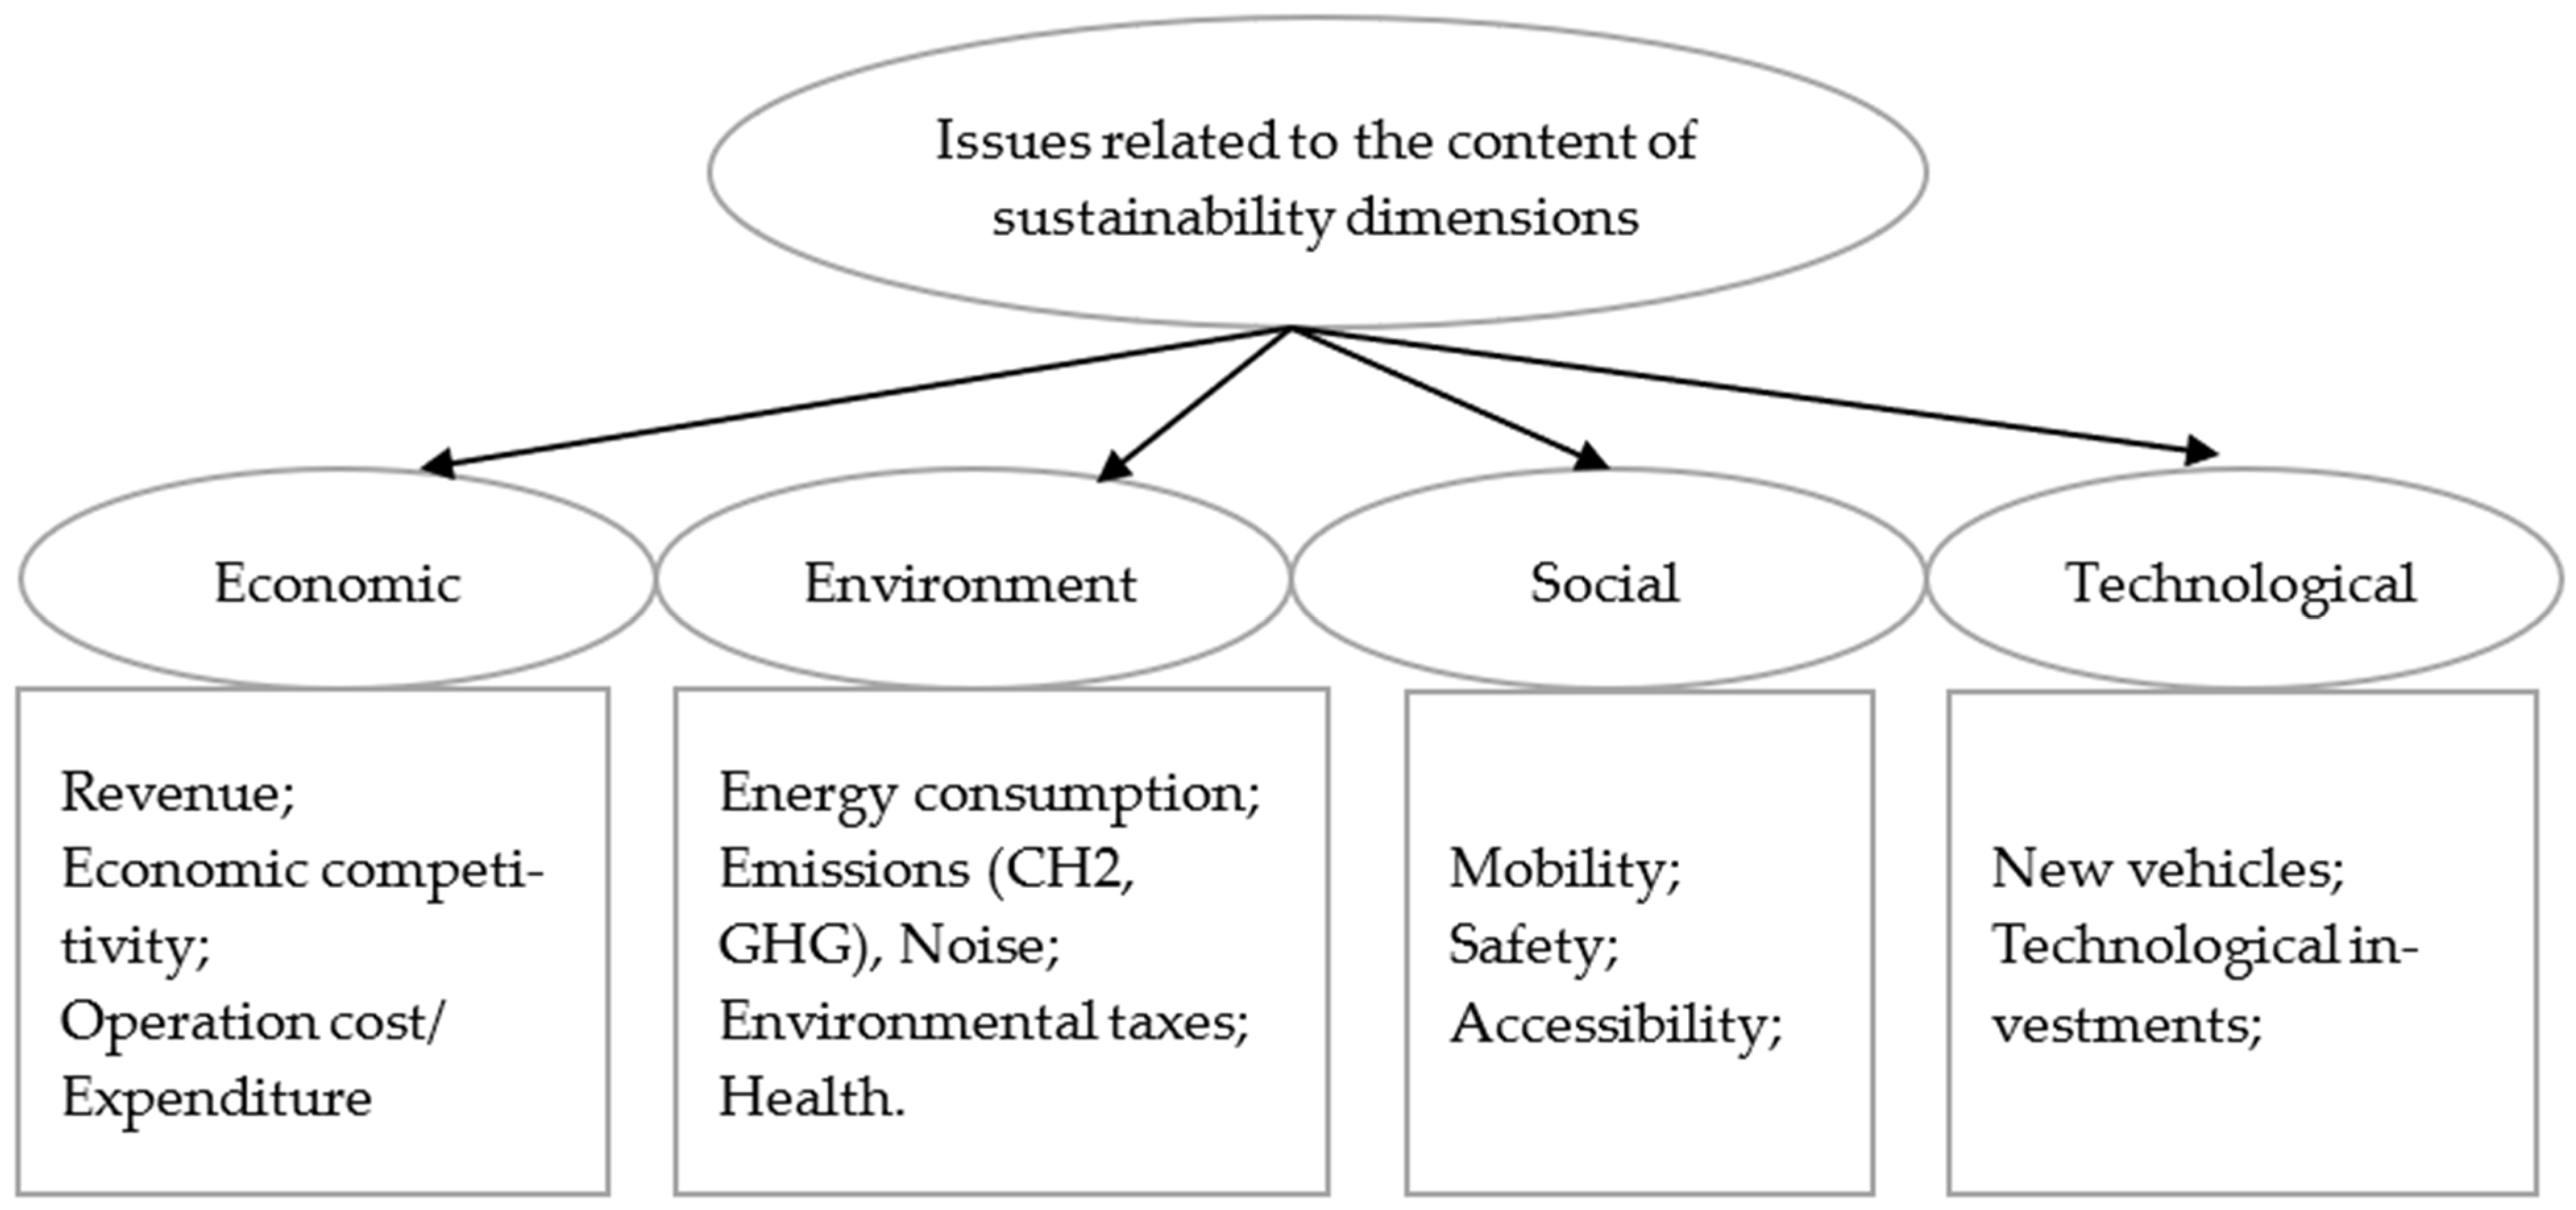
Figure 1. Main issues related to the content of the transport sustainability dimensions.
Energies 17 02645 g001
Figure 2. The process of indicators selection.
Energies 17 02645 g002
Figure 3. The confirmatory factor analysis—model plot.
Energies 17 02645 g003
Figure 4. The Gaussian graphical model for sustainability dimensions in transport.
Energies 17 02645 g004
Table 1. Summary of relevant elements of the literature and original contribution.
Research Areas Used from the Existing LiteratureOriginality of the Paper
Assessment of Transport Sustainability PerformanceCausal Dependence Analysis between Transport Sustainability Determinants
Research objectivesAssess the status (performance) and progress of transport sustainability.Estimate the isolated impact of different determinants on the level of transport emissions.Analysis of the global interdependencies/relationships between the dimensions of sustainability and their determinants in the context of EU decarbonization policies.
InputsSustainability dimensions: economic, environment, social, political, spatial, technological.Determinants: economic growth; renewable energy; energy efficiency and consumption; green policies; environmental technologies; taxes.Sustainability dimensions: economic, environment, social, technological.
Sustainability determinants: content-related indicators of the four dimensions.
OutputsComposite indexes of transport sustainability.
Multiple indicators relevant for sustainability performance assessment.
Evidence about the direct links/relationships between different factors of influence and the level of emissions from transport modes.Simultaneous evidence about the overall (direct, indirect and total) relationships between determinant factors of transport sustainability.
Table 2. Variables and sustainability dimensions.
Sustainability
Dimensions
SymbolSpecificationSource
Economic (Ecn)GDPGross domestic product, as value of well-being per capitaEurostat database
Rd_GVolume of goods, in million ton-kilometer, transported by roadEurostat database
Rl_GFreight transported by rail, volume of goods, in million ton-kilometer transported by railEurostat database
W_GUnitization in maritime of freight transport, as million ton-kilometerEurostat database
A_GFreight transported by air
Volume of goods, in tons, transported by air
Eurostat database
E_TPercentage of transport expenditure in total expenditure of householdsEurostat database
Environmental (Envr)CO2Tons of carbon dioxide (CO2) emissions from transportation Eurostat database
EngFinal energy consumption in transport, in tons of oil equivalentEurostat database
ShrShare of renewable energy in gross final energy consumption from transportEurostat database
EnvPercentage of total revenues from transport taxes and social contributions (excluding imputed social contributions)Eurostat database
Social
(Scl)
Rl_SNumber of rail accidentsEurostat database
Rd_SPersons killed in road accidentsEurostat database
Rl_PVolume of passengers, in millions of passenger-kilometers, transported by rail Eurostat database
Rd_PVolume of passengers, in millions of passenger-kilometers, transported by roadEurostat database
Technological (Tch)Rl_IInvestments on rolling stock and railway infrastructureEurostat database
Rd_IInvestments on rolling stock and road infrastructureEurostat database
E_lcElectrical locomotivesEurostat database
E_vhElectrical vehicle, as numbers of new zero-emission vehiclesEurostat database
Table 3. Descriptive statistic.
VariablesMenSt. DeviationSkewnessKurtosisN
GDP26,58317,2891.5322.644270
Rl_G14,80313,6301.7086.223270
Rd_G68,52366,7302.0253.125270
W_G10.6119.6800.9230.046270
A_G144,113214,4292.5065.580270
E_T12.1742.066−0.5691.663270
Env1.3420.8650.696−0.289270
CO215,536,14315,144,4612.0213.751270
Shr7.6615.0501.3665.746270
Eng10,17510,0371.9882.860270
Rl_S61.78957.5901.9533.412270
Rd_S7981451.5570.981270
Rl_P12,63711,7691.6755.998270
Rd_P505.68993.377−0.288−0.276270
Rd_I45789471.0092.793270
Rl_I220517601.2636.367270
E_vh15,20811,3101.6583.157270
E_lc3742771.6811.768270
Table 4. Confirmatory factor analysis.
CFA
(Four Sustainability Dimensions)
Fit Indexes
Chi-Square TestCFIRMSEAPNFI
x2dfp
Based (Table 1)4568153≤0.010.9210.0960.900
Fitted (Figure 2)3009149≤0.010.9370.0670.910
Disclaimer/Publisher’s Note: The statements, opinions and data contained in all publications are solely those of the individual author(s) and contributor(s) and not of MDPI and/or the editor(s). MDPI and/or the editor(s) disclaim responsibility for any injury to people or property resulting from any ideas, methods, instructions or products referred to in the content.