Article

Continuum Modeling of Slightly Wet Fluidization with Electrical Capacitance Tomograph Validation

1
Bioenergy and Solar Conversion Research Group (BSCRG), College of Engineering, American University of Sharjah, Sharjah P.O. Box 26666, United Arab Emirates
2
School of Chemistry, The University of Southampton, East Highfield Campus, University Road, Southampton SO17 1BJ, UK
3
Department of Chemical Engineering, Heriot-Watt University, Edinburgh EH14 4AS, UK
4
Applied Mathematics and Data Science, Aston University, Birmingham B4 7ET, UK
*
Author to whom correspondence should be addressed.
Energies 2024, 17(11), 2656; https://doi.org/10.3390/en17112656
Submission received: 12 March 2024 / Revised: 30 April 2024 / Accepted: 2 May 2024 / Published: 30 May 2024
(This article belongs to the Section A: Sustainable Energy)

Abstract

:
Gas–solid fluidized bed reactors are widely used in the power generation industry. The critical effect of the presence of liquid phase, either as a result of heat, chemical reaction or physical interaction, on the hydrodynamics of the reactor is well recognized by academic researchers and industrial operators. However, theory and simulation frameworks to predict such a condition using the continuum modeling approach are not yet available. This study first shows the significant changes in the flow pattern and distinguishable flow regimes in a slightly wet fluidized bed recorded by an advanced imaging technique. The study then describes the development and implementation of new mathematical formulations for wet particle-particle interactions in a continuum model based on the classic kinetic theory of granular flow (KTGF). Quantitative validation, carried out by comparing the predicted and measured fluidization index (FI) expressed in terms of pressure drop, has shown a good match. The prediction also demonstrates increased bubble splitting, gas channeling, slugging fluidization, and energy dissipation induced by liquid bridges developing from wet particle interactions. These characteristics are similar to those commonly observed in the fluidization of cohesive powders. This model constitutes an important step in extending the continuum theories of dry flow to wet particle-particle interactions. This will allow accurate description and simulation of the fluidized bed in its widest application including power generation systems that involve wet particle fluidization.

1. Introduction

Processing and handling of wet solids arise in a wide range of industrial processes, including chemicals, energy, pharmaceuticals, food, and minerals. For example, in power generation, oil/tar is formed in low-temperature regions of biomass thermal conversion reactors. Similarly, liquid may be present in fluid coking of tar sand (also called bituminous sand) or as a result of melting during particulate processing. In physical processing, liquid is commonly sprayed into mixers or fluidized beds for particle coating and granulation. The liquid presence in solid processing systems results in changing the inter-particle forces and energy dissipation at collisional contacts. The classical continuum model of granular flow, with constitutive relations adopted from the kinetic theory of granular flow (KTGF), has been widely used for many years to predict gas-solid flow behavior in dry conditions [1]. This is commonly referred to in the literature as Eulerian-Eulerian or two-fluid modeling approach. The basic idea in the classic KTGF is that the particles are homogeneously distributed within an ensemble and can be defined as a continuous phase with stresses arising from random fluctuations, collisions and frictions, with each assumed to be dominant at a given flow regime. In analogy with thermal temperature in dense gases, a “granular temperature” is assumed to arise from the particle velocity fluctuations. The energy dissipation during collision is approximated by a restitution coefficient, taking into consideration the particle inelasticity. The random fluctuations and collisional stresses are approximated using equations derived from the Boltzmann equation while the fractional contacts are obtained from the Mohr–Coulomb law. The latter came as part of the efforts to extend the classic KTGF to slow frictional flow and, hence, constituted an important step towards taking this modeling approach to wider applications. In the case of a slightly wet condition, the particle–particle interactions are much more complex due to the formation of a liquid layer at the particle surface, which subsequently results in changing the overall hydrodynamics.
Geldart [2,3] classified the particles into four main Groups, A, B, C and D, according to their flow hydrodynamics when fluidized in air. The distinct characteristic behavior of each particle group was mainly attributed to the differences in their inter-particle forces. Following this, several studies have shown that the addition of a liquid to a dry bubbling bed may shift the hydrodynamics towards the distinctive behavior of cohesive particles (e.g., from Geldart Group B to A). Seville and Clift [4] and McLaughlin and Rhodes [5] experimentally studied the effect of the presence of small quantities of liquid (non-volatile silicone oil) on the fluidization behavior of glass beads belonging to Group B. Both studies have confirmed a shift in the hydrodynamic behavior towards another particle group; this shift was shown to coincide with the change in inter-particle forces. However, the change in bubble characteristics, the main factor that determines the bed hydrodynamics, was never discussed. The experimental work conducted by Makkawi [6] and Makkawi et al. [7] on a slightly wet bubbling fluidized bed of glass beads indicated critical changes in the bubble characteristics and clear channeling and voidage-wave instability as a result of liquid addition. Tardos and Pfeffer [8] reported an experimental study in which a fluidizing gas was found to chemically react with the solids producing new softer components and melting. The particle cohesion and stickiness were observed and bubble characteristics (velocity, size, and frequency) and minimum fluidization velocity were all found to change significantly as the reaction progressed.
One of the earliest attempts at the simulation of wet particles in a bubbling fluidized bed was reported by Mikami et al. [9] using discrete element modeling (DEM) coupled with computational fluid dynamics (CFD-DEM). The liquid bridge forces at the single particle level were analyzed based on the bridge shape and volume at the interface. The same approach was then followed by several researchers [10,11,12,13,14] and these are reviewed as follows. Xu et al. [10] used the CFD-DEM coupling model to study the effect of liquid-induced forces on gas–solid flow. It was found that particles tend to form agglomerates, resulting in an enlarged stagnant zone and increased fluctuation of bed pressure drop. Jian et al. [11] introduced a discrete model for gas–solid flow with wet (cohesive) granules. The transition from free-flowing to cohesive behavior was found to occur at a distinct value of the granular capillary number. Lim et al. [12] used the CFD-DEM coupling to study the mixing behaviors of wet granular materials in gas-fluidized bed systems. It was noticed that wet particles have a high tendency to form large aggregates with limited motion of individual particles. He et al. [13] used DEM to study wet cohesive particles in the presence of liquid bridges in a gas-fluidized bed. Symmetrical profiles of the velocity and granular temperature were noticed at low liquid contents, which then shifted to asymmetrical at a high liquid content. Most recently, Wang et al. [14] reported a CFD-DEM model to study the flow characteristics of dry and wet particles in a circulating fluidized bed riser. It was reported that the wet particles move in a single particle as well as an agglomerate. Most recently, Motlagh et al. [15] presented a comprehensive Eulerian-Eulerian CFD model to simulate evaporative spray injection into a hot gas-solid fluidized bed. The mode treated the three phases (gas, particle, and liquid) as Eulerian phases with a population balance model added to account for the particle size change after granulation. To account for the possibility of agglomeration, an energy balance model was used to assess the outcome of collisions between wet particles. This model is probably the first to treat wet fluidization in such a continuum modeling approach. In a more fundamental approach, Berzi1 and Fraccarollo [16] defined new closure equations to describe the fluid and particle stresses in a collisional suspension of particles and water flow. The model was strictly assumed to be valid for a situation where the particle inertia is dominant. Another major assumption was that the particle pressure scales well with the granular temperature, hence, the use of kinetic theory also permits to modeling of the granular viscosity. Accordingly, the effective fluid viscosity was assumed to arise from the combined effect of turbulence and a granular-like viscosity. The latter was modeled by simply replacing the particle density in the KTGF expression with a modified density taking into account the added fluid mass. The study has shown the feasibility of extending the two-phase continuous mathematical models beyond the boundaries imposed by the classic KTGF, which is in agreement with the outcome of the approach adopted in this study.

2. Motivation and Objectives of the Study

Although many of the industrial gas–solid flow systems are operated at slightly wet conditions, as described in the introduction, reliable theoretical models to predict the effect of the liquid presence in practical industrial-scale fluidization are currently not available. There are many examples of inadequate operation, design, and safety risks resulting from poor understating of the particle–particle interaction in wet conditions (see Table 1). In coal gasification and biomass thermal conversion, particle agglomeration induced by liquid (tar) binding is a major problem. This occurs in fluidized bed reactors when the bed temperature falls below ~300 °C, either due to poor mixing or heat losses. The same agglomeration phenomena may occur due to the partial melting of particles when operating above the melting point of the bed material.
Theoretical modeling and simulation of wet fluidization and fluidized bed reactors in particular are challenging due to the high complexity of the particle–particle and the wall–particle interactions. The few reported models in this case are mainly focused on discrete element modeling (DEM) and coupled CFD-DEM approaches. These have been used for the simulation of some relevant wet fluidization cases such as in spray granulation and fluidized bed coating [17,18]. The DEM approach is based on Newton’s second law of motion to track individual particles in the flow field and the inter-particle contact forces are calculated by a linear or non-linear spring and a dashpot model to account for the particle inelasticity. The gas phase is treated as a continuum phase (Eulerian) and therefore its flow field is commonly computed from the solution of volume-averaged Navier–Stokes equations, thus creating what is sometimes denoted by Eulerian–Lagrangian approach. While these studies demonstrate the predictive capabilities of the DEM and its complementary approach to practical experimental studies, it suffers from a serious drawback that makes it unattractive for the simulation of realistic processes where a large number of particles exist. The implementation of momentum transfer at the single-particle level, as used by DEM models, has a huge impact on the computational time.
The widely used two-fluid model or the Eulerian–Eulerian method is an alternative option to simulate solid-gas flow systems within a reasonable computational time at a realistic scale. However, the classic two-fluid based model, in its original formulations based on the KTGF, lacks the framework to incorporate the effect of the liquid layer, thus its predictive capabilities are limited to the dry flow case only. It is therefore widely recognized that it is important to identify new approaches for modeling fluidized flows at slightly wet conditions relevant to industrial applications. This research has also been given priority for future research focus at several recent meetings and conferences on granular flows and fluidization technology. In this study, the main objective of this study is to develop a continuum CFD model for the fluidization of slightly wet non-porous particles in non-agglomerating situations. First, the Electrical Capacitance Tomography (ECT) imaging technique is utilized to show the critical changes in the flow pattern and distinguishable flow regimes in a fluidized bed of glass beads wetted with small amounts of non-volatile liquid. This study then presents in detail the development and implementation of new constitutive equations to describe the particle–particle interaction in a slightly wet condition. To demonstrate the qualitative and quantitative validity of the model, the developed equations were formulated as a user-defined function (UDF) and implemented in a continuum CFD model for a bubbling fluidized bed using ANSYS Fluent CFD commercial code for multiphase flow. Comparisons between dry/wet fluidized bed experimental observation and the model predictions have been made.

3. Theory

In modeling gas–solid flow, knowledge of the solid shear stress is essential to describe the normal and tangential particle momentum transfer. In the case of slightly wet gas-solid flow, liquid bridges form between the contacting particles as demonstrated in Figure 1a. This results in changing the particle momentum due to inter-particle forces introduced by fluid shear resistance, while the collisional contacts dissipate energy in the liquid layer or bridges. Figure 1b demonstrates the basic hypothesis of the proposed flow regimes and the associated inter-particle forces. In the rapid flow regime, it is assumed that solid stress and dissipation are mainly dominated by random velocity fluctuations, and hence, the flow can be predicted using the original KTGF formulation without losing much accuracy. In the intermediate flow regime, the existence of a liquid layer surrounding the particles becomes more relevant; this is assumed to trigger a process in which the collision force normal to the particle is reduced. Energy is dissipated in the liquid layer and the tangential solid shear stress is substituted by a fluid shear resistance due to the formation of a liquid bridge. In the limiting regime of slow frictional flow, direct particle-particle enduring contacts take place due to the squeezing of the liquid bridges. In this case, it is assumed that the flow obeys the conventional dry frictional flow, which can be predicted by the critical state theory and onset of yielding as described by Coulomb law [19].

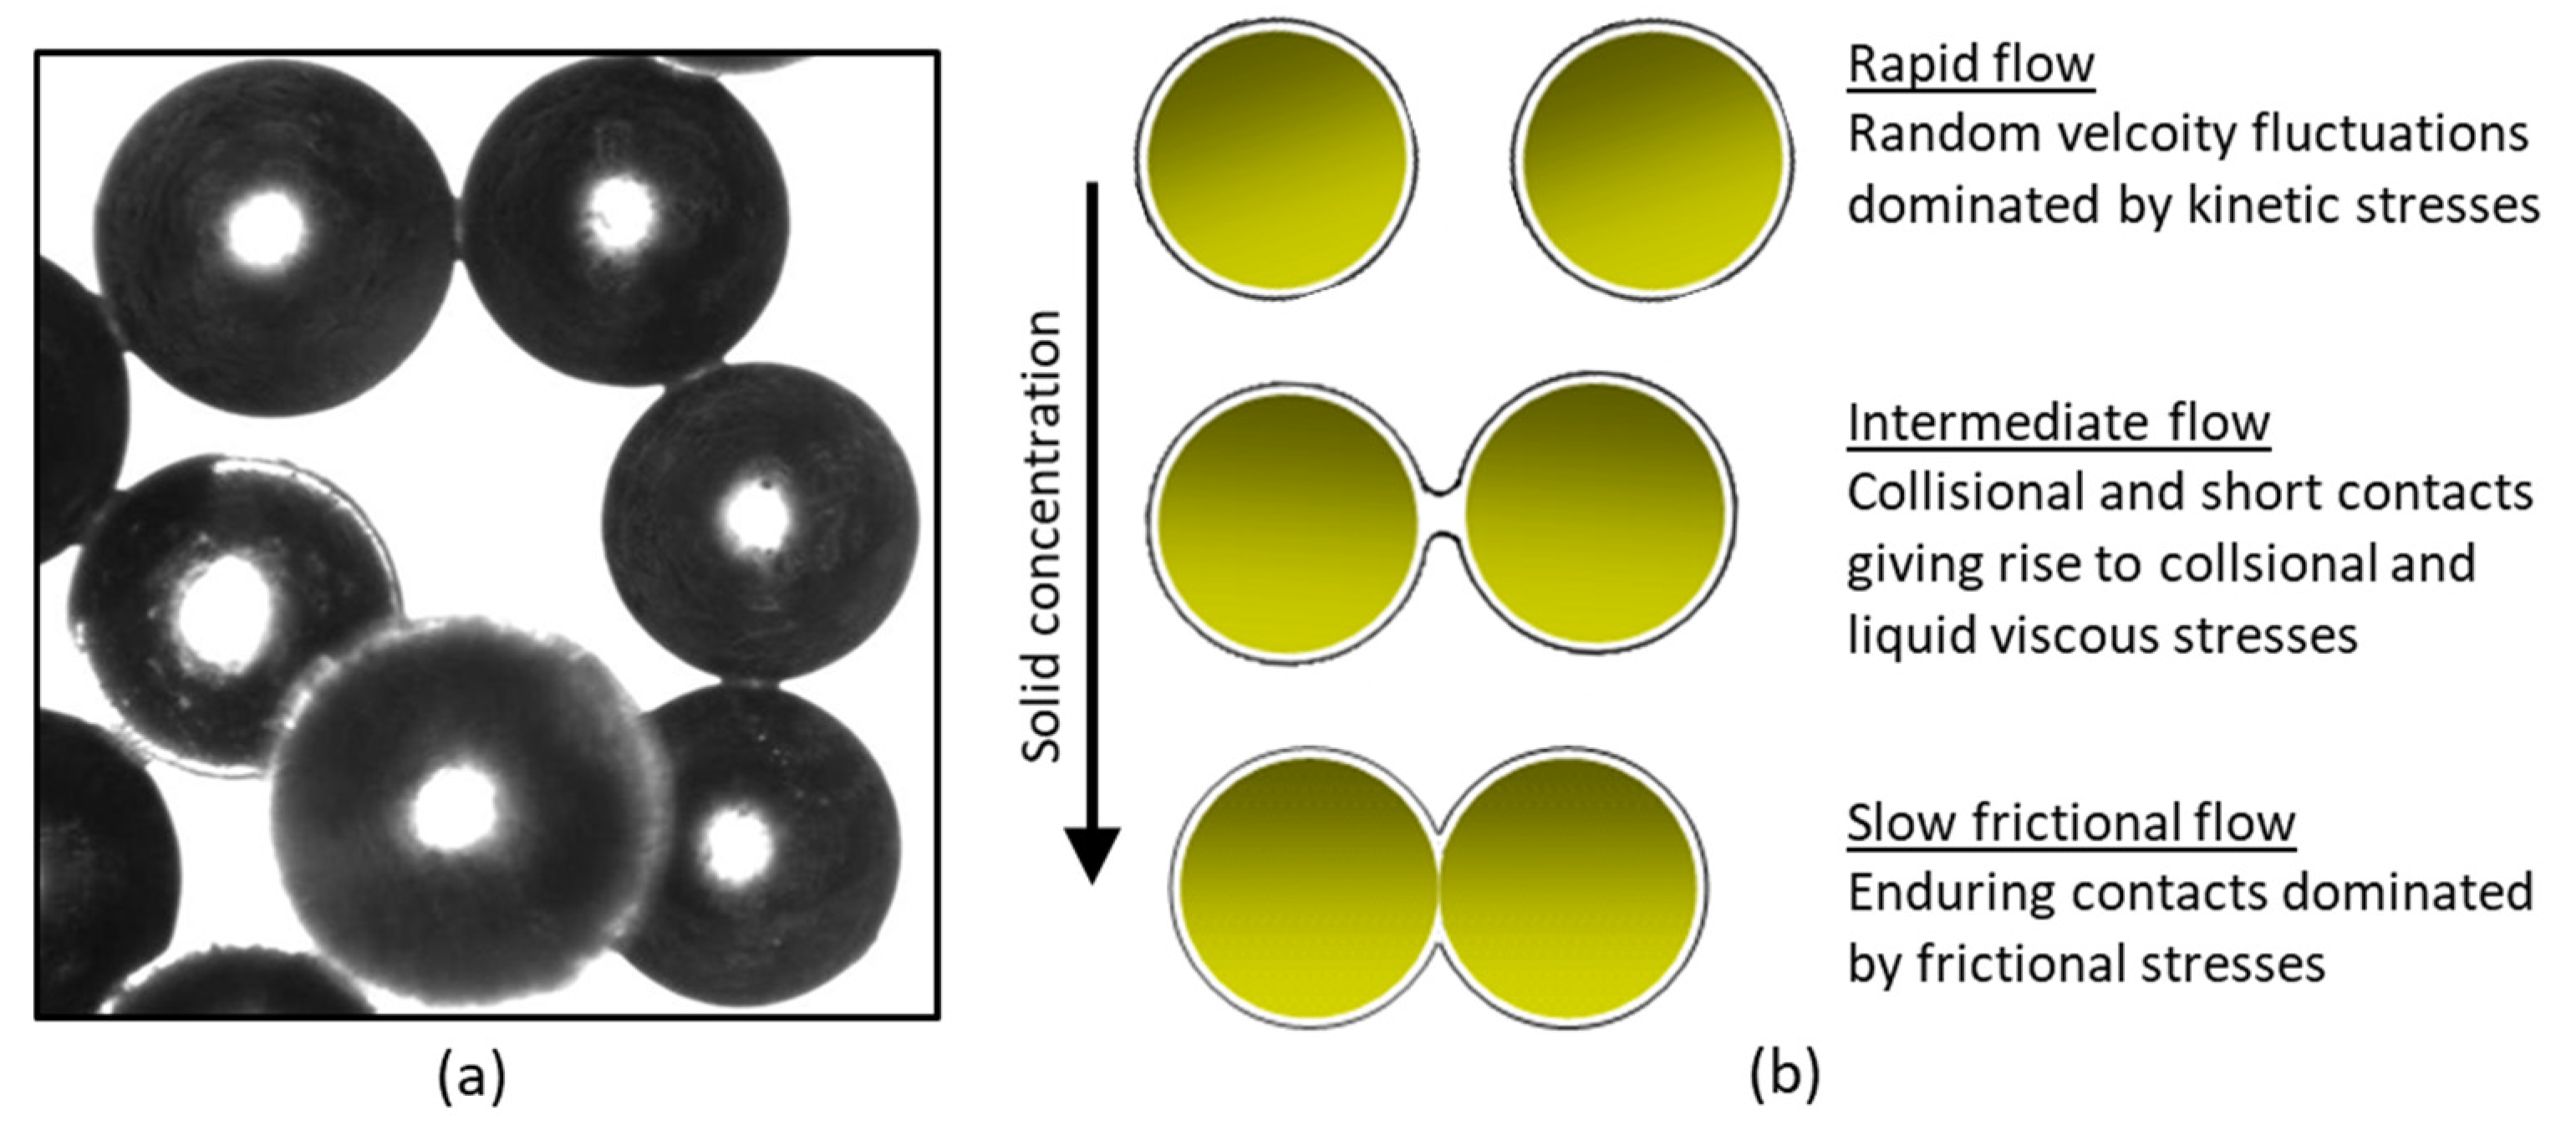
3.1. Solid Stress Tensor

The hypotheses described above have been used to derive the appropriate mathematical formulations required to take into consideration the reduced particle elasticity and increased inter-particle forces in particles of a slightly wet surface. Within the framework of continuum modeling, a strategy is proposed here to add a “liquid” normal stress term into the momentum equation of the particle phase. By analogy with the widely used kinetic-frictional solid stress model, a modified solid shear stress tensor, taking into consideration the contribution of liquid-induced stresses, is defined by:
τ ̿ s = 2 S ̿ μ s , k i n + μ s , c o l + μ s , f r + μ w e t
where S ̿ is the strain rate, μ s , k i n , μ s , c o l and μ s , f r represent the kinetic, collisional, and frictional contributions to the total solid-phase equivalent “viscosity”, and these can be obtained from the existing classical KTGF and Coulomb model of friction. μ w e t represents the viscosity arising from the particle-particle enduring contacts through the liquid bridge. Note that the model liquid used in this study is silicone oil. In this case, our calculation indicates that the capillary forces are insignificant compared to the viscous stresses, and hence ignored in the formulation of the solid stress model. It is also believed that the capillary force only becomes important in systems with high relative particle velocity or high-velocity fluctuation [20].
It is assumed that for a pair of wet contacting particles moving at a given velocity, u ˙ , the normal liquid force at the single-particle level can be defined by [21]:
F w e t = 3 8 π μ L d s 2 u ˙ s h
where μ L is the liquid dynamic viscosity, d s is the particle diameter and h is the inter-particle gap distance. The interparticle approach velocity can be estimated from the granular temperature, Θ s , as follows [22]:
u ˙ s = 2 3 ( π Θ s ) 1 / 2
With the normal liquid bridge force at the particle level is in hand, further development is required to allow the implementation of this into continuum modeling framework, hence making the theory more appealing in the simulation of realistic wet solid suspension systems. In this case, the liquid bridge force must be expressed in terms of force per unit area (stress) within an ensemble. In doing so, the number of particles per unit area was first determined as follows:
N s = 6 α s π d s 3 2 / 3
where α s is the solid concentration within an ensemble. Combining Equations (2)–(4), a constrained normal solid stress is proposed as follows:
P w e t = 9 16 h π μ L π Θ s 6 α s π 2 / 3           i f           h a < h h c r i t i c a l                                                                             0                                               i f                   h > h c r i t i c a l  
where h is the inert-particle distance, h a is the characteristic measure of the particle surface asperity and h c r i t i c a l is the critical rupture distance of the liquid bridge. Note that Equation (5) ignores the effect of multi-bridges on particle, a simplification made to avoid using an adjustable parameter without strong physical justification.
By analog to Mohr–Coulomb law for a dry particle at enduring contact or yielding condition, an equivalent liquid shear viscosity is defined by:
μ w e t = 2 P w e t S ̿ s i n ϕ
where ϕ is the maximum angle of stability. Experiments on the stability of silicone oil-wetted glass beads carried out by Nowak et al. [23] suggested a value ϕ in the range of 20° to 40°. In this study, an average value of 30° was used. The critical separation distance h c r i t i c a l , appearing in Equation (5), is defined here as the limit of the inter-particle gap between two contacting wet particles after which the liquid bridge rupture occurs.

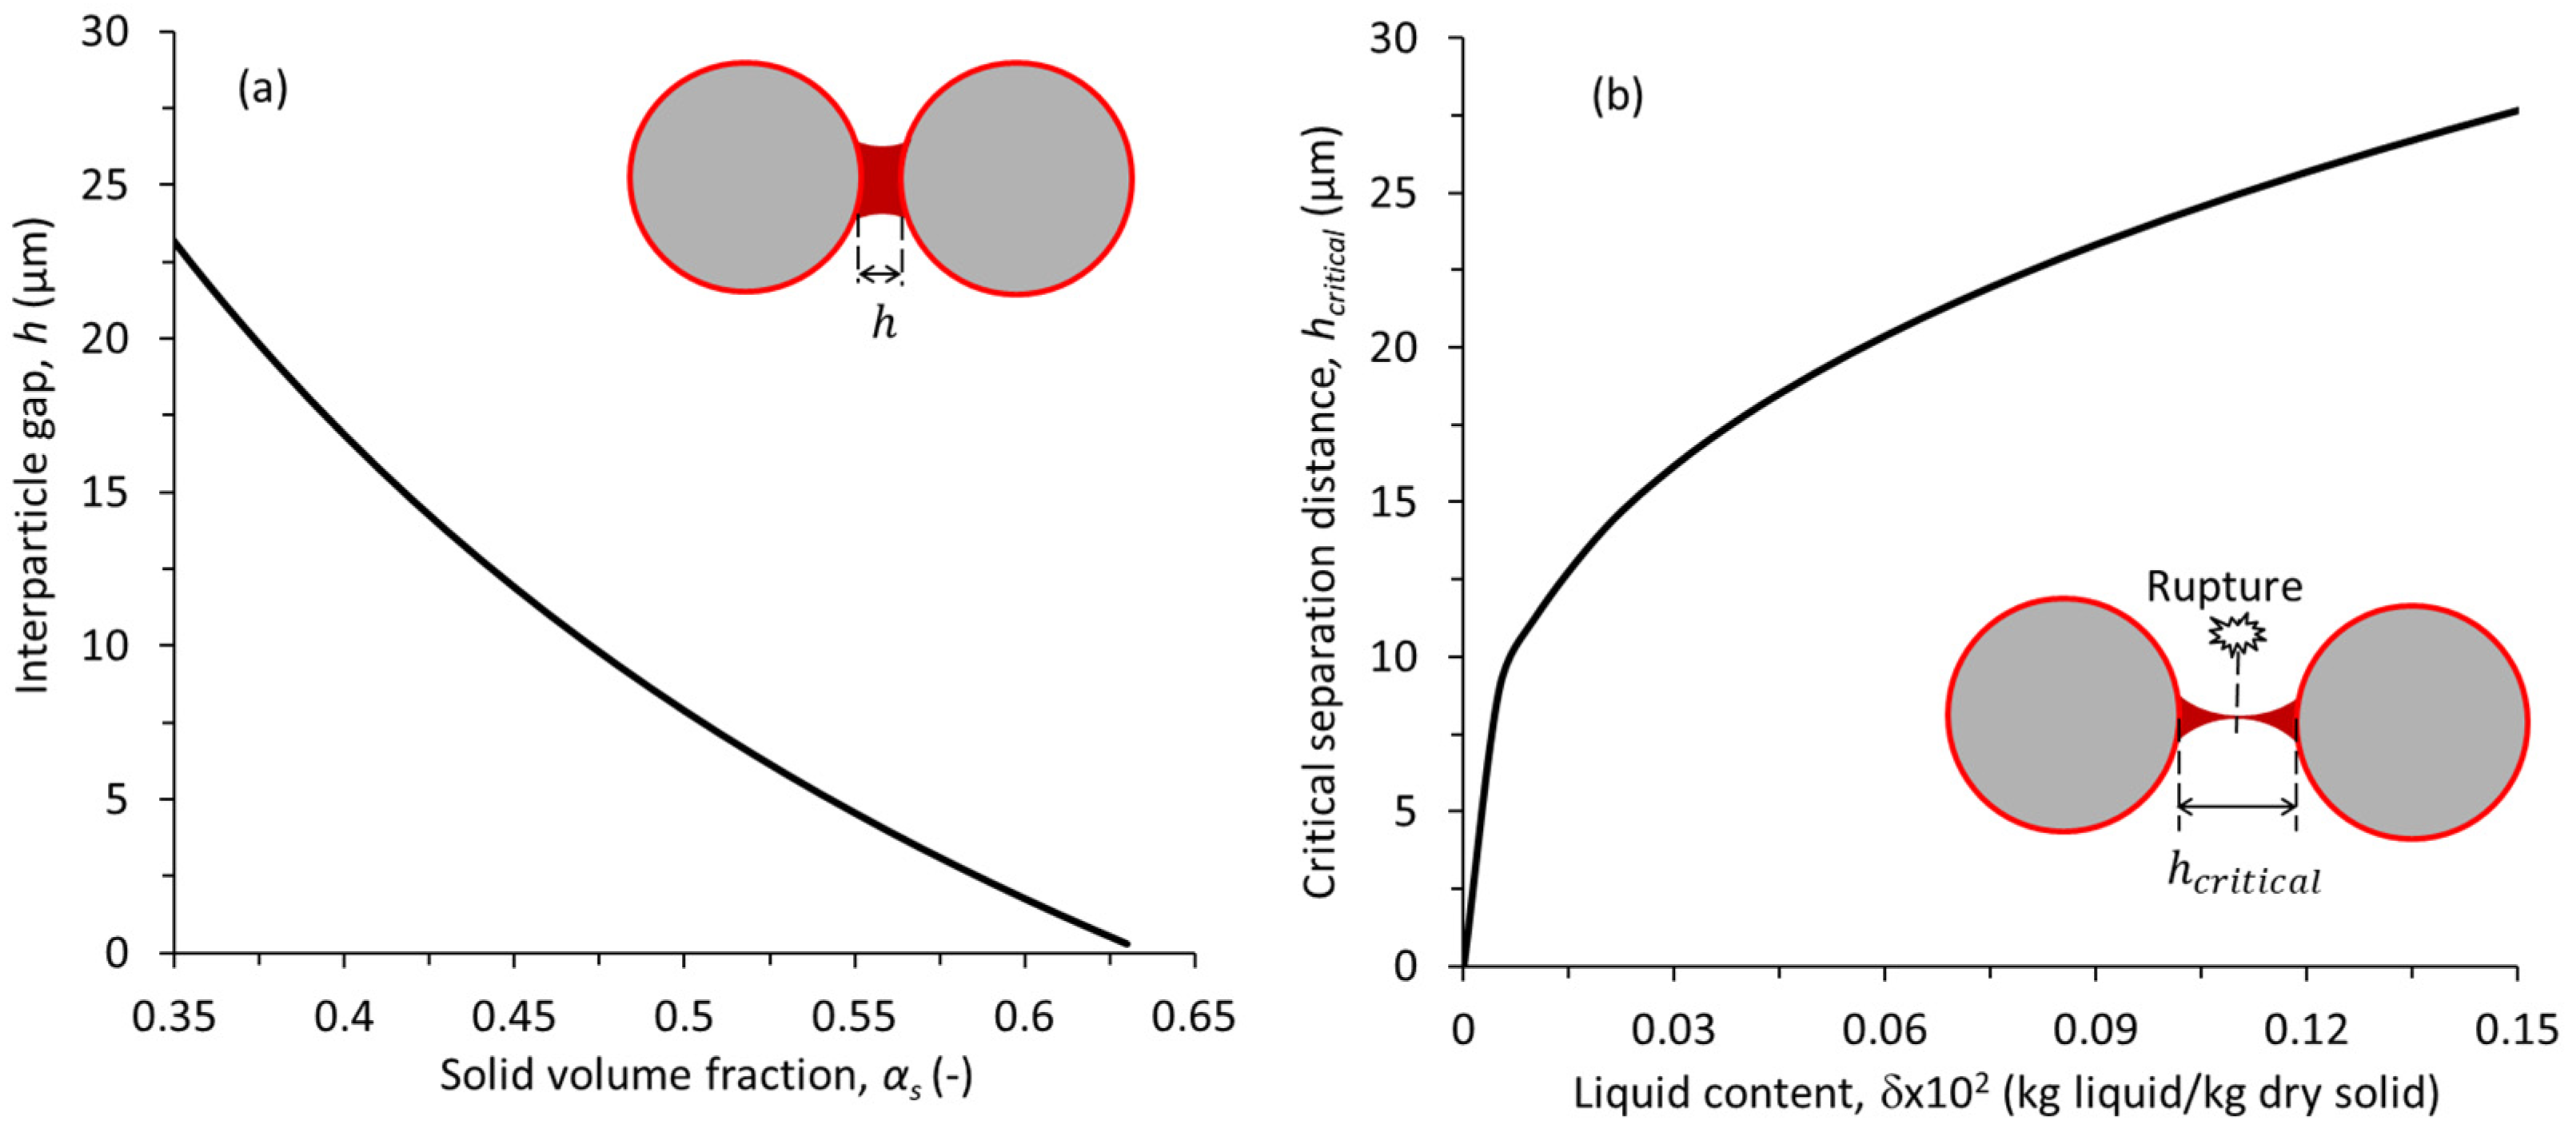
3.2. Inter-Particle Gap and Liquid Bridge Rupture Distance

In randomly packed spheres, Woodcock [24] proposed a relation between the solid volume fraction and the inter-particle gap distance expressed in terms of the particle diameter as follows:
h = d s 1 3 π α s + 5 6 1 / 2 1
In obtaining the critical rupture distance for particles at contact, h c r i t i c a l , a correlation equation derived from the original work of Lian et al. [25] has been used as follows:
h c r i t i c a l = 1 2 ( 1 + 0.5 γ ) d s M L M s ρ s ρ L 3
where γ is the liquid contact angle (in radians) and the term under the cube root represents the liquid-to-solid volume ratio. M L / M s is the overall ratio of liquid to solid mass in the bed (in the rest of this paper this ratio is denoted by δ). Figure 2a shows the relation between the separation distance and the solid volume fraction for the particle size considered in this study. It is shown that the separation distance decreases with increasing the solid concentration and correctly reduces towards zero as the solid volume fraction approaches the maximum packing condition. Figure 2b shows the critical rupture distance for the conditions considered here. The curve trend indicates that h c r i t i c a l is highly sensitive to the variation in liquid presence within the low range (δ < 0.03 × 10⁻²), after which the variation becomes negligible.

3.3. Energy Dissipation

The KTGF assumes that energy dissipation arises from the inelastic collision of dry smooth particles. While this appears to be satisfactory in simulating various granular flow conditions, there is an argument that the dissipation term derived from the KTGF has shortcomings due to neglecting the dissipation caused by sliding friction [26]. In the wet case, it is particularly important to take into consideration the increased energy dissipation due to non-ideal particle interactions (i.e., through a liquid bridge for example). In this proposed model, the energy dissipation induced by the liquid shear is implicitly considered through the change in the particle momentum equation, and the energy dissipation due to the normal collision is incorporated by using a modified particle restitution coefficient in the widely used energy dissipation equation derived from the KTGF as follows [27]:
γ s = 12 1 e w e t 2 g 0 , S S d S π 1 / 2 α S 2 ρ S Θ s 3 / 2
where e w e t represents the restitution coefficient of wet particles. Davis et al. [28] measured the rebound velocities of small spherical particles falling on a smooth surface coated with a layer of viscous fluid at impact velocities within the range of 1–5 m/s. Accordingly, an expression for the wet particle restitution coefficient was derived from the Stokes analysis of the collision kinetic energy as follows:
e w e t = e d r y 1 S t * S t
where e d r y is the dry particle restitution coefficient, and S t is the dimensionless Stokes number, which is a measure of the ratio of granular kinetic energy to the viscous dissipation and S t * is the critical Stokes number, above which the liquid bridge rupture becomes important. To give allowance for variation of energy dissipation during liquid bridge deformation and complete loss of elasticity at enduring contacts, a constrained term for the restitution coefficient based on the Stokes analysis and the inter-particle gap was proposed as follows:
e w e t = e d r y 1 S t * S t           i f           h a < h h c r i t i c a l     a n d     S t > S t * 0                                                                                 i f       S t S t * e d r y                       i f                   h > h c r i t i c a l   a n d   S t > S t *
Equation (11) allows for (i) a reasonable approximation of the energy dissipation in the liquid layer within the gap distance h a < h h c r i t i c a l (ii) complete dissipation when the particles collide with very low kinetic energy, and (iii) diminishing the effect of liquid layer dissipation while the particles are not subjected to liquid viscous stress within the gap distance of   h > h c r i t i c a l . The Stokes number is defined as follows [29]:
S t = 8 m u ˙ s 3 π μ L d s 2
where m is the mass of the particle and μ L is the liquid dynamic viscosity. Thielmann et al. [30] identified the critical Stokes number, S t * , in terms of the inter-particle gap distance, h , and the dry particle restitution coefficient as follows:
S t * = 1 + 1 e d r y l n h h a
For smooth glass beads, h a falls within the range of 0.08–6 µm [6,30]. In this study, an average value of h a = 2.8 µm has been used.

4. Experiments

Experiments were carried out in two different sized fluidization columns to collect quantitative and qualitative data on the hydrodynamics of slightly wet glass beads in a fluidized bed. The larger column was made of a cast acrylic column of 150 cm in height and 15 cm in diameter and equipped with a twin-plane ECT imaging system for recording the variations in solid concentration during fluidization. Air at ambient conditions was used to fluidize the bed material consisting of narrow-sized glass beads mixture of 350 µm mean diameter. Further details on this fluidization set-up, the ECT imaging system, and its application to fluidized bed hydrodynamic analysis and the image reconstruction procedure can be found in Makkawi and Wright [7,31] and Makkawi and Ocone [32]. A few additional experiments were carried out in a smaller glass column of 100 cm height and 5 cm diameter. Both columns were fitted with a pressure probe located 1 cm above the gas inlet and connected to a pressure transducer and data recording system. To ensure reproducibility, all the experiments were repeated at least three times.
At the beginning of experiments, the fluidized bed was operated at fully turbulent conditions and a controlled amount of non-volatile silicone oil (Fluid 500, Dow Corning Ltd., Barry, UK) was added from the top using a syringe. Silicone oil is mainly used because it is non-volatile, hence allowing for mimicking wet fluidization in several practical conditions. Besides, silicone oil is of low permittivity, making it ideal for ECT measurement because it does not interfere with its signal. To ensure adequate wetting of particles, the bed was left to fluidize for at least 30 min. The air was then switched off and restarted again for fluidization recording at various gas velocities up to 0.8 m/s (this is 4.7 times the minimum fluidization velocity of the dry bed, i.e., Umf = 0.17 m/s). The pressure drop across the distributor in the fluidization columns was designed to give around 40% of the dry bed pressure drop, which falls within the “rule of thumb” for distributor design [33]. In each experiment, the liquid loading was incrementally varied up to a maximum of δ = 0.15 × 10⁻² (mass of liquid to mass of dry bed). Additional details of the experiment operating conditions are given in Table 2.

5. Computational Model

The main model equation to describe the continuity, momentum and kinetic energy equations are described in this section as follows:
Continuity equations:
α i ρ i t + · α i ρ i u i = 0               ( i = g a s   o r   s o l i d )
α s + α g = 1
Momentum equations:
α g ρ g u g t + · α g ρ g u g u g = α g P + · τ ¯ ¯ g β g s u g u s + α g ρ g g
α s ρ s u s t + · α s ρ s u s u s = α s P P s + · τ ¯ ¯ s + β g s u g u s + α s ρ s g
The granular temperature was given by solving the pseudo kinetic energy equation given as follows [34]:
3 2 α s ρ s Θ S t + α s ρ s Θ S u s = P s I ¯ ¯ + τ ¯ ¯ s : u s + κ Θ S Θ S γ Θ S + ϕ g s
The above model, with the constitutive equations given in Table 3 applies to the dry case. In simulating for the wet cases, the same set of the above main equations were solved but with the modified solid stress and energy dissipation, as given earlier in Section 3. The model was solved in three-dimensional coordinates using ANSYS Fluent CFD code (Ver 2016). Note that the effect of liquid presence on the kinetic energy (Equation (18)) is considered through the implementation of the modified solid stress and dissipation terms (implicitly in terms of modified restitution coefficient), as described in Section 3.

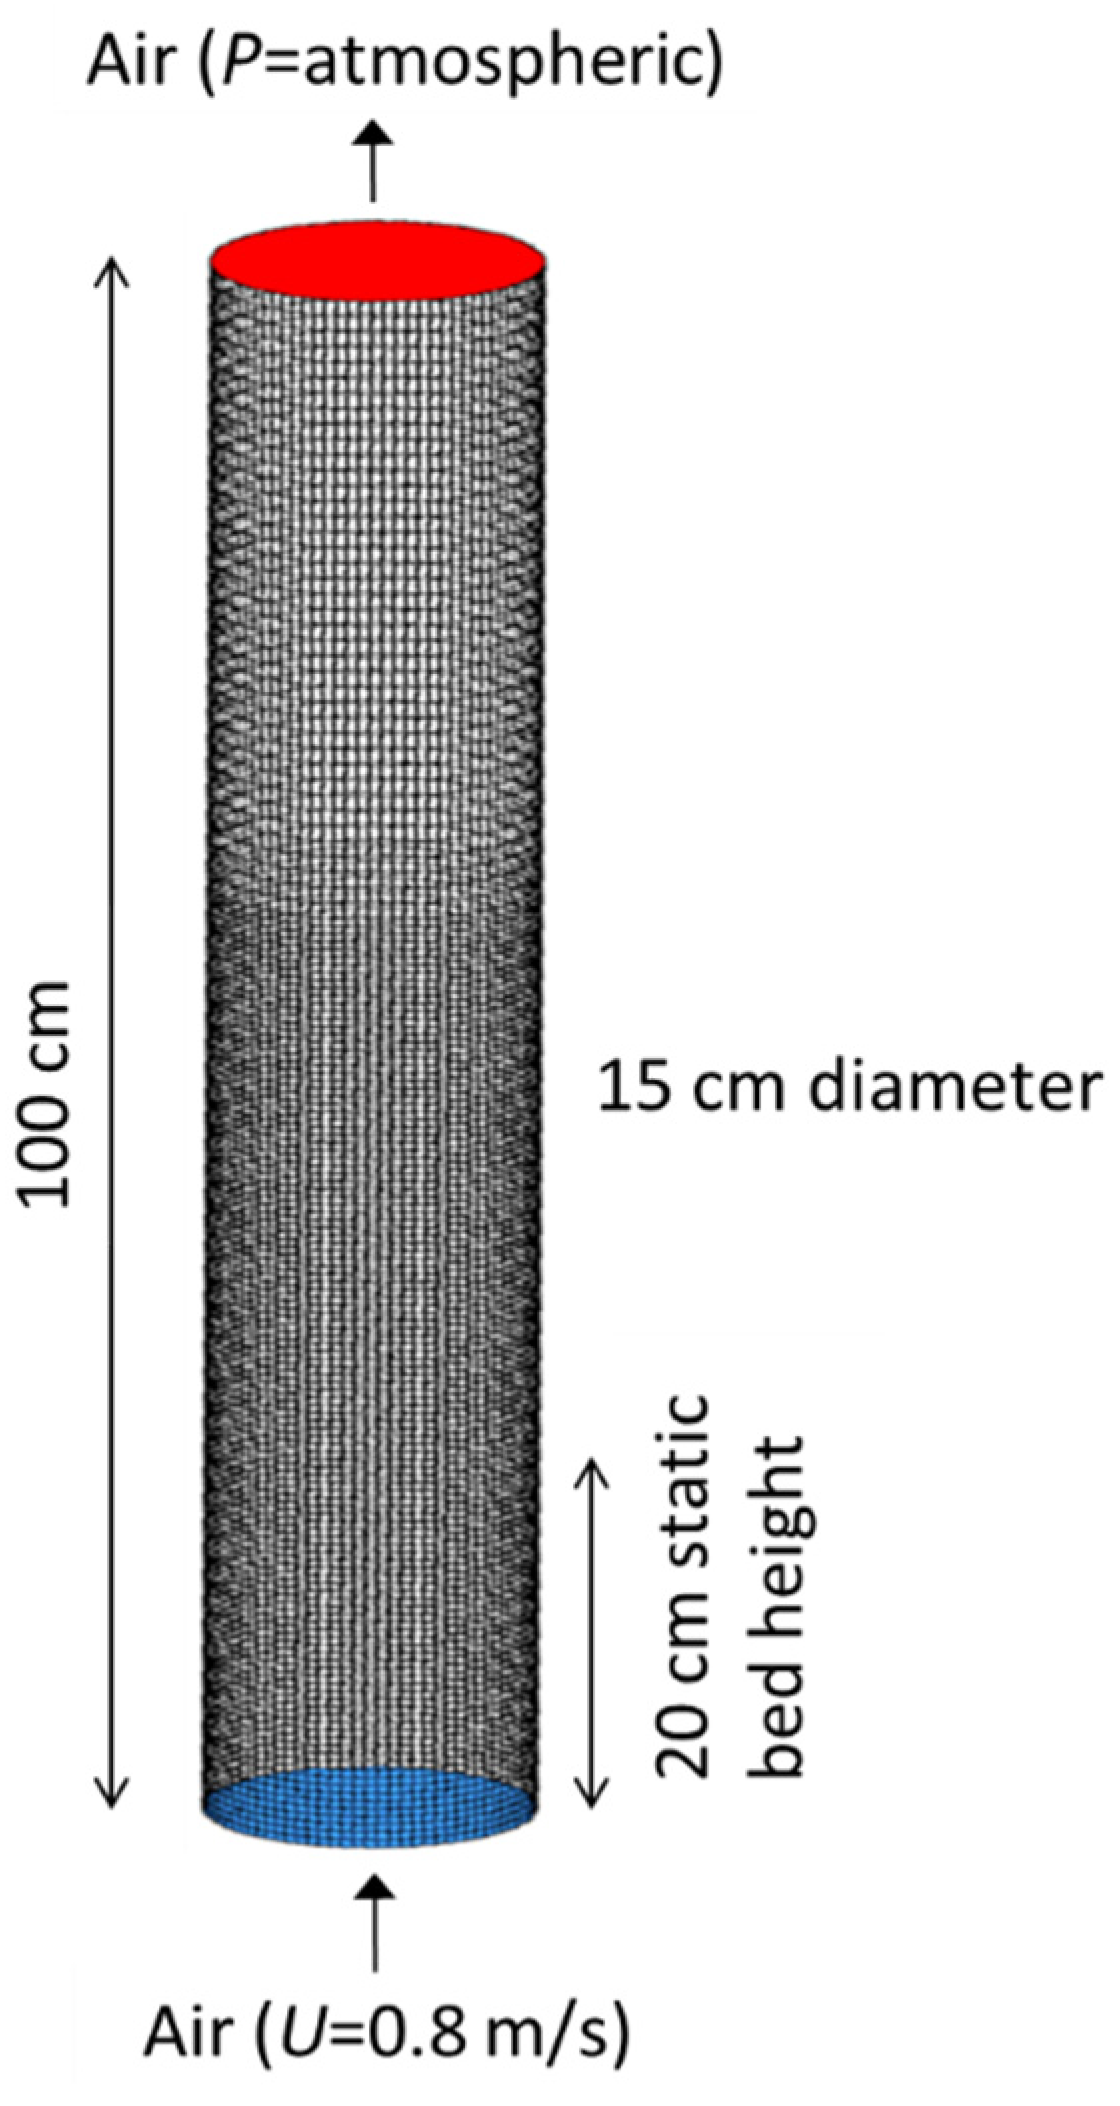
5.1. Meshing of the Simulation Domain and Solution Procedure

Figure 3 shows the geometry and meshing of the simulation domain using structured grids. The grid face size was set to minimum and maximum sizes of 3 and 7 mm, respectively, giving a total number of cells of 133,760. To confirm the reliability of meshing, grid-size sensitivity analysis was performed and this was found to produce an acceptable level of grid-independent solution. To ensure easy convergence of the partial differential equations (PDE) and optimize the computational time, the solution time step was determined using the Courant–Friedrichs–Lewy (CFL) condition, which is defined for three-dimensional PDE solution as follows:
C = u s , x t x + u s , y t y + u s , z t z C m a x
where Cmax is specified by the CFL condition to fall within the range of ~1–5 [35], t is the solution time step and x , y and z are the grid sizes in the x, y and z coordinates, respectively. u s , x , u s , y and u s , z are the particle velocity in the x, y and z coordinates, respectively. In this study, two different time steps of t = 0.1 × 10⁻³ and 0.3 × 10⁻⁴ s were used for dry and wet conditions, respectively. The wet case was found to require a smaller time step to avoid the stiffness and instability in the solution of the solid momentum equation. The convection terms in the continuity, momentum and granular temperature equations were solved using first-order discretization schemes with a maximum number of iterations of 20 per time step and a convergence criterion of 10−3 for each scaled residual component. For coupling the pressure–velocity fields, a modified SIMPLE algorithm was used [36]. The computer used in the simulation was HP Workstation (3.20 Ghz 4 Core processor with 24 GB RAM).

5.2. Boundary Conditions and Simulation Parameter

The boundary condition for the gas phase at the wall was assumed to obey no-slip condition (zero velocity), while the solid velocity and granular temperature were assumed to satisfy the boundary condition proposed by Johnson and Jackson as follows [37]:
u s , w = 6 μ s α s , m a x ( 3 Θ s , w ) 1 / 2 π φ ρ s α s g 0 , s s δ u s , w δ n
Θ s = k s Θ s γ w δ Θ s , w δ n +   3 π φ ρ s α s v s , s l i p 2 g 0 , s s Θ s 3 / 2 6 α s , m a x γ w
γ w =   3 π 1 e w a l l 2 ρ s α s g 0 , s s Θ s 3 / 2 4 α s , m a x
where φ is the specularity coefficient and e w a l l is the particle–wall restitution coefficient. To simplify the problem and avoid further increase in the computational time without jeopardizing the solution accuracy, the particle-wall restitution coefficient was kept independent of the bed wetting condition. A summary of the parameters used in the model are given in Table 4.

6. Results and Discussion

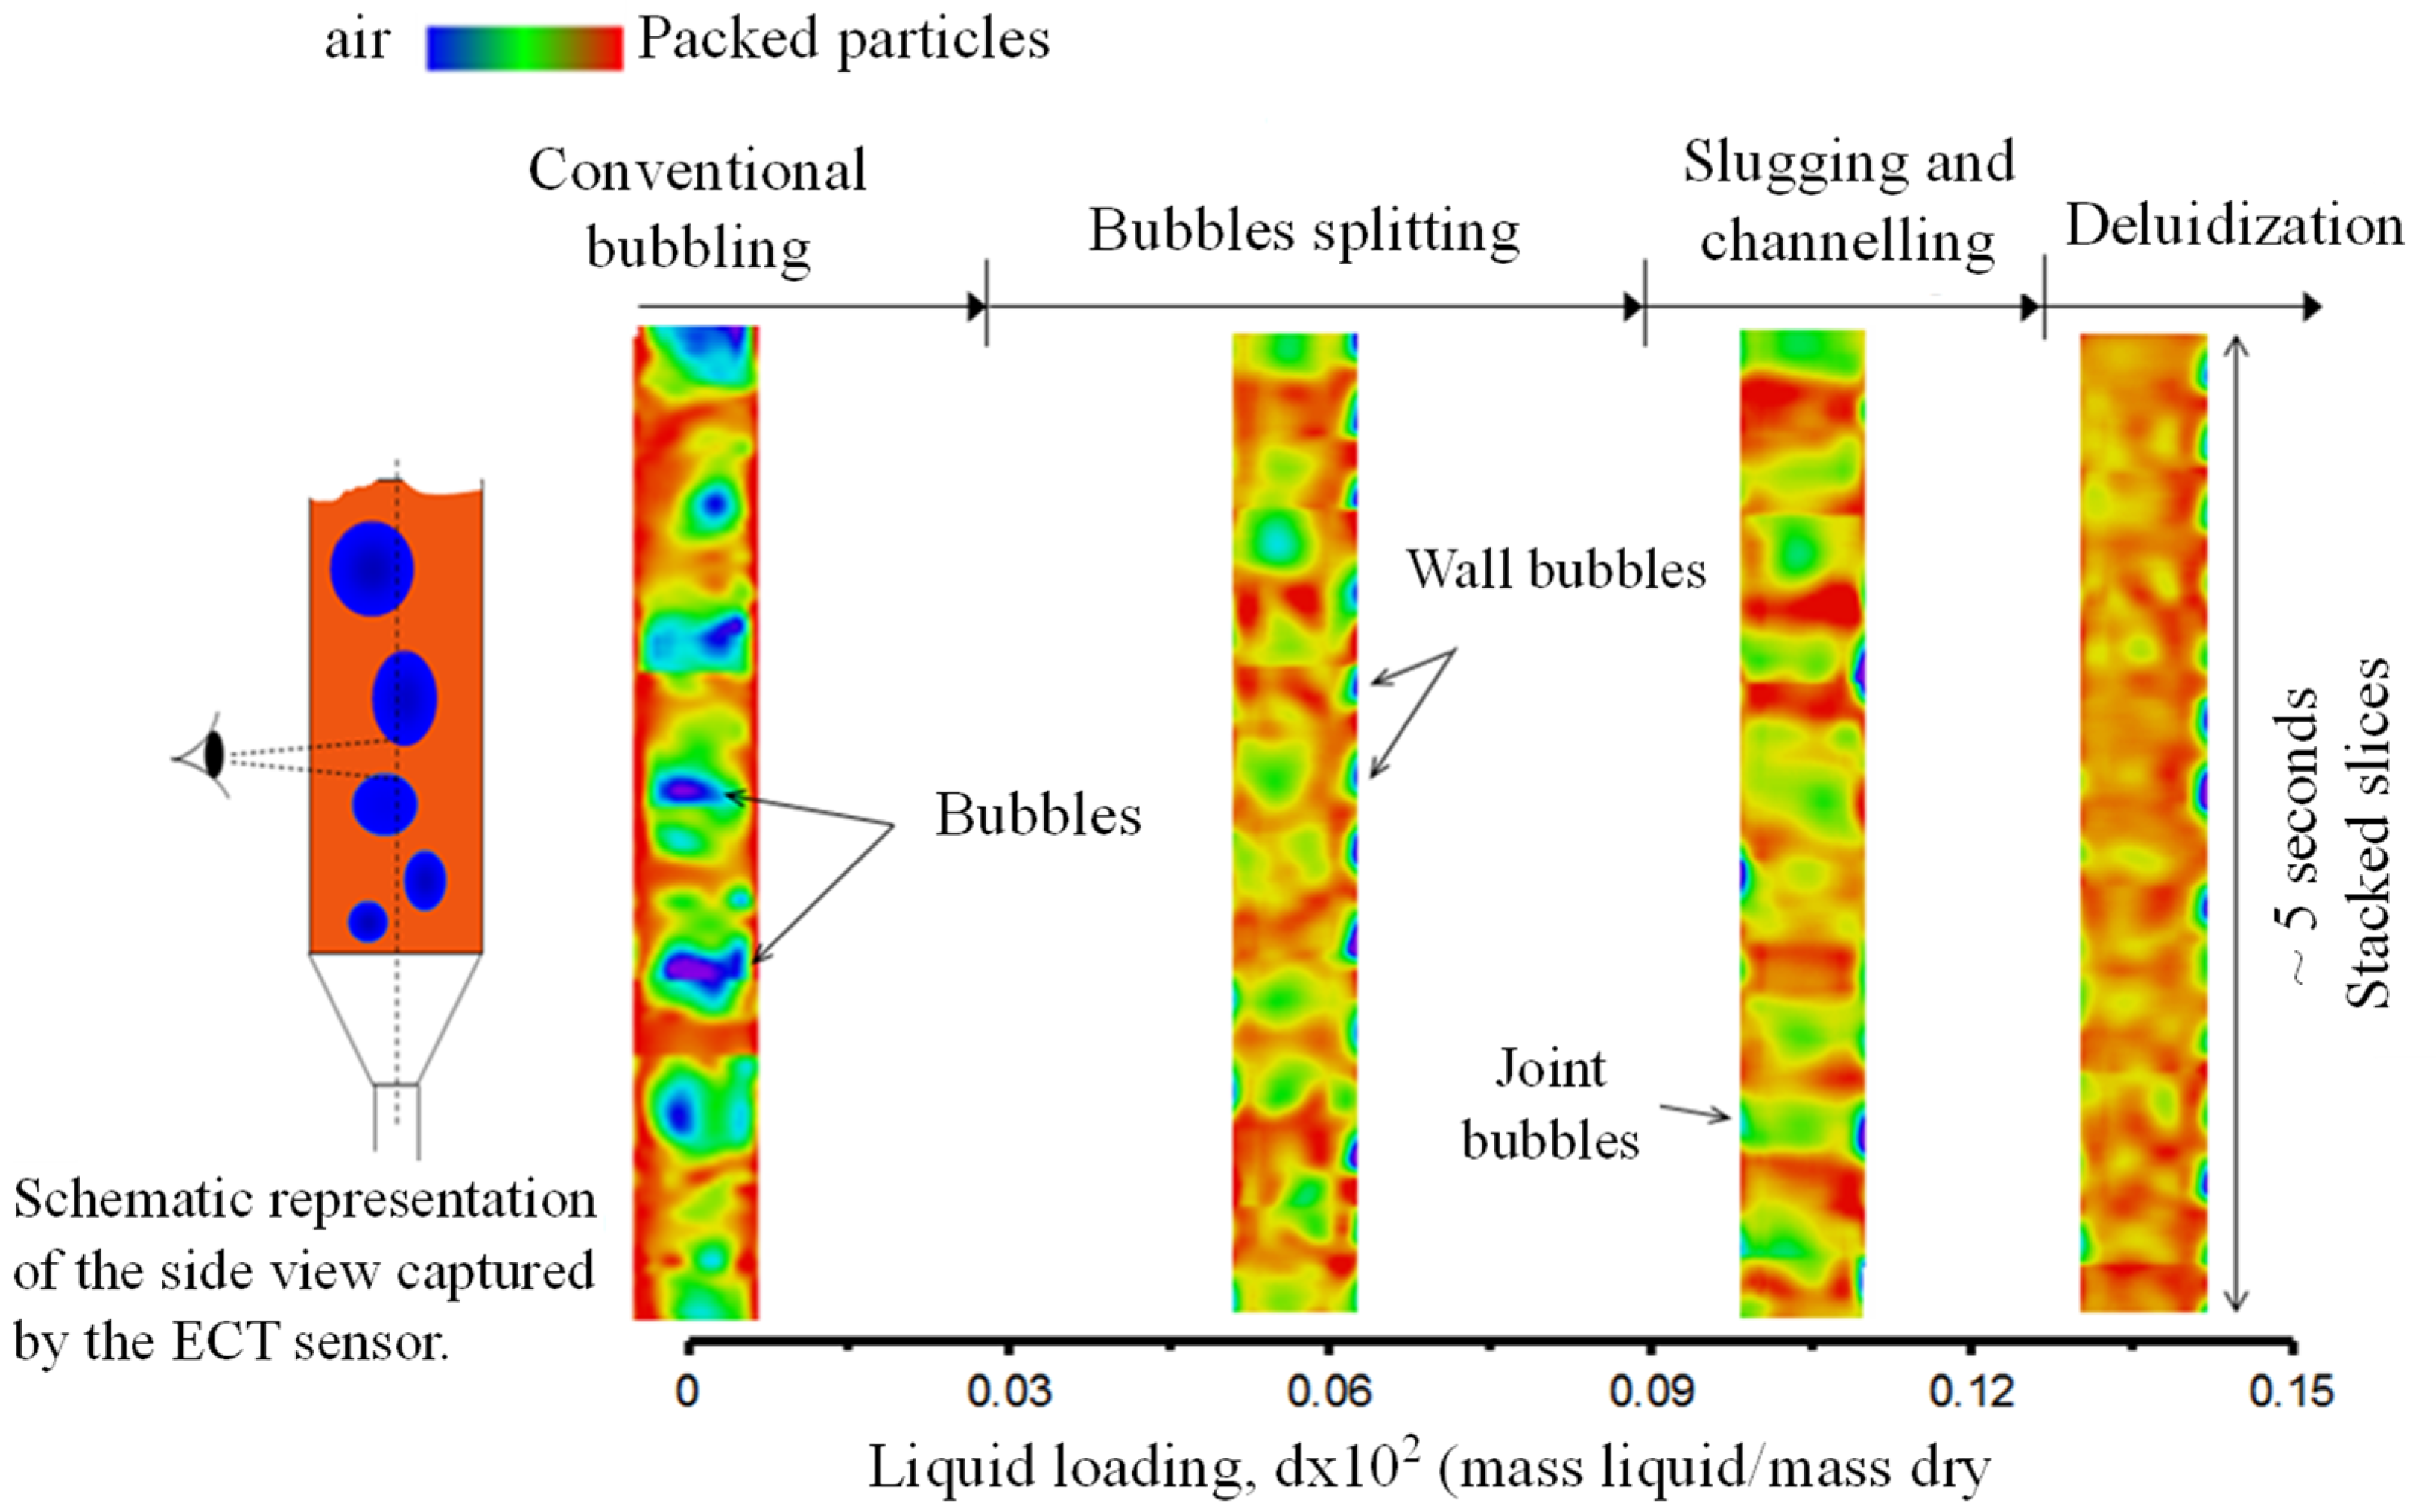
6.1. Boundary Conditions and Simulation Parameter

The section described the experimental results obtained for the large fluidized bed using the ECT system. Figure 4 shows a stack of the ECT slice images taken during the fluidization of dry and wet glass beads. These images represent a “cross-sectional view” of the bed at a given level above the distributor. It is clear in Figure 4 that a small amount of liquid in a bubbling fluidized bed causes dramatic changes in the solid distribution and bubbles characteristics. These changes can be summarized as follows:
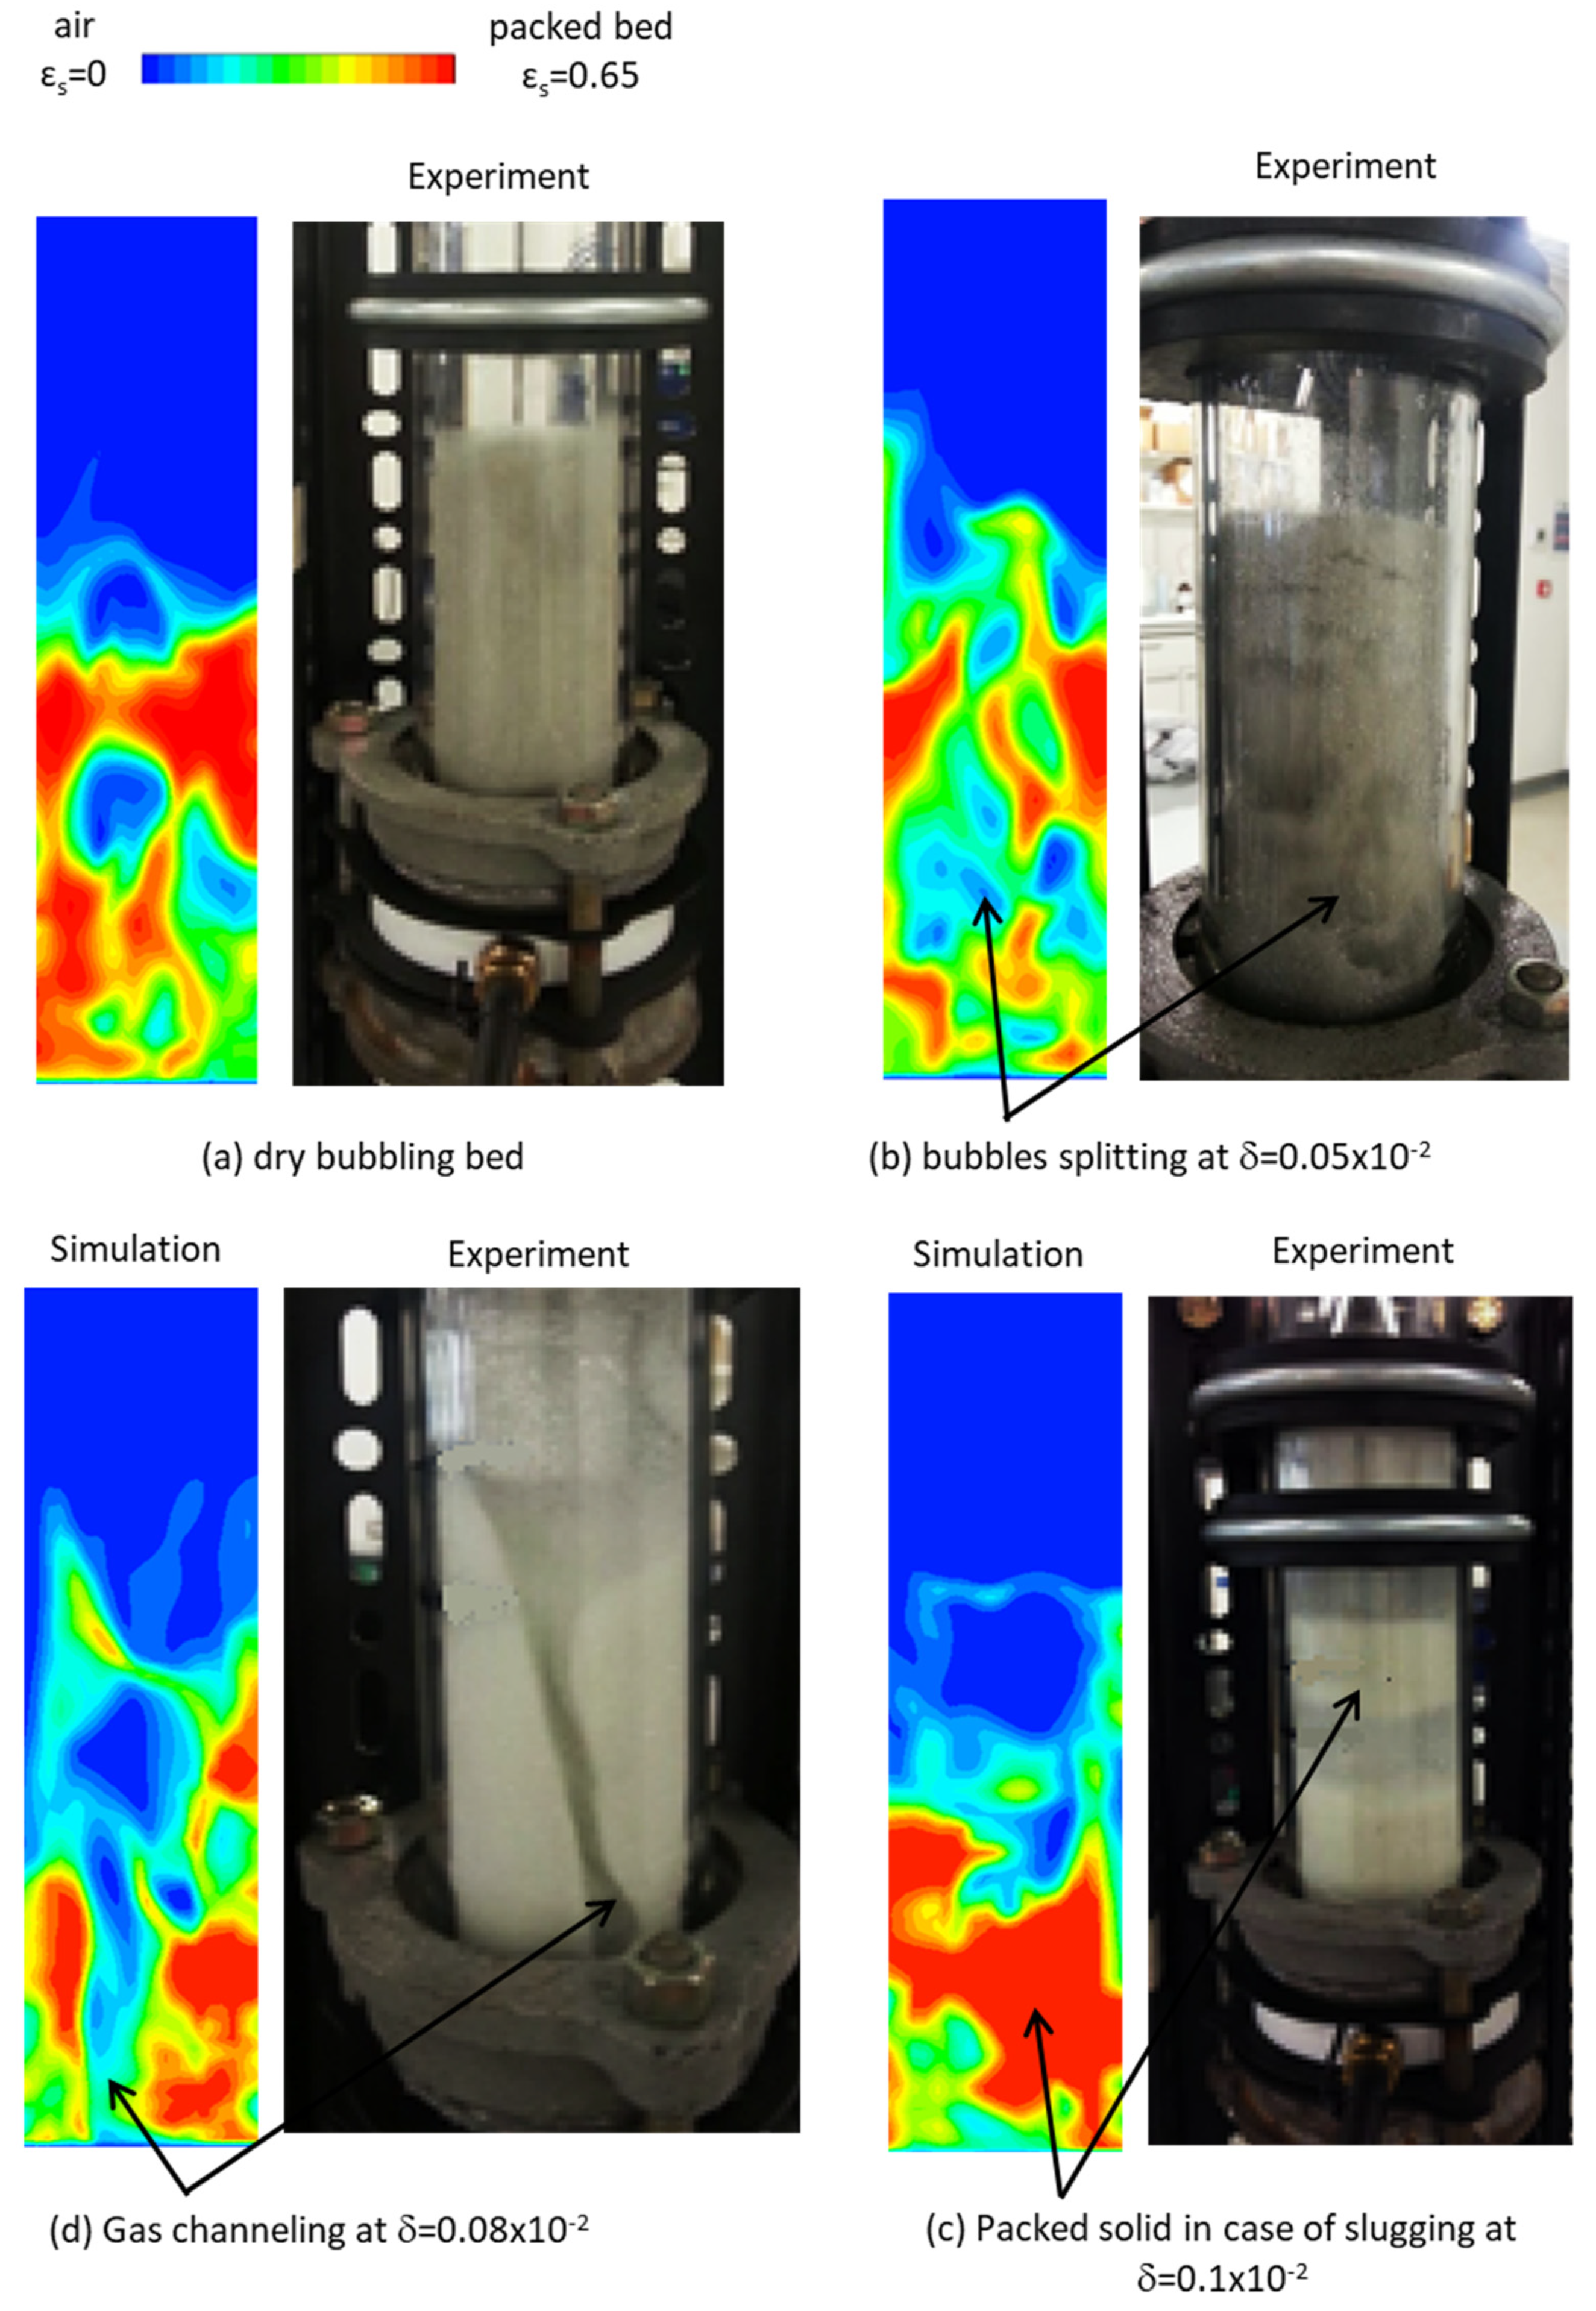
  • At a small liquid presence (δ < 0.08 × 10⁻²) there is a decrease in the bubble size, as a result of bubbles splitting, and intensified wall-bubble movements. This may also change to gas channeling with most of the gas rising through a channel adjacent to the wall. In some way, this resembles the fluidization behavior of Geldart A dry particles [2].
  • At an intermediate liquid presence (0.08 × 10⁻² < δ < 0.12 × 10⁻²) slugging is observed (jointly rising bubbles occupying more than half of the column cross-section), typically causing the bed to rise and collapse as a piston. This is of great similarity to the fluidization behavior of highly cohesive powder such as Geldart C dry particles [2].
  • At a considerably large liquid presence (δ > 0.12 × 10⁻²) the bed becomes de-fluidized with the gas mainly escaping through one or more channels.
Quantitatively, the increase in bubbles splitting at a small liquid presence can be assessed by measuring the bubbles frequency. For this purpose, the time-series data of the solid fraction fluctuation recorded by the ECT system (representing the spatial average fluctuation at the height of 7.6 cm above the distributor) was analyzed using the Fast Fourier Transform (FFT) method. A comparison of the bubble frequency spectra for dry and wet beds is shown in Figure 5. It is demonstrated that the wet bed has a wider bubble frequency distribution and more than doubled dominant frequency due to the intensified bubble splitting, thus lending support to the observation noted in point (i) above.

6.2. Comparison of the Experiment Results with the Model Predictions

This section compares the model predictions with the experimental observation in the small fluidized bed in liquid presence. In Figure 6, it is evident that the model correctly predicts the four characteristic features of wet fluidization as discussed above. The bubbles splitting, gas channeling, and slugging associated with the liquid presence are demonstrated in Figure 6b–d.
Quantitative validation is considered here by comparing the fluidization quality. Fluidization quality is characterized by a fluidization index ( F I ), commonly defined in terms of the bed pressure drop (ΔP), the mass of the bed material ( M b e d ) and the bed cross-sectional area ( A ) as follows:
F I = P A M b e d g
Pressure drop measurement remains the simplest, yet the most effective method to detect changes in the flow pattern and identify the regime transition and minimum fluidization velocities in a fluidized bed. If the dry particles are fully suspended by the gas stream, then the F I is expected to be close to unity, since in this condition the pressure force ideally balances the bed weight force. Figure 7 shows the measured pressure drop at various liquid presence and gas velocities. It is interesting to note that, compared to the dry bed measurement, the pressure drop curve for the cases of the low liquid content of δ = 0.027 × 10⁻² and δ = 0.055 × 10⁻² is lower than that of the dry case and appears to show a peak at the point of incipient fluidization velocity of 0.2 m/s. In this range of wetting conditions, the pressure drop peak is believed to be associated with the breakdown of interparticle cohesion force and particle rearrangement before fluidization. The peak is then followed by reduced pressure due to the channeling phenomena. At the high range of liquid presence of δ > 0.1 × 10⁻², the pressure drop is consistently higher than that of the dry case, mainly due to the commencement of slugging and de-fluidization.
The comparison of measured and predicted F I is shown in Figure 8. As expected, the F I value at dry conditions is close to unity. The overall model-based predictions and experimental curve trends are in satisfactory agreement within the low range of liquid loading. The observed decrease in F I is mainly due to the increase in bubbles splitting and channelling at this limit of wetting condition, as demonstrated earlier in Figure 6. At a higher liquid loading of δ > 0.1 × 10⁻², the experimental data shows the value of F I to increase above unity due to severe slugging (piston-like behavior) and increased wall shearing and friction, eventually leading to de-fluidization. This is to a great extent similar to the behavior of a highly cohesive powder, where the F I value is usually greater than 1.4 [38]. The model fails to provide a solution at a high liquid loading (δ > 0.1 × 10⁻²) because at this condition the bed is virtually static (de-fluidized) and hence, the solution diverges.

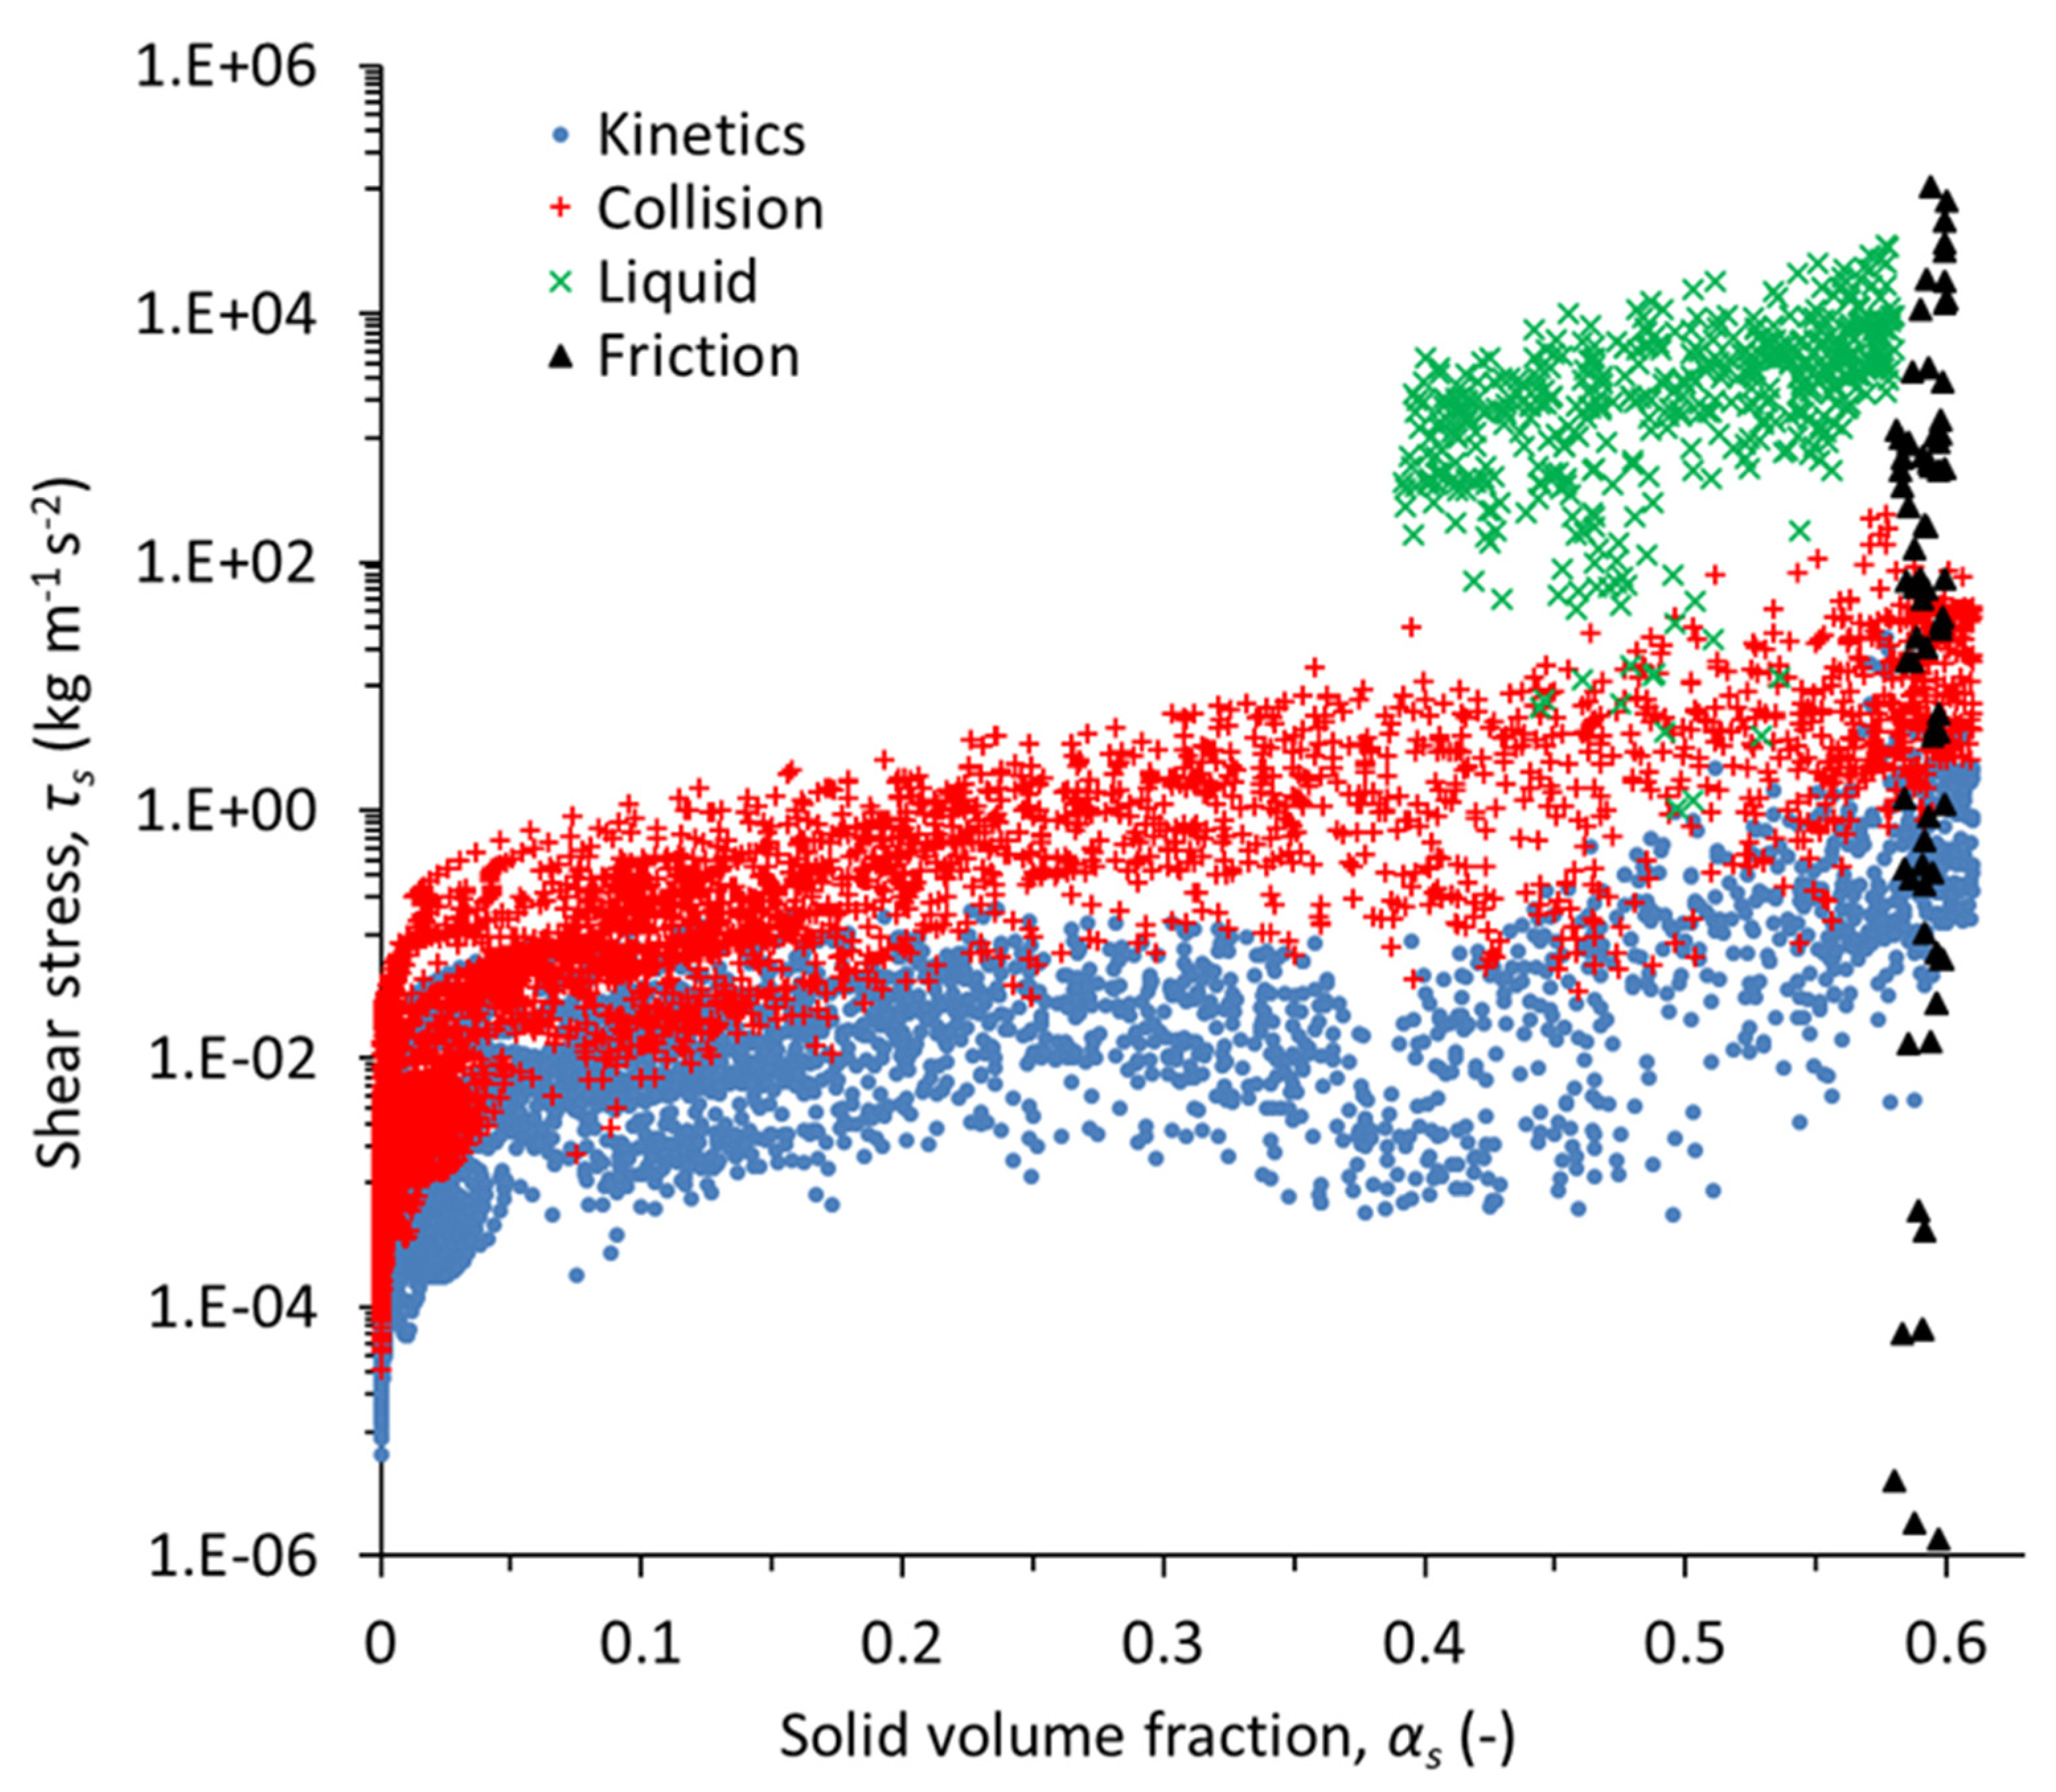
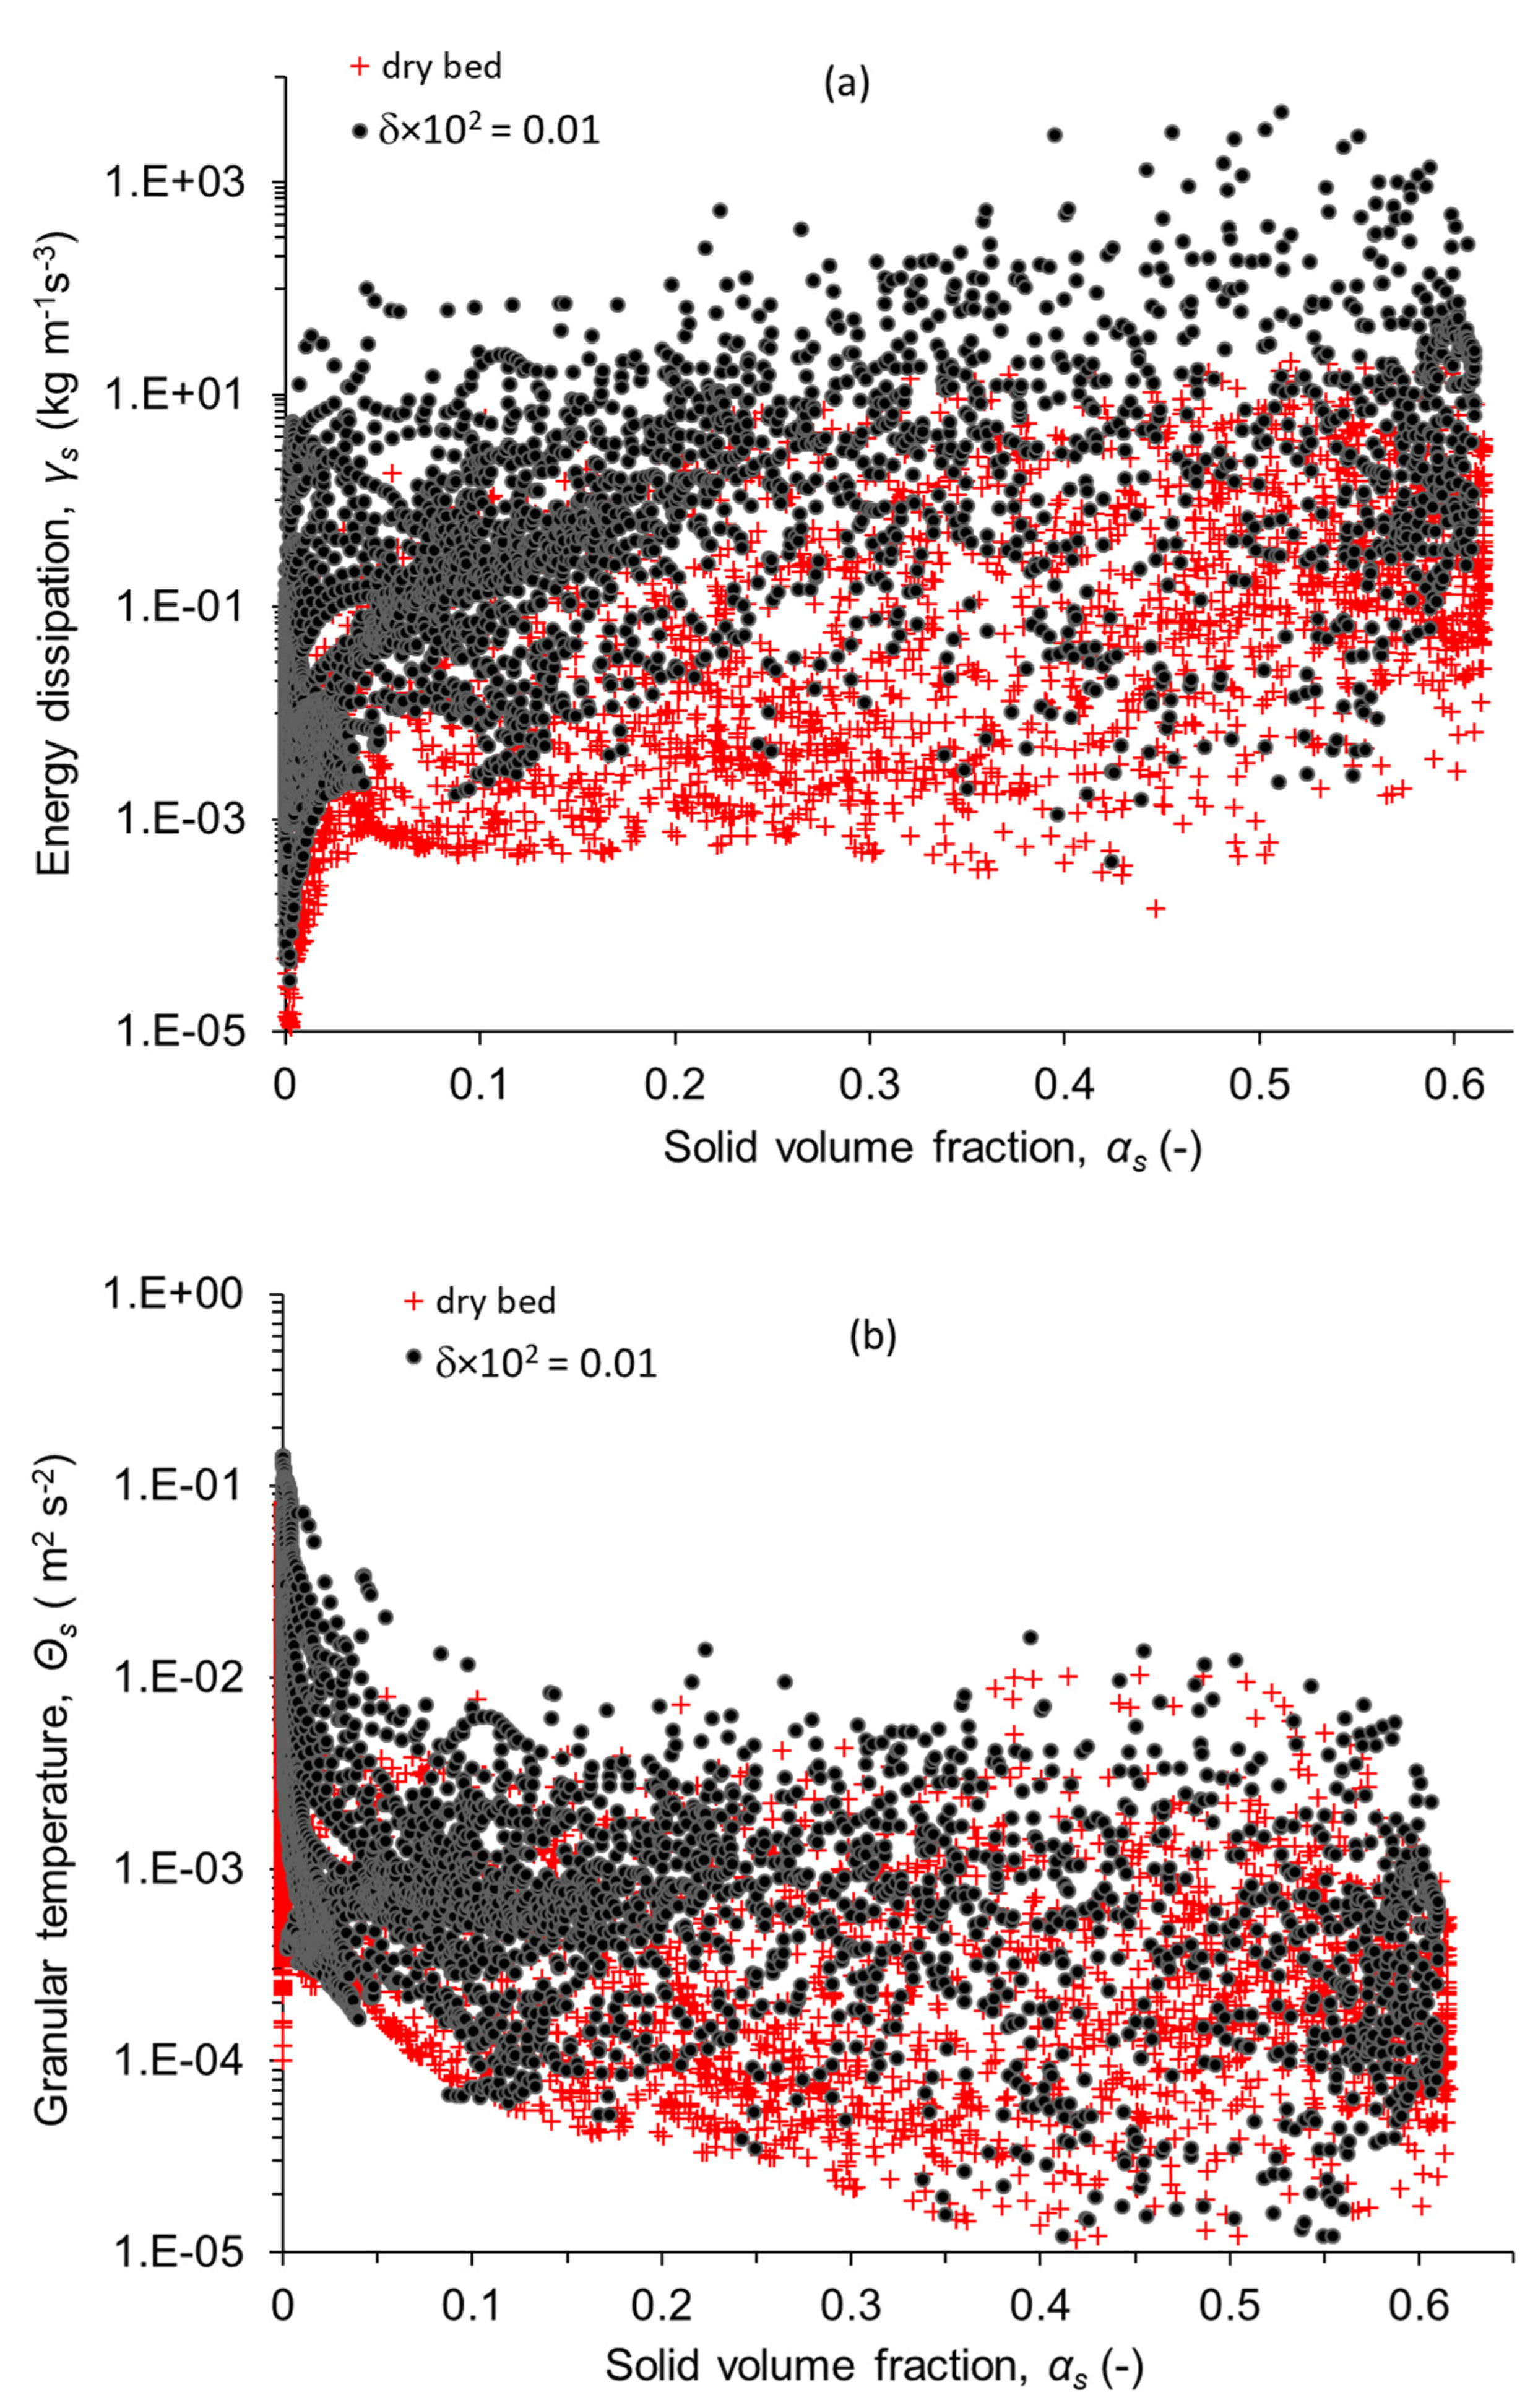
6.3. Solid Shear Stress, Energy Dissipation, and Granular Temperature

The numerical values of the dry flow kinetic, collisional, and frictional shear stress at different flow regimes (rapid, intermediate, and dense) have been previously reported by Makkawi and Ocone [39] and Makkawi et al. [40] using a one-dimensional two-fluid model based on the kinetic theory of granular flow. It was shown that at high solid fraction, the shear stress approaches the Coulomb yield condition, while in dilute flow, the particle stresses are dominated by the kinetic contribution. In between these boundaries, there is a mixed contribution of collisional and kinetic contributions. In a slightly wet particle flow, the model proposed here assumes that the liquid-induced bridge shear forces mainly dominate the flow at the intermediate regime, which has its boundaries identified in terms of the solid volume fraction through the interparticle gap distance.
Figure 9 shows the predicted solid shear stresses in the fluidized bed at the liquid loading of δ > 0.1 × 10⁻². Due to the anisotropic nature of the stresses, the reported values are for the root sum square given by τ x y 2 + τ x z 2 + τ y z 2 ). The values of the kinetic, collisional, and frictional contribution to the overall shear stress are numerically close to the range reported in the literature [41]. The liquid-induced shear stress within the intermediate flow regime dominates the overall shear stress and approaches the frictional stress at close to maximum packing. It should be noted that the scattering of the various solid stress terms appearing in this figure, i.e., different stress values at the same volume fraction, is owing to the variations of the shear rate and granular temperature at the same solid concentration.
Figure 10 shows the dependence of the energy dissipation and granular temperature on the solid concentration. In Figure 10a, the energy dissipation for the wet case is much higher than for the dry case. This is due to the reduced particle elasticity and dissipation in the liquid bridge as the restitution coefficient drops to low values. In Figure 10b, the granular temperature appears to generally drop with increasing the solid concentration. This is expected since as the particle approaches dense packing conditions, little room is available for relative particle motion and collision. Similar trends and numerical values for the dry case have been reported by Gidaspow et al. [41] and Makkawi and Ocone [39]. In the wet condition, the granular temperature is expected to be lower due to the lower particle velocity fluctuation, however, this is not well depicted here. It is possible that the energy generation associated with the additional liquid viscous stress, as implemented in the energy equation (Equation (18)), contributes to increasing the granular temperature, which is then counterbalanced by the increased energy dissipation as evident in Figure 10a. In such a case, the granular temperature may well remain within the range of the dry case due to the competing dissipation and generation terms. We believe that the relation between the energy dissipation and granular temperature, particularly for the wet case, is a complex one and requires further investigation.

7. Conclusions

The proposed model allowed, for the first time, continuum modeling of slightly wet solid-gas fluidized bed, thus extending the existing two-fluid modeling beyond its traditional boundaries. The proposed model combines theories of liquid bridge forces with the kinetic theory of granular flow (KTGF) formulations. The significant impact of the liquid presence is depicted by the increased energy dissipation similar to that observed in highly cohesive powder. The liquid-induced shear stress is found to dominate the overall shear stress and approaches the frictional stress at close to maximum packing. The experimental measurement produced by the electrical capacitance tomography (ECT) showed distinct hydrodynamic features characterized by bubbles splitting, gas channeling, slugging, and de-fluidization as the liquid present in the bed increases. Such experimental data is scarce in the open literature. Further experimental work at wider operating conditions (e.g., particle sizes, fluidization velocity, liquid properties) is highly recommended to reveal more details, provide important data for the validation of theoretical models, and help in the safe design and operation of modern fluidized bed systems for power generation and beyond. Finally, it is hoped that the proposed model will open the door for further development to address the increasing demand for new generations of fast computational models that can reasonably predict the flow in such a complex flow condition.

Author Contributions

Y.M. developed the research conceptualization, derived the model equations, developed the methodology of the solution, conducted the experimental investigation, led the project supervision and administration, and contributed to the data interpretation and writing/editing of the manuscript. X.Y. carried out the computational work using a software program (Fluent), implemented the constitutive equations on the software, and contributed to the data interpretation and writing of the draft manuscript. R.O. contributed to the research proposal, funding acquisition, project administration, and project planning. S.G. contributed to the research proposal, supervision, and writing of the manuscript. All authors have read and agreed to the published version of the manuscript.

Funding

This research was funded by The Leverhulme Trust (Grant: RPG-410).

Data Availability Statement

Data are available upon request.

Conflicts of Interest

The authors declare no conflicts of interest.

Abbreviations

Notations
C Courant number (-)
C D drag coefficient (-)
d s particle diameter of solid phase (m)
e d r y dry particle-particle restitution coefficient (-)
e s s particle-particle restitution coefficient (-)
e s i , w particle-wall restitution coefficient (-)
e w e t wet particle-particle restitution coefficient (-)
F ˙ l i q u i d dynamic liquid bridge force (kg m s−2)
g gravity (m s−2)
g 0 , s s Radial distribution function (-)
h inter-particle gap (m)
h a particle surface asperity (m)
h c r i t i c a l critical separation distance (m)
I ¯ ¯ Unit vector (-)
I 2 D second invariant of the deviatoric stress tensor (s−2)
M l , M p liquid and solid mass (kg)
N p number of particles per unit area (m−2)
P pressure (pa)
S ¯ ¯ strain rate (s−1)
S t dimensionless Stokes number (-)
S t * critical dimensionless Stokes number (-)
R e s Reynolds number of solid phase (-)
t Time (s)
u ˙ particle approach/collission velocity (m s−1)
u g , u s gas and solid velocity vector (m s−1)
u s , w particle velocity at wall (m s−1)
v r , s terminal velocity correlation (-)
Greek symbols
α g , α s volume fraction of gas and solid phase i , respectively (-)
α s m i n minimum solid volume fraction to trigger friction (=0.52) (-)
α s m a x maximum solid volume fraction at packing (=0.63) (-)
β momentum exchange coefficient (kg m−3 s−1)
γ Θ s collisional energy dissipation (kg m−1 s−3)
δ liquid to dry solid mass ratio (-)
Θ s granular temperature of solid phase i (m2 s−2)
κ Θ s diffusion coefficient of granular energy (kg m−1 s−1)
μ L liquid dynamic viscosity (kg m−1 s−1)
μ s , c o l viscosity of solid phase due to collision (kg m−1 s−1)
μ s , k i n viscosity of solid phase due to kinetics (kg m−1 s−1)
μ s , f r viscosity of solid phase due to friction (kg m−1 s−1)
μ w e t viscosity of solid phase due to liquid bridge (kg m−1 s−1)
ρ s ,   ρ g , ρ L Solid, gas, and liquid densities, respectively (kg m−3)
τ ¯ ¯ shear stress tensor (kg m−1 s−2)
ϕ angle of Internal friction (Degree)
ϕ internal angle of lubrication (Degree)
ϕ g s energy exchange between gas-solid phase (kg m−1 s−1)
γ liquid bridge angle (rad)
φ specularity coefficient (-)

References

  1. Liu, G. Application of the Two-Fluid Model with Kinetic Theory of Granular Flow in Liquid–Solid Fluidized Beds. In Granularity in Materials Science; George, K., Athanasios, C.M., Eds.; IntechOpen: Rijeka, Croatia, 2018. [Google Scholar]
  2. Geldart, D. Types of gas fluidization. Powder Technol. 1973, 7, 285–292. [Google Scholar] [CrossRef]
  3. Geldart, D. Gas Fluidization Technology; John Wiley & Sons: Chichester, NY, USA, 1986. [Google Scholar]
  4. Seville, J.; Clift, R. The effect of thin liquid layers on fluidization characteristics. Powder Technol. 1984, 37, 117–129. [Google Scholar] [CrossRef]
  5. McLaughlin, L.J.; Rhodes, M.J. Prediction of fluidized bed behavior in the presence of liquid bridges. Powder Technol. 2001, 114, 213–223. [Google Scholar] [CrossRef]
  6. Makkawi, Y.T. Investigation of Dry and Semi-Wet Fluidized Bed Hydrodynamics Utilizing Twin-Plane Electrical Capacitance Tomography. Ph.D. Thesis, Heriot-Watt University, Edinburgh, Scotland, 2004. [Google Scholar]
  7. Makkawi, Y.T.; Wright, P.C. Tomographic analysis of dry and semi-wet bed fluidization: The effect of small liquid loading and particle size on the bubbling behavior. Chem. Eng. Sci. 2004, 59, 201–213. [Google Scholar] [CrossRef]
  8. Tardos, G.; Pfeffer, R. Chemical reaction induced agglomeration and defluidization of fluidized beds. Powder Technol. 1995, 85, 29–35. [Google Scholar] [CrossRef]
  9. Mikami, T.; Kamiya, H.; Horio, M. Numerical simulation of cohesive powder behavior in a fluidized bed. Chem. Eng. Sci. 1998, 53, 1927–1940. [Google Scholar] [CrossRef]
  10. Xu, B.; Yu, A.; Chew, S.; Zulli, P. A study of the effect of liquid-induced forces on gas–solid flow by a combined continuum and discrete model. In Proceedings of the Second International Conference on CFD in Minerals & Process Industries CSIRO, Melborne, Australia, 6−8 December 1999. [Google Scholar]
  11. Jain, K.; Shi, D.; McCarthy, J. Discrete characterization of cohesion in gas–solid flows. Powder Technol. 2004, 146, 160–167. [Google Scholar] [CrossRef]
  12. Lim, C.; Wee, E.; Tan, H.; Beng, R.; Xiao, Z. Mixing behaviors of wet granular materials in gas fluidized bed systems. AIChE J. 2013, 59, 4058–4067. [Google Scholar]
  13. He, Y.; Peng, W.; Wang, T.; Yan, S. DEM Study of Wet Cohesive Particles in the Presence of Liquid Bridges in a Gas Fluidized Bed. Math. Probl. Eng. 2014, 2014, 316568. [Google Scholar] [CrossRef]
  14. Wang, M.; Zhu, W.; Sun, Q.; Zhang, X. A DEM simulation of dry and wet particle flow behaviors in riser. Powder Technol. 2014, 267, 221–233. [Google Scholar] [CrossRef]
  15. Motlagh, A.H.; Pougatch, K.; Maturi, A.; Salcudean, M.; Grace, J.R.; Grecov, D.; McMillan, J. CFD Study of Wet Agglomerate Growth and Breakage in a Fluidized Bed Containing Hot Silica Sand Particles with Evaporative Liquid Injection. Ind. Eng. Chem. Res. 2019, 58, 4396–4411. [Google Scholar] [CrossRef]
  16. Berzi1, D.; Fraccarollo, L. Turbulence Locality and Granularlike Fluid Shear Viscosity in Collisional Suspensions. Phys. Rev. Lett. 2015, 115, 194501–194505. [Google Scholar] [CrossRef] [PubMed]
  17. Tamrakar, A.; Ramachandran, R. CFD–DEM–PBM coupled model development and validation of a 3D top-spray fluidized bed wet granulation process. Comput. Chem. Eng. 2019, 9, 249–270. [Google Scholar] [CrossRef]
  18. Fries, L.; Antonyuk, S.; Heinrich, S.; Palzer, S. DEM–CFD modeling of a fluidized bed spray granulator. Chem. Eng. Sci. 2011, 66, 2340–2355. [Google Scholar] [CrossRef]
  19. Atkinson, J.H.; Brandsby, P. Mechanics of Soils; McGraw-Hill: London, UK, 1978. [Google Scholar]
  20. Samadani, A.; Kudrolli, A. Angle of repose and segregation in cohesive granular matter. Phys. Rev. 2001, 64, 051301. [Google Scholar] [CrossRef] [PubMed]
  21. Adams, M.; Perchard, V. The cohesive forces between particles with interstitial liquid. Inst. Chem. Eng. Symp. Ser. 1985, 91, 147–160. [Google Scholar]
  22. Chua, K.W.; Makkawi, Y.T.; Hounslow, M.J. A priori prediction of aggregation efficiency and rate constant for fluidized bed melt granulation. Chem. Eng. Sci. 2013, 98, 291–297. [Google Scholar] [CrossRef]
  23. Nowak, S.; Samadani, A.; Kudrolli, A. Maximum angle of stability of a wet granular pile. Nat. Phys. 2005, 1, 50–52. [Google Scholar] [CrossRef]
  24. Woodcock, L.V. Developments in the non-newtonian rheology of glass forming systems. In Molecular Dynamics and Relaxation Phenomena in Glasses: Proceedings of a Workshop Held at the Zentrum für interdisziplinäre Forschung Universität Bielefeld, Bielefeld, FRG 11–13 November 1985; Springer: Berlin/Heidelberg, Germany, 2005; pp. 113–124. [Google Scholar]
  25. Lian, G.; Thornton, C.; Adams, M.J. A theoretical study of the liquid bridge forces between two rigid spherical bodies. J. Colloid Interface Sci. 1993, 161, 138–147. [Google Scholar] [CrossRef]
  26. Goldschmidt, M.; Kuipers, J.; Van Swaaij, W. Hydrodynamic modeling of dense gas-fluidised beds using the kinetic theory of granular flow: Effect of coefficient of restitution on bed dynamics. Chem. Eng. Sci. 2001, 56, 571–578. [Google Scholar] [CrossRef]
  27. Lun, C.; Savage, S.B.; Jeffrey, D.; Chepurniy, N. Kinetic theories for granular flow: Inelastic particles in Couette flow and slightly inelastic particles in a general flowfield. J. Fluid Mech. 1983, 140, 223–256. [Google Scholar] [CrossRef]
  28. Davis, R.H.; Rager, D.A.; Good, B.T. Elastohydrodynamic rebound of spheres from coated surfaces. J. Fluid Mech. 2002, 468, 107–119. [Google Scholar] [CrossRef]
  29. Ennis, B.J.; Tardos, G.; Pfeffer, A. Microlevel-Based Characterization of Granulation Phenomena. Powder Technol. 1991, 65, 257–272. [Google Scholar] [CrossRef]
  30. Thielmann, F.; Naderi, M.; Ansari, M.A.; Stepanek, F. The effect of primary particle surface energy on agglomeration rate in fluidised bed wet granulation. Powder Technol. 2008, 181, 160–168. [Google Scholar] [CrossRef]
  31. Makkawi, Y.; Wright, P. Optimization of experiment span and data acquisition rate for reliable electrical capacitance tomography measurement in fluidization studies—A case study. Meas. Sci. Technol. 2002, 13, 1831. [Google Scholar] [CrossRef]
  32. Makkawi, Y.; Ocone, R. Integration of ECT measurements with hydrodynamic modeling of conventional gas–solid bubbling bed. Chem. Eng. Sci. 2007, 62, 4304–4315. [Google Scholar] [CrossRef]
  33. Kunii, D.; Levenspiel, O. Fluidization Engineering; Howard, B., Ed.; Elsevier: Amsterdam, The Netherlands; Butterworth-Heinemann: Butterworth, Malaysia, 2003. [Google Scholar]
  34. Ding, J.; Gidaspow, D. A bubbling fluidization model using kinetic theory of granular flow. AIChE J. 1990, 36, 523–538. [Google Scholar] [CrossRef]
  35. Courant, R.; Friedrichs, K.; Lewy, H. On the partial difference equations of mathematical physics. IBM J. 1967, 11, 215–234. [Google Scholar] [CrossRef]
  36. Vasquez, S.; Ivanov, V. A phase coupled method for solving multiphase problems on unstructured meshes. In Proceedings of the ASME FEDSM’00: ASME 2000 Fluids Engineering Division Summer Meeting, Boston, MA, USA, 11–15 June 2000. [Google Scholar]
  37. Johnson, P.C.; Jackson, R. Frictional–collisional constitutive relations for granular materials, with application to plane shearing. J. Fluid Mech. 1987, 176, 67–93. [Google Scholar] [CrossRef]
  38. De Jong, J.A.; Hoffmann, A.C.; Finkers, J. Properly determine powder flowability to maximize plant output. Chem. Eng. Prog. 1999, 95, 25–34. [Google Scholar]
  39. Makkawi, Y.; Ocone, R. Modeling the particle stress at the dilute-intermediate-dense flow regimes: A review. KONA Powder Part. J. 2005, 23, 49–63. [Google Scholar] [CrossRef]
  40. Makkawi, Y.; Wright, P.; Ocone, R. The effect of friction and inter-particle cohesive forces on the hydrodynamics of gas–solid flow: A comparative analysis of theoretical predictions and experiments. Powder Technol. 2006, 163, 69–79. [Google Scholar] [CrossRef]
  41. Gidaspow, D.; Bezburuah, R.; Ding, J. Hydrodynamics of Circulating Fluidized Beds, Kinetic Theory Approach, in Fluidization VII. In Proceedings of the 7th Engineering Foundation Conference on Fluidization, ECI Symposium Series, Gold Coast, Australia, 3–8 May 1992; pp. 75–82. [Google Scholar]
Figure 1. Wet particle interaction: (a) microscope image of wet particles (glass beads wetted with silicone oil) at static conditions demonstrating the formation of liquid bridges at the contact point; (b) schematics of the proposed flow regime and the corresponding particle-particle contacts.
Energies 17 02656 g001
Figure 2. (a) Inter-particle distance and (b) the critical separation distance for a particle diameter of 350 µm.
Energies 17 02656 g002
Figure 3. Computation domain and meshing of the fluidization column.
Energies 17 02656 g003
Figure 4. Electric capacitance tomography (ECT) images of 7.6 cm above the fluidized bed gas distributor. Each column is produced by stacking a series of images recorded at the rate of 100 frames per second and representing the spatial average solid concentration over 3.8 cm height. The data was produced in a 15 cm diameter column with the bed material consisting of 3.5 kg glass beads fluidized at the gas velocity of 0.8 m/s.
Energies 17 02656 g004
Figure 5. Fast Fourier transform (FFT) analysis of solid fraction fluctuation obtained by ECT measurement in a bubbling fluidized bed (a) dry bed (b) wet bed at δ = 0.055 × 10⁻². The data were produced at 0.8 m/s gas velocity.
Energies 17 02656 g005
Figure 6. Comparison of experimental and predicted fluidized bed material distribution at various wetting conditions. The experiments were carried out in a small fluidization column of 5 cm diameter at a fluidization velocity of 0.8 m/s.
Energies 17 02656 g006
Figure 7. Experimental fluidized bed pressure drop at various gas velocities and wetting conditions. The data was produced in a 15 cm diameter column with the bed material consisting of 3.5 kg glass beads. Each data point represents the average of three measurements (maximum deviation of 10%).
Energies 17 02656 g007
Figure 8. Comparison of the predicted and experimentally determined fluidization index (FI). The experimental data was produced in a 15 cm diameter column with the bed material consisting of 3.5 kg glass beads fluidized at the gas velocity of 0.8 m/s. Each data point represents the average of three measurements (maximum deviation of 10%).
Energies 17 02656 g008
Figure 9. Predicted solid shear stress in a slightly wet fluidized bed of 15 cm diameter at the gas velocity of 0.8 m/s and liquid presence of δ = 0.1 × 10⁻² wt% liquid.
Energies 17 02656 g009
Figure 10. Predicted (a) energy dissipation rate and (b) granular temperature as a function of the solid concentration in a dry and a slightly wet fluidized bed of 15 cm diameter at the gas velocity of 0.8 m/s.
Energies 17 02656 g010
Table 1. Examples of problems and risks associated with wet particle flow and suspension.
ProcessProblems
Coal/biomass gasificationOil/tar leading to agglomeration and severe degradation in the low-temperature regions of fluidized bed reactors
Catalytic crackingSurface catalyst melting at high temperatures leads to dead zones and de-fluidization.
Pneumatic conveyingMoisture leading to solid slugging, high-pressure drop, wear, and line blockage
Fluidized bed coating/dryingLiquid presence leads to undesired agglomeration and particle segregation
Table 2. Summary of the experiment operating conditions for the dry and wet bed.
Particle Glass beads,
Density = 2500 [kg/m3]
Diameter = 350 [µm]
Fluidization velocity Up to 0.8 [m/s]
Fluidization mediumAir at ambient condition
liquid used in wet conditionSilicon oil (Fluid 500, Dow Corning Ltd., UK)
dynamic viscosity = 0.4945 [kg/m.s]
surface tension = 0.0165 [N/m]
density = 969 [kg/m3]
Statics bed height 13 [cm] (large column)
5 [cm] (small column)
Liquid content in wet condition δ = 0.027 − 0.138 × 10⁻² [-]
Table 3. Constitutive relations for the gas-solid flow.
Solids pressure:
  P s = P s , k i n + P s , c o l + P s , f r
where
     P s , k i n = α s ρ s Θ s
     P s , c o l = 2 ρ s 1 + e s , d r y α s 2 g 0 , s s Θ s
   P s , f r = 0.05 α s α s , m i n 2 α s , m a x α s 3
Radial distribution function:
g 0 , s s = 1 α s α s , m a x 1 / 3 1  
Gas-solid drag coefficient:
β g s = 3 ρ g α s α g 4 u r , s 2 d s C D R e s v r , s u g u s
where
          v r , s = 0.5 A 0.06 R e s + 0.06 R e s 2 + 0.12 R e s 2 B A + A 2    
   A = α g 4.14 ,     B = 0.8 α g 1.28   α g 0.85 B = α g 2.65   α g > 0.85    
   C D =   0.63 + 4.8 R e s / v r , s 2    
   R e s = d s ρ g u g u s μ g    
Diffusion coefficient of granular energy:
κ Θ s = 150 ρ s d s π Θ s 1 2 384 e s s + 1 g 0 , s s 1 + 6 5 α s g 0 , s s e s , d r y + 1 2 + 2 α s 2 ρ s d s g 0 , s s e s , d r y + 1 Θ s π 1 2    
Kinetic viscosity:
μ s , k i n = α s ρ s d s Θ s π 6 3 e s s 1 + 2 5 e s , d r y + 1 3 e s , d r y 1 α s g 0 , s s  
Collisional viscosity:
μ s , c o l = 4 5 α s ρ s d s g 0 , s s e s , d r y + 1 Θ s π 1 / 2  
Frictional viscosity:
μ s , f r = P s , f r s i n ϕ  
Strain rate ( i = gas or solid):
S ̿ = U i , x x 1 2 U i , y x + U i , x y 1 2 U i , x z + U i , z x 1 2 U i , y x + U i , x y U i , y y 1 2 U i , z y + U i , y z 1 2 U i , x z + U i , z x 1 2 U i , z y + U i , y z U i , z z  
Table 4. Summary of the parameters used in the model.
Fluidization velocity, U0.8 [m/s]
Gas outlet pressure, P o u t 0 [Pag]
Wall-particle restitution coefficient, e s , w 0.8 [-]
Dry particle-particle restitution coefficient, e s , d r y 0.9 [-]
Maximum allowable solid concentration, α s 0.61 [-]
Critical frictional solid concentration 0.58 [-]
Internal angle of friction, ϕ 30 [deg]
liquid contact angle, γ 0.175 [rad]
Specularity coefficient, φ 0.5 [-]
Disclaimer/Publisher’s Note: The statements, opinions and data contained in all publications are solely those of the individual author(s) and contributor(s) and not of MDPI and/or the editor(s). MDPI and/or the editor(s) disclaim responsibility for any injury to people or property resulting from any ideas, methods, instructions or products referred to in the content.

