Abstract
The preservation of perishable food items within the cold chain is a critical aspect of modern food logistics. Traditional refrigeration systems consume large amounts of energy, without an optimal temperature distribution, leading to potential food spoilage and economic losses. In recent years, the integration of Phase Change Materials (PCMs) into cold chain systems has emerged as a promising solution to address these challenges. This article presents a comprehensive analysis of the utilization of PCMs for food preservation in a refrigerated truck, focusing on the impact on temperature control, phase change fraction, costs, and energy savings. The effectiveness of PCM-based refrigeration system to maintain the refrigerated truck at a temperature of −18 °C under various scenarios and environmental conditions using a transient model was evaluated. The TRNSYS model includes a representation of a conventional refrigerated van’s system, with simulations conducted in a Mediterranean climate (Naples). The model’s core components consist of Type 56 for cooling load estimation and Type 1270a for the new PCM component. Results indicate that for guaranteeing −18 °C for 10 h, 96.4 kg and 102.2 kg of E-26 and E-29 PCM are needed, respectively, for scenarios with 10 door openings during transportation and for two different velocities of the truck: 30 and 80 km h−1. Results indicate that the incorporation of PCMs in the refrigerated van leads to significant improvements in temperature stability and uniformity, thereby extending the shelf life of perishable food products and reducing the risk of spoilage. Furthermore, the analysis shows that, using the PCMs, a significant reduction of the energy costs can be obtained (up to a maximum of around 79%).
1. Introduction
The availability of food for a growing world population has been a matter of concern for decades. Despite this, in many countries, post-harvest losses are huge due to insufficient food storage. The recent rise in the price of fossil fuels further increases the cost of food, thus increasing the demand for energy efficiency. Ice for food storage was probably the first application of Phase Change Materials (PCMs) for transport and quick cooling in food processing. Distribution and transport take place before food products are delivered to customers, which makes temporary storage of raw materials, semi-finished products, and finished products [1] inevitable. However, most vegetables, meats, and fruits quickly deteriorate at room temperature due to microbial deterioration and oxidation. A low-temperature environment prolongs storage time by inhibiting microbial growth and chemical changes, thereby maintaining food quality [2]. Therefore, for the storage and distribution of food, cold chain structures, represented by Refrigerated Warehouses (RWHs) and cooled trucks, have become a vital part of the food supply chain. Food quality and maximum shelf life are generally sensitive to variations in storage temperature [3]. The cold chain is responsible for storing and transporting perishable foods within the appropriate temperature range to slow down biological degradation processes and provide consumers with safe and high-quality foods. Studies show that the cold chain’s efficiency is often far from ideal, as there are frequent changes in temperature above or below the product-specific optimal temperature range, a situation that significantly increases food waste and puts food safety at risk. The stages of the cold chain are divided into: production and processing of the product; storage in a refrigerator warehouse; transport; retail sale; preservation; and consumption. This work has focused on the transportation phase of food items. This phase is of crucial importance for the cold chain. Vehicles, in fact, must be equipped with refrigerators already at the required temperature, which will have to be in place during the transport to another refrigerator storage facility or at the points of sale of the large organized distribution. Operators use instruments to control the air temperature in the compartment.
The continuous rise in greenhouse gas emissions, fuel prices, and the limited availability of fossil fuels are pushing towards the use of various renewable energy sources. Thermal Energy Storage (TES) temporarily stores thermal energy for later use. Sensitive heat and latent heat are the main types of energy storage options. In heat-sensitive TES systems, the temperature of the storage medium (which can be water, soil, rock, salmon, etc.) changes to store energy. In TES systems of the latent heat type, a phase change occurs to store energy; for example, refrigerated storage of ice. The effectiveness of a TES system for a specific application is based on a number of variables, including storage duration, economic aspects, temperature requirements of supply and use, storage capacity, and availability of space and heat. The focus will be on latent thermal energy systems [4,5,6]. A Phase Change Material (PCM) is a type of latent heat storage material that absorbs or releases heat by undergoing an isothermic or quasi-isothermic phase transformation from liquid to vapor, from solid to liquid, or vice versa. Solid–liquid PCMs work like conventional storage materials, whose temperature does not change with heat absorption. Differently from the sensitive storage materials, the main advantage of PCMs is the stability of the absorption rate and heat release [7,8].
In this study the attention is focused on the use of PCMs in refrigerated trucks. The use of PCMs in refrigerated trucks with numerical simulations and experimental campaigns has already been addressed in the literature. In 2012 and 2014 Liu et al. [9,10] proposed the use of an innovative PCM-based refrigeration system in a refrigerated truck. The unit with the PCMs was placed outside the refrigerated compartment and was connected to a cooling unit placed in the compartment through a secondary fluid. The PCM used was a solution of water and hydrated salts with a melting point of −30.6 and −26.7 °C. The compartment was kept at −18 °C. Experimental studies were conducted and a model was developed in TRNSYS with the climate of Adelaide in Australia for numerical simulations. From the results obtained it was seen that it was possible to save up to around 80% using the PCM.
Mousazade at al. [11] conducted an experimental study on a 6-ton refrigerated truck using three types of PCMs (E-26, E-29, and E-32). The PCMs were positioned inside the refrigerated compartment through plate heat exchangers. The air that exchanged with the PCMs was in natural convection. The effect of the speed of the refrigerated truck (at 81 and 110 km h−1) on the global exchange coefficient and on the temperature distribution in the compartment was studied.
Taher et al. [12] studied a PCM cooling system positioned on the ceiling of the refrigerated compartment of a truck using a numerical model. This system worked to reduce temperature fluctuations in the compartment when the doors were opened. The truck was also equipped with a traditional vapor compression cooling system. It was found that with PCM it was possible to reduce the cooling energy required during door opening up to a maximum of 61%. In another work Liu et al. [13] studied a PCM-based refrigerating unit on a refrigerated truck installed on the front of the compartment in the weather conditions of Guangzhou, China. An experimental test campaign has been carried out to evaluate the temperature distribution in the compartment and the energy cost saving (up to a 91.4% reduction).
This paper investigates the efficacy of two PCMs with two different melting temperatures (−26 °C and −29 °C) applied to the ceiling of a refrigerated van. Results reveal significant insights into temperature regulation, PCM consumption rates, and economic savings, providing valuable data for optimizing thermal management strategies in refrigerated transportation systems. This research offers novel insights into the application of phase change materials in the context of refrigerated transportation. By examining the effectiveness of PCM integration into the ceiling of a refrigerated van, this study contributes valuable data on temperature control, PCM utilization rates, and economic benefits. Such findings have the potential to inform future research and aid in the development of more efficient and cost-effective thermal management solutions for cold chain logistics and refrigerated transport industries.
2. Physical and Technical Requirements of the PCMs
The temperature range in which the phase change occurs allows us to classify PCMs into three main groups:
- low-temperature PCM, in which phase change occurs below 15 °C. Typical applications are air conditioning and cooling.
- PCM at average temperature (phase change temperature between 15 °C and 90 °C). They are the most widespread because they are used for the storage of hot water in solar plants, as passive systems in buildings for the maintenance of comfort and environmental air conditioning, and in the cooling of electronic components.
- High-temperature PCM (more than 90 °C) is used in industrial applications, in solar power generation plants, and in aerospace applications.
Figure 1a shows a classification of PCMs according to the state transition temperature and the latent heat associated with the status transition. PCMs can also be classified as liquid–vapor, solid–liquid, solid–solid, and solid–vapor. However, the phase change and thermal transition of solid–solid PCMs are often very slow. Solid–liquid PCMs, classified into organic, euthetic, and inorganic categories, are considered the best materials for storing thermal energy in structures. The latent heat storage technology, which is an application of the cold preservation technology of phase change materials, has received extensive attention and research due to its high energy storage density [14]. Currently, energy storage applications such as energy saving in buildings [15], solar heat storage [16], and cold storage of food and medicines [11,12] widely utilize cold storage technology. In the process of transforming the cold storage and discharge phases, the phase change material can maintain a constant temperature without generating large temperature fluctuations [17]. The application of cooled trucks and refrigerated containers to cold chain logistics not only prolongs the food’s storage period but also reduces its damage rate [18]. Low thermal conductivity is a common defect in many PCMs. Inserting wings [19], adding a material with high thermal conductance [20], and combining PCM and porous structural material can increase heat transfer to overcome the disadvantage of low thermal conductivity. The addition of nanoparticles to phase change organic materials, based on the high thermal conductivity and high-frequency Brownian motion of the nanoparticle, represents an important improvement in the thermal conductance of the materials [21]. To determine the correct PCM to be used, it is important to assess physical requirements such as phase change temperature, entropy, cycling stability, and subcooling (also called supercooling) [22]. The phenomenon of supercooling involves cooling a substance significantly below its melting point to initiate solidification and release thermal energy. If the temperature does not reach that threshold, the PCM will not undergo solidification and will only be able to store perceptible heat (Figure 1b).
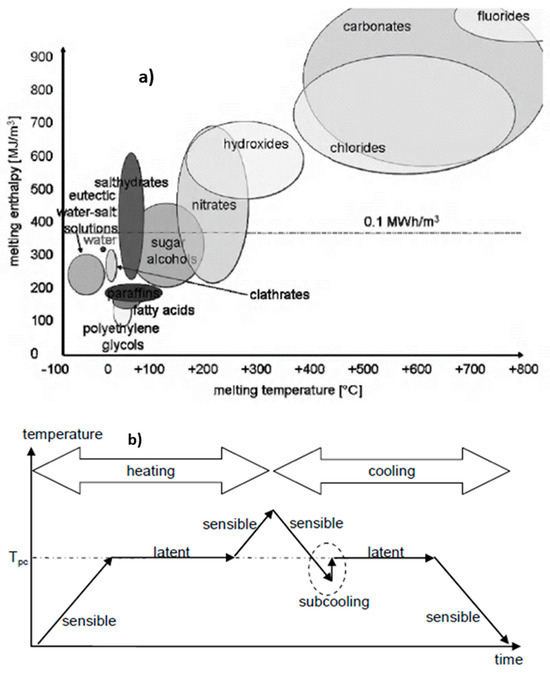
Figure 1.
PCM properties: (a) classification of PMC; (b) temperature change of PCM.
3. Theoretical Approach for Temperature Control in Transport Containers with PCM
In this section, the theoretical basis of the PCM physics is introduced with the final aim of correctly dimensioning the amount of PCM to be employed for maintaining the compartment temperature at −18 °C. The PCMs used in these simulations are of the low-temperature type and are based on solid–liquid transition. The PCM stores latent heat at constant temperature during phase transition. After the phase transition is completed, the temperature increases until it reaches the temperature of the compartment. To describe the heat transfer inside the PCM, the enthalpy method has been applied which is based on the following equations [23,24]:
The specific enthalpy () is defined by the sum of both sensible and latent heat:
where is the liquid fraction and L is the latent heat of the PCM. In Equation (1) m is the mass of PCM, and the quantity, van is the sum of the power absorbed by the air infiltrations (inf) caused by any opening of the box door transmitted through the walls (tras), the power coupled with mechanical equipment (mec), and possibly the power associated with people (p). The power of the fan motor can be evaluated based on the actual electric energy consumed during operation. Generally, the fans of the cooling unit work continuously. However, the fans can be turned on and off to control the temperature and save energy. The contribution to the total cooling power resulting from the fan power alone was considered 10% of the total.
To assess the infiltration power for fully established flow, the following equation [25] is used:
where is the surface of the door of the truck, and are the enthalpy of the air flow in the external and internal conditions, respectively; and are the density of the refrigerated air and of the infiltration air, respectively; g is the gravitational constant; H is the door height; and is the density factor defined as follows [25]:
is estimated by considering the conduction and convection heat losses through the refrigerated truck body. The solar radiation effect on the external surfaces was considered:
where is the solar irradiation, is the external heat transfer coefficient that takes into account the truck velocity, is the equivalent radiative heat transfer coefficient, the is the external air temperature, is the temperature of the external walls of the truck, is the ambient temperature.
The thermal power transmitted through the walls of the truck is defined by the following equation:
where is the overall heat transfer coefficient that considers the resistance of the various layers of materials of which the walls are made.
is the energy flow from the inside of the van considering the heat transfer by convection between the cold air moved by the fans and the internal walls:
In this study, the component of the thermal power due to people was neglected as it is assumed that there is no presence of people inside the container. Furthermore, an additional hypothesis has been made neglecting the thermal load due to the products to be stored (which are already supposed to be at the storage temperature).
4. Case Study and TRNSYS Model
The case study envisages the use of PCM inside a refrigerated compartment for the local transportation of food products. During the transport phase, the PCM absorbs the accumulated heat inside the compartment, maintaining a constant internal temperature to prevent potential product deterioration. One of the advantages of this cooling system over a conventional one is the reduction of energy consumption (in particular, fuel consumption) and the resulting production of polluting products. A cooling system is modeled for a typical refrigerated van, whose dimensions are 3 m × 2 m × 1.8 m. The equipment load dissipates 117 W of heat. When the door of the compartment is closed, there is no infiltration of any kind; depending on the number of times the door is opened, there is a different model for infiltrations by means of Equation (5). Each wall of the compartment has a stratigraphy from a panel of polyurethane of thickness equal to 50 mm enclosed in two layers of galvanized steel 1 mm thick. Table 1 displays the thermophysical properties of the walls.

Table 1.
Thermophysical properties of walls.
For the case study the following assumptions have been used:
- the reference climatic conditions are those of Naples (Italy) and the external temperatures considered in this study are those that are the warmest during the year, as the hottest day of the year was chosen for sizing the PCM in order to meet the cooling demand on all days of the year;
- the van makes 10 stops during which the operator opens the door for 1 min. It was considered that during the journey which lasts 10 h (from 8.00 a.m. to 6.00 p.m.), the truck makes one stop per hour to load or unload the food products;
- food products that are stored inside the van are already at the storage temperature set at −18 °C, therefore, the thermal load due to the cooling of food products is neglected;
- Two different velocities of the van (30 and 80 km h−1) have been considered to study two different scenarios: the first refers to a van transporting food products in an urban area where the speed limit is 50 km h−1 (so the average speed of a van is 30 km h−1); the second considers transport on a highway where the speed limit is 90 km h−1 (with an average speed of a van at 80 km h−1).
This study evaluated the use of PCMs placed inside the refrigerated compartment on the ceiling. Respecting the guidelines presented by Lane et al. [22] in terms of phase change temperature, entropy, and supercooling, two types of euthetic PCMs, called E-26 and E-29, have been selected (properties are reported in Table 2).
Table 2.
Thermophysical properties of PCM.
Based on these assumptions and by applying the equations presented in the previous section it is possible to obtain the thermal energy required to ensure the correct storage of the food present inside the van.
Transient Model and Governing Equations
The case study introduced in the previous paragraphs was analyzed with the help of the TRNSYS18 software. The database implemented in TRNSYS includes many of the components (called “types”) for thermal and electrical energy uses, as well as modules for managing input data. The component that represents the building (Type 56) models and incorporates all the parameters necessary to represent radiative exchanges between surfaces, convective exchange, solar radiation, and conductive exchange. Type 1270 models a PCM wall and allows the user to incorporate a layer of PCM anywhere within the wall structure.
The assumptions in the Type 1270 are:
- the specific heat of the PCM is constant and equal in both liquid and solid state;
- the thermal contact resistance between the PCM and adjacent layers is negligible;
- the solidification and melting processes take place at a fixed temperature.
To make a comparison with a standard cooling system (vapor compression system), a standard van installation system (Figure 2) was first modeled (Type 166) to allow the assessment of the energy demand required to meet the requirements defined above. Subsequently, a model was developed to simulate the use of PCM on the ceiling of the van without the use of the standard refrigerator. The quantity of PCM (and its size) was obtained from the amount of energy needed to keep the temperature inside the compartment at about −18 °C. The PCM is encapsulated into a plate, inside which there are tubes (diameter 12.7 mm and length 19 m) in which a solution of water and ethylene glycol (50% by weight) flows. The heat carrier fluid is then used to cool the air of the compartment in a fan coil (the same one that is used for the vapor compression system). The fan circulates air inside the van at a capacity of 1500 kg h−1. The PCM unit can be charged by a refrigeration unit when the vehicle is stationary in the warehouse. The refrigeration unit is powered during the nighttime by electricity instead of the internal combustion engine (off-vehicle recharging system).
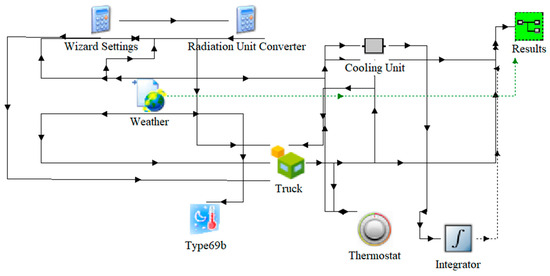
Figure 2.
TRNSYS model of a truck with vapor compression system standard.
The amount of energy required (in the 10 h time frame) is 25,540 kJ considering 10 door openings, on a typical July day in the city of Naples, with an average van speed of 30 km h−1. Under the same conditions, but considering an average speed of the van of 80 km h−1, the amount of energy required is equal to 30,104 kJ. The PCM dimensioning has been assessed when the van has an average speed of 30 km h−1. Therefore, for PCM E-26, the total mass of PCM is 96.4 kg, whereas a mass of 102.2 kg is required in the case of E-29 PCM. Installing the PCM on the truck ceiling at a fixed thickness of 44 mm yielded a surface area of 1.75 m2 for the E-26 PCM and 1.64 m2 for the E-29 PCM. Figure 3 shows the van’s dynamic model with the PCM unit inserted.
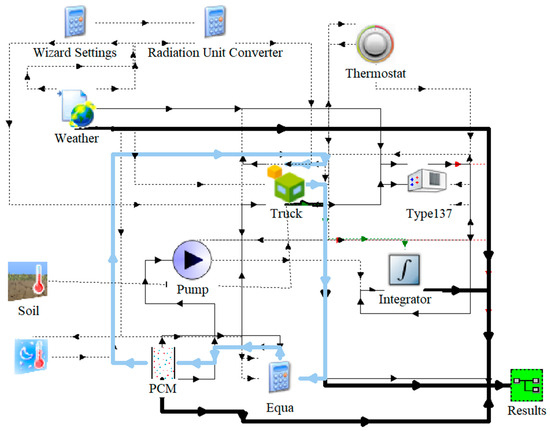
Figure 3.
TRNSYS model of a truck with the PCM unit.
5. Results
This section presents the results on a refrigerated truck maintaining a temperature of −18 °C. The results consider the design conditions and the comparison with a traditional refrigeration system based on vapor compression. The dynamic simulations were carried out considering the weather conditions of a typical 10 h working day on a typical summer day in July (the most energy-consuming conditions) in the city of Naples. Figure 4 shows the instantaneous power absorption of the standard vapor compression system (model: Thermo King ES150).
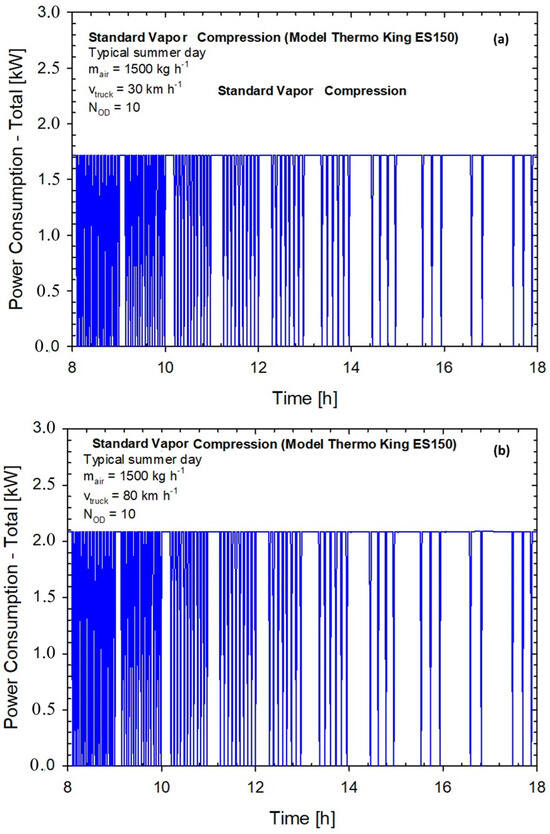
Figure 4.
Power consumption of standard vapor compression as a function of time for different truck velocities: (a) 30 km h−1; (b) 80 km h−1.
From the graphs, it is clear that in the first hours of the working day, the system remains less active as the infiltration load is relatively low; from 1.00 p.m. the ON time of the vapor compression plant increases since the infiltration load is much more effective. When the truck moves at 80 km h−1, the heat exchange between the external and the internal environment becomes more effective, and therefore the power consumption increases. As a result the Energy Efficiency Ratio (E.E.R.) is always lower than that at 30 km h−1, as shown in Figure 5.
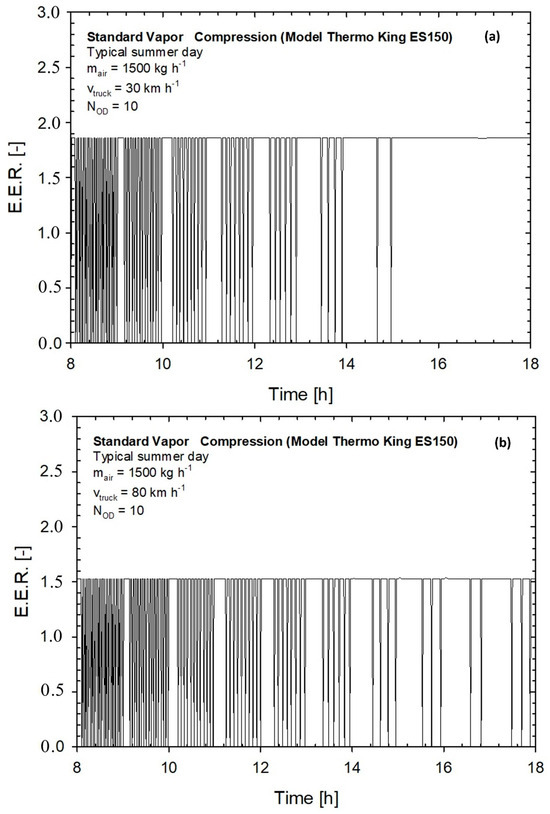
Figure 5.
Energy efficiency ratio of standard vapor compression as a function of time for different truck velocities: (a) 30 km h−1; (b) 80 km h−1.
Figure 6 reports the temperature of: air inside the van, external air, and PCM as a function of time for the PCM-based refrigerated unit.
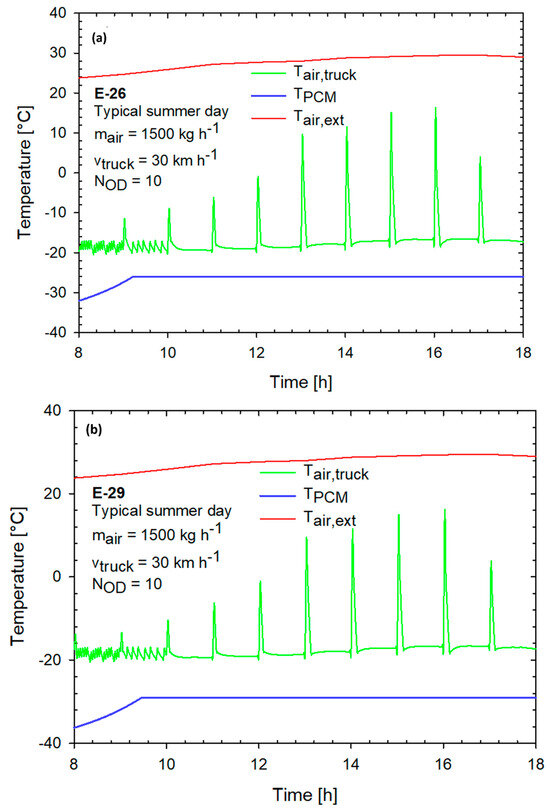
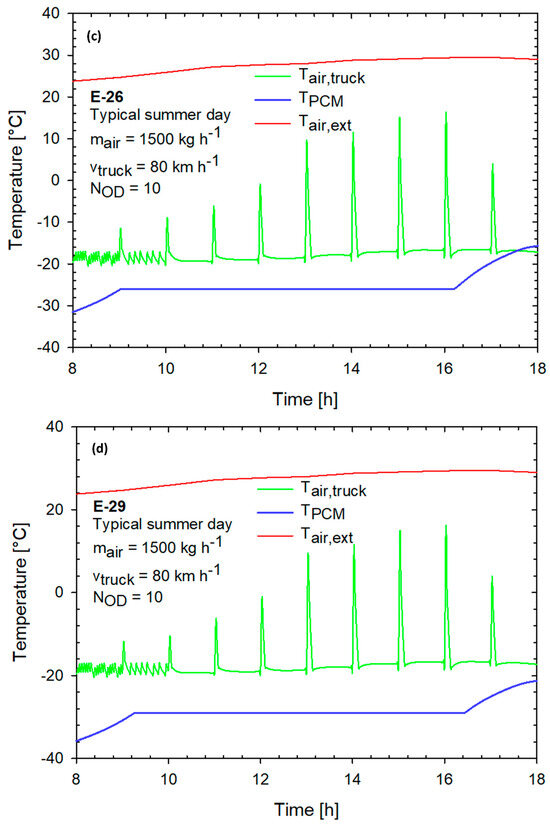
Figure 6.
The temperature of a typical workday as a function of time for different PCMs and truck velocities: (a) E-26 and 30 km h−1; (b) E-26 and 80 km h−1; (c) E-29 and 30 km h−1; (d) E-29 and 80 km h−1.
The peaks of the inner air temperature represent the instantaneous change in temperature that occurs during the opening of the door, in accordance with what was stated in the work of Taher et al. [12]. Nevertheless, this variation occurs in a very short time interval, so the cold chain is not compromised. Figure 7 shows the liquid fraction of the two PCMs during the day at different van speeds. It can be noted that as the speed of the van increases, the temperature of the PCM E-26 and PCM E-29, after about 8 h, increases because the PCM has completely melted. This is due to the more effective heat exchange with the external ambient environment. Indeed, the speed of the van greatly affects the PCMs installed on the ceiling, and the absorbed thermal energy leads to the melting of PCM E-26 at 16:06 and E-29 at 16:20. To demonstrate how the speed of the van significantly affects the melting of the PCM, an analysis was conducted assuming a steady-state regime of the van. It can be observed that the liquid fraction with PCM E-26 and PCM E-29 remains below 30%.
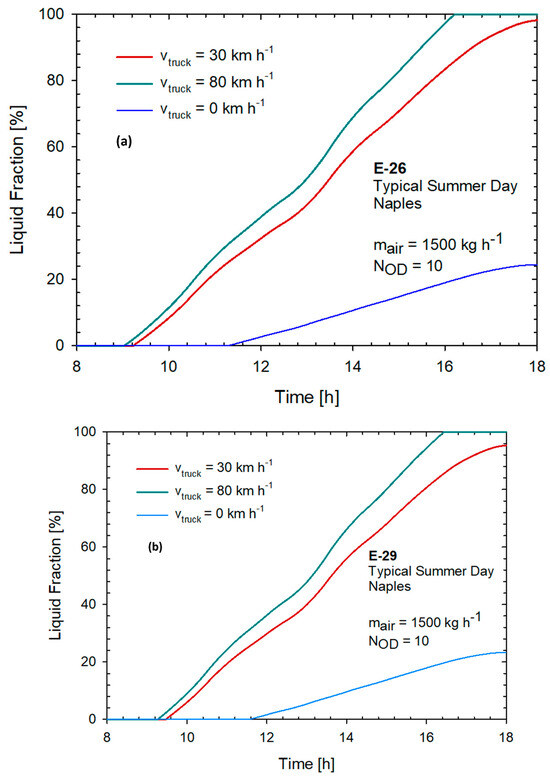
Figure 7.
Liquid fraction of PCMs as a function of time for different truck velocities: (a) E-26; (b) E-29.
The suggested refrigeration unit based on PCM and the refrigerating system driven by an internal combustion engine (powered by diesel) have had their energy consumption and costs compared for the typical summer working day. The standard cooling unit has an impact on fuel consumption of 0.47 l h−1 per kW of installed refrigerator power [14]. Regarding the PCM, it should be considered that the impact on fuel consumption is solely due to the fan component and the increase in van weight. Chandran et al. [26] found a 1% increase in fuel consumption for every 45 kg increase in van weight. Since the weight of a standard cooling system is around 50 kg, the installation of the PCM E-26 resulted in a weight increase of 46.4 kg, whereas that of E-29 PCM was 52.2 kg. Figure 8a shows the average daily cost of using the PCM unit compared to the average daily cost of the traditional vapor compression system.
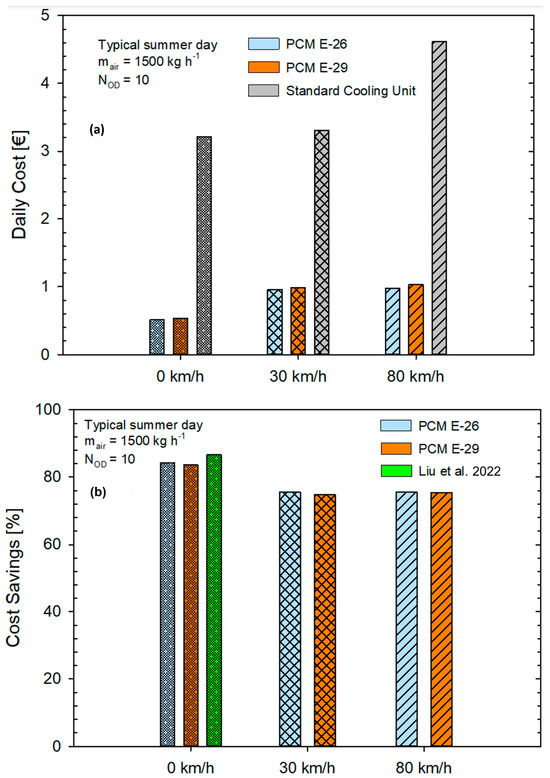
Figure 8.
Average cost of PCMs vs. standard cooling unit as a function of two different truck velocities: (a) daily cost; (b) cost savings percentage.
The average cost of diesel fuel in Italy is EUR 1.747 l−1, while the average price of electricity in the evening time range (7 p.m.–7 a.m.) is EUR 0.12 kWh−1. It can be noted that the average cost of the PCM is much lower than the average cost of a standard cooling unit, as the cost of the energy supply to recharge PCM occurs in the evening (after the workday), with a cost savings greater than 70% for both PCM E-26 and PCM E-29 (Figure 8b). In addition, it can be noted that less energy is required to recharge the PCM if the van travels at an average speed of 30 km h−1. This is because the PCM has retained a small share of latent energy. Some results in terms of economic savings are also provided in the work of Liu et al. [25,26]. In their study, they examine the climate of Adelaide (Australia) by comparing a standard system with one employing PCM, and they have noted that an economic saving of 86.7% can be achieved. However, in their study, they do not account for the speed of the refrigerated van, which inevitably leads to an increase in thermal exchange with the external environment. Therefore, the data presented in this work, which consider the average speed of the van, provide further detailed insight needed to correctly size the amount of PCM required to successfully preserve the products inside the refrigerated van over the course of a day. This work also finds confirmation when compared to the experimental investigation conducted by Mousazade et al. [11], who also experimentally assert that as the truck’s speed increases, the PCM reaches complete fusion more quickly. However, their analysis, although thoroughly experimental, does not provide data on the economic implications of using PCM within a refrigerated truck. Therefore, this work aims to be the first to embrace both the thermal exchange aspects and the economic benefits of using PCM. While the use of PCMs is cost-effective from an economic point of view, the same cannot be said from an energetic point of view, considering the primary energy consumption. As shown in Figure 9, the primary energy for charging the PCM is higher than that used by the vapor compression system, considering both the van’s average speeds. This is due to a lower value of the E.E.R. of the PCM charging system compared to the standard cooling unit’s E.E.R. value shown in Figure 5. In addition, as the average speed of the van increases, the energy gap between the use of the PCM and the standard cooling unit decreases since the convective heat exchange with the external environment is higher, activating the standard cooling unit for a longer period during the day, resulting in an increase in the energy demand and a decrease in the value of the E.E.R. A different scenario occurs in the case of a stationary van. In this situation, the convective heat exchange mechanism is of a natural type. Therefore, since the PCM never reaches a fully melted configuration (as previously seen), the energy required to recharge the PCM is much lower compared to the energy needed to keep the standard cooling system active during the workday. Thus, ultimately, the 0 km h−1 configuration is more cost-effective and energy-efficient, but it represents a small portion of the entire workday for a van transporting food products.
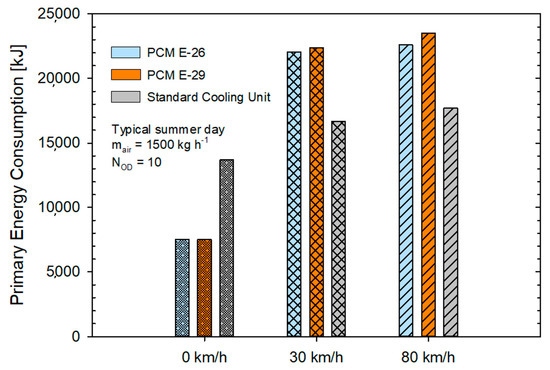
Figure 9.
Primary energy consumption as a function of three different truck velocities.
6. Conclusions
This article studied the thermoeconomic effect of the use of phase change materials in the cold chain, in particular the use of euthetic PCMs, E-26 (1.75 sqm) and E-29 (1.64 sqm), installed on the ceiling of a refrigerated van at a temperature of −18 °C. A dynamic model has been developed with variable weather conditions during a typical summer day in the city of Naples. The model outputs are: the temperature of air in the van, the temperature of PCM, the PCM liquid fraction. A cost analysis has been carried out to compare the refrigeration unit based on PCM and a standard cooling unit typically used for refrigerated transport purposes. The simulations have been performed changing the velocity of the refrigerated van (30 and 80 km h−1) with 10 door openings during the working day, and an internal mechanical ventilation with a capacity of 1500 kg h−1. The results showed that:
- -
- the use of PCMs E-26 and E-29 can guarantee the cold chain, considering the average speed of the van at both 30 and 80 km h−1 for the entire working day (8.00 a.m.–6 p.m.) and a stationary situation at 0 km h−1;
- -
- the PCM E-26 exhausts its latent energy approximately 20 min before the E-29 PCM at an average van speed of 80 km h−1; while in the case of steady-state conditions, the PCM never reaches a fully melted configuration;
- -
- the average daily cost of the PCM E-26 is equal to EUR 0.96 and EUR 0.98, considering average speed of the van of 30 and 80 km h−1, respectively; in the case of 0 km h−1, the average daily cost is approximately EUR 0.58;
- -
- the average daily cost of the PCM E-29 is equal to EUR 0.99 and EUR 1.03, considering average speed of the van at 30 and 80 km h−1, respectively; in the case of 0 km h−1, the average daily cost is approximately EUR 0.59;
- -
- the daily economic saving due to the use of PCMs is always greater than 70%, up to a maximum of 78.84%, considering the PCM E-26 and the average van speed of 80 km h−1; in the case of 0 km h−1, the daily economic saving is around 83% for both PCMs;
- -
- for the primary energy consumptions, the worst case is connected with the recharging energy of PCM E-29 with a van speed of 80 km h−1; meanwhile, the 0 km h−1 configuration is more cost-effective and energy-efficient, but it represents a small portion of the entire workday for a van transporting food products.
Author Contributions
Conceptualization, L.C., A.G. and C.M.; Methodology, L.C., A.G. and C.M.; Validation, L.C., A.G. and C.M.; Formal Analysis, L.C., A.G. and C.M.; Investigation, L.C., A.G. and C.M.; Data Curation, L.C., A.G. and C.M.; Writing Original Draft Preparation, L.C., A.G. and C.M.; Writing—Review and Editing, L.C., A.G. and C.M.; Visualization, L.C., A.G. and C.M.; Supervision, L.C., A.G. and C.M.; Project Administration, A.G. All authors have read and agreed to the published version of the manuscript.
Funding
This research received external funding by University Ministry of Research of Italy within the scope of the project “PNRR ON FOODS SPOKE 3” a spoke of the maxi project ONFOODS (Research and innovation network on food and nutrition Sustainability, Safety and Security—Working ON Foods) financed by the European Community among the activities of the Italian PNRR, i.e., the National Recovery and Resilience Plan (PNRR) as part of the Next Generation EU program (NGEU), agreed by the European Union in response to the pandemic crisis of 2020.
Data Availability Statement
Data is contained within the article.
Conflicts of Interest
The authors declare no conflicts of interest.
Nomenclature
| Roman Symbols | |
| m | Mass, kg |
| L | Latent heat, kJ |
| h | Specific enthalpy, kJ/kg |
| H | Door height, m |
| t | Time |
| Power, kJ/h | |
| g | Gravity constant, m/s2 |
| A | Surface, m2 |
| Fm | Density factor, - |
| U | Overall heat transfer coefficient, W/(m2K) |
| C | Conductance surface, (W/ m2K) |
| x | Thickness, m |
| k | Thermal conductivity, W/(mK) |
| cp | Specific heat, kJ/(kgK) |
| E.E.E. | Energy efficiency ratio, - |
| PCM | Phase change material |
| N | Number |
| Greek symbols | |
| ρ | Density, kg/m3 |
| ∆ | Differential |
| λ | Heat transfer coefficient, (W/ m2K) |
| Subscripts | |
| i | Internal |
| r | Refrigerated |
| sen | Sensible |
| lat | Latent |
| tras | Transmission |
| PCM | Phase change material |
| inf | Infiltration |
| mech | Mechanical |
| M | Melting |
| OD | Open door |
| ext | External |
References
- Richards, G. Warehouse Management: A Complete Guide to Improving Efficiency and Minimizing Costs in the Modern Warehouse, 2nd ed.; Kogan Page: London, UK, 2014. [Google Scholar]
- Zhou, G.H.; Xu, X.L.; Liu, Y. Preservation technologies for fresh meat—A review. Meat Sci. 2010, 86, 119–128. [Google Scholar] [CrossRef]
- Meneghetti, A.; Monti, L. Greening the food supply chain: An optimisation model for sustainable design of refrigerated automated warehouses. Int. J. Prod. Res. 2015, 53, 6567–6587. [Google Scholar] [CrossRef]
- Mania, T.; Kawa, J. Heat and Cold Energy Storage Technologies as a Practical Complement to Renewable Energy Installations. Eco-Energetics Technol. Environ. Law Econ. 2018, 1, 41–50. [Google Scholar] [CrossRef]
- Vadhera, J.; Sura, A.; Nandan, G.; Dwivedi, G. Study of Phase Change materials and its domestic application. Mater. Today Proc. 2018, 5, 3411–3417. [Google Scholar] [CrossRef]
- Rosen, M.A.; Ibrahim, D. Thermal Energy Storage: Systems and Applications, 2nd ed.; John Wiley & Sons: Hoboken, NJ, USA, 2011. [Google Scholar]
- Gielen, D.; Boshell, F.; Saygin, D.; Bazilian, M.D.; Wagner, N.; Gorini, R. The role of renewable energy in the global energy transformation. Energy Strategy Rev. 2019, 24, 38–50. [Google Scholar] [CrossRef]
- Dávila, P.; Bourouis, M.; Francisco Nicolalde, J.; Martínez-Gómez, J. CO2/acetone mixture desorption process in a plate heat exchanger for compression/resorption heat pumps. Appl. Therm. Eng. 2024, 244, 122704. [Google Scholar] [CrossRef]
- Liu, M.; Saman, W.; Bruno, F. Development of a novel refrigeration system for refrigerated trucks incorporating phase change material. Appl. Energy 2012, 92, 336–342. [Google Scholar] [CrossRef]
- Liu, M.; Saman, W.; Bruno, F. Computer simulation with TRNSYS for a mobile refrigeration system incorporating a phase change thermal storage unit. Appl. Energy 2014, 132, 226–235. [Google Scholar] [CrossRef]
- Mousazade, A.; Rafee, R.; Valipour, M.S. Thermal performance of cold panels with phase change materials in a refrigerated truck. Int. J. Refrig. 2020, 120, 119–126. [Google Scholar] [CrossRef]
- Ben Taher, M.A.; Kousksou, T.; Zeraouli, Y.; Ahachad, M.; Mahdaoui, M. Thermal performance investigation of door opening and closing processes in a refrigerated truck equipped with different phase change materials. J. Energy Storage 2021, 42, 103097. [Google Scholar] [CrossRef]
- Liu, G.; Li, Q.; Wu, J.; Xie, R.; Zou, Y.; Marson, A.; Scipioni, A.; Manzardo, A. Improving system performance of the refrigeration unit using phase change material (PCM) for transport refrigerated vehicles: An experimental investigation in South China. J. Energy Storage 2022, 51, 104435. [Google Scholar] [CrossRef]
- TUmate, B.; Sawarkar, P.D. A review on thermal energy storage using phase change materials for refrigerated trucks: Active and passive approaches. J. Energy Storage 2024, 75, 109704. [Google Scholar] [CrossRef]
- De Gracia, A.; Cabeza, L.F. Phase change materials and thermal energy storage for buildings. Energy Build. 2015, 103, 414–419. [Google Scholar] [CrossRef]
- Zhou, Z.; Zhang, Z.; Zuo, J.; Huang, K.; Zhang, L. Phase change materials for solar thermal energy storage in residential buildings in cold climate. Renew. Sustain. Energy Rev. 2015, 48, 692–703. [Google Scholar] [CrossRef]
- Zhang, N.; Yuan, Y.; Cao, X.; Du, Y.; Zhang, Z.; Gui, Y. Latent Heat Thermal Energy Storage Systems with Solid–Liquid Phase Change Materials: A Review. Adv. Eng. Mater. 2018, 20, 1700753. [Google Scholar] [CrossRef]
- Mehling, H. Use of Phase Change Materials for Food Applications—State of the Art in 2022. Appl. Sci. 2023, 13, 3354. [Google Scholar] [CrossRef]
- EAssis; Katsman, L.; Ziskind, G.; Letan, R. Numerical and experimental study of melting in a spherical shell. Int. J. Heat Mass Transf. 2007, 50, 1790–1804. [Google Scholar] [CrossRef]
- Teng, T.P.; Cheng, C.M.; Cheng, C.P. Performance assessment of heat storage by phase change materials containing MWCNTs and graphite. Appl. Therm. Eng. 2013, 50, 637–644. [Google Scholar] [CrossRef]
- Omara, Z.M.; Ahmed, M.M.Z.; Alawee, W.H.; Shanmugan, S.; Elashmawy, M. A comprehensive review of nano-enhanced phase change materials on solar stills with scientometric analysis. Results Eng. 2024, 22, 102088. [Google Scholar] [CrossRef]
- Lane, G.A. Solar Heat Storage: Latent Heat Material—Volume I: Background and Scientific Principles, 1st ed.; CRC Press: Boca Raton, FL, USA, 1983. [Google Scholar]
- Khattari, Y.; El-Otmany, H.; El Rhafiki, T.; Kousksou, T.; Ahmed, A.; Ghoulam, E.B. Physical models to evaluate the performance of impure phase change material dispersed in building materials. J. Energy Storage 2020, 31, 101661. [Google Scholar] [CrossRef]
- Zeneli, M.; Nikolopoulos, A.; Karellas, S.; Nikolopoulos, N. Numerical methods for solid-liquid phase-change problems. In Ultra-High Temperature Thermal Energy Storage, Transfer and Conversion; Elsevier: Amsterdam, The Netherlands, 2020; pp. 165–199. [Google Scholar] [CrossRef]
- Gonçalves, J.C.; Costa, J.J.; Lopes, A.M.G. Analysis of the air infiltration through the doorway of a refrigerated room using different approaches. Appl. Therm. Eng. 2019, 159, 113927. [Google Scholar] [CrossRef]
- Chandran, R.; Hasanuzzaman, M.; Arıcı, M.; Kumar, L. Energy, economic and environmental impact analysis of phase change materials for cold chain transportation in Malaysia. J. Energy Storage 2022, 55, 105481. [Google Scholar] [CrossRef]
Disclaimer/Publisher’s Note: The statements, opinions and data contained in all publications are solely those of the individual author(s) and contributor(s) and not of MDPI and/or the editor(s). MDPI and/or the editor(s) disclaim responsibility for any injury to people or property resulting from any ideas, methods, instructions or products referred to in the content. |
© 2024 by the authors. Licensee MDPI, Basel, Switzerland. This article is an open access article distributed under the terms and conditions of the Creative Commons Attribution (CC BY) license (https://creativecommons.org/licenses/by/4.0/).