Article

Advanced Levelized Cost Evaluation Method for Electric Vehicle Stations Concurrently Producing Electricity and Hydrogen

College of Electrical Engineering, Zhejiang University, Hangzhou 310027, China
*
Author to whom correspondence should be addressed.
Energies 2024, 17(11), 2682; https://doi.org/10.3390/en17112682
Submission received: 4 May 2024 / Revised: 26 May 2024 / Accepted: 28 May 2024 / Published: 31 May 2024
(This article belongs to the Special Issue Power Electronics and Power Quality 2023)

Abstract

:
This study develops a new method to evaluate the economic viability of co-generation electric vehicle stations that concurrently generate electricity and hydrogen for charging battery electric vehicles and refueling hydrogen vehicles. The approach uniquely differentiates the costs associated with various energy outputs in co-generation stations and includes often-overlooked peripheral devices critical for accurate evaluation of the levelized cost of electricity (LCOE) and hydrogen (LCOH). The method was tested across three design configurations: two featuring single storage options (battery and fuel cell, respectively) and a third using hybrid storage employing both. Each configuration was modeled, simulated, and optimized using HOMER Pro 3.14.2 to determine the most optimal sizing solution. Then, based on the optimal sizing of each design, LCOE and LCOH were evaluated using the proposed method in this study. The analysis revealed that excluding often-overlooked peripheral devices could lead to a 27.7% error in LCOH evaluation, while the impact on LCOE was less than 1%. Among different configurations, the design with hybrid storage proved economically superior, achieving a total levelized cost of energy (TLCOE) for the entire system of USD 0.113/kWh, with the LCOE at USD 0.025/kWh and LCOH at USD 0.088/kWh (or USD 3.46/kg). Comparative analysis with state-of-the-art studies confirmed the accuracy of the proposed method. This study provides a more precise and holistic approach that can be leveraged for the feasibility analysis of electric vehicle stations globally, enhancing strategic decision-making in sustainable energy planning.

1. Introduction

The transportation sector, responsible for a substantial 24% of global CO2 emissions [1], is progressively adopting electric powertrain technologies. The move towards electrifying transportation stands out as a critical strategy to mitigate the pollution from the rising number of vehicles reliant on fossil fuels [2,3,4]. To achieve transportation electrification, two primary approaches are being implemented: (i) the use of battery storage in battery electric vehicles (BEVs) and (ii) the employment of fuel cells in hydrogen-powered fuel cell electric vehicles (FCEVs).
FCEVs differ from BEVs as they cannot directly utilize electricity for refueling. Instead, they require hydrogen, generated through power-to-hydrogen (P2H) technology using electrolysis [5,6,7]. The hydrogen produced by electrolyzers typically emerges at a pressure of 10–20 bars [8], whereas hydrogen refueling stations require pressures between 350 and 900 bars [9]. Additionally, the refueling process necessitates pre-cooling the hydrogen to mitigate temperature increase due to hydrogen expansion during refueling. Proper refueling also depends on specialized hydrogen dispensers that adhere to specific refueling protocols. Consequently, a complete FCEV refueling infrastructure not only includes a regular energy system but also requires peripheral devices such as high-pressure hydrogen tanks, pre-cooling units, compressors, and hydrogen dispensers [8]. In contrast, peripheral equipment required to assist BEV charging is generally less complex, primarily involving EV chargers.
The new concept of co-generation stations, which concurrently produce electricity and hydrogen, is gaining prominence due to its potential to concurrently facilitate the widespread adoption of BEVs and FCEVs [10,11,12,13]. These systems offer significant advantages. First, such co-generation systems can enable more optimal handling of energy resources offered by the combination of multiple energy sources and multiple generation types [14]. This integration enhances the flexibility and resilience of an energy system and might increase the security of supply [14]. Additionally, these stations might reduce operational costs through shared infrastructure and maximize environmental benefits [15], facilitated by efficient use of resources and scheduling of different EVs [16]. Therefore, such co-generation stations are attracting significant attention.
The growing interest in co-generation EV stations highlights the need for a comprehensive techno-economic analysis to evaluate their viability [10,11,12]. The initial step in such analysis involves calculating the levelized costs for various types of energy outputs for assessing a co-generation station’s financial performance. A variety of methods have been debated and employed in the literature to calculate the levelized cost of hydrogen (LCOH) and the levelized cost of electricity (LCOE). Some studies [17,18,19,20,21,22,23,24] used similar calculation approaches where LCOH estimations focused on dividing the financial expenses associated with hydrogen generation by the yearly hydrogen production. In such LCOH calculations, the hydrogen generation expenses include investment in components specific to hydrogen production and operational electricity expenses for electrolysis. The LCOE is determined by dividing the system’s total expenses by the annual electricity production (not served). In such LCOE calculations, the total system expenses include capital cost, replacement cost, and operations and maintenance cost, along with any environmental cost savings.
Using the calculation methods detailed above, different studies have evaluated the LCOE and LCOH of renewable systems based on diverse power and storage options such as photovoltaic (PV), wind turbine (WT), battery (BAT), and fuel cell (FC). Scholars in [17] performed an economic, energy, and environmental analysis for an integrated PV and WT system for clean hydrogen production in Egypt. The results showed that for different performance degradation rates, the LCOH and LCOE varied between USD 3.73/kg and USD 4.65/kg, and USD 0.137/kWh and USD 0.219/kWh, respectively. Okonkwo et al. [18] conducted optimization and analysis on two hybrid energy configurations: WT/BAT and PV/WT/BAT. Their findings indicated that the PV/WT/BAT system exhibited superior cost-effectiveness, achieving an LCOE of USD 0.434/kWh and an LCOH of USD 0.375/kg. Likewise, the authors of [19] conducted a green hydrogen generation assessment for Tunisia using solar energy, reporting an LCOH of EUR 3.32/kg. Nevertheless, costs related to hydrogen dispensing such as dispenser units were overlooked in studies [17,18,19].
Similarly, other studies conducted economic assessments of diverse renewable energy configurations focusing on different locations. Caliskan et al. [20] investigated different configurations using PV, WT, a diesel generator, and a grid for hydrogen refueling infrastructure within a campus area in Turkiye. The results reported the combination of PV, WT, and grid to be optimal, with an LCOE of USD 0.0232/kWh. Yet, this study did not offer LCOH evaluation. Mostafa Rezaei et al. [21] analyzed hydrogen production in Afghanistan based on wind energy, demonstrating its potential with LCOE and LCOH figures ranging from USD 0.063 to 0.079/kWh and USD 2.12 to 2.26/kg, respectively. Similarly, Mostafaeipour et al. [22] performed evaluations across 12 Iranian cities for a solar-powered hydrogen refueling station. The results indicated an LCOH from USD 0.79 to 1.68/kg and an LCOE between USD 0.531 and 1.627/kWh. Ahshan et al. [23] conducted a sensitivity analysis on combined electricity and hydrogen generation in Oman. They found an LCOH from USD 3.37 to 6.13/kg and an LCOE between USD 0.0349 and 0.0701/kWh. Sadiq et al. [24] assessed large-scale hydrogen production from PV in Saudi Arabia using alkaline electrolyzer (AEL) and polymer electrolyte membrane (PEM) electrolyzers. The results showed that LCOH ranges from USD 2.09 to 2.66/kg for AELs and from USD 2.30 to 2.93/kg for PEMs. Despite diverse and insightful findings, none of these studies [20,21,22,23,24] included essential peripheral components (like high-pressure hydrogen tanks, pre-cooling units, compressors, and hydrogen dispensers) that are indispensable for refueling stations.
A different body of research [10,11,12] used another method to calculate the levelized costs. All these studies [10,11,12] focused on standalone co-generation EV stations for combined charging and refueling facilities. In these studies, the method for LCOE calculation involved dividing the system’s total annualized costs by the electricity served annually, rather than the electricity produced. This distinction might be crucial as not all generated electricity in standalone systems is usable. For the LCOH, the method involves taking the entire system’s annualized costs, subtracting the annual revenue from electricity sales, and then dividing by the total hydrogen generated annually.
Among studies [10,11,12], ref. [10] explored six renewable configurations in Chennai. The results showed an LCOE range of USD 0.493 to 1.168/kWh and an LCOH of USD 8.86 to 20.4/kg. Likewise, researchers in [11] investigated PV systems across five Indian locations, finding LCOE values between USD 0.41 and 0.48/kWh and LCOH values between USD 3.00 and 3.22/kg. A significant oversight in [10,11] is the omission of essential hydrogen peripheral devices and not allocating the system’s shared costs appropriately between electricity and hydrogen outputs while calculating the LCOE and LCOH.
Ampah et al. [12] considered six configurations based on combinations of different renewable resources in Ghana, reporting the LCOE and LCOH in the ranges of USD 0.33 to 1.79/kWh and USD 5.72 to 31.38/kg, respectively. However, they only considered hydrogen peripheral devices, overlooking the necessary charging peripherals for BEVs. Additionally, the annualized costs of the hydrogen devices were included equally in the evaluation of both LCOE and LCOH. These hydrogen peripheral devices only served the hydrogen refueling process for FCEVs, but their methodology did not distinguish between the roles and costs of peripherals required for BEVs and FCEVs. Such an oversimplification, which overlooks the complex interactions between system components that generate multiple energy forms simultaneously, can lead to significant inaccuracies in LCOE and LCOH evaluations. Hence, more precise methodologies that properly include all peripherals, differentiate equipment based on their roles, and take into account the complex interactions within co-generation systems are needed.

Research Gap and Contributions

From the detailed discussion of studies, it can be noticed that diverse approaches are applied for evaluating the LCOE and LCOH. The existing gaps can be stated as follows:
  • Complexity in Co-generation EV Stations: Existing methods for calculating the LCOE and LCOH may not fully suit co-generation EV systems, as they often overlook the complex interactions between components that generate multiple energy forms simultaneously. For instance, LCOH calculations that divide the total system’s annualized cost by the hydrogen produced overlook the concurrent electricity production for BEVs, as in [10,11,12]. This oversight can lead to inaccuracies where electricity-related costs, like BEV charging, might inappropriately inflate the costs attributed to hydrogen production, and vice versa.
  • Oversight of Peripheral Devices: Unlike common energy systems, co-generation EV stations require peripheral devices to realistically model such stations, yet most of the studies [10,11,17,18,20,21,22,23,24] did not incorporate the cost of these devices.
  • Lack of Differentiation in Device Function: When peripheral devices are included in some studies, distinctions are often not made between peripheral devices serving FCEVs and BEVs. Consequently, the annualized costs of these peripheral devices are typically aggregated into the total annualized system cost. This combined cost is then used to calculate both the LCOE and LCOH. Such aggregation often leads to significant inaccuracies, as it does not correctly allocate costs according to their specific functions and uses.
  • Need for a Holistic View: A comprehensive understanding of the economic viability of co-generation EV stations requires an evaluation of both the total levelized cost of the entire co-generation station and the levelized costs of individual energy types (hydrogen and electricity). However, existing methods do not provide such a holistic view.
In response to the outlined gaps, this paper endeavors to make the following contributions:
  • This study features a method that precisely calculates the LCOE and LCOH based on the respective shares of electricity and hydrogen in the total energy output. This approach is particularly tailored for co-generation stations that serve both BEVs and FCEVs.
  • This study properly includes refueling-specific peripheral devices such as high-pressure hydrogen tanks, pre-cooling units, compressors, and hydrogen dispensers, as well as charging-specific devices like EV chargers. By factoring in these often-overlooked costs, this study strives to provide a more precise depiction of the economic landscape.
  • The proposed methodology distinguishes between the costs associated with charging and refueling peripheral devices. This precision prevents the misallocation of costs in the calculations of LCOE and LCOH, addressing a common shortcoming in previous studies.
  • The methodology introduced in this study offers the evaluation of not only the individual levelized costs (LCOE, LCOH) but also the total levelized cost of energy for the entire co-generation system (TLCOE). This holistic approach provides deeper insights into the economic viability of co-generation EV stations.
This study showcases the application of the proposed method through a case study of three autonomous co-generation EV stations in Lahore. Lahore is a major urban center in South Asia, and the sixth most populous city in the world [25]. Due to its frequent power shortages, high pollution levels, and dependence on fossil fuels, Lahore represents a critical need for innovative energy solutions [26,27]. Hence, this study considers Lahore as a case study for co-generation stations. Each station configuration employs PV panels as the primary power source, with variations in storage options across the designs. The generic diagram of the system is shown in Figure 1. Design 1 incorporates battery storage, Design 2 utilizes a fuel cell for backup storage, and Design 3 combines both battery and fuel cell systems. Initially, each design was modeled, simulated, and optimized using HOMER Pro to determine the most effective sizing solution based on energy balance. Subsequently, the optimization results were used to calculate the TLCOE, LCOE, and LCOH for each design. This study concludes by comparing all three designs to identify the most economically viable option, with the findings compared to existing research in the field.

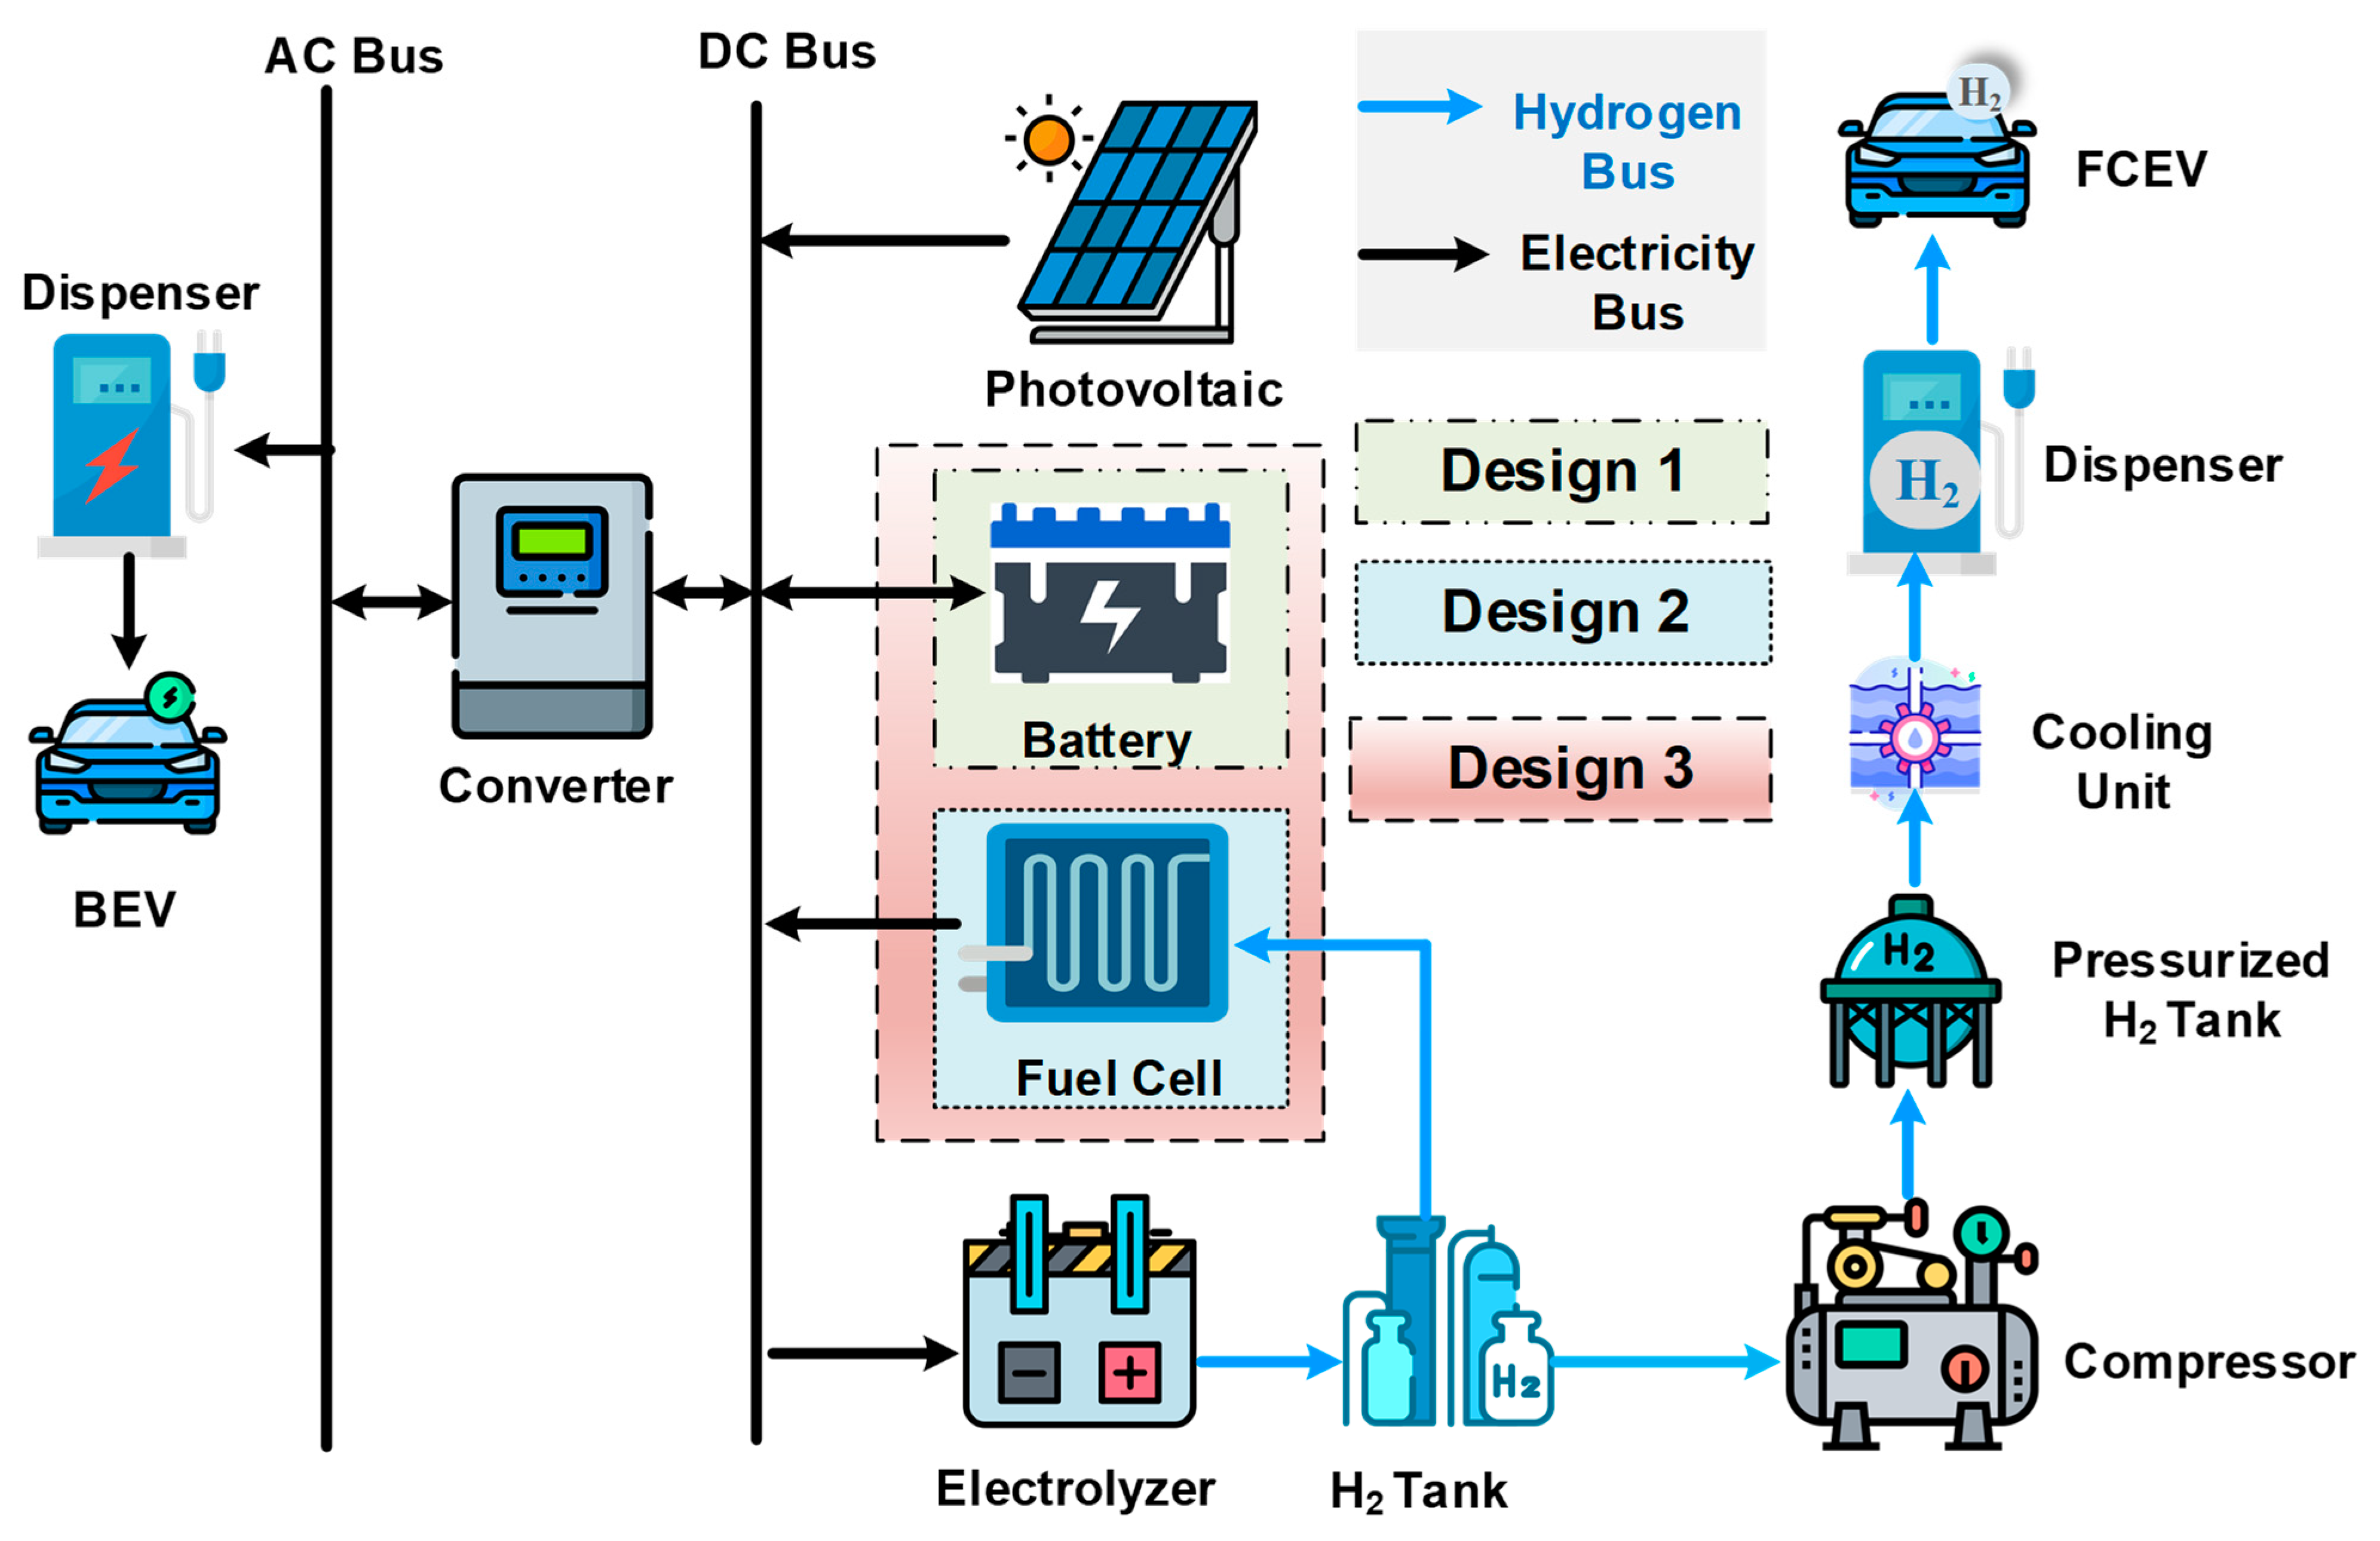
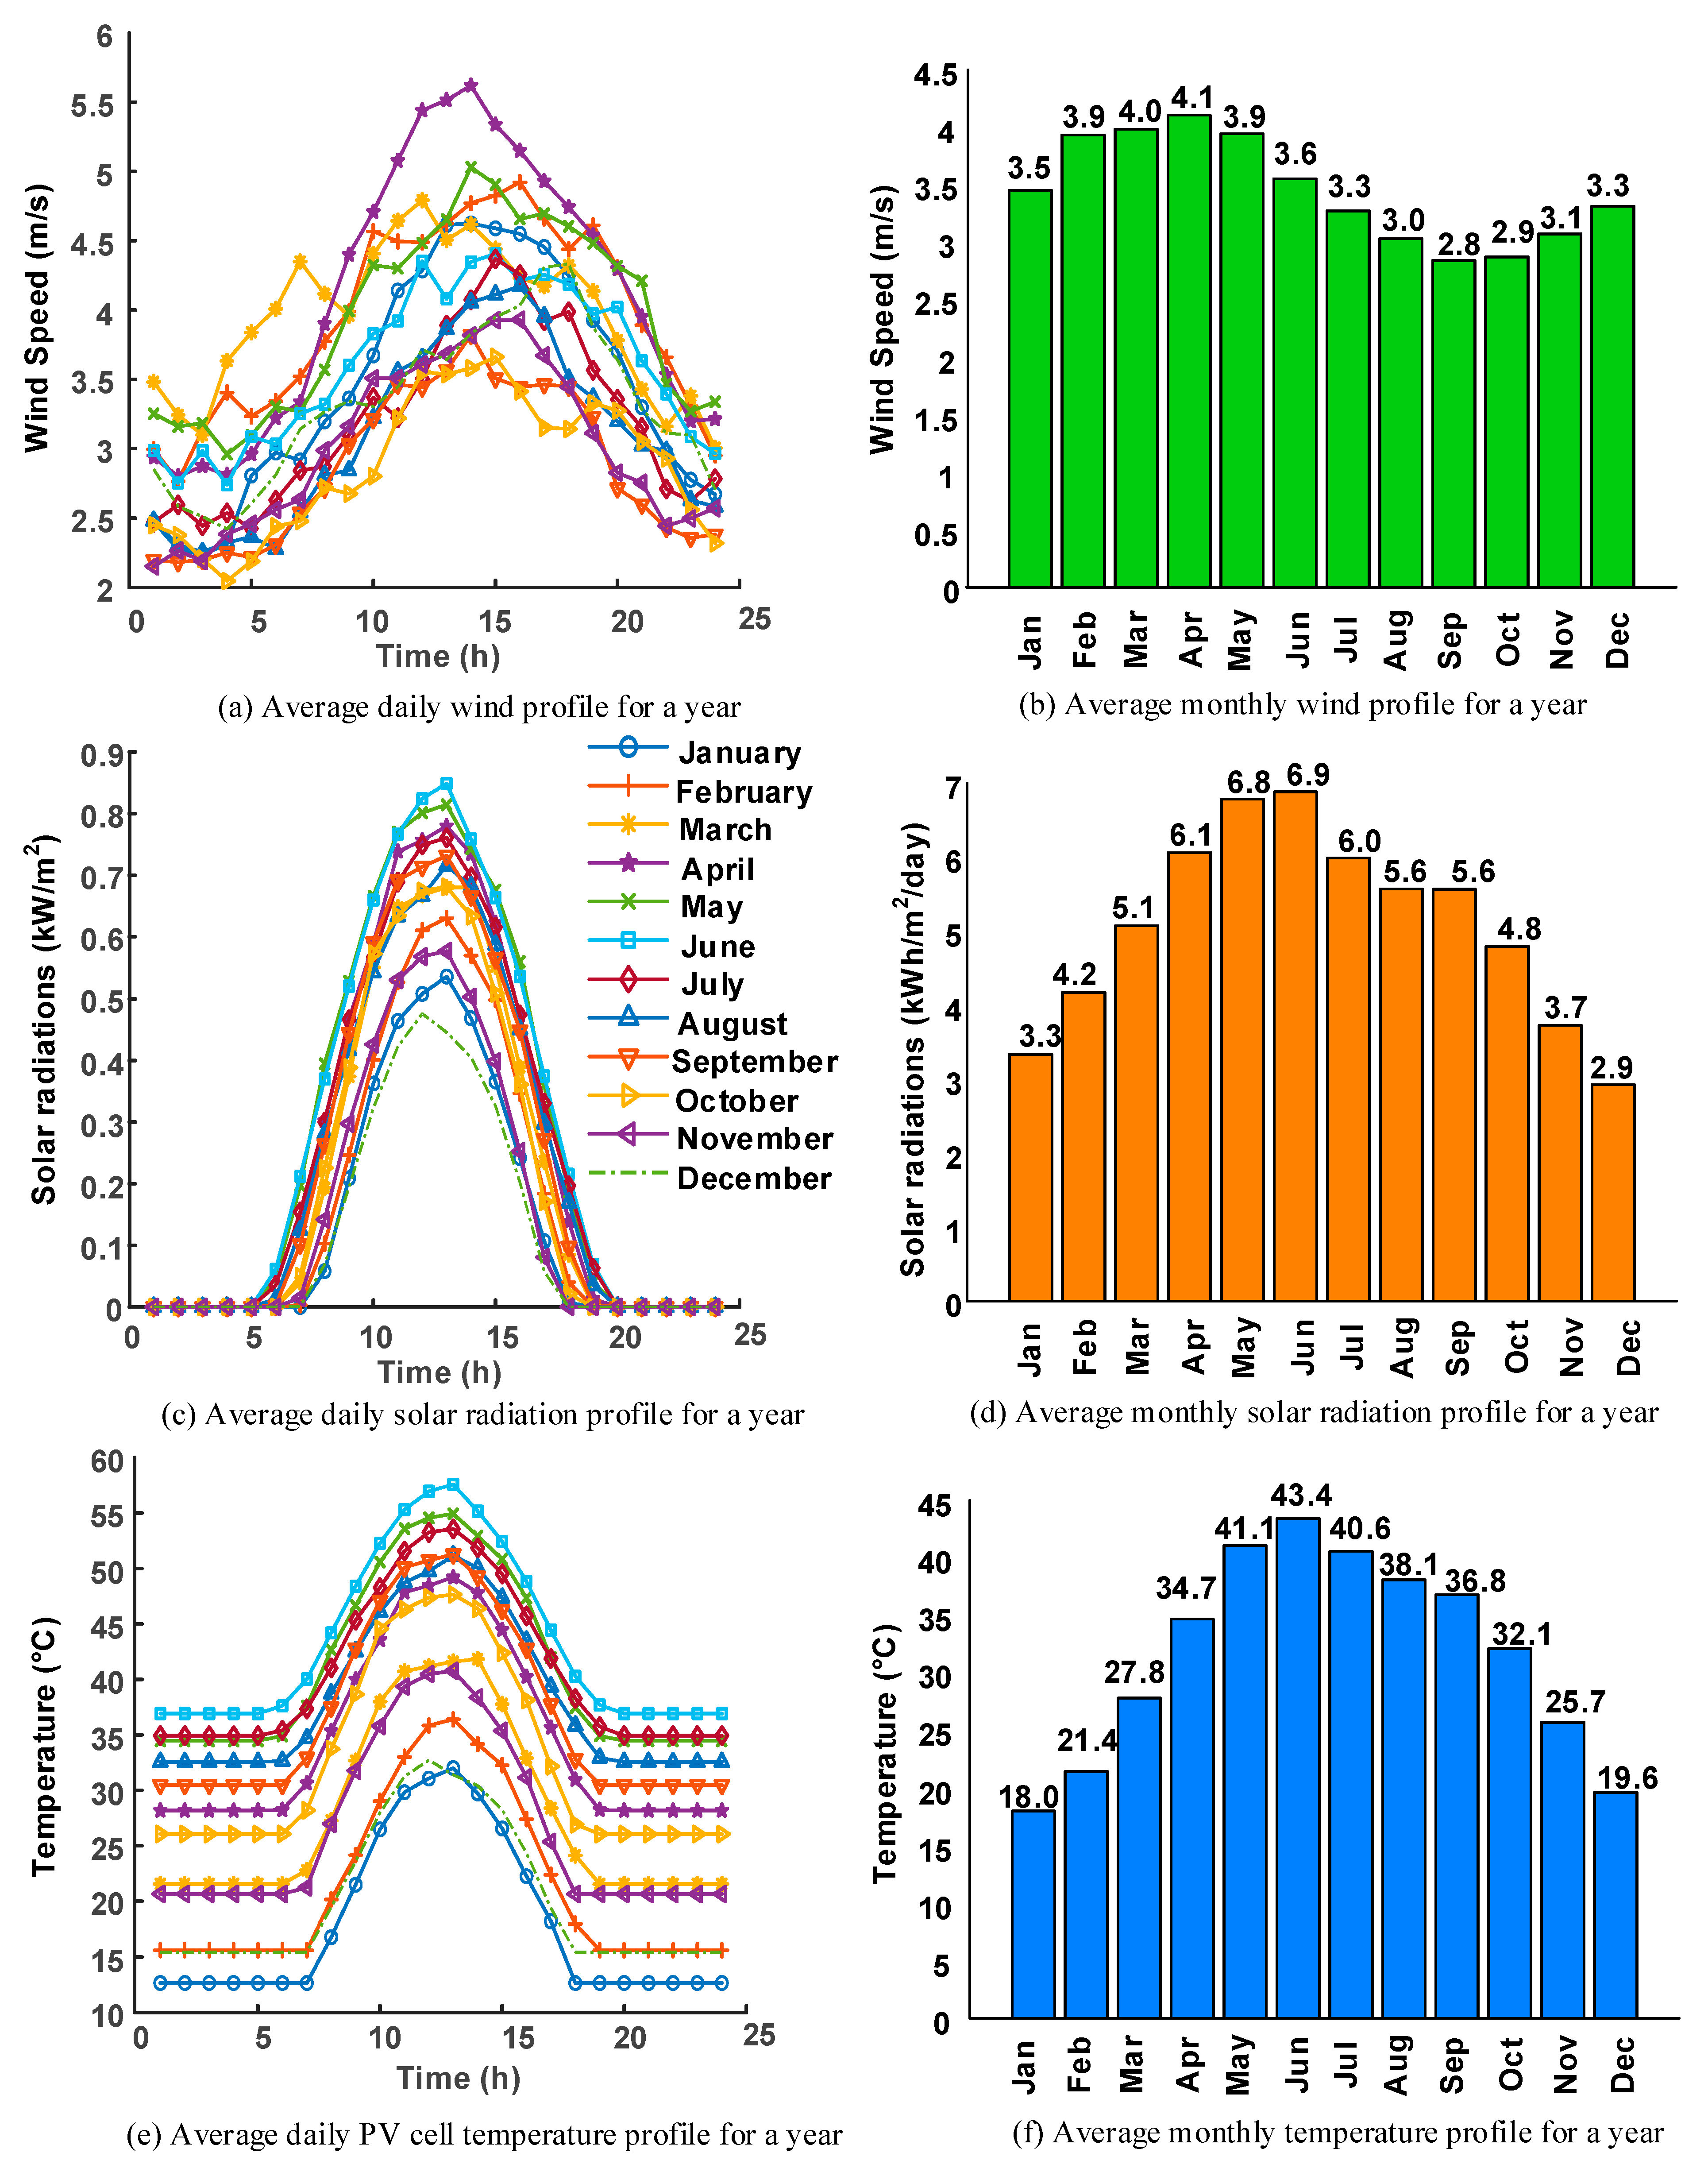
2. Input Data and System Details

The co-generation charging and refueling station design aims to meet the requirements of 70 BEVs and 30 FCEVs. Considering the 30 kWh battery capacity of a BEV, the electrical charging load was 2100 kWh/day, which increased to 2205 kWh/day when taking into account the electricity required for peripheral devices. For FCEV refueling, the hydrogen load was estimated to be 150 kg/day, given that a typical private FCEV has a 5 kg hydrogen storage capacity [8]. The demand for charging and refueling varies daily throughout the year, as shown in Figure 2. It is evident from Figure 2a,c that both daily charging and refueling demands remain higher during morning and evening hours, moderate during the rest of the daytime, and relatively low at nighttime. The seasonal electrical load profile in Figure 2b indicates a monthly minimum load ranging from 18.64 to 29.70 kW, a monthly maximum load ranging from 212.12 to 287.63 kW, and a monthly average load ranging from 91.78 to 106.8 kW. Similarly, the average daily high and low ranges from 181.21 to 212.45 kW and 31.63 to 36.89 kW, respectively. The seasonal hydrogen load profile in Figure 2d shows monthly maximums, minimums, and averages in the ranges of 11.94–14.49 kg, 1.85–2.29 kg, and 5.75–6.67 kg, respectively. Daily high and low ranges are 11.12–12.92 kg and 2.11–2.44 kg, respectively. Generally, the summer (June–July) and winter (November–January) months were observed to have higher charging and refueling load demands compared to other times of the year. This pattern might be attributed to the increased use of climate control systems—air conditioning in the summer and heating in the winter—which typically results in higher energy consumption in vehicles.
To supply energy to the station, a comprehensive evaluation of resources was carried out at the targeted city. This process included an analysis of the availability and feasibility of various renewable energy sources to facilitate well-informed decision-making for the selection of optimal energy solutions. Data on solar irradiance, temperatures, and wind velocity were sourced from Prediction of Worldwide Energy Resources [28]. This study took the average of 30-year historical data for wind, solar, and temperature to ensure data reliability. Then, these average data were used for analysis and system optimization. An illustration of the collected data is presented in Figure 3.
Figure 3a depicts the variance in daily wind speeds over the course of a year, highlighting fluctuations across different months. The peak wind speeds are observed in April, whereas the lowest is recorded in September. To further evaluate the potential for wind energy generation, Figure 3b presents the monthly average wind speeds in Lahore, which fluctuate between 4.1 m/s and 2.8 m/s, with an annual average of 3.45 m/s. Given that effective wind energy exploitation typically requires higher wind speeds, the data suggest that the observed speeds at the targeted site are insufficient for conventional wind power generation. This consistent trend of suboptimal wind speeds throughout the year leads to the conclusion that harnessing wind power at this location is not viable.
Figure 3c illustrates the daily solar radiation patterns at the target site, revealing seasonal fluctuations that influence both the intensity and duration of sunlight throughout the year. The peaks in Figure 3c correspond to the summer solstice when the Earth’s axial tilt is maximally inclined toward the sun, resulting in extended periods of daylight and heightened solar irradiance. In contrast, the notable troughs at the start and close of the year are attributed to the winter solstice, where the tilt is away from the sun, shortening daylight hours and diminishing solar potential. Figure 3d quantifies these observations, showing monthly average solar radiation values ranging from 3.3 to 6.9 kWh/m2/day and an overall average of 5.08 kWh/m2/day. These figures underscore a significant solar energy potential, making photovoltaic technology a viable option for the site.
Likewise, the temperature daily profile follows the same trend as that of solar radiation. Figure 3e,f show a spectrum from 18 °C to 43.4 °C with an average of 25.6 °C. Lahore’s geographical positioning, far from any geothermal hotspots or the ocean, rules out the potential for geothermal and wave energy. In conclusion, on synthesizing the meteorological data for the targeted site, photovoltaic technology emerges as the most feasible renewable energy source.
With the suitable renewable resource (PV) identified, two storage options, batteries and fuel cells, are considered in this study. Based on the combination of PV with batteries and fuel cells, three station designs were possible that were evaluated systematically. The generalized system diagram is shown in Figure 1. In Design 1, surplus electricity from the solar PV array is stored in batteries, providing power during periods of deficient solar generation. Design 2 does not employ battery storage, but instead uses a fuel cell that converts stored hydrogen into electricity when solar power is insufficient. Design 3 integrates both batteries and fuel cells. This design strategically draws power from the less expensive storage option first—typically the battery—and switches to the fuel cell only when necessary to meet additional demand. To ensure optimal use of resources, the electricity generated by the fuel cells is not utilized for battery charging.
In this study, techno-economic optimization was conducted with a focus on minimizing the net present cost (NPC) across all system designs. Each design was individually simulated and optimized using HOMER Pro software, chosen for its widespread recognition and proven utility in renewable energy system optimization, as endorsed by various studies [29,30,31]. By optimizing and analyzing all design configurations, this study aims to identify the most optimal design with minimum NPC that can fulfill the load requirements without any unmet electrical and hydrogen load. The detailed modeling equations behind the simulations of the various system components are provided in the next section, and their costs are given in Tables S1 and S2.

3. Components Modeling

3.1. Photovoltaic Panels

The electricity generation by solar PV modules is influenced by the panel’s surface temperature, the amount of sunlight received, and the efficiency-modifying derating coefficient [32]. The derating coefficient adjusts for assorted inefficiencies affecting the module’s actual versus ideal power yield [33]. The calculation of the PV modules’ electrical output (PPVoutput) utilizes the method detailed in [32], which can be described as follows:
P PVoutput = P Rated _ PV × D F PV × ( R ¯ T R ¯ T , STC ) × [ 1 + θ p × ( T cell T cell , STC ) ]
T cell = T amb + R ¯ T × ( T cell , NOCT T amb , NOCT R ¯ T , NOCT ) × ( 1 η array τ α × ( η array , STC × ( 1 θ p × T cell , STC ) τ α ) ) 1 + ( T cell , NOCT T amb , NOCT ) × ( θ p × η mp τ α ) × ( R ¯ T R ¯ T , STC )
where PRated_PV denotes the peak capacity of the PV module (kW), DFPV is the PV derating coefficient (%), R ¯ T is the incident solar irradiance on the PV module for the present interval (kW/m2), R ¯ T,STC indicates the irradiance during standard testing conditions (kW/m2), θp is the power temperature coefficient (%/°C), R ¯ T,NOCT is the solar irradiance at the nominal operating condition (kW/m2), τ represents the rate at which solar rays pass through the PV panel cover, α signifies the PV module solar absorptance, Tamb corresponds to the ambient air temperature (°C), Tcell,STC is the standard testing condition cell temperature (°C), Tcell represents the temperature of the PV cell at the current time (°C), Tcell,NOCT is the cell temperature at the nominal operating condition (°C), Tamb,NOCT is the ambient temperature at the nominal operating condition (°C), and ηarray is the PV module array’s conversion efficiency (%).

3.2. Converter and Battery

A bidirectional converter facilitates power conversion between AC and DC buses [34,35]. Power delivery from the converter is determined by the following [36,37]:
P o , inve = P DC × η inve P o , rect = P AC × η rect
where PDC and PAC signify the input DC and AC power in kilowatts, while ηrect and ηinve correspond to the rectifier and inverter efficiencies. Similarly, Po,rect and Po,inve quantify the rectifier and inverter output powers in kilowatts.
The kinetic battery model is applied in this study as it best represents lead–acid batteries. The model determines the maximal charge power as per HOMER’s constraints, given as follows [32]:
P B , cmax = M i n i m u m ( P BAT , cmax , mcc , P BAT , cmax , mcr , P BAT , cmax , kbm ) η BAT , c
P BAT , cmax , mcr = ( 1 e α r Δ t ) × ( C max C ) Δ t
P BAT , cmax , kbm = e k Δ t C 1 k + C r k ( 1 e k Δ t ) 1 e k Δ t + r ( k Δ t + e k Δ t 1 )
P BAT , cmax , mcc = N BAT × V norm × I max 1000
C = C 1 + C 2
η BAT , char = ( η BAT , round ) 1 / 2
The terms PBAT,cmax,mcc, PBAT,cmax,mcr, and PBAT,cmax,kbm indicate different regulatory limits on the battery’s maximal charging power PBAT,cmax, with BAT indicating ‘battery’. The acronyms kbm, mcr, and mcc stand for kinetic battery model, maximum charging rate, and maximum charging current, respectively.
At each time interval’s onset, the battery’s total stored energy, C (kWh), is the aggregate of C1 (available energy in kWh) and C2 (bound energy in kWh, while Cmax (kWh) indicates the battery’s full storage capacity. The constant r is the capacity ratio, while k (h−1) governs the storage rate. The parameter α represents the peak charge rate in A/Ah, and ∆t denotes the time step length in hours. The battery’s maximum charging current and nominal voltage are given by Imax (A) and Vnorm (V). Charging efficiency and overall round trip efficiency are represented by ηBAT,char and ηB,round, while the count of batteries is specified by NBAT.
Furthermore, the optimal storage discharge power symbolized as PBAT,dmax is evaluated as follows [38]:
P BAT , dmax = P BAT , kbm , dmax × η BAT , disc
P BAT , kbm , dmax , ( 1 e k Δ t ) C r k + e k Δ t k C 1 C max k 1 e k Δ t + r ( e k Δ t + k Δ t 1 )
η BAT , disc = η B , char
The parameters ηBAT,dis and ηBAT,char refer to the efficiencies of discharging and charging.

3.3. Electrolyzer and Fuel Cell

The core function of an electrolyzer is to utilize electrical power to separate water into its constituent gases, hydrogen and oxygen, through the process of electrolysis. In this research, a polymer electrolyte membrane (PEM) electrolyzer was employed, chosen for its proven performance and widespread use in systems harnessing renewable energy [39]. The production rate of hydrogen by the electrolyzer is quantified by Equation (13).
H r _ hyd = η f I E n cs 2 F
Equation (13) expresses the hydrogen generation rate symbolized by Hr_hyd incorporating the series count of electrolytic cells, indicated by ncs and the Faraday efficiency, symbolized by ηf which is expressed as follows:
η f = 96 × exp ( 0.09 I E 75.5 I 2 E )
where F represents the Faraday constant, and IE stands for the current passing through the electrolyzer. The hydrogen gas yielded by the electrolyzer is then stored in tanks, which can be used to meet hydrogen demands, or in a fuel cell to generate electricity as required.
The fuel cell, an electrochemical device, produces electrical energy by transforming the chemical energy from the reaction of hydrogen with oxygen. The voltage generated by a fuel cell stack is given by the following [39]:
U FC = N C E C = E a U act U ohm U con
where UFC, Ea, Uohm, Uact, and Ucon correspondingly denote the output voltage of the fuel cell, open circuit voltage, ohmic overvoltage, activation overvoltage, and concentration overvoltage. The PEM fuel cell is employed in this study as it is recognized for its valuable features, such as emission-free operation, superior energy conversion efficiency, straightforward and cost-effective maintenance, quiet functioning, lower operational temperatures, and high adaptability, making it suited for use in urban energy systems [40]. The cost details of the main components used in the simulation are outlined in Table S1.

3.4. Peripheral Devices

Compared with a regular energy system, the charging and refueling energy system requires additional devices for FCEV refueling and BEV charging. For instance, on-station dynamic BEV chargers facilitate the charging of electricity to BEVs and enable coordinated operation that can avoid station overloading [41,42]. The number of chargers is based on the station requirements and space constraints. A total of 10 chargers were included in this study. In addition, the hydrogen produced by an electrolyzer is at a low pressure of around 10 to 20 bars [8]. Nevertheless, the required pressure at a typical refueling station is 350 to 900 bars [9,43]. Hence, a compressor and a high-pressure tank are required to increase the pressure and store it, respectively. Moreover, a refueling process should comply with the international hydrogen refueling protocol (SAE TIR J2601). According to this protocol, hydrogen should be pre-cooled to −20 °C to compensate for the temperature increase due to hydrogen expansion while fueling it to FCEVs. Hence, this study incorporated one cooling unit and one dispenser unit as in the related studies [8,12]. High-pressure hydrogen is typically sized considering the peak hourly hydrogen request [44], which was 15 kg in this study. The compressor sizing can be obtained as follows:
P comp = x mean R T l n η comp ( d d 1 ) [ ( P 2 P 1 ) d 1 / n d 1 ] × H r
where xmean represents the average compressibility factor of hydrogen. The temperature at which hydrogen enters the compressor is noted as Tl, while ηcomp reflects the efficiency of the compressor. The pressures at the inlet and outlet of the hydrogen compressor are indicated by P1 and P2, respectively. Additionally, the isentropic exponent is denoted as d. Meanwhile, Hr is the rate at which hydrogen flows through the compressor. For this study, the values for these parameters were taken the same as those specified in reference [12]. The costs of all peripheral equipment used in this study are outlined in Table S2.

4. Economic Parameters Calculations

As mentioned earlier, the existing methods for evaluating the levelized cost of electricity and the levelized cost of hydrogen might not be precise for co-generation EV stations. Therefore, a new method is proposed that strives to evaluate these economic metrics more precisely.
In the literature, both the levelized cost of electricity and the levelized cost of energy share the same acronym, i.e., LCOE. Nevertheless, in systems concurrently producing electricity and hydrogen, the levelized cost of energy of the whole system considering all energy types and the levelized cost of electricity should be clear. Therefore, focusing on a co-generation EV station, this study has adopted a separate acronym, TLCOE (total levelized cost of energy). The TLCOE represents the total levelized cost considering all energy types (electrical and hydrogen) in a co-generation system. The LCOE and LCOH retain their conventional usage for the levelized cost of electricity and hydrogen, as normally used in the literature. The proposed method first calculates the annualized cost of the main system (Csys,ann) to determine the TLCOE. It then calculates the levelized costs of individual streams (LCOE and LCOH) based on their respective shares of the total energy served, as detailed below.
C sys , ann = NPC × i ( 1 + i ) k i ( 1 + i ) k 1
where NPC represents the net present cost. The k indicates the project life in years, while the project’s real discount rate is denoted by i.
The total levelized cost of energy (TLCOEs) in USD/kWh for total output energy can be calculated as follows:
TLCOE s = C sys , ann + E n save , ann E n cost , ann E served = C sys , ann + E n save , ann E n cos t , ann E elect + E hyd + E grid
For renewable designs, the annualized environmental cost-saving element Ensave,ann should be subtracted from Csys,ann since generating electricity by renewables would reduce carbon emissions, resulting in cost savings. Likewise, for non-renewable designs, the annualized cost plenty element (Encost,ann) should be added to Csys,ann due to payable carbon tax. Note that (18) can be simplified into (19) for a standalone system with no environmental plenty/incentives.
TLCOE s = C sys , ann E served = C s y s , ann E elect + E hyd
where Eserved (USD/kWh) is the total of all served energy types, including (1) served electrical energy Eelect (USD/kWh); (2) produced hydrogen energy Ehyd (USD/kWh), where the value of Ehyd in USD/kWh can be calculated using the hydrogen’s Higher Heating Value (HHV); (3) the excess electricity exported to the grid Egrid (USD/kWh). Egrid in standalone systems is zero and it cannot export electricity to the grid.
The LCOEs and LCOHs can be calculated based on the share (Yx) of each energy type in the total energy served (Eserved) as follows:
LCOE s = TLCOE s × Y elect = TLCOE s × E elect E served LCOH s = TLCOE s × Y hyd = TLCOE s × E hyd E served
where Yhyd is the share of hydrogen energy and Yelect is the share of electrical energy.
Note that the above-levelized costs (TLCOEs, LCOEs, and LCOHs) are based on the annualized cost of the main system component obtained from HOMER. However, the annualized cost of peripheral devices that cannot be calculated in HOMER should be calculated separately using their NPC and capital recovery factor. The levelized cost of peripheral devices required for BEV charging (LCOEChar-PD) and levelized cost for peripheral devices required for FCEV refueling (LCOHChar-PD) can be calculated as follows:
LCOE Char - PD = C Ch - PD , ann E Char LCOH H 2 - PD = C H 2 - PD , ann E H 2 - ref
where Cchar-PD,ann and CH2-PD,ann are the annualized costs of charging and hydrogen refueling peripheral devices, respectively, and Echar and EH2-ref are the energy served to BEV charging and hydrogen fueling of FCEVs, respectively. Then, by adding the costs of main system components (TLCOEs, LCOEs, and LCOHs) and the costs of peripheral devices (TLCOEs, LCOEs, and LCOHs), the final levelized costs can be calculated as follows:
LCOE = LCOE s + LCOE Char - PD LCOH = LCOH s + LCOH H 2 - PD TLCOE = TLCOE s + LCOH H 2 - PD + LCOE Char - PD
Note that the proposed method properly distinguishes between the devices used for charging and refueling. This is because hydrogen refueling devices are significantly more expensive than charging devices (EV chargers). Without such differentiation, this cost may be incorrectly distributed among LCOE and LCOH. Additionally, the costs of both types of peripheral devices (LCOEs and LCOHs) are also added factors in the total levelized cost of energy of the entire system. The detailed execution of the proposed method using three different co-generation EV station designs is presented in Section 5.
In summary, the method proposed in this study, which assesses the share of each energy type in a co-generation EV station while appropriately accounting for the cost of peripheral devices, offers a more precise economic evaluation for combined charging and refueling stations. By providing both the overall levelized cost of energy for the entire system and the levelized cost of individual energy streams (electricity and hydrogen), the proposed approach offers a holistic perspective on the economic viability of co-generation charging and refueling stations.

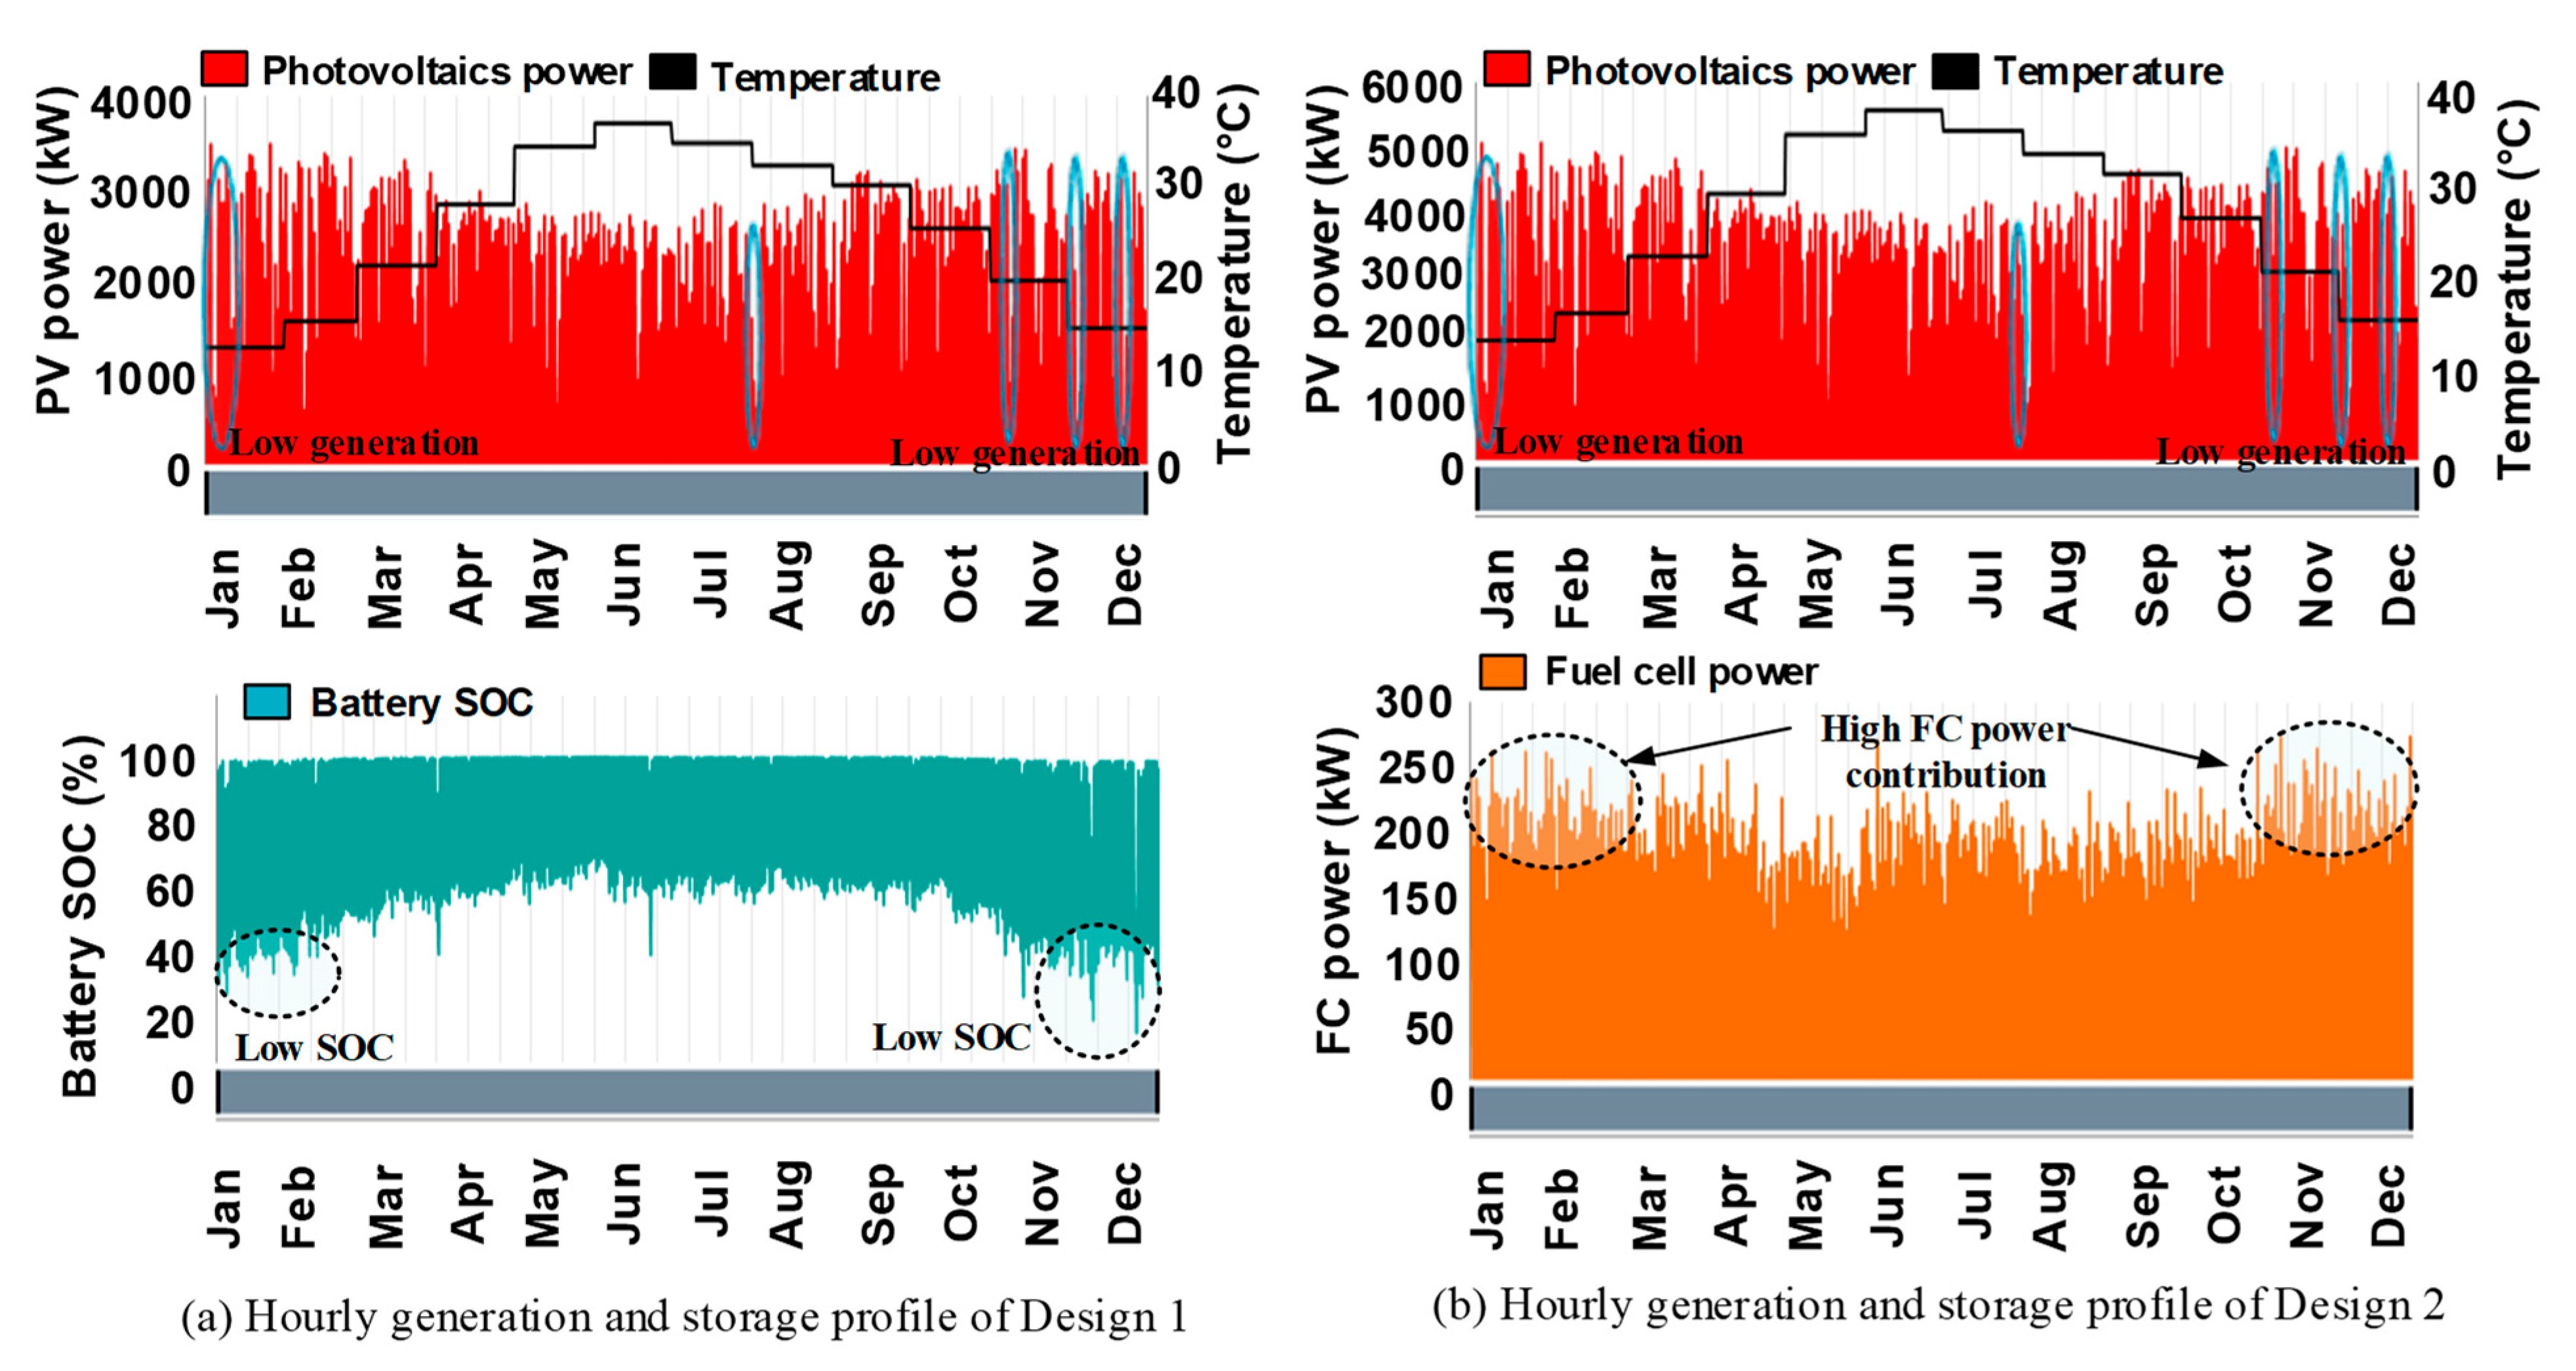
5. Results and Discussion

The optimization process facilitates the identification of optimal sizing for all designs. The optimal sizing results based on the net present cost, obtained through HOMER Pro, are outlined in Table 1. The energy balance based on this optimal component sizing is presented in Table 2. This energy balance shows that all designs can fulfill the demand of the station. Electricity production and consumption trends vary in these designs due to differences in the configuration of designs. For instance, the electricity consumption by the electrolyzer stands at 43.29% in Design 1, which increases to 46.59% in Design 2, as more hydrogen is produced in Design 2 because it relies only on hydrogen storage without battery support. Likewise, the consumption by the other system components also varies slightly due to the distinct configuration of each design. From the technical perspective, Table 2 shows that all design configurations were able to fulfill the hydrogen and electrical demands.
From an economic perspective, Table 1 shows that the NPC of the first two designs, which are based on single storage, is higher than that of Design 3, which has hybrid storage. Among designs with single storage, the battery-based design has a lower cost compared with the fuel cell-based design. The high cost of the fuel cell-based design can be attributed to the high capital and replacement cost of the fuel cell and the increased sizing of PV panels and hydrogen tanks compared with the battery-based design, as depicted in Table 1. In summary, among single storage-based designs, the battery-based design outperforms its fuel cell-based counterpart in terms of NPC.
Design 3, with a hybrid storage option, offers cost reduction compared with the first two designs. This cost reduction can be attributed to the combination of battery and fuel cells, which achieved the capacity reduction of PV, and the battery; hence, facilitated NPC reduction, as can be seen in Table 1. The operation of the storage system in all three designs is illustrated in Figure 4 and Figure 5. It can be seen that the PV power in all designs is reduced at the beginning and end of the year. This reduction in PV power is due to reduced solar radiation during winter periods (at the start and end of the year), as can be seen in Figure 3d. As a result, these events require more storage backup. Hence, the battery state of charge (SOC) in Design 1 reaches its lowest during this period, as shown in Figure 4a. Likewise, fuel cell power contribution is highest during the low-solar-radiation periods in Design 2, as shown in Figure 4b. In the case of Design 3, the fuel cell and battery together provide power during these events, as shown in Figure 5, which might be attributed to system components’ sizing reduction in this case. However, to obtain the optimal sizing combination, optimization needs to be conducted. In this study, Design 3 with 1795 kWh batteries, a 90 kW fuel cell, 3495 kW of photovoltaic capacity, an 1100 kW electrolyzer, an 800 kg hydrogen tank, and a 255 kW converter was found optimal using HOMER’s optimization.
Note that the NPC of design alternatives in Table 1 is based on the main system components obtained from HOMER without peripheral devices. The peripheral devices are not available in HOMER software. As a result, various studies [10,11,17,18,20,21,22,23,24] did not consider these devices. However, this simplification may lead to imprecise results as mentioned earlier. Therefore, this study calculated the NPC of these peripheral devices. Then, the total NPC of design alternatives was recalculated to include the cost of peripheral devices, as shown in Table 3. In Table 3, the hydrogen peripheral devices include a high-pressure hydrogen tank, a pre-cooling unit, a compressor, and a dispenser. Charging peripheral devices for BEVs comprise dynamic EV chargers. The cost specifics of peripheral components used to evaluate their NPC are given in Table S2 and their sizing has been elucidated in Section 3.4. By comparing the NPC in Table 1 (without peripheral devices) and Table 3 (with peripheral devices), it can be noticed that the NPC of Designs 1, 2, and 3 increased by 14.07% (from USD 5,948,122 to USD 6,784,898), 6.08% (USD 12,298,952 to USD 13,135,728), and 14.55% (from USD 5,750,772 to USD 6,587,549), respectively. Hence, omitting these costs can result in significant errors in the NPC estimation of design alternatives.
Afterward, levelized costs were calculated using the proposed methodology in this paper. First, the total levelized cost of energy without peripheral devices (TLCOEs) was calculated using the annualized cost of the system given by HOMER and dividing it by Eserved. The Eserved is the total energy served including the hydrogen generated by the electrolyzer and electricity served to BEV charging and hydrogen peripheral devices. The TLCOEs ranged from USD 0.093/kWh to USD 0135/kWh for different design configurations, as can be seen in Table 4 (second column).
From Table 4 (third to fifth columns), it can be seen that the share of electricity served to BEV charging (Yelect) stands at 22.6%, the share of hydrogen energy (Yhyd) stands at 71.1%, and the share of electricity used by hydrogen peripheral (Yhyd-PD) stands at 2.2% for Design 1. These shares (Yelect, Yhyd and Yhyd-PD) in Design 2 stand at 18%, 80.5%, and 1.5%, while for Design 3, these shares stand at 26.6%, 71.2%, and 2.2%, respectively. These shares slightly vary across designs due to different production trends. For instance, compared with Designs 1 and 3, the hydrogen share in Design 2 is higher because more hydrogen is produced in this design as hydrogen is the only storage in this configuration.
Based on the shares of electricity and hydrogen, the levelized costs of electricity and hydrogen (LCOEs and LCOHs) were calculated, as shown in Table 4 (last three columns). Note that the sum of Yhyd and Yhyd-PD was considered the total share of hydrogen energy. This is because Yhyd-PD was the share of electricity that hydrogen peripheral devices consumed to serve the hydrogen refueling. Additionally, the hydrogen HHV value was used to shift the unit between USD/kWh and USD/kg for LCOHg. In the literature, both units USD/kWh and USD/kg have been used for LCOHg; therefore, both units are provided in this study. The results in Table 4 show that LCOEg ranges from USD 0.024 to 0.026/kWh. Likewise, LCOHg ranges from USD 0.068 to 0.111/kWh (or USD 2.69 to 2.79/kg). Note that these levelized costs in Table 4 only include the costs of the main system components obtained from HOMER and do not include the cost of peripheral devices.
To properly include the peripheral devices in levelized cost evaluations, their annualized costs were obtained using the capital recovery factor and NPC of these devices. Then, these annualized costs were used to calculate the levelized cost of hydrogen peripheral devices (LCOHH2-PD) and levelized charging peripheral devices (LCOEChar-PD). The annualized cost of hydrogen peripheral devices was divided by the total hydrogen served to FCEVs, while that of electrical peripheral devices was divided by the total electricity served for BEV charging. The calculated LCOHH2-PD and LCOEChar-PD are outlined in Table 5. By adding the levelized cost of the designs without PD (LCOEs and LCOHs) and the levelized cost of the peripheral device (LCOHH2-PD and LCOEChar-PD), the final levelized costs (LCOE and LCOH) were calculated, as outlined in Table 5.
By comparing Table 4 and Table 5, it can be noticed that LCOH significantly increases when hydrogen peripheral devices’ costs are added. It increases from USD 2.79 to 3.55/kg in Design 1, from USD 4.36 to 5.12/kg in Design 2, and from USD 2.69 to 3.46/kg in Design 3. This increase in LCOH ranges from 17.4% to 27.7% in different designs. On the other hand, the LCOE remains almost similar after adding the charging peripheral device across all designs. This is because charging peripheral devices (i.e., EV chargers) are relatively cheap compared with hydrogen peripheral devices (i.e., high-pressure tank, cooling unit, compressor, and hydrogen dispenser). Therefore, the cost impact of hydrogen peripheral devices is significantly higher due to the higher number of devices required for hydrogen dispensing and their higher costs. Conversely, the cost contribution of EV chargers remains trivial. Hence, two conclusions can be drawn from this analysis: (1) not including the cost of peripheral devices can result in a significant error (up to 27.7%) in levelized costs; (2) not distinguishing between charging and hydrogen refueling peripheral devices can incorrectly increase the LCOE and decrease the LCOH. Hence, the proposed method, by including the peripheral devices and distinguishing them into hydrogen dispensing and electricity charging, offers a relatively precise method to estimate the levelized cost for co-generation EV stations.
The LCOHH2-PD and LCOEChar-PD were also factored into the TLCOEg to calculate TLCOE, that is, the total levelized cost of energy of the complete system considering peripheral devices. Figure 6 illustrates the breakdown of TLCOE contributions across different designs. From Figure 6, it can be seen that the contribution of different components remains similar in Designs 1 and 3 because of similar system sizing. The minor percentage distribution variation is due to the small capacity of the fuel cell in Design 3 compared with Design 1 (as shown in Table 1). Notably, a significant difference is in Design 2 where the 42.2% contribution of fuel cells highlights that employing only fuel cells as storage can significantly increase the TLCOE. Overall, the TLCOE of Designs 1 to 3 stands at USD 0.117/kWh, USD 0.155/kWh, and USD 0.113/kWh, respectively. Figure 7 visually presents the TLCOE, LCOE, and LCOH for all three designs, indicating that Design 3 with a hybrid storage system is the most attractive from the levelized cost perspective.
The levelized cost calculation method featured in this study yields results consistent with those reported in the existing literature, as demonstrated in Table 6. A detailed discussion of some studies is also provided in Section 1. Specifically, Table 6 indicates a range for the levelized cost of energy from USD 0.0349 to 2.500/kWh and the levelized cost of hydrogen from USD 2.12 to 11.08/kg. The calculated levelized costs for various design configurations in this study are similar to these ranges, with TLCOE ranging from USD 0.113 to 0.117/kWh, LCOE from USD 0.025 to 0.026/kWh, and LCOH from USD 3.461 to 5.123/kg. This consistency indicates the correctness of the proposed methodology.
The observed variations in reported values across studies stem from differences in energy system dynamics and the specific site conditions. Table 6 illustrates that these studies encompass a range of loads, discount rates, and interest rates tailored to their respective locations. Additionally, discrepancies in meteorological data further contribute to variations in LCOE and LCOH values. Therefore, values in different studies vary.
In conclusion, the method proposed in this study, which assesses the share of each energy type in a co-generation EV station while appropriately accounting for the cost of peripheral devices, offers a more precise economic evaluation of such co-generation charging and refueling stations. By providing both the overall levelized cost of energy for the entire co-generation system and the levelized cost of individual energy types (electricity and hydrogen), the proposed approach offers a comprehensive perspective on the economic viability of charging and refueling stations. Such granularity might enable informed decision-making and facilitate the identification of areas for cost reduction, ultimately enhancing the economic sustainability of such energy systems.

6. Conclusions

This study introduces a comprehensive method to evaluate the economic viability of co-generation electric vehicle stations that concurrently produce hydrogen and electricity for fuel cell vehicles (FCEVs) and battery electric vehicles (BEVs), respectively. The approach precisely differentiates costs across various energy outputs based on their proportion of total generated energy and integrates often-overlooked peripheral devices in the calculations of the levelized cost of electricity (LCOE) and levelized cost of hydrogen (LCOH).
The method was applied to three configurations with distinct storage options: battery, fuel cell, and a combination of both. Each configuration was optimized in HOMER Pro to achieve optimal sizing solutions, which the proposed method used to calculate levelized costs. The analysis highlighted a significant potential for error—up to 27.7% in LCOH calculations when peripheral devices were excluded, though the impact on LCOE remained marginal. Among the single storage designs, the battery-based design was found to be more cost-effective compared to the fuel cell-based design. Among all designs, the hybrid storage design was the most economical, offering a total levelized cost of energy (TLCOE) for the entire system of USD 0.113/kWh, with an LCOE of USD 0.025/kWh and an LCOH of USD 0.088/kWh (or USD 3.46/kg). Comparative analysis with state-of-the-art studies endorses the accuracy of the method.
The proposed method provides a holistic analysis, not only offering LCOE and LCOH but also the TLCOE of the entire co-generation station. It can be exploited for the techno-economic analysis of co-generation EV stations globally, thereby supporting strategic decision-making in sustainable urban development. Future research can explore the integration of additional renewable energy sources, such as wind, micro-hydro, or geothermal, into co-generation EV stations to evaluate their influence on system resilience and cost-effectiveness across diverse geographic regions.

Supplementary Materials

The following supporting information can be downloaded at: https://www.mdpi.com/article/10.3390/en17112682/s1, Table S1: Specifics of system components; Table S2: Specifics of peripheral components [8,31,33,51,53,54].

Author Contributions

M.T. and S.H. developed the idea for this study; M.T. and H.Z. conducted the optimization and calculations; data analysis was performed by M.T. and H.Z.; M.T. and S.H. revised the manuscript. All authors have read and agreed to the published version of the manuscript.

Funding

This work was supported by the Zhejiang Provincial Natural Science Foundation of China (under Grant LGG22E070013) and the National Natural Science Foundation of China (under Grant 52177199).

Data Availability Statement

The raw data supporting the conclusions of this article will be made available by the authors on request.

Conflicts of Interest

The authors declare no conflicts of interest.

References

  1. Nicolaides, D.; Cebon, D.; Miles, J. An Urban Charging Infrastructure for Electric Road Freight Operations: A Case Study for Cambridge UK. IEEE Syst. J. 2019, 13, 2057–2068. [Google Scholar] [CrossRef]
  2. Muna, Y.B.; Kuo, C.-C. Feasibility and Techno-Economic Analysis of Electric Vehicle Charging of PV/Wind/Diesel/Battery Hybrid Energy System with Different Battery Technology. Energies 2022, 15, 4364. [Google Scholar] [CrossRef]
  3. Abdelrahim, M.; Alkawsi, G.; Alkahtani, A.A.; Alhasan, A.M.W.; Khudari, M.; Abdul Kadir, M.R.; Ekanayake, J.; Tiong, S.K. Techno-Economic Analysis of a Wind-Energy-Based Charging Station for Electric Vehicles in High-Rise Buildings in Malaysia. Energies 2022, 15, 5412. [Google Scholar] [CrossRef]
  4. Tahir, M.; Hu, S.; He, X.; Sideng, H.; Xiangning, H. Performance Improvement Strategies for Discrete Wide Bandgap Devices: A Systematic Review. Front. Energy Res. 2021, 9, 4691–4699. [Google Scholar] [CrossRef]
  5. İnci, M.; Büyük, M.; Demir, M.H.; İlbey, G. A Review and Research on Fuel Cell Electric Vehicles: Topologies, Power Electronic Converters, Energy Management Methods, Technical Challenges, Marketing and Future Aspects. Renew. Sustain. Energy Rev. 2021, 137, 110648. [Google Scholar] [CrossRef]
  6. Pramuanjaroenkij, A.; Kakaç, S. The Fuel Cell Electric Vehicles: The Highlight Review. Int. J. Hydrogen Energy 2023, 48, 9401–9425. [Google Scholar] [CrossRef]
  7. Fang, T.; Vairin, C.; von Jouanne, A.; Agamloh, E.; Yokochi, A. Review of Fuel-Cell Electric Vehicles. Energies 2024, 17, 2160. [Google Scholar] [CrossRef]
  8. Gökçek, M.; Kale, C. Optimal Design of a Hydrogen Refuelling Station (HRFS) Powered by Hybrid Power System. Energy Convers. Manag. 2018, 161, 215–224. [Google Scholar] [CrossRef]
  9. Greene, D.L.; Ogden, J.M.; Lin, Z. Challenges in the Designing, Planning and Deployment of Hydrogen Refueling Infrastructure for Fuel Cell Electric Vehicles. eTransportation 2020, 6, 100086. [Google Scholar] [CrossRef]
  10. Palanisamy, S.; Lala, H. Optimal Sizing of Renewable Energy Powered Hydrogen and Electric Vehicle Charging Station (HEVCS). IEEE Access 2024, 12, 48239–48254. [Google Scholar] [CrossRef]
  11. Praveenkumar, S.; Agyekum, E.B.; Ampah, J.D.; Afrane, S.; Velkin, V.I.; Mehmood, U.; Awosusi, A.A. Techno-Economic Optimization of PV System for Hydrogen Production and Electric Vehicle Charging Stations under Five Different Climatic Conditions in India. Int. J. Hydrogen Energy 2022, 47, 38087–38105. [Google Scholar] [CrossRef]
  12. Ampah, J.D.; Afrane, S.; Agyekum, E.B.; Adun, H.; Yusuf, A.A.; Bamisile, O.; Dankwa, J.; Afrane, S.; Bonah, E.; Adun, H.; et al. Electric Vehicles Development in Sub-Saharan Africa: Performance Assessment of Standalone Renewable Energy Systems for Hydrogen Refuelling and Electricity Charging Stations (HRECS). J. Clean. Prod. 2022, 376, 134238. [Google Scholar] [CrossRef]
  13. Xu, X.; Hu, W.; Cao, D.; Huang, Q.; Liu, W.; Jacobson, M.Z.; Chen, Z. Optimal Operational Strategy for an Offgrid Hybrid Hydrogen/Electricity Refueling Station Powered by Solar Photovoltaics. J. Power Sources 2020, 451, 227810. [Google Scholar] [CrossRef]
  14. Huang, W.; Zhang, N.; Yang, J.; Wang, Y.; Kang, C. Optimal Configuration Planning of Multi-Energy Systems Considering Distributed Renewable Energy. IEEE Trans. Smart Grid 2019, 10, 1452–1464. [Google Scholar] [CrossRef]
  15. Alabi, T.M.; Agbajor, F.D.; Yang, Z.; Lu, L.; Ogungbile, A.J. Strategic Potential of Multi-Energy System towards Carbon Neutrality: A Forward-Looking Overview. Energy Built Environ. 2023, 4, 689–708. [Google Scholar] [CrossRef]
  16. Shoja, Z.M.; Mirzaei, M.A.; Seyedi, H.; Zare, K. Sustainable Energy Supply of Electric Vehicle Charging Parks and Hydrogen Refueling Stations Integrated in Local Energy Systems under a Risk-Averse Optimization Strategy. J. Energy Storage 2022, 55, 105633. [Google Scholar] [CrossRef]
  17. Nasser, M.; Megahed, T.F.; Ookawara, S.; Hassan, H. Performance Evaluation of PV Panels/Wind Turbines Hybrid System for Green Hydrogen Generation and Storage: Energy, Exergy, Economic, and Enviroeconomic. Energy Convers. Manag. 2022, 267, 115870. [Google Scholar] [CrossRef]
  18. Okonkwo, P.C. A Case Study on Hydrogen Refueling Station Techno-Economic Viability. Int. J. Hydrogen Energy 2024, 49, 736–746. [Google Scholar] [CrossRef]
  19. Barhoumi, E.M.; Okonkwo, P.C.; Farhani, S.; Ben Belgacem, I.; Zghaibeh, M.; Mansir, I.B.; Bacha, F. Techno-Economic Analysis of Photovoltaic-Hydrogen Refueling Station Case Study: A Transport Company Tunis-Tunisia. Int. J. Hydrogen Energy 2022, 47, 24523–24532. [Google Scholar] [CrossRef]
  20. Caliskan, A.; Percin, H.B. Techno-Economic Analysis of a Campus-Based Hydrogen-Producing Hybrid System. Int. J. Hydrogen Energy, 2024; in press. [Google Scholar] [CrossRef]
  21. Rezaei, M.; Naghdi-Khozani, N.; Jafari, N. Wind Energy Utilization for Hydrogen Production in an Underdeveloped Country: An Economic Investigation. Renew. Energy 2020, 147, 1044–1057. [Google Scholar] [CrossRef]
  22. Mostafaeipour, A.; Rezayat, H.; Rezaei, M. A Thorough Investigation of Solar-Powered Hydrogen Potential and Accurate Location Planning for Big Cities: A Case Study. Int. J. Hydrogen Energy 2020, 45, 31599–31611. [Google Scholar] [CrossRef]
  23. Ahshan, R.; Onen, A.; Al-Badi, A.H. Assessment of Wind-to-Hydrogen (Wind-H2) Generation Prospects in the Sultanate of Oman. Renew. Energy 2022, 200, 271–282. [Google Scholar] [CrossRef]
  24. Sadiq, M.; Alshehhi, R.J.; Urs, R.R.; Mayyas, A.T. Techno-Economic Analysis of Green-H2@Scale Production. Renew. Energy 2023, 219, 119362. [Google Scholar] [CrossRef]
  25. Rana, I.A.; Bhatti, S.S. Lahore, Pakistan—Urbanization Challenges and Opportunities. Cities 2018, 72, 348–355. [Google Scholar] [CrossRef]
  26. Qureshi, T.M.; Ullah, K.; Arentsen, M.J. Factors Responsible for Solar PV Adoption at Household Level: A Case of Lahore, Pakistan. Renew. Sustain. Energy Rev. 2017, 78, 754–763. [Google Scholar] [CrossRef]
  27. Kazmi, H.; Mehmood, F.; Tao, Z.; Riaz, Z.; Driesen, J. Electricity Load-Shedding in Pakistan: Unintended Consequences, Opportunities and Policy Recommendations. Energy Policy 2019, 128, 411–417. [Google Scholar] [CrossRef]
  28. NASA POWER|Prediction of Worldwide Energy Resources. Available online: https://power.larc.nasa.gov/ (accessed on 12 February 2024).
  29. Thirunavukkarasu, M.; Sawle, Y.; Lala, H. A Comprehensive Review on Optimization of Hybrid Renewable Energy Systems Using Various Optimization Techniques. Renew. Sustain. Energy Rev. 2023, 176, 113192. [Google Scholar] [CrossRef]
  30. Sinha, S.; Chandel, S.S. Review of Software Tools for Hybrid Renewable Energy Systems. Renew. Sustain. Energy Rev. 2014, 32, 192–205. [Google Scholar] [CrossRef]
  31. Khan, T.; Waseem, M.; Tahir, M.; Liu, S.; Yu, M. Autonomous Hydrogen-Based Solar-Powered Energy System for Rural Electrification in Balochistan, Pakistan: An Energy-Economic Feasibility Analysis. Energy Convers. Manag. 2022, 271, 116284. [Google Scholar] [CrossRef]
  32. Tahir, M.; Hu, S.; Khan, T.; Zhu, H. Sustainable Hybrid Station Design Framework for Electric Vehicle Charging and Hydrogen Vehicle Refueling Based on Multiple Attributes. Energy Convers. Manag. 2024, 300, 117922. [Google Scholar] [CrossRef]
  33. Pal, P.; Mukherjee, V. Off-Grid Solar Photovoltaic/Hydrogen Fuel Cell System for Renewable Energy Generation: An Investigation Based on Techno-Economic Feasibility Assessment for the Application of End-User Load Demand in North-East India. Renew. Sustain. Energy Rev. 2021, 149, 111421. [Google Scholar] [CrossRef]
  34. Tahir, M.; Hu, S.; Liang, Z.; Meng, Y. Unit Partition Resonance Analysis Strategy for Impedance Network in Modular Power Converters. Front. Energy Res. 2022, 10, 823938. [Google Scholar] [CrossRef]
  35. Yang, Z.; Tahir, M.; Hu, S.; Huang, Q.; Zhu, H. Transformer Leakage Inductance Calculation Method with Experimental Validation for CLLLC Converter Topology. Energies 2022, 15, 6801. [Google Scholar] [CrossRef]
  36. HOMER Energy. Available online: https://www.homerenergy.com/products/pro/docs/3.11/index.html (accessed on 9 May 2024).
  37. Tahir, M.; Ahmed Khan, S.; Khan, T.; Waseem, M.; Khan, D.; Annuk, A. More Electric Aircraft Challenges: A Study on 270 V/90 V Interleaved Bidirectional DC–DC Converter. Energy Rep. 2022, 8, 1133–1140. [Google Scholar] [CrossRef]
  38. Kinetic Battery Model. Available online: https://support.ul-renewables.com/homer-manuals-pro/kinetic_battery_model.html (accessed on 21 September 2023).
  39. Rad, M.A.V.; Ghasempour, R.; Rahdan, P.; Mousavi, S.; Arastounia, M. Techno-Economic Analysis of a Hybrid Power System Based on the Cost-Effective Hydrogen Production Method for Rural Electrification, a Case Study in Iran. Energy 2020, 190, 116421. [Google Scholar] [CrossRef]
  40. Bezmalinović, D.; Barbir, F.; Tolj, I. Techno-Economic Analysis of PEM Fuel Cells Role in Photovoltaic-Based Systems for the Remote Base Stations. Int. J. Hydrogen Energy 2013, 38, 417–425. [Google Scholar] [CrossRef]
  41. Alaee, P.; Bems, J.; Anvari-Moghaddam, A. A Review of the Latest Trends in Technical and Economic Aspects of EV Charging Management. Energies 2023, 16, 3669. [Google Scholar] [CrossRef]
  42. Zhu, H.; Hu, S.; Tahir, M.; Bai, Y.; Wu, X. CLLC Modeling and Control in V2G Mode to Mitigate Double-Line Frequency Current for High-Power Density On-Board Charger. IEEE J. Emerg. Sel. Top. Power Electron. 2024, 12, 219–230. [Google Scholar] [CrossRef]
  43. Gustafson, M.K. A Computational Approach to Simulating the Performance of a 24-Hour Solar-Fuel Cell-Hydrogen Electric Power Plant. Masters’ Thesis, Wright State University, Dayton, OH, USA, 2013. [Google Scholar]
  44. Reddi, K.; Mintz, M.; Elgowainy, A.; Sutherland, E. Building a Hydrogen Infrastructure in the United States. Compend. Hydrogen Energy 2016, 4, 293–319. [Google Scholar]
  45. Minh, P.V.; Le Quang, S.; Pham, M.H. Technical Economic Analysis of Photovoltaic-Powered Electric Vehicle Charging Stations under Different Solar Irradiation Conditions in Vietnam. Sustainability 2021, 13, 3528. [Google Scholar] [CrossRef]
  46. Ekren, O.; Canbaz, C.H.; Güvel, Ç.B.; Hakan Canbaz, C.; Güvel, Ç.B.; Canbaz, C.H.; Güvel, Ç.B.; Hakan Canbaz, C.; Güvel, Ç.B. Sizing of a Solar-Wind Hybrid Electric Vehicle Charging Station by Using HOMER Software. J. Clean. Prod. 2021, 279, 123615. [Google Scholar] [CrossRef]
  47. Schetinger, A.M.; Dias, D.H.N.; Borba, B.S.M.C.; Pimentel da Silva, G.D. Techno-Economic Feasibility Study on Electric Vehicle and Renewable Energy Integration: A Case Study. Energy Storage 2020, 2, e197. [Google Scholar] [CrossRef]
  48. Podder, A.K.; Supti, S.A.; Islam, S.; Malvoni, M.; Jayakumar, A.; Deb, S.; Kumar, N.M. Feasibility Assessment of Hybrid Solar Photovoltaic-biogas Generator Based Charging Station: A Case of Easy Bike and Auto Rickshaw Scenario in a Developing Nation. Sustainability 2022, 14, 166. [Google Scholar] [CrossRef]
  49. Gabbar, H.A.; Siddique, A.B. Technical and Economic Evaluation of Nuclear Powered Hybrid Renewable Energy System for Fast Charging Station. Energy Convers. Manag. X 2023, 17, 100342. [Google Scholar] [CrossRef]
  50. Mansir, I.B.; Okonkwo, P.C.; Farouk, N. Technoeconomic Optimization of a Photovoltaic Wind Energy-Based Hydrogen Refueling Station: A Case Study. Energy Technol. 2023, 11, 2201490. [Google Scholar] [CrossRef]
  51. Ayodele, T.R.; Mosetlhe, T.C.; Yusuff, A.A.; Ntombela, M. Optimal Design of Wind-Powered Hydrogen Refuelling Station for Some Selected Cities of South Africa. Int. J. Hydrogen Energy 2021, 46, 24919–24930. [Google Scholar] [CrossRef]
  52. Siyal, S.H.; Mentis, D.; Howells, M. Economic Analysis of Standalone Wind-Powered Hydrogen Refueling Stations for Road Transport at Selected Sites in Sweden. Int. J. Hydrogen Energy 2015, 40, 9855–9865. [Google Scholar] [CrossRef]
  53. Canadian Solar–Global n.d. Available online: https://www.csisolar.com/na (accessed on 8 May 2023).
  54. StarCharge: AC Level 2 Chargers n.d. Available online: https://www.wbstar.com/product?id=1609854359141453826 (accessed on 9 May 2023).
Figure 1. Generic diagram of co-generation electric vehicle station.
Energies 17 02682 g001
Figure 2. Daily representatives and seasonal demands for electricity charging and hydrogen refueling.
Energies 17 02682 g002
Figure 3. Solar irradiance, temperatures, and wind velocity data for the targeted site.
Energies 17 02682 g003
Figure 4. Hourly annual generation and storage profile of Designs 1 and 2 with single storage.
Energies 17 02682 g004
Figure 5. Hourly annual generation and storage profile of Design 3 with hybrid storage.
Energies 17 02682 g005
Figure 6. Contribution of different components to the total levelized cost of energy (TLCOE) of EV stations.
Energies 17 02682 g006
Figure 7. Levelized costs to design alternatives.
Energies 17 02682 g007
Table 1. Optimal component sizing of design alternatives obtained from HOMER Pro without peripheral devices.
ConfigurationPV
(kW)
BAT
(kWh)
CON
(kW)
FC
(kW)
EL
(kW)
H2 Tank
(kg)
NPC
(USD)
Design 1
PV+BAT
3552228127711008005,948,122
Design 2
PV+FC
51483043001500110012,298,952
Design 3
PV+BAT+FC
349517952559011008005,750,772
Table 2. Energy balance of different design alternatives.
Design 1
PV+BAT
Design 2
PV+FC
Design 3
PV+BAT+FC
ProductionkWh/yr.%kWh/yr.%kWh/yr.%
Solar PV5,843,327100.008,468,86492.955,750,63399.93
Fuel cell00.00642,6407.0543080.07
Total5,843,327100.009,111,505100.005,754,941100.00
ConsumptionkWh/yr.%kWh/yr.%kWh/yr.%
Electricity consumption
by electrolyzer
2,529,67643.294,244,59646.592,535,15144.05
Electricity consumption
by H2-PD
67,3431.1567,3430.7467,3431.17
Electricity consumption
by BEV charging
804,36413.77804,2538.83804,99013.99
Excess electricity 2,307,31739.493,949,44143.352,213,37938.46
Losses134,6282.3045,8730.50134,0792.33
Total5,843,327100.009,111,505100.005,754,941100.00
Table 3. Total net present cost calculation for all designs considering the peripheral devices.
ComponentsCapital (USD)Replacement (USD)O and M (USD)Salvage (USD)Total NPC (USD)
Design 1
PV+BAT
Battery684,300494,038278,768−341,5471,115,559
Electrolyzer1,210,000732,314224,057−207,4121,958,959
Solar PV1,420,7170723,45902,144,176
Hydrogen tank480,0000162,9510642,951
Converter55,38443,3780−12,28686,477
H2 refueling PD343,220482,135102,412−98,613829,155
Electricity charging PD350051680−10467622
System4,197,1211,757,0331,491,647−660,9036,784,898
Design 2
PV+FC
Fuel Cell600,0004,338,486992,492−389,9785,541,000
Electrolyzer1,650,000998,610305,533−282,8342,671,308
Solar PV2,059,07701,048,52503,107,602
Hydrogen Tank660,0000224,0570884,057
Converter60,83347,6460−13,49594,984
H2 Refueling PD343,220482,135102,412−98,613829,155
Electricity Charging PD350051680−10467622
System5,376,6305,872,0452,673,019−785,96513,135,728
Design 3
PV+BAT+FC
Fuel cell180,00004510−103,41781,092
Battery538,500388,776219,372−268,776877,873
Electrolyzer1,210,000732,314224,057−207,4121,958,959
Solar PV1,398,1800711,98202,110,162
Hydrogen tank480,0000162,9510642,951
Converter51,06639,9960−11,32879,734
H2 refueling PD343,220482,135102,412−98,613829,155
Electricity charging PD350051680−10467622
Total System4,204,4661,648,3891,425,285−690,5916,587,549
Table 4. Levelized costs considering only main system components.
TLCOEs
(USD/kWh)
YelectYhydYhyd-PDLCOEs
(USD/kWh)
LCOHs
(USD/kWh)
LCOHs
(USD/kg)
Design 1
PV+BAT
0.0970.2660.7110.0220.0260.0712.795
Design 2
PV+FC
0.1350.1800.8050.0150.0240.1114.360
Design 3
PV+BAT+FC
0.0930.2660.7120.0220.0250.0682.699
Table 5. Levelized costs considering both main system components are peripheral devices.
Levelized Cost of Hydrogen
(LCOH)
Levelized Cost of Electricity
(LCOE)
Total Levelized Cost of Energy (TLCOE)
SystemH2-PDTotalSystemChar-PDTotalSystemTotal
LCOHs
(USD/kWh)
LCOHPD
(USD/kWh)
LCOH
(USD/kWh)
LCOH
(USD/kg)
LCOEs
(USD/kWh)
LCOEPD
(USD/kWh)
LCOE
(USD/kWh)
TLCOEs
(USD/kWh)
TLCOE
(USD/kWh)
Design 1
PV+BAT
0.0710.0190.0903.5580.0260.0004880.0260.0970.117
Design 2
PV+FC
0.1110.0190.1305.1230.0240.0004880.0250.1350.155
Design 3
PV+BAT+FC
0.0680.0190.0883.4610.0250.0004880.0250.0930.113
Note: H2-PD: hydrogen peripheral device; Char-PD: charging peripheral device.
Table 6. Comparison with other studies.
Ref.Hydrogen LoadElectricity LoadNominal Discount RateInterest RateLevelized Cost of EnergyLevelized Cost of Hydrogen
kg/daykWh/day%%USD/kWhUSD/kg
[23]134–247 a6.50.034–0.0703.37–6.13
[21]20150.06–0.072.12–2.26
[45]0.080–0.099
[46]2.4 MWh0.064
[11]1001500820.41–0.483.00–3.22
[47]9004.004.300.120–0.160
[48]72.518.000.181
[49]50,0008.002.000.260–0.330
[50]2003000.170–0.1964.23–4.33
[51]1256.34–8.97
[52]16005.00 *5.18–9.62
[8]1259.138.501.900–2.5008.92–1.08
a tones/site, * real discount rate.
Disclaimer/Publisher’s Note: The statements, opinions and data contained in all publications are solely those of the individual author(s) and contributor(s) and not of MDPI and/or the editor(s). MDPI and/or the editor(s) disclaim responsibility for any injury to people or property resulting from any ideas, methods, instructions or products referred to in the content.

