Abstract
This research examines the risk of natural disasters for offshore wind turbines together with their potential wind energy capacity to help the site selection of offshore wind power farms. Through evaluations of expert questionnaires, we use the fuzzy analytic hierarchy process to weight how natural disasters damage the sub-assemblies of an offshore wind turbine, then obtain the natural disaster risk assessment model, and finally utilize ArcGIS Pro 3.2 to map the potential wind farm sites for the waters off Taiwan’s west coast. We identify that typhoons are the most threatening type of disaster to generators, rotor blades, and rotor hubs; earthquakes are the most threatening to towers; and lightning is the most threatening to transformers. For the whole wind turbine, wind is ironically the most threatening natural disaster, followed by lightning, sea waves, and then earthquakes. Lastly, we examine the results by overlapping the offshore wind farms developed and planned in Taiwan, which coincide with locations in relatively low risk and high wind speed areas.
1. Introduction
Wind power is one of the most precious natural resources and an alternative solution for sustainable energy. With continuous industrial and economic development, the impact of global warming has become increasingly intensified in recent years, and people worldwide have gradually increased their environmental awareness. The United Nations Sustainable Development Goals (SDGs), integrated through various indicators, aim to create a better world by balancing social, economic, and environmental sustainability. Taiwan, an island heavily dependent on imported energy to sustain its power supply, has long relied on conventional fossil fuel generation and nuclear power. Renewable energy has now emerged as a prominent option for transitioning to a low-carbon, less import-dependent energy portfolio for this densely populated country. Offshore wind power is considered one of the most attractive renewable energy sources for sustainable development and has already become an emerging industry in Taiwan.
The technological maturity and development of renewable energy have produced many successful examples in Europe. With appropriate cooperation among industry, government, and academia, the wind energy industrial chain can significantly benefit economic development. The spacious sea areas with strong winds in the Taiwan Strait provide an ideal environment for planning large-scale, utility-class offshore wind farms, with an estimated potential capacity of at least 6–10 GW. Hence, Taiwan has become a prominent offshore wind power market in East Asia, thanks to its favorable wind conditions and the government’s commitment to policies promoting energy security, a green economy, and environmental protection. Its offshore wind power policy and related support reveal the Taiwanese government’s determination to promote renewable energy in the future.
Offshore wind power is a highly capital-intensive industry that requires multi-party cooperation for successful implementation. The entire construction and maintenance process of wind farms includes preliminary site selection, environmental impact assessments, wind turbine installation, power grid layout, and finally, commercial operation and maintenance (O&M). Errors in coordination with stakeholders or vulnerabilities in the technological sub-assemblies of an offshore wind turbine can result in significant costs for a wind farm. Taiwan’s unique climatic conditions, which differ significantly from those in Europe, expose offshore wind turbines to multiple natural catastrophes.
Research and innovations in the European Union aim to lower costs and improve the performance and reliability of offshore wind energy technology [1]. Taiwan, located in the northwest Pacific Ocean near the convergent boundary of the Philippine Sea Plate and the Eurasian Plate, is frequently subject to earthquakes, typhoons, heavy rains, and thunderstorms caused by severe and synoptic-scale weather events [2]. These frequent natural hazards present unique challenges to offshore wind farm development and its O&M. Therefore, a robust risk assessment and management strategy is essential to reduce the offshore wind power industry’s exposure to these unexpected natural hazards.
A significant barrier to developing offshore wind energy is the lack of accurate information about wind resource characteristics and external metocean design conditions in most offshore areas at the heights and depths relevant to wind turbines and their associated structures. Pacheco et al. [3] emphasize the critical need to improve the characterization of metocean conditions to facilitate future offshore wind energy developments. Maandal et al. [4] assess the technical and economic viability of offshore wind farms in the Philippines.
Selecting the appropriate risk mitigation measures for offshore wind farms is a complex and critical task, as the related technologies are extremely costly and time-consuming. Chaouachi et al. [5] propose a site selection framework that investigates, through a systemic approach, the interrelationship of criteria affecting the optimal selection of offshore wind sites, considering decision makers’ priorities and preferences. These multi-criteria are then aggregated to reach a consensus prioritization. A comprehensive risk mitigation strategy dedicated to disaster response can not only avoid the impacts of natural disasters but also increase power generation and reduce O&M costs. Conversely, a poorly chosen strategy can negatively impact overall wind power system operations, reducing production efficiency and profitability. Risk assessment in selecting offshore wind farm sites helps lower and stabilize both predictable and unpredictable risks in the subsequent O&M stage.
Several studies have aimed to reduce the number of potential risk events during the operation and maintenance (O&M) of offshore wind power systems and to implement risk management plans for existing or future offshore wind farms [6]. Two types of risks are classified: system failure risks and environmental risks [7,8]. System failure risks are caused by the degradation of systems and components, leading to significant O&M and component replacement costs. Environmental risks arise from the natural environment, including harsh weather conditions and large waves. Both types of risks reduce the normal operation time of wind turbines, decrease power output, and pose significant safety hazards to people and infrastructure [9]. This research evaluates how potential environmental risks influence equipment failures when selecting wind farm sites.
The fuzzy analytic hierarchy process (FAHP) combines fuzziness with the analytic hierarchy process (AHP) and fuzzy logic to tackle the preference of decision makers and experts in decision-making problems. Therefore, in this research, FAHP is employed to weight how various natural disasters damage the separate sub-assemblies of an offshore wind turbine. Several researchers have explored the efficacies of FAHP in handling vagueness, uncertainty, and fuzziness, thereby removing the crispiness of the relationship of different associating factors [10,11]. Taheri A.H. [12] employs a combined computational model based on the FAHP approach and geographic information system (GIS) to evaluate landslides susceptibility and hazard zonation and to provide hazard risk potential maps. GIS is a computer system designed to manage and display geospatial data effectively. It has become an essential technique for spatial data management and has played a significant role in understanding complex natural resource issues in recent years. A widely used commercial GIS application, ArcGIS Pro 3.2, enables the visualization and analysis of data, allowing users to generate both 2D and 3D maps. This functionality is crucial for comparing potential and actual sites [13,14]. Githinji et al. [15] delineate groundwater potential zones using an effective ensemble of FAHP and geospatial technologies.
The main objective of this study is to develop a framework using integrated approaches to establish a natural disaster risk assessment model, based on delineating zones for offshore wind power site selection in the western waters of Taiwan. Two kinds of data analytics are involved. The first part obtains preliminary information of natural disasters regarding wind speed data/typhoons, wave data/wave heights, earthquakes, and lightning strikes. The second part employs experts’ evaluations and judgements. We then integrate both data analysis results together with the standardized metocean database to establish a natural disaster risk assessment model for offshore wind power generation sites. The balance of risk and reward is always crucial for attracting and retaining investor interest.
The remainder of this paper is organized as follows. Section 2 briefly depicts related studies in the literature about how natural disasters impact wind turbines and discusses the acquisitions of related data employed in the subsequent analyses. Section 3 applies FAHP to verify how natural disasters damage the separate sub-assemblies of an offshore wind turbine based on experts’ evaluations. Section 4 presents the resulting natural disaster risk assessment model and casts light on searching for potential wind farm sites. In comparison with developed and planned wind farm locations, the resulting potential zones for wind power farms confirm the model’s credibility. Section 5 concludes with suggestions for policy and future studies.
2. Metocean Data and Natural Disasters
To explore the main objective of understanding the effect of natural disasters on offshore wind turbines, we first consider four major natural disasters: typhoons, high waves, earthquakes, and lightning strikes. These events can severely damage offshore wind turbines. If the connection to the electrical power grid is lost, the control system may be compromised, putting the structure at risk during any natural disaster. The same reliability levels may not be sufficient to withstand these events. This section investigates related metocean data from various sources in the literature and the acquisition of relevant data used in subsequent analyses.
2.1. High Speed Wind and Typhoon
The higher the wind speed, the larger the power generation capacity. As wind speeds increase, more electricity is generated until it reaches a limit known as the rated speed, at which point the turbine produces its maximum or rated power. Beyond this speed, the power generated by the turbine remains constant until it reaches a cut-out speed, at which point the turbine shuts down to prevent unnecessary strain on the rotor. Additionally, certain metocean parameters, such as wave height or wind speed, must not be exceeded for operability or safety reasons. For instance, when the anemometer registers wind speeds higher than 55 mph (the cut-out speed varies by turbine), it triggers the wind turbine to automatically shut down. Tavner et al. [16] consider the influence of weather on the reliability of wind turbines, particularly the effect of wind speed.
A typhoon is a tropical cyclonic storm that originates in the western Pacific Ocean, while in the Atlantic, the same type of storm is called a hurricane. Typhoons are characterized by large masses of clouds spiraling around a central point, or eye. Known for their destructive powers, typhoons bring heavy and persistent rainfall and coastal storm surges that can have devastating effects. The higher wind speeds and wave heights associated with typhoons, along with their greater variability, can significantly impact the safety and reliability of offshore wind turbines [17]. Current wind turbine designs may not be adequate for typhoon-prone regions [18]. The high frequency of typhoons in the Taiwan area may reduce the fatigue life of offshore wind turbine sub-assemblies, while also increasing O&M costs and downtime.
Various questions regarding hurricanes, typhoons, and tropical cyclones have been posed to hurricane researchers concerning renewable generation capacity. Xie et al. [19] discuss how the failure rates of power converter sub-assemblies are closely related to capacities of wind turbines and wind speeds. Zhang et al. [20] study the failure mechanics and failure modes of wind power structures subjected to typhoon.
2.2. Earthquake
As previously mentioned, Taiwan is situated at the boundary between the Philippine Sea Plate to the east and the Eurasian Plate to the west, leading to frequent high seismic activity due to fast plate motions. Current wind turbine design guidelines include procedures for assessing earthquake resistance. However, the frequency and severity of earthquakes in the Taiwan region may present additional challenges and equipment casualties. Therefore, the literature on estimating and assessing earthquake probability provides important information for this study [21,22].
The earthquake resistance of offshore wind farms is crucial, as earthquakes have repeatedly caused structural collapses of buildings and damaged subsea cables in Taiwan and Southeast Asia. Kaynia [23] offers a comprehensive review of the literature on the seismic aspects of wind turbine design. Seismic-related geohazards, such as faulting, seafloor landslides, and soil liquefaction, may also damage offshore wind turbine sub-assemblies. As offshore wind capacity expands, it is essential to quantify the resistance of offshore wind turbines, foundations, substations, and cables to earthquakes. In particular, planning and designing for soil liquefaction are of high concern and require a thorough investigation and understanding of the geological and geotechnical site characteristics during site evaluation.
2.3. Wave Height
Several research studies have explored the effect of environmental loading on the mechanical behaviors of offshore wind turbine towers. For example, Sun [24] examines the mitigation of monopile offshore wind turbines subjected to wind and wave loading. One phenomenon, known as ringing, is a type of vibration that occurs when choppy waves strike marine installations. The ringing problem may increase significantly as more offshore turbines are planned worldwide. Sun and Jahangiri [25] demonstrate that offshore wind turbines subjected to combined wind and wave loadings experience excessive vibrations, which increase fatigue loading on the structure and reduce fatigue life.
The literature has investigated the combined effect of wind and wave forces on fatigue damage in the sea environment for spar-type offshore floating wind turbines. Li et al. [26] present findings on short-term fatigue damage at the tower base of a spar-type platform under stochastic wind–wave cyclic loads. Hu et al. [27] examine the effects of current wave and wind interaction as a type of dynamic loading on the dynamic response of offshore wind turbine towers.
2.4. Lightning Strike
According to field observations, wind turbines experience a significant number of lightning strikes during their lifetime [28]. Wind turbines act as lightning magnets, and strikes on these tall, spinning structures can cause significant damage, such as blade explosions or the frying of generators and control system electronics. Repairing lightning damage is often expensive and can lead to substantial downtime. Additionally, the increasing size of wind turbines poses considerable challenges for the development of lightning strike protection systems, as the number of lightning strikes grows with the increase in structure height.
To determine how to safely disperse lightning, Becerra et al. [29] evaluate the incidences of downward lightning as well as self-initiated and other-triggered upward flashes to offshore wind power plants. Understanding these dynamics is critical for modeling the frequency of lightning strikes on wind farms.
2.5. Data Sources and Acquisitions
Following the discussions above, the data acquisitions are described in detail as follows.
- (1)
- Wind speed data are obtained from the National Aeronautics and Space Administration (NASA) Modern-Era Retrospective analysis for Research and Applications (Version 2, MERRA-2). We collect wind speed data on a total of 45 geographical locations, resulting from a grid of 0.625 degrees for both longitude and latitude as cut-off points in the area lying between north latitude 22.0 degrees and 26.0 degrees and between east longitude 119.375 degrees and 121.875 degrees. The time scale is every 60-min’ wind speed spanning from 1 January 1980 to 31 December 2018 at each location.
- (2)
- Wave height data are obtained from the open weather data website of the Central Weather Bureau (CWB), Taiwan (website: https://opendata.cwa.gov.tw/dataset/observation/C-B0049-001, accessed on 1 February 2021). Effective wave height is based on significant wave height (SWH) in the period between 2003 and 2019 [30]. SWH data are collected from nine buoy stations in surrounding waters of Taiwan, which include: Xiao Liuqiu Buoy (longitude: 120.3628 E, latitude: 22.3136 N), Hsinchu Buoy (longitude: 120.8461 E, latitude: 24.7606 N), Dongjidao wave station (longitude: 119.68389 E, Latitude: 23.25639 N), Fugui Cape Buoy (longitude: 121.535 E, latitude: 25.3042 N), Pengjiayu Buoy (longitude: 122.065 E, latitude: 25.6153 N), Taichung Buoy (longitude: 120.4094 E, Latitude: 24.2108 N), Pratas Buoy (longitude: 118.82 E, latitude: 21.0733 N), Matsu Buoy (longitude: 120.5133 E, latitude: 26.3508 N), and Chimei Buoy (longitude: 119.5169 E, latitude: 22.9522 N). The location of the buoy stations are obtained from the website of the CWB, Taiwan (website: https://e-service.cwb.gov.tw/wdps/mmc/StationList.htm, accessed on 1 February 2021).
- (3)
- Seismic data are acquired by digitizing iso-acceleration lines from probabilistic seismic hazard analysis (PSHA) in Taiwan, which provides the probability of exceedance for a specific ground motion level during a time interval [31]. The PSHA technique is ideally suited to compiling hazard maps for a large area, in which the calculations are made for a grid of points instead of just one. The corresponding values are contoured to give a picture of the spatial variation of the hazard.
- (4)
- Lightning strike data are obtained from Taiwan government open data—a database of lightning monitoring from January 1989 to December 2019. The monitoring area is from 117 degrees to 125 degrees east longitude and from 19 degrees to 27.5 degrees north latitude. There are two types of lightning: in-cloud (IC) lightning and cloud-to-ground (CG) lightning. Since IC lightning is not able to affect ground devices, we only use CG lightning for the subsequent analysis.
2.6. Study Area
Given the severity of the environment and the limited experience with offshore wind in Taiwanese waters, a site-specific design risk assessment should be undertaken. Successfully addressing these issues will help developers and designers identify ways to mitigate risks through engineering, manufacturing, installation, monitoring, and maintenance/inspection programs. We first use Taiwan’s offshore wind potential and research on optimal offshore block sites by Lu et al. [32] to delineate the exclusion area, the outer line of the 12-nautical-mile territorial sea, and the contour of the waters off Taiwan’s west coast.
To create a potential offshore wind map using the spatial interpolation technique in ArcGIS Pro 3.2, this study employs the built-in spatial analysis function to account for the spatial correlation of variables and predict the values of variables at unobserved locations based on observed locations. The information required for preliminary site selection includes wind speed data, exclusion areas, territorial waters, and isobath boundaries to establish potential locations for offshore wind turbines in the western Taiwan seas. The details are described as follows:
- (1)
- Establish a wind speed network in Taiwan: A preliminary understanding of the wind speed off the coast of Taiwan is required. The designed hub height of the offshore wind turbine in this study is 90 m from the sea level at the corresponding positions accordingly by converting the NASA data from 1980 to 2018. We then build a wind speed network based on the height 90 m from sea level, in which the variation among four seasons is examined. The highest wind speed around the Taiwan waters is in the northwest with relatively low speed in the southwest. In terms of seasons, the wind speed during autumn and winter is significantly higher than that in spring and summer.
- (2)
- Delineation of exclusion areas: This restriction results from economic, technological, environmental, and regulatory aspects. Potential planned sites can be excluded within 2 km of fishing ports, wetlands, fixed fisheries, natural gas pipelines, and submerged pipelines. There are 23 exclusion areas, including important habitat areas for white dolphins, natural environment protection areas in coastal areas, and restricted construction areas for military facility and control reasons.
- (3)
- Isobaths:Given that the wind power farms built in Taiwan consist entirely of fixed offshore wind turbines, the applicable seawater depth is set to a maximum of 50 m due to technical limitations. Therefore, floating offshore wind turbines (FOWTs) that can be installed in depths greater than 50 m are not included in this research. We connect all points having the same depth below a water surface of the 50 m isobaths in western Taiwan.The selection of sites for wind power farms in Taiwan primarily considers several factors such as wind speeds, terrain, environmental protection, and the connectivity to neighboring power grids. Additionally, these sites must avoid areas restricted by various departments to safeguard sources of drinking water, fishing zones, sea lanes of communication, natural reserves, and cultural heritage sites, among others. In order to meet the increasing demands for power, locations with sufficient wind energy are the critical factors for site selection. Although the risks of natural disasters are not a direct criterion for site selection, established methods are available to assess these risks at the chosen locations with strong wind speeds.
- (4)
- Territorial sea: The territorial seas for Taiwan cover areas from the beach to 12 nautical miles outside of the island by law. The construction of offshore wind turbines must be located within the territorial sea. Therefore, 12 nautical miles are used as the benchmark.
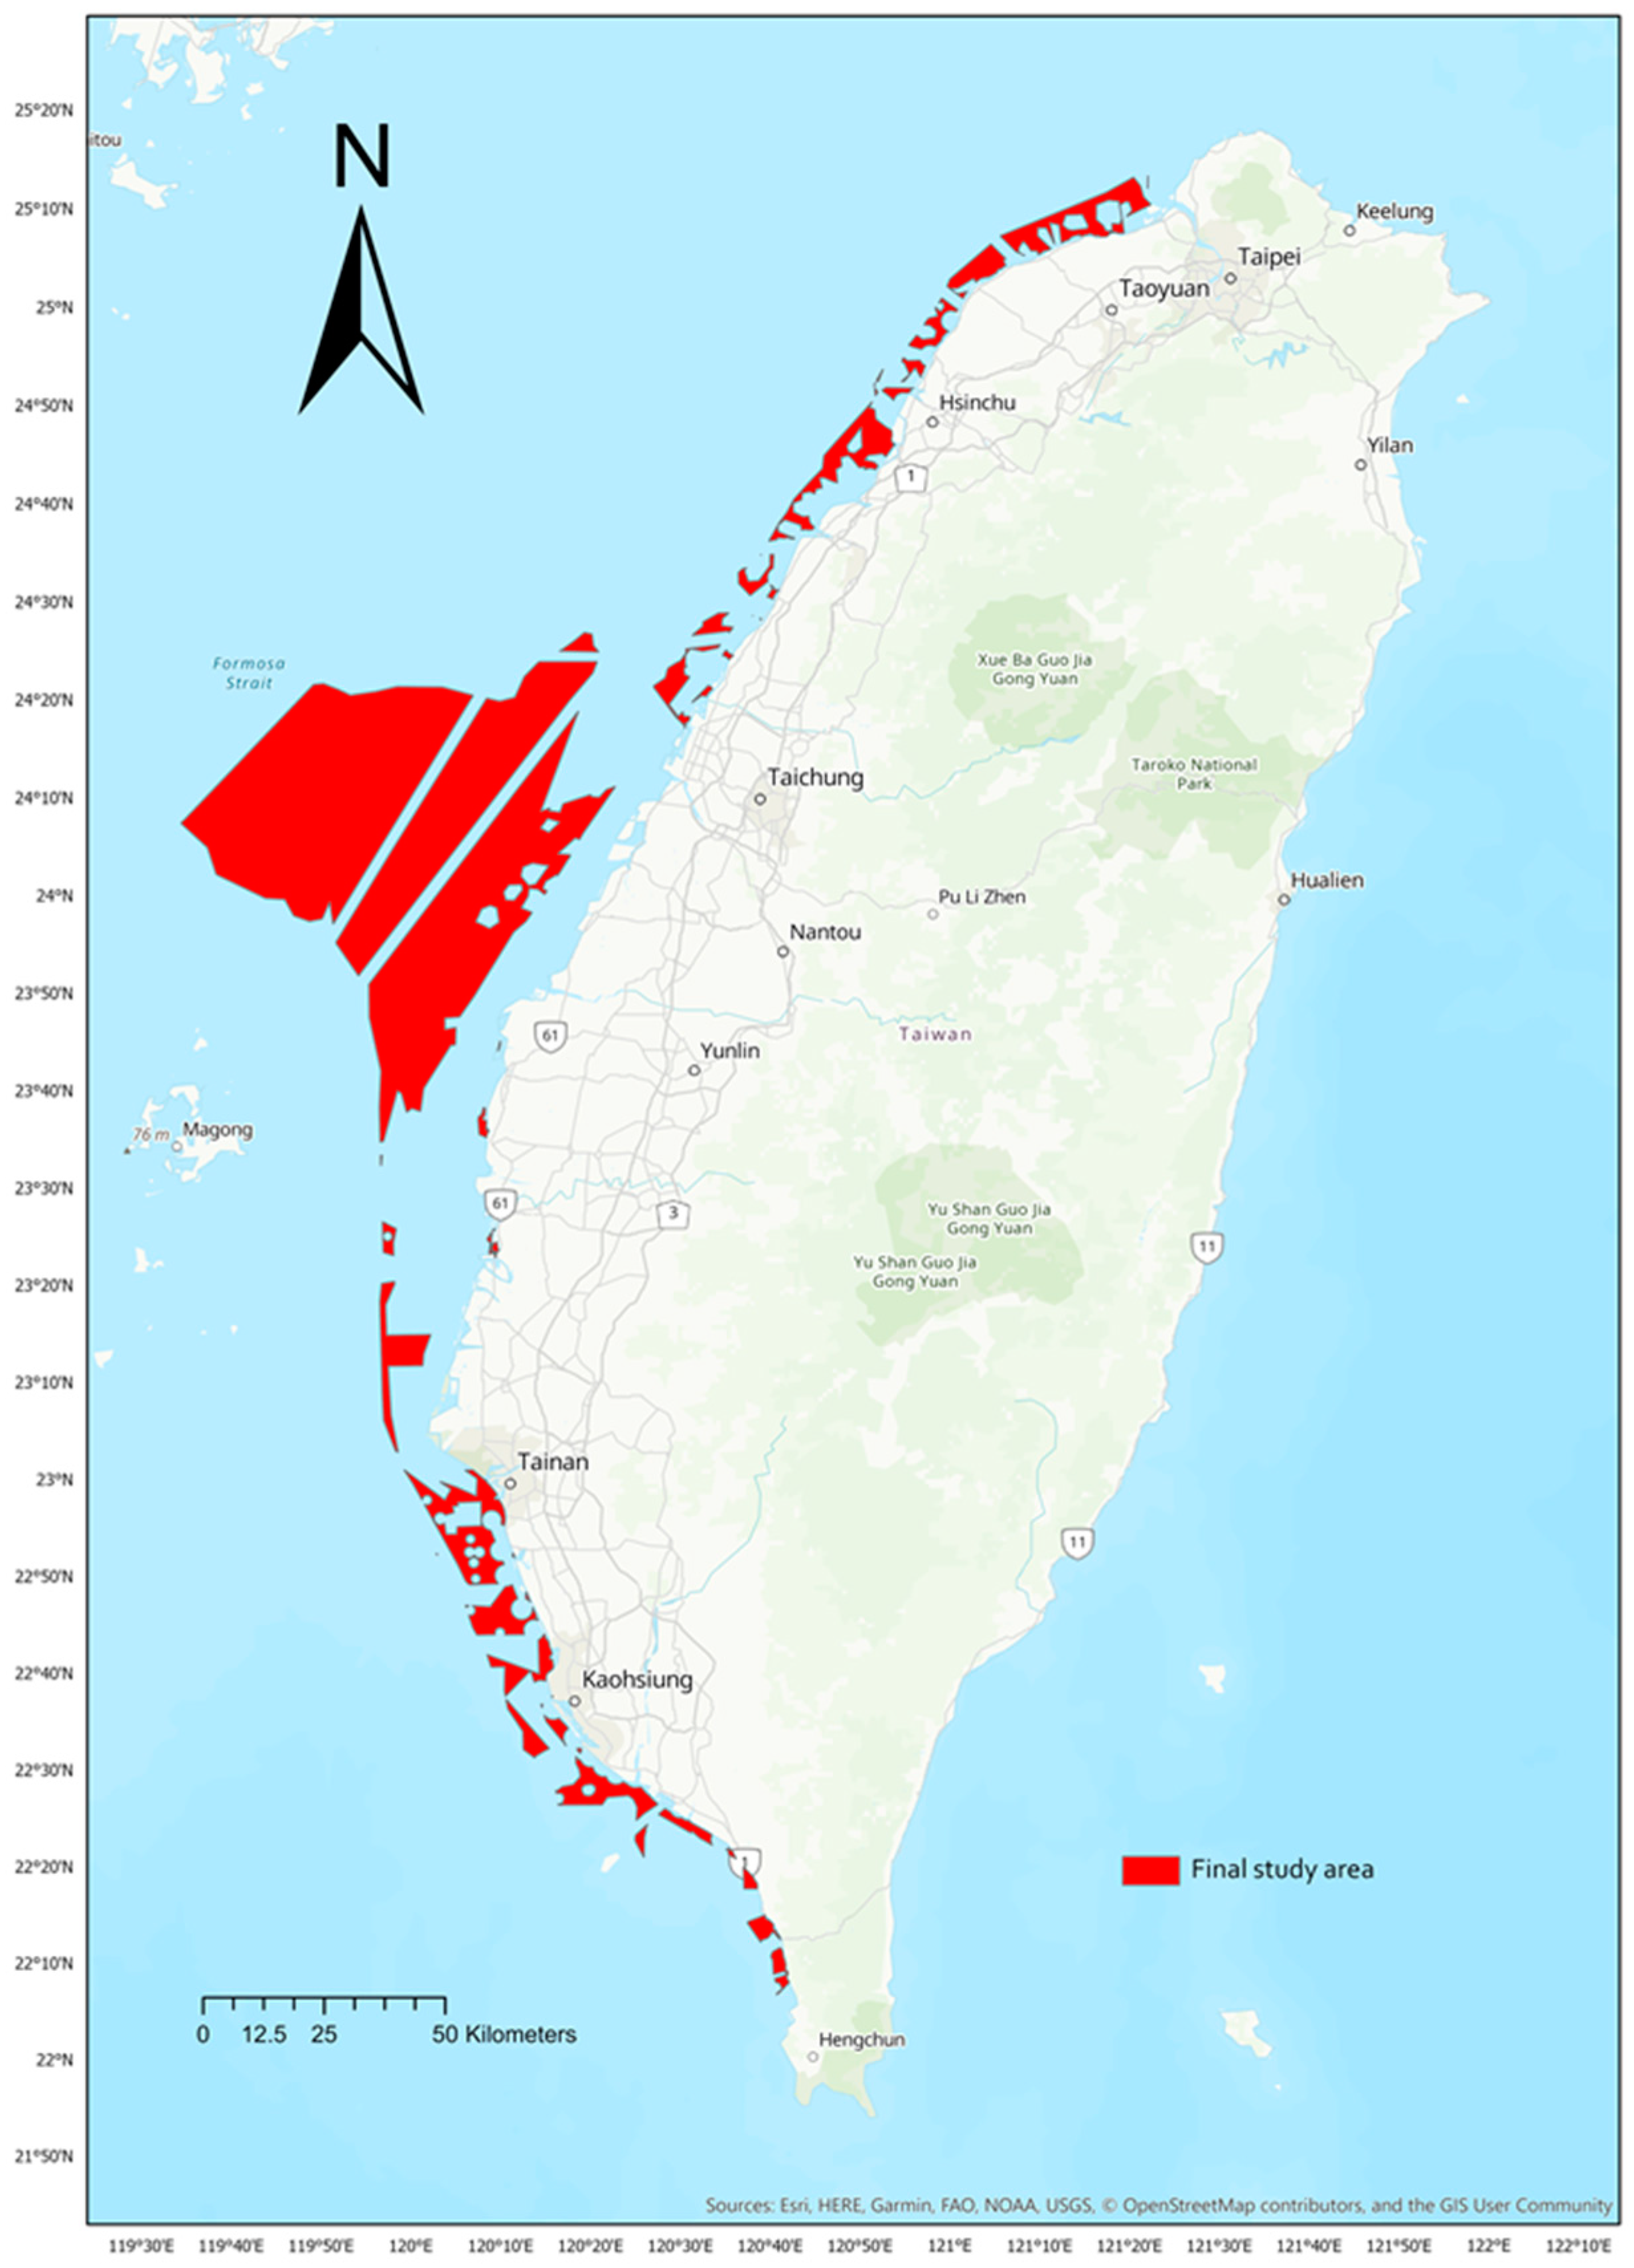
All results from points (1) to (4) are imported into ArcGIS Pro 3.2. Figure 1 presents the resulting study area for the proposed natural disaster risk assessment in subsequent analysis.

Figure 1.
Study area.
3. Natural Disasters and Risk Assessment Models
The risk assessment model proposed in this research includes using FAHP to weight risks and ArcGIS Pro 3.2 software to build a database of natural disasters. To identify potential areas for wind farms, it is essential to understand the likelihood and corresponding weighting of natural risks throughout the construction of a wind turbine and its sub-assemblies. The Analytic Hierarchy Process (AHP) proposed by Saaty [33,34] is a powerful and flexible multi-criteria decision-making method used to solve unstructured problems in various decision-making situations. The AHP method derives ratio scale priorities from approximate pairwise verbal comparisons relative to any quantitative or qualitative attributes.
However, the AHP method provides crisp values and does not account for personal judgment vagueness. The Fuzzy Analytic Hierarchy Process (FAHP) addresses this limitation by integrating linguistic fuzziness [35]. FAHP determines factor weights through pairwise comparisons by domain experts and yields weight ratios based on subjective judgment. These subjective judgments are expressed as triangular fuzzy numbers, indicating uncertainty and lack of confidence in a given decision [11,36]. FAHP is a standard tool for assigning weight to factors based on individual pairwise matrix comparisons using subject knowledge, prior knowledge, and site-specific settings [37],
Based on experts’ views, the FAHP approach transforms concrete values into fuzzy numbers and membership functions. This procedure allows for a more rational weighting of parameters, resulting in the correct assignment of weight to the factors [38]. The final fuzzy weights are used to rank variables in order of importance. The existing literature can be consulted to gain a proper understanding of variable ranking in various environmental conditions.
It is also necessary to prepare a database of information in reference to the influencing factors regarding damage occurrence of wind turbines, which has led to the preparation of input databases in the risk assessment of wind turbine. These factors and their sub-factors are considered as a dataset used for the FAHP model to evaluate the impact coefficients of each factor and sub-factors. The coefficients create information layers in GIS, which lead to digitalized data and can prepare for wind turbine risk maps. We then use ArcGIS Pro 3.2 software to build a database of natural disasters, and its combination with the metocean data can obtain a natural disaster risk assessment model for offshore wind turbines that can be summed up in fields with different risk levels.
As a wind power system located at sea comes with higher failure rates, lower reliability and availability, and higher O&M costs, Shafiee and Dinmohammadi [39] develop a mathematical tool for risk and failure mode analysis of wind turbine systems. Each one of the failure modes has a root cause in which the probability of failure mode directly relates to the probability of occurrence of its root cause. Mishnaevsky et al. [40] present a short overview of composite materials for wind turbine applications. Following the literature [41,42,43,44], this study uses the Supervisory Control And Data Acquisition (SCADA) database, automatic fault log, and operation report to examine a total of sixteen sub-assemblies as shown in Shafiee and Dinmohammadi [39]. Table 1 presents these 16 sub-assemblies being evaluated in this study, according to the ordering failure rate of each component [39,45]. The existing SCADA-based measurements provide valuable information to wind farm operators and researchers. Each failure in the wind turbine system may result in high production loss, poor power quality to the grid, and significant audible noise.

Table 1.
Failure rates of 16 sub-assemblies of a wind turbine.
This study conducts a two-phase questionnaire aiming to gather evaluation and assessment information about sub-assemblies of a wind turbine via face-to-face interviews with experts and scholars. The phase I questionnaire examines data validation and obtains the degree of impact of natural disasters on wind turbine components based on the Likert scale, while phase II employs the FAHP approach. The results of the two questionnaires are then multiplied to weight each separate sub-assembly of a wind energy turbine impacted by various natural disasters.
3.1. Phase I Questionnaire
The failure rate of each component for this study is mainly based on the impact of natural disasters on wind turbines. The experts can effectively express their personal views and appropriate judgments, based on a five-point Likert scale, about the impact of natural disasters on sub-assemblies of wind turbine SWT-6.0-154. This model of wind turbine is manufactured by Sienmens Gamesa Renewable Energy in Zamudio, Vizcaya, Spain. The questionnaire covers five main issues, including wind farm designs and installation, equipment, quality, and service for wind turbine structure, which helps us study the degree of impact of natural disasters on wind turbine sub-assemblies. SWT-6.0-154 is a direct-drive type and without the structure of a gearbox. To make the questionnaire more intelligible, this study focuses on the most vulnerable components (annualized failure rate ≥ 0.139), including rotor blades, generators, towers, transformers, and rotor heads, as shown in Table 1. Five leading experts were invited to be interviewed, from academia and industry, with professional knowledge highly related to the offshore wind power industry. Throughout validity and reliability tests for the questionnaire, all α values are greater than 0.8; Table 2 lists these in detail.
Table 2.
Cronbach’s α values for sub-assemblies.
3.2. Calculation of Normalized Weights Using the FAHP Method
This section investigates the influence of wind speed, waves, lightning strikes, and earthquakes on each component unit. We utilize FAHP in the present study for multi-criteria decision making. To obtain the priority vector, a triangular fuzzy comparison matrix is used. The strength of preference for one factor over another is expressed using a linguistic importance scale, as shown in Table 3 [37].
Table 3.
Triangular fuzzy scale.
The evaluation operation is performed by defining fuzzy sets and fuzzy membership functions for each factor. The information is then inferred based on the knowledge of the expert system and then converted into non-fuzzy sets (defuzzification). Using this implementation approach, fuzzy–hierarchical impact coefficients are prepared. Methodologically, the FAHP approach has been used to prepare the impact coefficients of each factor and analyze them in the GIS environment. Data are then classified as information layers and used in the preparation of fuzzy index maps.
The algorithm involved in the extent analysis method is summarized as follows. The flowchart is shown in Figure 2. The hierarchical structure for this study includes those five sub-assemblies as factors and each separate sub-assembly affected by different natural disasters as a sub-factor. The natural disasters of each component are compared in pairs and via a consistency test. For the verification of the consistency test, if it is unqualified, then the procedure goes back to the elimination of the corresponding questionnaire and then makes a pairwise comparison again; if it passes the test, the data are fuzzified and de-fuzzified. Finally, we obtain the weights of the natural disasters on each sub-assembly of the offshore wind turbine.
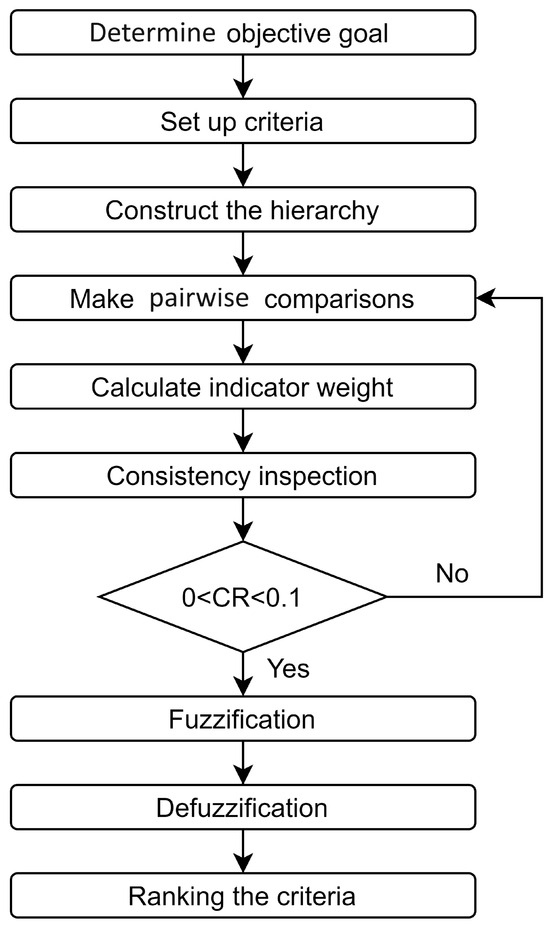
Figure 2.
Flowchart for the FAHP approach.
Table 4 lists the weight values of sub-assemblies in detail. We employ Expert Choice 11 to obtain the consistency index (CI), where the analysis is classified into the random index (RI) and the consistency ratio (CR). If the CR value is greater than 0.1, then this criterion is not suggested to be used. The consistency test of the questionnaire is shown in Table 5, in which criterion for towers does not meet the requirement. Nevertheless, the procedure can carry on with the remaining criteria.
Table 4.
Weight of natural disaster failures on each sub-assembly.
Table 5.
Consistency test for questionnaire.
The calculation of weights for different factors starts by drawing a schematic outline of the interdependencies of various factors. The greater the effect of a factor has on other factors, the greater is its relative value, which results in a higher weight and vice versa [33]. FAHP calculates the impact of wind speed, waves, lightning strikes and earthquakes on rotor blades, generators, towers, transformers, and rotor heads. The fuzzy scale of the expert questionnaire and the triangular fuzzy scale are shown in Table 3. Upon introducing AHP into triangular fuzzy numbers and averaging the pairwise comparison matrices, this study uses the defuzzification method proposed by Chang [46] and Tyagi [47] to solve the weights. The details are in Rahaman et al. [14]. Here, we only summarize the process of fuzzification and defuzzification for FAHP as follows.
- (1)
- Let , , …, be the values of the ith analysis range among m targets. The degree of fuzzy comprehensive value of the ith object is defined as:
- (2)
- Assuming and , the pairwise comparison to evaluate each fuzzy set is:V is the fuzzy number, which is greater than those k fuzzy functions (1, 2, …, k), defined by:
- (3)
- Assume , where k = 1, 2,…, n and , so that the vector weight is obtained as follows:
We now have the normalized weight and defuzzification:
Here, W is a non-fuzzy number.
3.3. Fuzzification and Defuzzification to Obtain Weights
This section constructs a site selection plan based on the risk caused by natural disasters from the perspective of risk assessment for Taiwan western seas. The whole framework is presented in detail as follows. Following the triangular fuzzy scales in Table 1, we obtain the pairwise comparison matrices for all the factors presented in Table 6. Notations C1, C2, C3, and C4 indicate factors for wind, wave, lightning strike, and earthquake, respectively, and G, RB, RH, T, and TR denote those for generators, rotor blades, rotor heads, towers, and transformers, respectively. Table 6 shows the resulting pairwise comparison matrix and calculated weights of all the factors. Notation implies that component X is impacted by natural disaster y. Hence, means generator is impacted by wind, is transformer impacted by earthquake, etc.
Table 6.
Pairwise comparison matrix and calculated weights of all the factors.
Table 7 presents the FAHP weights of each component unit affected by natural disasters. Generator, rotor blade, and rotor head are all affected by the wind to the highest degree, accounting for 32.51%, 49.88%, and 54.19%, respectively. Towers are most affected by earthquakes, accounting for 44.01%, and transformers are most affected by lightning strikes, accounting for 41.69%. In combination with the above results and discussions, Table 8 shows the weights of natural disaster and the resulting annualized failure rate for each component unit.
Table 7.
Weights and fuzzy ratings of influencing factors.
Table 8.
Annualized failure rates of sub-assemblies.
Finally, this study multiplies and linearizes the weights of component units affected by natural disasters and the weights of component units affected by wind speed, waves, lightning strikes, and earthquakes according to FAHP. Throughout the above calculation process, we conclude that each component of the offshore wind turbine can be affected by high wind speed, large waves, earthquakes, and lightning strikes. In terms of wind turbines as a whole, wind is rated as the most threatening natural disaster (40.94%), followed by lightning strikes (22.04%), waves (20.26%), and earthquakes (16.76%).
4. Delineation of Potential Offshore Wind Farms’ Map with Disaster Risk Assessments
After estimating the fuzzy membership functions and extracting the fuzzy coefficients as sensitivity factors for each factor and their corresponding sub-factors, these coefficients are entered into the GIS environment as information layers. These layers represent input information and FAHP coefficients, which are used in the preparation of risk maps. The multi-criteria decision analysis resulting from FAHP is then applied to assign weight to the individual factors influencing wind farm potential in the GIS environment, and these data are imported into ArcGIS Pro 3.2 in the subsequent section.
Using the natural disaster database established in ArcGIS Pro 3.2, we construct an offshore wind force map for the western waters of Taiwan and establish a risk assessment model for natural disaster site selection for power generation. We screen out the five sub-assemblies with the highest failure rates of the wind turbines. Through expert questionnaires, we use fuzzy mathematics to calculate the degree of influence of each turbine unit on the four climate conditions. This section uses ArcGIS Pro 3.2 software to establish a disaster database that is displayed on the map. Based on the weights obtained, it develops a natural disaster risk assessment model for offshore wind power generation in the western waters of Taiwan.
4.1. Mapping Offshore Wind Farms
This section uses ArcGIS Pro 3.2 to establish a natural disaster database that includes high wind speeds, large waves, lightning strikes, and earthquakes. It then combines the weights derived from questionnaires and FAHP to establish a natural disaster risk assessment model for offshore wind turbines.
In addition to identifying potential areas for offshore wind farm sites, this study quantifies the impact of natural disasters on each component of the wind turbine. The following explains the construction of four natural disaster databases, utilizing the data presented in Section 2.5, based on the study area shown in Figure 1 in Section 2.6.
4.1.1. High Wind Speed Frequency Data
The wind speed data are screened to count the number of times that the wind speeds at each geographical point in the study area are greater than 25 m per second, because this is the limit of the wind turbine SWT-6.0-154 being forced to stop. The frequency of strong winds is interpolated into a grid to form high wind speed frequency data. The position points with wind speeds greater than 25 m/s are interpolated into a grid according to the frequency of strong winds to establish high wind speed frequency data. Figure 3 shows that the frequency of strong winds off the western coast of Taiwan is relatively the highest, and the northern area is slightly higher than the southern area.
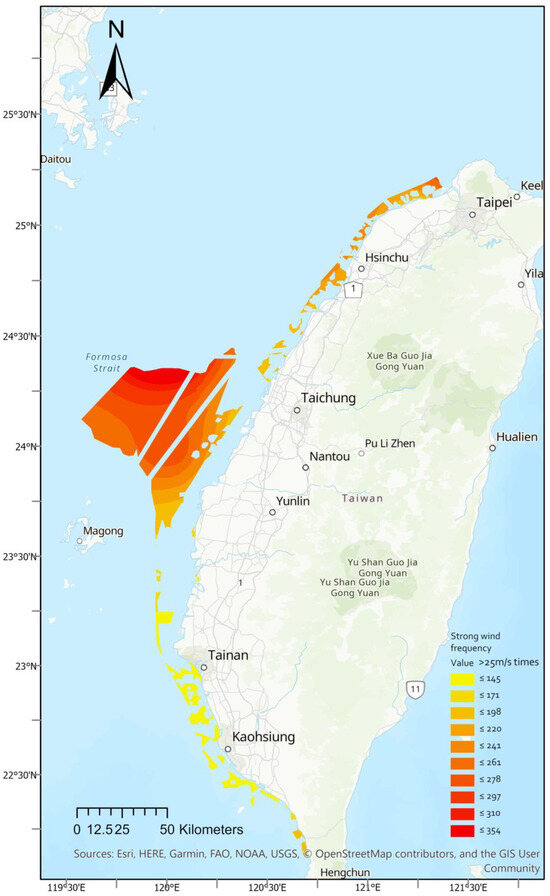
Figure 3.
Frequency for high wind speed data.
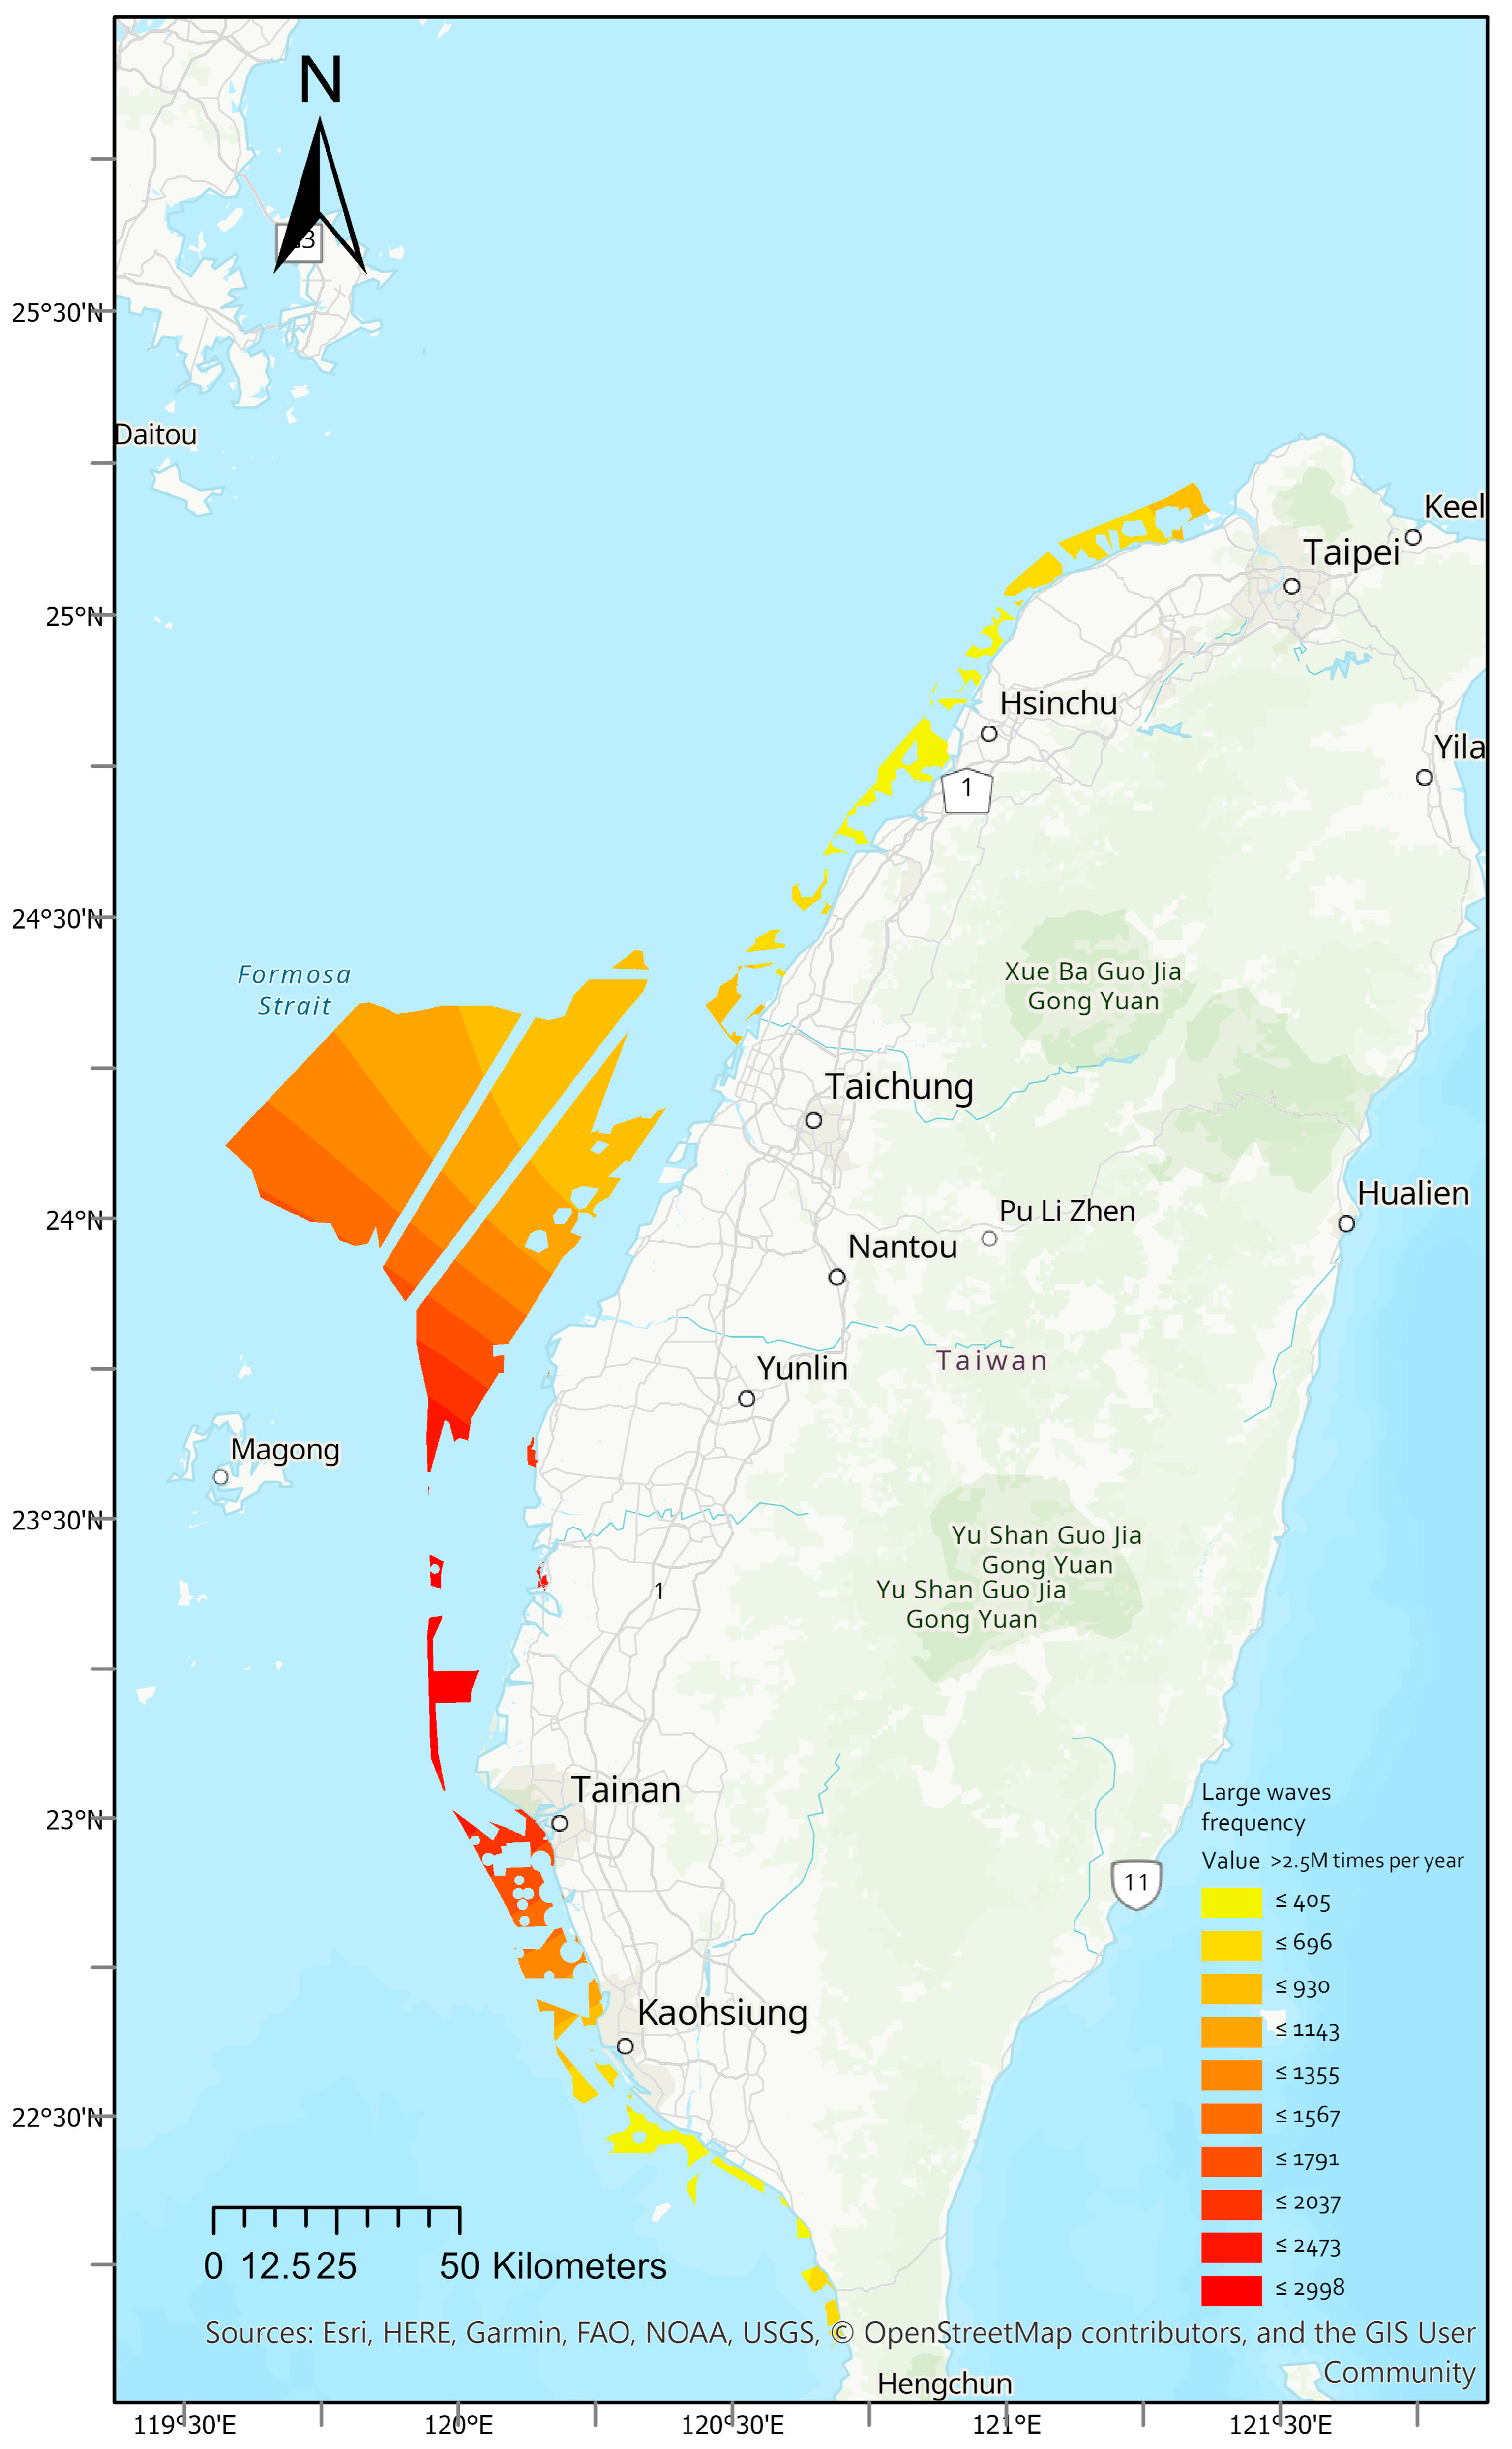
4.1.2. Big Wave Frequency Data
The definition of large waves in this study is a wave height over 2.5 m. The monthly wave height and direction are used to interpolate the buoy stations where large waves appear in a grid according to the frequency of large waves, as shown in Figure 4. We see that the area closer to Penghu has a high frequency of large waves, and this decreases along the north and south sides of Penghu.
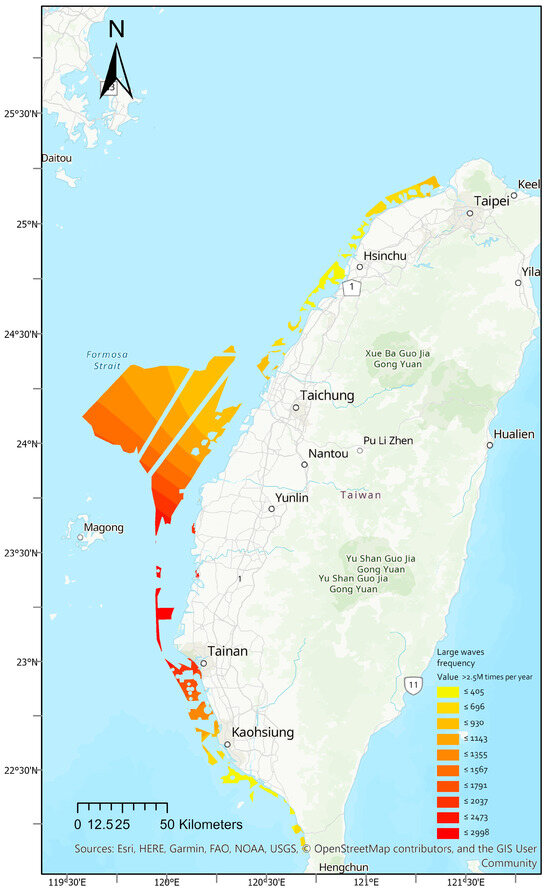
Figure 4.
Frequency for big wave data.
4.1.3. Strong Earthquake Area Data
Seismic data are collected from Taiwan’s seismic hazard analysis 475-year return period according to the Probabilistic Seismic Hazard Analysis (PSHA) iso-acceleration curve. The line feature class is established, digitized, and then interpolated into a grid, where the strong ground motion area data are established according to the seismic acceleration value. Figure 5 presents that the closer to Taiwan’s main island a wind power farm is, the stronger the ground motion area, and the higher the acceleration value. The ground motion decreases as the area moves out to sea.
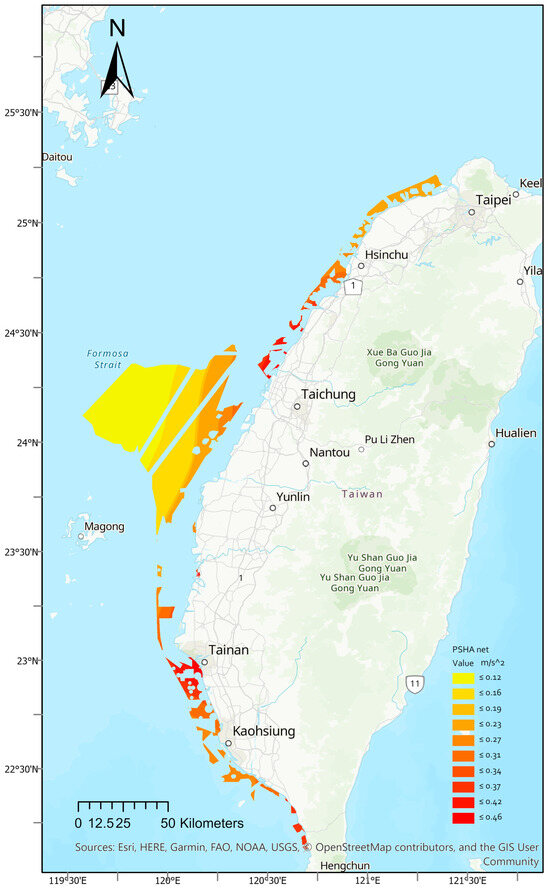
Figure 5.
Regions for strong earthquake data.
4.1.4. Probabilistic Lightning Strike Area
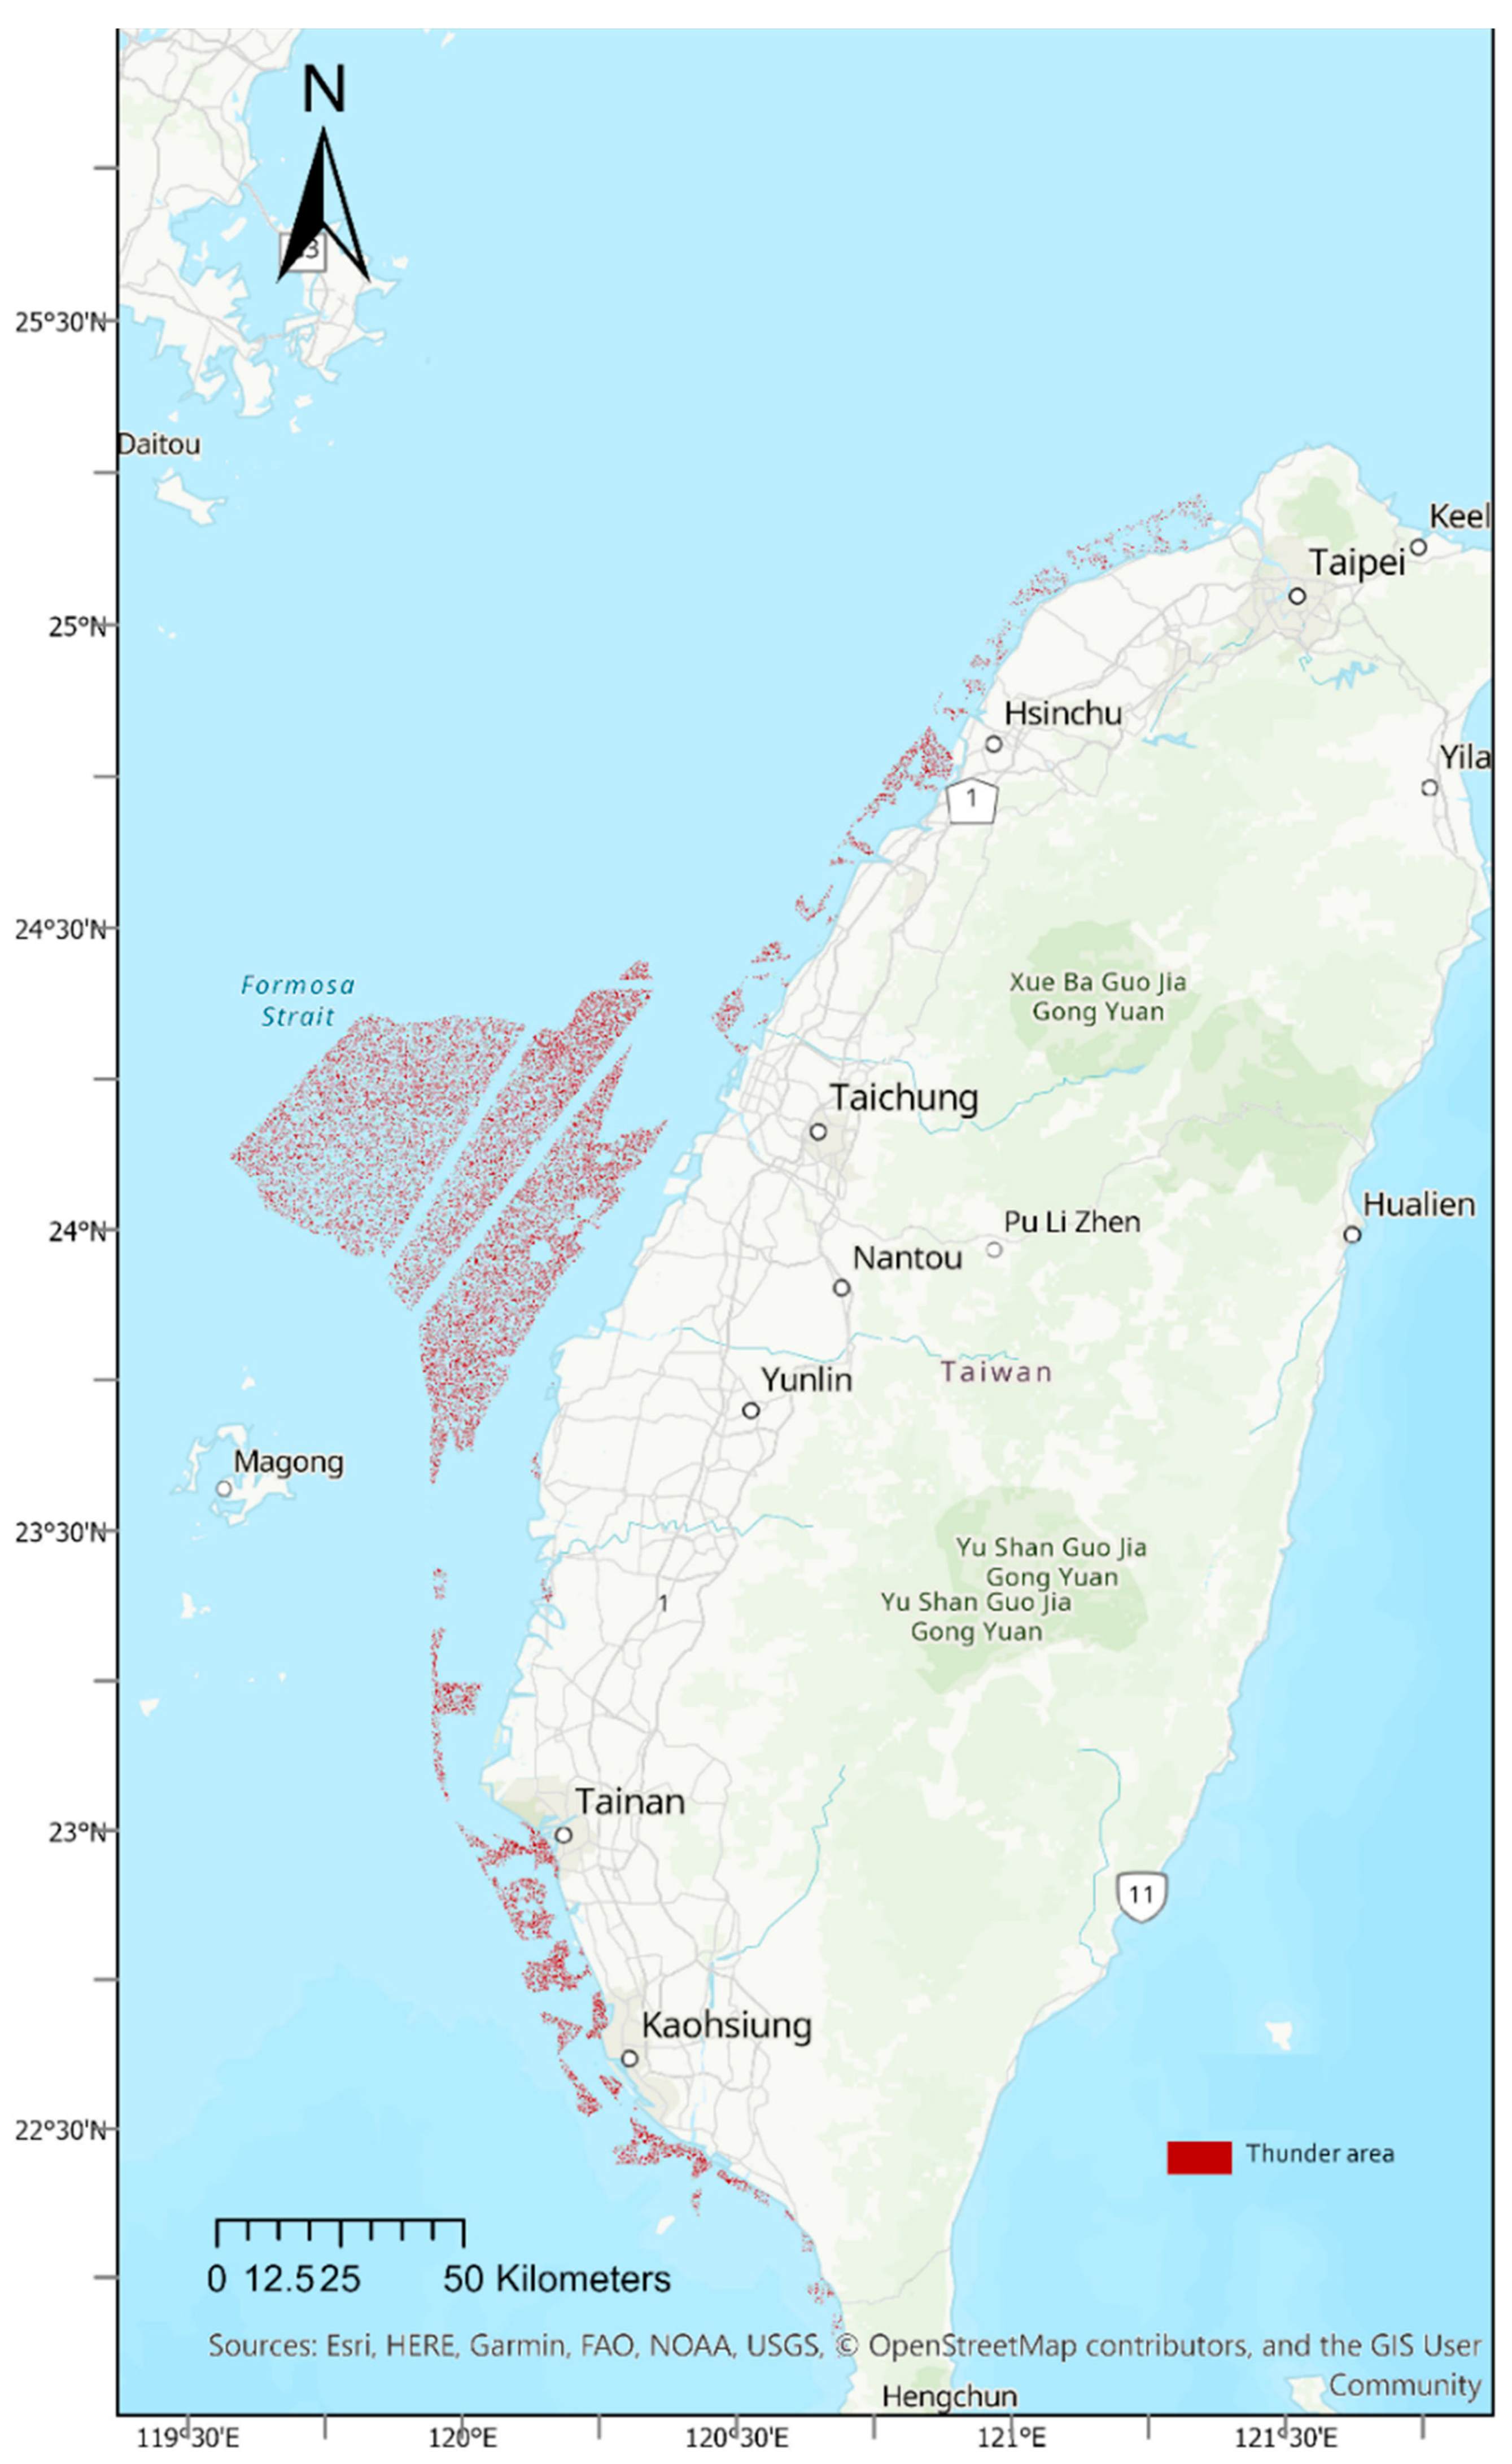
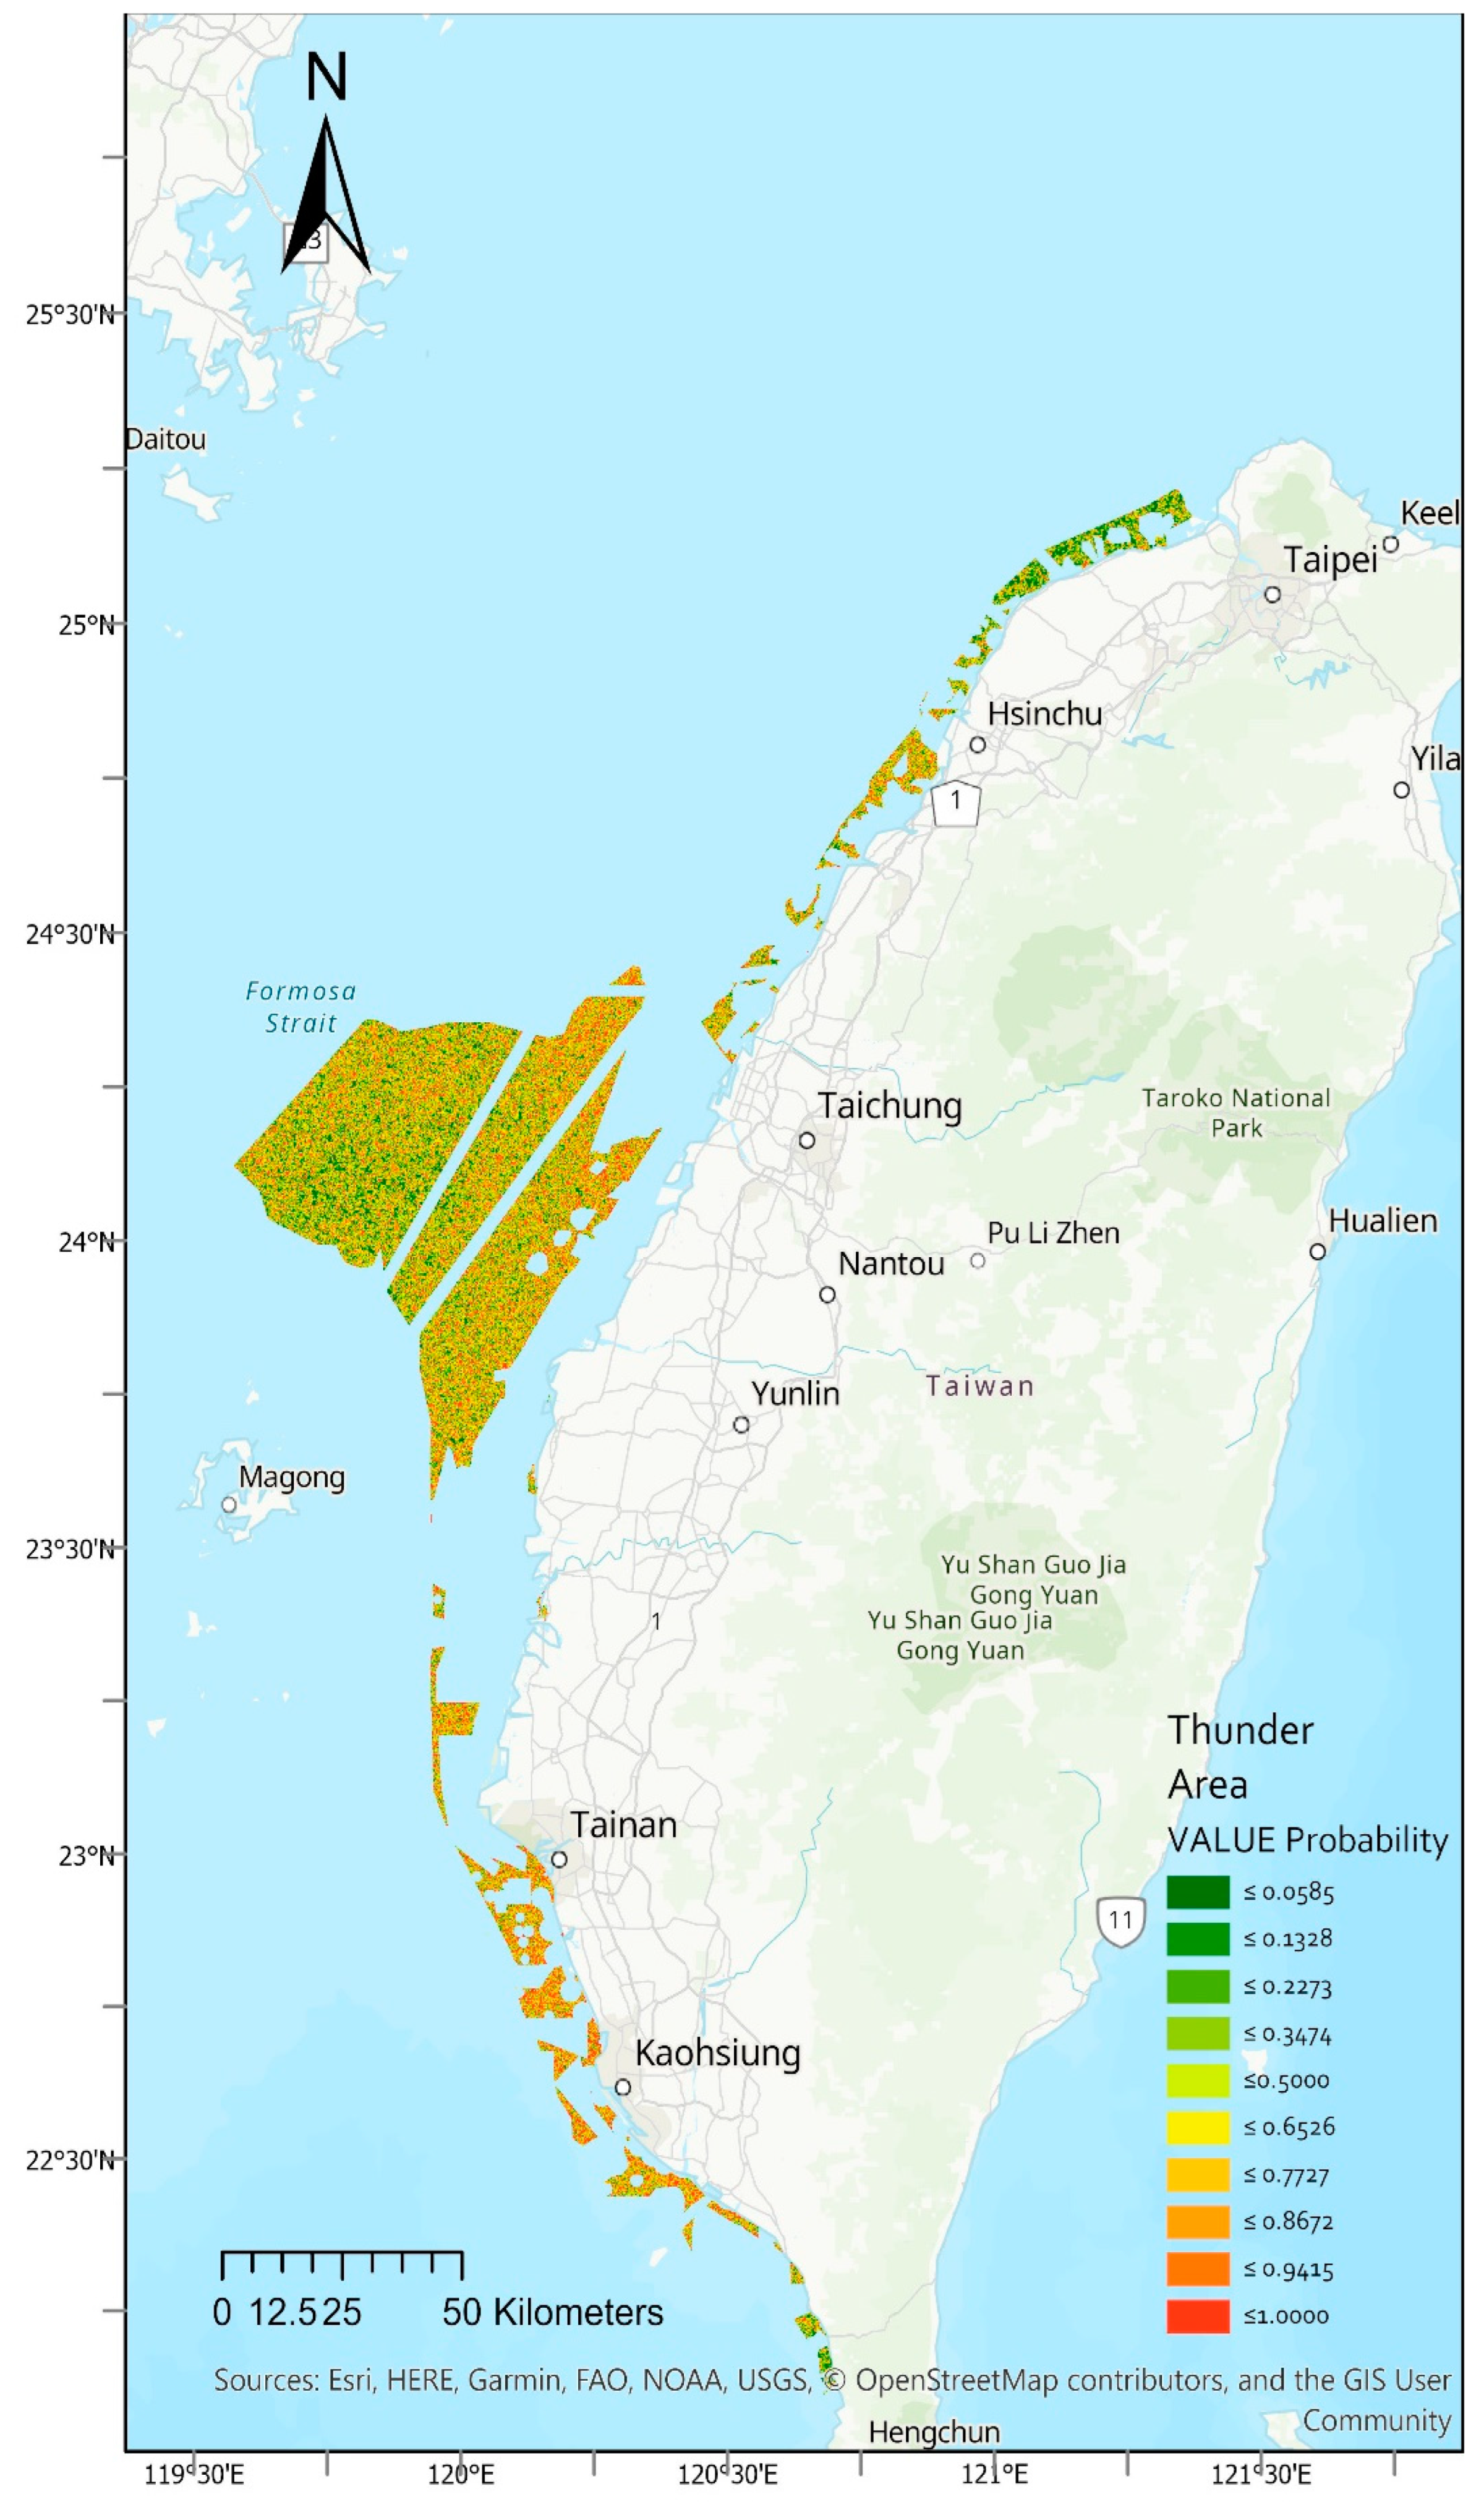
For this study, lightning strike data are interpolated into a grid based on the dissolve buffer results with a radius of 30 m. Figure 6 displays the number of lightning strikes’ distribution map. It is interpolated into a grid, and Figure 7 shows the probabilistic lightning strike areas, established according to the number of lightning strikes. There is no obvious concentrated distribution of lightning strikes in the entire study area.
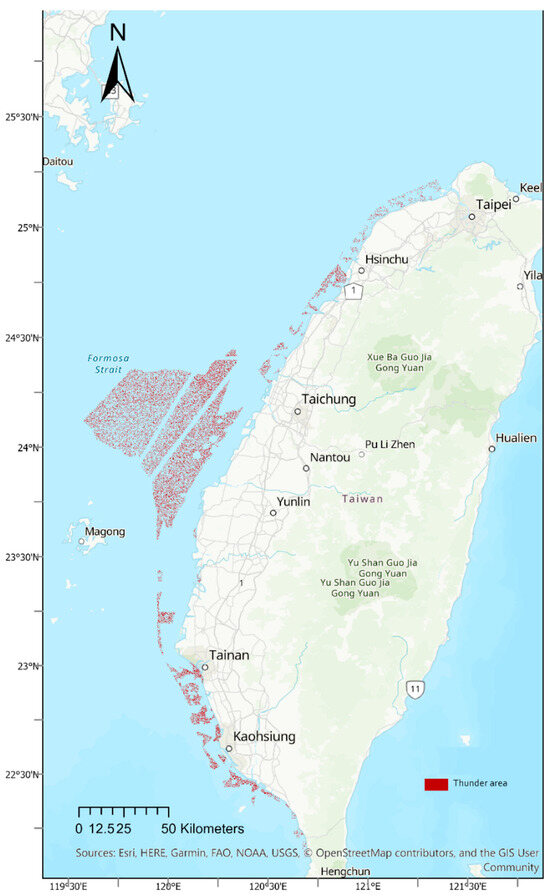
Figure 6.
Distribution of lightning strike points.
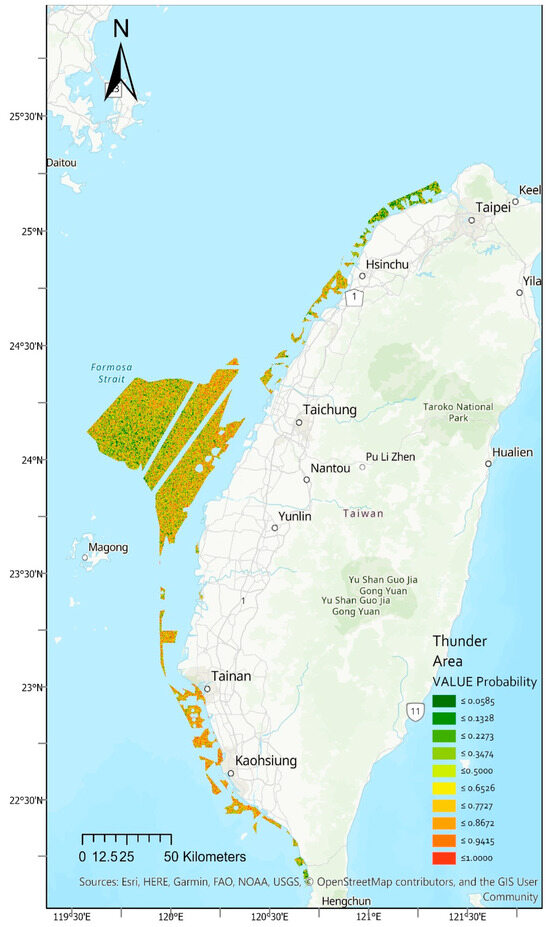
Figure 7.
Distribution of probabilistic lightning strikes.
4.1.5. Natural Disaster Risk Assessment Model for Offshore Wind Turbines
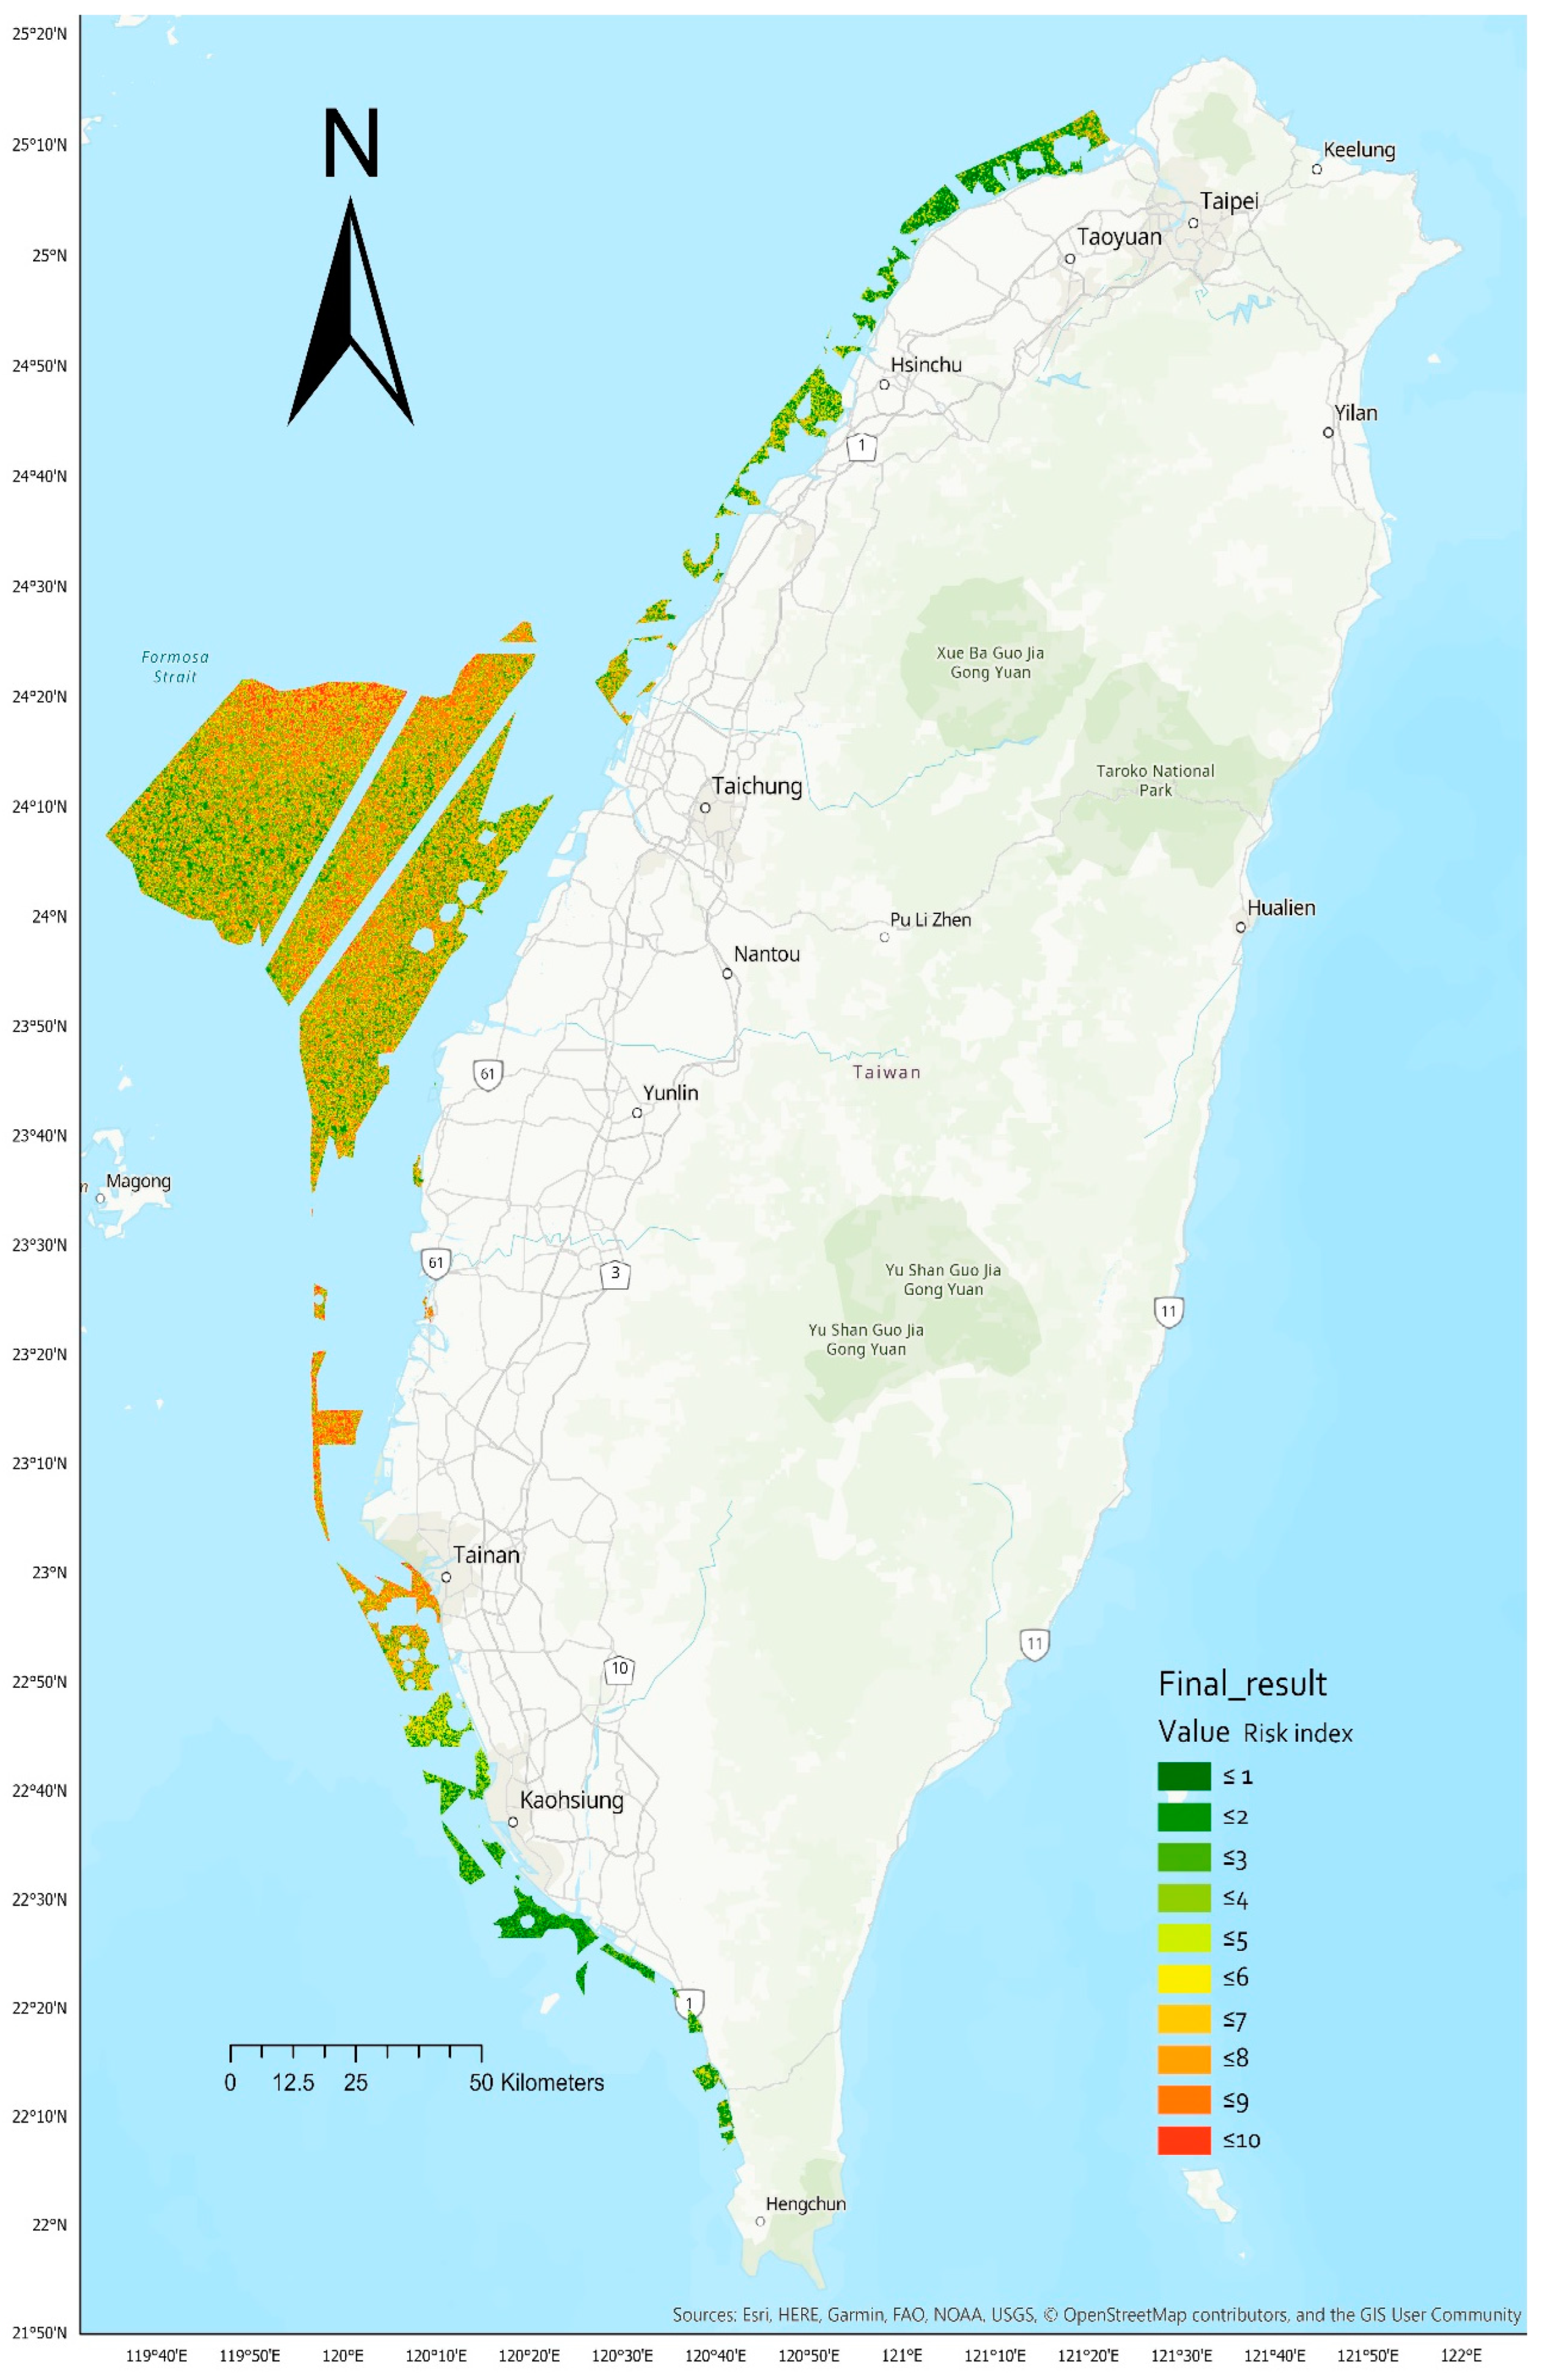
We now standardize the results presented in Figure 3, Figure 4 and Figure 5 and 7 for high wind speed frequency, large wave frequency, seismic acceleration, and probabilistic lightning strike area data, respectively. Using the weights affected by natural disasters shown in Table 7, we multiply these four datasets using the built-in Raster calculation function of ArcGIS Pro 3.2. Figure 8 presents the proposed natural disaster risk assessment model for offshore wind turbines, with 10 levels indicating the degree of safety, where 1 is the safest and 10 is the most dangerous. We note that the areas with low-risk indicators are located along the coasts of Hsinchu and Kaohsiung, while the outer waters of Taichung are relatively dangerous.

Figure 8.
Natural disaster risk assessment model for offshore wind power sites in the western waters of Taiwan.
This research establishes the spatial distribution of various natural disasters and analyzes the impact of natural disasters on wind turbine components. The natural disaster risk assessment model for offshore wind farms is based on standardized indicators, ranging from 1 to 10, to distinguish the risk index. This model provides a reference for the most suitable sites for offshore wind turbines. The results of the implementation process help prepare susceptibility maps and identify vulnerable and threatening areas. Estimating the probability of conditions occurring for any location and ensuring data accuracy are crucial to making the analysis results representative of the location of interest for assessing wind farm potential.
4.2. Effectiveness Evaluation
As previously mentioned, the critical factors for selecting wind power farms in Taiwan are wind energy strength and relevant constraints. Although natural disasters are not explicitly listed as constraints for selecting wind power farm locations, it is logical to consider that energy companies account for the influence of natural disasters on construction designs as safety factors. Therefore, we used the locations of current wind power farms as an indicator to verify the results of this study. However, it would be more reasonable to validate our results by comparing them with locations selected considering the influences of natural disasters or with the results of other risk assessment models in future studies.
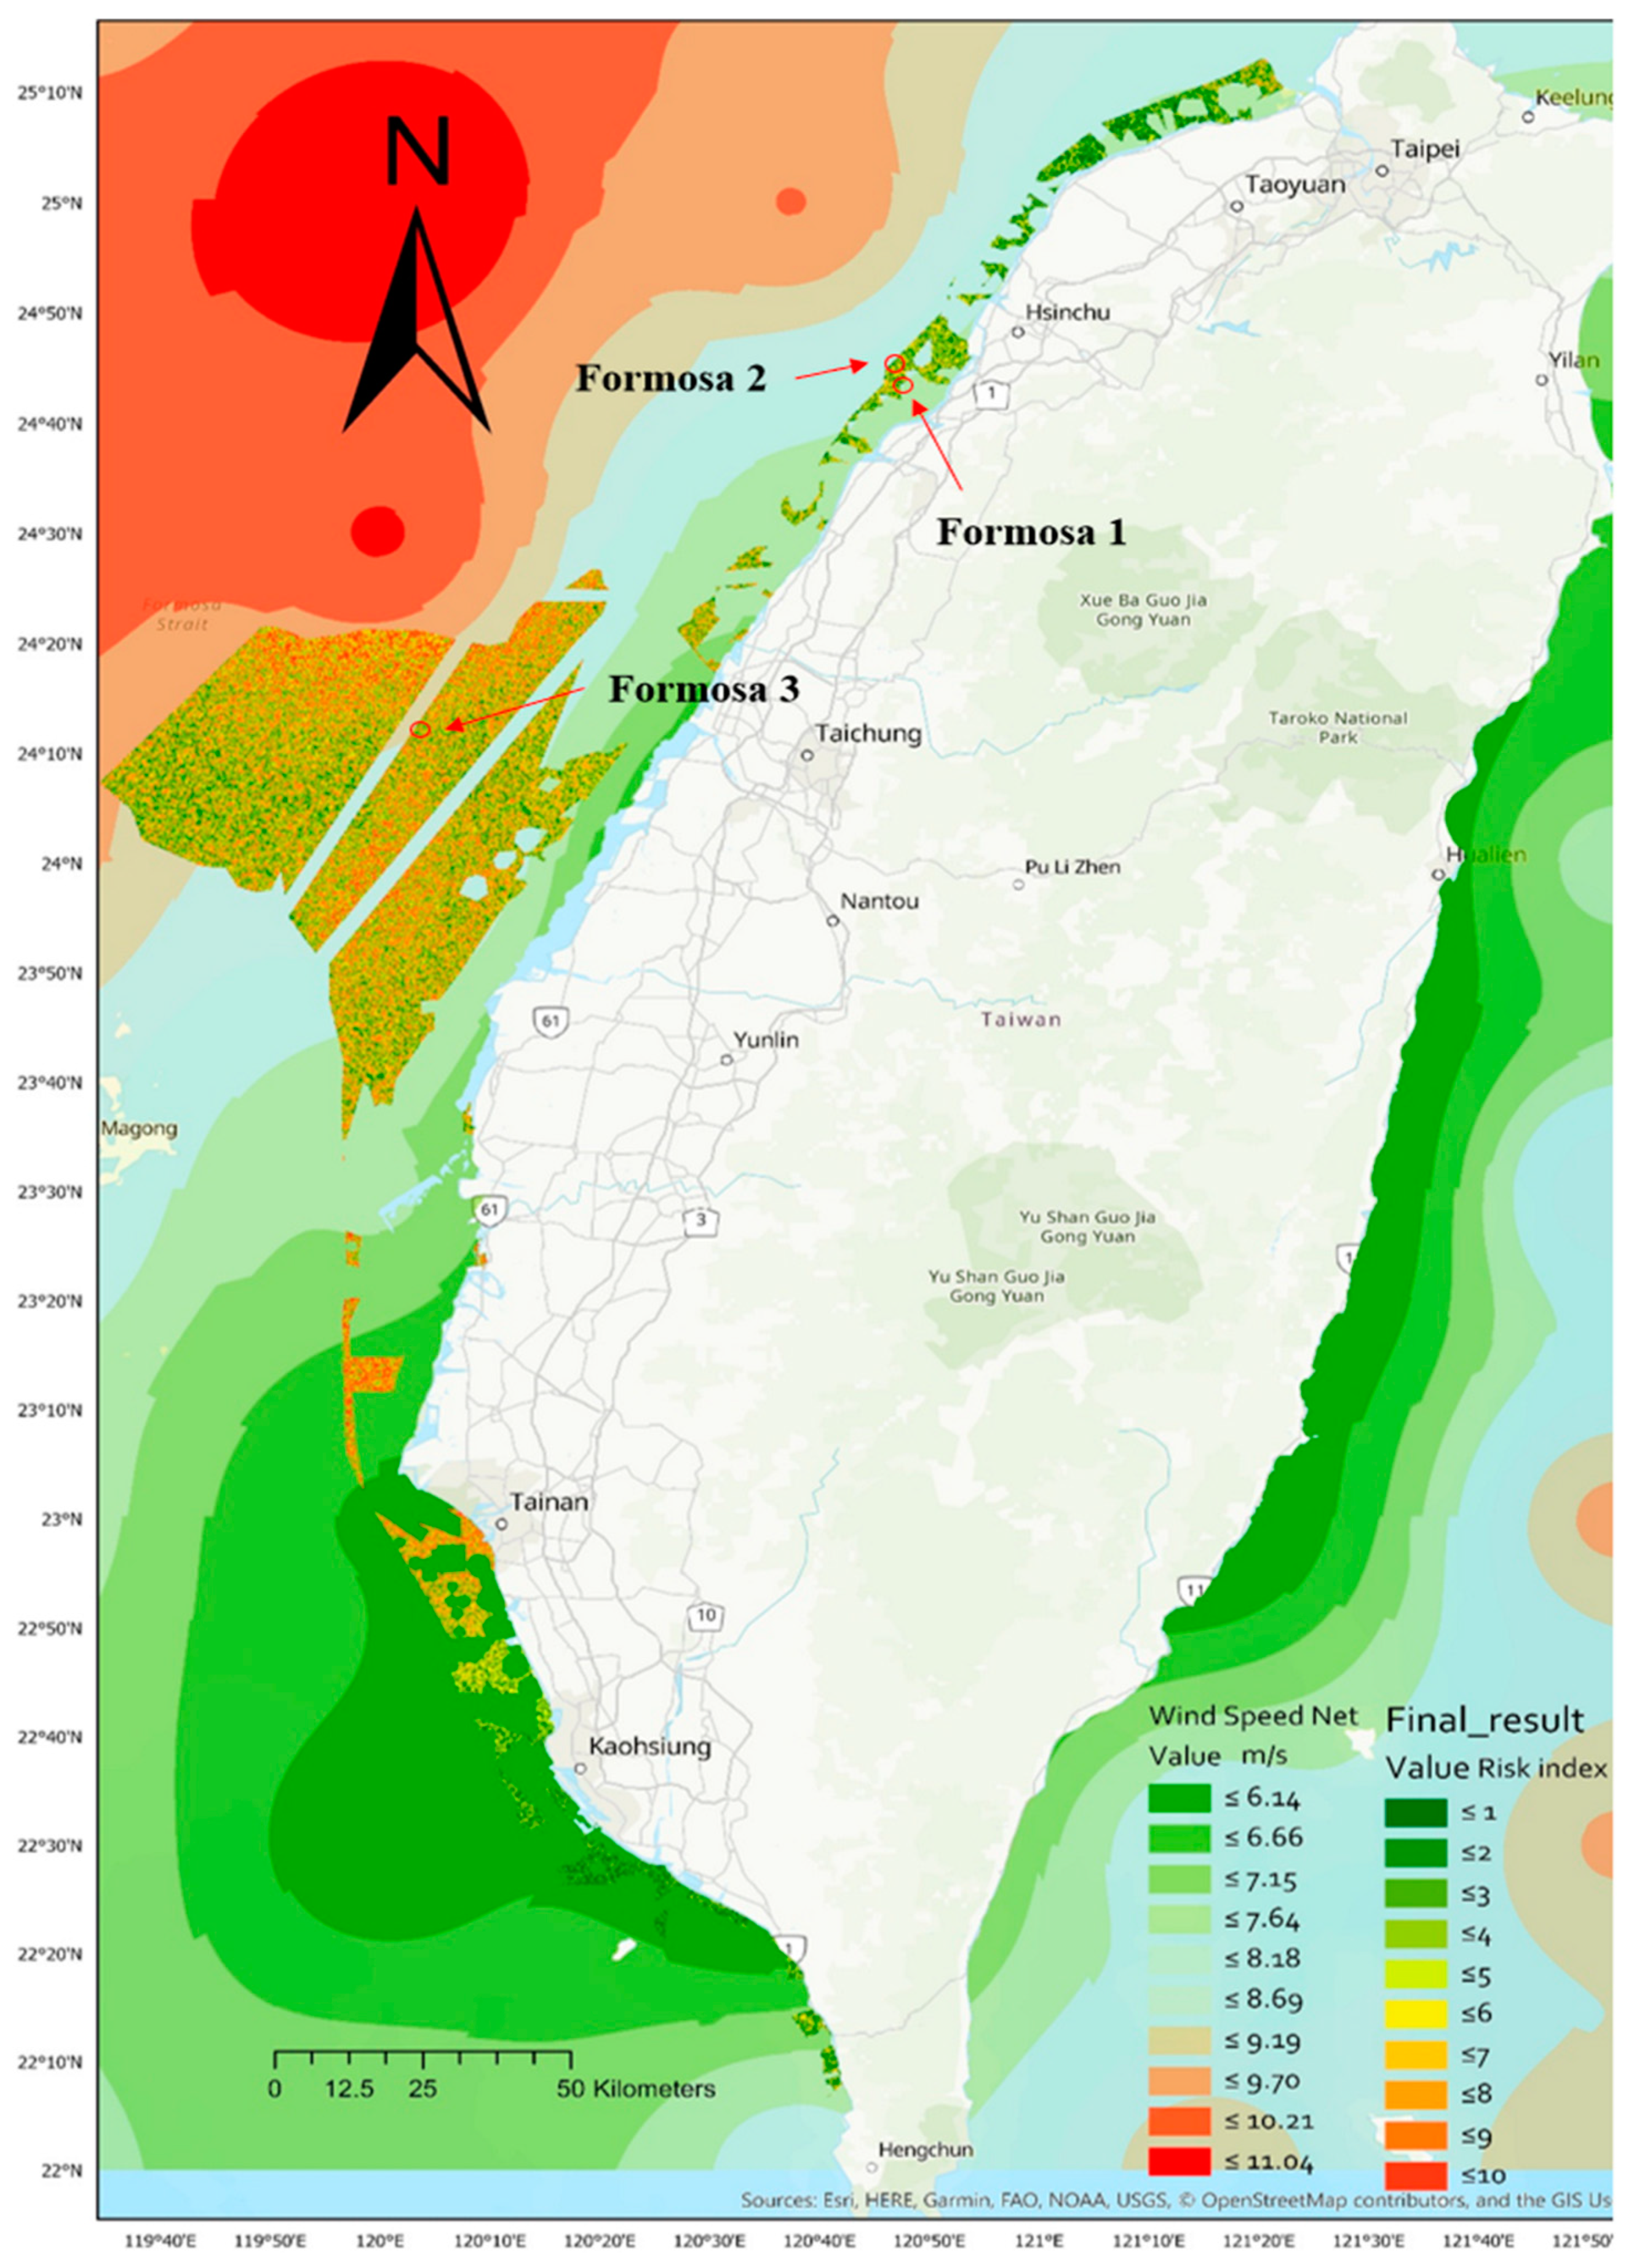
Figure 9 compares developed or planned offshore wind power generation in the western waters of Taiwan. The light-colored icons represent the distribution of wind speed, and the darker-colored icons represent risk assessment model indicators.

Figure 9.
Existing and developing offshore wind farms overlay with the proposed natural disaster risk assessment model.
We then overlay those offshore wind farms under development. Formosa 1 has been in commercial operation since 2019, is located in Zhunan, Miaoli County, and is about 2–6 km away from the land. Formosa 2 is a sea energy wind power plant, located about 4–10 km off the coast of Miaoli County, and is expected to start commercial operations in 2023. Formosa 3 is expected to start commercial operations in 2025 for Haiding Wind Power, which is located about 36–62 km off the coast of Changhua County. Formosa 4, located about 18–20 km off the coast of Miaoli County, is also expected to be commercialized in 2025. From the results of the overlay map, the sites of existing developed or under-developed wind farms are in areas with relatively low risk indicators and relatively high wind speeds.
5. Conclusions and Discussion
Given the objective of this research aims to develop a natural disaster risk assessment framework for offshore wind power site selection, FAHP is used to assess the degree of influence of five sub-assemblies by natural disasters through the results of questionnaires. FAHP estimates the impact coefficients and classifies the susceptibility of each of the mentioned factors, and ArcGIS Pro 3.2 data image processing is then employed to investigate the impacts of natural disasters on the wind turbines.
Based on the results of the image processing, the potential sites of wind turbines in the western seas of Taiwan are identified, and they are in line with the locations of four current offshore wind power farms. Therefore, this research framework of using FAHP and ArcGIS Pro 3.2 data image processing has the potential to act as a predictive tool to decide the locations of new offshore wind power farms. This capability enables decision makers and the energy companies to conduct the preliminary research and assessment to improve the efficiency and effectiveness for selecting new locations of wind power farms with stronger wind energy and their impacts on environment.
Given the current method to contemplate wind power farms in Taiwan mainly considers the overall wind energy capacity in an area where wind turbines can be planted, our risk assessment model takes into account the impacts of natural disasters on selecting potential locations. For regulators, this model provides reference scales of risks from natural disasters to request energy companies to adjust their design to cope with the relevant risks. This model also enables energy companies to appropriately examine the design of wind turbines and sub-assemblies to withstand the loads over their lifetime.
One of the limitations of this research is the sparse metocean data in potential development areas that influence the quality of estimation. Inaccurate metocean data also make wind energy assessment and validation a challenging task. More accurate data with higher resolution and shorter time intervals might be able to improve the accuracy of FAHP results.
In addition to data accuracy, extending wind power farms outward to enlarge their size is inevitable to fulfil soaring demands for power. In this scenario, the turbines need to be installed at deeper depths; the severe environmental challenges are unavoidable. Therefore, the area influenced by minima natural disasters cannot meet the actual demands for power. The features and technical constraints of FOWT need to be considered to cope with large power demands in future research.
Since offshore wind energy is an emerging technology around the world, various improvements can be achieved by taking technical, economic and environmental factors into account.
This study helps sustainable energy resource development, planning, and management and provides further insights for the coastal regions of the East China Sea, Japan Sea, Philippine Sea, and parts of the South China Sea, which have adequate wind speeds. It is concluded that a risk-based maintenance approach has considerable potential for optimizing maintenance effort, and further development of such models is recommended.
Author Contributions
Conceptualization, F.-S.N. and K.-C.P.; Methodology, F.-S.N., K.-C.P. and T.-C.C.; Validation, T.-C.C.; Formal analysis, F.-S.N., K.-C.P. and T.-C.C.; Investigation, F.-S.N. and W.-J.L.; Data curation, F.-S.N., W.-J.L. and T.-C.C.; Writing—original draft, W.-J.L.; Writing—review & editing, F.-S.N. and K.-C.P. All authors have read and agreed to the published version of the manuscript.
Funding
The authors gratefully acknowledge partial support from the National Science and Technology Council in Taiwan under the grant NSTC 112-2627-M-004-001: Building a Sociotechnical Substructure for Taiwan’s Energy Just Transition: A Transdisciplinary Research for Local Energy Democracy.
Data Availability Statement
The original contributions presented in the study are included in the article, further inquiries can be directed to the corresponding author.
Acknowledgments
We thank FSN and TCC for their contributions.
Conflicts of Interest
The authors declare no conflict of interest.
References
- Wieczorek, A.J.; Negro, S.O.; Harmsen, R.; Heimeriks, G.J.; Luo, L.; Hekkert, M.P. A review of the European offshore wind innovation system. Renew. Sustain. Energy Rev. 2013, 26, 294–306. [Google Scholar] [CrossRef]
- Tsai, M.H.; Chan, H.Y.; Chan, Y.L.; Shen, H.K.; Lin, P.Y.; Hsu, C.W. A Chatbot System to Support Mine Safety Procedures during Natural Disasters. Sustainability 2021, 13, 654. [Google Scholar] [CrossRef]
- Pacheco, A.; Gorbeña, E.; Sequeira, C.; Jerez, S. An evaluation of offshore wind power production by floatable systems: A case study from SW Portugal. Energy 2017, 131, 239–250. [Google Scholar] [CrossRef]
- Maandal, G.L.D.; Tamayao-Kieke, M.A.M.; Danao, L.A.M. Techno-Economic Assessment of Offshore Wind Energy in the Philippines. J. Mar. Sci. Eng. 2021, 9, 758. [Google Scholar] [CrossRef]
- Chaouachi, A.; Covrig, C.F.; Ardelean, M. Multi-criteria selection of offshore wind farms: Case study for the Baltic States. Energy Policy 2017, 103, 179–192. [Google Scholar] [CrossRef]
- Florian, M.; Sørensen, J.D. Risk-based planning of operation and maintenance for offshore wind farms. Energy Procedia 2017, 137, 261–272. [Google Scholar] [CrossRef]
- Leung, D.Y.; Yang, Y. Wind energy development and its environmental impact: A review. Renew. Sustain. Energy Rev. 2012, 16, 1031–1039. [Google Scholar] [CrossRef]
- Machmood, K.; Shevtshenko, E. Analysis of machine production processes by risk assessment approach. J. Mach. Eng. 2015, 15, 112–124. [Google Scholar]
- Sørensen, J.D. Framework for risk-based planning of operation and maintenance for offshore wind turbines. Wind Energy Int. J. Prog. Appl. Wind Power Convers. Technol. 2009, 12, 493–506. [Google Scholar] [CrossRef]
- Ahmed, F.; Kilic, K. Fuzzy Analytic Hierarchy Process: A performance analysis of various algorithms. Fuzzy Sets Syst. 2014, 362, 110–128. [Google Scholar] [CrossRef]
- Şener, E.; Şener, Ş.; Davraz, A. Groundwater potential mapping by combining fuzzy-analytic hierarchy process and GIS in Beyşehir Lake Basin, Turkey. Arab. J. Geosci. 2018, 11, 187. [Google Scholar] [CrossRef]
- Taheri, A.H. Landslide Susceptibility Mapping for Shirin-darreh Dam’s Reservoir using Fuzzy Analytical Hierarchy Process and GIS. Geotech. Geol. 2021, 17, 495–505. [Google Scholar]
- Murmu, P.; Kumar, M.; Lal, D.; Sonker, I.; Singh, S.K. Delineation of groundwater potential zones using geospatial techniques and analytical hierarchy process in Dumka district, Jharkhand, India. Groundw. Sustain. Dev. 2019, 9, 100239. [Google Scholar] [CrossRef]
- Rahaman, M.H.; Sajjad, H.; Masroor, M.; Bhuyan, N.; Rehman, S. Delineating groundwater potential zones using geospatial techniques and fuzzy analytical hierarchy process (FAHP) ensemble in the data-scarce region: Evidence from the lower Thoubal river watershed of Manipur, India. Arab. J. Geosci. 2022, 15, 677. [Google Scholar] [CrossRef]
- Githinji, T.W.; Dindi, E.W.; Kuria, Z.N.; Olago, D.O. Application of analytical hierarchy process and integrated fuzzy-analytical hierarchy process for mapping potential groundwater recharge zone using GIS in the arid areas of Ewaso Ng’iro–Lagh Dera Basin, Kenya. HydroResearch 2022, 5, 22–34. [Google Scholar] [CrossRef]
- Tavner, P.; Edwards, C.; Brinkman, A.; Spinato, F. Influence of wind speed on wind turbine reliability. Wind Eng. 2006, 30, 55–72. [Google Scholar] [CrossRef]
- Chen, X.; Li, C.; Xu, J. Failure investigation on a coastal wind farm damaged by super typhoon: A forensic engineering study. J. Wind Eng. Ind. Aerodyn. 2015, 147, 132–142. [Google Scholar] [CrossRef]
- Li, Z.Q.; Chen, S.J.; Ma, H.; Feng, T. Design defect of wind turbine operating in typhoon activity zone. Eng. Fail. Anal. 2013, 27, 165–172. [Google Scholar] [CrossRef]
- Xie, K.; Jiang, Z.; Li, W. Effect of wind speed on wind turbine power converter reliability. IEEE Trans. Energy Convers. 2012, 27, 96–104. [Google Scholar] [CrossRef]
- Zhang, Z.; Li, J.; Zhuge, P. Failure analysis of large-scale wind power structure under simulated typhoon. Math. Probl. Eng. 2014, 2014, 486524. [Google Scholar] [CrossRef]
- Chan, C.H.; Wang, Y.; Wang, Y.J.; Lee, Y.T. Seismic-hazard assessment over time: Modeling earthquakes in Taiwan. Bull. Seismol. Soc. Am. 2017, 107, 2342–2352. [Google Scholar] [CrossRef]
- Chan, C.H.; Ma, K.F.; Lee, Y.T.; Wang, Y.J. Rethinking seismic source model of probabilistic hazard assessment in Taiwan after the 2018 Hualien, Taiwan, earthquake sequence. Seismol. Res. Lett. 2019, 90, 88–96. [Google Scholar] [CrossRef]
- Kaynia, A.M. Seismic considerations in design of offshore wind turbines. Soil Dyn. Earthq. Eng. 2019, 124, 399–407. [Google Scholar] [CrossRef]
- Sun, C. Mitigation of offshore wind turbine responses under wind and wave loading: Considering soil effects and damage. Struct. Control Health Monit. 2018, 25, e2117. [Google Scholar] [CrossRef]
- Sun, C.; Jahangiri, V. Fatigue damage mitigation of offshore wind turbines under real wind and wave conditions. Eng. Struct. 2019, 178, 472–483. [Google Scholar] [CrossRef]
- Li, H.; Hu, Z.; Wang, J.; Meng, X. Short-term fatigue analysis for tower base of a spar-type wind turbine under stochastic wind-wave loads. Int. J. Nav. Archit. Ocean Eng. 2018, 10, 9–20. [Google Scholar] [CrossRef]
- Hu, Y.; Yang, J.; Baniotopoulos, C.; Wang, X.; Deng, X. Dynamic analysis of offshore steel wind turbine towers subjected to wind, wave and current loading during construction. Ocean Eng. 2020, 216, 108084. [Google Scholar] [CrossRef]
- Garolera, A.C.; Madsen, S.F.; Nissim, M.; Myers, J.D.; Holboell, J. Lightning damage to wind turbine blades from wind farms in the US. IEEE Trans. Power Deliv. 2014, 31, 1043–1049. [Google Scholar] [CrossRef]
- Becerra, M.; Long, M.; Schulz, W.; Thottappillil, R. On the estimation of the lightning incidence to offshore wind farms. Electr. Power Syst. Res. 2018, 157, 211–226. [Google Scholar] [CrossRef]
- Holthuijsen, L.H.; Powell, M.D.; Pietrzak, J.D. Wind and waves in extreme hurricanes. J. Geophys. Res. Ocean. 2007, 117. [Google Scholar] [CrossRef]
- Cheng, C.-T.; Hsieh, P.-S.; Lin, P.-S.; Yen, Y.-T.; Chan, C.-H. Probability seismic hazard mapping of Taiwan. In Encyclopedia of Earthquake Engineering; Beer, M., Kougioumtzoglou, I.A., Patelli, E., Au, I.S.-K., Eds.; Springer: Berlin, Germany, 2015. [Google Scholar]
- Lu, X.; McElroy, M.B.; Nielsen, C.P.; Chen, X.; Huang, J. Optimal integration of offshore wind power for a steadier, environmentally friendlier, supply of electricity in China. Energy Policy 2013, 62, 131–138. [Google Scholar] [CrossRef]
- Saaty, T.L. How to make a decision: The analytic hierarchy process. Eur. J. Oper. Res. 1990, 48, 9–26. [Google Scholar] [CrossRef]
- Saaty, T.L. Fundamentals of Decision Making and Priority Theory with the Analytic Hierarchy Process; RWS Publications: Pittsburgh, PA, USA, 1994. [Google Scholar]
- Halder, S.; Roy, M.B.; Roy, P.K. Fuzzy logic algorithm based analytic hierarchy process for delineation of groundwater potential zones in complex topography. Arab. J. Geosci. 2020, 13, 574. [Google Scholar] [CrossRef]
- Mohamed, M.M.; Elmahdy, S.I. Fuzzy logic and multi-criteria methods for groundwater potentiality mapping at Al Fo’ah area, the United Arab Emirates (UAE): An integrated approach. Geocarto Int. 2017, 32, 1120–1138. [Google Scholar] [CrossRef]
- Mukherjee, I.; Singh, U.K. Delineation of groundwater potential zones in a drought-prone semi-arid region of east India using GIS and analytical hierarchical process techniques. Catena 2020, 194, 104681. [Google Scholar] [CrossRef]
- Tan, R.R.; Aviso, K.B.; Huelgas, A.P.; Promentilla, M.A.B. Fuzzy AHP approach to selection problems in process engineering involving quantitative and qualitative aspects. Process Saf. Environ. Prot. 2014, 92, 467–475. [Google Scholar] [CrossRef]
- Shafiee, M.; Dinmohammadi, F. An FMEA-based risk assessment approach for wind turbine systems: A comparative study of onshore and offshore. Energies 2014, 7, 619–642. [Google Scholar] [CrossRef]
- Mishnaevsky, L., Jr.; Branner, K.; Petersen, H.N.; Beauson, J.; McGugan, M.; Sørensen, B.F. Materials for wind turbine blades: An overview. Materials 2017, 10, 1285. [Google Scholar] [CrossRef] [PubMed]
- Faulstich, S.; Hahn, B.; Tavner, P.J. Wind turbine downtime and its importance for offshore deployment. Wind Energy 2011, 14, 327–337. [Google Scholar] [CrossRef]
- Guo, H.; Watson, S.; Tavner, P.; Xiang, J. Reliability analysis for wind turbines with incomplete failure data collected from after the date of initial installation. Reliab. Eng. Syst. Saf. 2009, 94, 1057–1063. [Google Scholar] [CrossRef]
- Rinaldi, G.; Thies, P.R.; Walker, R.; Johanning, L. A decision support model to optimise the operation and maintenance strategies of an offshore renewable energy farm. Ocean Eng. 2017, 145, 250–262. [Google Scholar] [CrossRef]
- Scheu, M.N.; Kolios, A.; Fischer, T.; Brennan, F. Influence of statistical uncertainty of component reliability estimations on offshore wind farm availability. Reliab. Eng. Syst. Saf. 2017, 168, 28–39. [Google Scholar] [CrossRef]
- Gaushell, D.J.; Darlington, H.T. Supervisory control and data acquisition. Proc. IEEE 1987, 75, 1645–1658. [Google Scholar] [CrossRef]
- Chang, D.Y. Applications of the extent analysis method on fuzzy AHP. Eur. J. Oper. Res. 1996, 95, 649–655. [Google Scholar] [CrossRef]
- Tyagi, S. An improved fuzzy-AHP (IFAHP) approach to compare SECI modes. Int. J. Prod. Res. 2016, 54, 4520–4536. [Google Scholar] [CrossRef]


Disclaimer/Publisher’s Note: The statements, opinions and data contained in all publications are solely those of the individual author(s) and contributor(s) and not of MDPI and/or the editor(s). MDPI and/or the editor(s) disclaim responsibility for any injury to people or property resulting from any ideas, methods, instructions or products referred to in the content. |
© 2024 by the authors. Licensee MDPI, Basel, Switzerland. This article is an open access article distributed under the terms and conditions of the Creative Commons Attribution (CC BY) license (https://creativecommons.org/licenses/by/4.0/).