Article

A Fuzzy OLTC Controller: Applicability in the Transition Stage of the Energy System Transformation

Electrical Power Engineering Institute, Faculty of Electrical Engineering, Warsaw University of Technology, 00-662 Warsaw, Poland
*
Author to whom correspondence should be addressed.
Energies 2024, 17(11), 2716; https://doi.org/10.3390/en17112716
Submission received: 19 April 2024 / Revised: 21 May 2024 / Accepted: 25 May 2024 / Published: 3 June 2024
(This article belongs to the Section F3: Power Electronics)

Abstract

:
This paper introduces a Fuzzy Logic Controller designed for an on-load tap changer within medium voltage distribution systems with bulk penetration of Distributed Energy Resources. As the on-load tap changer remains one of the most essential forms of voltage regulation in medium voltage distribution networks, improving its operation is a cost-effective response to the emerging voltage violations caused by intermittent generation during the early stages of the energy system transformation. Software-in-the-loop simulations were conducted to validate the effectiveness of the proposed algorithm compared to the conventional methods. A modified CIGRE Medium Voltage Distribution Network Benchmark in European Configuration was modelled while the controller code developed in Python 3.12 was running on a PC, both coupled in a real-time closed-loop environment. The analyses showed that the proposed algorithm managed to reduce overvoltage from 7.02% to 4.85% in the benchmark network, thus demonstrating that the algorithm is efficient and ready for on-field implementation.

1. Introduction

The ongoing transformation in the energy system has a crucial impact on the characteristics of modern power systems. It seems that the most significant objective of these changes is to maximize the utilization of renewable energy resources to mitigate the harmful impact of fossil fuel consumption. Among the most popular renewable energy resources are photovoltaic and wind sources, which are considered as intermittent resources. Moreover, they are often directly connected to medium voltage (MV) distribution networks, partly due to their relatively small capacities compared to conventional power plants. This transforms traditional passive distribution networks into Active Distribution Networks (ADNs) [1].
These changes, coupled with the ever-increasing demand for electrical energy, position distribution networks under substantial pressure, which encompasses both the technical and the economic challenges faced by the Distribution System Operators (DSOs) in the process of supplying electrical energy, while meeting strict standards for its parameters.
Voltage regulation has been found to be the essential issue. The bidirectional power flow caused by the distributed generation changed the paradigm that the voltage level decreases along the feeder. Based on this assumption, regulation algorithms were developed and are still functioning in many distribution systems worldwide to this day. Unfortunately, they prove to be insufficient under these new conditions and despite their operation voltage deviations that exceed the permissible ranges occur [2,3], which is unacceptable because such deviations are hazardous for people and power system equipment. Furthermore, MV distribution networks are predominantly rather extensive, still work in a radial configuration, and have often lacked investment, which further complicates this issue.
Therefore, it is necessary to find new methods or to modify existing ones, which will allow to eliminate this problem. It is worth noting that the practical effectiveness of the proposed solution (i.e., the precision and efficiency of the voltage regulation) is not the sole criterion for evaluating its applicability. It is equally important to note the cost and ease of implementation.
There are many techniques that have been developed to manage voltage volatility in ADNs. They can be categorized in many ways. In Reference [4], they are divided into centralized and decentralized techniques; however, in Reference [5], they are divided into traditional and modern. Some of them operate independently, while others can only serve as a subsidiary to the primary method applied in a given network. Nonetheless, each of them has different advantages and disadvantages, and, above all, they require different resources for their practical implementation. Therefore, some may be effectively utilized in the early stages of the transformation of the energy system, while others may be more suitable for later stages, as they are considerably more intricate.
A simplified ADN feeder is shown in Figure 1. Applying Kirchoff’s voltage law yields the following:
V _   1 Δ V _   V _   2 = 0 ,
where V _   1 is the voltage at bus 1 [V], V _   2 is the voltage at bus 2 [V], and Δ V _ is the voltage drop [V].
The voltage drop Δ V _ across the line depends on its impedance Z _ [Ω] and the current I _ [A]:
Δ V _ = Z _ · I _   ,
I _ = S _ V _   1 * ,
where S is the apparent power [VA].
Expressing the current in the form of Equation (3) and combining Equations (2) and (3), the voltage drop becomes the following:
Δ V = S _ V _     1 * ·   R + j X = P V _     1 Q V _     1 ·   R + j X = P R + Q X V _     1 + j P X R Q V _     1   ,
where P is the active power [W], Q is the reactive power [Var], R is the resistance [Ω], and X is the reactance [Ω].
Since the X/R ratio in distribution networks is relatively small, the power angle is also small; therefore, the imaginary part of Equation (4) can be neglected. Returning to Equation (1), the voltage at bus 2 is equal to the following:
V _     2 = V _     1 P R + Q X V _   1   ,
The apparent power of the feeder mainly depends on the load power, as well as on the power generated by Distributed Energy Resources (DERs). Taking this into account, Equation (5) can be written as follows:
V _     2 = V _     1 P L P G R + Q L Q G X V _   1   ,
where P L is the load active power [W], P G is the generated active power [W], Q L is the load reactive power [Var], and Q G is the generated reactive power [Var].
Hence, the voltage value in the remote node of the network is influenced by the voltage at the feeding substation, the line parameters, and the load and generation power equilibrium at the given node. It is evident that an increase in the active power generation of the DERs leads to an elevation in voltage at bus 2. Consequently, if the voltage difference between the nodes becomes sufficiently large, there is a risk of overvoltage at bus 2. All voltage regulation methods involve changing one or more of the variables included in Equation (6).
The basic and conventional method of voltage regulation in distribution networks is based on influencing the voltage at the main bus of the feeder, i.e., V _   1 . This is accomplished through an on-load tap changer (OLTC). Changing the tap position of the transformer results in a change in its turns ratio and, consequently, the voltage on the MV bus. It is a cost-effective method, because most HV/MV transformers are equipped with an OLTC. Its disadvantages undoubtedly include a slow response time, including a lack of ability to regulate the voltage during transients, together with restricted tap changes each day due to the limited mechanical endurance of the OLTC [6].
Another method involves the active power curtailment of the DERs [7,8]. By decreasing P G , the overvoltage in the network connection point (NCP) is reduced. It is uncomplicated because it only requires a communication path between the DSO and the producers. However, it should only be used during an emergency and during critical overvoltage, because an active power curtailment entails financial losses for the producers.
Similarly, regulating the reactive power also affects voltages [9,10]. A promising example of a coordinated control method for the OLTC and PV inverters is shown in Reference [11]. However, the effects of reactive power regulation are less significant compared to active power curtailment, as the X/R ratio in distribution networks is relatively small. Reducing the power factor, with source apparent power constant, naturally results in a decrease in the generated active power, which again translates to losses for the producers. Moreover, constructing capacitor banks and shunt reactors deep in the network also introduces additional costs.
It is also possible to change the P L and Q L parameters. Implementing a demand side response (DSR) and demand side management (DSM) mechanisms enables the participation of active consumers in grid regulation [12,13]. Once again, it requires data exchange between a DSO and consumers. Furthermore, the consumers should be encouraged to cooperate through financial gratifications, for example.
Highly effective regulation methods are those using D-FACTS devices and energy storage [14,15]. They provide fast and accurate regulation. They are also suitable for coordination with control from an OLTC. However, D-FACTS devices or distribution scale energy storage are highly expensive. In order for them to be used on a whole network scale, a huge investment is needed.
A different approach is a network reconfiguration [16]. Changing the network topology alters power flows and, as a result, voltage levels. Clearly, it cannot be used in radial networks. It also requires wide area measurements in order to properly implement the control algorithms.
To illustrate the practical applicability of the above-mentioned methods, the Polish case is discussed. Most of the Polish MV distribution networks are radial. With the rapidly increasing number of DERs, especially PV and wind-based, voltage deviations arise. D-FACTS devices are practically non-existent. While there are increasingly more energy storage systems, they are mostly installed by consumers and serve the consumers’ purposes, which are mainly economical, thus contributing neither partially nor fully to voltage regulation. Therefore, a key voltage regulation method is control with an OLTC along with the dispatching of DERs. For the DERs connected to distribution networks, typically ranging from tens of kW to several MW, they usually operate with a unity power factor. In cases of overvoltage, their active power is just curtailed. For that reason, at the current stage of the Polish energy transformation, it is necessary to find solutions based on an OLTC control and active power curtailment, which are easy and inexpensive to implement in order to mitigate the voltage violations.
The rest of this paper is organized as follows. In Section 2, the control techniques of the OLTC are described. Section 3 presents the fuzzy control algorithm that was developed for the OLTC. The SIL testbed and experiments are described in Section 4, while the simulation results are set out in Section 5 and the conclusions are demonstrated in Section 6.

2. OLTC Control Methods
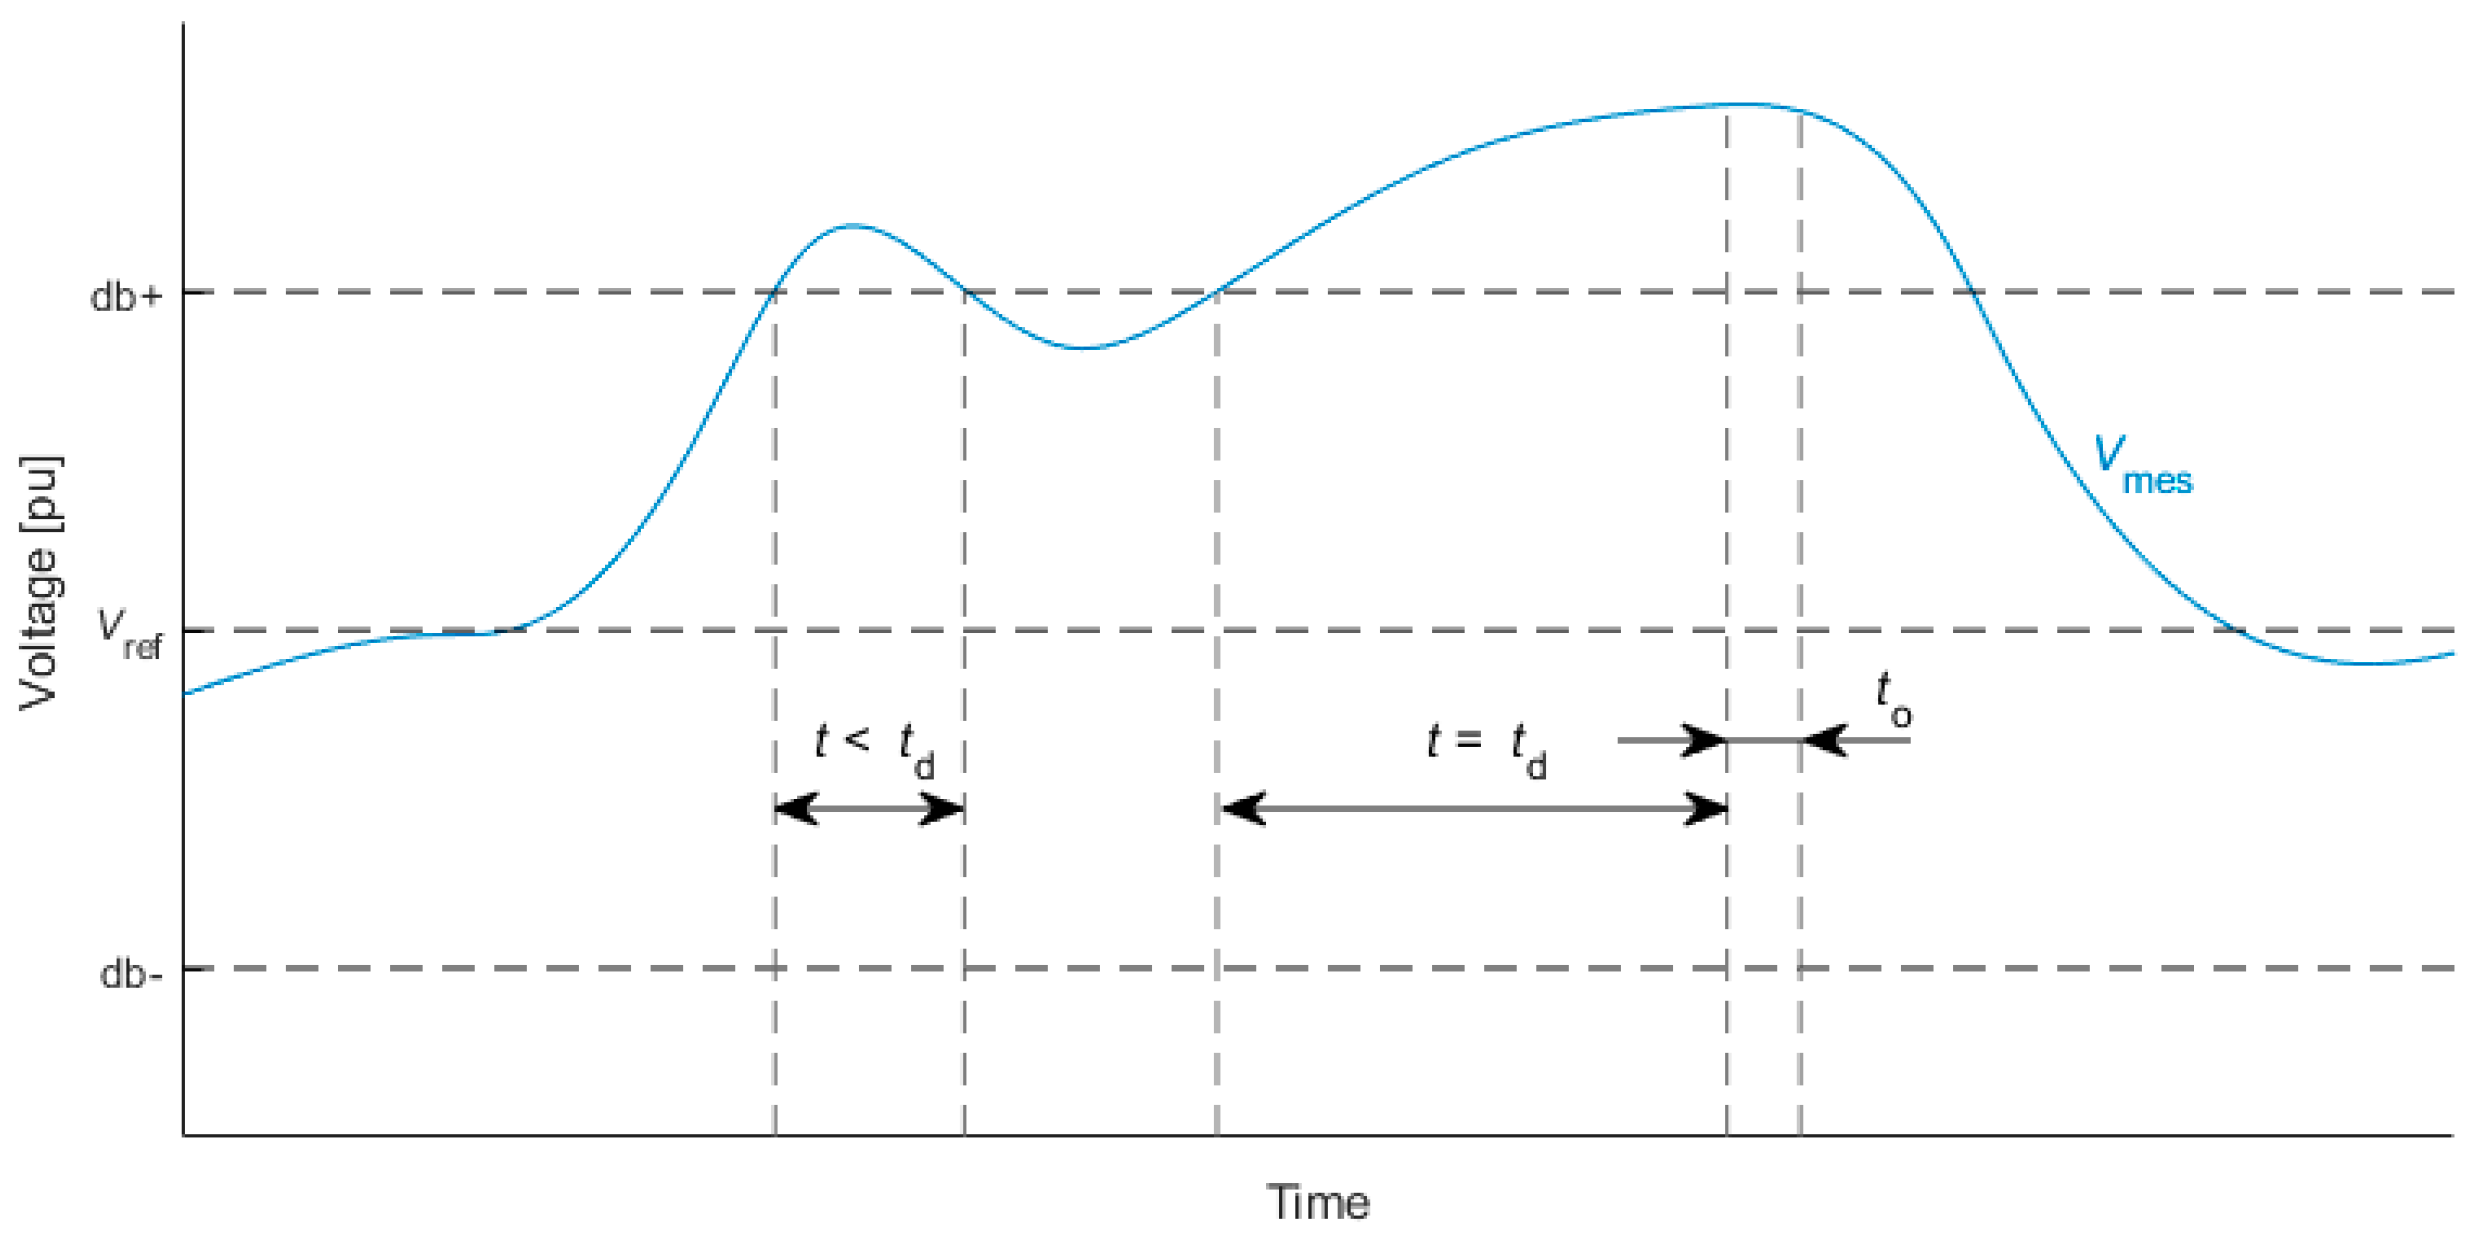
2.1. Basic Methods

A conventional OLTC control is called the Autonomous Tap Control (ATC). The governor consists of a hysteresis controller and a time-delay element. Figure 2 shows the idea behind an ATC. The measured voltage V M E S is compared with the reference voltage V R E F . If it exceeds the range of the deadband zone for longer than the set time delay t d (usually set to a few minutes), then a tap change signal is sent to the OLTC. The tap will be changed after the operational time t o (typically a few seconds). The deadband width must be greater than the voltage change caused by a unit change in the tap position. Due to hysteresis, the stability of the regulation during fluctuating voltage changes is ensured, while introducing a time delay helps to eliminate unnecessary tap changes, which might, for example, be caused by the connection or disconnection of a large load. Moreover, the proper selection of a time delay guarantees a limited number of tap changes per day. To achieve an acceptable lifespan of the OLTC and to reduce the maintenance costs, the number of tap changes is limited to 30–50 per day.
An important matter is the selection of the V M E S . In practice, it is predominantly a voltage on the MV side of the transformer. This is the easiest method, because it requires only a local measurement supplied by the secondary circuits of the substations. In the case of an ADN, this criterion is insufficient because the voltage value at the MV bus substation does not accurately reflect the voltage profiles in the network, due to the contribution of the DERs, according to Equation (6).
An extension of this method, which improves its effectiveness, is line drop compensation. In this case, V M E S is an estimated voltage at a node deep in the feeder. The estimation is calculated based on the local voltage measurement at the substation and the approximate voltage drop between the measurement and the selected node. The voltage drop is derived from line impedance and feeder current, according to Equation (2). However, considering the influence of DERs, such a method of calculating the voltage drop will be exposed to significant errors. Therefore, more accurate methods for estimating the voltage deep in the feeder have been developed, such as using current and voltage sensors or a power flow calculation [17,18].

2.2. Advanced Methods

In the literature, many examples of other types of OLTC control can be found. One of the popular ones involves a Fuzzy Logic Controller (FLC). In Reference [19], an FLC was presented where the input signals were the voltage error at the MV transformer side and the tap position. The outputs were the direction of the tap change and the time delay. The advantage of the algorithm was the limitation of daily tap changes compared to with an ATC. In Reference [20], there was a similar adapted FLC. However, in both cases, only local measurements available at the main substation were used and the analyses did not take into consideration the penetration of the DERs.
An FLC that utilized the voltage values at the remote nodes of the network was presented in Reference [21]. Based on these values, the maximum and minimum voltages were determined, which served as inputs to the fuzzy controller; its output was the reference voltage of the OLTC governor. The solution proved to be effective in maintaining the voltage within the allowed range in the ADN. Nevertheless, the studies did not consider a scenario where the measurements of all voltages in the network were not available. If among the missing measurements were the actual minimum or maximum voltages in the grid, then the algorithm might not function correctly and escalate the overvoltage or undervoltage.
A similar idea of dynamically calculating the reference voltage but without using an FLC appeared in Reference [22]. This method was an advanced algorithm that proved to alleviate voltage violations during offline simulations, real-time simulations, and field tests [23].
On the other hand, in Reference [24], a feeder-wide voltage control was presented. The method involved optimizing the tap position based on the load, forecasts of the generation of DERs, and the calculated load flow. The solution proved to be more effective compared to an ATC, reducing the daily tap changes while maintaining the voltage profiles within the allowed range. However, this approach is quite complex and therefore challenging to implement in practice, because it requires the use of data from all nodes for the power flow calculation and its effectiveness depends on the accuracy of the forecasts.
An engrossing case of an OLTC controller based on a game theory algorithm can be found in Reference [25]. The algorithm determined the tap changes based on the available strategies in a given situation. A measurement from one node was utilized. The research confirmed an improvement in the regulation conditions, including the accuracy, stability and velocity compared to an ATC. However, the studies assumed the connection of the DERs at only one node, and the stability of the method was not tested in more harsh conditions.
As mentioned before, it is also possible to improve the voltage regulation effects by coordinating the OLTC control with other elements in the grid, such as D-FACTS devices [26,27,28]. These solutions can greatly reduce the number of daily tap changes and effectively regulate rapid voltage violations, although it obviously involves the use of expensive devices.

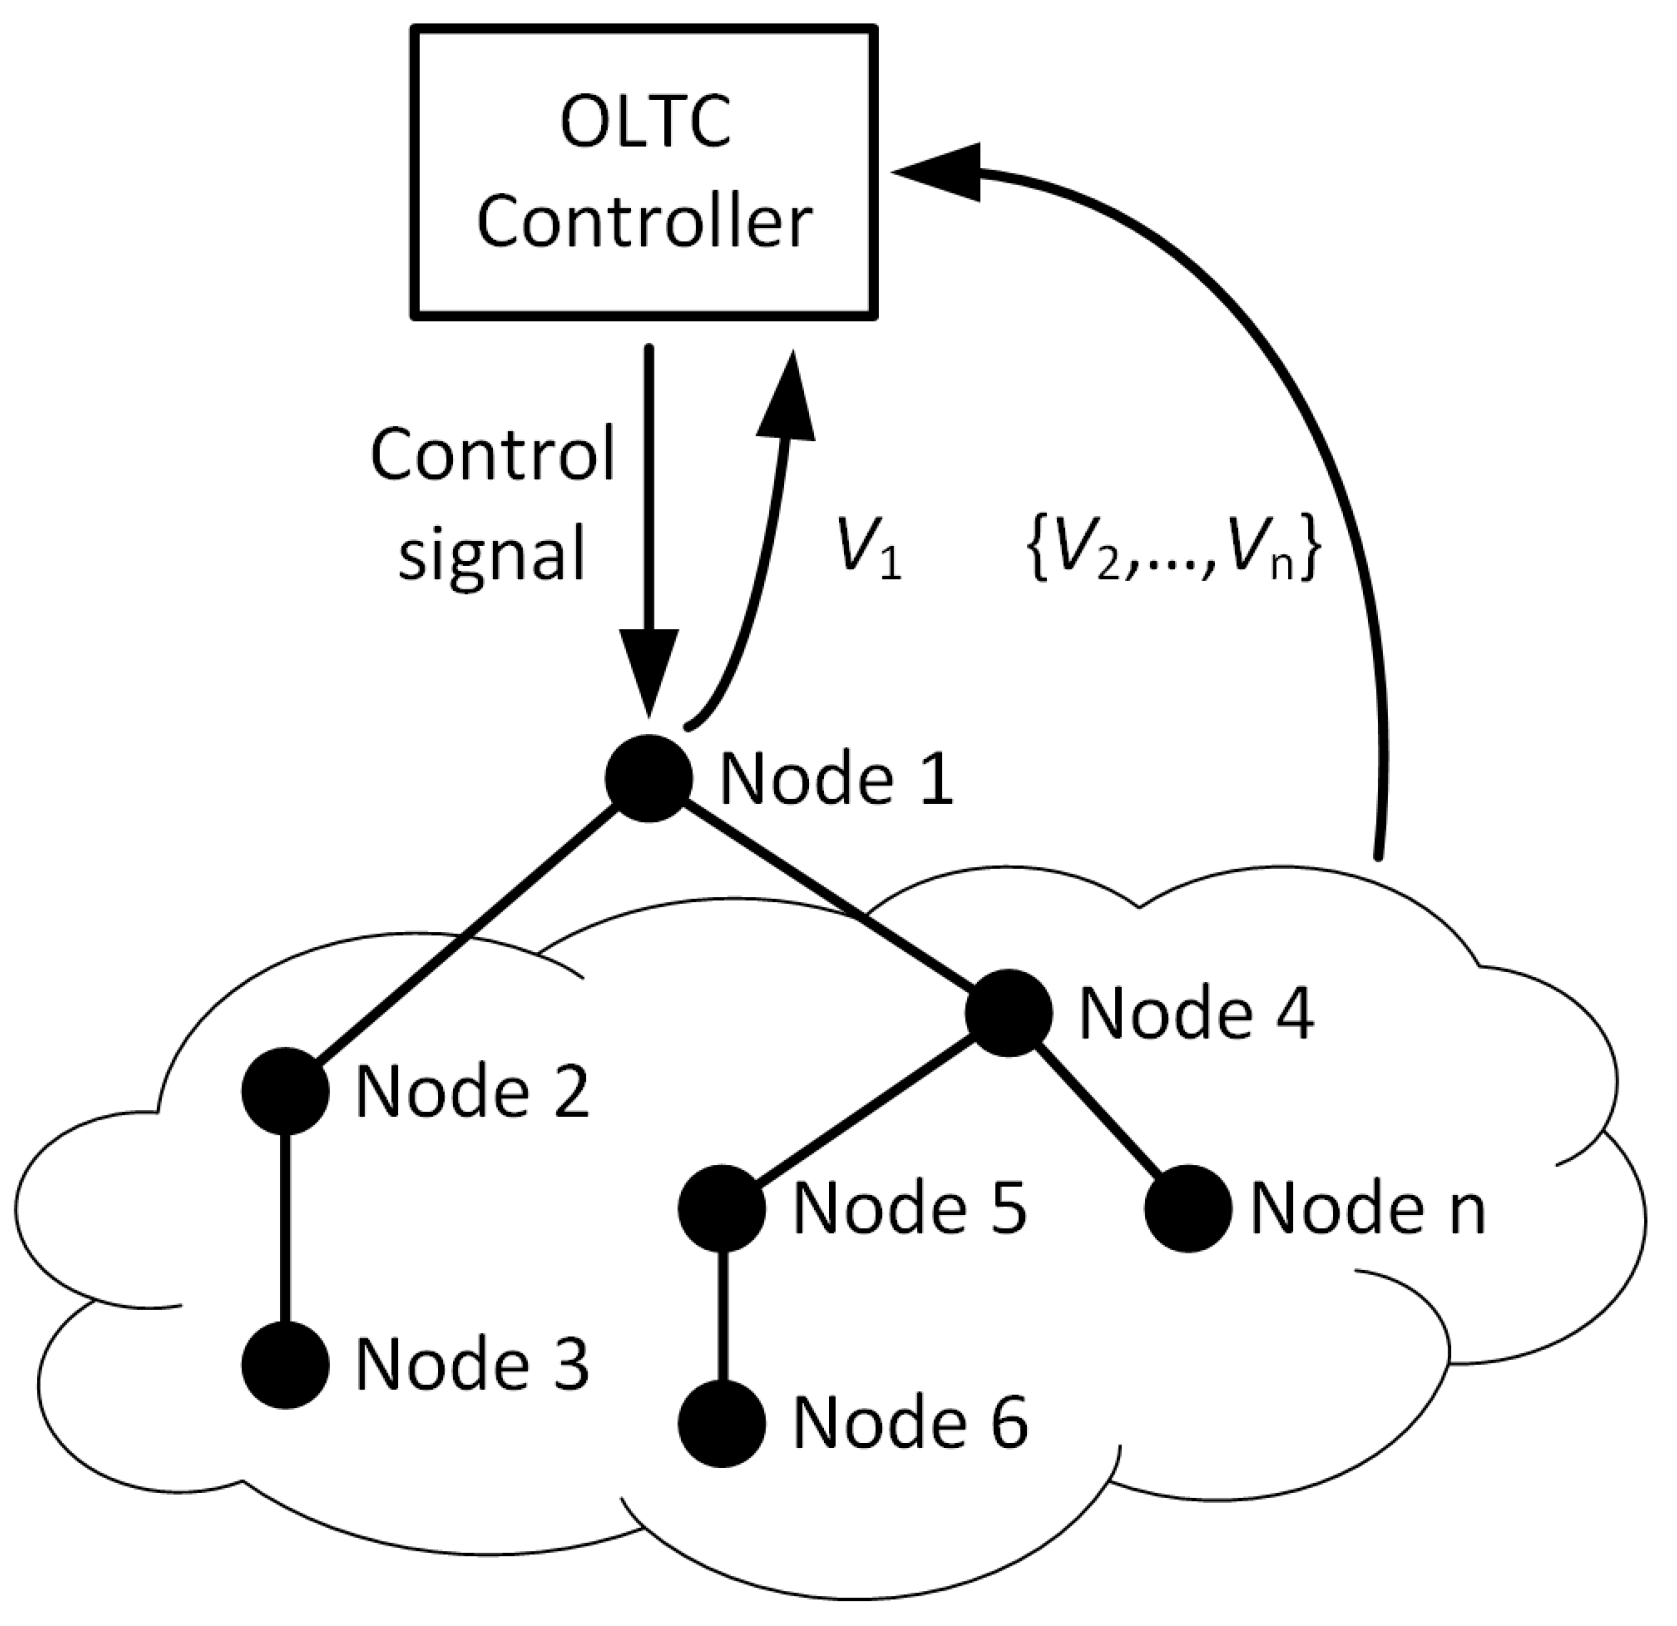
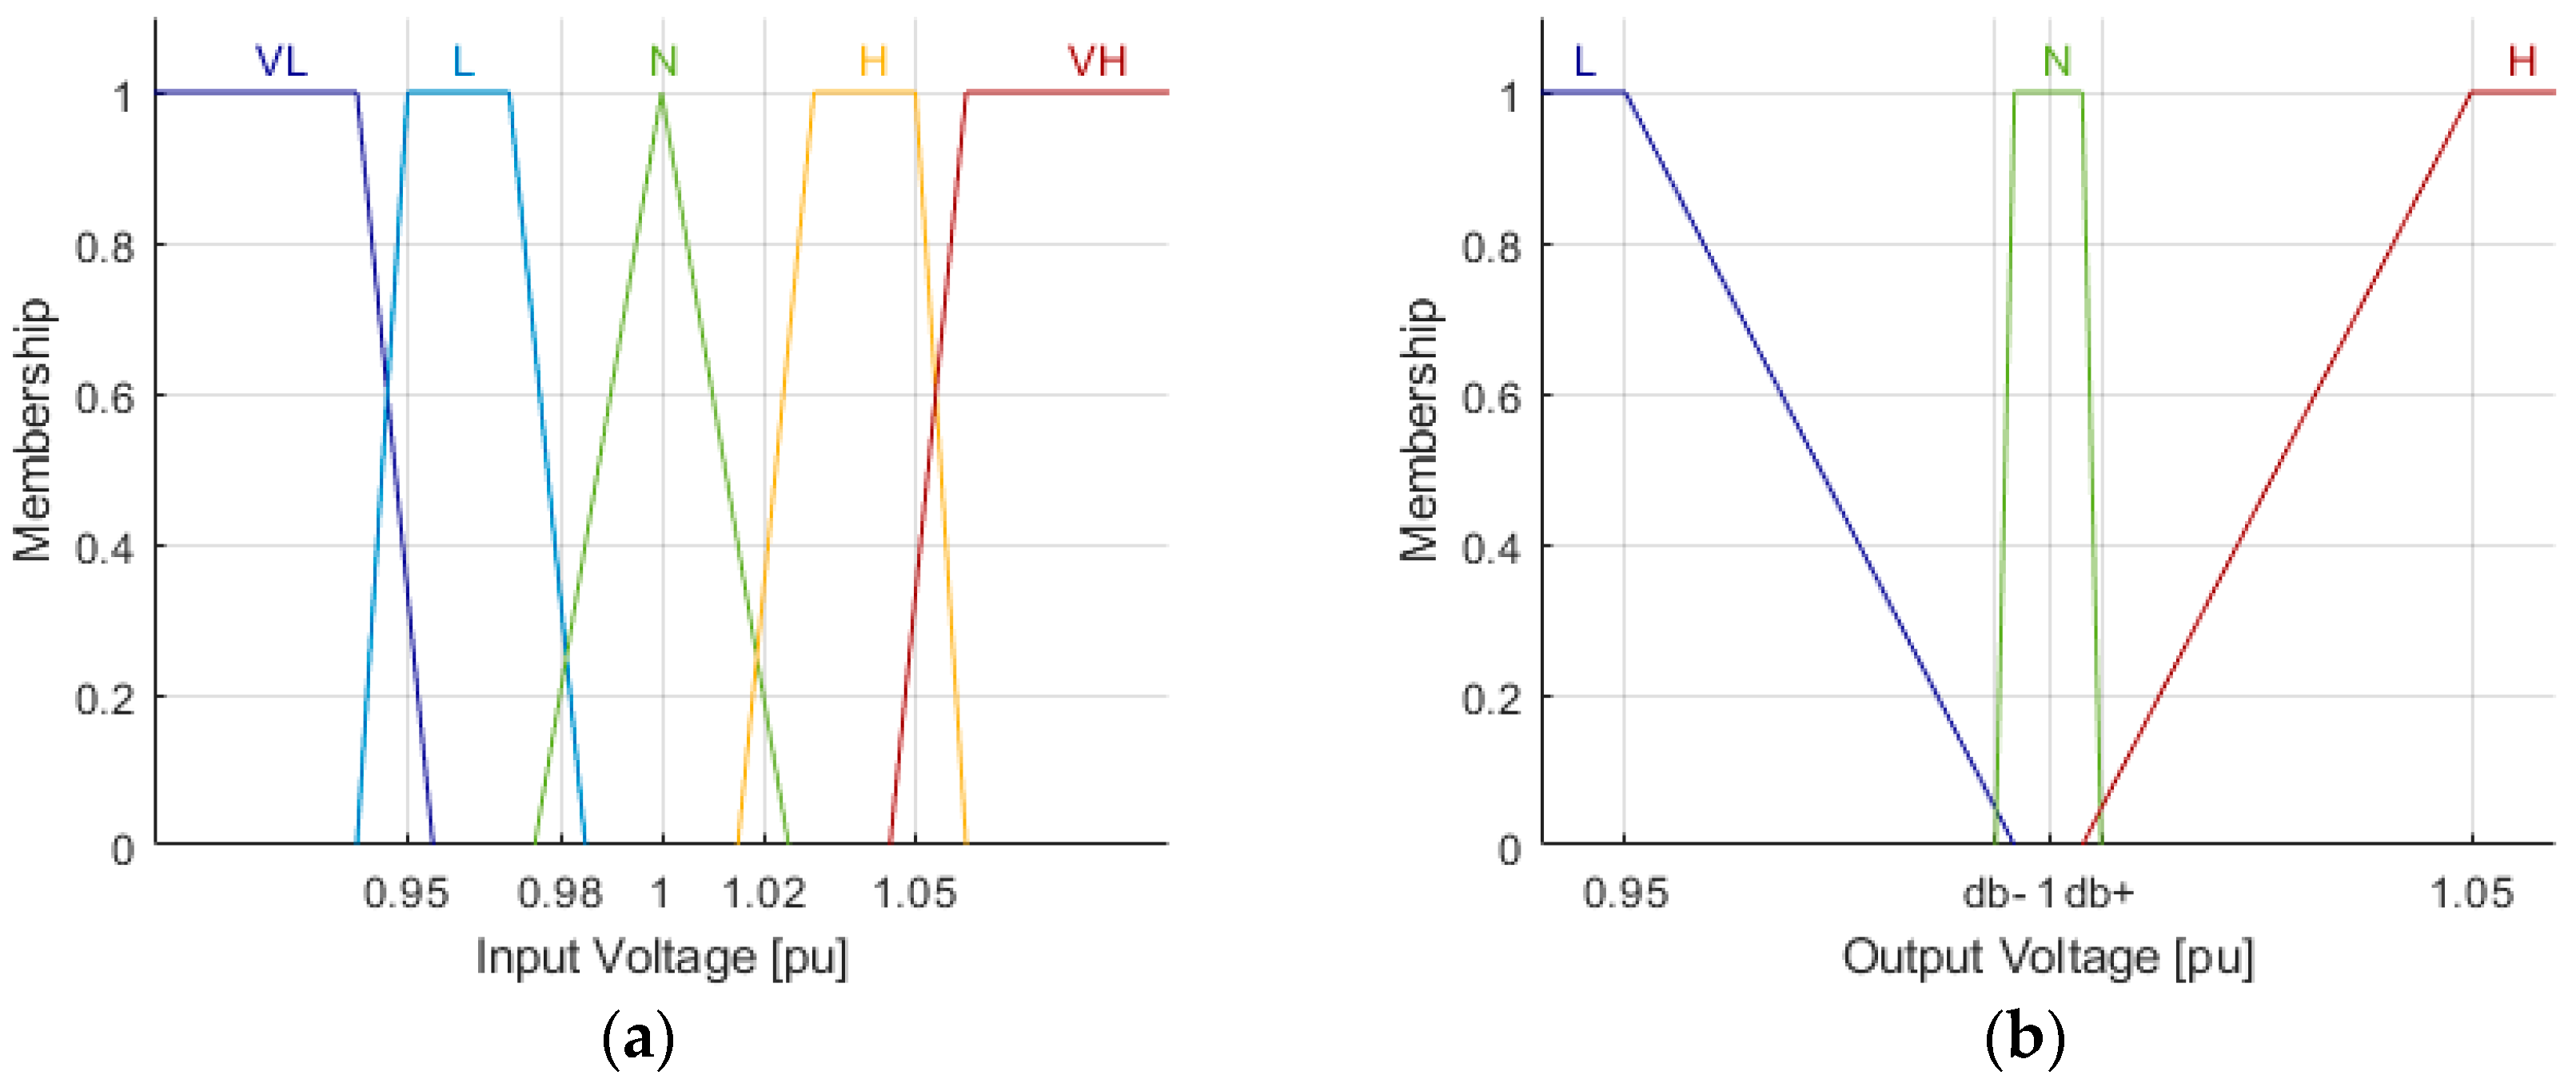
3. Proposed OLTC Controller Algorithm

Taking into account the simplicity of on-field implementation and the desired effectiveness of regulation, the proposed algorithm, based on an FLC, utilizes only local and remote voltage measurements. Figure 3 and Figure 4 illustrate its operating principle. The input voltage to the hysteresis controller is not the voltage measured on the MV side of the transformer, as in the case of a conventional ATC, but rather the output signal from the adaptive fuzzy synthesis element. This element feeds the hysteresis controller with the V M E S combined from the local and remote voltage measurements.
The set of remote measurements consists of voltages { V 2 , ,   V n } from nodes 2 to n , and the local measurement is V 1 . Values { V 1 , ,   V n } are the RMS values of the positive sequence voltage. Since the communication and the measuring devices are not perfect, it is necessary to verify the correctness of the received data to maintain the stability of the controller. If the data were incorrect or the measurements were corrupted, the algorithm could malfunction. Thus, a measurement verification element is essential. Accordingly, the sets { V 2 , ,   V n } and { V i , ,   V k } satisfy the following relationship:
i   2 k   n ,
The algorithm for the measurement verification will vary from the communication protocol used. The basic condition is that at least one measurement must be available from each feeder. For example, if one feeder is close to overvoltage and another to undervoltage and the measurement is not present from one of them, then the tap could be changed, improving the voltage in one and introducing a violation in the other. Moreover, the measured values should be within the range determined by the pick-up values of the undervoltage and overvoltage relays set in the given network, because if they exceed these limits, it is not the OLTC that should act but the protections that should trip.
The fuzzy synthesis is performed at a specified time step, which is equal to the interval of collecting data from the grid nodes. This time step will vary depending on the data exchange protocol used and the capabilities of the telecommunication network. Naturally, for the algorithm to be stable, the calculation interval must be shorter than the tap change time delay.
The measurements can be collected from the SCADA system, smart meters, μPMU, or any other source [29,30,31]. As the OLTC control process is characterized by quite long-time delays, the regime of the data retrieval speed is not very strict.

Adaptive Fuzzy Synthesis

In order to combine multiple voltage values into a single V M E S , fuzzy logic was applied. Fuzzy logic performs well when the input data can be incomplete or uncertain. It may also enhance the controller flexibility under conditions of fluctuating voltage changes caused by intermittency in the DERs.
The antecedents are the RMS values of the positive sequence voltage of the selected nodes from the given network. They are represented by five membership functions: “VL”, “L”, “N”, “H”, and ”VH”, which stands for “Very Low”, “Low”, “Nominal”, “High”, and “Very High”. The consequent membership function is depicted by three membership functions: “L”,”N”, and ”H”, which stand for “Low”, “Nominal”, and “High”. The boundaries of the membership functions depend on the width of the deadband zone of the hysteresis controller and the permissible limits in the given network. The membership functions shown in Figure 5 were tuned based on the parameters of the model described in Section 4. In Figure 5b, the “db−“ and “db+” ticks on the x axis correspond to the limits of the deadband zone of the hysteresis controller.
The fuzzy rules that are set will depend on the number of available input variables. This means that for each number of inputs, the rules are predefined and they may change with each step of the calculations. The rules set map the possible mutual relationship between the input variables and assign an output to its proper membership function. An example set of rules for three inputs case is presented in Table 1. If there is a cell in a row with a unity value, it means that the given variable can be in any state. For example, the first three rules can be understood as follows: “If any input is Very Low, then the output is Low”. It is worth paying attention to rules 10–15. They reflect a case in which one of the voltages is above the permissible value and the other is below. In this situation, changing the tap position would restore one of them to the permissible range but would also deepen the voltage deviation in the other node. Therefore, the tap position should not be changed. The same explanation applies as to why it is necessary to use at least one measurement from each feeder.

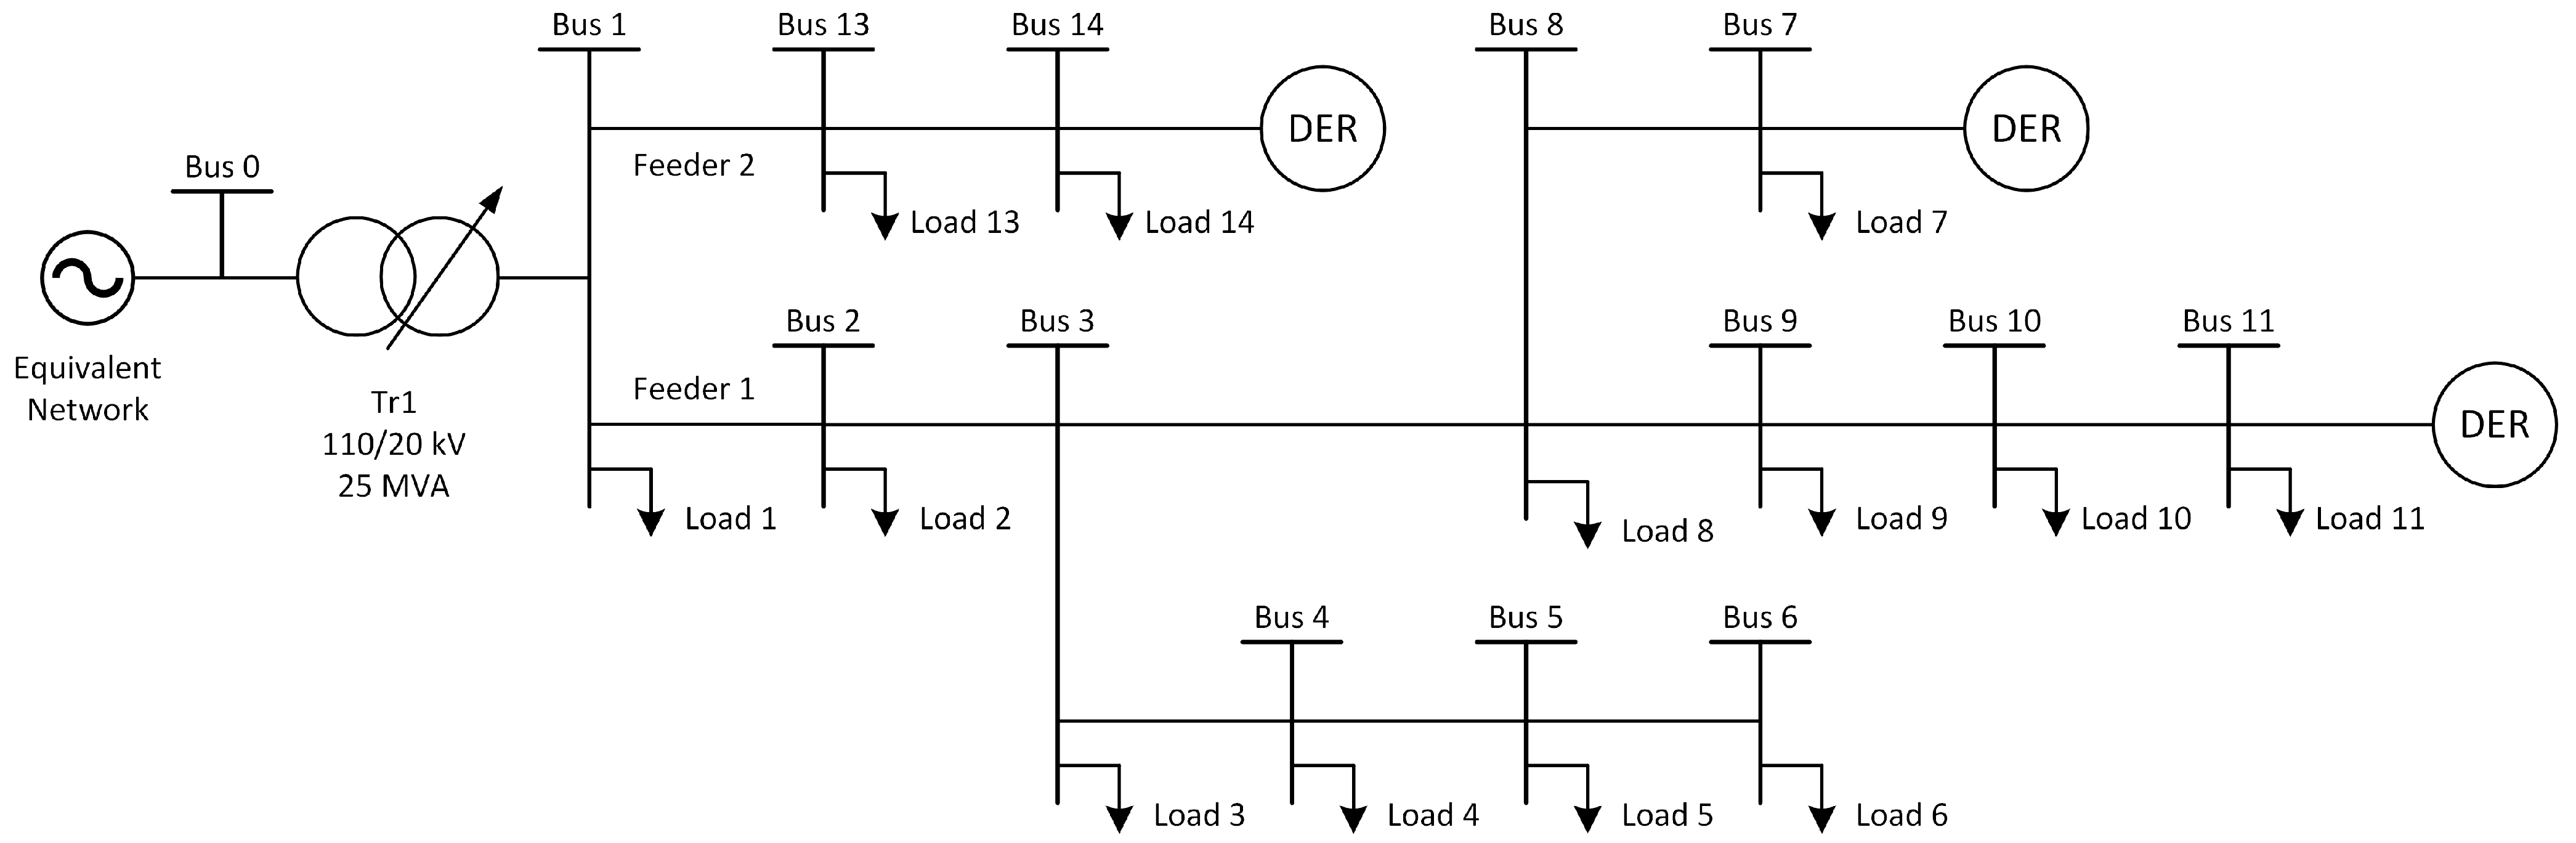
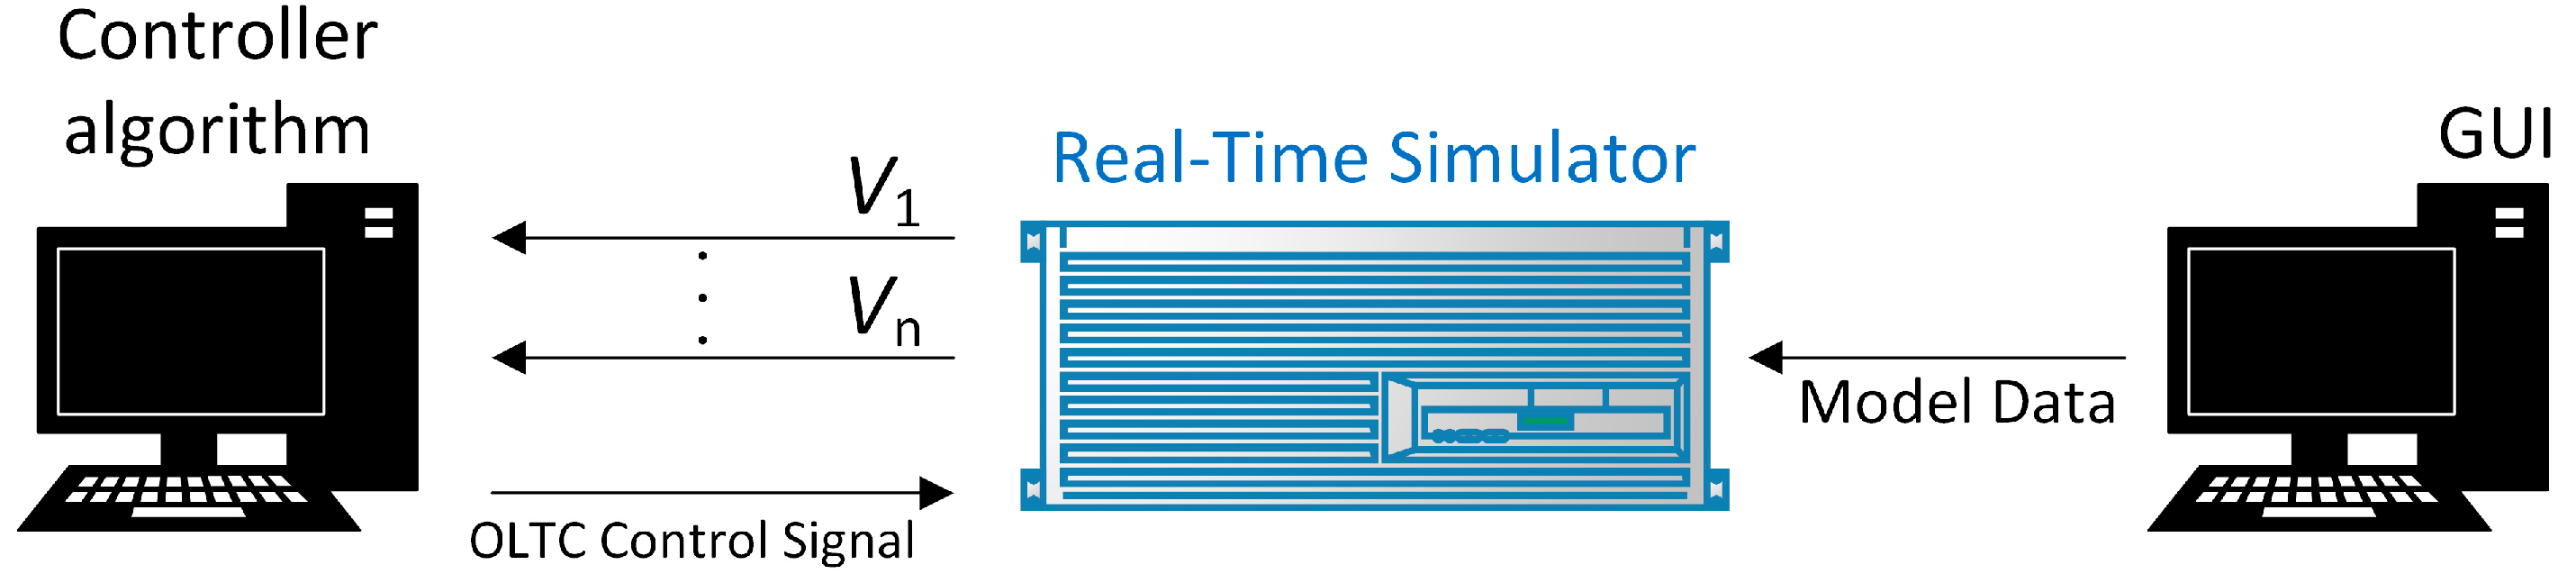
4. Methods and Experiments

To verify the correctness of the proposed algorithm, Software-in-the-loop (SIL) tests were performed. A real-time simulation offers specific benefits. Firstly, the algorithm is already developed in the target programming language in a form that can be directly implemented on a microprocessor controller. Additionally, a closed-loop environment allows for considering the impact of communication latency, controller computational time, and simulated process dynamics on the regulator’s performance [32,33,34]. Therefore, it is a cheap, fast, and reliable way to conduct the early prototyping of the control algorithms.
A modified CIGRE MV Distribution Network Benchmark in European Configuration presented in Reference [35] was modelled. Figure 6 shows the network topology. The modification involved connecting both feeders to one transformer, as a result of which bus no. 12 disappeared, but the numbering of the remaining ones was left unchanged to maintain readability and the ability to compare with the original topology. Additionally, all lines were changed to overhead, which makes the grid more susceptible to voltage disturbances caused by generation from DERs, as the X/R ratio is smaller for overhead lines than underground cables. The grid was fed by a 110/20 kV, 25 MVA transformer. It was equipped with an OLTC on secondary winding with ±10% (0.625% per tap position) regulation capabilities. The permissible voltage levels in the grid were assumed to be ±5% [35].
There were industrial and residential loads. The daily power curves are illustrated in Figure 7a [35]. For the industrial loads, there was a noon demand peak, while for the residential loads there was an evening demand peak.
There were PV-based DERs connected to nodes 7, 11, and 14 with a capacity of 14 MW in total. They were working at the unity power factor. The power curves, depicted in Figure 7b, were different for the DERs in both feeders. These curves represent the data on production from various days of the year for a location in Poland with the coordinates 49°45′28″ N 22°5′58″ E, taken from a weather model available in the System Advisor Model (SAM) developed by NREL. Since the DER generation in feeder 1 decreases while the load increases and the generation in feeder 2 remains high, feeder 1 is vulnerable to undervoltage and feeder 2 to overvoltage at the same time. This complicates the voltage regulation process.
The proposed controller algorithm was developed in Python and compiled on a PC. The data between the simulator and the computer acting as the controller were exchanged using the UDP/IP socket protocol. The voltage values from the network nodes were sent to the controller at specified time steps, and, after performing the calculations, the controller transmitted the control commands for the tap position to the simulator. Figure 8 shows the laboratory setup for the SIL simulations.
The simulations lasted 24 h and accurately replicated the operation of the modelled network. Three cases were considered. Firstly, the proposed algorithm was compared with a conventional ATC. Next, the impact of the loss of one measurement on the controller’s operation was investigated. Finally, the effect of changing the data transmission time step was analyzed.

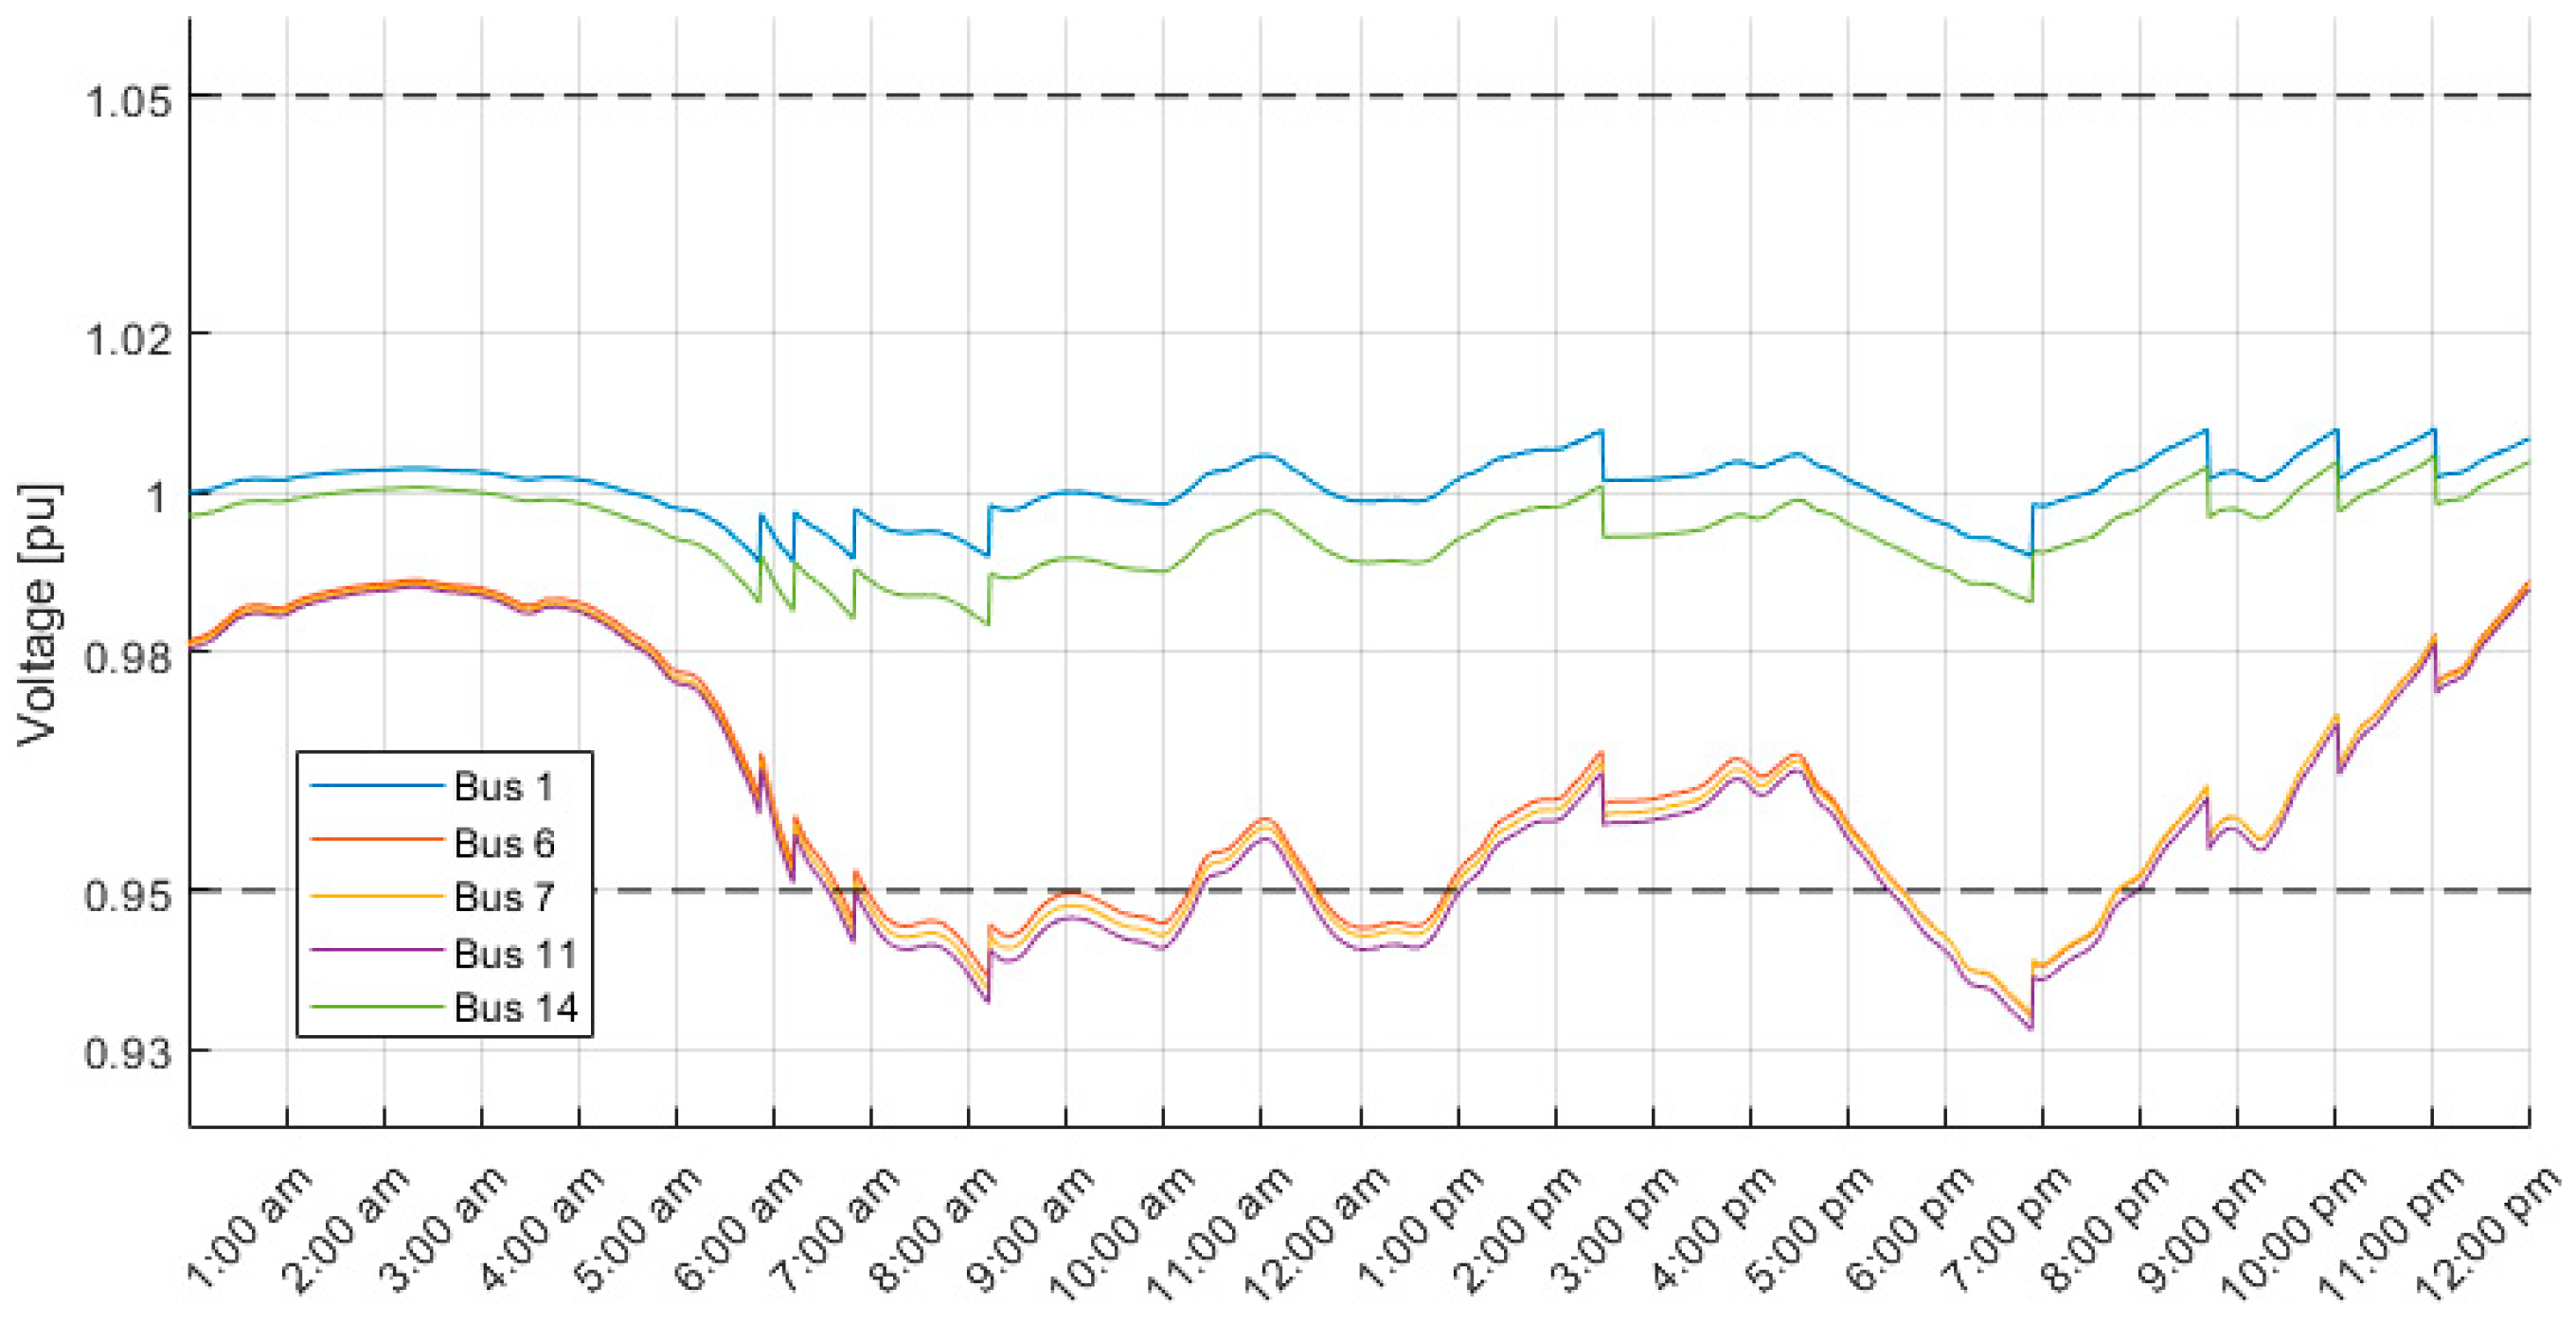
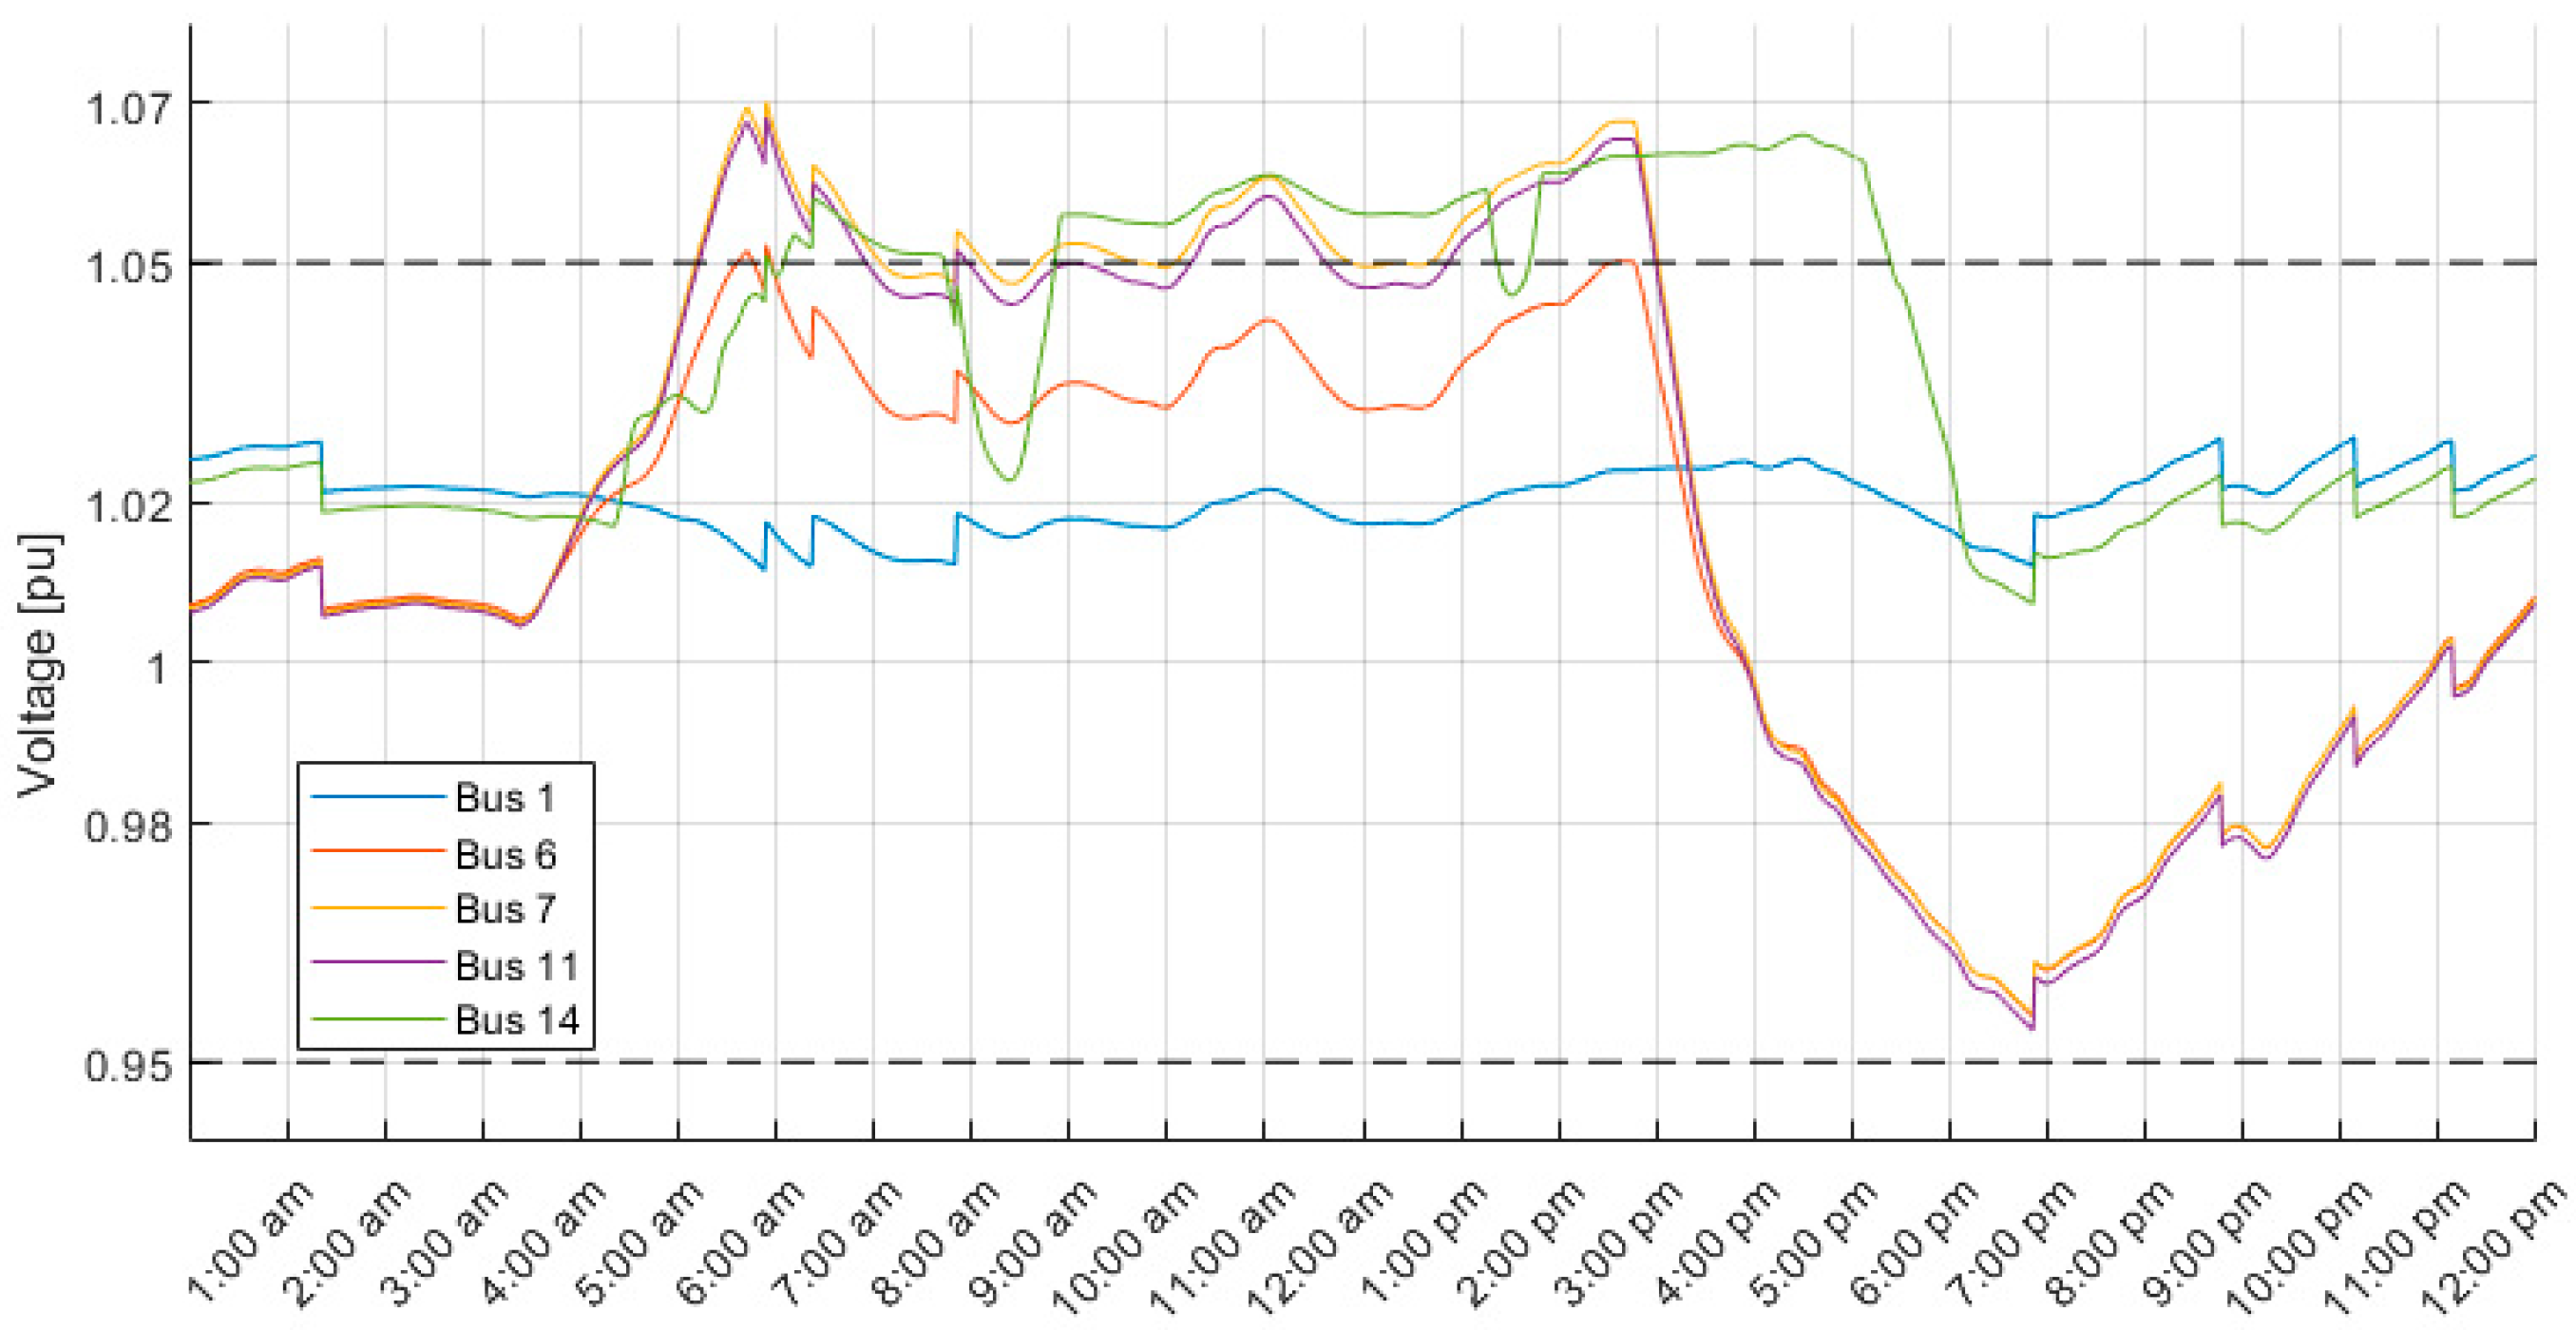
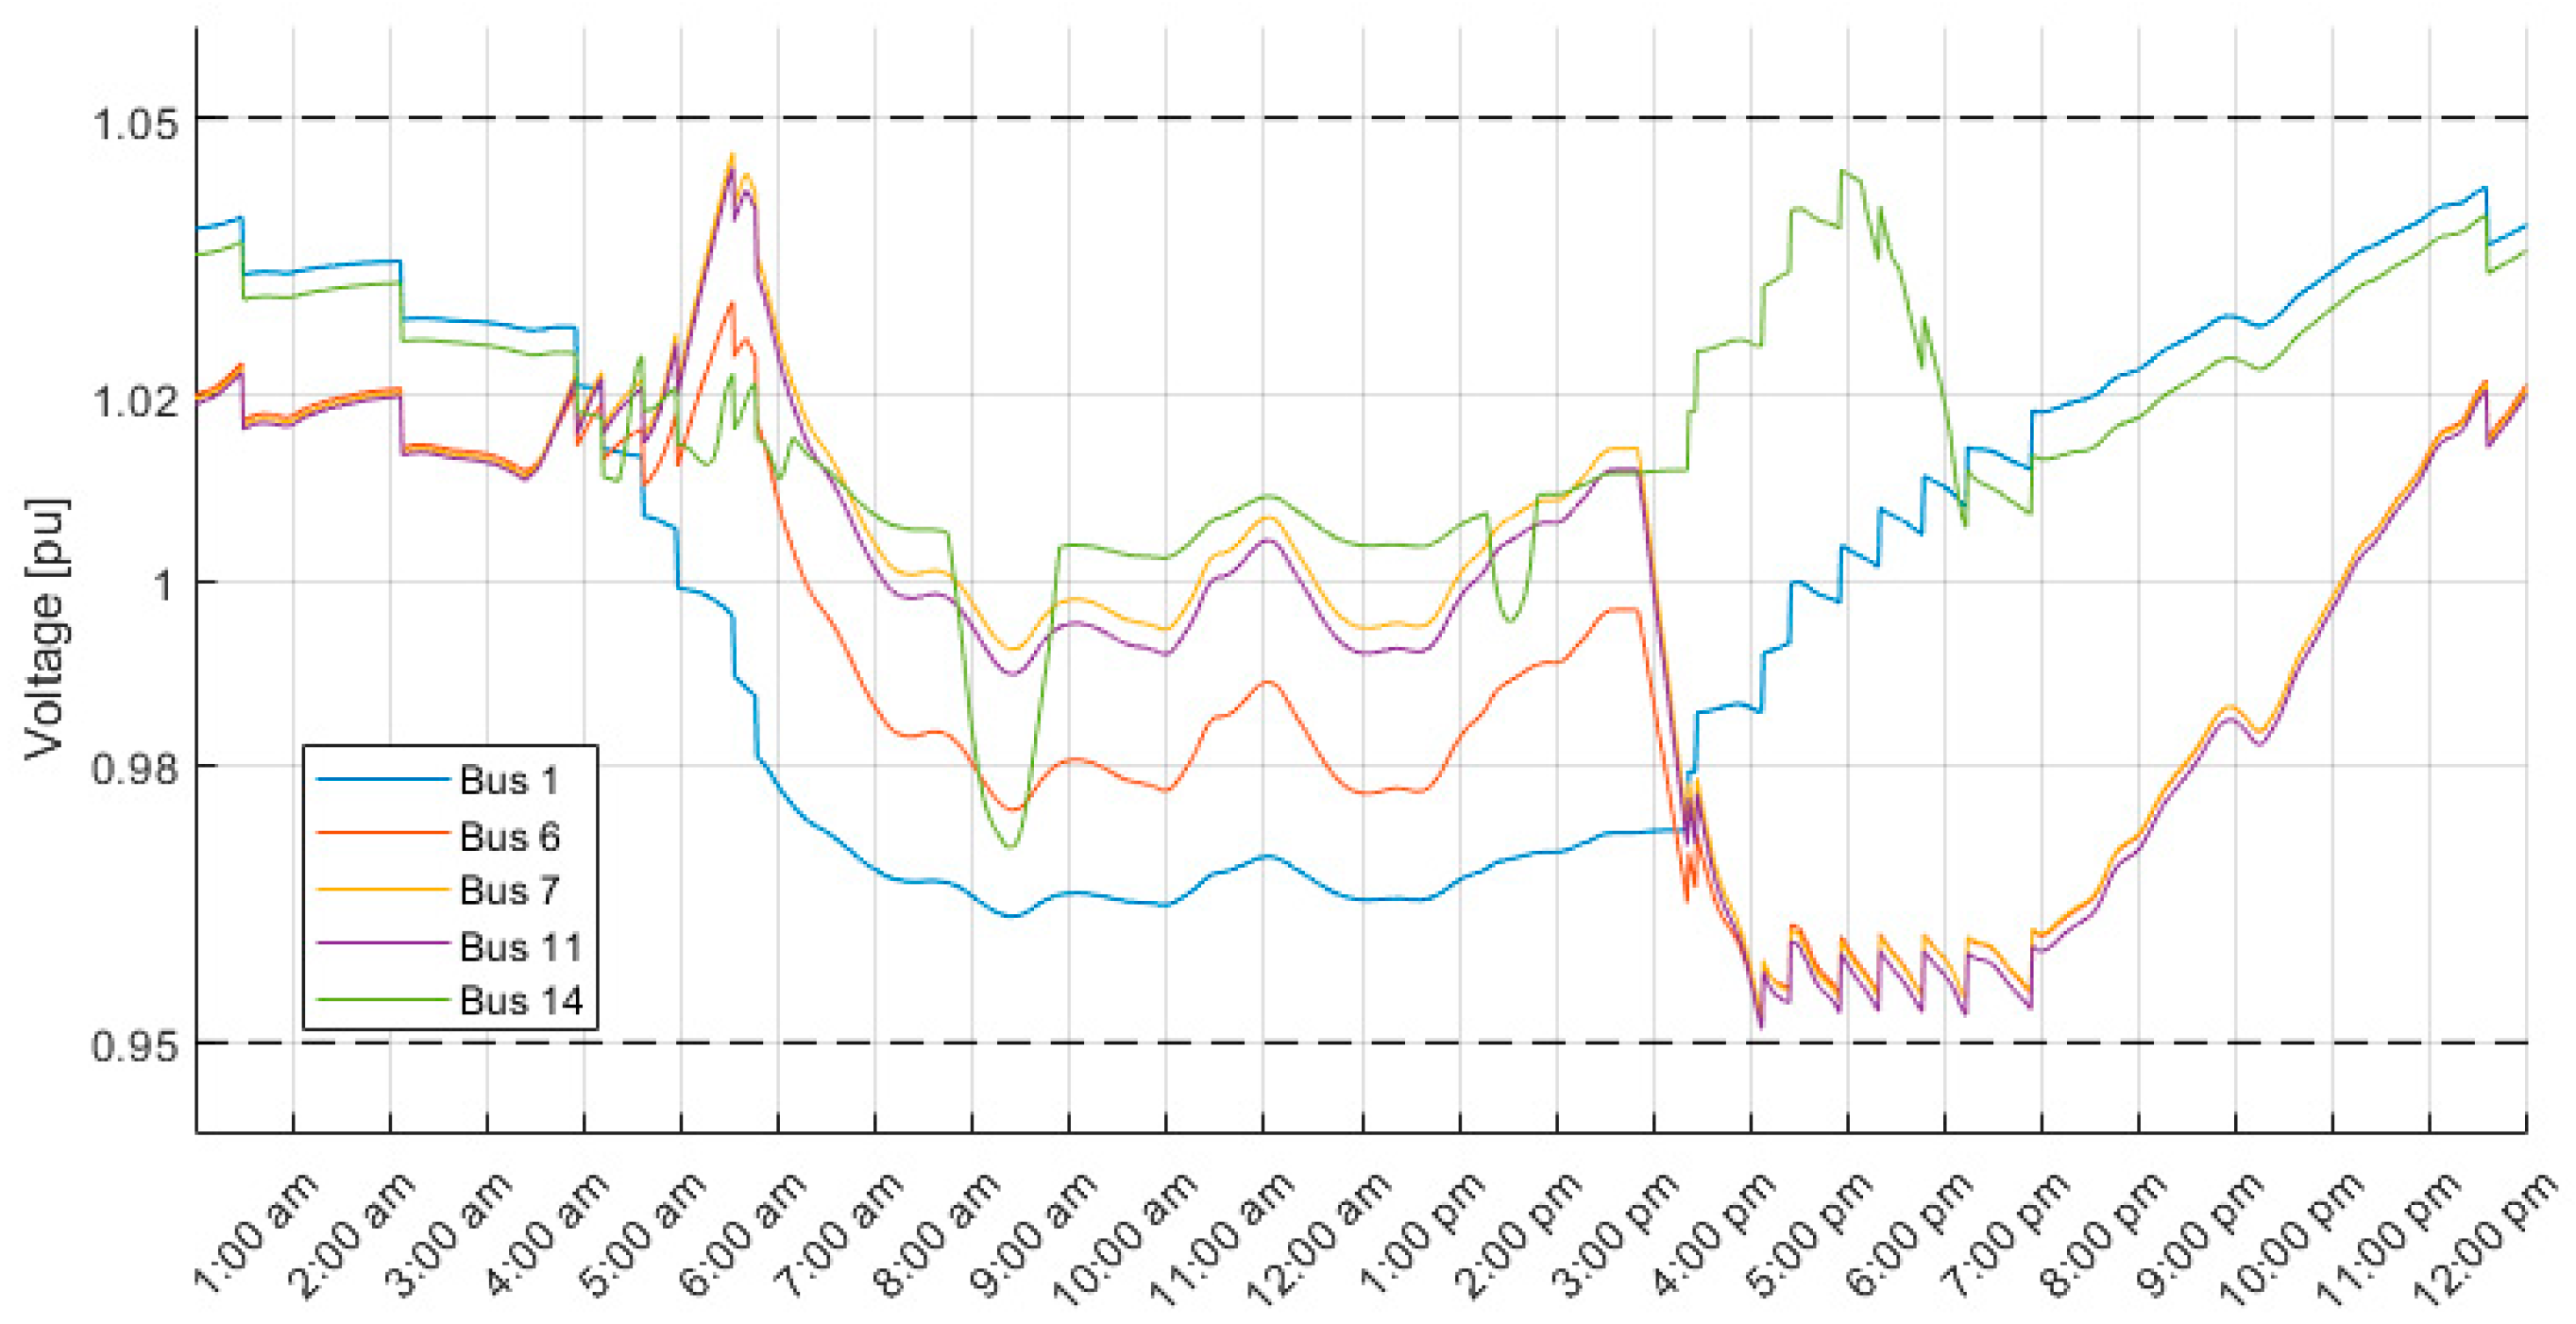
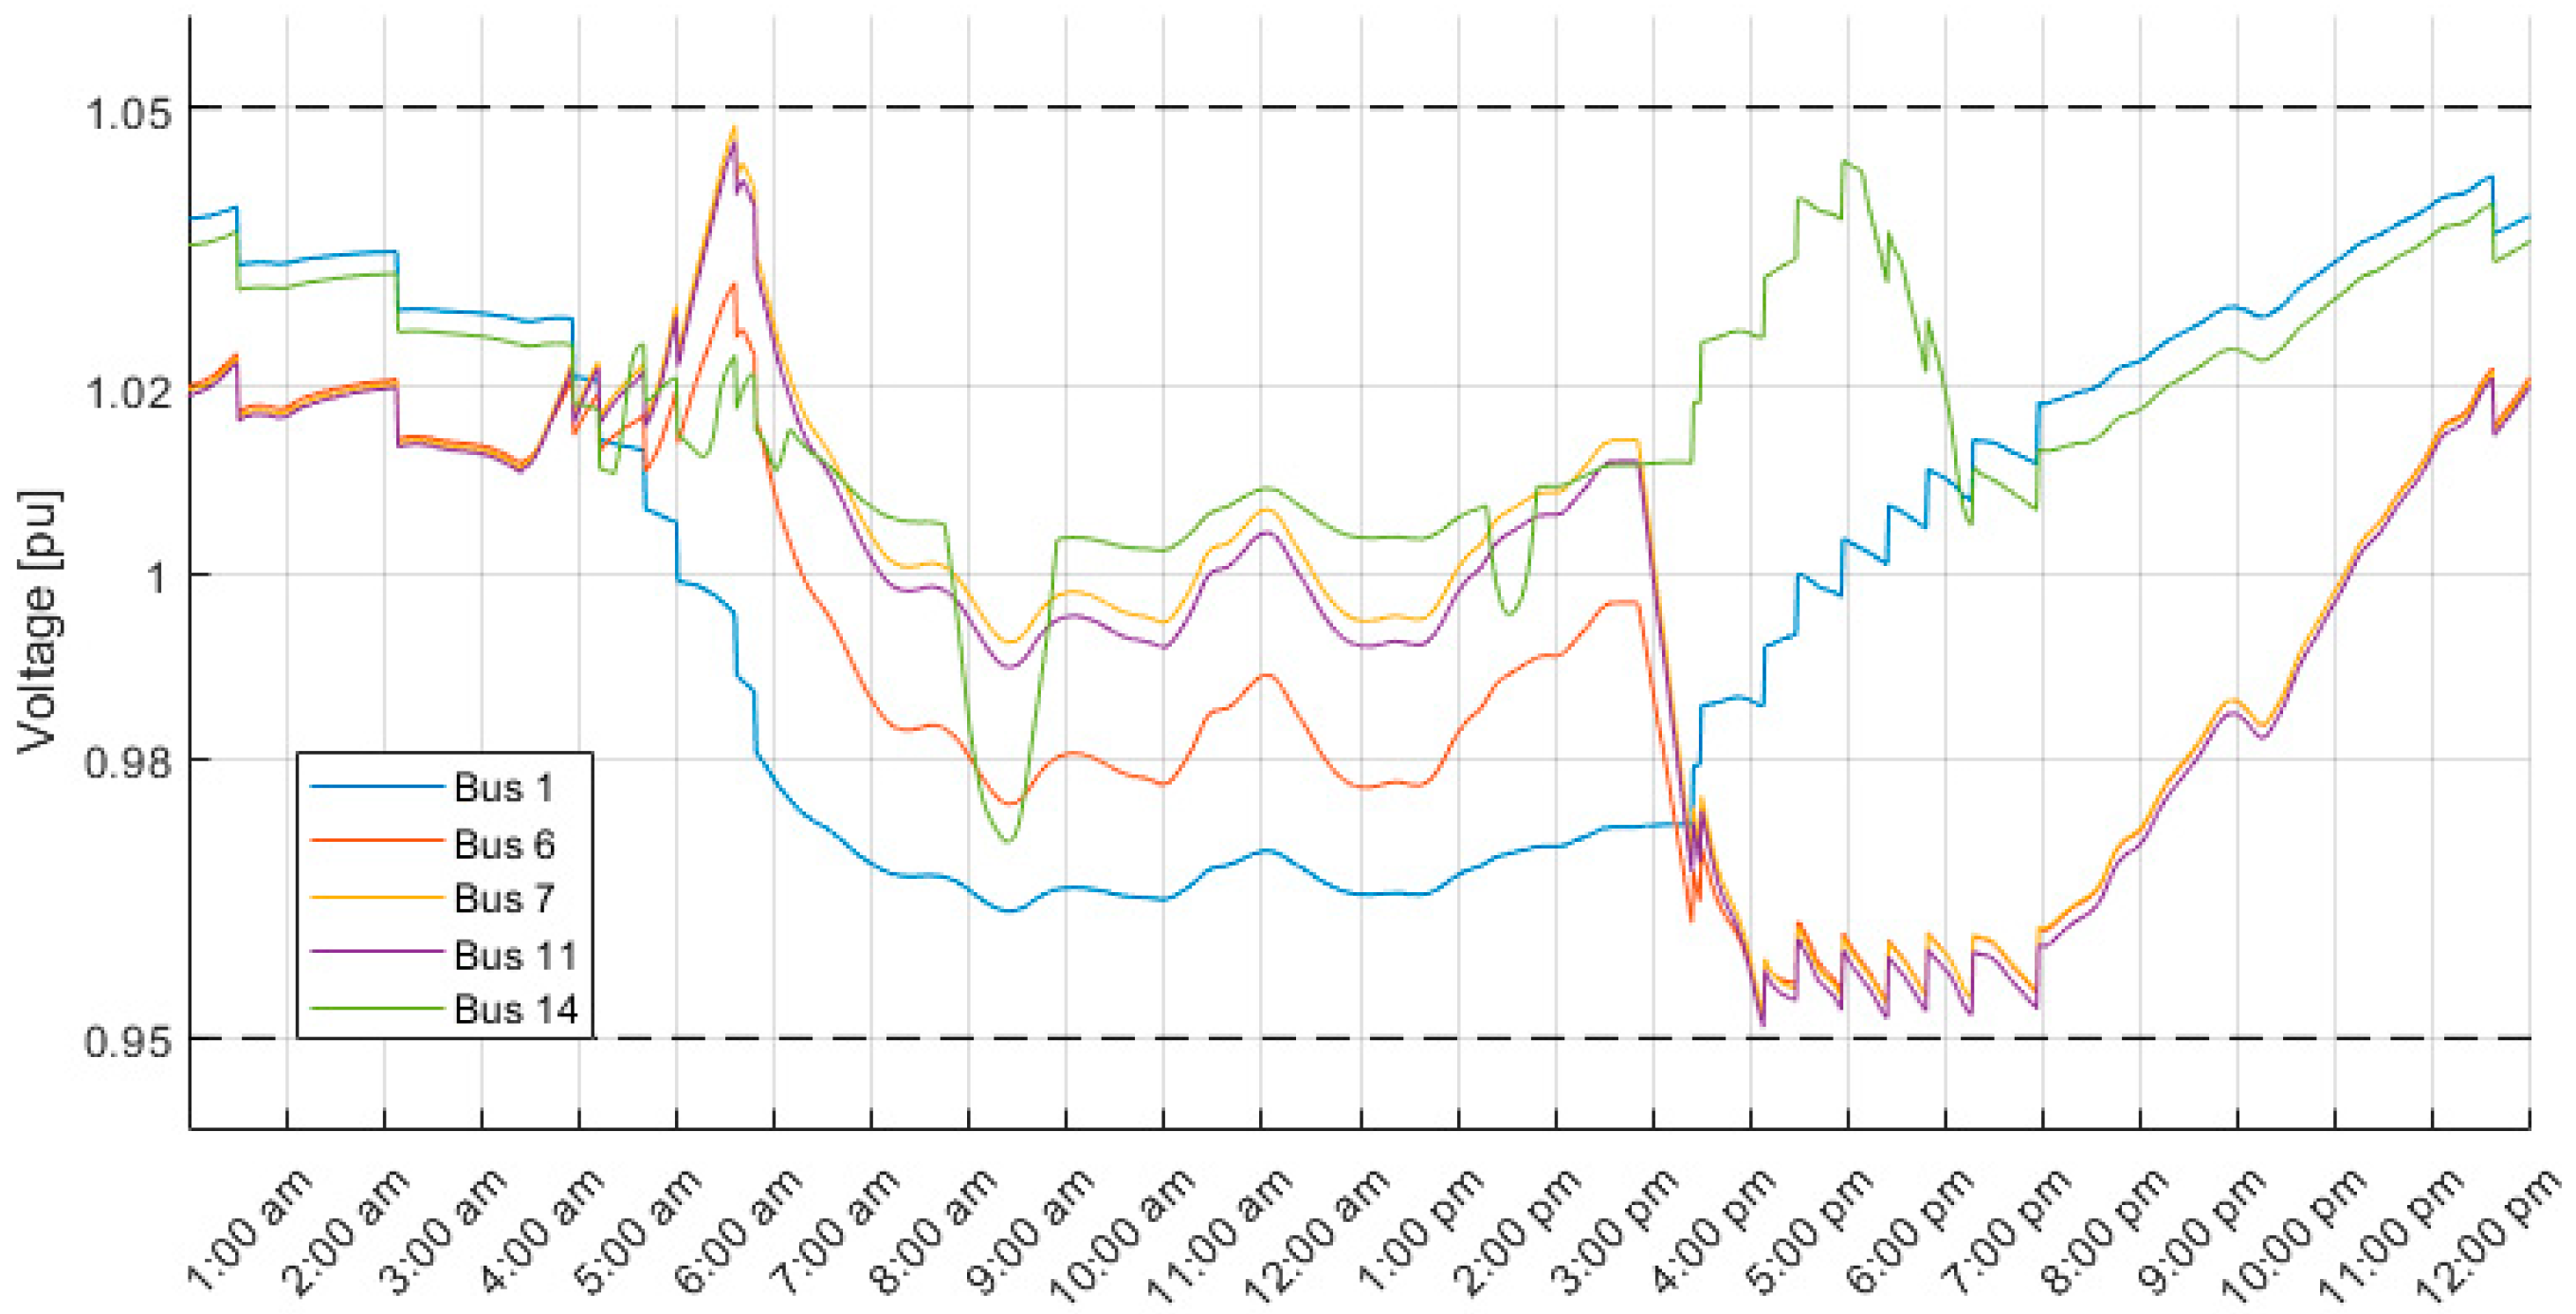
5. Results and Discussion

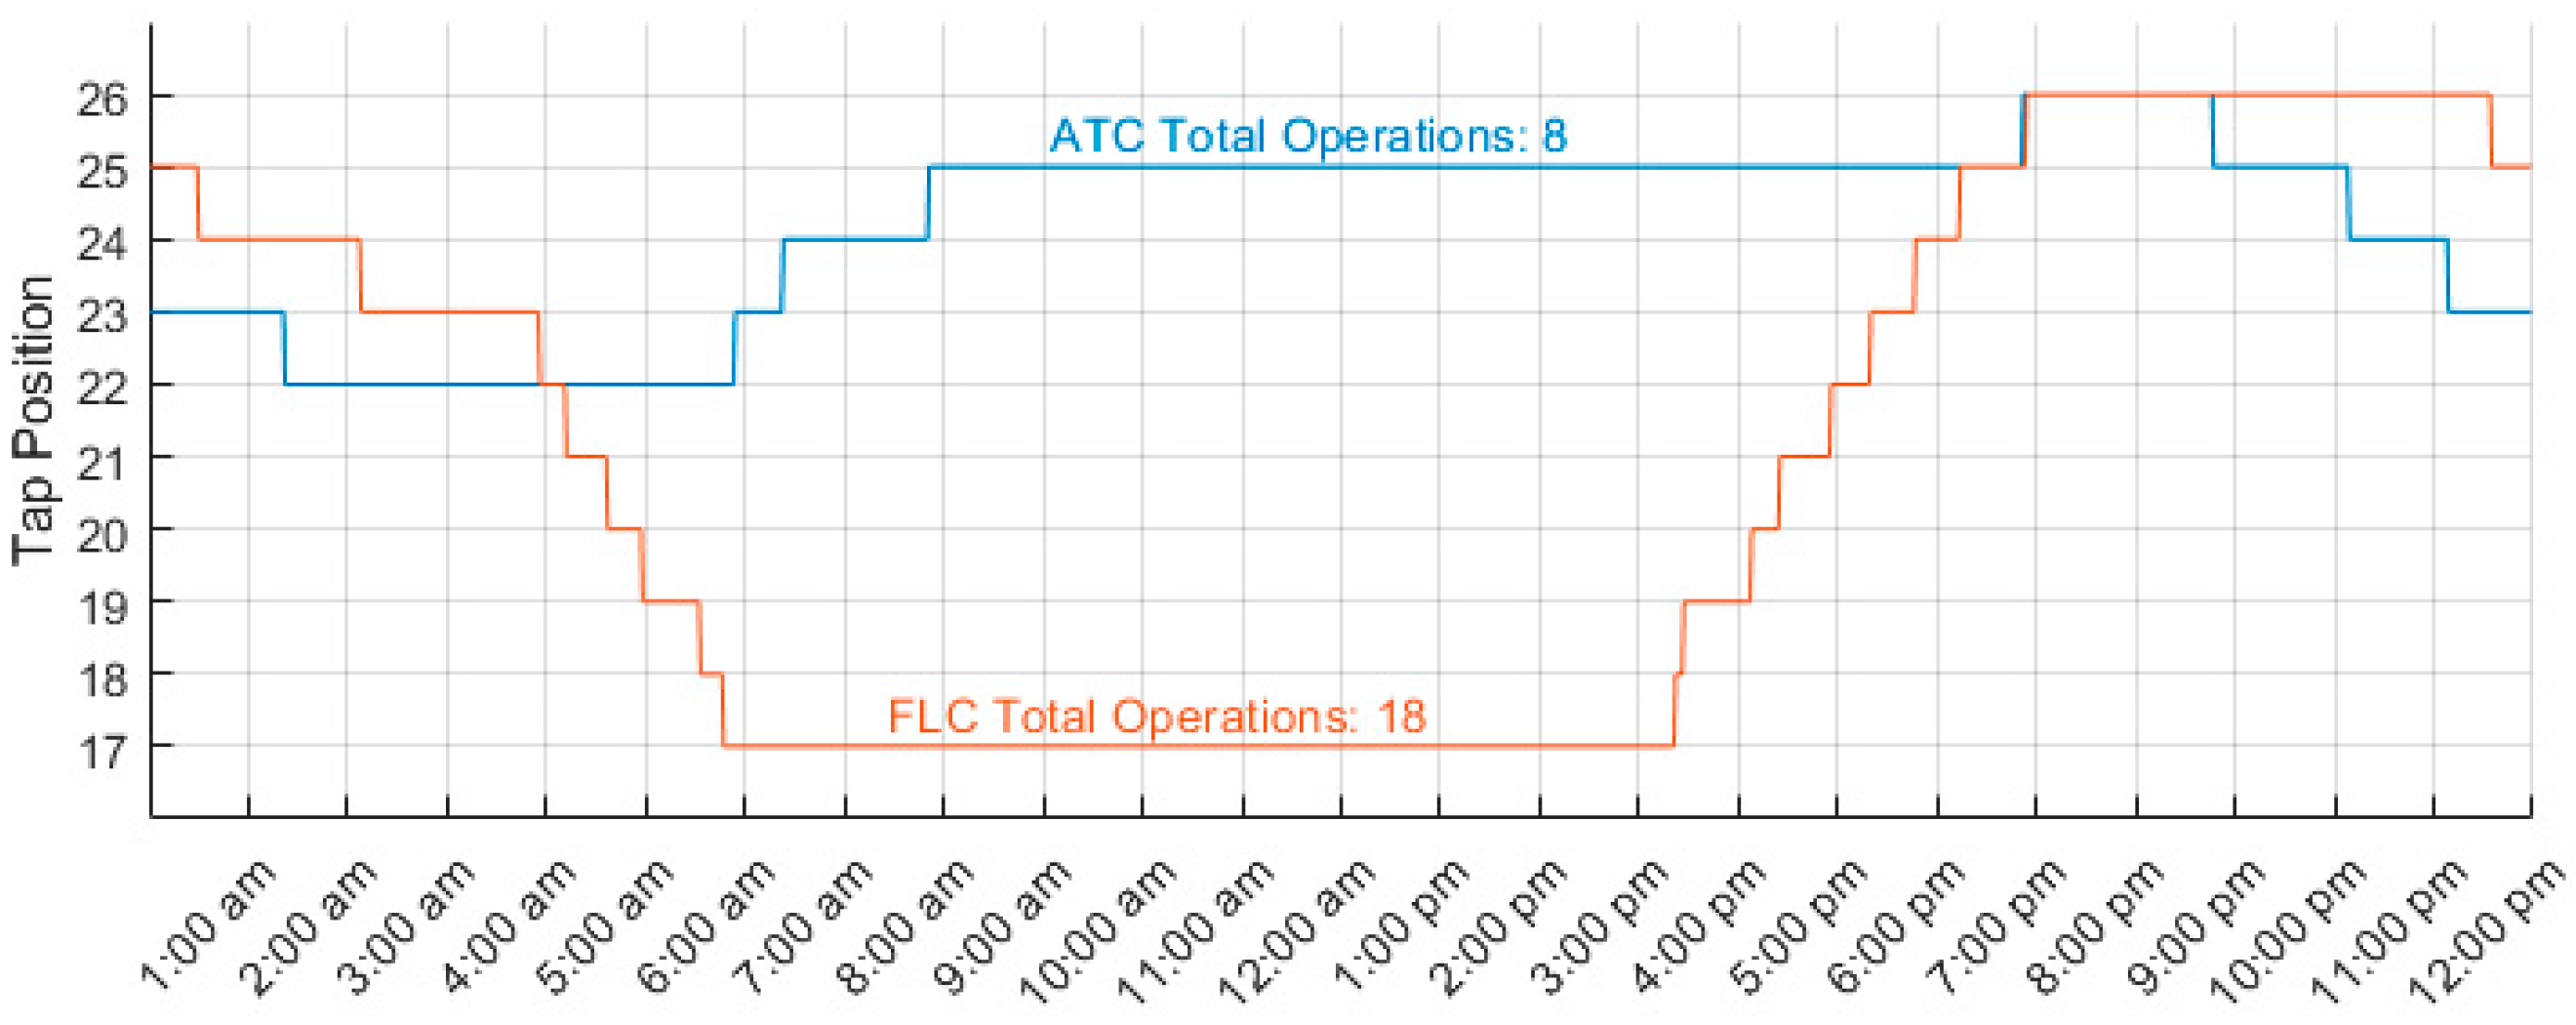
5.1. Comparison of FLC with ATC

The hysteresis controller and the time delay element settings for both the FLC and ATC were the same. Namely, the deadband zone was set to ±0.75% and the time delay to 5 min. For the ATC, the reference voltage had to be set to 1.2 pu in order to avoid deep undervoltage when DERs do not produce any energy (Figure 9). On the other hand, for the FLC, the reference voltage had to be set to 1.00 pu. The remote measurements were sent to the FLC from nodes 1, 7, 11, and 14 with a time step equal to 0.1 s.
Figure 10 shows the positive sequence voltage at the critical buses (those with the DERs connected at the end of the feeder and at the main substation), i.e., no. 1, 6, 7, 11, and 14, with ATC regulation. The exceedances of the allowed level of 1.05 pu are clearly visible in the morning when the PV generation begins and the load is low. In the later part of the day, as the load increases, the voltage decreases until there is a decrease in the industrial load, when there is again an overvoltage in at least two nodes. In the afternoon hours, the voltages in feeder 1 significantly decrease, because the generation decreases while the residential consumption rises. On the other hand, the voltage in feeder 2 remains above the permissible value as significant amounts of energy are still being generated by the PV connected to node no 14. The largest voltage deviation was 7.016% (node no. 7) during the morning PV generation peak.
On the contrary, the regulation effects of the FLC are illustrated in Figure 11. First and foremost, the proposed algorithm operation is correct. It effectively maintains the network voltages within the permissible range. The largest voltage deviation was 4.853% (node no. 11) during the evening load peak. The computation time for one time step averaged several tens of milliseconds depending on the input data, which is entirely suitable for this kind of application.
Figure 12 illustrates a comparison of the voltage deviations at the network nodes for both cases. Once again, overvoltage is clearly visible in the case of the ATC. In contrast, the FLC caused a shift in the voltage distribution towards the lower values. Lower values than the nominal network voltage appear much more frequently because the FLC controller maintains permissible voltage levels at the nodes deep in the network during the reverse power flow, which introduces lower voltage values at the nodes closer to the main substation. Nevertheless, undervoltage does not occur.
Figure 13 shows the tap position during the day for both the ATC and FLC. Both initial positions of the OLTC are different. This is because the grid state, for which the V M E S lies within the deadband zone for both algorithms is divergent as the ATC observers only node no. 1, while the FLC observes the others as well. However, the FLC generates 225% more tap changes. This is because the OLTC controller holds the tap on a relatively low position during the immense PV generation. When the PV generation is diminished, which correlates with a residential load increase, the tap has to be raised by several positions.

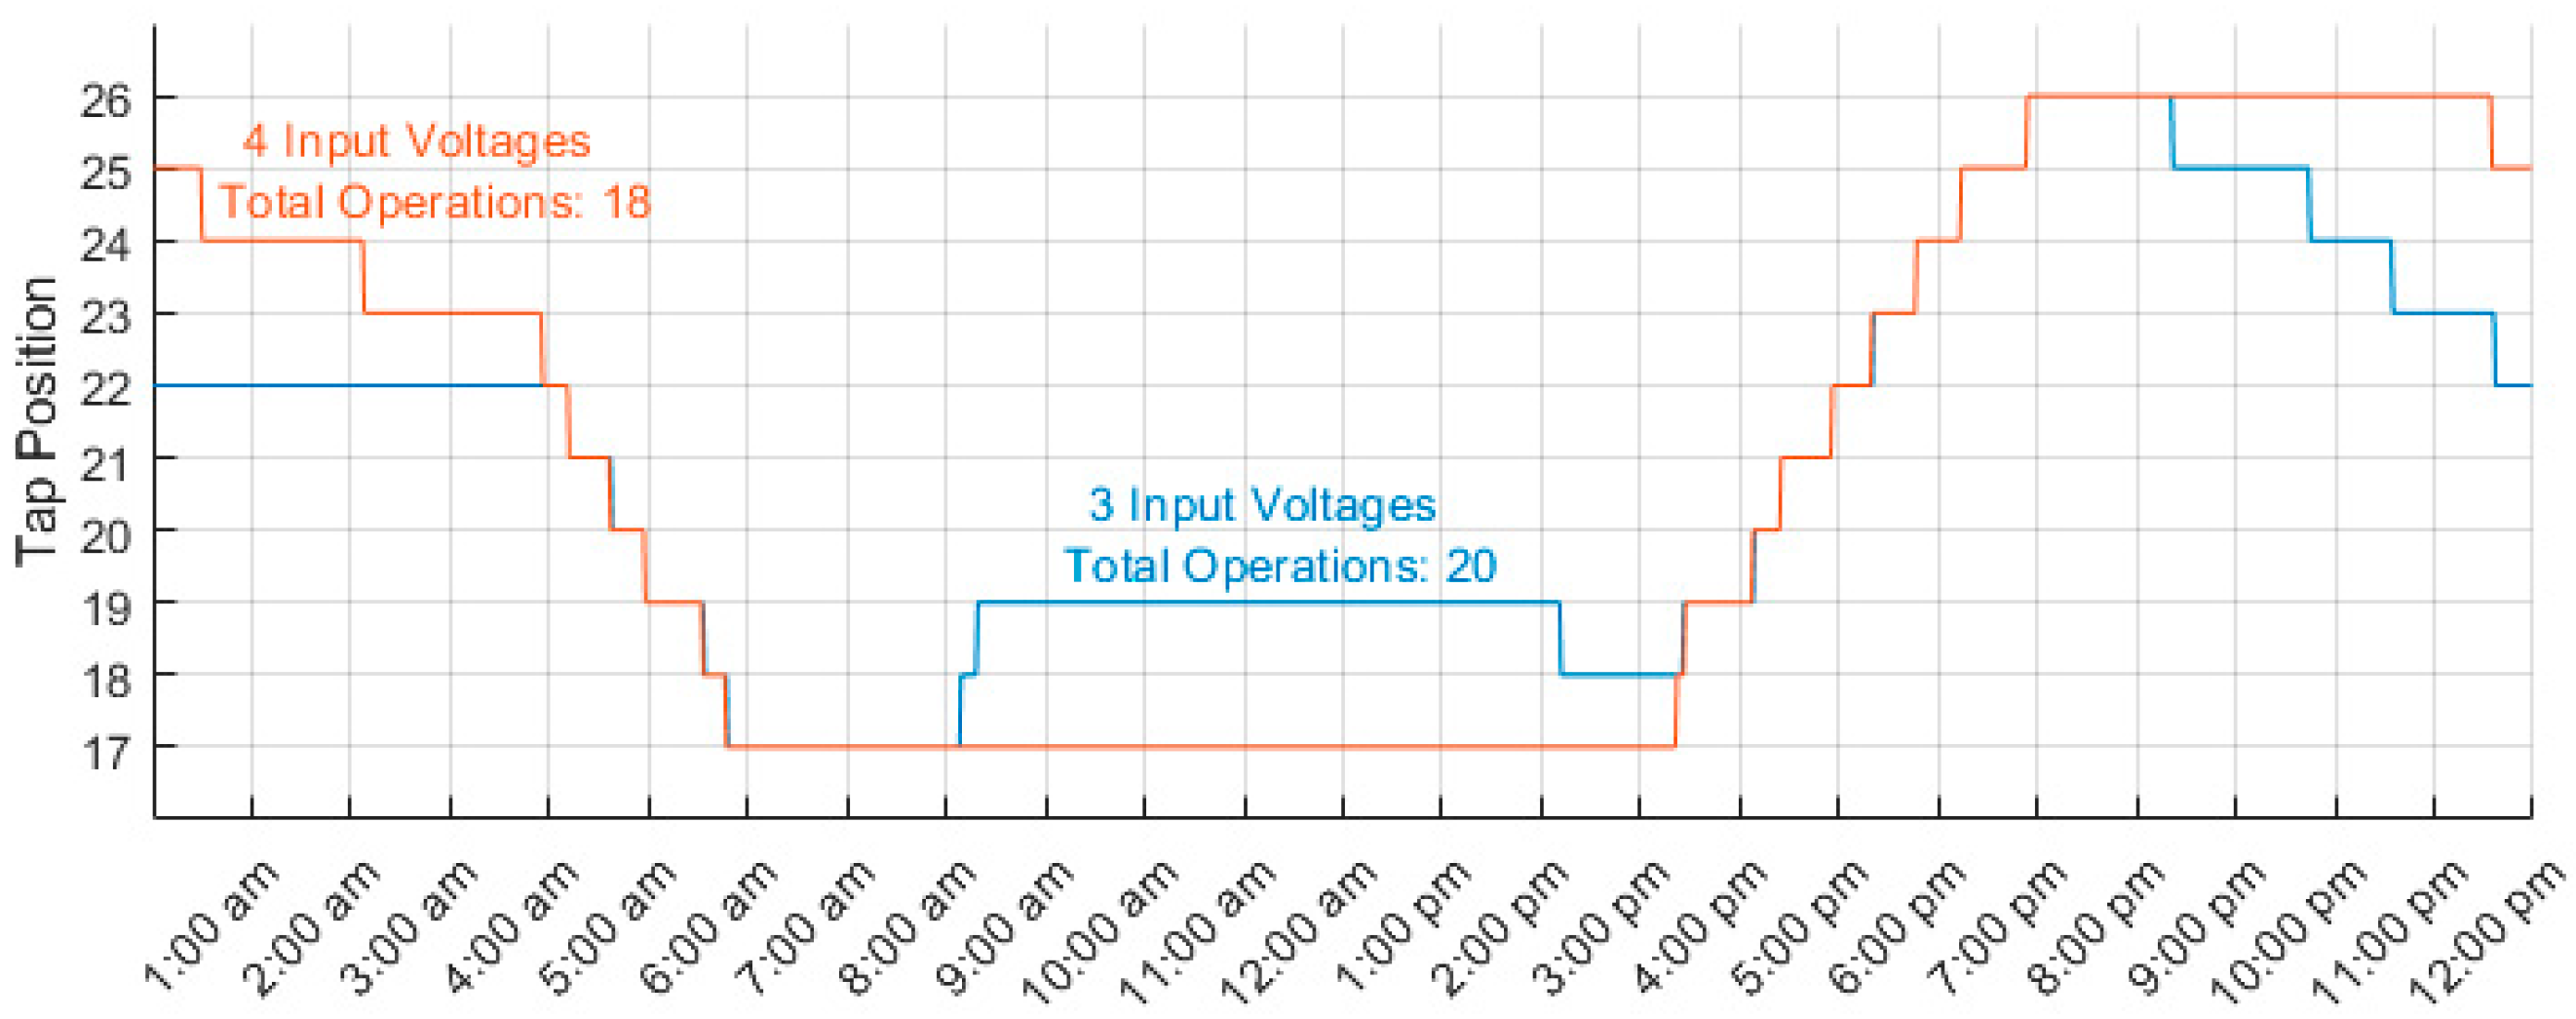
5.2. Impact of Input Voltage Quantity

To assess the impact of the quantity of the observed nodes, the algorithm’s performance was compared with three (nodes 1, 11, and 14) and four input voltages (nodes 1, 7, 11, and 14). Figure 14 shows the tap position for both cases. Again, the initial position of the OLTC was different. The explanation for this is the same as described in Section 5.1. For the three input voltages, the tap position changed slightly more frequently. However, the voltages remained within the allowed range, as shown in Figure 15, indicating that the FLC was functioning correctly, even under conditions of limited network visibility. Therefore, reducing the number of measurements does not affect the effectiveness of regulation but leads to increased wear on the OLTC. On the other hand, it is not advised to increase the number of input voltages beyond the critical nodes, because it does not improve the quality of regulation. It only increases the complexity of the fuzzy rule set. It is worth noting, however, that at least one measurement from each feeder is necessary, as described before. Nevertheless, the advantage of the proposed algorithm is that if all the measurements are lost, then the fuzzy synthesis is disabled, and the controller behaves like a conventional ATC. Thus, even in the event of a loss of communication, the grid voltage would remain regulated.

5.3. Impact of Data-Receiving Time Step

Previous cases were conducted with a measurement receiving time of 0.1 s. This is a rather short interval suitable only for fast communication standards and frequent measurements. Therefore, the algorithm behavior was investigated when the measurement receiving interval was extended. A time step of four minutes was adopted, which would be suitable, for example, when retrieving data from a SCADA system. Four input voltages were utilized (nodes no 1, 7, 11, and 14).
Figure 16 illustrates the output signal V M E S from the fuzzy synthesis element around 2:00 a.m. when the tap position was changed. When the measurements were sent to the controller every 0.1 s, it can be observed that the V M E S signal changed quasi-continuously. Around 2:03 a.m., it exceeded the deadband threshold triggering the time delay element set to 5 min. Then, at 2:08 a.m. the tap change occurred, and, in the next time step, the signal decreased into the deadband zone. When the measurements were sent every 4 min, the V M E S signal was updated every 4 min. At approximately 2:04 a.m., the signal exceeded the deadband threshold, and the tap changed at 2:09 a.m. However, the next data update was not until 2:10 a.m., and that was when the V M E S returned within the deadband limits. Therefore, to avoid the tap hunting phenomenon, the measurements must be gathered and sent to the controller more frequently than the OLTC time delay. Despite the delay in the tap change, there are no voltage violations according to Figure 17. Since the OLTC operates with significant time delays (of the order of single minutes), extending the data update interval to the order of the OLTC time delay does not result in a loss of the regulatory capabilities of the proposed algorithm.

6. Conclusions

The conventional OLTC control method, using an ATC, widely employed for voltage regulation in MV distribution networks, proves to be insufficiently effective under the conditions of a high penetration of DERs. This leads to hazardous overvoltage in distribution networks and generally complicates the preservation of power quality parameters. Consequently, a novel controller algorithm was proposed, which alters the input signal compared with the conventional ATC. This signal is obtained through a fuzzy synthesis based on local voltage measurements at the main substation and remote measurements from nodes deep within the network. SIL tests were conducted to validate the controller’s operation, and the results were compared with the performance of a conventional ATC in a benchmark network with a significant share of DERs. It also allowed the confirmation of the stability of the developed algorithm code.
The algorithm operation was tested under varying quantities of remote measurements and different time steps for their reception. Regardless of these parameters, the proposed controller helped to avoid voltage violations in the ADN, albeit at the cost of approximately twice as many tap changes operations compared to the ATC (eight for the ATC and eighteen for the FLC). However, even with the increased maintenance cost of the OLTC, it will likely be lower than the costs incurred by the DSO due to the compensations paid to customers for not meeting the power quality parameters. Additionally, the avoided costs of electrical apparatus maintenance that are exposed to neither overvoltage nor undervoltage should also be considered.
Moreover, the algorithm was designed in such a way that it is not sensitive to the partial or complete loss of remote measurements. Although limiting the number of measurements deteriorates the quality of the regulation, the obtained results are still superior to those achieved with an ATC.
Furthermore, this research has shown that the data transmission interval to the controller must be shorter than the time delay of the hysteresis controller to avoid the tap hunting phenomenon. However, considering the actual settings of transformer governors, which typically equal several minutes, the requirements for data transmission speed are not excessive. Therefore, it is possible to use a GSM network for data transmission, where the expected latency reaches hundreds of milliseconds.
Further work will focus on testing other popular communication protocols (IEC 61850 [36], DNP 3.0 [37], and IEC 60870-5-104 [38]), constructing a controller prototype, and conducting hardware-in-the-loop simulations of the controller followed by field tests. The proposed solution is characterized by low implementation costs. Implementing the controller only requires replacing or adding a controller at the substation and connecting local and remote measurements to it.

Author Contributions

W.W.: conceptualization, methodology, software, formal analysis, investigation, visualization, and writing—original draft preparation; R.K.: methodology, analysis, investigation, writing—review and editing, and supervision; M.J.: conceptualization, analysis, investigation, writing—review and editing, and project administration; and K.K.: analysis, investigation, and writing—review and editing. All authors have read and agreed to the published version of the manuscript.

Funding

This work was supported by the Electrical Power Engineering Institute of the Warsaw University of Technology with a research subsidy: the ZPB program. The research was carried out on devices co-funded by the Warsaw University of Technology within the Excellence Initiative: Research University (IDUB) programme.

Data Availability Statement

The data are contained within this article and the references.

Conflicts of Interest

The authors declare no conflicts of interest.

References

  1. Hidalgo, R.; Abbey, C.; Joós, G. A review of active distribution networks enabling technologies. In Proceedings of the IEEE PES General Meeting, Minneapolis, MN, USA, 25–29 July 2010. [Google Scholar] [CrossRef]
  2. Sarimuthu, C.R.; Ramachandaramurthy, V.K.; Agileswari, K.R.; Mokhlis, H. A review on voltage control methods using on-load tap changer transformers for networks with renewable energy sources. Renew. Sustain. Energy Rev. 2016, 62, 1154–1161. [Google Scholar] [CrossRef]
  3. Gao, C.; Redfern, M.A. A review of voltage control techniques of networks with distributed generations using On-Load Tap Changer transformers. In Proceedings of the 45th International Universities Power Engineering Conference UPEC2010, Cardiff, UK, 31 August–3 September 2010. [Google Scholar]
  4. Murray, W.; Adonis, M.; Raji, A. Voltage control in future electrical distribution networks. Renew. Sustain. Energy Rev. 2021, 146, 111100. [Google Scholar] [CrossRef]
  5. Razavi, S.-E.; Rahimi, E.; Sadegh, M.; Nezhad, A.E.; Lotfi, M.; Shafie-khah, M.; Catalão, J.P.S. Impact of distributed generation on protection and voltage regulation of distribution systems: A review. Renew. Sustain. Energy Rev. 2019, 105, 157–167. [Google Scholar] [CrossRef]
  6. Ismail, F.B.; Mazwan, M.; Al-Faiz, H.; Marsadek, M.; Hasini, H.; Al-Bazi, A.; Yang Ghazali, Y.Z. An Offline and Online Approach to the OLTC Condition Monitoring: A Review. Energies 2022, 15, 6435. [Google Scholar] [CrossRef]
  7. Ghosh, S.; Rahman, S.; Pipattanasomporn, M. Distribution Voltage Regulation Through Active Power Curtailment With PV Inverters and Solar Generation Forecasts. IEEE Trans. Sustain. Energy 2017, 8, 13–22. [Google Scholar] [CrossRef]
  8. Maataoui, Y.; Chekenbah, H.; Boutfarjoute, O.; Puig, V.; Lasri, R. A Coordinated Voltage Regulation Algorithm of a Power Distribution Grid with Multiple Photovoltaic Distributed Generators Based on Active Power Curtailment and On-Line Tap Changer. Energies 2023, 16, 5279. [Google Scholar] [CrossRef]
  9. Ma, W.; Wang, W.; Chen, Z.; Wu, X.; Hu, R.; Tang, F.; Zhang, W. Voltage regulation methods for active distribution networks considering the reactive power optimization of substations. Appl. Energy 2021, 284, 116347. [Google Scholar] [CrossRef]
  10. Salih, S.N.; Chen, P. On Coordinated Control of OLTC and Reactive Power Compensation for Voltage Regulation in Distribution Systems With Wind Power. IEEE Trans. Power Syst. 2016, 31, 4026–4035. [Google Scholar] [CrossRef]
  11. Jafari, M.R.; Parniani, M.; Ravanji, M.H. Decentralized Control of OLTC and PV Inverters for Voltage Regulation in Radial Distribution Networks With High PV Penetration. IEEE Trans. Power Deliv. 2022, 37, 4827–4837. [Google Scholar] [CrossRef]
  12. Yao, E.; Samadi, P.; Wong, V.W.S.; Schober, R. Residential Demand Side Management Under High Penetration of Rooftop Photovoltaic Units. IEEE Trans. Smart Grid 2016, 7, 1597–1608. [Google Scholar] [CrossRef]
  13. Ponnaganti, P.; Pillay, J.R.; Bak-Jensen, B. Opportunities and challenges of demand response in active distribution networks: Opportunities and challenges of demand response. WIREs Energy Environ. 2018, 7, e271. [Google Scholar] [CrossRef]
  14. Lee, S.; Kim, J.; Kim, C.; Kim, S.; Kim, E.; Kim, D.; Mehmood, K.K.; Khan, S.U. Coordinated Control Algorithm for Distributed Battery Energy Storage Systems for Mitigating Voltage and Frequency Deviations. IEEE Trans. Smart Grid 2016, 7, 1713–1722. [Google Scholar] [CrossRef]
  15. Ahmad Khan, H.; Zuhaib, M.; Rihan, M. Voltage fluctuation mitigation with coordinated OLTC and energy storage control in high PV penetrating distribution network. Electr. Power Syst. Res. 2022, 208, 107924. [Google Scholar] [CrossRef]
  16. Song, Y.; Zheng, Y.; Liu, T.; Lei, S.; Hill, D.J. A New Formulation of Distribution Network Reconfiguration for Reducing the Voltage Volatility Induced by Distributed Generation. IEEE Trans. Power Syst. 2020, 35, 496–507. [Google Scholar] [CrossRef]
  17. Caldon, R.; Coppa, M.; Sgarbossa, R.; Turri, R. A simplified algorithm for OLTC control in active distribution MV networks. In Proceedings of the AEIT Annual Conference, Mondello, Palermo, Italy, 3–5 October 2013. [Google Scholar] [CrossRef]
  18. Yoon, K.-H.; Shin, J.-W.; Nam, T.-Y.; Kim, J.-C.; Moon, W.-S. Operation Method of On-Load Tap Changer on Main Transformer Considering Reverse Power Flow in Distribution System Connected with High Penetration on Photovoltaic System. Energies 2022, 15, 6473. [Google Scholar] [CrossRef]
  19. Kasztenny, B.; Rosolowski, E.; Izykowski, J.; Saha, M.M.; Hillstrom, B. Fuzzy logic controller for on-load transformer tap changer. IEEE Trans. Power Deliv. 1998, 13, 164–170. [Google Scholar] [CrossRef]
  20. Choukri, L.; Chekenbah, H.; Lasri, R.; Bouhorma, M.; Maataoui, Y. On-Load Tap-Changer Control by a Fuzzy Logic Controller. In Proceedings of the 2019 4th World Conference on Complex Systems (WCCS), Quarzazate, Marocco, 22–25 April 2019. [Google Scholar] [CrossRef]
  21. Azzouz, M.A.; Farag, H.E.; El-Saadany, E.F. Fuzzy-based control of on-load tap changers under high penetration of distributed generators. In Proceedings of the 2013 3rd International Conference on Electric Power and Energy Conversion Systems, Istanbul, Turkey, 2–4 October 2013. [Google Scholar] [CrossRef]
  22. Stifter, M.; Bletterie, B.; Brunner, H.; Burnier, D.; Sawsan, H.; Andrén, F.; Schwalbe, R.; Abart, A.; Nenning, R.; Herb, F.; et al. DG DemoNet validation: Voltage control from simulation to field test. In Proceedings of the 2011 2nd IEEE PES International Conference and Exhibition on Innovative Smart Grid Technologies, Manchester, UK, 5–7 December 2011. [Google Scholar] [CrossRef]
  23. Herb, F.; Bletterie, B.; Abart, A.; Schwalbe, R.; Pointer, R.; Stifter, M. DG DemoNet: Impact of volt/VAR control on increasing the voltage band reserve—Results from field trial validations. In Proceedings of the 22nd International Conference and Exhibition on Electricity Distribution (CIRED 2013), Stockholm, Sweden, 10–13 June 2013. [Google Scholar] [CrossRef]
  24. Li, C.; Disfani, V.R.; Pecenak, Z.K.; Mohajeryami, S.; Kleissl, J. Optimal OLTC voltage control scheme to enable high solar penetrations. Electr. Power Syst. Res. 2018, 160, 318–326. [Google Scholar] [CrossRef]
  25. Tasnim, S.; Sarimuthu, C.R.; Lan, B.L.; Tan, C.P. A game theory approach for OLTC voltage control operation in an active distribution network. Electr. Power Syst. Res. 2023, 214, 108861. [Google Scholar] [CrossRef]
  26. Daratha, N.; Das, B.; Sharma, J. Coordination between OLTC and SVC for Voltage Regulation in Unbalanced Distribution System Distributed Generation. IEEE Trans. Power Syst. 2014, 29, 289–299. [Google Scholar] [CrossRef]
  27. Lee, S.-Y.; Chuang, Y.-S.; Lai, J.-W. A novel STATCOM control scheme for the coordination with OLTC on voltage regulation. Int. J. Smart Grid Clean Energy 2014, 3, 161–167. [Google Scholar] [CrossRef]
  28. Bakhshideh Zad, B.; Lobry, J.; Vallee, F. Coordinated control of on-load tap changer and D-STATCOM for voltage regulation of radial distribution systems with DG units. In Proceedings of the 2013 3rd International Conference on Electric Power and Energy Conversion Systems, Istanbul, Turkey, 2–4 October 2013. [Google Scholar] [CrossRef]
  29. Chakraborty, S.; Das, S.; Sidhu, T.; Siva, A.K. Smart meters for enhancing protection and monitoring functions in emerging distribution systems. Int. J. Electr. Power Energy Syst. 2021, 27, 106626. [Google Scholar] [CrossRef]
  30. Yahya, S.; Ndyetabura, H.; Mvungi, N.; Lujara, S. Low Cost Data Acquisition System for Electrical Secondary Distribution Network. In Proceedings of the 2020 6th IEEE International Energy Conference (ENERGYCon), Gammarth, Tunisia, 13–16 April 2020. [Google Scholar] [CrossRef]
  31. Dusabimana, E.; Yoon, S.-G. A Survey on the Micro-Phasor Measurement Unit in Distribution Networks. Electronics 2020, 9, 305. [Google Scholar] [CrossRef]
  32. Guerrero, C.A.V.; Da Silveira, P.M.; Carvalho, J.M.; Bonatto, B.D.; Oliveira, D.Q.; Santos, M.; Marujo, D.; Zambroni, A.C.; Felver, L.A.; Oliveira, J.A.; et al. A new software-in-the-loop strategy for real-time testing of a coordinated Volt/Var Control. In Proceedings of the 2016 IEEE PES PowerAfrica, Livingstone, Zambia, 28 June–2 July 2016. [Google Scholar] [CrossRef]
  33. Tuominen, V.; Reponen, H.; Kulmala, A.; Lu, S.; Repo, S. Real-time hardware- and software-in-the-loop simulation of decentralised distribution network control architecture. IET Gener. Transm. Distrib. 2017, 11, 3057–3064. [Google Scholar] [CrossRef]
  34. Andrén, F.; Henein, S.; Stifter, M. Development and validation of a coordinated voltage controller using real-time simulation. In Proceedings of the IECON 2011—37th Annual Conference of the IEEE Industrial Electronics Society, Melbourne, VIC, Australia, 7–10 November 2011. [Google Scholar] [CrossRef]
  35. Strunz, K. Benchmark Systems for Network Integration of Renewable and Distributed Energy Resources. CIGRE Task Force C6.04.02; Electra; CIGRE: Paris, France, 2014; Volume 575, ISBN 978-285-873-270-8. Available online: https://www.e-cigre.org/publications/detail/elt-273-8-benchmark-systems-for-network-integration-of-renewable-and-distributed-energy-resources.html (accessed on 24 May 2024).
  36. IEC TR 61850-1:2013; Communication Networks and Systems for Power Utility Automation—Part 1: Introduction and Overview. IEC: Geneva, Switzerland, 2013.
  37. IEEE Std 1815-2012; IEEE Standard for Electric Power Systems Communications-Distribiuted Network Protocol (DNP3). IEEE: Piscataway, NJ, USA, 2012.
  38. IEC 60870-5-104; Transmission Protocols–Network Access for IEC 60870-5-101 Using Standard Transport Profiles. IEC: Geneva, Switzerland, 2006.
Figure 1. Simplified ADN feeder.
Energies 17 02716 g001
Figure 2. Principle behind ATC.
Energies 17 02716 g002
Figure 3. Proposed OLTC controller scheme.
Energies 17 02716 g003
Figure 4. Proposed OLTC controller algorithm.
Energies 17 02716 g004
Figure 5. (a) Antecedent membership functions; and (b) consequent membership functions.
Energies 17 02716 g005
Figure 6. Modified CIGRE benchmark.
Energies 17 02716 g006
Figure 7. (a) CIGRE daily load power curves; and (b) PV generation daily power curves according to SAM weather model.
Energies 17 02716 g007
Figure 8. SIL laboratory setup.
Energies 17 02716 g008
Figure 9. The voltage values of the critical buses in the ATC where V R E F = 1.00   p u without DER generation.
Energies 17 02716 g009
Figure 10. The voltage values of the critical buses in the ATC where V R E F = 1.02   p u .
Energies 17 02716 g010
Figure 11. The voltage values of the critical buses in an FLC with four inputs with a 100 ms data update interval.
Energies 17 02716 g011
Figure 12. Comparison of voltage deviations with ATC and FLC.
Energies 17 02716 g012
Figure 13. Tap position comparison of FLC with ATC.
Energies 17 02716 g013
Figure 14. Tap position: comparison for cases with three and four input signals.
Energies 17 02716 g014
Figure 15. The voltage values of the critical buses in an FLC with three inputs with a 100 ms data update interval.
Energies 17 02716 g015
Figure 16. Fuzzy synthesis output signals for 0.1 s and 4 min data update intervals.
Energies 17 02716 g016
Figure 17. The voltage values of the critical buses in an FLC with four inputs at a 4 min data update interval.
Energies 17 02716 g017
Table 1. Fuzzy rules set for three inputs.
Rule NumberInput Voltage 1Input Voltage 2Input Voltage 3Output Voltage
1VL11L
21VL1L
311VLL
4LL1L
51LLL
6L1LL
7NN1N
81NNN
9N1NN
10VLVH1N
11VL1VHN
12VHVL1N
131VLVHN
1411VLN
1511VLN
16LNHN
17LHNN
18NLHN
19HLNN
20NHLN
21HNLN
22HH1H
231HHH
24H1HH
25VH11H
261VH1H
2711VHH
Disclaimer/Publisher’s Note: The statements, opinions and data contained in all publications are solely those of the individual author(s) and contributor(s) and not of MDPI and/or the editor(s). MDPI and/or the editor(s) disclaim responsibility for any injury to people or property resulting from any ideas, methods, instructions or products referred to in the content.

