Article

Thermal Resistance Modeling for the Optimal Design of EE and E/PLT Core-Based Planar Magnetics

1
Univ. Lille, Arts et Metiers Institute of Technology, Centrale Lille, Junia, HESAM Université, ULR 2697, L2EP, F-59000 Lille, France
2
Arts et Métiers Campus of Rabat, Technopolis Parc, Salé 11000, Morocco
3
Univ. Lille, Arts et Metiers Institute of Technology, Centrale Lille, Junia, ULR 2697-L2EP, F-59000 Lille, France
*
Author to whom correspondence should be addressed.
Energies 2024, 17(11), 2755; https://doi.org/10.3390/en17112755
Submission received: 29 April 2024 / Revised: 31 May 2024 / Accepted: 2 June 2024 / Published: 4 June 2024

Abstract

:
With the integration of power electronic converters and components, an accurate thermal design becomes essential. Hence, precise thermal models for components are needed for their optimal design. This paper focuses on the development of an analytical model for the design of thermal resistance of planar magnetic cores (PMC). Based on computational fluid dynamic (CFD) simulations, the PMC design thermal resistance variation is studied, according to ambient temperature and level of losses. Then, a polynomial equation is developed to model those variations, and coefficients are deduced for all the sizes of PMC. This analytical model, useful for designers, is finally validated with thermal measurements on a planar transformer prototype.

1. Introduction

Reducing power electronic converter volume and increasing its efficiency are two main objectives when developing a power converter [1,2]. These criteria are essential, especially in embedded and transportation systems. They can lead to serious thermal constraints on power components. Regarding high-frequency (HF) passive magnetic components (i.e., transformers and inductors), volume, losses, and thermal management are of major concern for designers. They need to be optimized in order to reach the objectives of power density. Planar magnetic components are one solution for the reduction of magnetic component size. They present lower losses and higher surface area to volume ratio compared to conventional wound components [3,4]. They are particularly suitable for electric vehicle (EV) applications [5,6,7].
In order to evaluate the temperature rise of a planar component in a design stage, a single equivalent thermal resistance can be used. Some expressions of such thermal resistance for planar magnetic cores (PMC) are given in the literature [2,8,9,10,11,12,13,14]. It can be computed based on the external area of the component [8,9] or from the volume of the core [10,11,12]. These expressions only depend on the geometrical dimensions of the core and windings. They do not consider working conditions such as ambient temperature or dissipated power inside the component. Other models take into consideration power losses as well as the external area of the component [2,13,14]. The ambient temperature is never considered even if this parameter has a great impact on heat transfer due to convection and radiation phenomena.
In this paper, an analytical expression for the thermal resistance of PMC is developed in order to take into account the impact of losses and ambient temperature. For this study, planar magnetics are considered in natural air cooling with no heatsink. Such a cooling solution is the first hypothesis fixed by designers when dealing with planar magnetics. Indeed, it is cost-effective and well-adapted to planar magnetics and presents high power density compared to wound components.
Combinations of EE and E/Plate (PLT) cores are studied for core sizes 32, 38, 43, 58, and 64 [15] with computational fluid dynamic (CFD) simulations. Then, a polynomial model is developed, and coefficients are deduced for each combination and size of ferrite cores. The developed model is dedicated to the design step or optimization process. It enables to quickly size, as fairly as possible, the thermal behavior of PMC.
The paper is organized as follows: In Section 2, some of the models available in the literature are first compared, based on the analysis reviewed in [16]. Then, in Section 3 the methodology for the computation of equivalent thermal resistance depending on power loss and ambient temperature is detailed. CFD simulations for all the sizes of EE and E/PLT planar cores are performed using Icepack and Fluent software (version 2020 R2) [17] in order to study the variation of their thermal resistance according to both parameters. Then, the obtained curves are compared to the thermal resistance model usually used in the design process to highlight the benefits of such thermal resistance variation modeling. In Section 4, the analytical model is developed, and polynomial coefficients are deduced for each size of planar cores. Finally, the analytical model is compared to CFD results and an experimental validation is performed on a 360 VA planar transformer prototype made with an E/PLT 38 ferrite core.

2. Thermal Resistance for the Design of Planar Magnetics

As mentioned in the introduction, planar magnetics present some advantages compared to conventional wound magnetic components. One of their main advantages is linked to their particular geometry, linked to the use of planar cores, which increases cooling performance due to their higher surface-to-volume ratio [3,4].

2.1. Planar EE and E/PLT Cores

Planar magnetic cores are made of a two-halve ferrite core (Figure 1). For E/PLT (Figure 1a), the E part is combined with a plate (PLT) one while for EE (Figure 1b), two similar planar E cores are associated.
The width L refers to the size of the planar core. Thus, an E64 or a PLT64 has a width of 64 mm. Based on [15], lengths of standard planar cores are set up in [16]. From these data, two geometrical parameters can be deduced:
  • The external area: Aext. Its value is computed by summing all the external surfaces of the core and the windings;
  • The effective volume: Ve. This value defines a hypothetical ring core having the same magnetic properties as the planar core [15].
As will be detailed in the next section, these values of Aext and Ve are used in many thermal resistance models from the literature.

2.2. Can a Single Global Thermal Resistance Be Used for Planar Magnetics?

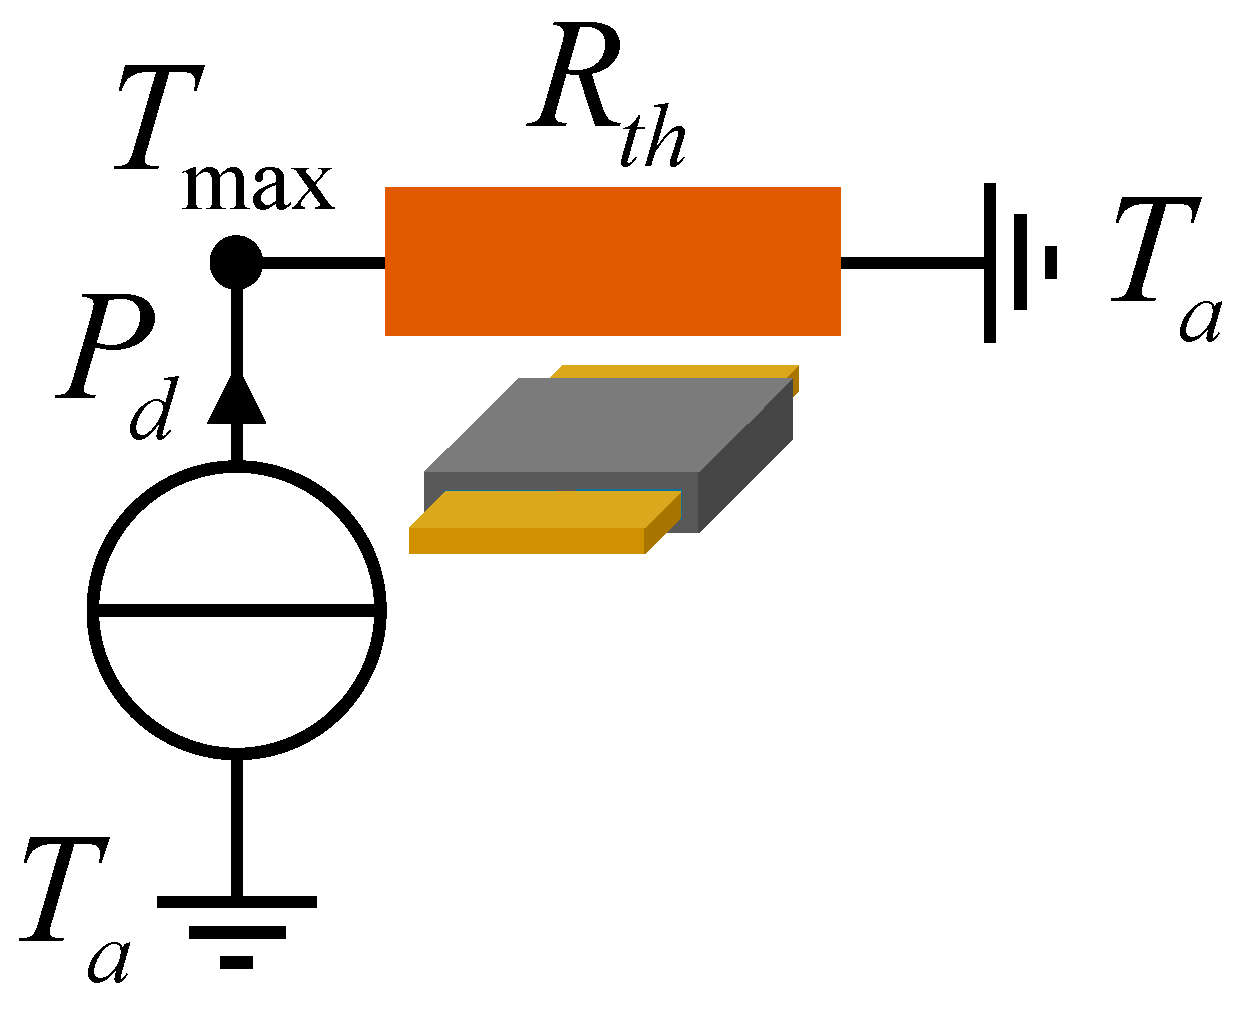
Regarding PMC thermal modeling, the temperature inside the component is quite homogeneous due to their large footprint compared to their weak thickness. As a consequence, a unique global thermal resistance can be used to model the planar component temperature rise (Figure 2). Then, the temperature rise T is linked to the power dissipated inside the component P d and the thermal resistance R t h :
T = R t h × P d
In order to highlight this attribute, a planar transformer made with EE64 planar core [15] is studied in free air convection conditions with finite element analysis (FEA). FEA is performed with Ansys Mechanical [17]. Thermal conductivities used for the FEM simulation are listed in Table 1. For the windings, copper and insulator are considered a homogenous material with two different thermal conductivities [18]: a transverse one (Kxy) and a normal one (Kz). Their computations are based on [19]. For the magnetic core, thermal conductivity is the same in the three space directions. In the following sections, the same values will also be set for CFD modeling.
Other simulation conditions are listed below:
  • Total losses inside the transformer (13 W) are divided into two parts: 6.5 W for the winding and 6.5 W for the core;
  • Thermal connection between the winding and the core is perfect;
  • Ambient temperature is set to 25 °C;
  • A heat exchange coefficient of 14 W·K−1·m−2 is applied to all the external areas of the transformer [20].
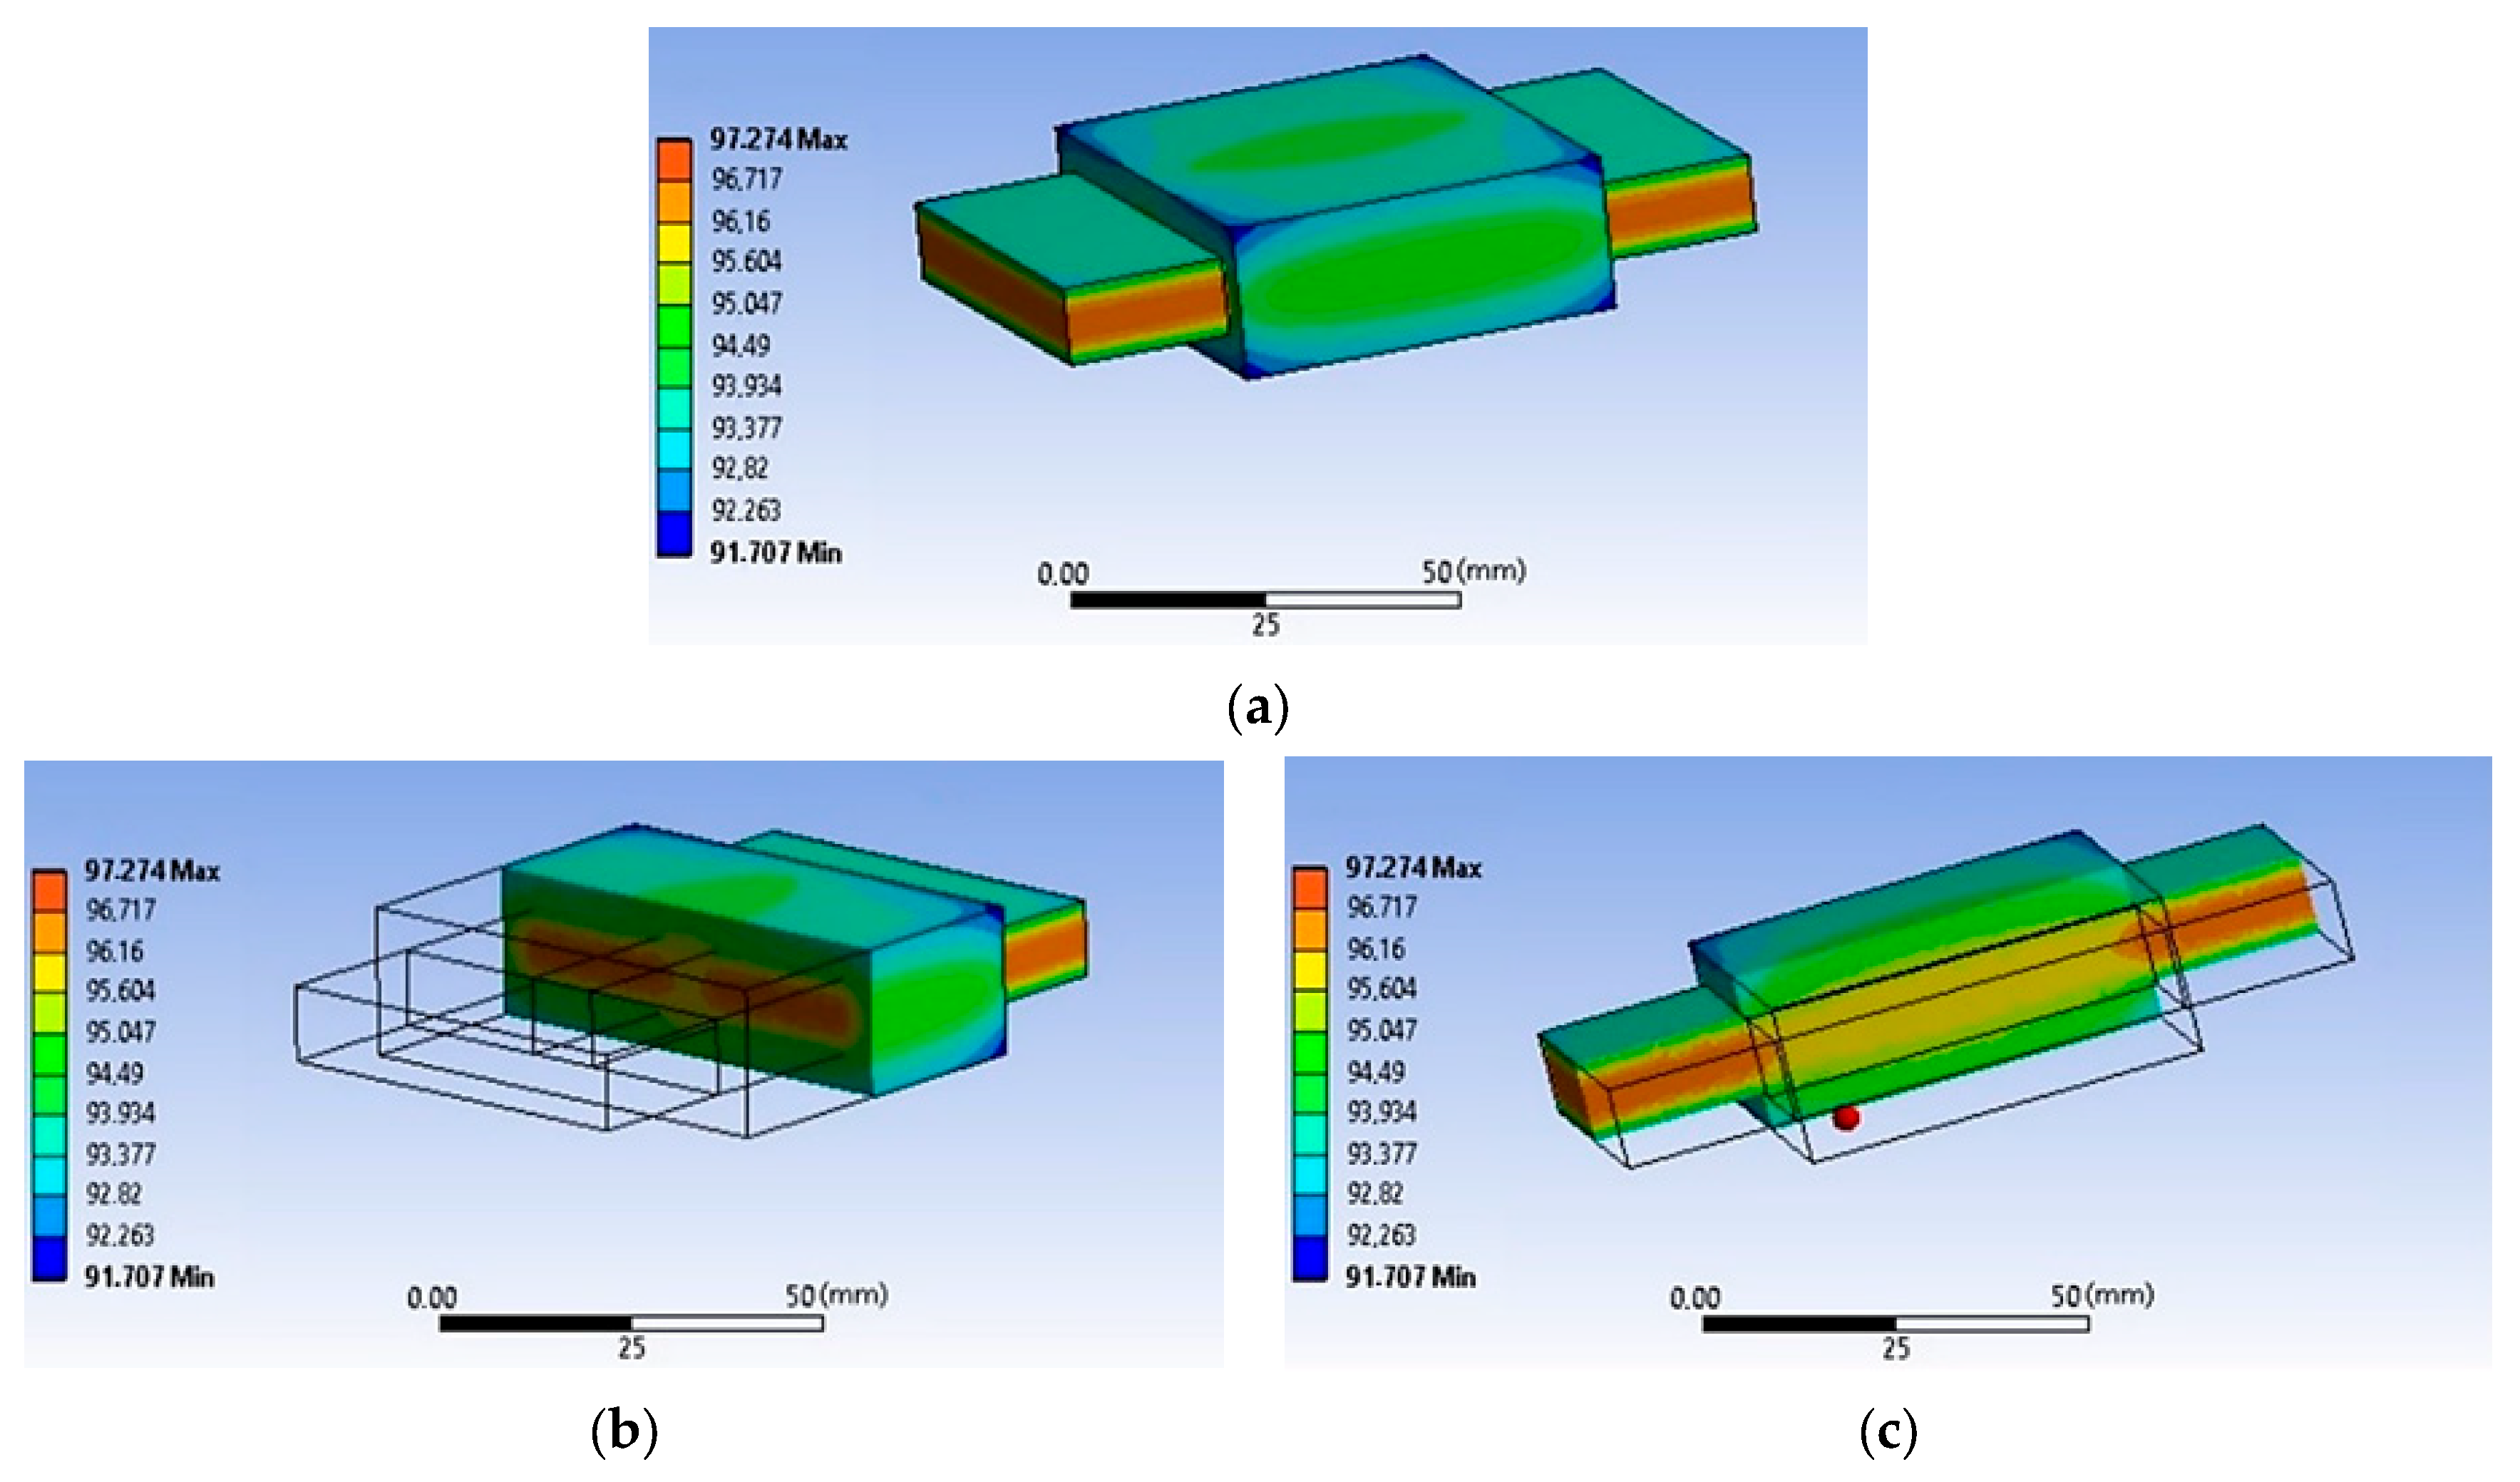
Figure 3 presents the computed thermal distribution. Figure 3a presents the thermal distribution on the external surface of the planar transformer. Figure 3b,c show the temperature inside the transformer along two cutting planes.
The temperature inside the transformer is quite homogenous. Indeed, temperature is between 91.7 °C and 97.3 °C. Compared to HF wound components, the temperature distribution is more homogenous in planar magnetics, as shown in [4]. Such temperature distribution (Figure 3) clearly justifies the use of equivalent thermal resistance for fast estimation of temperature rise (1). In a planar transformer design process, losses can be non-uniform in the winding, but in a steady state, the temperature of the winding is quite homogenous thanks to the significant area-to-volume ratio. Then, the difference between the temperature with uniform losses and non-uniform winding losses is small. This hypothesis is valid for natural convection cooling, which is the subject of this paper. For liquid-cooled transformers, a strong gradient of temperature can appear.
This example (Figure 3) is consistent with planar transformers with reduced core air gap. Losses are uniformly distributed inside the component. This hypothesis is important. In general, the same hypothesis is considered when designing magnetics. If the losses are not uniform in the component, more complex models with electro-thermal coupling are needed. In the following, this uniform loss distribution hypothesis will be kept. The air gap (Figure 1) between E parts or E and PLT is negligible.

2.3. Impact of Parameters on the Planar Component Temperature Distribution

In this section, the impact of layer thickness and loss repartition on the temperature distribution is discussed. A E/PLT58 core-based planar transformer, with 10 layers, serves as an example for the analysis and comparison. The transformer temperature distribution is computed with FEA [17].
First, the impact of the insulator thickness is studied. The conductors’ thickness is fixed to 0.2 mm while their width is 4 mm. Three insulator thickness values (0.2 mm, 0.3 mm, and 0.4 mm) are tested (Table 2). The thermal conductivity is 380 W·m−2·K−1 for the copper tracks and 0.15 W·m−2·K−1 for the insulating layers. Only a quarter of the transformer is simulated thanks to the symmetry (Figure 4). The copper and core losses are both equal to 1.5 W for the transformer quarter.
The analysis of these test cases shows a limited impact on the temperature distribution, as illustrated in Figure 4. The maximal temperature value presents a small variation (less than 1 °C). Then, the hypothesis of using a fixed value for the winding equivalent thermal conductivity can be justified. This hypothesis is only valid for a well-built transformer with a good thermal coupling between winding and core (i.e., with a thermal interface material to fill the window area). In the case of liquid-cooled or other strong cooling systems, the variation of the conductivity can have a more significant impact.
Then, the impact of the loss distribution between the core and the winding is also studied. Based on the case 1 (Table 2), with 0.2 mm for the copper and the insulator thicknesses, three other cases have been studied:
  • Case 4, where the total losses are localized in the core;
  • Case 5, where the losses are split between the core and the winding;
  • Case 6, where the losses are localized only in the winding.
From Table 3, one can say that the loss distribution between the transformer parts also has a limited impact. Indeed, the difference in the maximal temperature is lower than 4.4 °C. In the worst case, where the total losses are localized in the winding (case 6), only an error of 6% is induced, compared to the reference case where the losses are equally distributed between the core and the winding (case 5). This error is reduced to 3.6% when the losses are localized only inside the core (case 4) because it is more exposed to the air compared to the winding. This last case will be used, in this paper, for the experimental validation. Then, using the hypothesis of equally distributed losses between core and winding can be justified.

2.4. Comparison of Planar Magnetic Core Thermal Resistance Modeling

As mentioned in the introduction, some thermal resistance models are available in the literature [2,8,9,10,11,12,13,14]. Some of these models are specific for the design of planar magnetics while others are more generic for the design of HF wound magnetics. Most of these models are only based on the geometrical dimensions of the core: external area (Aext) and effective volume (Ve). Some also consider the power losses inside the magnetic device. Table 4 lists these different models that are reviewed in [16].
In order to compare these different models, a maximal power loss value (Pmax) is defined according to the E/PLT and EE core size, to limit the temperature rise to 80 °C inside the planar component. These values are reported in Table 5. In the next sections, all the models will be evaluated on a power range from 1 W to Pmax.
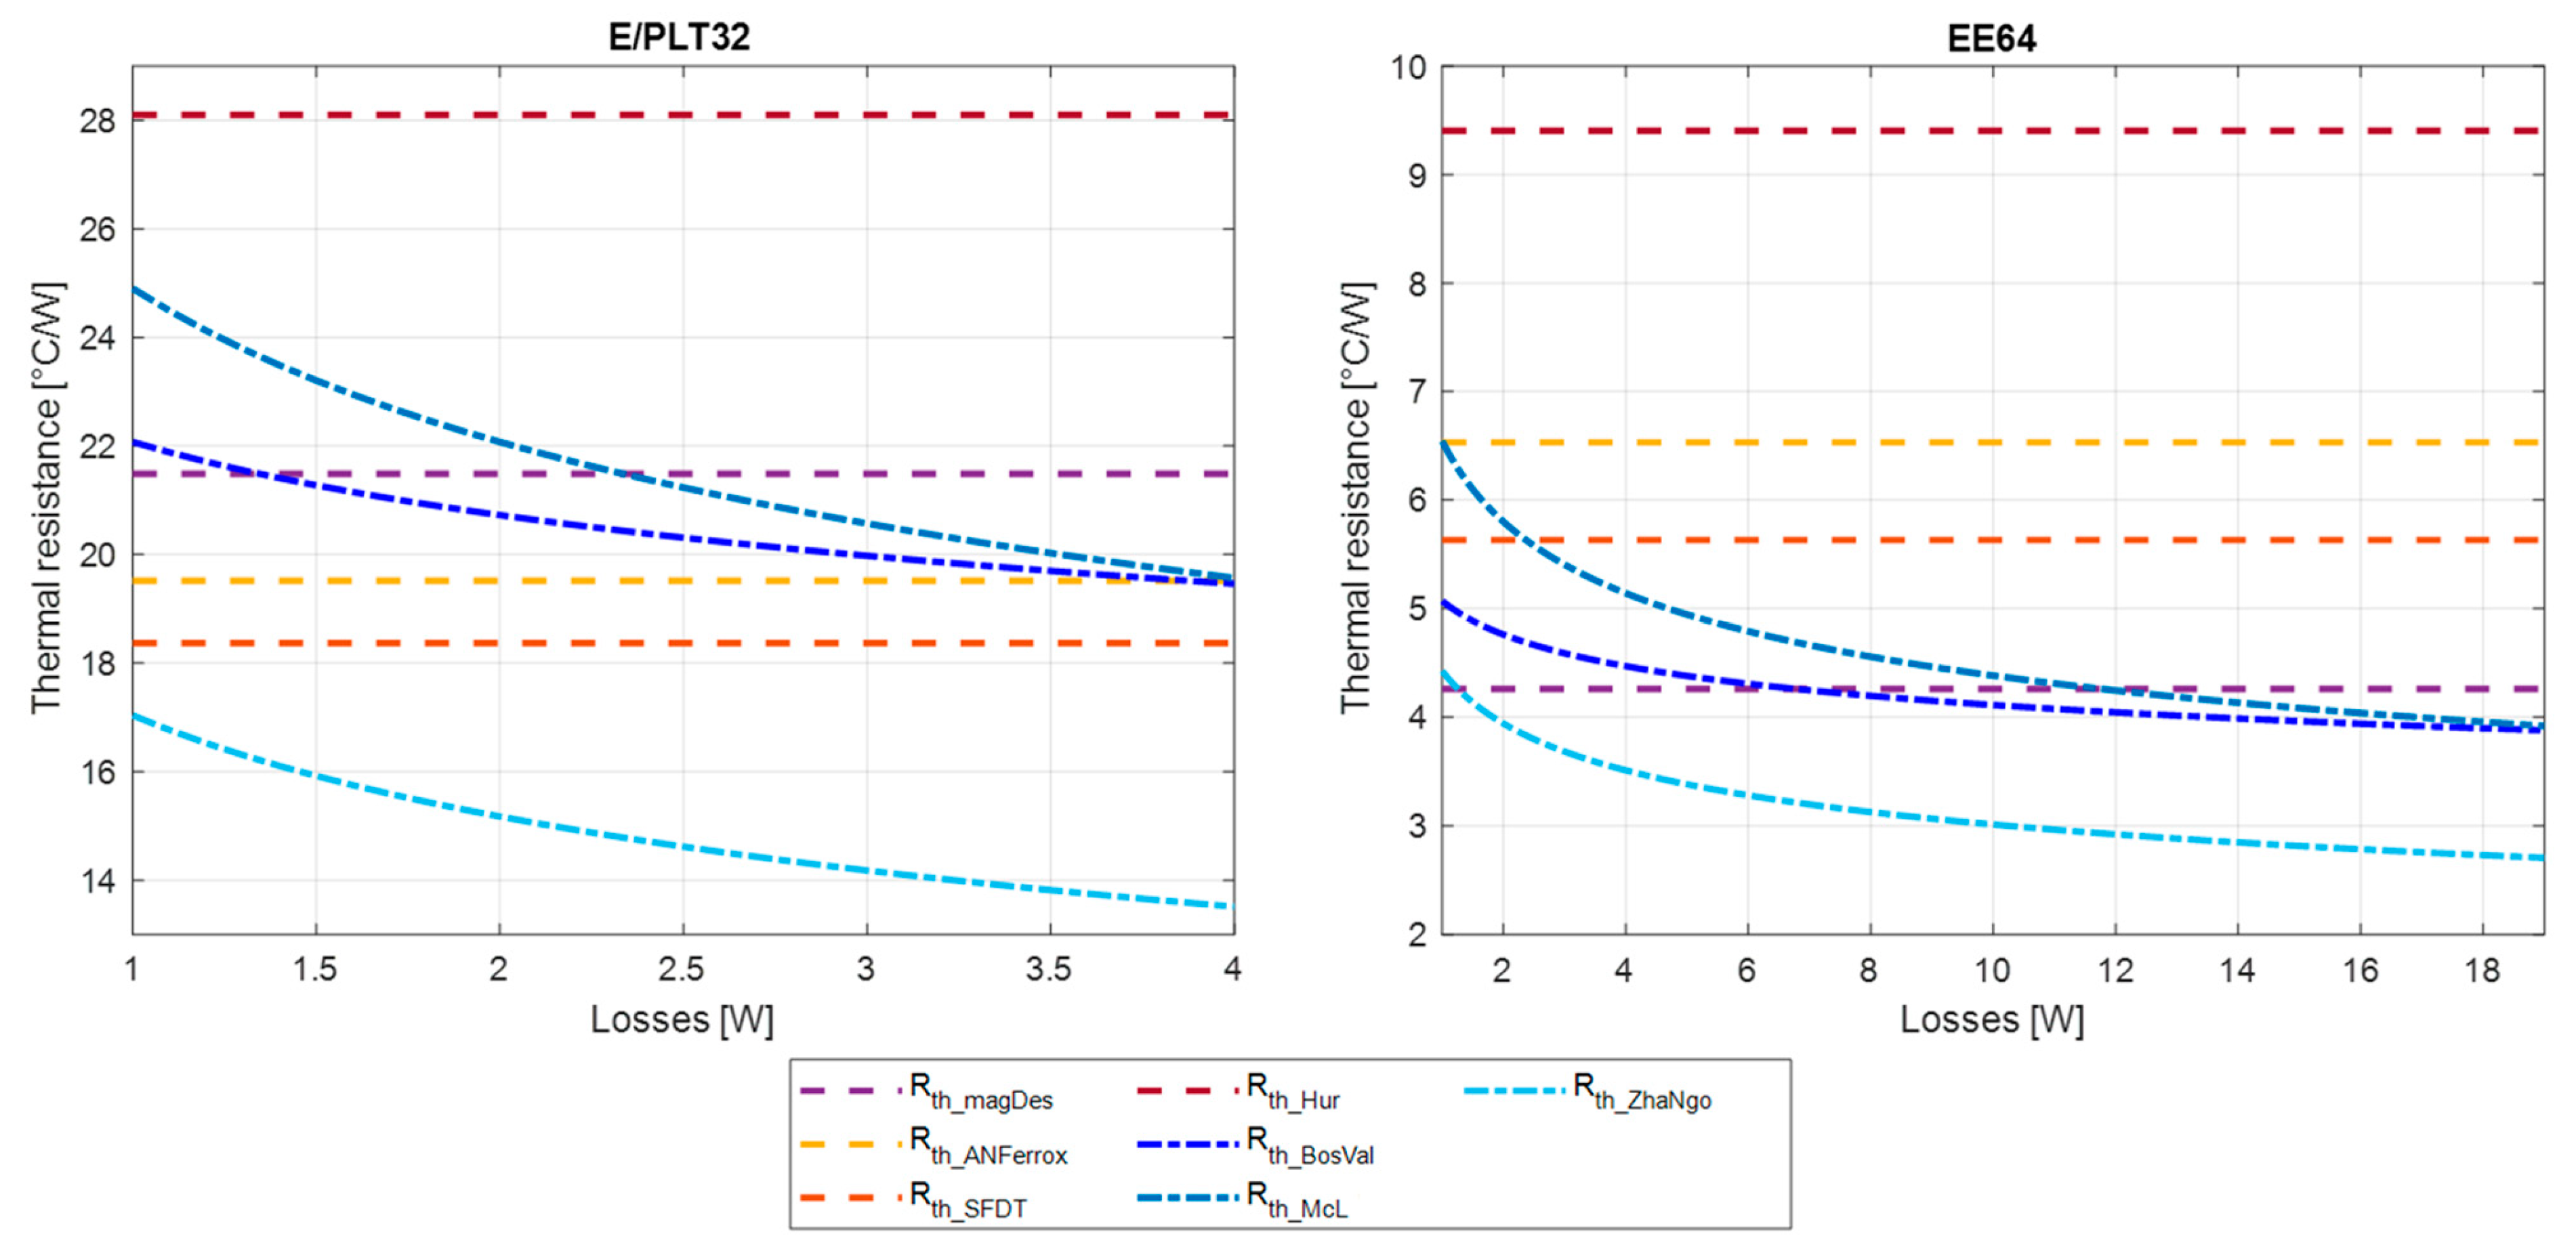
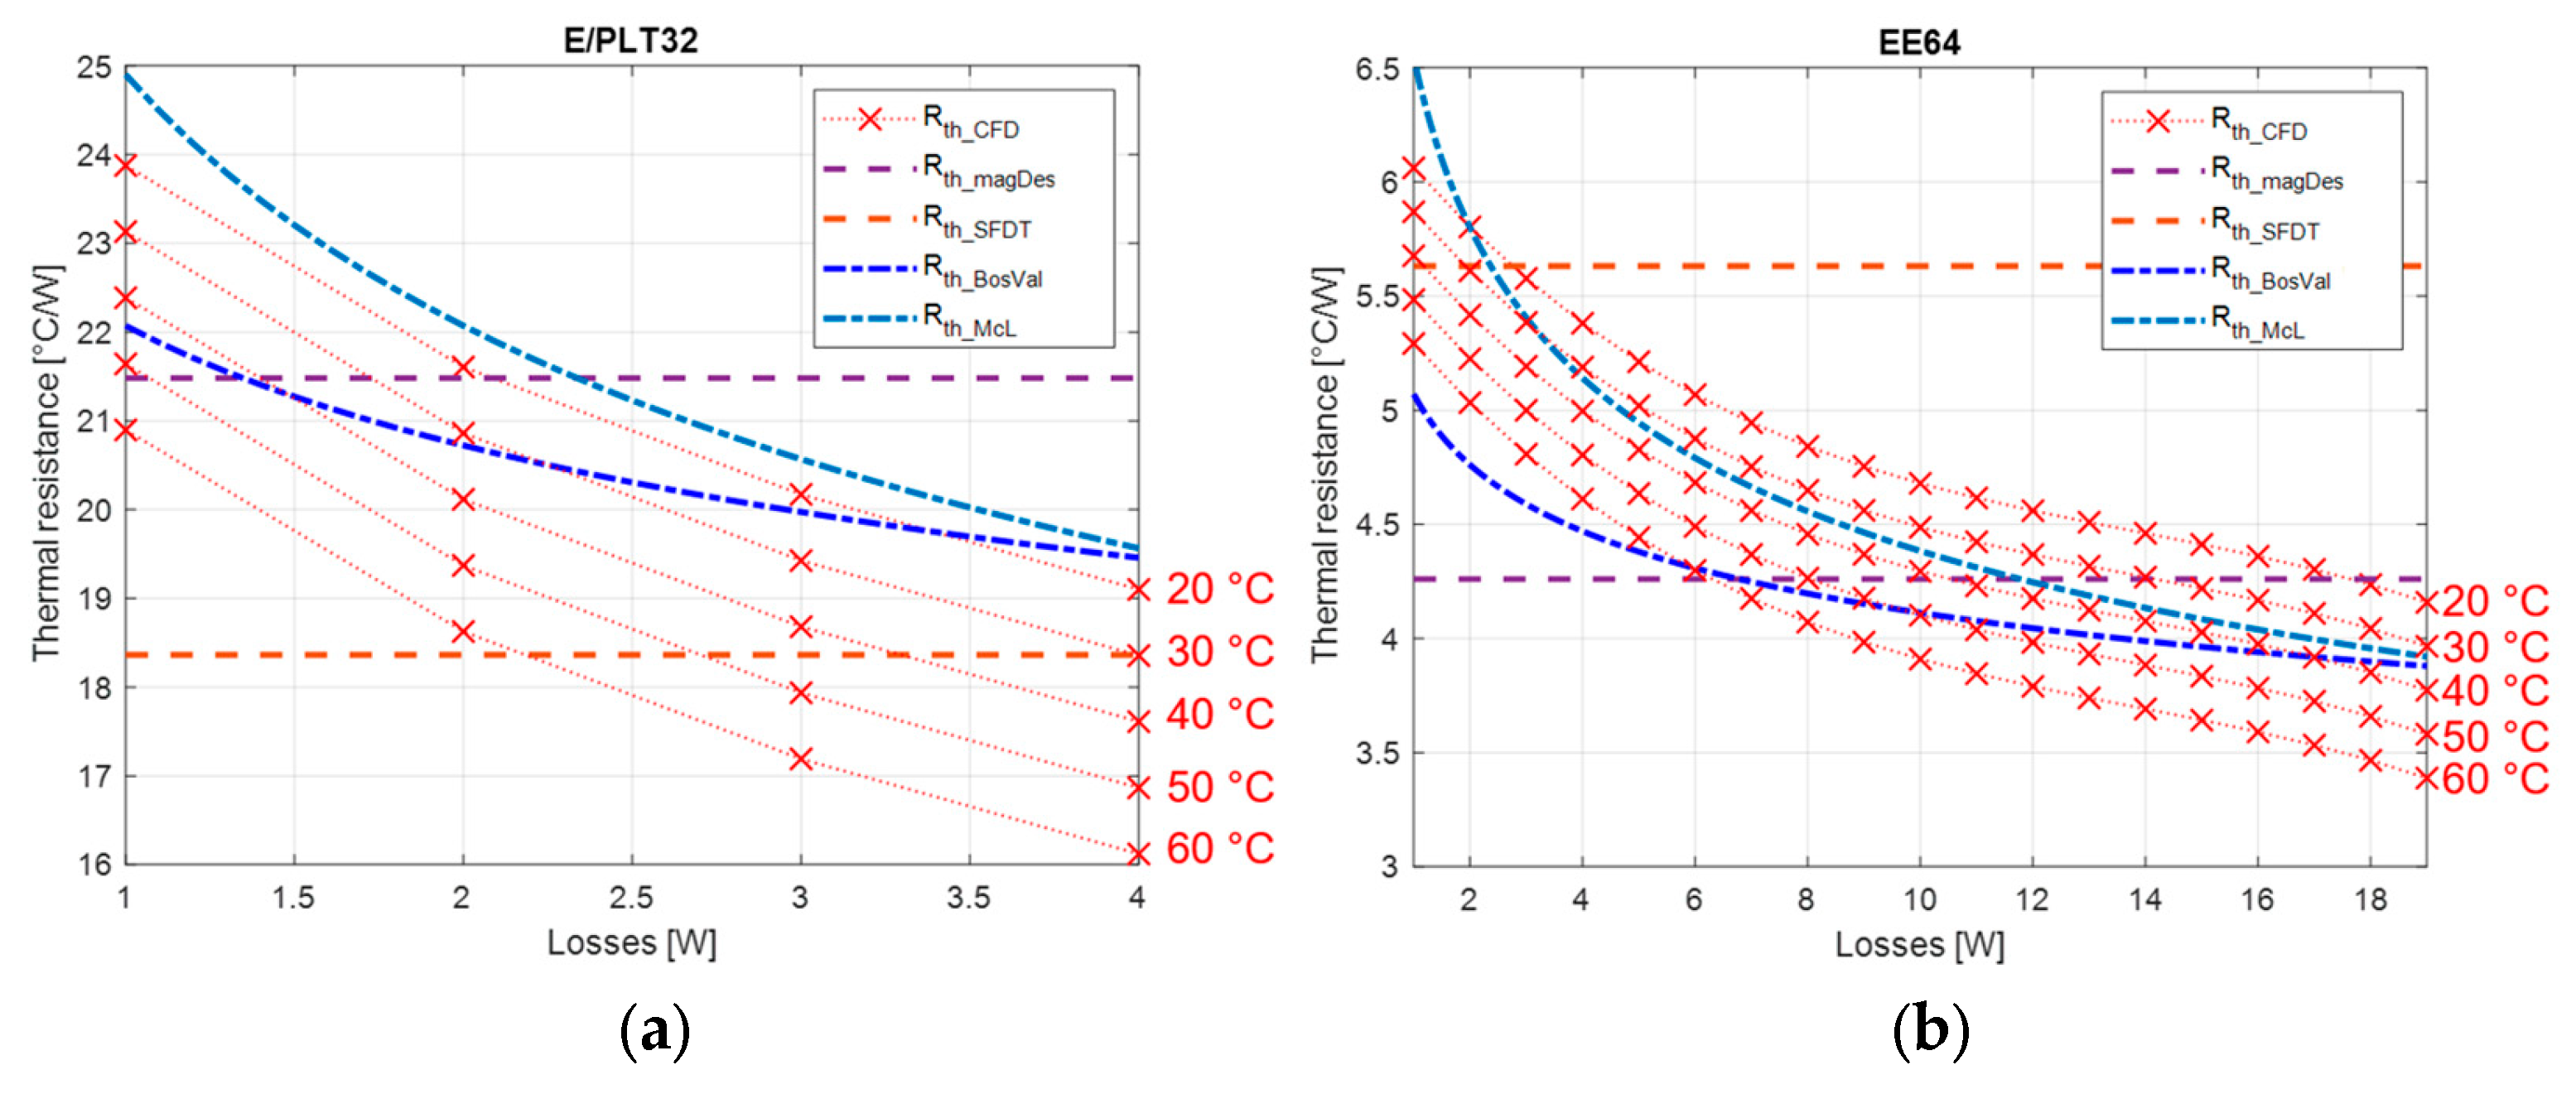
The thermal resistance models (Table 4) are compared, in Figure 5, for E/PLT32 and EE64 planar cores.
For E/PLT32, thermal resistance values vary from 17 °C/W ( R t h _ Z h a N g o ) to 28 °C/W ( R t h _ H u r ) for 1 W losses while for 4 W, models give values between 13.5 °C/W ( R t h _ Z h a N g o ) and 28 °C/W ( R t h _ H u r ). For EE64, values are between 4.2 °C/W ( R t h _ m a g D e s ) and 9.4 °C/W ( R t h _ H u r ) for 1 W losses while for 19 W, models give values between 2.7 °C/W ( R t h _ Z h a N g o ) and 9.4 °C/W ( R t h _ H u r ). These values can lead to significant differences in temperature estimations. As an example, for the E/PLT32 core, both models give an 11 °C difference for 1 W and 58 °C for 4 W. For the EE64, these values are, respectively, 5.2 °C and 127 °C. The range variation in the models is wide and can lead to significant errors in the thermal design of planar magnetics.
Four of the presented models are constant with losses. The three others decrease as the power losses increase. None vary with ambient temperature.
In the following, a CFD study of E/PLT and EE planar cores is performed. The goal is to examine variations in thermal resistance according to power losses and ambient temperature. The results will be compared to four models from the literature: R t h _ m a g D e s , R t h _ S F D T , R t h _ B o s V a l and R t h _ M c L .

3. Study of Thermal Resistance Variation According to Power Losses and Ambient Temperature

In this section, the thermal resistance variation in E/PLT and EE planar cores is studied with CFD simulations.

3.1. Study Methodology

For each planar core, CFD simulations are performed according to both parameters:
  • The total losses (Pd) that vary from 1 W to Pmax (Table 5) by step of 1 W;
  • The ambient temperature (Tamb) that takes discrete values: 20 °C, 30 °C, 40 °C, 50 °C and 60 °C.
For each simulation, the thermal resistance value (2) is calculated from the extracted maximal temperature (Tmax), obtained in steady-state:
R t h P d , T a = T m a x T a P d
Each E/PLT and EE core-based planar device is modeled according to their core dimensions [15] and considering the winding length outside the core to be equal to the width of the winding window. The gaps between windings and magnetic core are set according to the dimensions shown in Figure 6.

3.2. CFD Simulation Parameters

The geometry of the problem is described with Ansys Icepack [17]. Fluent is used to solve the CFD equations. In order to obtain valid results, some modeling parameters need to be set.
As mentioned in Section 2.2, planar windings are supposed to be homogeneous, and thermal conductivities listed in Table 1 are applied to CFD modeling. Regarding emissivity, ferrite, and winding ones are fixed to typical values, 0.9 and 0.45, respectively.
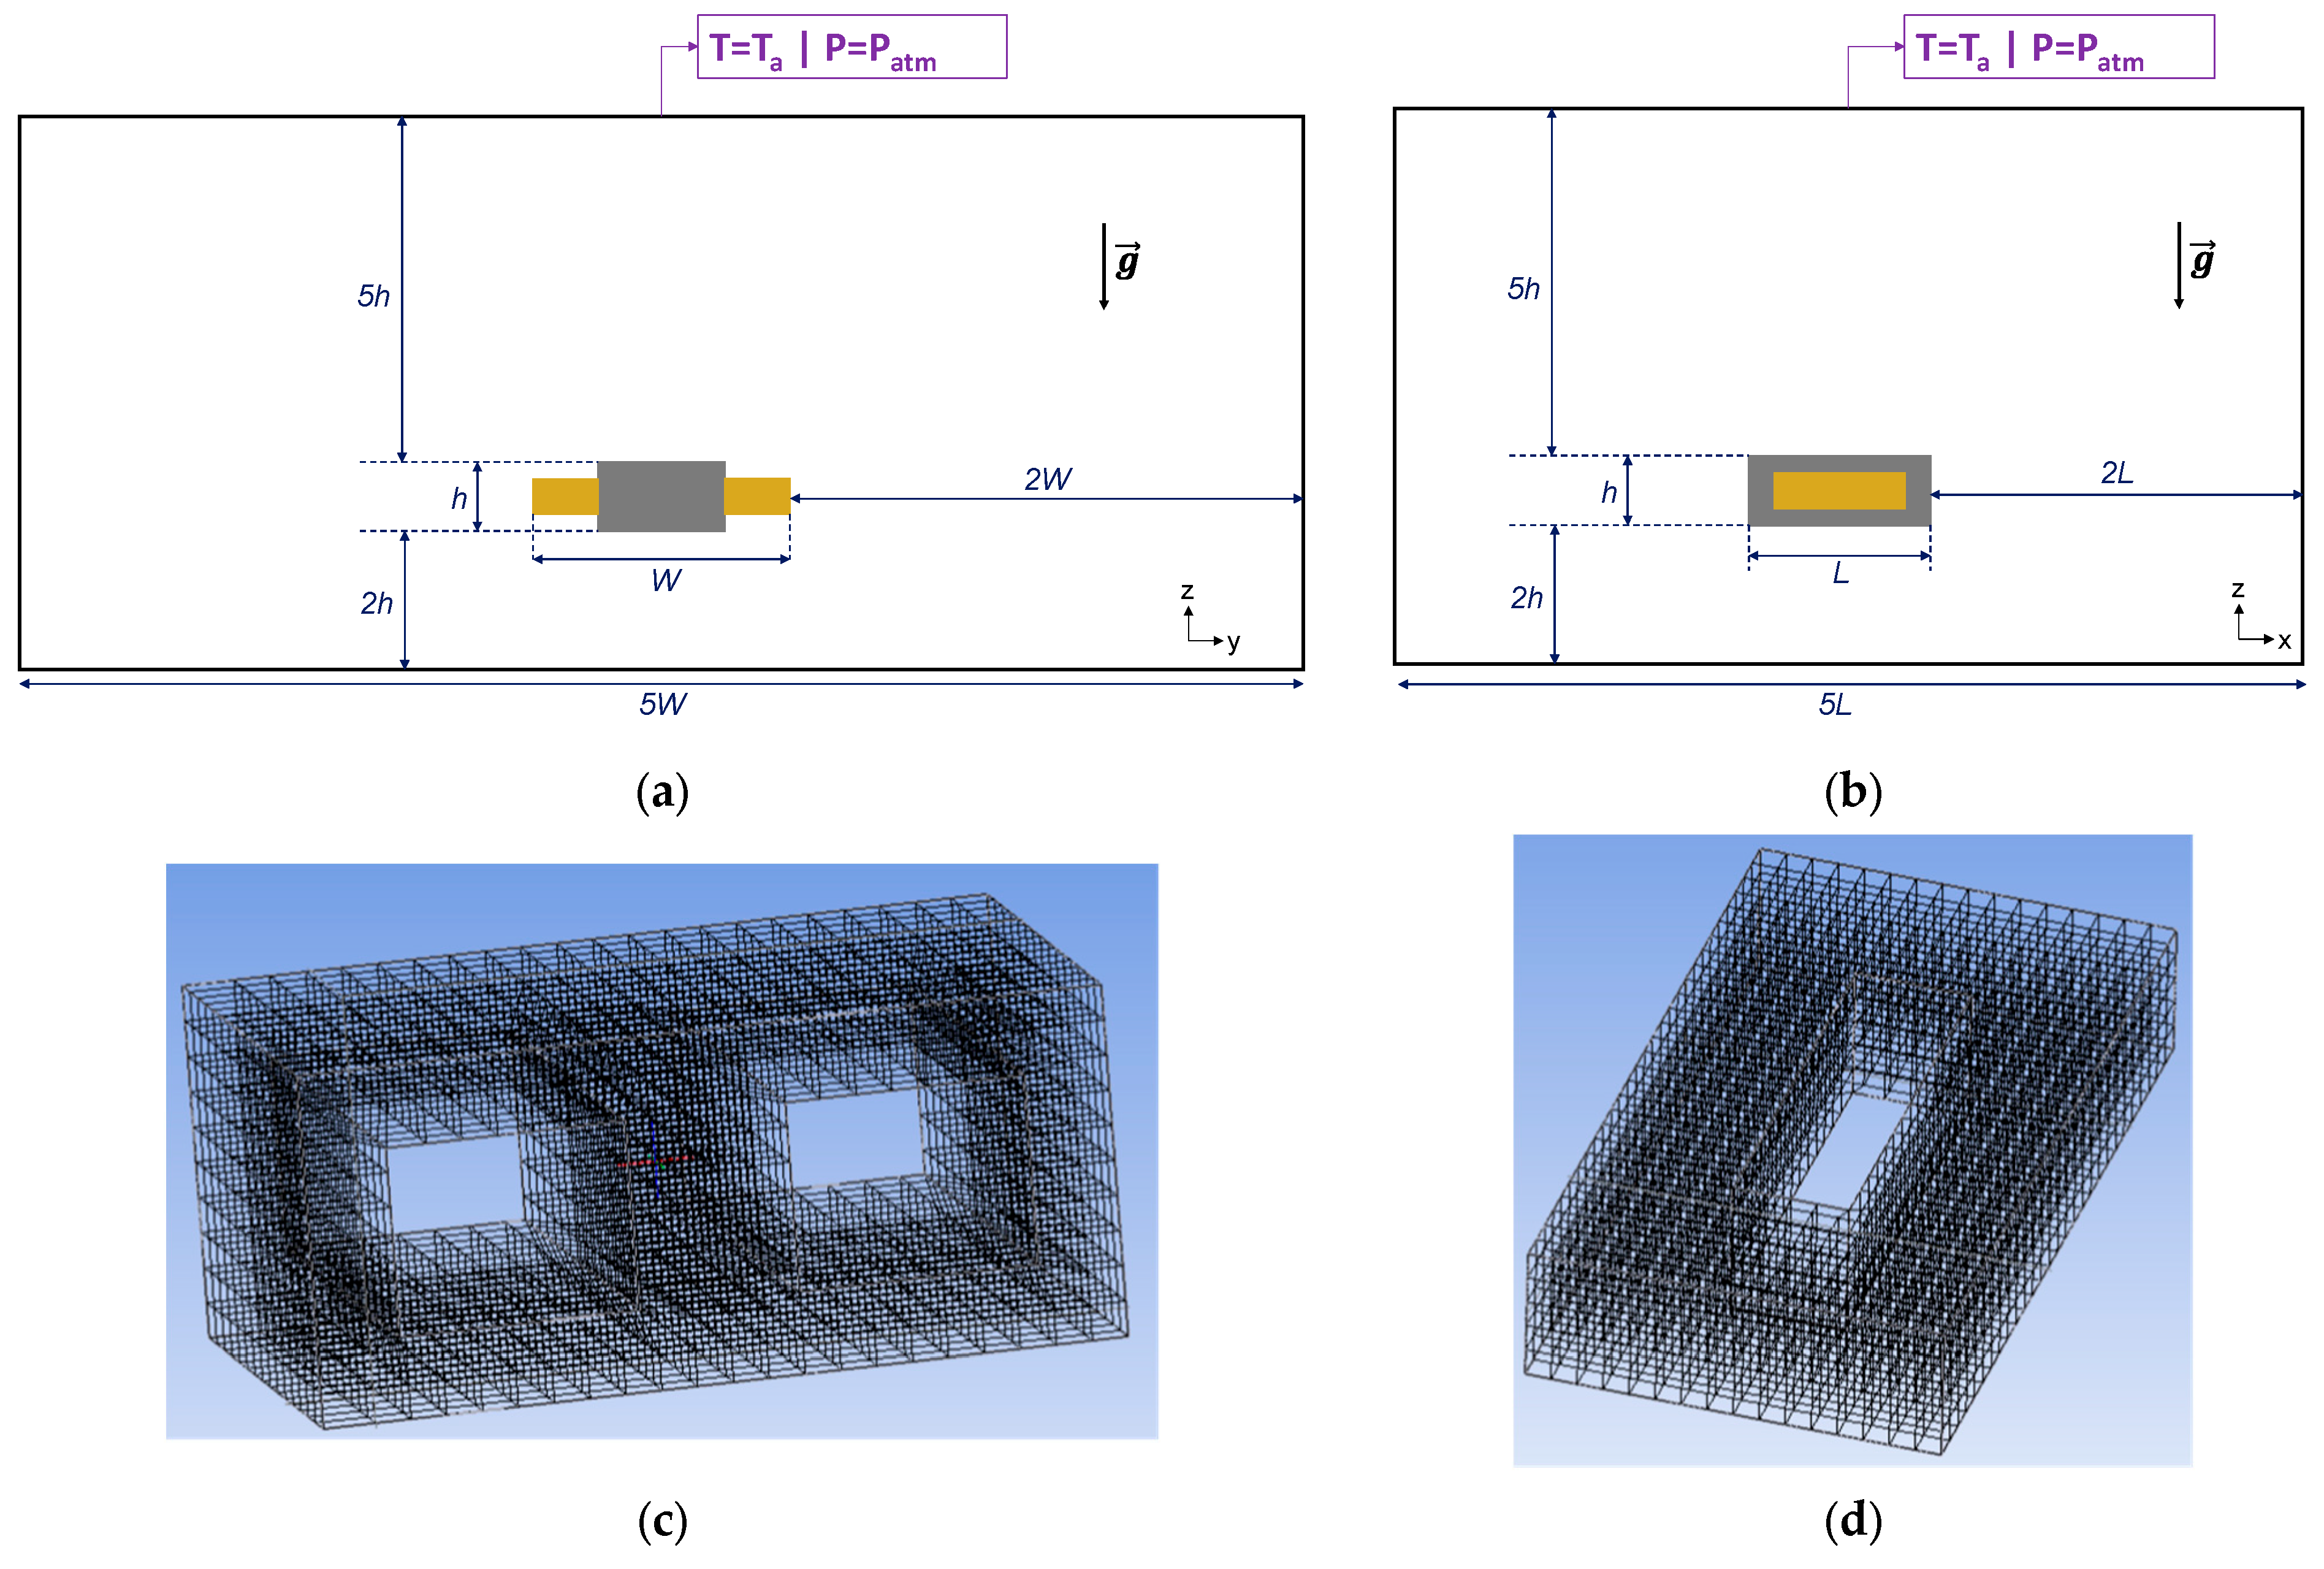
In natural convection, the simulation domain needs to be carefully set. In this study, the domain is filled with air. It needs to be large enough to allow air movement while avoiding reverse flow [21]. Figure 7a,b present a simulation domain that varies with the component’s size. Two boundary conditions (BC) are fixed:
  • Temperature of the external area of the domain is fixed to Ta.
  • Air pressure is set to atmospheric pressure: P a t m = 10 5   P a
The CFD simulation meshing is a key point of modeling. Indeed, fluid equations are nonlinear, and they can lead to convergence difficulties. Here, the mesh is hexahedral (cartesian). Figure 7c,d present mesh for both parts of the component: magnetic core (Figure 7c) and winding (Figure 7d). As an example, the size of the mesh is set to 648,358 elements for the smallest core (E/PLT32) while it is expanded to 5,954,862 elements for the biggest one (EE64). Computation time varies from 30 min to 4 h for one operating point.
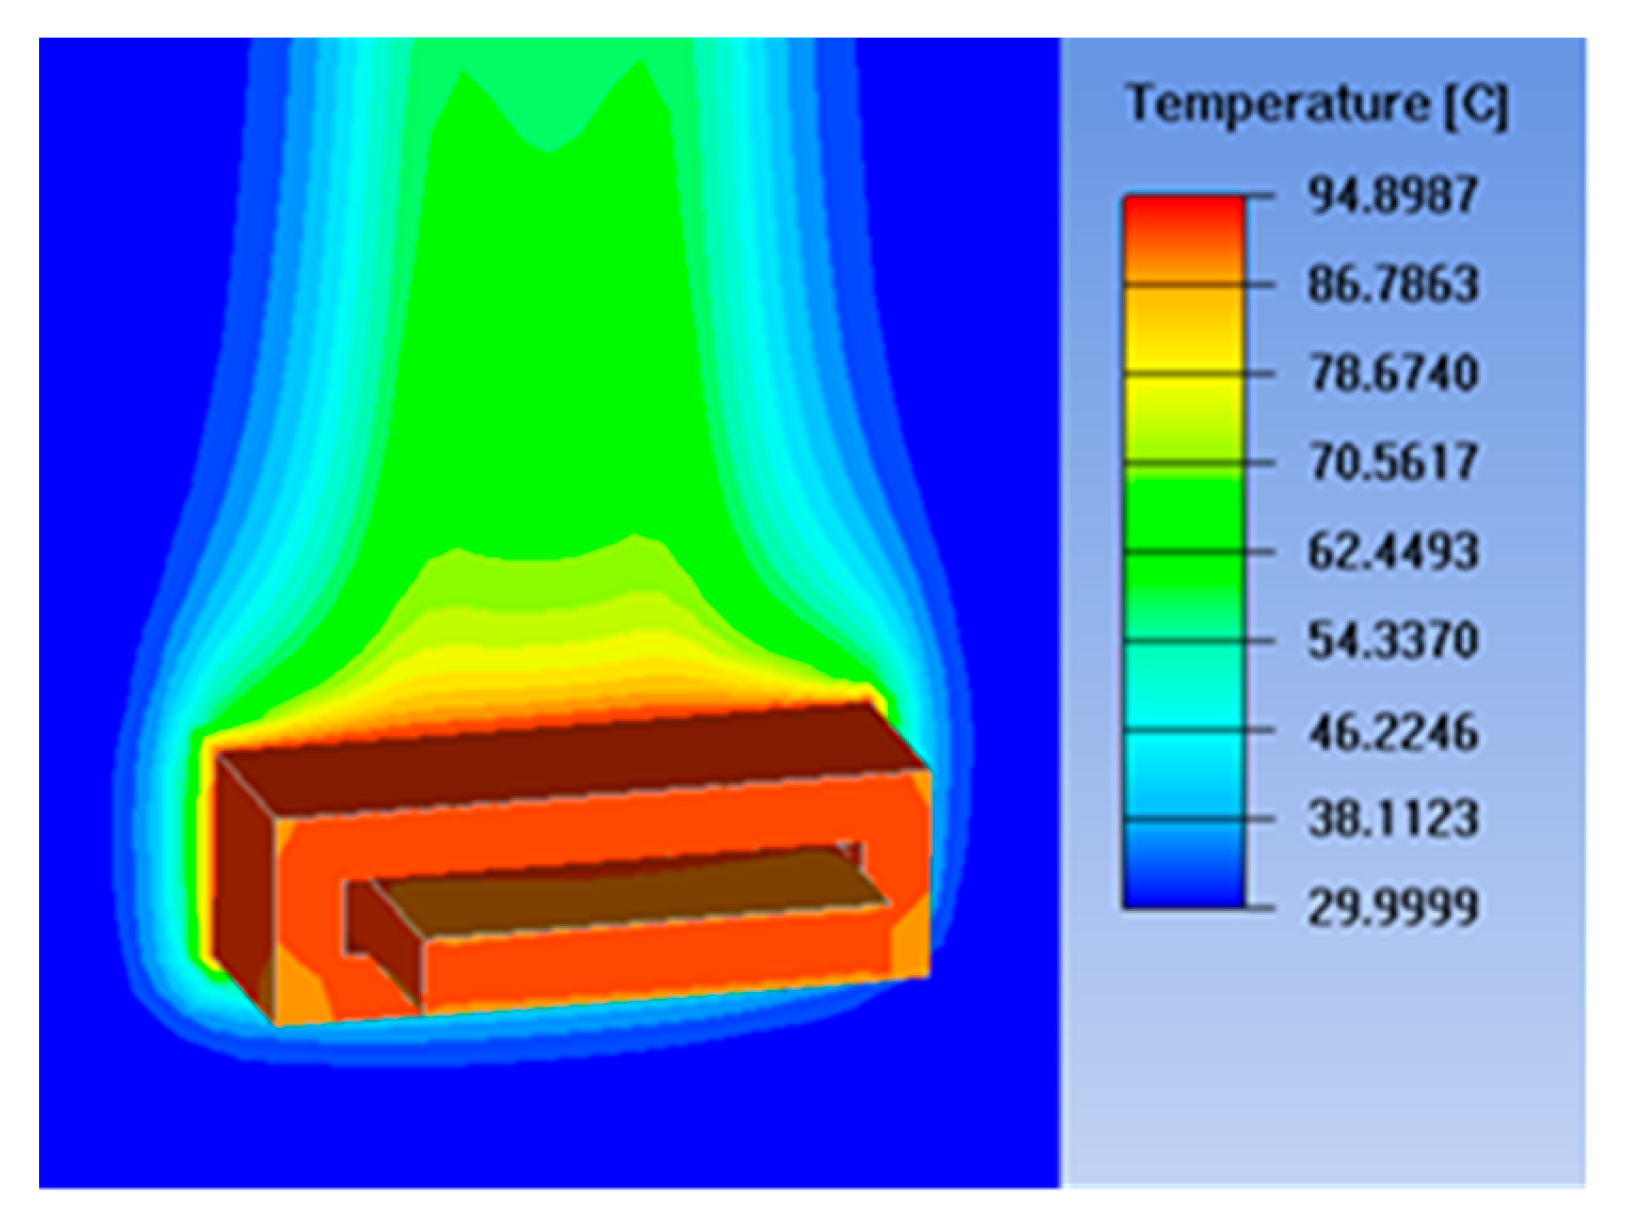
CFD equations are solved based on the finite volume method (FVM) [22]. Figure 8 shows an example of temperature distribution computed for an E/PLT38 core with Pd = 6 W and Ta = 30 °C. In this figure, it could be noticed that the air movement is due to temperature gradient. Indeed, the hot air is rising, and the cool air is falling. Then, the air above the transformer is hotter and, conversely, the air at the bottom is cooler.

3.3. Results and Analysis

Figure 9 presents the thermal resistance variations, obtained with CFD, for both cores E/PLT32 (Figure 9a) and EE64 (Figure 9b). These variations are plotted according to power losses and ambient temperature. As mentioned before, the results are compared to four models from the literature: R t h _ m a g D e s , R t h _ S F D T , R t h _ B o s V a l and R t h _ M c L .
Looking at the curves, two main comments can be made: the planar component thermal resistances decrease when power losses increase. Their values also decrease with the rise in the ambient temperature. These comments are the same for all the other sizes of E/PLT and EE planar cores.
For the E/PLT32 core (Figure 9a), thermal resistance values decrease from 23.8 °C/W to 19.1 °C/W for 20 °C ambient temperature and losses that vary from 1 W to 4 W. At 60 °C, values are between 20.9 °C/W and 16.1 °C/W. For the EE64 core (Figure 9b), values are much smaller. While losses vary from 1 W to 19 W, the thermal resistance values decrease from 6 °C/W to 4.1 °C/W at 20 °C. For a 60 °C ambient temperature, values are between 5.3 °C/W and 3.4 °C/W.
In order to explain those variations, the evolution of convection and radiation global heat transfer coefficients, computed for all the external areas of the component with losses and ambient temperature, is plotted in Figure 10a,b, respectively. From Figure 10a, it can be seen that both heat exchange coefficients increase with losses and so the thermal resistance decreases. For the variation due to the ambient temperature increase (Figure 10b), the convection heat exchange coefficient decreases while the radiation heat coefficient increases. The latter has a greater slope, so the resulting global heat exchange coefficient has a positive slope, increasing with ambient temperature. As a consequence, the thermal resistance also decreases with this parameter.
Comparisons between CFD simulation results and the ones computed from the literature’s model (Figure 9) show that values are at the same level of magnitude. However, variations due to the power losses and ambient temperature induce significant differences that can lead to errors in the operating temperature estimation of a real component. If the temperature is underestimated (i.e., thermal resistance is undervalued), excessive heating can appear inside the component and can cause its destruction. On the opposite side, if the temperature is overestimated (i.e., thermal resistance is overstated), one component’s design can be distorted. As a consequence, some design solutions can be replaced even if it was fully able to endure the constraints of the system.
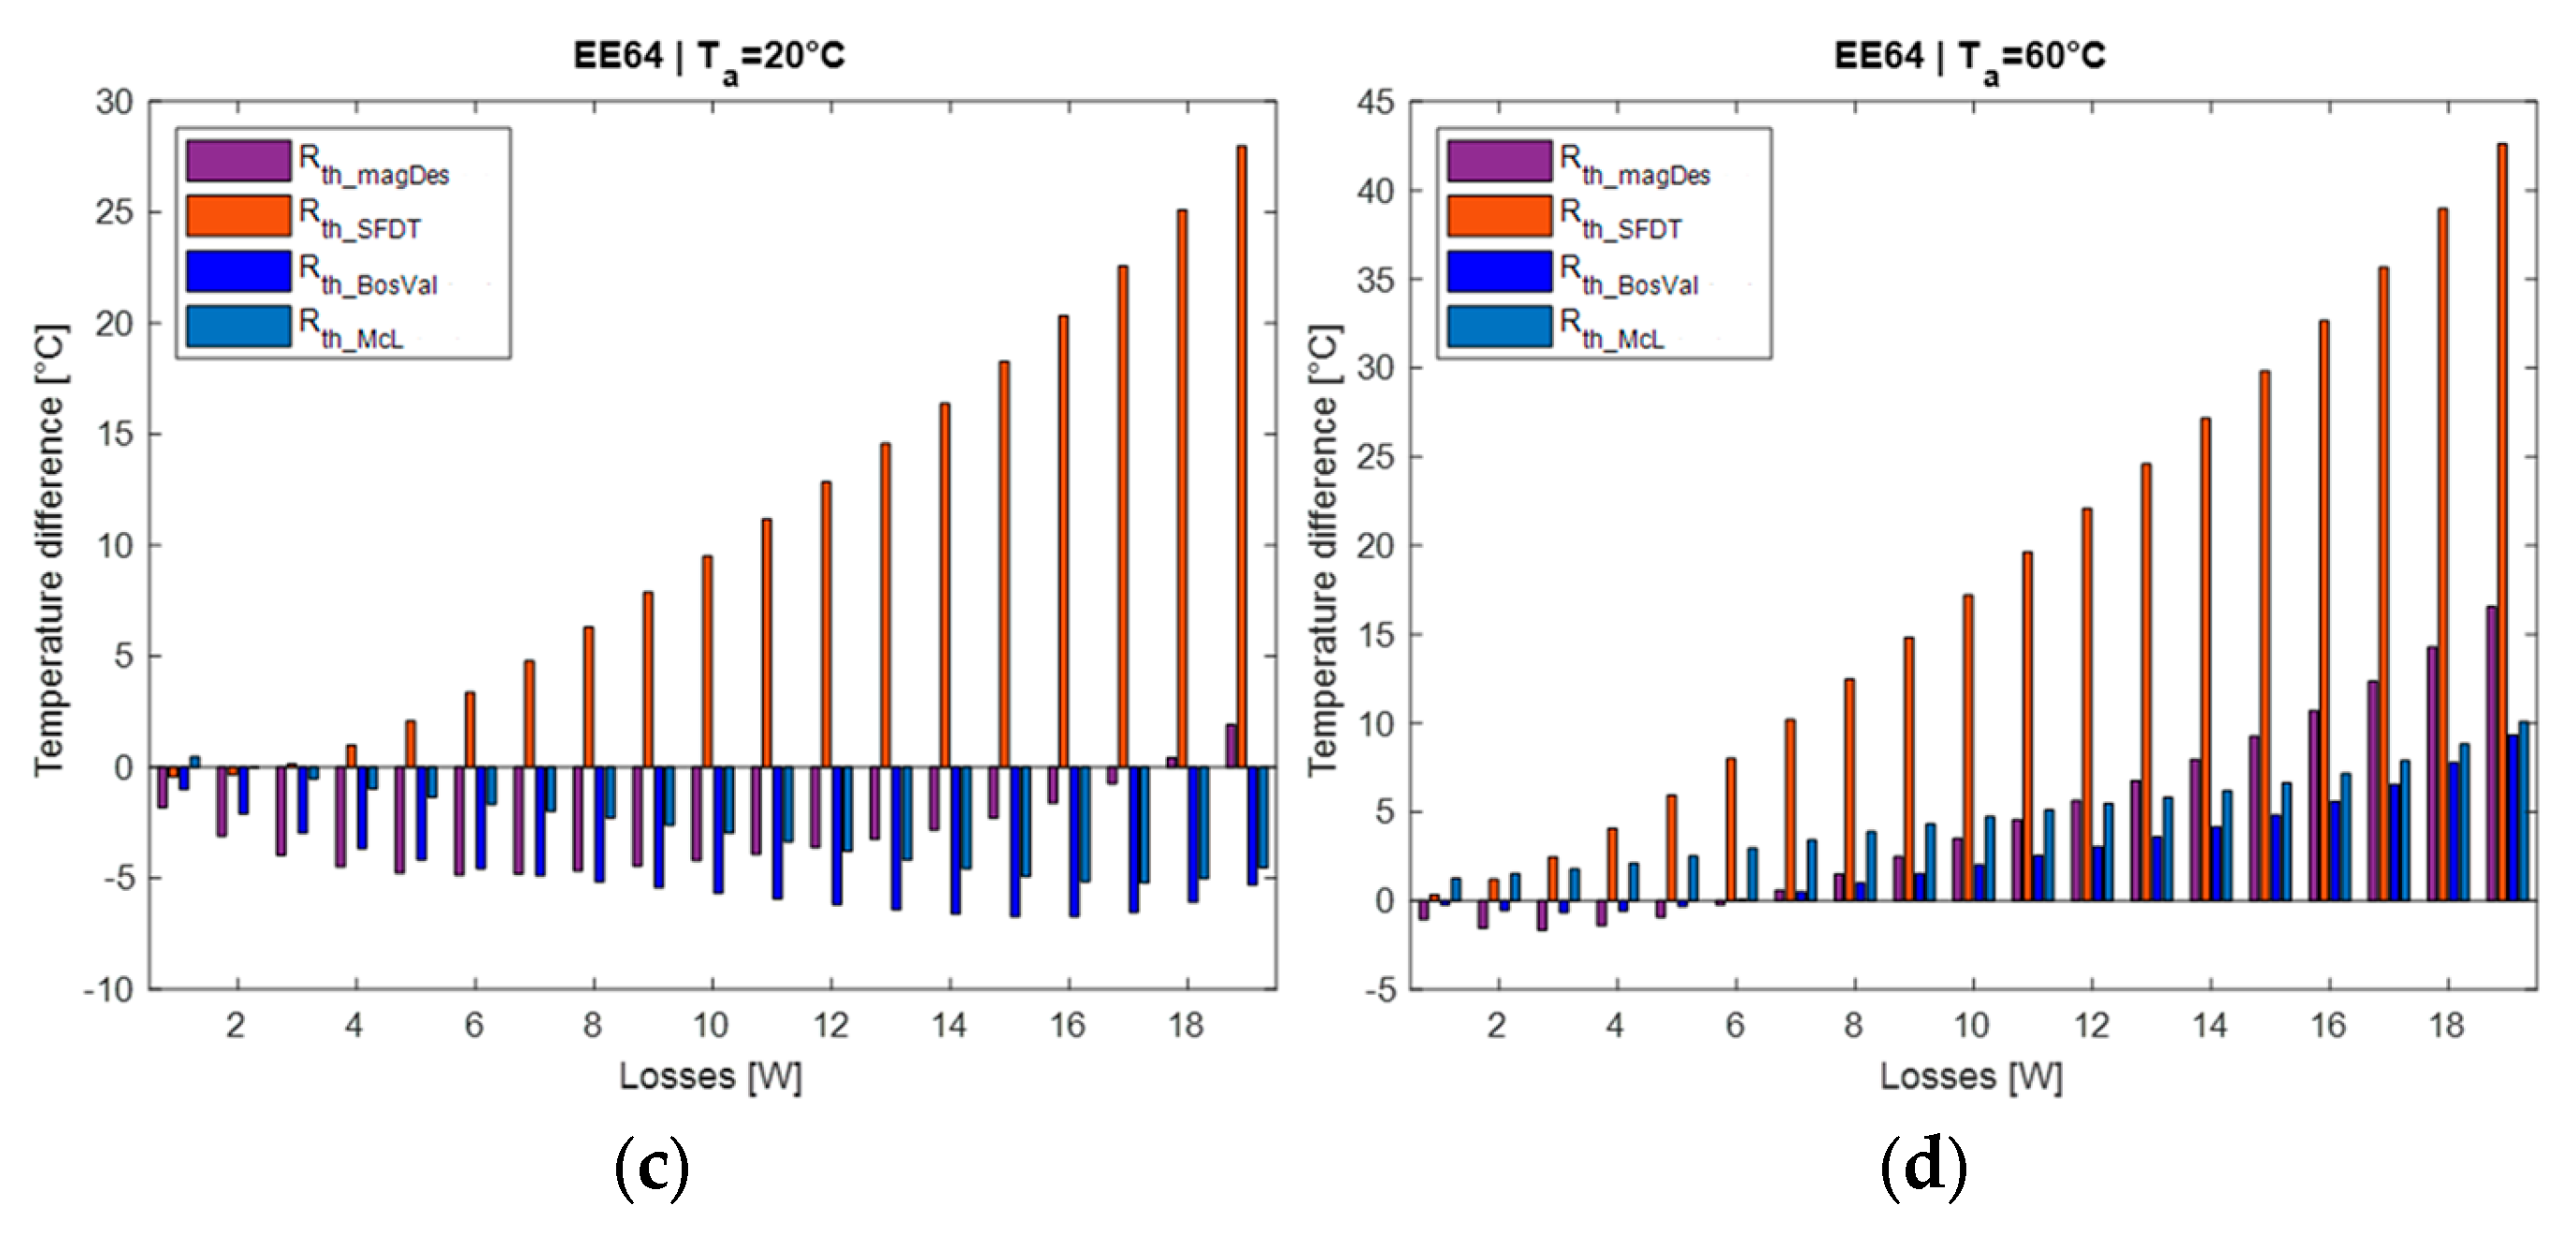
In order to highlight the benefits of such a thermal resistance model that considers power losses and ambient temperature, the temperature differences obtained with models from the literature and results from CFD-based simulations are calculated for each value of power losses (3):
T d i f f = R t h _ l i t R t h _ C F D × P d
where R t h _ C F D the thermal resistance computed with CFD simulations, P d the power losses and R t h _ l i t the four different resistances from the literature: R t h _ m a g D e s , R t h _ S F D T , R t h _ B o s V a l and R t h _ M c L .
Temperature differences are displayed in Figure 11 for E/PLT32 and EE64 at 20 °C and 60 °C, to show under and over-estimation of models in comparison with the CFD simulation results. If the temperature difference is negative, models underestimate the component’s temperature and if the difference is positive, models overestimate the temperature.
For a small core (E/PLT32), thermal resistance values are highly disparate. However, due to the small number of losses, temperature differences are limited. At 20 °C (Figure 11a), differences between the model and CFD results are limited in the range of −6.5 °C to 9.2 °C. At 60 °C (Figure 11b), due to the high decrease in the thermal resistance with the ambient temperature, differences rise to be between −2.5 °C and 21.1 °C. This increase leads to a more significant overestimation. For a big core (EE64), differences between models are smaller but the high level of losses induces more important estimated temperature differences. For example, at 20 °C (Figure 11c), the differences are between −7 °C and 27.5 °C while, at 60 °C (Figure 11d), the differences are included between −1.6 °C and 42.1 °C.
Generally, constant models ( R t h _ m a g D e s and R t h _ S F D T ) are close to CFD results but only for a limited power loss variation range. Moreover, the differences increase while the ambient temperature increases. For the two models accounting for power loss variation ( R t h _ B o s V a l and R t h _ M c L ), the ambient temperature’s change induces more important errors in temperature estimation.
This analysis clearly shows the benefits of using a more precise thermal resistance model accounting for power losses and ambient temperature. As it is shown in Figure 9, the latter parameter has a non-negligible impact and can lead to significant overestimation in planar magnetic design. With such models accounting for losses and temperature, the design of a planar component can be performed more precisely avoiding potential destruction of the component if the temperature is underestimated and over-sizing of components in order to endure constraint of the power converter and its environment.

4. Analytical Modeling of Thermal Resistance Variation

In a planar component design process, the use of complex and time-consuming CFD simulations might be problematic. Analytical modeling is generally preferred in order to have fast results, more suitable for design and optimization tasks. For designers, considering the variation in thermal resistance according to power losses and ambient temperature is a major step toward optimized planar components.
In order to make it easy and fast for engineers in their planar components’ developments, analytical modeling of the thermal resistance variation is developed for all the E/PLT and EE planar cores, based on these CFD results.
To model the variation in the thermal resistance according to power losses and ambient temperature, a polynomial equation is adopted (4):
R t h P d , T a = a 3 P d 3 + a 2 P d 2 + a 1 P d + b T a + c
where a 3 , a 2 , a 1 , b , and c are the coefficients to be identified.
Coefficients for each planar E/PLT and EE core are determined from CFD results using regression with the least squares method [23]. The obtained coefficients are listed in Table 6 for the E/PLT cores and in Table 7 for the EE ones. For the different cores, this polynomial modeling is restricted to:
  • Power range: P d 1 W ; P m a x (Table 5);
  • Ambient temperature: T a 20   ° C ; 60   ° C .
In both tables, the b coefficient is negative that is consistent with the drop of thermal resistance with the ambient temperature. Moreover, odd coefficients a 3 and a 1 also have negative values in order to ensure a decrease in thermal resistance with power losses.

5. Validation and Discussion

In this section, the analytical modeling is compared to the CFD simulation results and measurement on a 360 VA E/PLT38 core-based planar transformer. Then, the results are discussed to highlight the benefits of using such a model in a design stage and also its limitations.

5.1. Comparison with CFD Simulation Results

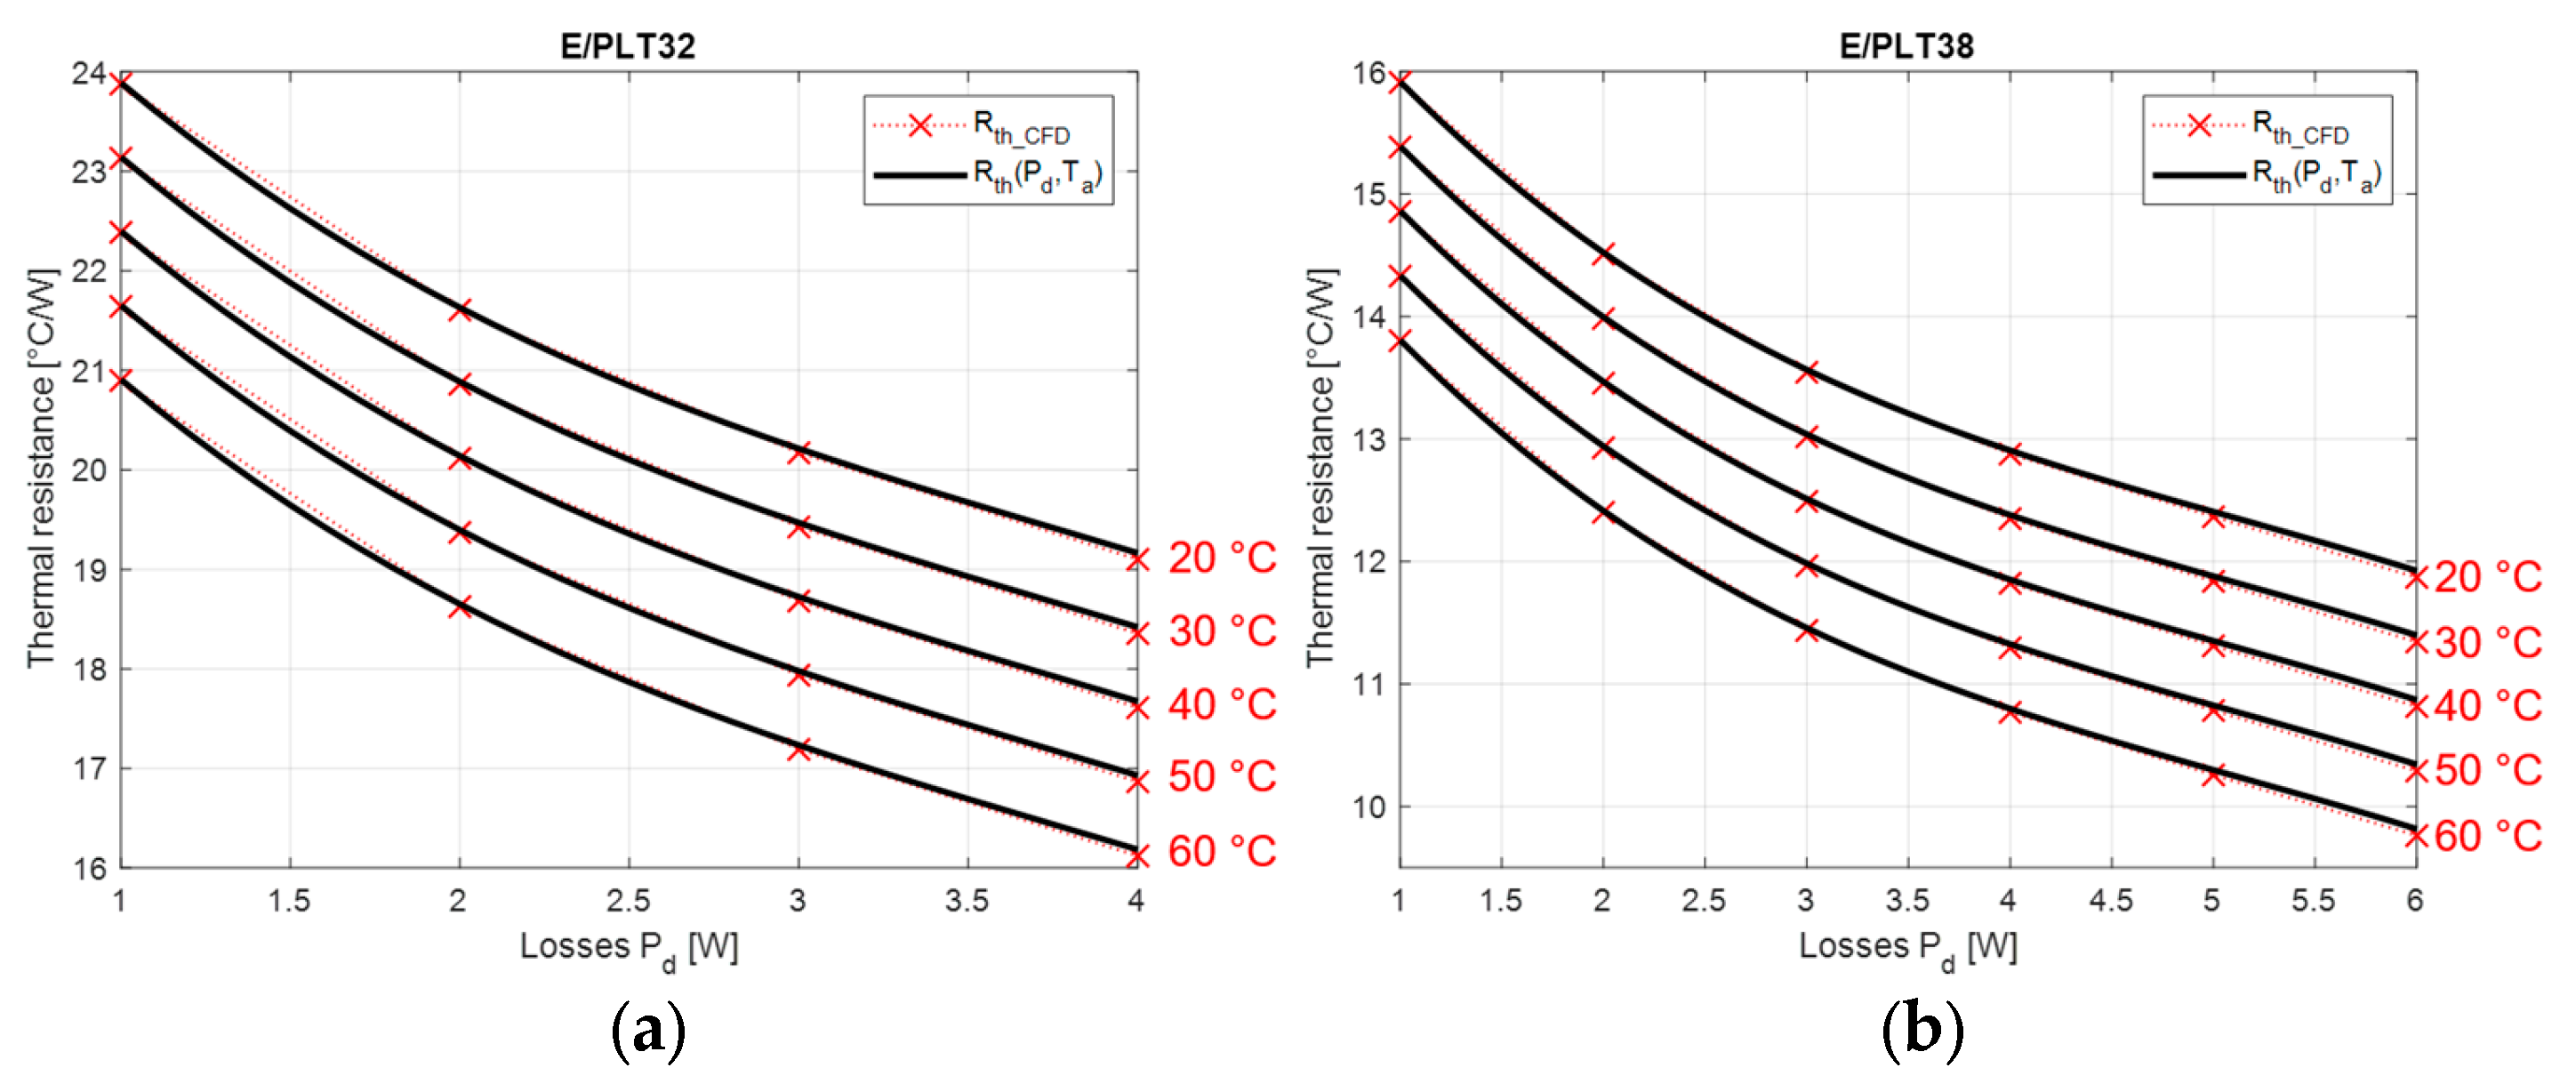
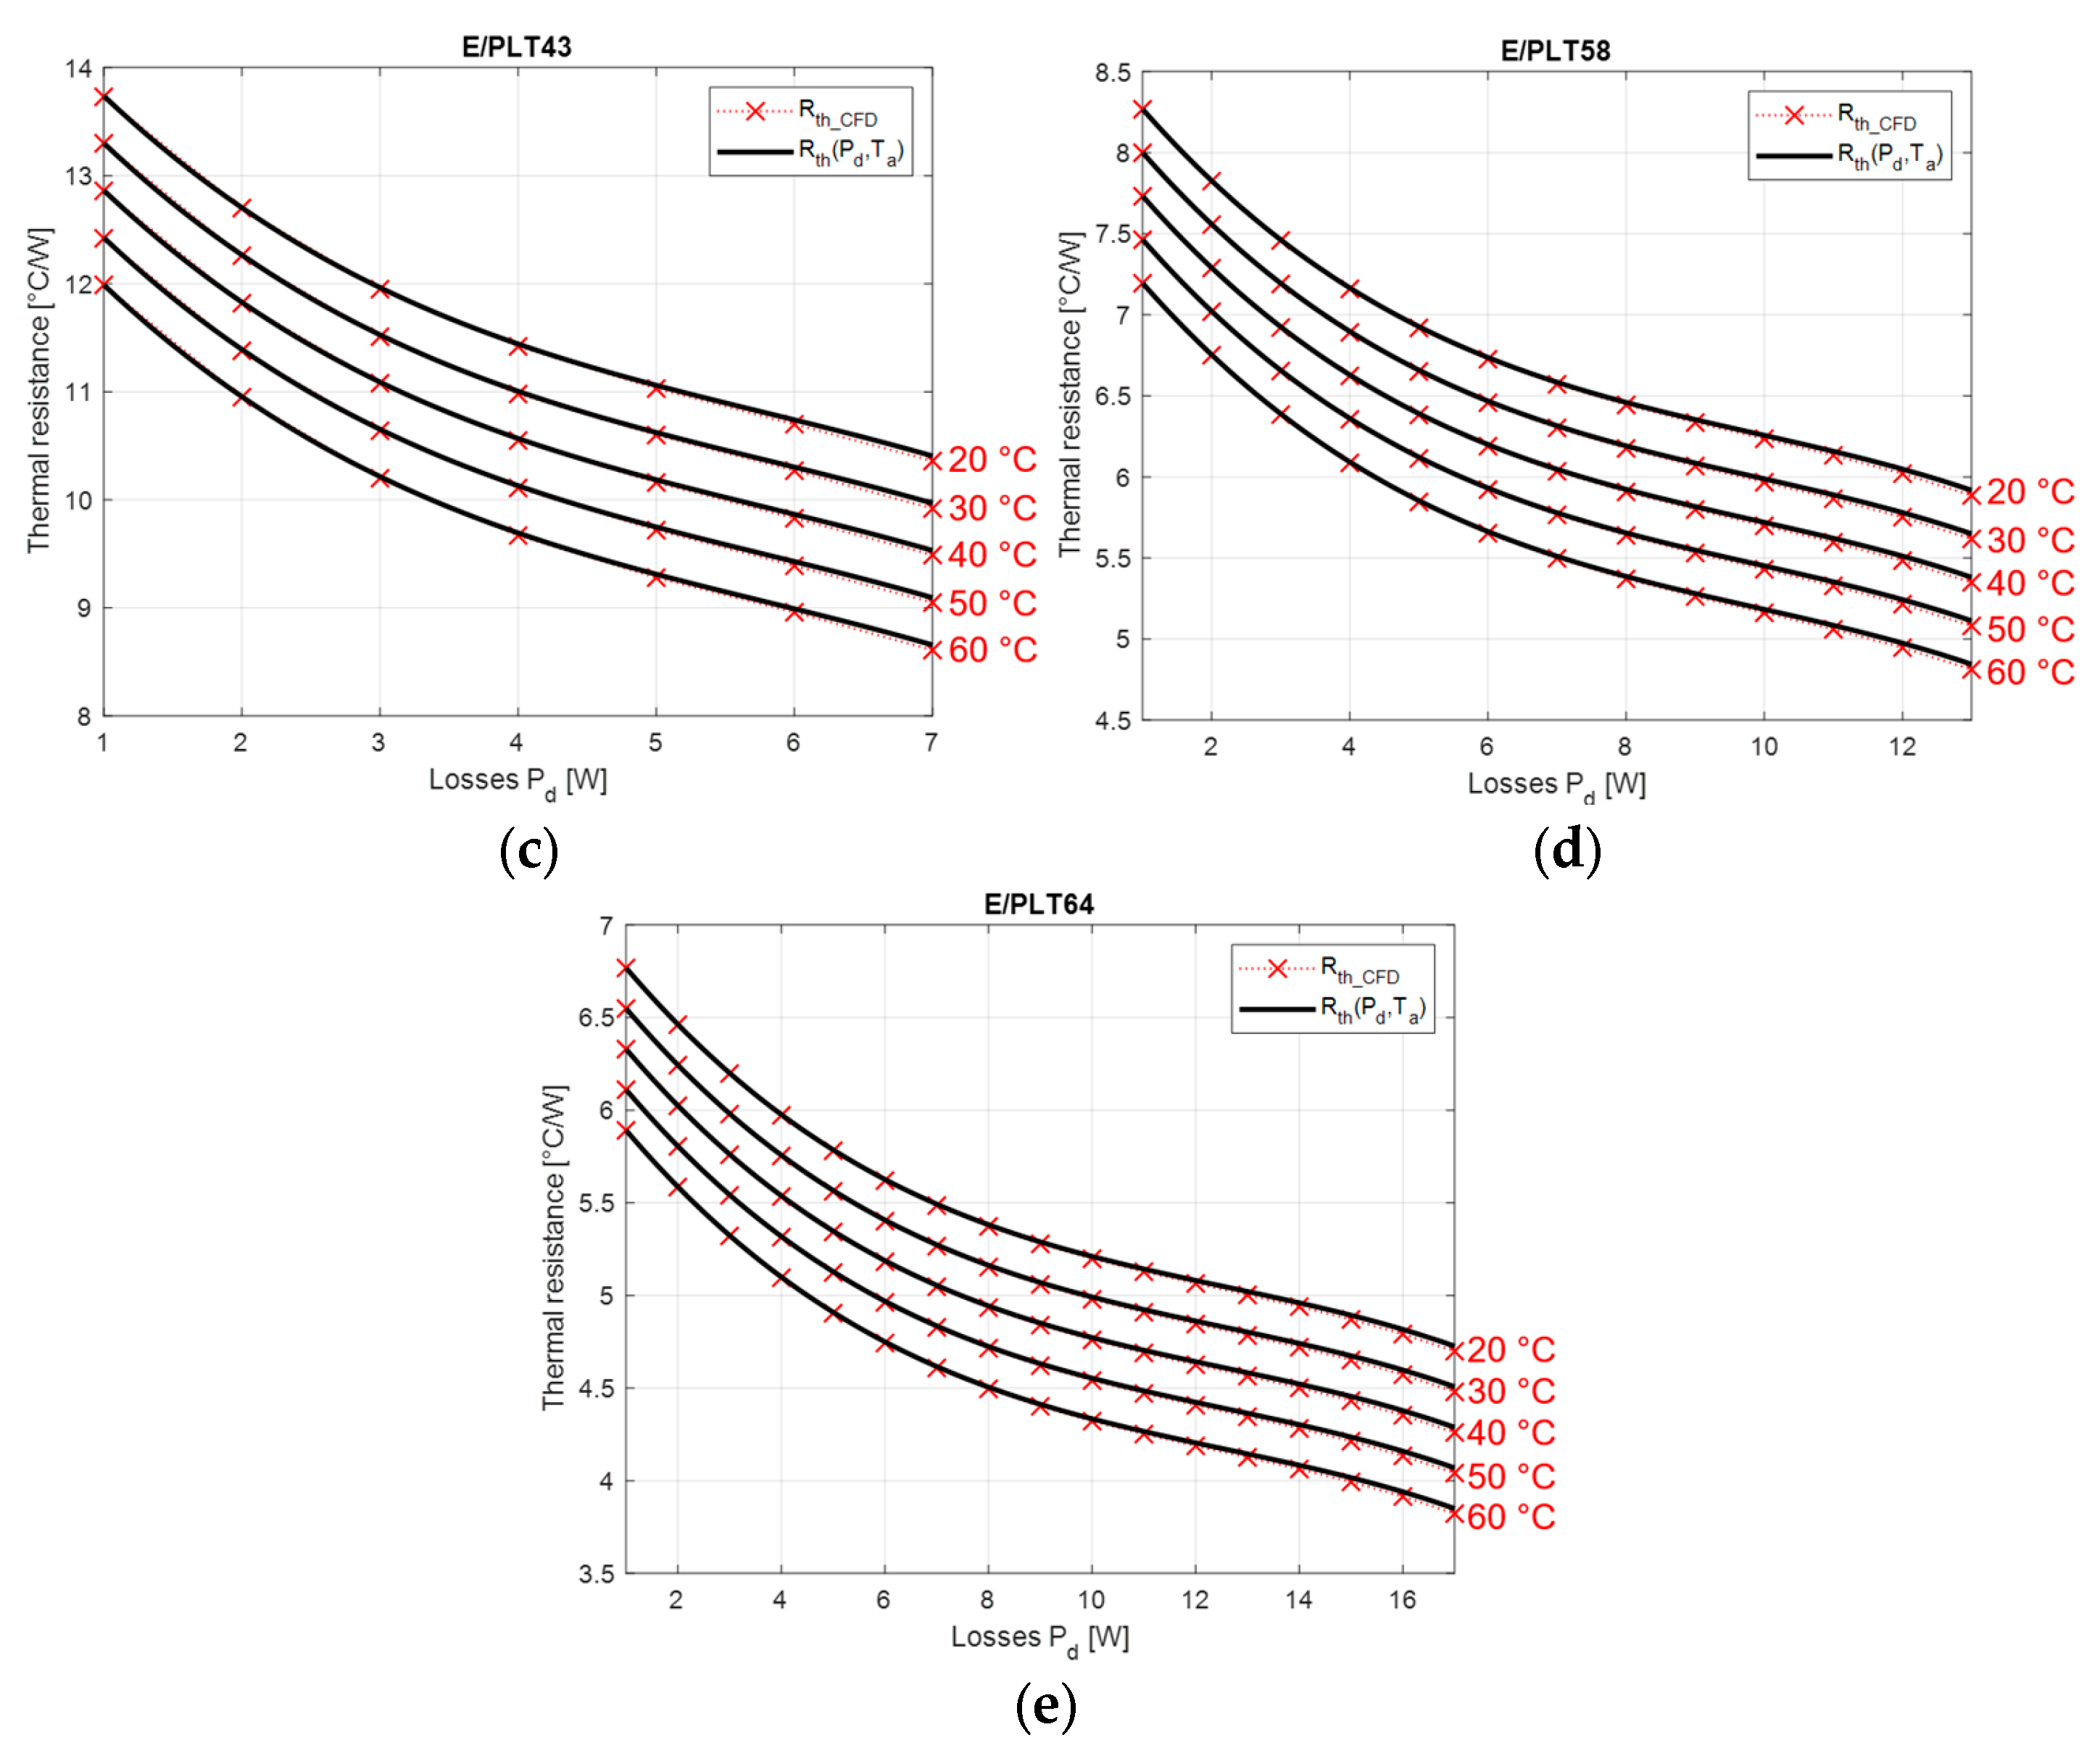
Thermal resistances calculated with the polynomial formula (4) are compared to results from CFD simulations in Figure 12 and Figure 13 for E/PLT and EE cores, respectively. Analytical formulation correctly reproduces variations in thermal resistances for all the sizes of E/PLT and EE planar cores. The maximal error does not go beyond 1% inside the loss and temperature ranges.

5.2. Experimental Validation

In order to validate the thermal resistance model, a prototype of a planar transformer based on E/PLT38 core 3F3 magnetic material is developed. The prototype is designed for 360 VA. The nominal voltage at primary winding is 40 V and its operating frequency is 100 kHz. Its maximum losses are 6 W.
The prototype is a two-winding transformer made of 12 copper layers separated by Kapton layers as an insulator. The six first layers form the three turns of the primary winding (two parallel layers by turn) while the six other layers are all parallelized to form the secondary winding. The design of this prototype is presented in [24].
For testing the validity of the thermal resistance model, the losses inside the component need to vary from 1 W to its maximal power (Table 5). In order to generate different loss values, the transformer prototype is tested with a secondary in an open circuit. In this configuration, losses are mainly core ones. They can be tuned by acting on the sinusoidal voltage (   V p ) and its frequency ( f ) at the primary winding, as is shown in the Steinmetz model [25]. In power converters, voltages and currents are usually non-sinusoidal. In this case, other models must be considered to compute the core losses. The Revised Generalized Steinmetz Model (RGSE) is one of the most accurate models and can consider a DC offset in the case of HF inductors [26,27].
P c o r e = k c ( c 2 T 2 + c 1 T 2 + c 0 ) 4.44   S c   N p f α β   V p β V e
where k c , c 0 , c 1 , c 2 , α , and β are coefficients given by manufacturer [10], T is the core temperature, V e is the effective volume of the core, S c is the cross-sectional area of the core.
In practice, these both parameters are useful for tuning the loss values. The voltage parameter is set to tune the main power while the frequency parameter is used to adjust the desired value.
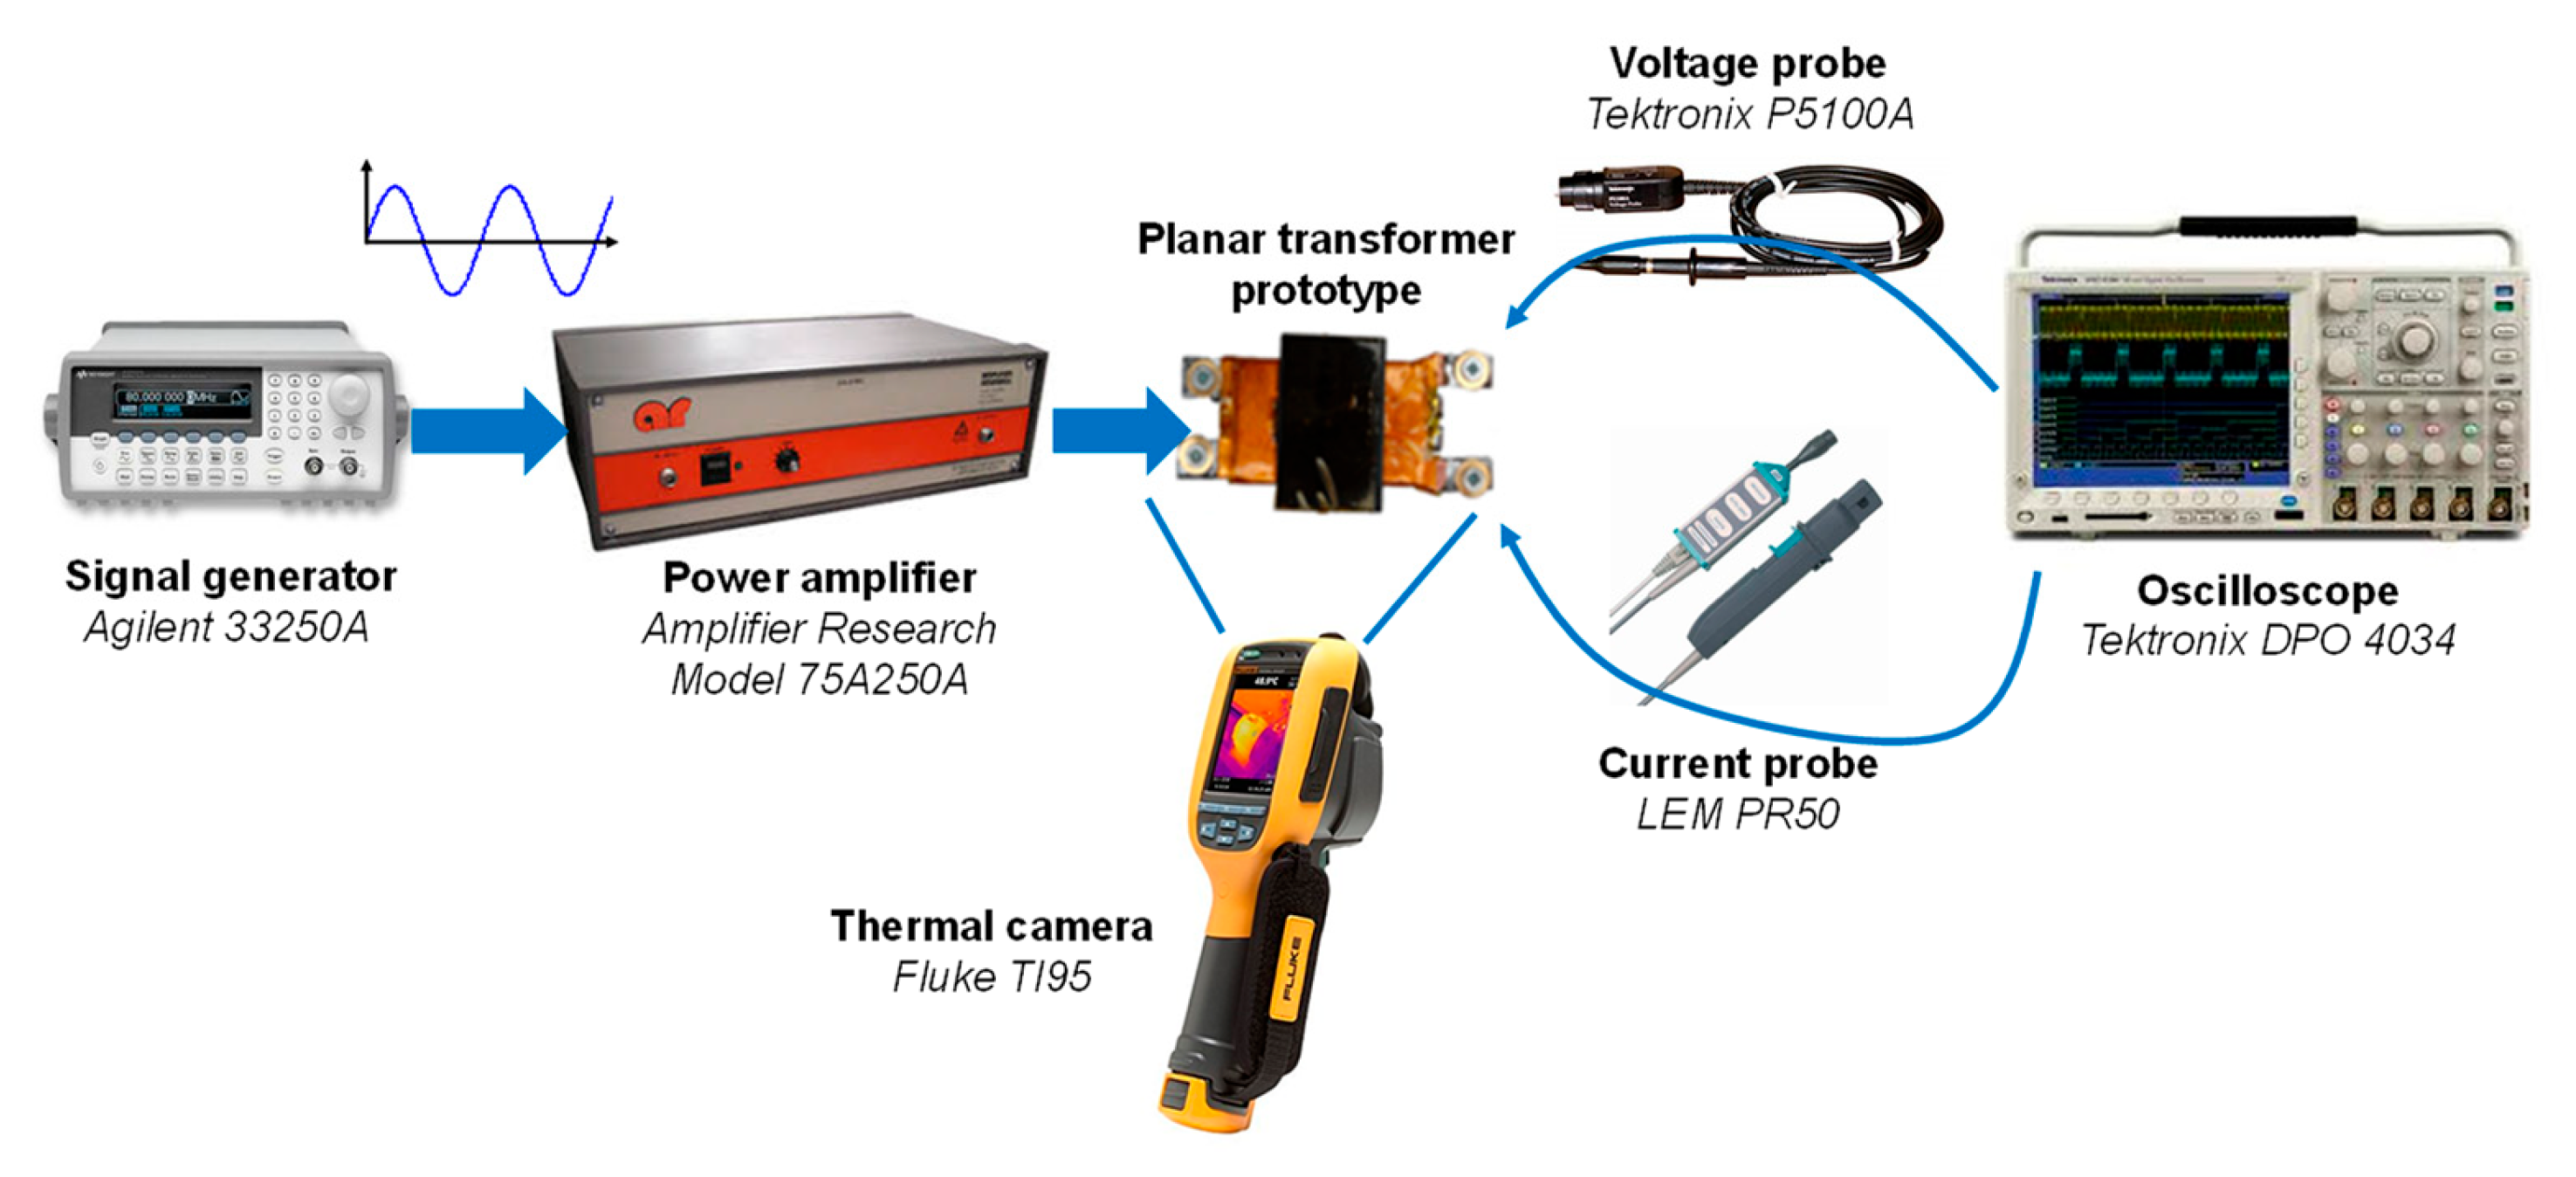
Figure 14 presents the principle and the equipment for the thermal resistance variation measurements. The sinusoidal voltage is generated by the Function Waveform Generator Agilent 33250 A [28]. The signal is amplified with a power amplifier 75A250A [29]. Losses are evaluated with oscilloscope (Tektronix DPO 4034 [30]) measurements. In order to accurately estimate those losses inside the planar transformer, probes need to generate very small delays [31]. Current in primary winding is measured with LEM PR50 current probe [32] while voltage measurement is achieved with Tektronix P5100A voltage probe [33]. These probes have a bandwidth of 50 MHz and 500 MHz, respectively. They are large enough to observe fundamental and predominant harmonics. With these probes, the delay is below 9 ns and the measurement error is below 7% for a 40 V-100 kHz frequency voltage excitation applied to the planar device.
Temperatures are measured with a thermal camera Fluke TI95 [34]. That camera has a tunable emissivity and a sensitivity of 0.1 °C between 25 and 30 °C. The thermal camera was first calibrated using thermocouples in order to tune the emissivity values. The emissivities of 0.9 and 0.45 for the magnetic core and the winding were confirmed.
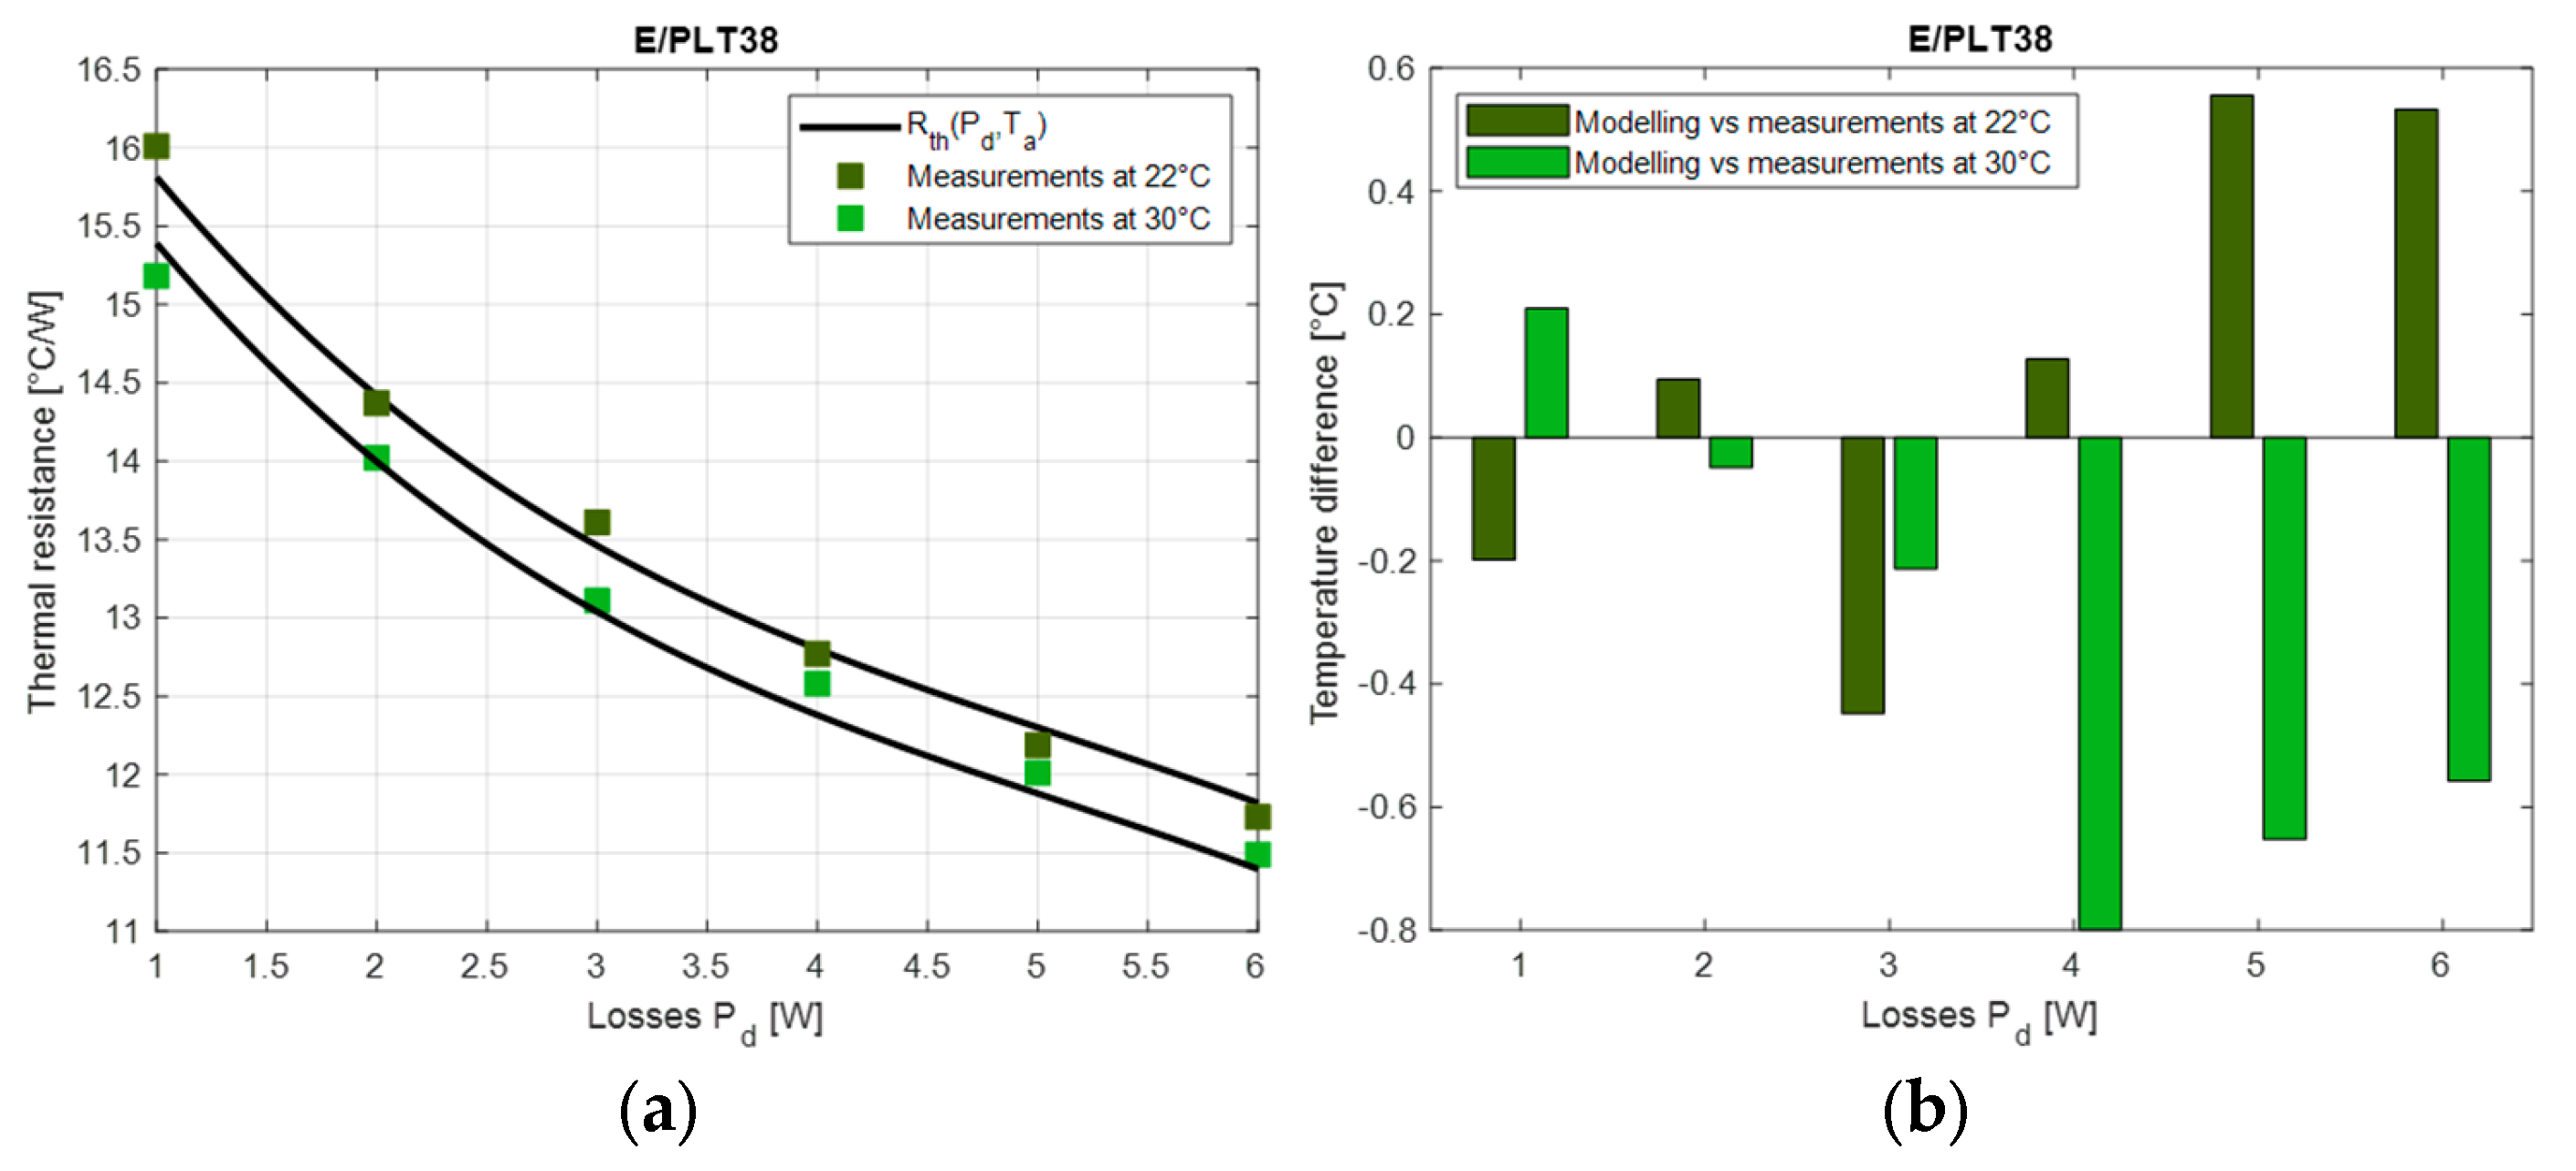
Six tests are performed with various power values (1 W, 2 W, 3 W, 4 W, 5 W, and 6 W) for two different ambient temperature values (22 °C and 30 °C). Thermal resistance is then extracted from the maximal measured temperature of the component according to (3), considering the measured power and the ambient temperature. Figure 15 shows an example of a thermal image obtained for 6 W loss and 22 °C ambient temperature. The obtained temperature is quite homogenous on the core’s surface. The maximal temperature is located on the top area of the magnetic core because losses are located inside the core.
Figure 16a presents the comparison between the thermal resistances evaluated with these tests and the ones calculated with the analytical modeling (4). The temperature differences (6) obtained with the modeling and the measurements are plotted in Figure 16b:
T d i f f = R t h P d , T a R t h _ m e a s × P d
where R t h P d , T a the thermal resistance calculated with the model, P d the power losses and R t h _ m e a s the thermal resistance measured.
The experimental results of thermal resistance are consistent with CFD results and its analytical modeling. The test configuration with only core losses does not affect the results. Indeed, the loss distribution (i.e., only copper losses or shared between core and winding) does not bring a significant difference in the maximal temperature. The difference is below 3 °C.
As expected, thermal resistances decrease with ambient temperature and power losses. The maximum difference between thermal resistance from measurements and the analytical calculation is approximately 3%.

5.3. Discussion

The developed model is easy to use, and it does not need important processing power. It enables a fair sizing of planar magnetics in natural convection with no heatsink. It can also be included in the optimization process. Similar models could be developed for other planar cores (ER, EQ) or other customized cores with low profiles.
However, such a model is limited to the design stage. Indeed, the latter does not permit obtaining temperature distribution inside the component. Hot spots inside windings or magnetic cores cannot be considered. To address this issue, the more complex model can be used in 2D [35,36,37], in 3D [24,38], or with FEA-based modeling [39,40,41].
Other models based on artificial intelligence (AI) [42,43,44] can also be used to accurately estimate temperature distribution. Indeed, AI is a promising tool, especially suitable for the design of HF magnetic components and their thermal management [44]. For example, AI models can lead to more efficient thermal management and automatic heatsink design, as it was developed, in [45], for the heatsink optimization of air-cooled power modules. AI-based models are fast, but their development needs a lot of data and cannot be used in a simple computation tool.

6. Conclusions

In this paper, a thermal sizing model for planar magnetics is developed. Based on CFD simulation, a global thermal resistance is computed in natural convection with no heatsink. The variation of this resistance is tested according to two parameters: the power losses inside the planar component and the ambient temperature. Thermal resistance values of EE and E/PLT core-based planar transformers are computed and compared to models from the literature, in order to highlight the benefits of such models.
Then, analytical modeling considering both parameters (i.e., power losses and ambient temperature) is developed based on a polynomial equation. This analytical model is compared with CFD results. Finally, the thermal resistance model is also compared to measurement on a 360 VA planar transformer prototype.
Such a model can be very useful for designers. It enables the precise calculation of the increase in temperature, avoiding problems linked to underestimation or oversizing of magnetic components. The developed model is very fast and can enable the exploration of planar component design solutions in a design process. It can also be used in an optimization process, combined with other analytical models.
The methodology developed in this paper can be extended to other planar core geometries, such as ER or EQ ones. Some investigation must be conducted to validate the adaptation of such a polynomial model for these geometries.
The future developments of AI approaches should enable the improvement of the thermal design of HF magnetics. Such AI-based design will provide solutions that will enhance the performances of planar components and their integration into power converters.

Author Contributions

Conceptualization, R.B. and X.M.; methodology, R.B. and X.M.; validation, R.B.; investigation, R.B. and X.M.; writing—original draft preparation, X.M.; writing—review and editing, R.B. and X.M.; project administration, X.M., P.L.M. and N.I. All authors have read and agreed to the published version of the manuscript.

Funding

This research received no external funding.

Data Availability Statement

Data are contained within the article.

Conflicts of Interest

The authors declare no conflicts of interest.

References

  1. Guan, Y.; Wang, Y.; Xu, D.; Wang, W. A 1 MHz Half-Bridge Resonant DC/DC Converter Based on GaN FETs and Planar Magnetics. IEEE Trans. Power Electron. 2017, 32, 2876–2891. [Google Scholar] [CrossRef]
  2. Zhang, Z.; Ngo, K.D.T. Multi-megahertz quasi-square-wave flyback converter using eGaN FETs. IET Power Electron. 2017, 10, 1138–1146. [Google Scholar] [CrossRef]
  3. Ouyang, Z.; Andersen, M.A.E. Overview of Planar Magnetic Technology—Fundamental Properties. IEEE Trans. Power Electron. 2014, 29, 4888–4900. [Google Scholar] [CrossRef]
  4. Ngoua Teu Magambo, J.S.; Bakri, R.; Margueron, X.; Le Moigne, P.; Mahe, A.; Guguen, S.; Bensalah, T. Planar Magnetic Components in More Electric Aircraft: Review of Technology and Key Parameters for DC–DC Power Electronic Converter. IEEE Trans. Transp. Electrif. 2017, 3, 831–842. [Google Scholar] [CrossRef]
  5. Planar Transformers for EV On-Board Chargers & DC-DC Converter Applications. Available online: https://standexelectronics.com/planar-magnetics/planar-transformers-for-ev-on-board-chargers-dc-dc-converter-applications/ (accessed on 25 April 2024).
  6. Son, W.-J.; Lee, B.K. Design of Planar Transformers for LLC Converters in High Power Density On-Board Chargers for Electric Vehicles. Energies 2023, 16, 6757. [Google Scholar] [CrossRef]
  7. Lee, D.-W.; Lim, J.-H.; Lee, D.-I.; Youn, H.-S. A High-Power-Density Active-Clamp Converter with Integrated Planar Transformer. Energies 2022, 15, 5609. [Google Scholar] [CrossRef]
  8. Magnetics Designer—Personal Computer Circuit Design Tools. Available online: http://www.intusoft.com/lit/Magdes.pdf (accessed on 25 April 2024).
  9. Muldoon, W.J. Analytical design optimization of electronic power transformers. In Proceedings of the Power Electronics Specialists Conference, Syracuse, NY, USA, 13–15 June 1978; pp. 216–225. [Google Scholar]
  10. Design of Planar Power Transformers. Available online: http://ferroxcube.home.pl/appl/info/plandesi.pdf (accessed on 25 April 2024).
  11. Ferroxcube Soft Ferrites Design Tool (SFDT). Available online: https://www.ferroxcube.com/en-global/design_tool/index (accessed on 25 April 2024).
  12. Hurley, W.G.; Wölfle, W.H. Transformers and Inductors for Power Electronics—Theory, Design and Applications; John Wiley & Sons Ltd.: West Sussex, UK, 2013. [Google Scholar]
  13. van den Bossche, A.; Valchev, V.C. Inductors and Transformers for Power Electronics; Taylor and Francis: Boca Raton, FL, USA, 2005. [Google Scholar]
  14. McLyman, C.W.T. Transformer and Inductor Design Handbook, 4th ed.; CRC Press: Boca Raton, FL, USA, 2011. [Google Scholar]
  15. Soft Ferrites and Accessories Data Handbook 2013. Available online: https://www.ferroxcube.com/en-global/download/download/11 (accessed on 25 April 2024).
  16. Bakri, R.; Corgne, G.; Margueron, X. Thermal Modeling of Planar Magnetics: Fundamentals, Review and Key Points. IEEE Access 2023, 11, 41654–41679. [Google Scholar] [CrossRef]
  17. ANSYS—Simulation Driven Product Development. Available online: http://www.ansys.com (accessed on 25 April 2024).
  18. Bakri, R.; NgouaTeu Magambo, J.S.; Margueron, X.; Le Moigne, P.; Idir, N. Planar transformer equivalent thermal resistance variation with ambient temperature and power losses. In Proceedings of the 18th European Conference on Power Electronics and Applications (EPE’16 ECCE Europe), Karlsruhe, Germany, 5–9 September 2016; pp. 1–9. [Google Scholar]
  19. Coombs, C.F. Printed Circuits Handbook, 6th ed.; McGraw-Hill: New York, NY, USA, 2008. [Google Scholar]
  20. Boglietti, A.; Cavagnino, A.; Staton, D.; Shanel, M.; Mueller, M.; Mejuto, C. Evolution and Modern Approaches for Thermal Analysis of Electrical Machines. IEEE Trans. Ind. Electron. 2009, 56, 871–882. [Google Scholar] [CrossRef]
  21. Lewaiter, A.; Ackermann, B. A thermal model for planar transformers. In Proceedings of the 4th IEEE International Conference on Power Electronics and Drive Systems, Denpasar, Indonesia, 25 October 2001; pp. 669–673. [Google Scholar]
  22. Lomax, H.; Pulliam, T.H.; Zingg, D.W. Fundamentals of Computational Fluid Dynamics; Springer: Berlin/Heidelberg, Germany, 2001. [Google Scholar]
  23. Hansen, P.C.; Pereyra, V.; Scherer, G. Least Squares Data Fitting: With Applications; Johns Hopkins Univ. Press: Baltimore, MD, USA, 2013. [Google Scholar]
  24. Bakri, R.; Margueron, X.; Ngoua Teu Magambo, J.S.; Le Moigne, P.; Idir, N. Planar Automated tool for 3D planar magnetic temperature modelling: Application to EE and E/PLT core-based components. IET Power Electron. 2019, 12, 4043–4053. [Google Scholar] [CrossRef]
  25. Brittain, J.E. A steinmetz contribution to the AC power revolution. Proc. IEEE 1984, 72, 196–197. [Google Scholar] [CrossRef]
  26. Roberto, S.F.; Scirè, D.; Lullo, G.; Vitale, G. Equivalent Circuit Modelling of Ferrite Inductors Losses. In Proceedings of the 2018 IEEE 4th International Forum on Research and Technology for Society and Industry (RTSI), Palermo, Italy, 10–13 September 2018; pp. 1–4. [Google Scholar]
  27. Vitale, G.; Lullo, G.; Scirè, D. Thermal Stability of a DC/DC Converter with Inductor in Partial Saturation. IEEE Trans. Ind. Electron. 2021, 68, 7985–7995. [Google Scholar] [CrossRef]
  28. 33250A Function/Arbitrary Waveform Generator, 80 MHz. Available online: https://www.keysight.com/us/en/product/33250A/function--arbitrary-waveform-generator-80-mhz.html (accessed on 25 April 2024).
  29. Amplifier Research 75A250A. Available online: https://www.arworld.us (accessed on 25 April 2024).
  30. Tektronix 4000 Series Digital Phosphor Oscilloscopes User Manual. Available online: https://download.tek.com/manual/071212104web (accessed on 25 April 2024).
  31. Mu, M. High Frequency Magnetic Core Loss Study. Ph.D. Thesis, Virginia Polytechnic Institute and State University, Blacksburg, VA, USA, 2013. [Google Scholar]
  32. PR 50 Universal 50 MHz Current Probe for Oscilloscopes. Available online: http://www.lem.com (accessed on 25 April 2024).
  33. Passive High Voltage Probe P5100A. Available online: https://www.tek.com/en/datasheet/passive-high-voltage-probes (accessed on 25 April 2024).
  34. Ti90, Ti95 Ti100, Ti105, Ti110, Ti125 TiR105, TiR110, TiR125 Performance Series Thermal Imagers Users Manual. Available online: https://www.myflukestore.com/pdfs/cache/www.myflukestore.com/ti95-9hz/manual/ti95-9hz-manual.pdf (accessed on 25 April 2024).
  35. Buccella, C.; Cecati, C.; de Monte, F. A coupled electrothermal model for planar transformer temperature distribution computation. IEEE Trans. Ind. Electron. 2008, 55, 3583–3590. [Google Scholar] [CrossRef]
  36. Buccella, C.; Cecati, C.; de Monte, F. A computational method of temperature distribution in high frequency planar transformers. In Proceedings of the 2011 IEEE International Symposium on Industrial Electronics, Gdansk, Poland, 27–30 June 2011; pp. 477–482. [Google Scholar]
  37. Górecki, K.; Detka, K.; Górski, K. Compact Thermal Model of the Pulse Transformer Taking into Account Nonlinearity of Heat Transfer. Energies 2020, 13, 2766. [Google Scholar] [CrossRef]
  38. Shafaei, R.; Ordonez, M.; Saket, A. Three-Dimensional Frequency Dependent Thermal Model for Planar Transformers in LLC Resonant Converters. IEEE Trans. Power Electron. 2018, 34, 4641–4655. [Google Scholar] [CrossRef]
  39. Bernardoni, M.; Delmonte, N.; Cova, P.; Menozzi, R. Thermal modeling of planar transformer for switching power converters. Microelectron. Reliab. 2010, 50, 1778–1782. [Google Scholar] [CrossRef]
  40. Salinas, G.; Delgado, A.; Oliver, J.A.; Prieto, R. Fast FEA thermal simulation of magnetic components by winding equivalent layers. In Proceedings of the 2018 IEEE Energy Conversion Congress and Exposition (ECCE), Portland, OR, USA, 23–27 September 2018; pp. 7380–7385. [Google Scholar]
  41. Shafaei, R.; Saket, M.A.; Ordonez, M. Thermal comparison of planar versus conventional transformers used in LLC resonant converters. In Proceedings of the 2018 IEEE Energy Conversion Congress and Exposition (ECCE), Portland, OR, USA, 23–27 September 2018; pp. 5081–5086. [Google Scholar]
  42. Guillod, T.; Papamanolis, P.; Kolar, J.W. Artificial Neural Network (ANN) Based Fast and Accurate Inductor Modeling and Design. IEEE Open J. Power Electron. 2020, 1, 284–299. [Google Scholar] [CrossRef]
  43. Santamargarita, D.; Salinas, G.; Molinero, D.; Bueno, E.J.; Vasić, M. Tradeoff between Accuracy and Computational Time for Magnetics Thermal Model Based on Artificial Neural Networks. IEEE J. Emerg. Sel. Top. Power Electron. 2023, 11, 5658–5674. [Google Scholar] [CrossRef]
  44. Shen, X.; Zuo, Y.; Kong, J.; Martinez, W. Artificial Intelligence Applications in High-Frequency Magnetic Components Design for Power Electronics Systems: An Overview. IEEE Trans. Power Electron. 2024, 39, 8478–8496. [Google Scholar] [CrossRef]
  45. Wu, T.; Wang, Z.; Ozpineci, B.; Chinthavali, M.; Campbell, S. Automated Heatsink Optimization for Air-Cooled Power Semiconductor Modules. IEEE Trans. Power Electron. 2019, 34, 5027–5031. [Google Scholar] [CrossRef]
Figure 1. Cross section of planar cores: (a) E/PLT; (b) EE.
Energies 17 02755 g001
Figure 2. Planar magnetic thermal modeling with single global thermal resistance.
Energies 17 02755 g002
Figure 3. Example of EE64 core-based planar transformer temperature distribution: (a) 3D view; (b) transverse section; (c) longitudinal cut.
Energies 17 02755 g003
Figure 4. Simulation of E/PLT58 core-based planar transformer: (a) case 1; (b) case 2; and (c) case 3.
Energies 17 02755 g004
Figure 5. Comparison of Rth models for E/PLT32 and EE64 cores.
Energies 17 02755 g005
Figure 6. Gaps between winding and magnetic core for CFD simulation.
Energies 17 02755 g006
Figure 7. CFD simulation parameters: (a) YZ plane simulation domain; (b) XZ plane simulation domain; (c) magnetic core meshing; and (d) winding meshing.
Energies 17 02755 g007
Figure 8. Example of temperature distribution for E/PLT38 (Pd = 6 W and Ta = 30 °C).
Energies 17 02755 g008
Figure 9. Variation in thermal resistance according to losses and ambient temperature—CFD results: (a) E/PLT32; (b) EE64.
Energies 17 02755 g009
Figure 10. Variation in thermal resistance according to losses and ambient temperature—CFD results: (a) E/PLT32; (b) EE64.
Energies 17 02755 g010
Figure 11. Comparison of temperature estimation difference obtained with CFD simulation and models from the literature: (a) E/PLT32 at 20 °C; (b) E/PLT32 at 60 °C; (c) EE64 at 20 °C; and (d) EE64 at 60 °C.
Energies 17 02755 g011aEnergies 17 02755 g011b
Figure 12. Comparison of thermal resistance variation: analytical model vs. CFD for E/PLT cores: (a) E/PLT32; (b) E/PLT38; (c) E/PLT43; (d) E/PLT58; and (e) E/PLT63.
Energies 17 02755 g012aEnergies 17 02755 g012b
Figure 13. Comparison of thermal resistance variation: analytical model vs. CFD for EE cores: (a) EE32; (b) EE38; (c) EE43; (d) EE58; and (e) EE63.
Energies 17 02755 g013
Figure 14. Principle and measurement equipment for the experimental characterization of the thermal resistance variation.
Energies 17 02755 g014
Figure 15. Thermal image of for E/PLT38 core (6 W losses and 22 °C ambient temperature).
Energies 17 02755 g015
Figure 16. Comparison of analytical modeling and experimental measurements for E/PLT38 core: (a) thermal resistance; (b) temperature difference.
Energies 17 02755 g016
Table 1. Thermal conductivities.
Part of the Planar ComponentDirection (x,y,z)Thermal Conductivity
[W m−2 K−1]
Winding—transverse directionxy237
Winding—normal directionz0.5
Ferrite corexyz4
Table 2. E/PLT58 planar transformer with various insulator thicknesses.
ParametersCase 1Case 2Case 3
Copper thickness (mm)0.20.20.2
Insulator thickness (mm)0.20.30.4
Transverse Kxy (W·m−2·K−1)190.1152.1126.8
Normal Kz (W·m−2·K−1)0.300.250.22
Maximal temperature (°C)100.1999.6899.46
Table 3. Simulation results for different loss repartition (copper and core).
ParametersCase 4Case 5Case 6
Core losses (W)31.50
Copper losses (W)01.53
Maximal temperature (°C)102.7100.2104.56
T (°C)72.770.274.6
R t h (°C/W)6.15.96.2
Error (%)3.606.2
Table 4. Thermal resistance models.
Application Note/AuthorsReferenceRth ModelParameters
Magnetic Designer/Muldoon[8,9] R t h _ m a g D e s External area—Aext
Ferroxcube application note[10] R t h _ A N F e r r o x Effective volume—Ve
Ferroxcube Soft Ferrite Design Tool (SFDT)[11] R t h _ S F D T Effective volume—Ve
Hurley, Wölfe[12] R t h _ H u r Effective volume—Ve
Van den Bossche, Valchev[13] R t h _ B o s V a l External area—Aext
Losses in the component—Pd
McLyman[14] R t h _ M c L External area—Aext
Losses in the component—Pd
Zhang, Ngo[2] R t h _ Z h a N g o External area—Aext
Losses in the component—Pd
Table 5. Maximal power loss values.
E/PLT CorePmaxEE CorePmax
E/PLT324EE326
E/PLT386EE387
E/PLT437EE439
E/PLT5813EE5816
E/PLT6417EE6419
Table 6. Coefficients for E/PLT cores.
Sizea3a2a1bc
E/PLT32−0.07850.8908−4.379−0.074428.943
E/PLT38−0.02320.3585−2.306−0.052718.942
E/PLT43−0.01290.225−1.618−0.043716.019
E/PLT58−0.001640.0486−0.5765−0.02689.335
E/PLT64−0.000660.0251−0.3761−0.02197.558
Table 7. Coefficients for EE cores.
Sizea3a2a1bc
EE32−0.03170.4889−3.125−0.060424.815
EE38−0.01460.2537−1.8109−0.044817.146
EE43−0.006420.1376−1.189−0.03613.563
EE58−0.000870.0309−0.4331−0.02237.977
EE64−0.000450.0191−0.312−0.01926.7406
Disclaimer/Publisher’s Note: The statements, opinions and data contained in all publications are solely those of the individual author(s) and contributor(s) and not of MDPI and/or the editor(s). MDPI and/or the editor(s) disclaim responsibility for any injury to people or property resulting from any ideas, methods, instructions or products referred to in the content.