Article

Economic Optimal Scheduling of Integrated Energy System Considering Wind–Solar Uncertainty and Power to Gas and Carbon Capture and Storage

1
Power China Hubei Electric Engineering, Wuhan 430040, China
2
School of Finance, Hubei University of Economics, Wuhan 430205, China
3
School of Automation, China University of Geosciences, Wuhan 430074, China
*
Author to whom correspondence should be addressed.
Energies 2024, 17(11), 2770; https://doi.org/10.3390/en17112770
Submission received: 11 May 2024 / Revised: 30 May 2024 / Accepted: 3 June 2024 / Published: 5 June 2024

Abstract

:
With the shortage of fossil energy and the increasingly serious environmental problems, renewable energy based on wind and solar power generation has been gradually developed. For the problem of wind power uncertainty and the low-carbon economic optimization problem of an integrated energy system with power to gas (P2G) and carbon capture and storage (CCS), this paper proposes an economic optimization scheduling strategy of an integrated energy system considering wind power uncertainty and P2G-CCS technology. Firstly, the mathematical model of the park integrated energy system with P2G-CCS technology is established. Secondly, to address the wind power uncertainty problem, Latin hypercube sampling (LHS) is used to generate a large number of wind power scenarios, and the fast antecedent elimination technique is used to reduce the scenarios. Then, to establish a mixed integer linear programming model, the branch and bound algorithm is employed to develop an economic optimal scheduling model with the lowest operating cost of the system as the optimization objective, taking into account the ladder-type carbon trading mechanism, and the sensitivity of the scale parameters of P2G-CCS construction is analyzed. Finally, the scheduling scheme is introduced into a typical industrial park model for simulation. The simulation result shows that the consideration of the wind uncertainty problem can further reduce the system’s operating cost, and the introduction of P2G-CCS can effectively help the park’s integrated energy system to reduce carbon emissions and solve the problem of wind and solar power consumption. Moreover, it can more effectively reduce the system’s operating costs and improve the economic benefits of the park.

1. Introduction

In recent years, renewable new energy, mainly wind and solar power generation, has been gradually developed and applied to society. However, due to the wind and solar power generation system output having a certain degree of randomness and volatility, there has been a tendency for wind and solar power to be abandoned. This has resulted in the new energy utilization rate being relatively low, and the variability in and uncertainty of the energy source potentially affecting the stability and economy of the power system scheduling [1]. Concurrently, the energy industry, particularly the electric power industry, accounts for a considerable proportion of greenhouse gas emissions, and thus bears a significant responsibility for the achievement of green and low-carbon development. Consequently, the park integrated energy system (PIES), which couples a variety of energy sources through energy conversion equipment and exploits the complementary advantages of multiple energy sources, will play an important role in energy conservation and emission reduction in the energy industry [2,3]. This is due to the fact that it is supported by renewable energy generation, electricity-to-gas conversion, energy storage and other technologies.
The uncertainty of wind and solar output can be better managed to enhance the reliability, stability and economy of integrated energy systems. Currently, the mainstream research approach to the wind–solar power output uncertainty problem is to use statistical methods to model wind and solar resources, such as time series analysis and probability distribution fitting, to quantify the uncertainty of wind energy [4]. Nayak et al. [5] used a stochastic approach to model uncertainty and performed bi-objective optimization in a fuzzy domain using a ‘fuzzy max-min’ satisfaction criterion. Abdelmalak et al. [6] pointed out that Monte Carlo simulation and perturbation techniques are computationally intensive and cannot be directly embedded in the power system model, and proposed an approach based on generalized polynomial chaos (GPC). Cao et al. [7] proposed a combined LHS and K-means clustering method to solve the uncertainty problem of wind-glow output. Each of the aforementioned studies addresses uncertainty through extensive random sampling and parameter perturbation, or the use of polynomial approximation of the uncertainty distribution. However, constrained by the computational cost and parameter space, the LHS and fast prior scenario reduction methods appear to be more widely applicable and more efficient in sampling. When compared to other methods like Monte Carlo or random sampling, LHS offers better coverage of the parameter space and reduced sampling variance. It ensures a more even distribution of samples, which can lead to more accurate and reliable results, especially in high-dimensional problems. Many studies have used LHS to generate different scenarios and then reduced the simulation options using the fast forward selection algorithm (FSA), which is a time-consuming method of scenario simplification but more accurate compared to the backward reduction algorithm [8].
In addressing the issue of the low-carbon economic optimization of integrated energy systems (IESs), Duan et al. [9] employs the reward–punishment laddering carbon trading mechanism to quantify the carbon trading cost, thereby constructing a low-carbon economic optimization model of IESs. Wang et al. [10] utilizes the carbon emission factor and reward–punishment stepped carbon trading mechanism to calculate the carbon trading cost and evaluates the economic benefits of carbon capture power plants. By formulating an optimized stepped carbon trading mechanism, the internal carbon balance of the IES can be achieved and carbon emissions can be curbed to prevent the IES from overshooting the annual carbon emission settlement [11,12]. Li et al. [13] proposed an IES scheduling model based on full life cycle assessment and carbon capture and utilization (CCU) technology, and analyzed the correlation between different carbon trading prices and the low-carbon economic transport of the IES. Furthermore, the impact of CCU technology inputs on the low-carbonity of the IES was investigated. In a further contribution to the field, Li et al. [14] put forth an IES source–load coordinated optimal scheduling model with the objective of achieving comprehensive economic optimality for the system, encompassing system–system economy and low amounts of carbon. This model employs a reward and punishment ladder-type carbon trading mechanism to minimize the waste of wind energy, stimulate consumer participation, and reduce system operating costs and carbon emissions.
Power to gas (P2G) plants enhance the capacity of wind and solar power by converting excess electricity into natural gas in an IES [15]. The underlying principle is that H 2 and O 2 are initially produced by electrolysis of water in an electrolysis system (EL), and then natural gas is synthesized from H 2 and C O 2 by a methane reactor (MR). Carbon capture and storage (CCS) technology captures, sequesters and utilizes carbon, and the carbon captured by CCS can be made available to P2G. Introducing P2G-CCS from the equipment side is one of the important ways to help an IES reduce carbon emissions and achieve low-carbon operation. The P2G-CCS carbon cycle flow diagram is shown in Figure 1, in which the CCS captures and utilizes the C O 2 emitted from the operation of natural gas, gas-fired internal combustion engines and gas-fired boilers, and transports a part of it to the methane reactor equipment to realize the coupling with the P2G.
Zhang et al. [16] proposed a two-tier optimal scheduling model for an integrated energy system with a carbon capture system and a P2G facility, which improves the economy of the IES and the capacity of wind and solar energy consumption. Furthermore, Li et al. [17] extended the P2G-CCS technology to a hybrid concentrated solar power and combined heat and power (CSP-CHP) IES with the aim of consuming more wind power and further reducing C O 2 emissions. In a further development, Liang et al. [18] created an Integrated Electricity–Gas System (IEGS) optimal dispatch model that couples gas-fired units and P2G links. This model was then used to investigate the impact of different constraints, such as power system constraints and natural gas constraints, on the model’s wind power consumption. Zhang et al. [19] integrated P2G, carbon capture and the supercritical carbon dioxide ( S C O 2 ) cycle systems into a carbon cycle system. This system was then used to investigate the role of the carbon cycle system in an electric–thermal IES.
The literature above demonstrates the efficacy of P2G-CCS for the optimal low-carbon economic dispatch of the IES. However, it does present certain challenges to the economic dispatch due to the stochasticity of wind and solar power not being considered. Zhu et al. [20] proposed a low-carbon economic dispatch model of an IES containing P2G and hydrogen-doped gas units (HGT) coupling under the stepped carbon trading mechanism. This model addresses the wind abandonment problem of the IES by utilizing the operating characteristics of P2G in the system while considering the inherent uncertainty of wind power output. Furthermore, it enhances the system’s renewable energy consumption capacity. In a further contribution to the field, Zhang et al. [21] employed conditional value-at-risk (CvaR) theory to analyze the uncertainty of wind power, utilizing P2G to reduce the system wind abandonment rate and energy storage devices to mitigate the operational risk of wind power fluctuation on the system. Both Sun et al. and Pan et al. [22,23] have proposed an optimal scheduling model for IESs considering flexible loads and P2G participation in the carbon trading market, and verified the importance and economics of P2G for system reduction of operating costs and the feasibility of wind power adaptability. In a further contribution to the field, Yang et al. [24] put forth a P2G multi-objective cooperative operation optimization model for an interconnected integrated gas-to-electric energy system, taking into account the inherent uncertainty of wind power. Through an arithmetic analysis, it was demonstrated that connecting the P2G equipment can reduce the total operating cost of the natural gas system and can improve the system wind energy consumption.
In light of the aforementioned background, it can be seen that the consideration of carbon trading mechanisms and wind and solar uncertainty is conducive to achieving energy savings, emission reductions and an economically viable integrated energy system. Furthermore, the role of P2G-CCS equipment in the system’s wind and solar consumption capacity and low-carbon economy requires further investigation. However, the current study has the following shortcomings:
  • The low-carbon economy and wind-scenery consumption effect of integrated energy systems have not been adequately explored, despite the necessity of effectively quantifying wind-scenery uncertainty.
  • The sensitivity analysis of the construction scale parameters of P2G-CCS equipment has yet to be studied.
In light of the aforementioned considerations, this paper initially examines the potential for wind and solar output uncertainty, preprocesses the wind and solar resource data, generates a classical scenario set utilizing the Latin hypercube sampling and reduction technique, and then reduces the scenarios using the fast antecedent elimination technique. This process enables the scenario set to comprise a number of representative scenarios, which can then be used to estimate the actual wind and solar output effect and to reduce the influence of wind and PV output fluctuations.
Secondly, an integrated energy system mathematical model considering P2G-CCS is established. This model is used to analyze the coupling relationship between multiple energy sources and to establish a system carbon emission calculation model and a step-type carbon trading mechanism.
Subsequently, the branch bounding algorithm is employed to transform the system’s wind and solar consumption and carbon emissions into wind and solar abandonment costs and carbon trading costs, which are then aggregated into the system’s operating cost. The objective of this process is to identify the lowest system operating cost, which serves as the benchmark for the economic optimal scheduling study. This study aims to identify the optimal scheduling strategy for the system.
Finally, a typical park is used as an example to verify the optimization model proposed in this paper. The sensitivity of the construction scale parameters of the P2G-CCS is analyzed, and the results demonstrate that the model is effective in solving the aforementioned issues. The issue of wind and solar energy consumption, and the reduction in system operating costs and carbon emissions, is addressed. It is demonstrated that as the construction scale of the P2G-CCS increases, the system’s operating costs decrease. This verifies the economic and effective nature of the optimization scheduling model proposed in this paper.

2. PIES System Architecture

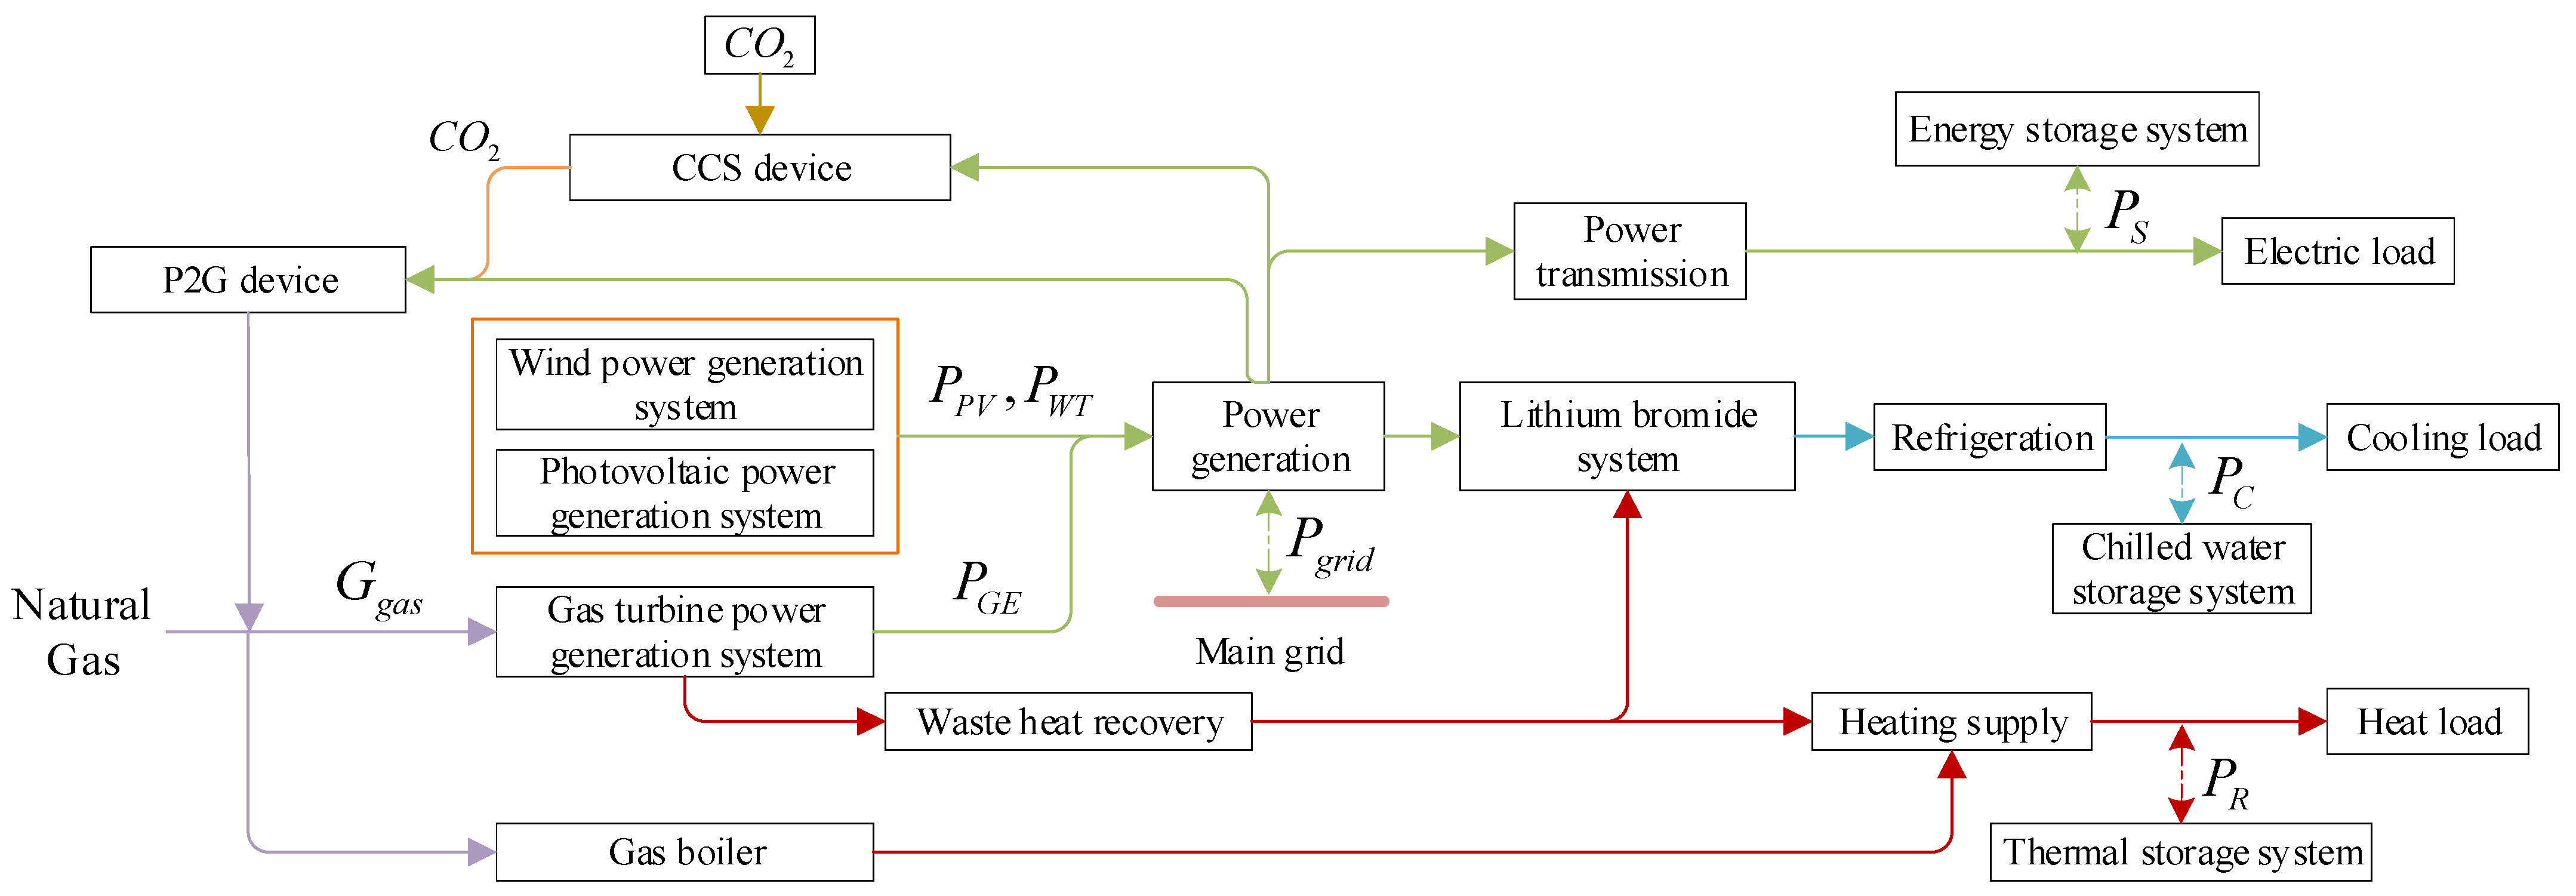
The architectural framework of the PIES system is illustrated in Figure 2, which depicts the principal coupled energy types within the system. These include electric energy, cooling energy, heat energy and natural gas. With regard to the electric energy aspect, the power input side is primarily constituted by wind and solar power generation systems and combustion turbine power generation systems. In this latter case, the combustion turbine system performs the function of power transmission and distribution by consuming natural gas. With regard to the interaction between the PIES system and the main grid, it is important to note that the prices for the purchase and sale of power are identical. These prices are based on the same-day step tariff, as specified in [25].
In terms of heat generation, the primary source is a gas boiler and a waste heat recovery device, which utilizes the waste heat generated by the combustion engine to provide heat. On the cooling side, the primary cooling system is a lithium bromide absorption chiller, which operates on the principle of generating cooling energy by consuming heat energy. In order to facilitate the flexible scheduling of heat and cold energy, this paper incorporates heat and cold energy storage systems for energy storage and release.
The supply of natural gas to the PIES is comprised of two primary sources: the gas grid and the P2G facility on the campus. The gas grid is the primary source, where C O 2 is captured and purified by CCS to obtain a high concentration of C O 2 for delivery to the P2G facility. The P2G facility generates A and B by electrolysis of water, combines H 2 and C O 2 into natural gas, and sends C H 4 to the gas pipeline for use in the combustion engine and gas boiler systems. Consequently, the utilization of P2G-CCS apparatus cannot only facilitate the system’s ability to utilize wind and solar energy but also facilitate the capture of C O 2 to produce natural gas for the system. This reduces the system’s natural gas purchase costs and carbon emissions, and thus enables the system to operate in a low-carbon manner.
In this study, based on the information of the relevant price data in the past day, the optimal scheduling of each piece of equipment’s output in the PIES in the past day is carried out with the optimization goal of minimizing the cost of one day’s operation of the system, so as to achieve the economic and low-carbon operation of the system. Therefore, the mathematical model of each piece of equipment’s output model in the PIES will be constructed according to the PIES system architecture, in which the natural gas supplier and the main network are the external energy suppliers of the system, and the remaining equipment is the internal equipment of the PIES. The specific mathematical model of each piece of equipment is shown in Section 3.

3. PIES Modelling

In the previous section, the system architecture of the PIES was established, and in this section, the mathematical modelling of the processing models of each device in the PIES will be continued. Among them, considering the spectral output uncertainty problem, this paper adopts the LHS method for scene generation, and then applies the fast antecedent elimination technique for scene reduction to deal with the wind and light output uncertainty problem. Each piece of energy supply equipment in the PIES sees the existence of coupling; therefore, this paper will establish a multi-energy coupling equipment power model in Section 2. At the same time, this paper takes the lowest cost of system operation as the optimization goal, and carries out the optimal scheduling of the output of each device before the day, and the scheduling process involves the relevant constraints to constrain the operation of the system. Therefore, this chapter will follow the construction of the mathematical model of the system optimization goal and constraints, so as to build up a mathematical model basis for the subsequent optimal scheduling research.

3.1. Wind Turbine Systems

Wind turbines convert the kinetic energy of the wind into mechanical energy through the wind turbine wheel. This wheel cuts the magnetic inductance to generate electric current after speeding up and then converts the mechanical energy into electric energy. Wind farms usually consist of several wind turbines, and the output power must be calculated according to factors such as wind velocity and wind direction. The power generation of wind turbines can be expressed as [26,27]:
P W T ( t ) = P r v 2 v i 2 v r 2 v i 2 , v i < v < v r P r , v r v < v f 0 , the   rest
where:
  • P W T : Actual power of the WTG.
  • P r : Rated power of the WTG.
  • v : Real-time wind velocity.
  • v i : Cut-in wind velocity of the turbine during normal operation.
  • v r : Rated wind velocity of the turbine.
  • v f : Maximum wind velocity of the turbine during normal operation.
  • t : Current moment.

3.2. Photovoltaic System

The PV system, comprising photovoltaic panels, converts solar energy into direct current (DC) electrical energy [28]. The fundamental principle is based on the photovoltaic effect, whereby the semiconductor material on the panels absorbs solar energy to be converted into electrical energy. The photovoltaic array model is described in Equation (2) as the PIES. The PV system’s active power output is primarily influenced by the intensity of light S on a given day, which can be expressed as:
P P V ( t ) = P S T C L C ( t ) L S T C ( 1 + μ ( T C T S T C ) )
where:
  • P P V : Actual power generated by the solar photovoltaic panel.
  • P S T C : Rated power of the solar photovoltaic panel.
  • L C : Current ambient light intensity.
  • L S T C : Light intensity in the ideal environment.
  • μ : Power temperature coefficient.
  • T C : Surface temperature of the solar photovoltaic panel at work.
  • T S T C : Surface temperature of the solar photovoltaic panel in the ideal environment.

3.3. Wind and Solar Scene Production and Weakening

The uncertainty of the system comes from two sources: turbine output and PV output. Wind turbine output is primarily affected by wind velocity and exhibits stochastic characteristics. PV output is predominantly contingent on outside weather conditions, particularly cloud cover. To effectively assess uncertainty, it is essential to propose probability density functions (PDFs) for wind and solar output [29]. It has been demonstrated that the forecast errors of wind turbine and PV output exhibit a Weibull distribution and a Beta distribution, respectively [30].
The PDF of wind turbine output:
f ( P W T ) = ( k W T r ) × ( P W T r ) k W T 1 exp [ ( P W T r ) k W T ]
where:
  • P W T : The actual operating power of the turbine.
  • k W T : The shape factor of the turbine output.
  • r : The scale factor.
The PDF of PV output:
f ( P P V ) = P P V η m A P V η P V cos θ A
where:
  • P P V : The actual operating power of the PV.
  • η m : The tracking rate at the maximum power point.
  • A P V : The radiation area of the PV.
  • η P V : The conversion efficiency.
  • θ : The solar incidence angle.

3.3.1. Latin Hypercube Sampling Based on Probability Distributions

The LHS method is employed to generate a multitude of scenarios, which may be considered a form of stratified sampling with an inverse function transformation [31]. This is utilized to simulate the potential wind and solar power generation, in the context of a probability distribution function of a random variable. LHS may be stratified by dividing the sampling probability intervals in equal parts, thereby ensuring the completeness of the sampling information and enriching the information of the samples.
In this paper, the PIES is made to interact with the smart grid for information interaction, and through the previous day’s wind velocity data and light information transmitted by the meteorological forecast central, it obtains the previous day’s power generation data for preprocessing, determines its probabilistic model parameters, and generates the correlation sample matrix of wind velocity and light intensity, respectively, and then transforms the data in the matrix into wind and solar power data to form the base scenario according to the wind and solar system model.

3.3.2. Scene Weakening

To reduce the computational burden and improve the overall effectiveness and response speed, the fast antecedent elimination technique is applied to reduce the scenarios with similar characteristics, and the typical scenarios are selected while retaining the characteristics of the original set of scenarios. The simplified typical wind and PV scenarios are combined into a new scenario set and their corresponding probabilities are calculated [32].
The probability corresponding to each scene generated by LHS is P s ( S = 1 , 2 , , N ) and satisfies P s 0 , S P s = 1 . Let each scene generation probability P s = 1 / N , ξ S ( S = 1 , 2 , , N ) denote the scene in the sample space, and the specific steps of the fast antecedent elimination technique are as follows:
Step 1: Calculate the two-paradigm number between each scene. This can be achieved by calculating the Euclidean distance, which allows for the determination of the elements that are more important according to their size. This enables the analysis of the characteristics and structure of the vector. The Euclidean distance formula is as follows:
d ( ξ i , ξ j ) = t = 1 24 ( ξ t , i ξ t , j ) 2
where:
  • d : The Euclidean distance.
  • ξ i / ξ j : Two scenes in space.
Step 2: Identify the set of the minimum value of the product of the number of paradigms of each pair of scenes ( ξ i , ξ j ) and the probability P s of the occurrence of scene ξ i in all the scenes. This set is denoted as set D and its expression is as follows:
D = min i 1 , 2 , , N i j P s d ( ξ i , ξ j )
Replace ξ i with ξ j , the closest Euclidean distance to ξ i in the scene set D . The probability of D 1 should then be added to the probability of D . ξ i should be eliminated, a new scene set D 1 formed and the number of elements in the scene set updated.
Step 3: Repeat steps 1 and 2 until the reduction requirements are met and the number of remaining scenes is reached. At this point, the run should be stopped. Otherwise, the reduction process should be continued.

3.4. Energy Storage Equipment

In light of the uncertainty of wind and solar output, this paper proposes the introduction of energy storage systems in the PIES to enhance the stability of the system and increase the wind and solar consumption rate. The energy storage equipment can be categorized into three main types: battery storage, thermal energy storage and cold energy storage [33]. The storage systems can help the PIES to improve the stability of the system’s function and increase the wind and solar consumption rate. Additionally, the incorporation of energy storage systems can increase the flexibility of the PIES, facilitate the optimal selection of energy sources, facilitate enhanced interaction between the system and the main grid, and facilitate the generation of higher economic returns.
(1)
Accumulators’ energy storage
In this paper, the lithium iron phosphate battery energy storage system with better safety and high-rate discharge performance is selected. With the breakthrough of battery formation and application technology, the technology of a lithium-ion battery in large-capacity, large-scale power storage system applications will be gradually improved. Its mathematical model is as follows:
E t e s = E t 1 e s + ( η e s , i n P t e s , i n μ t e s , i n P t e s , o u t μ t e s , o u t η e s , o u t ) Δ t
where:
  • E t e s / E t 1 e s : The storage power of the battery storage equipment at t, t − 1, kW.
  • η e s , i n / η e s , o u t : The charging and discharging efficiency of the battery.
  • P t e s , i n / P t e s , o u t : The charging and discharging power of the storage battery at t, kW.
  • μ t e s , i n / μ t e s , o u t : The starting and stopping working state of the energy storage equipment.
(2)
Heat and cold storage equipment
This paper presents a mathematical model for a heat and cold energy storage system that can be used to achieve peak shaving and valley filling of heat and cold energy. This model effectively improves the energy utilization and economy of the system. Its mathematical model is as follows:
E t h s = E t 1 h s + ( η h s , i n H t h s , i n μ t h s , i n H t h s , o u t μ t h s , o u t η h s , o u t ) Δ t
where:
  • E t h s / E t 1 h s : The stored thermal power of heat storage equipment at t, t − 1, kW.
  • η h s , i n / η h s , o u t : The charging and discharging efficiency of heat storage equipment.
  • H t h s , i n / H t h s , o u t : The charging and discharging power of thermal energy storage at t, kW.
  • μ t h s , i n / μ t h s , o u t : The starting and stopping working state of energy storage equipment.
    E t c s = E t 1 c s + ( η c s , i n Q t c s , i n μ t c s , i n Q t c s , o u t μ t c s , o u t η c s , o u t ) Δ t
    where:
  • E t c s / E t 1 c s : The stored thermal power of cold storage equipment at t, t − 1, kW.
  • η c s , i n / η c s , o u t : The charging and discharging efficiency of cold storage equipment.
  • Q t c s , i n / Q t c s , o u t : The charging and discharging power of thermal energy storage at t, kW.
  • μ t c s , i n / μ t c s , o u t : The starting and stopping working state of energy storage equipment.

3.5. Gas Internal Combustion Engine Systems

The internal combustion engine system generates electricity by consuming natural gas, while the waste heat generated by the internal combustion engine is utilized twice through a waste heat recovery unit. The mathematical model of the internal combustion engine system is as follow:
P t G E = G t g a s β G E
Q t G E = G t g a s β R E
where:
  • P t G E : The electrical energy generated by the combustion engine, kW.
  • G t g a s : The flow rate of natural gas, m 3 / h .
  • β G E : The electrical energy conversion efficiency of the combustion engine.
  • Q t G E : The available waste heat generated in the process of generating electricity by the combustion engine.
  • β R E : The waste heat recovery efficiency of the combustion engine.

3.6. Lithium Bromide Absorption Refrigeration System

The flue gas type lithium bromide absorption chiller utilizes a waste heat recovery device to absorb the waste heat generated by a gas-fired internal combustion engine for refrigeration. The mathematical model is as follows:
Q t B L = Q t b l β B L
where:
  • Q t B L : The refrigeration capacity of the lithium bromide unit.
  • Q t b l : The heat absorbed and consumed by the lithium bromide unit for refrigeration.
  • β B L : The conversion efficiency of the lithium bromide refrigeration unit.

3.7. The Waste Heat Recovery Device

The waste heat recovery device is mainly used to absorb the heat released during the operation of a gas internal combustion engine. Its mathematical model is as follows:
Q t b a c k = Q t g e β b a c k
where:
  • Q t b a c k : The heat generated by the waste heat recovery device.
  • Q t g e : The heat absorbed by the waste heat recovery device from the internal combustion engine.
  • β b a c k : The energy recovery efficiency of the waste heat recovery device.

3.8. P2G Device

The introduction of P2G technology into the PIES system, utilizing natural gas production, can effectively increase the wind and solar power integration rate and enhance the system’s economic benefits. The mathematical model of the P2G device is as follows:
G t P 2 G = P t P 2 G β P 2 G R t
where:
  • G P 2 G : The natural gas flow rate produced by P2G equipment.
  • P t P 2 G : The electrical power consumed by the P2G equipment.
  • β P 2 G : The electric-to-gas efficiency of the P2G equipment.
  • R t : The lower heating value.

3.9. Objective Function

The integrated energy system constructed in this study achieves coordinated planning, optimal operation and interactive correspondence between energy subsystems by integrating multiple energy sources such as natural gas, electricity, heat and cold in the region, and introduces P2G-CCS equipment to efficiently improve energy use efficiency while improving the diversified energy demand in the system. When considering the effect of scenery uncertainty on the economic efficiency of the system, the costs under typical scenarios are calculated separately and then summed up to obtain the final operating costs. The system operation optimization cost is determined by the sum of the integrated energy system’s cost of purchasing electricity from the main grid in the day-ahead market, the cost of purchasing gas at the natural gas end, the cost of operating and constructing each unit’s equipment, the cost of carbon emission constraints, and the cost of the penalty for wind and solar energy system abandonment, which is expressed as shown in the following equation:
min F P I E S = s = 1 n P s ( F s Y W + F s J S + F s , T , l C O 2 + F s Z W + F s Q + F s q f g )
where
  • F P I E S : The minimum operating cost of the integrated energy system for one day.
  • n : The number of generated scenarios.
  • P s : The probability of the scenario s occurring.
  • F s , T , l C O 2 : The carbon emission cost under scenario s .
    F s Y W = t = 1 24 ( k P V P s , t P V + k W T P s , t W T + k M R P s , t M R + k G E P s , t G E + k G B P s , t G B + k L B P s , t L B + k G B P s , t G B + k P 2 G P s , t P 2 G + k C C S P s , t C C S + y [ E S , C S , H S ] k y ( P y , s , t c + P y , s , t f ) )
    where
  • F s Y W : The maintenance cost of the system’s basic equipment under scenario s .
  • k P V / k W T / k M R / k G E / k G B / k L B / k P 2 G / k C C S / k y : The maintenance cost factors for P V , W T , M R , G E , G B , L B , P 2 G , C C S , and energy storage units ( E S , C S , H S ), respectively.
  • P s , t W T / P s , t M R / P s , t G E / P s , t G B / P s , t L B / P s , t P 2 G / P s , t C C S : The output power of each device at time t .
  • P y , s , t c : The energy storage charging power at time t .
  • P y , s , t f : The energy storage discharging power at time t (energy storage cannot be charged and discharged simultaneously at the same time).
    F s J S = i = 1 m ( h i a i , s , t )
    where
  • F s J S : The system construction cost of scenario s .
  • m : The number of equipment types in the system.
  • h i : The construction cost factor for equipment i .
  • a i : The installed capacity of equipment i .
    F s Z W = t = 1 24 ( G p r i c e 1 P s , t g r i d , c + G p r i c e 2 P s , t g r i d , f )
    where
  • F s Z W : The system power purchase costs of scenario s .
  • G p r i c e 1 : The main grid tariff, which is sold to the system at time-of-day tariffs.
  • G p r i c e 2 : The main grid power purchase price from the system.
  • P s , t g r i d : The electricity purchased by the system from the main grid.
  • P s , t g r i d , f : The electricity sold by the system to the main grid.
    F s Q = t = 1 24 G G a s p r i c e ( P s , t G B X G B + P s , t G E X M T P s , t P 2 G X M R )
    where
  • F s Q : The cost of gas purchased by the system from the natural gas side of scenario s .
  • G G a s p r i c e : The price of natural gas.
  • P s , t G B : The exchange power of gas boiler at time t .
  • P s , t G E : The electrical power generated by the combustion engine at time t .
  • P s , t P 2 G : The exchange power of P2G at time t .
  • X G B / X M T : The efficiency values of natural gas consumption in gas boilers and combustion engines, respectively.
  • X M R : The efficiency value of MR’s consumption of hydrogen to make natural gas.
    F s q f g = t = 1 24 c q f g ( P s , t Z f P s , t Z )
    where
  • F s q f g : The wind and light abandonment costs of the system under scenario s .
  • c q f g : The abandonment penalty cost factor.
  • P s , t Z f : The WT and PV power generation at moment t .
  • P s , t Z : The local consumption of WT and PV energy at time t .

3.10. Constraints

The PIES introduces constraint conditions to regulate the rational, efficient, and stable scheduling and utilization of various system devices, assisting the PIES in its objective of economic optimization through multi-period, multi-objective system day-ahead scheduling research. Specific constraints include:
(1)
Electric power balance constraint
P t l o a d = P t g r i d + P t Z + P t G E + P t e s , o u t P t P 2 G , e P t C C S P t e s , i n
P t Z = P t P V + P t W T
where:
  • P t l o a d : The system electrical load demand.
  • P t g r i d : At time t, the exchange power between the integrated energy system and the main grid, where a positive value indicates the system purchasing electricity from the main grid, and a negative value indicates the system selling electricity to the main grid.
  • P t Z : At time t, the sum of the output power from photovoltaic panels and wind turbines.
(2)
Cooling power balance constraint
Q t l o a d = Q t B L + Q t c s , o u t Q t c s , i n
where:
  • Q t B L : The cooling energy produced by lithium bromide.
  • Q t c s : The cooling energy exchange of the energy storage system.
  • Q t l o a d : The system cooling energy demand.
(3)
Thermal power balance constraint
H t l o a d = H t b a c k + H t G B + H t h s , o u t H t h s , i n H t B L
where:
  • H t l o a d : The thermal load demand of the system.
(4)
The safety constraint on power exchange of the main grid transmission lines
P t g r i d , max P t g r i d P t g r i d , max
where:
  • P t g r i d , max : The maximum allowable power exchange of the transmission lines.
(5)
The constraints of the electricity storage equipment
P t e s , min P t e s , i n P t e s , max P t e s , min P t e s , o u t P t e s , max μ t e s , i n + μ t e s , o u t 1 t = 1 24 ( μ t e s , i n + μ t e s , o u t ) R e s S O C e s , min E t e s S O C e s , max S O C e s , min = 0.1 S O C S O C e s , max = 0.9 S O C
where:
  • P t e s , max : The maximum charging and discharging power of the electricity storage equipment at time t.
  • P t e s , min : The minimum charging and discharging power of the electricity storage equipment at time t.
  • R e s : The maximum number of charge and discharge cycles allowed for the energy storage equipment within one day.
  • S O C : The installed capacity of the electricity storage system equipment, kWh.
  • S O C e s , min : The minimum state of charge threshold for the energy storage system.
  • S O C e s , max : The maximum state of charge threshold for the energy storage system.
(6)
The constraints of the thermal storage equipment
Q t c s , min Q t c s , i n Q t c s , max Q t c s , min Q t c s , o u t Q t c s , max μ t c s , i n + μ t c s , o u t 1 t = 1 24 ( μ t c s , i n + μ t c s , o u t ) R c s S O C c s , min E t c s S O C c s , max S O C c s , min = 0.1 S O C c S O C c s , max = 0.9 S O C c
where:
  • Q t c s , max : At time t, the maximum charging and discharging cooling power of the thermal energy storage equipment.
  • Q t c s , min : At time t, the minimum charging and discharging cooling power of the thermal energy storage equipment.
  • R c s : The maximum charging and discharging cycles allowed for thermal energy storage equipment within one day.
  • S O C c : The installed capacity of the cold energy storage system equipment, kWh.
  • S O C c s , min : The minimum capacity state threshold of the energy storage system.
  • S O C c s , max : The maximum capacity state threshold of the energy storage system.
(7)
Thermal energy storage device operating power constraint
H t h s , min H t h s , i n H t h s , max H t h s , min H t h s , o u t H t h s , max μ t h s , i n + μ t h s , o u t 1 t = 1 24 ( μ t h s , i n + μ t h s , o u t ) R h s S O C h s , min E t h s S O C h s , max S O C h s , min = 0.1 S O C h S O C h s , max = 0.9 S O C h
where:
  • H t h s , max : At time t, the maximum charging and discharging heat power of the thermal energy storage equipment.
  • H t h s , min : At time t, the minimum charging and discharging heat power of the thermal energy storage equipment.
  • R h s : The maximum number of heat charge and discharge cycles allowed for the thermal storage equipment within one day.
  • S O C h : The installed capacity of the thermal energy storage system equipment, kWh.
  • S O C h s , min : The minimum capacity state threshold of the energy storage system.
  • S O C h s , max : The maximum capacity state threshold of the energy storage system.
(8)
The operational power constraints of the internal combustion engine equipment
P t G E , min P t G E P t G E , max P t G E , d o w n Δ t P t G E P t - 1 G E P t G E , u p Δ t
where:
  • P t G E , max : The maximum operating power of the gas engine.
  • P t G E , min : The minimum operating power of the gas engine.
  • P t G E , u p : The maximum ramping-up power of the gas engine unit.
  • P t G E , d o w n : The maximum ramping-down power of the gas engine unit [34].
(9)
Lithium bromide equipment operating power constraint
Q t B L , min Q t B L Q t B L , max
where:
  • Q t B L , max : The maximum operating power of the lithium bromide system.
  • Q t B L , min : The minimum operating power of the lithium bromide system.
(10)
Power to gas (P2G) equipment operating power constraint
0 P t P 2 G P t P 2 G , max
where:
  • P t P 2 G , max : The maximum operating power allowed for P2G equipment.

3.11. Stepped Carbon Trading Mechanism

(1)
Carbon emission calculation
The carbon emission modeling calculation of the carbon emission equipment in the system is carried out to further improve the calculation accuracy of the system’s carbon transaction cost. The actual carbon emission calculation model is as follows:
E t C O 2 , a = E t g r i d + E t Z + E t G E + E t G B + E t E S E t g r i d = ρ g P t g r i d E t Z = ( ρ p P t p v + ρ w P t w ) E t G E = ρ m ( κ h P t G E + H t G E ) E t G B = ρ b H t G B E t E S = ρ e H t E S
where:
  • E t C O 2 , a : The actual carbon emission of the equipment.
  • ρ g / ρ p / ρ w / ρ m / ρ b : The carbon emission coefficients of power grid purchase, wind and solar power generation, gas turbine, gas boiler and energy storage, respectively.
(2)
Carbon quota calculation
E t C O 2 , b = t = 1 T ( E t g r i d + E t Z + E t G E + E t G B + E t E S ) E t g r i d = ϖ g P t g r i d E t Z = ( ϖ p P t p v + ϖ w P t w ) E t G E = ϖ m ( κ h P t G E + H t G E ) E t G B = ϖ b H t G B E t E S = ϖ e H t E S
where:
  • E t C O 2 , b : The carbon emission quota of equipment.
  • ϖ g / ϖ p / ϖ w / ϖ m / ϖ b : Initial carbon emission coefficient of power grid purchase, wind and solar power generation, gas turbine, gas boiler and energy storage, respectively.
  • T : One operating cycle, taking the value of 24 h a day.
Initial carbon allowances are the maximum amount of carbon dioxide that can be legally emitted in the carbon market. By limiting the total amount of carbon emissions, the government encourages companies to reduce their emissions through internal optimization or external trading.
Carbon emission allowances for each carbon source are shown in Table 1.
(3)
Carbon trading mechanism
The stepped carbon trading mechanism is a system that sets different carbon trading prices according to the different carbon emission intensities of enterprises. The difference between actual carbon emissions and carbon emission quotas is divided into multiple intervals. The higher the difference is, the higher the unit carbon trading price is, and the higher the additional cost that enterprises need to pay [35]. The cost mathematical model is as follows:
E t r , t = t = 1 T E t C O 2 , a E t C O 2 , b
F T , l C O 2 = λ ( 1 + 2 ) ( E t r , t + l ) , E t r , t l λ ( 1 + 2 ) l + λ ( 1 + ) E t r , t , l E t r , t 0 λ E t r , t , E t r , t < l λ ( 1 + α ) ( E t r , t l ) + λ l , l E t r , t 2 l λ ( 1 + 2 α ) ( E t r , t 2 l ) + λ ( 2 + α ) l , 2 l E t r , t 3 l λ ( 1 + 3 α ) ( E t r , t 3 l ) + λ ( 3 + 3 α ) l , 3 l E t r , t 4 l λ ( 1 + 4 α ) ( E t r , t 4 l ) + λ ( 4 + 6 α ) l , E t r , t 4 l
where:
  • F T , l C O 2 : Stepped carbon transaction costs.
  • λ : Carbon trading base price.
  • E t r , t : Actual carbon emissions minus carbon quotas.
  • l : The length of carbon emissions interval.
  • α : Trading price growth rate.
  • : The growth rate of transaction base price.

4. Multi-Objective Optimization Solution

Taking Equation (15) as the objective function and Equations (21) to (31) as the constraints, the system model can be summarized in the following form by optimizing the day-ahead power scheduling for each device of the system to achieve the intra-day economic operation of the system:
min F P I E S = s = 1 n P s ( F s Y W + F s J S + F s , T , l C O 2 + F s Z W + F s Q + F s q f g ) F s Y W = t = 1 24 ( k P V P s , t P V + k W T P s , t W T + k M R P s , t M R + k G E P s , t G E + k G B P s , t G B + k L B P s , t L B + k P 2 G P s , t P 2 G + k C C S P s , t C C S + y [ E S , C S , H S ] k y ( P y , s , t c + P y , s , t f ) ) F s J S = i = 1 m ( h i a i , s , t ) F s Z W = t = 1 24 ( G p r i c e 1 P s , t g r i d , c + G p r i c e 2 P s , t g r i d , f ) F s Q = t = 1 24 G G a s p r i c e ( P s , t G B X G B + P s , t G E X M T P s , t P 2 G X M R ) F s q f g = t = 1 24 c q f g ( P s , t Z f P s , t Z ) E . q . ( 35 ) s . t . E . q . ( 21 ) ( 31 )
In the PIES, a day is considered to be divided into 24 time segments, with each hour as a unit, and it is assumed that the operation data of each system module are constant in the unit time.
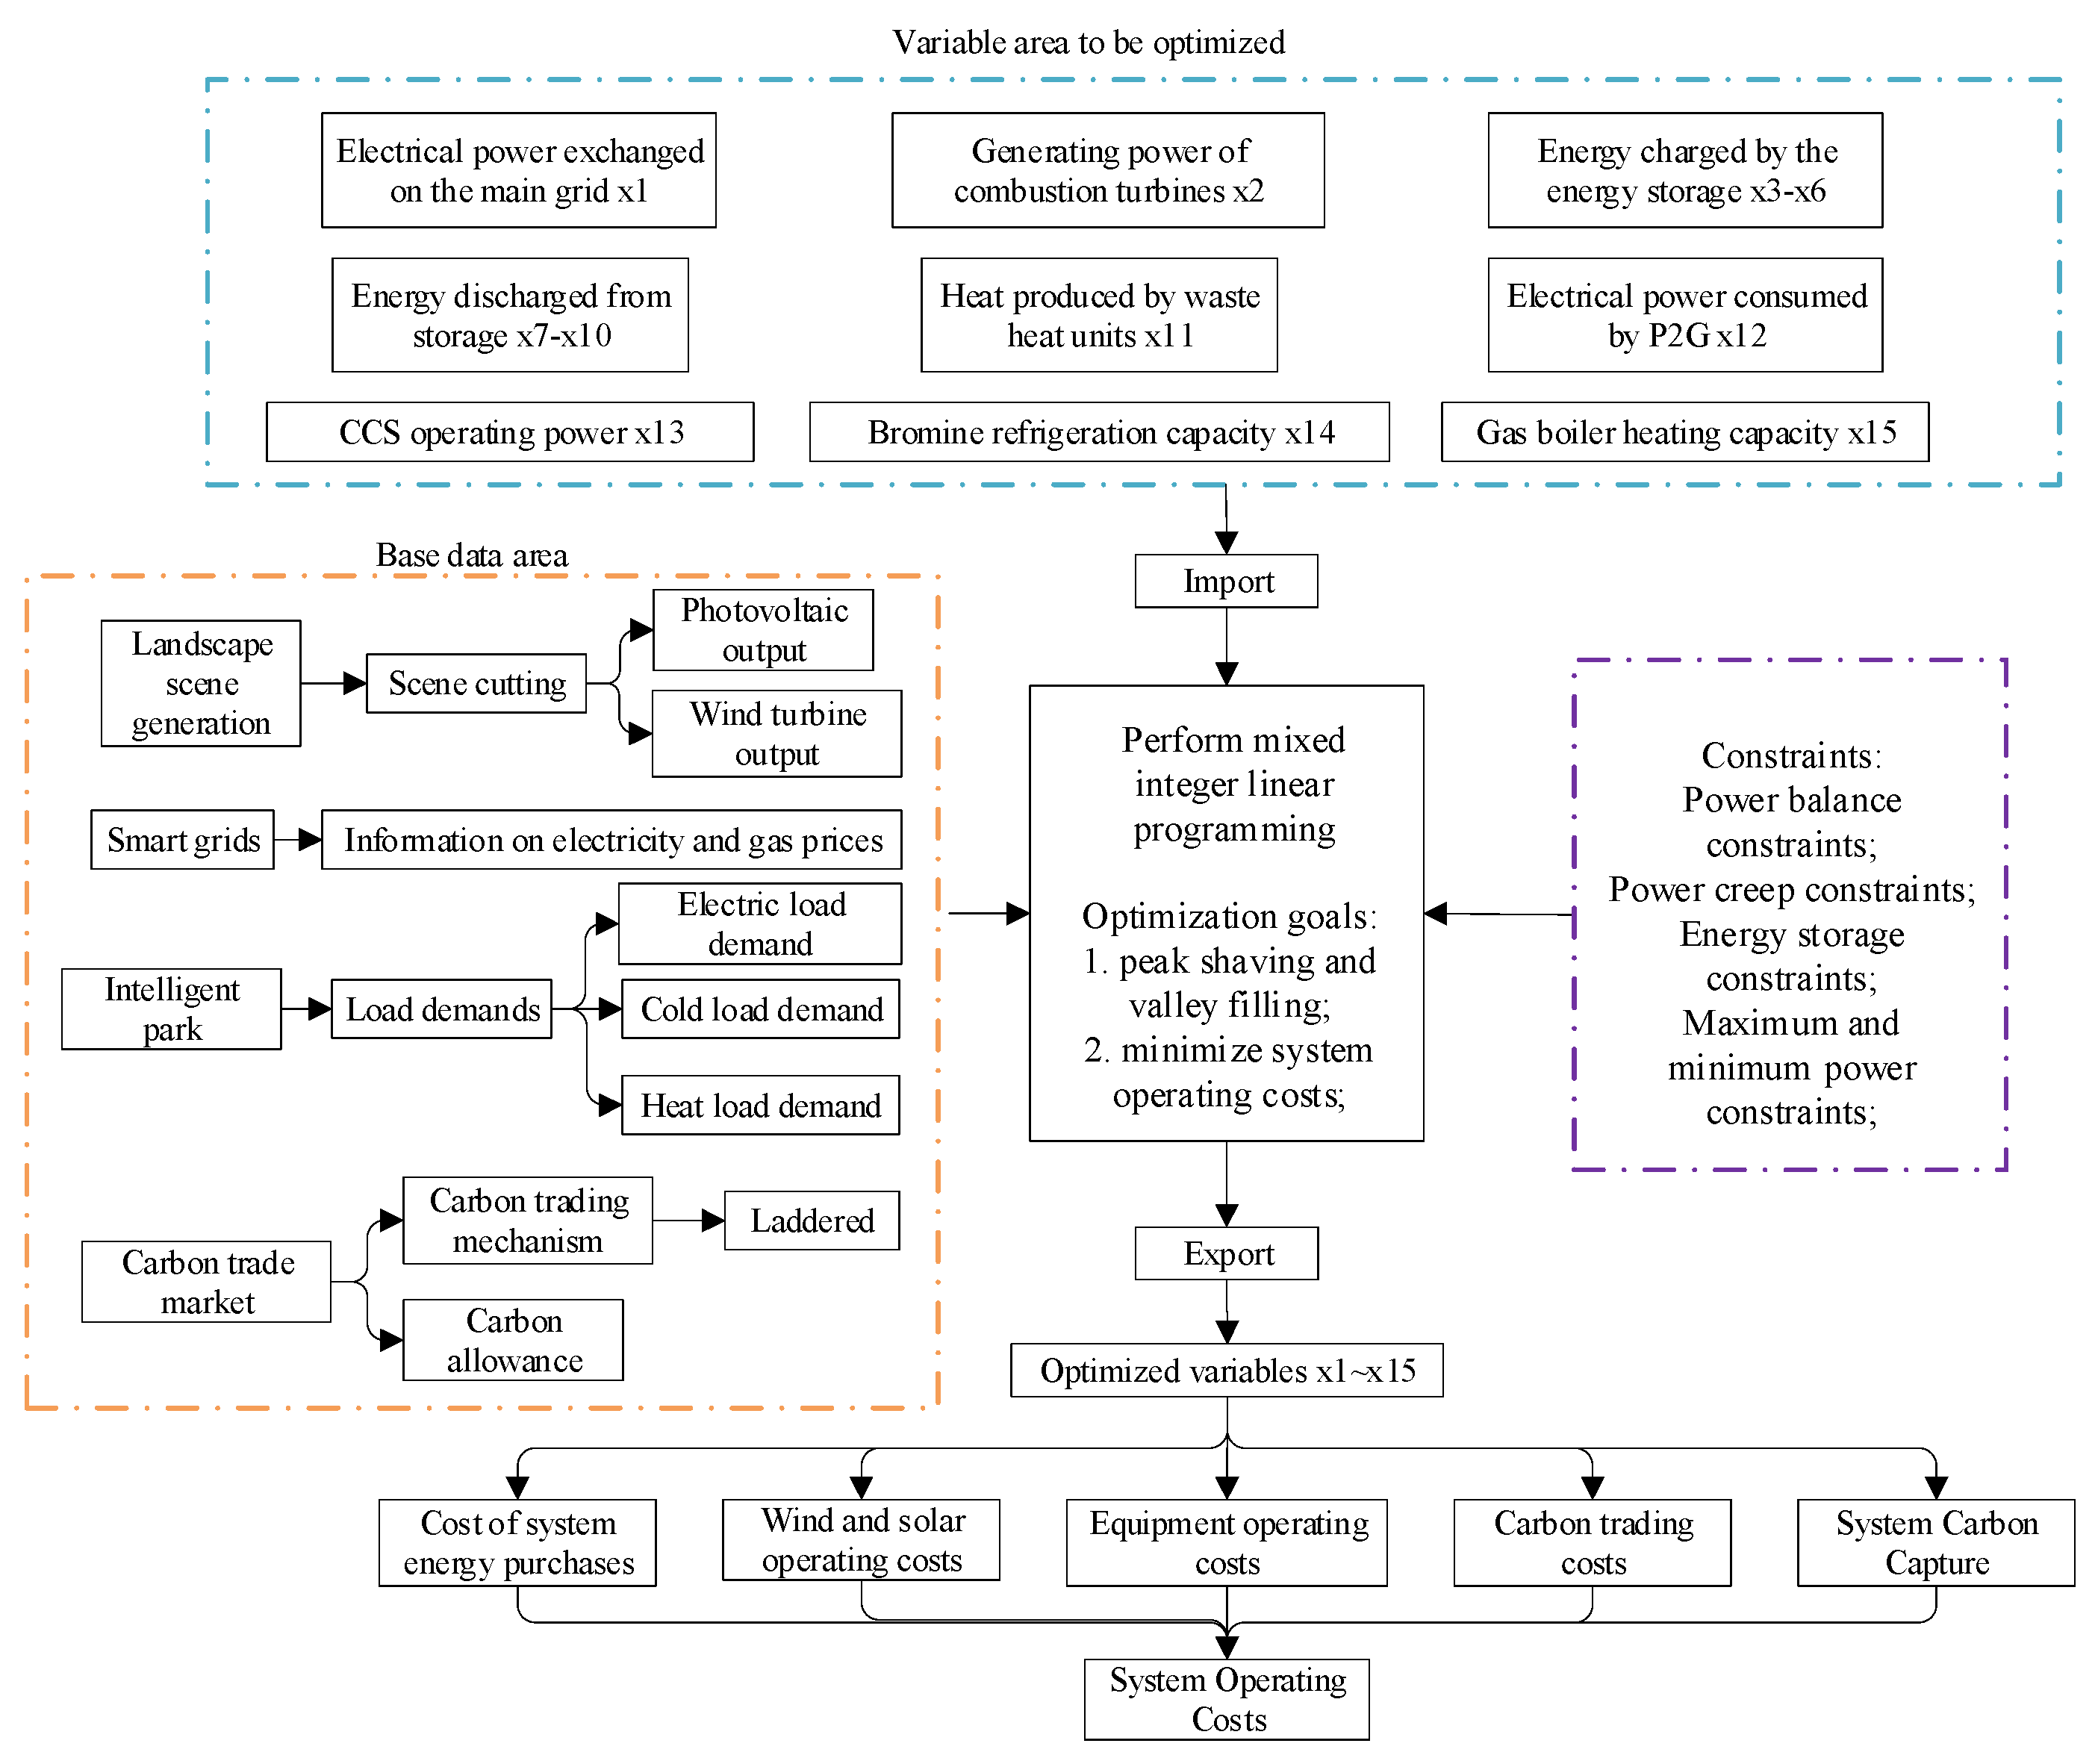
Its system structure and algorithm correlation diagram is shown in Figure 3. The algorithm takes the minimum system operation cost as the goal, which in addition to the operation and maintenance cost of the integrated energy system in the park itself includes the cost of wind and light abandonment and the cost of carbon trading, and the constraints include the system energy supply and balance constraints, the equipment climbing constraints, and the equipment starting and stopping constraints. Since the model built in this study is a mixed integer linear programming model, this study considers the branch bounding algorithm and uses CPLEX for solving the problem. The optimal scheduling is shown in Figure 4, and the specific steps are shown below:
Step 1: The wind and solar output scene is generated by Latin hypercube sampling, and then the scene reduction is carried out by using the fast previous generation elimination technology. Five typical wind and solar output scenes and the corresponding probabilities of each scene are obtained, and the wind and solar output data are transmitted to the model to be optimized.
Step 2: Obtain day-ahead information such as the ladder electricity price and gas price.
Step 3: Model each piece of equipment in the integrated energy system, construct the system carbon emission calculation model and the carbon trading mechanism model, and determine the optimization variables of each piece of equipment’s output and their relevant parameters.
Step 4: Perform mixed integer linear programming, add conditional constraints, use the branch and bound algorithm, and use CPLEX for the optimal solution.
Step 5: Determine whether there is an optimal solution, and whether it is an integer; if not, select a non-integer solution variable to generate a branch. If yes, it is judged to search all branches, and the optimal solution is obtained by circular solution comparison.
Step 6: Obtain the solution results, output the output data of each piece of terminal equipment at each time, the system operation cost, carbon transaction cost and other information.
The optimization algorithm used by CPLEX can provide an accurate optimal solution; therefore, in this paper, for the integrated energy system model, and for the mixed integer linear programming problem, the CPLEX solver is used to find the best optimal scheduling solution [36].

5. Example Analysis and Simulation

5.1. Basic Data

In this paper, the purchase and sale transactions between the PIES and the main grid are carried out based on time-sharing tariffs, and the tariff data are shown in Table 2, where the system purchases power from the grid according to the corresponding peak and valley time-sharing tariffs, and sells power to the main grid at a price of 0.36 yuan to save costs and improve economic efficiency in the process of optimal scheduling.
In order to assess and compare the carbon emission levels of different equipment so as to take corresponding emission reduction measures, carbon emission coefficients are used to express the carbon emissions per unit of production, and the specific values are shown in Table 3.
Table 4 shows the values of the parameters such as power size, capacity range and number of times of charging and discharging energy for each device in the model of this paper.

5.2. Generation and Reduction of Landscape Scenes

In order to solve the wind power uncertainty problem, this paper adopts the previously described method to process the wind power uncertainty problem based on the day-ahead prediction data of wind power, as shown in Figure 5. Firstly, 1000 wind power scenarios are generated by using the Latin hypercubic sampling method, and then, five typical wind power scenarios are obtained by using the probability distance-based fast antecedent elimination technique to reduce them, The probability corresponding to each scenario is shown in Table 5.
The method used brings five typical scenarios of wind power output into the system optimal scheduling model for optimal operation to obtain the system’s operation cost under different scenarios, then probabilistically sum up the operation costs under the five typical scenarios to obtain the final system’s operation cost, and then carry out the optimal scheduling strategy of the system with the minimum operation cost through the solver to obtain the optimal operation scheduling strategy of the system considering the uncertainty of the wind power output.

5.3. Example Validation Analysis

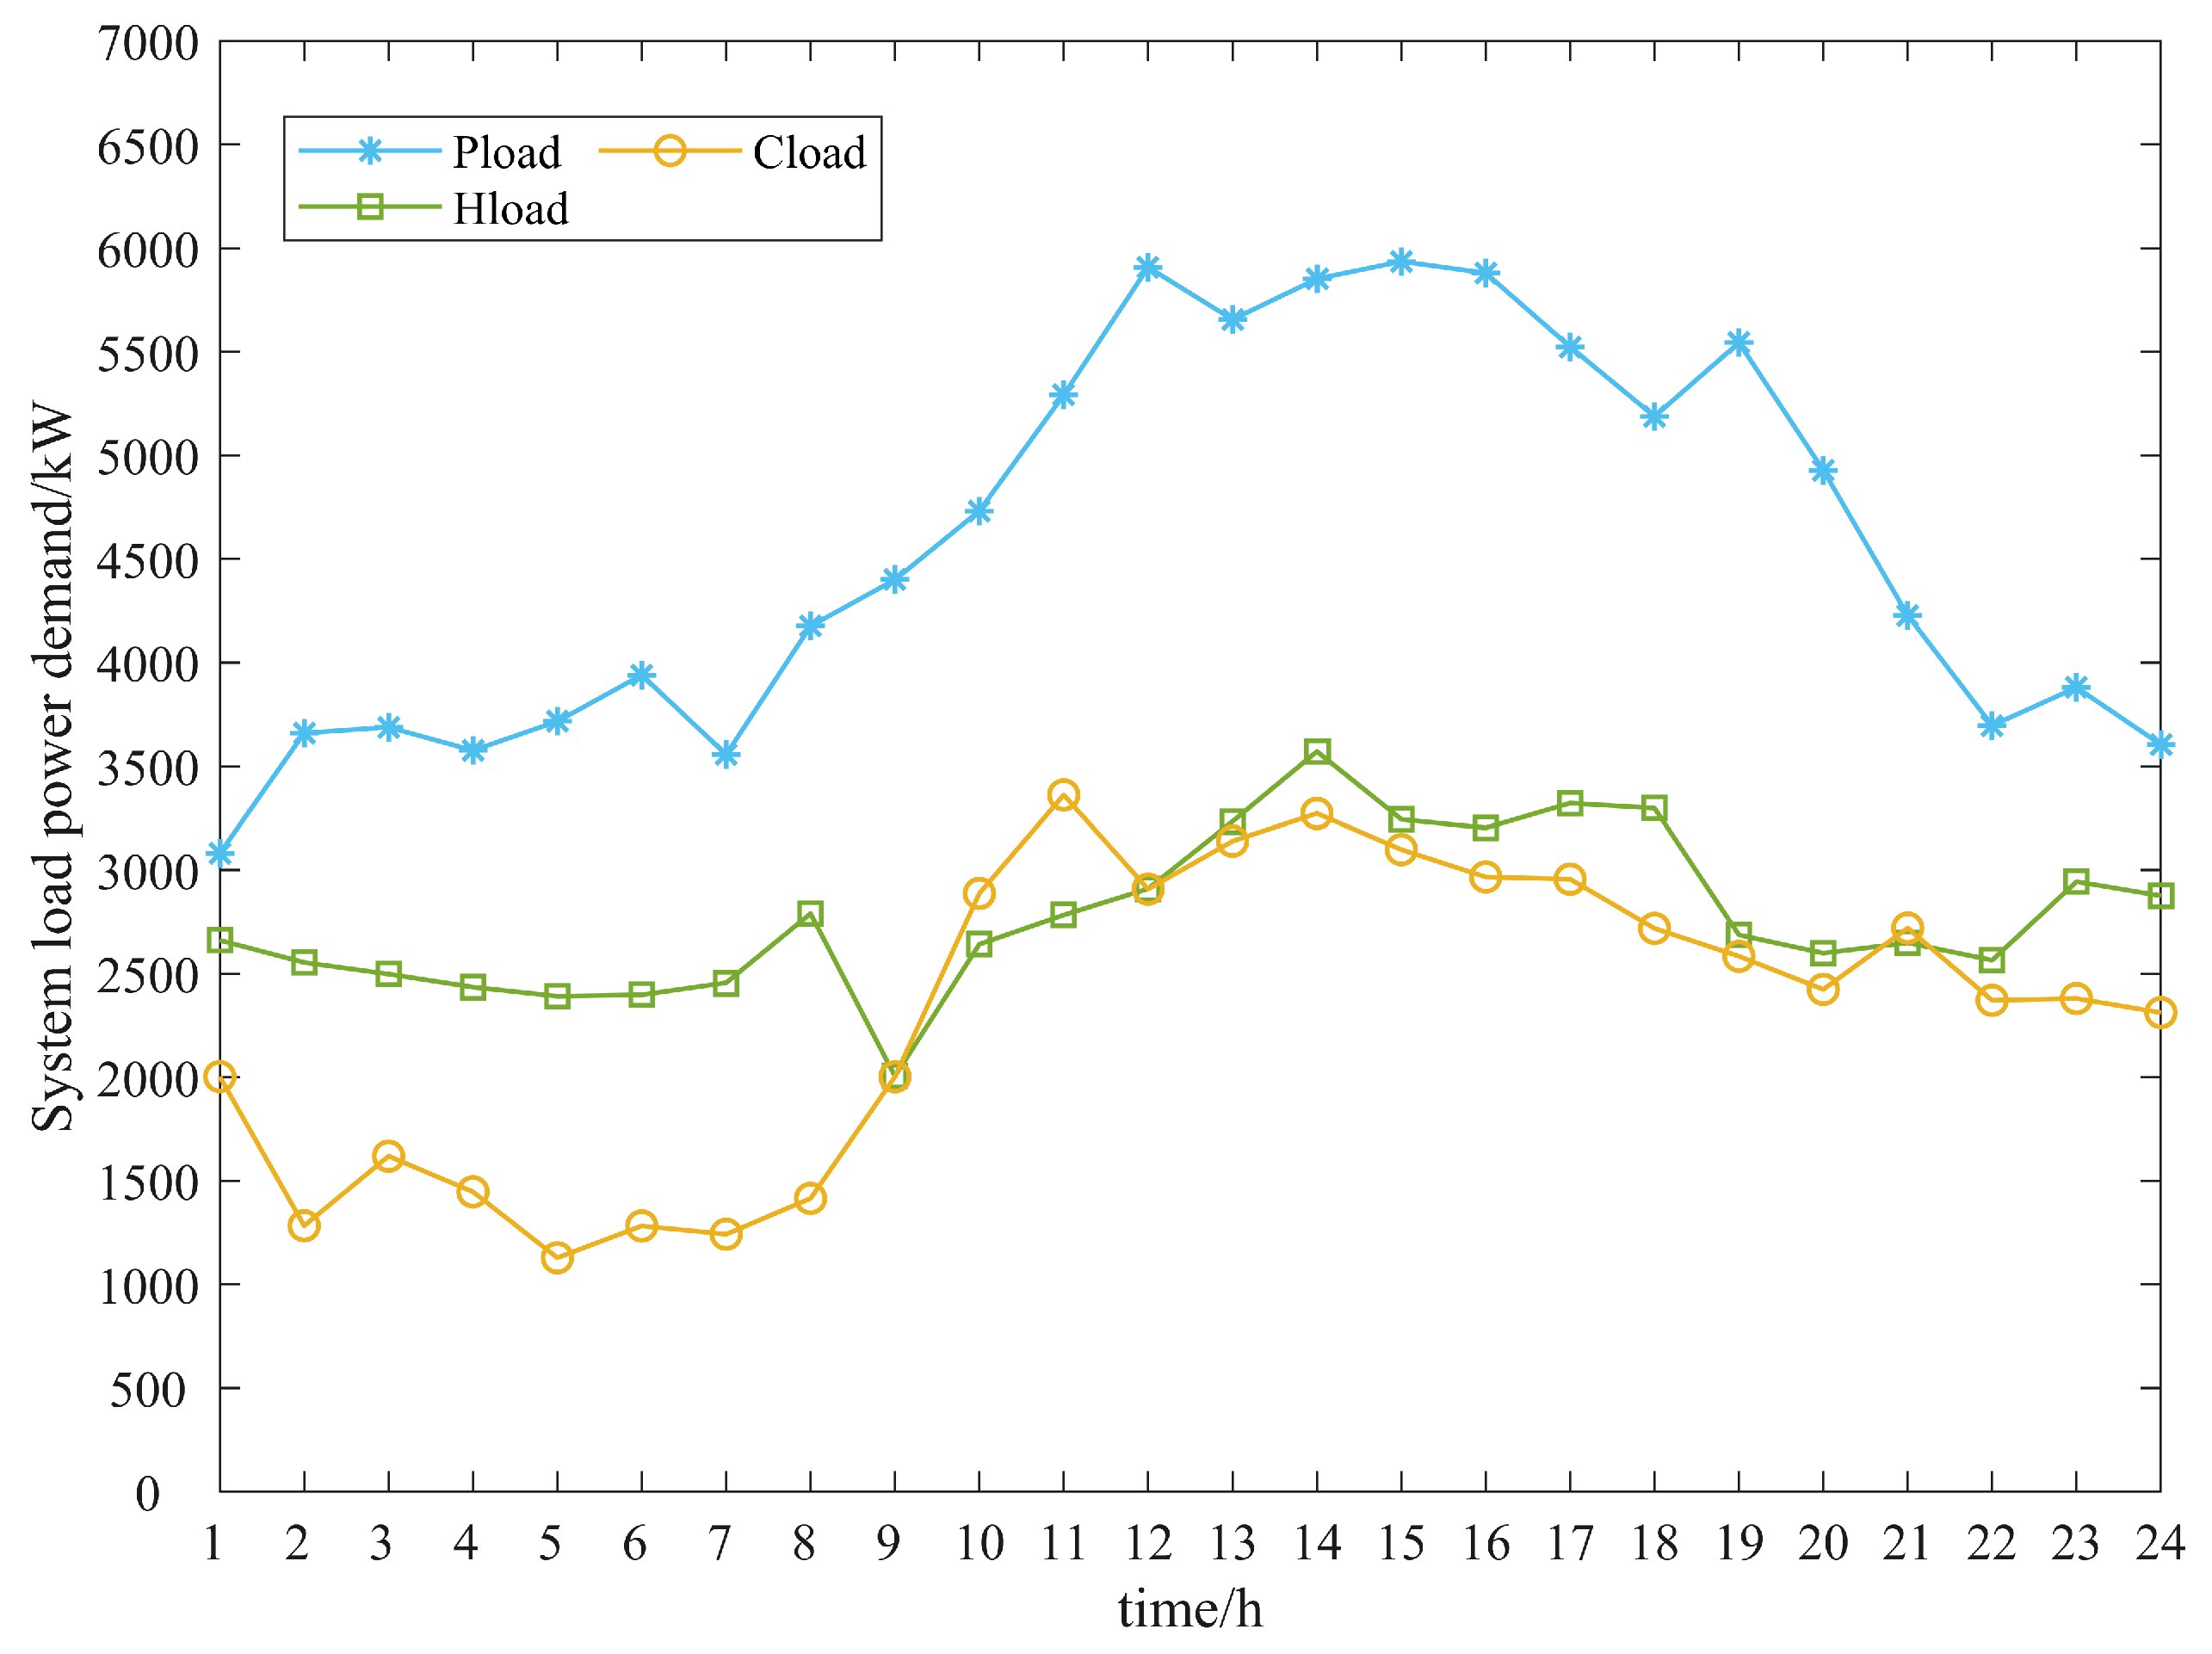
To verify the effectiveness of the economic optimal scheduling strategy of the integrated energy system proposed in this paper considering wind power uncertainty and P2G-CCS, this paper takes the data of a typical integrated energy system park in Hubei as an example, as shown in Figure 6, which gives the initial data of the system’s electric, heat and cold energy load demand, where P l o a d is the electric load, C l o a d is the cold load, and H l o a d is the heat load. This paper also adopts the stepped carbon trading mechanism to carry out a comparative analysis of the system’s operating costs under different scenarios, and the selected scenarios are shown as follows, with Scenario 4 being the scenario model proposed in this paper:
Scenario 1: Without considering the uncertainty of wind and solar processing, P2G-CCS is not introduced;
Scenario 2: Without considering the uncertainty of wind and solar power output, the introduction of P2G-CCS is considered;
Scenario 3: Considering the uncertainty of wind and solar output, the introduction of P2G-CCS is not considered;
Scenario 4: Considering the uncertainty of wind and solar power output, the introduction of P2G-CCS is considered.
Table 6 shows the comparative analysis results of the PIES’s operating costs and other parameters in different scenarios. From Scenario 2 and Scenario 4, it can be seen that after the introduction of P2G-CCS in the system architecture of this paper, due to the scheduling flexibility of P2G-CCS, it can effectively help the system reduce the wind and light curtailment rate, reduce the carbon emissions of the system and thus reduce the operating costs of the system. In scenario 4, when considering the uncertainty of wind and solar output, on the basis of meeting the demand of various energy loads, the rate of wind and solar abandonment is basically 0, and the carbon emission has a downward trend. It not only solves the problem of the wind and solar consumption of the system, and reduces the carbon emissions of the system, but also further realizes the goal of the low-carbon economic operation of the PIES more effectively and saves economic costs.
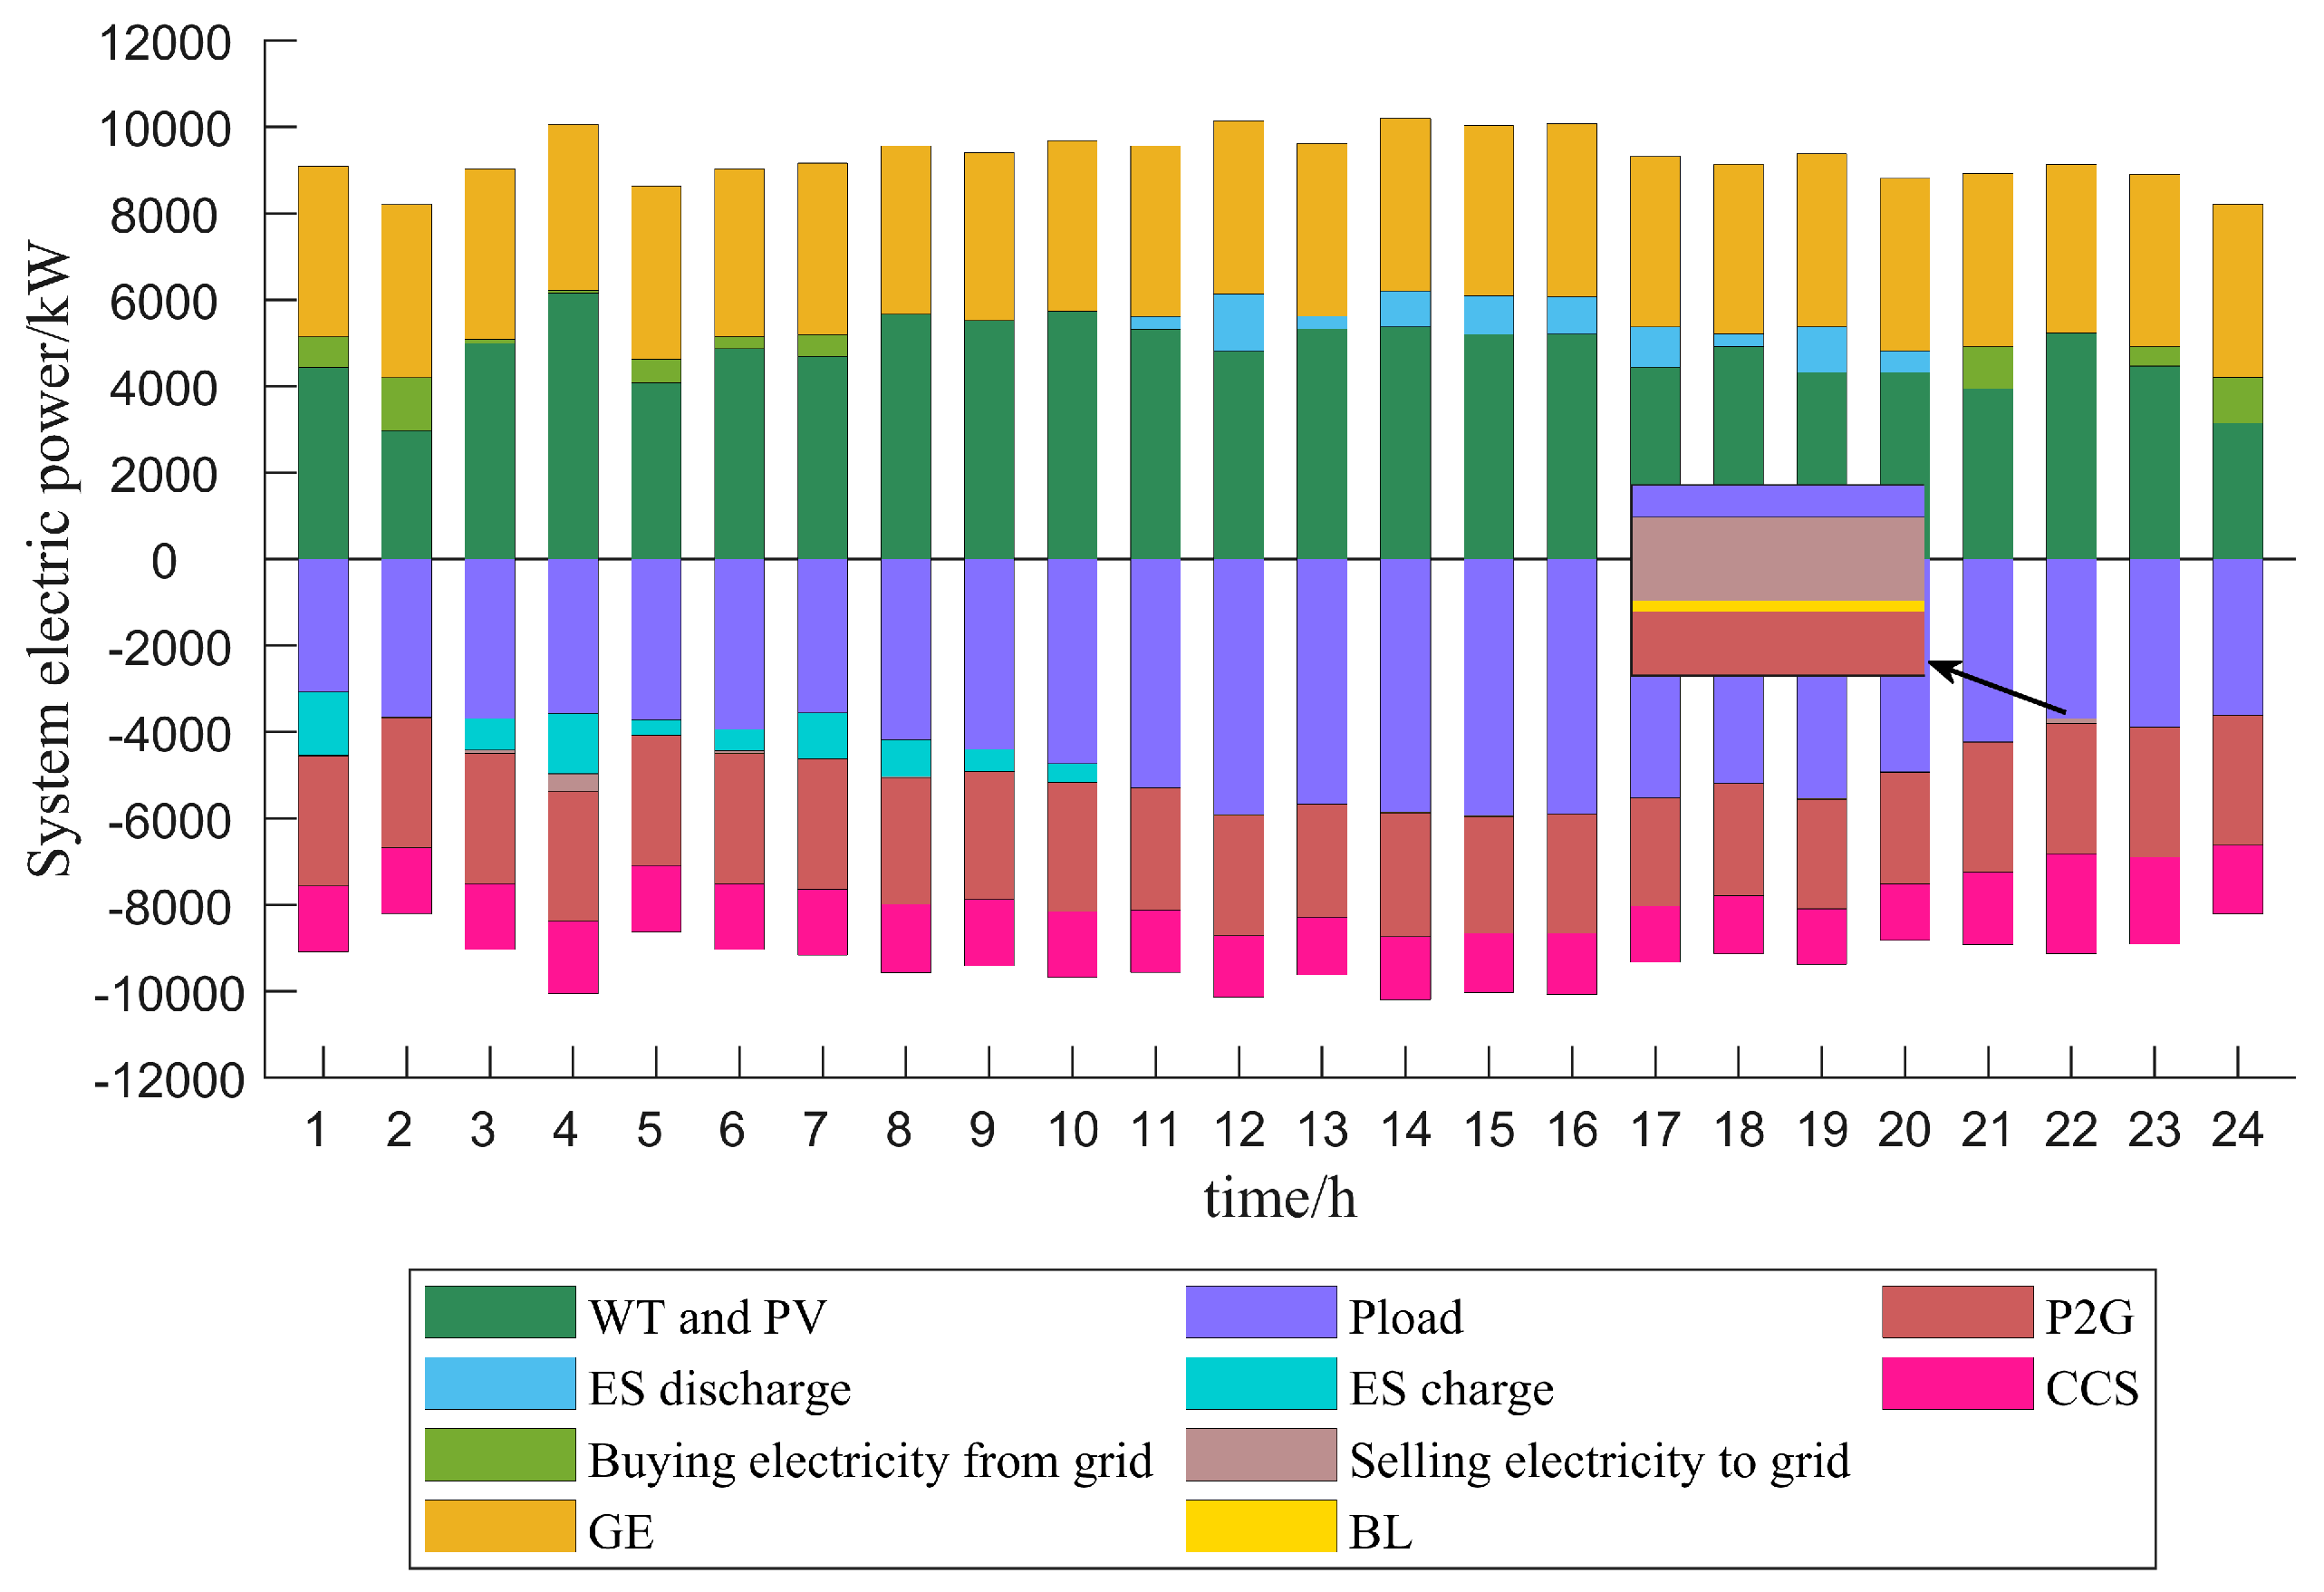
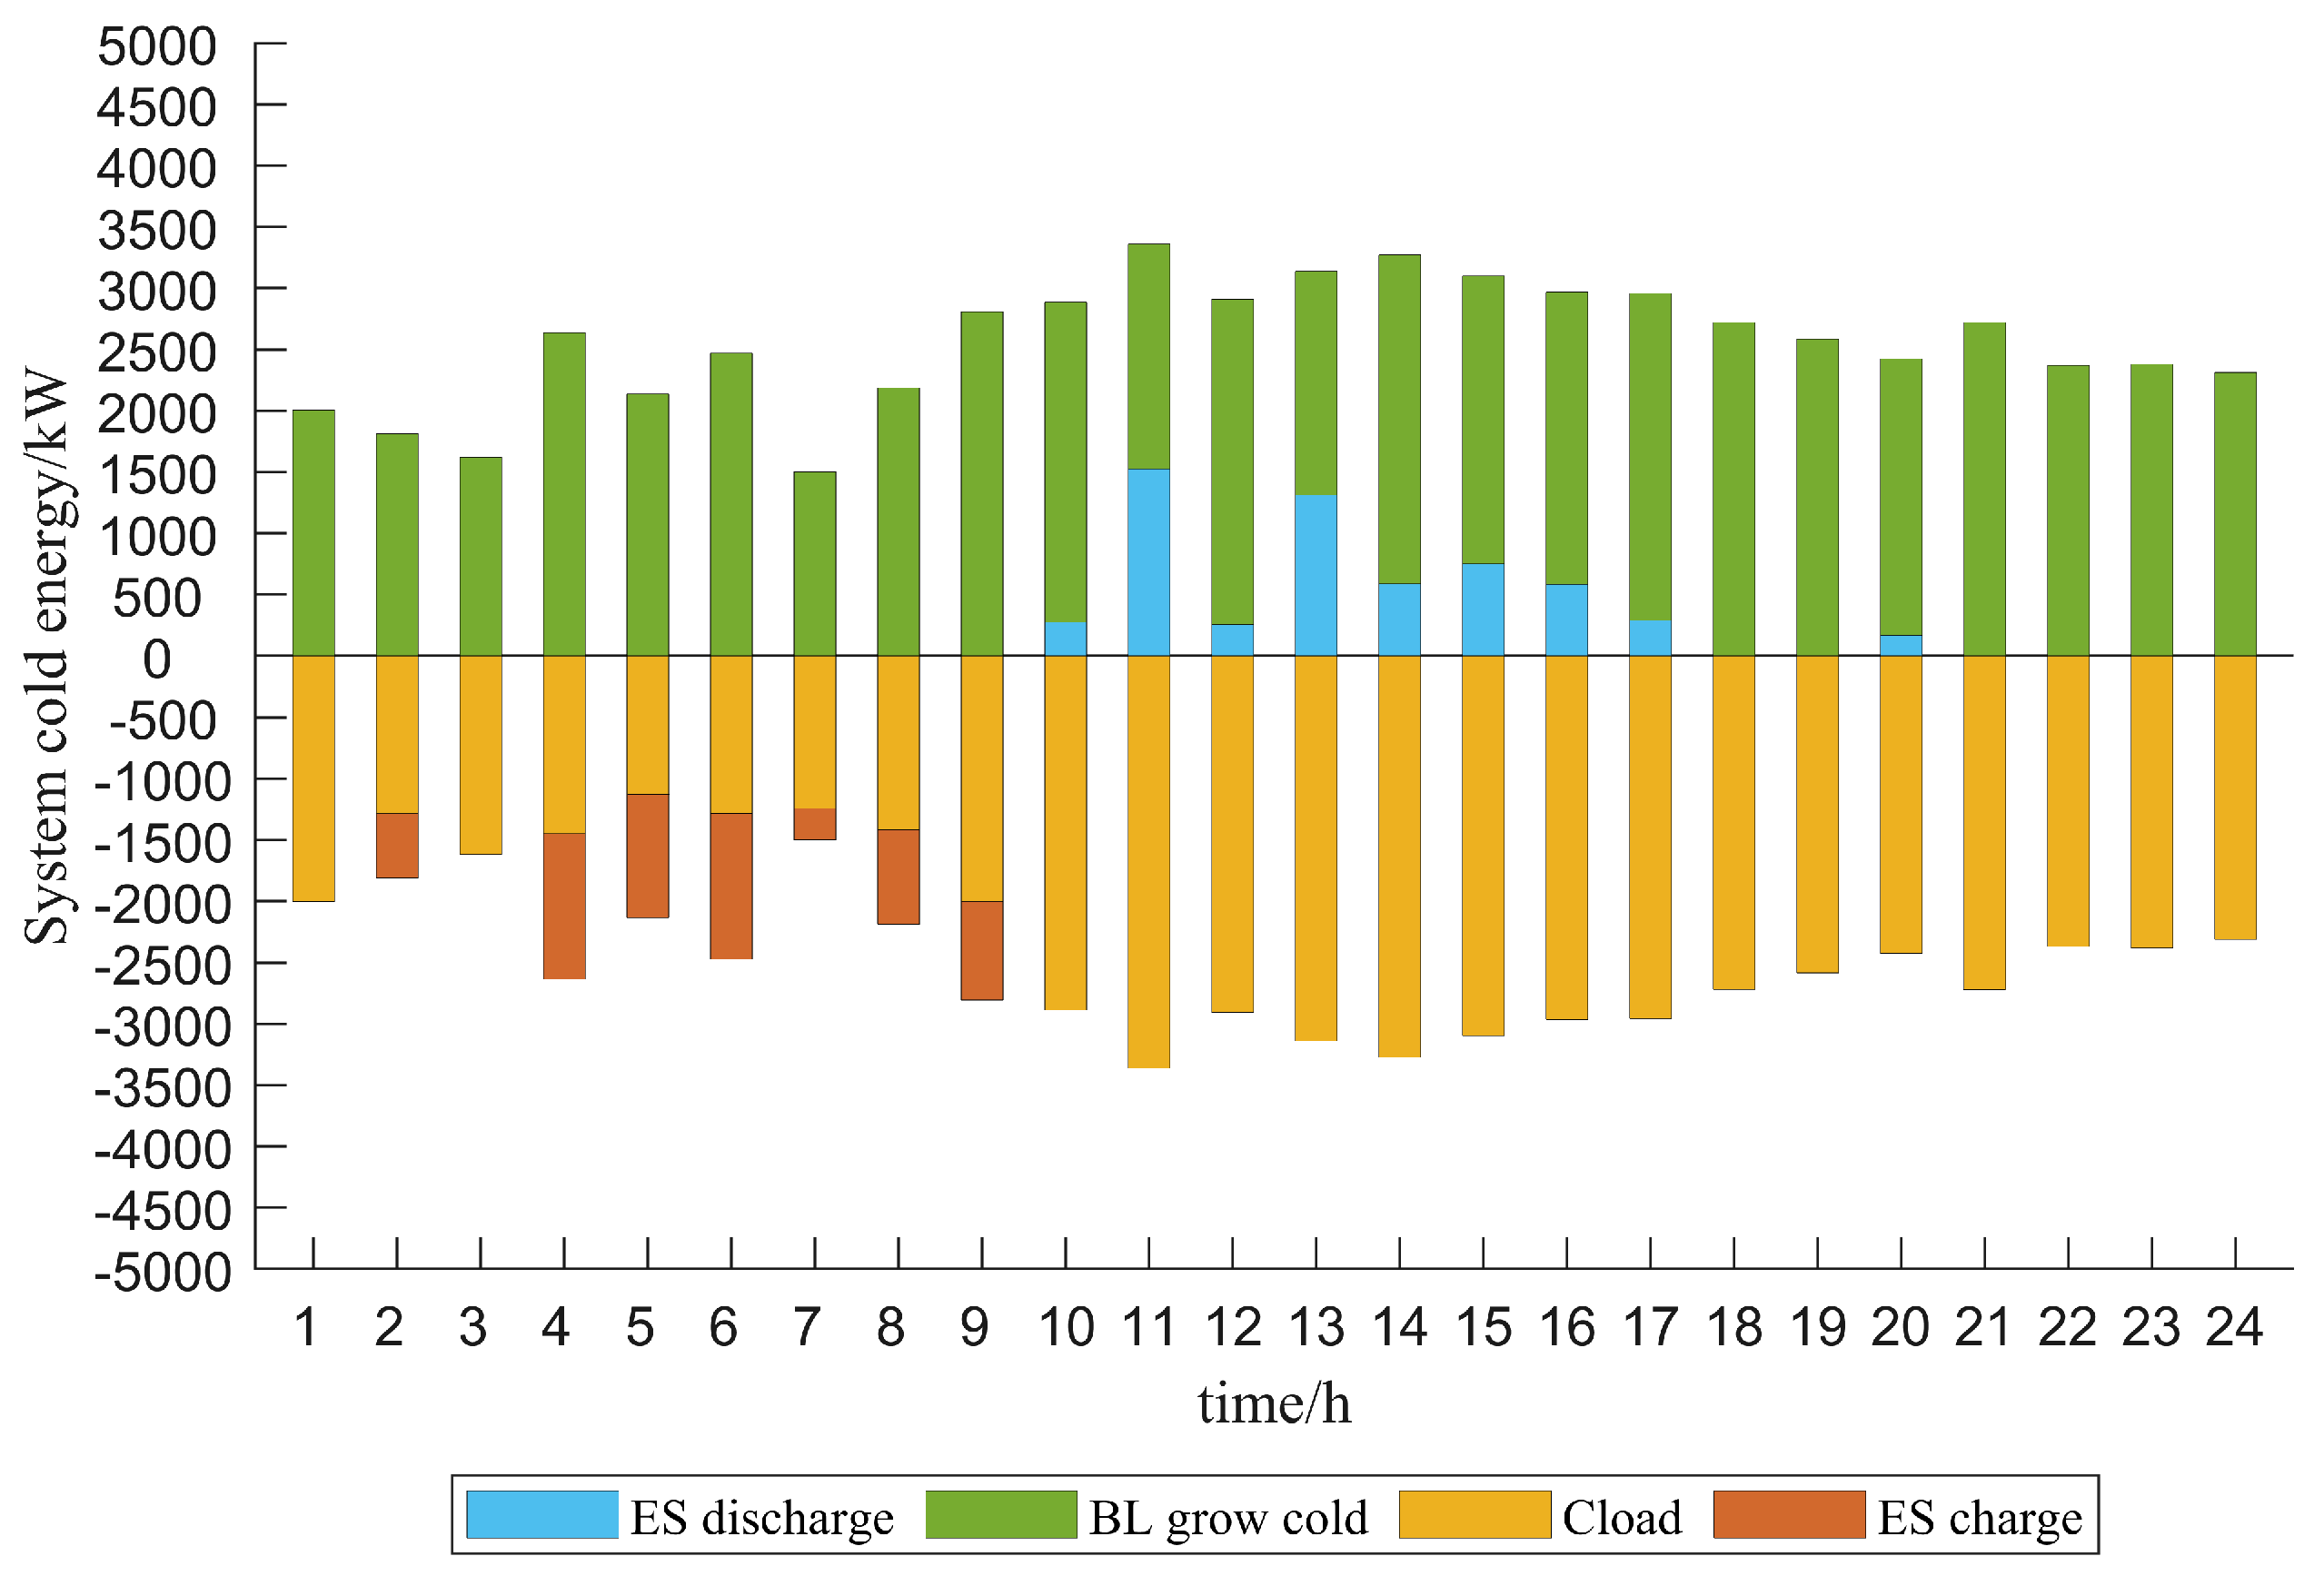
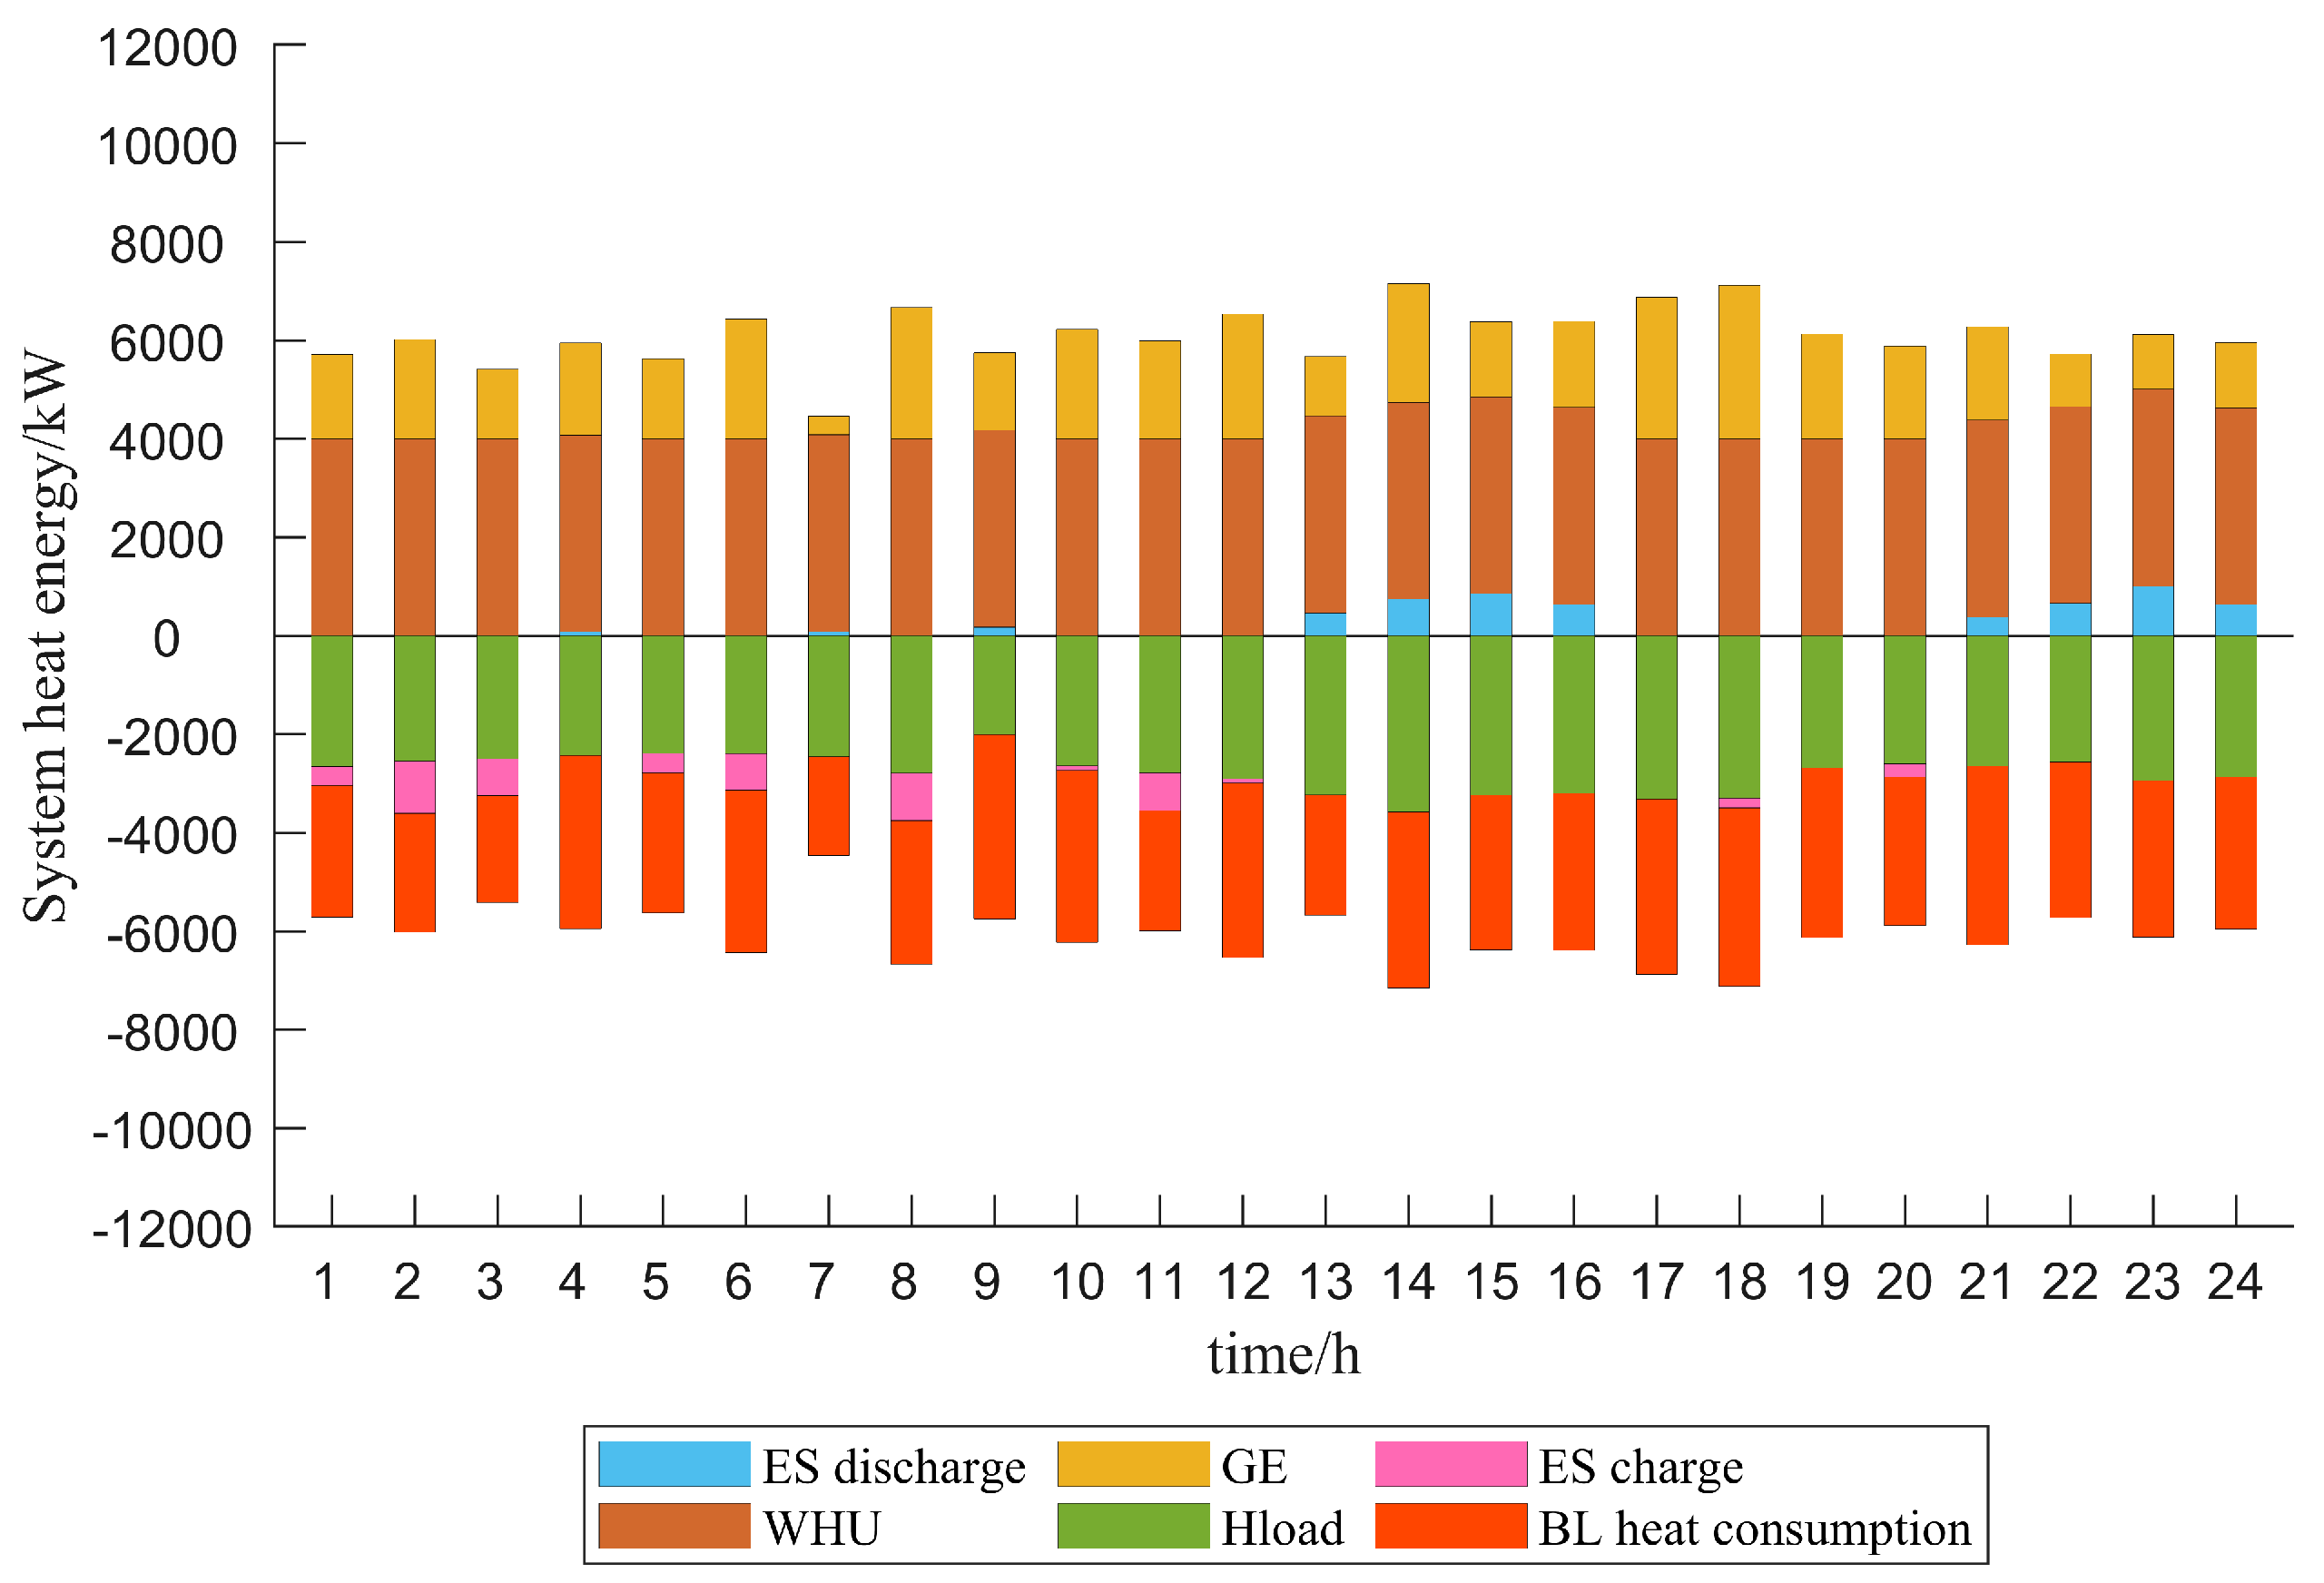
In the Scenario 4 model, the energy supply optimization scheduling results of the system’s equipment are shown in Figure 7, Figure 8 and Figure 9. In the diagram, the positive value of each energy storage device indicates that the energy storage is discharged, and the negative value indicates that the energy storage system is charged. The positive value of the main grid indicates that the park buys electricity from the main grid, and the negative value indicates that the park sells electricity to the main grid.
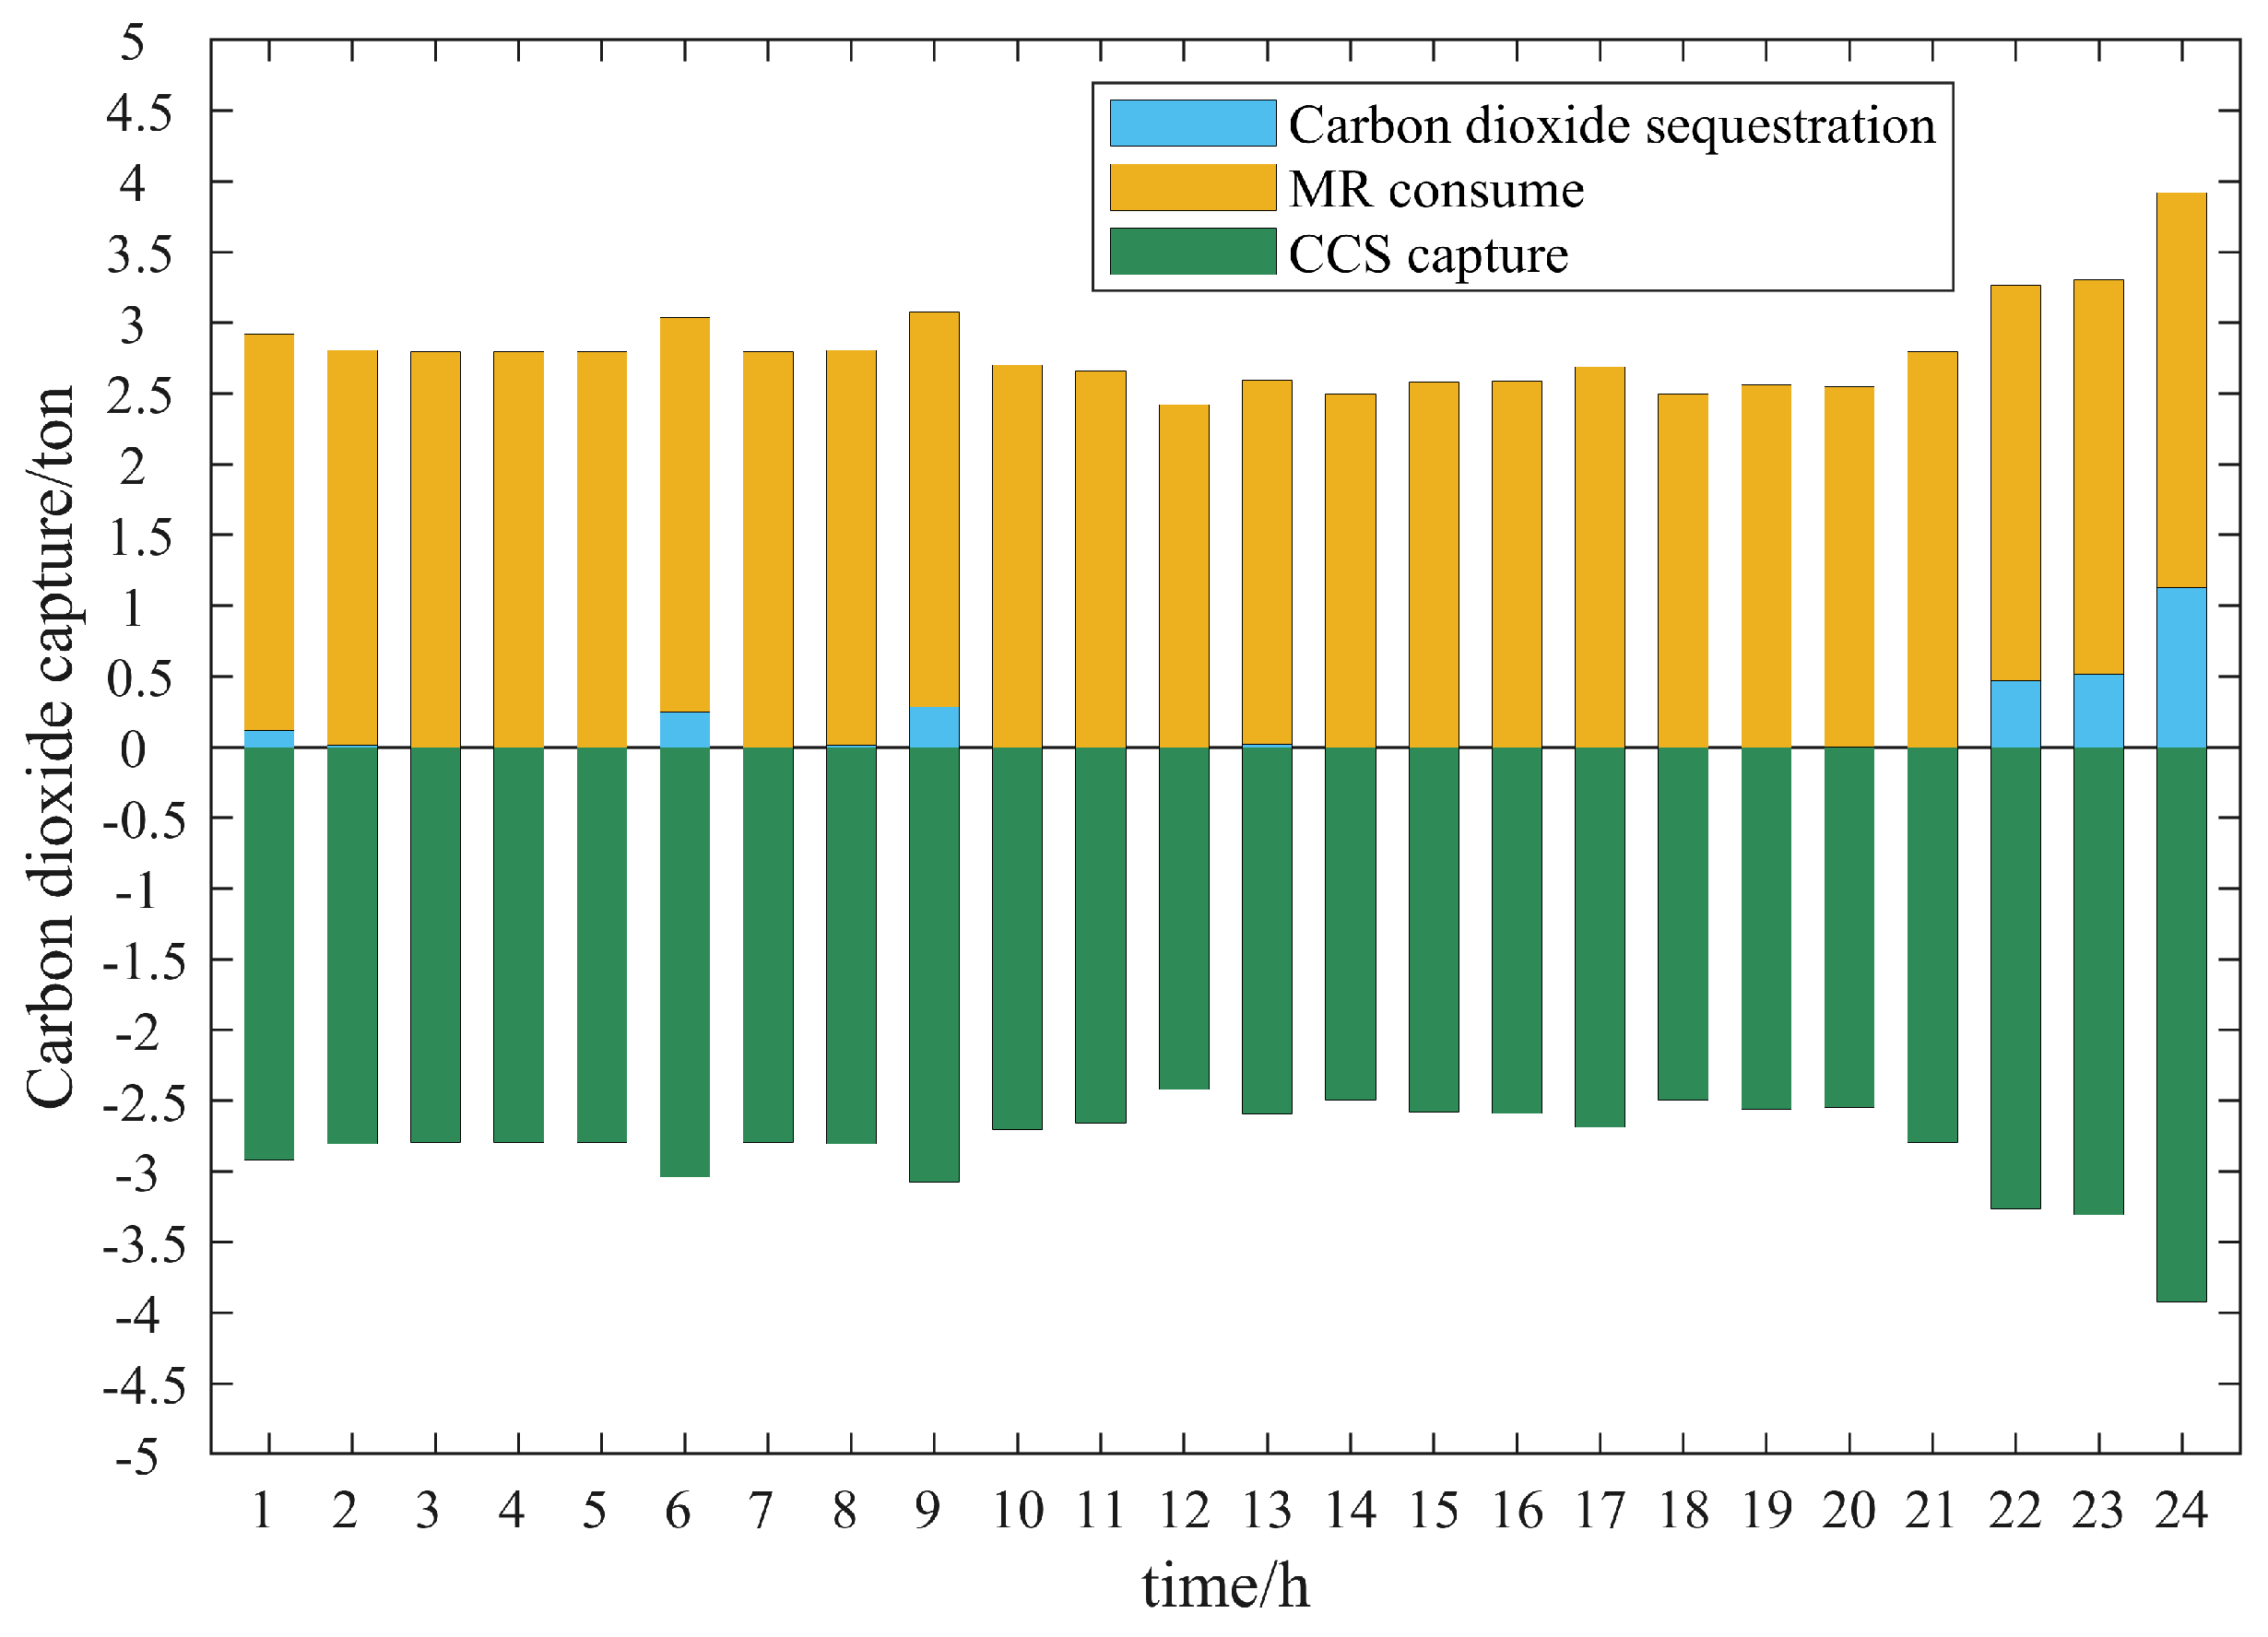
Figure 10 shows the carbon emissions diagram of the system. Figure 11 shows the distribution diagram of carbon dioxide utilization and storage after CCS captures carbon dioxide. After CCS captures carbon dioxide, a part of carbon dioxide is sent to P2G, and the MR in P2G consumes carbon dioxide and hydrogen to produce natural gas.
Combined with the chart, it can be observed that after the introduction of P2G-CCS in the system, since both P2G and CCS operate by consuming electric energy, the PIES flexibly schedules P2G equipment after the introduction of P2G-CCS, which solves the problem of wind and light consumption and makes the power supply of the system stable and balanced in each period. Moreover, P2G-CCS consumes carbon dioxide to produce natural gas for gas turbines and gas boilers, which reduces the cost of gas purchase of the PIES’s natural gas to a certain extent. At the same time, it reduces the carbon emissions of the system, improves the economic benefits of the PIES participating in the carbon trading market and further reduces the operating cost of the system.
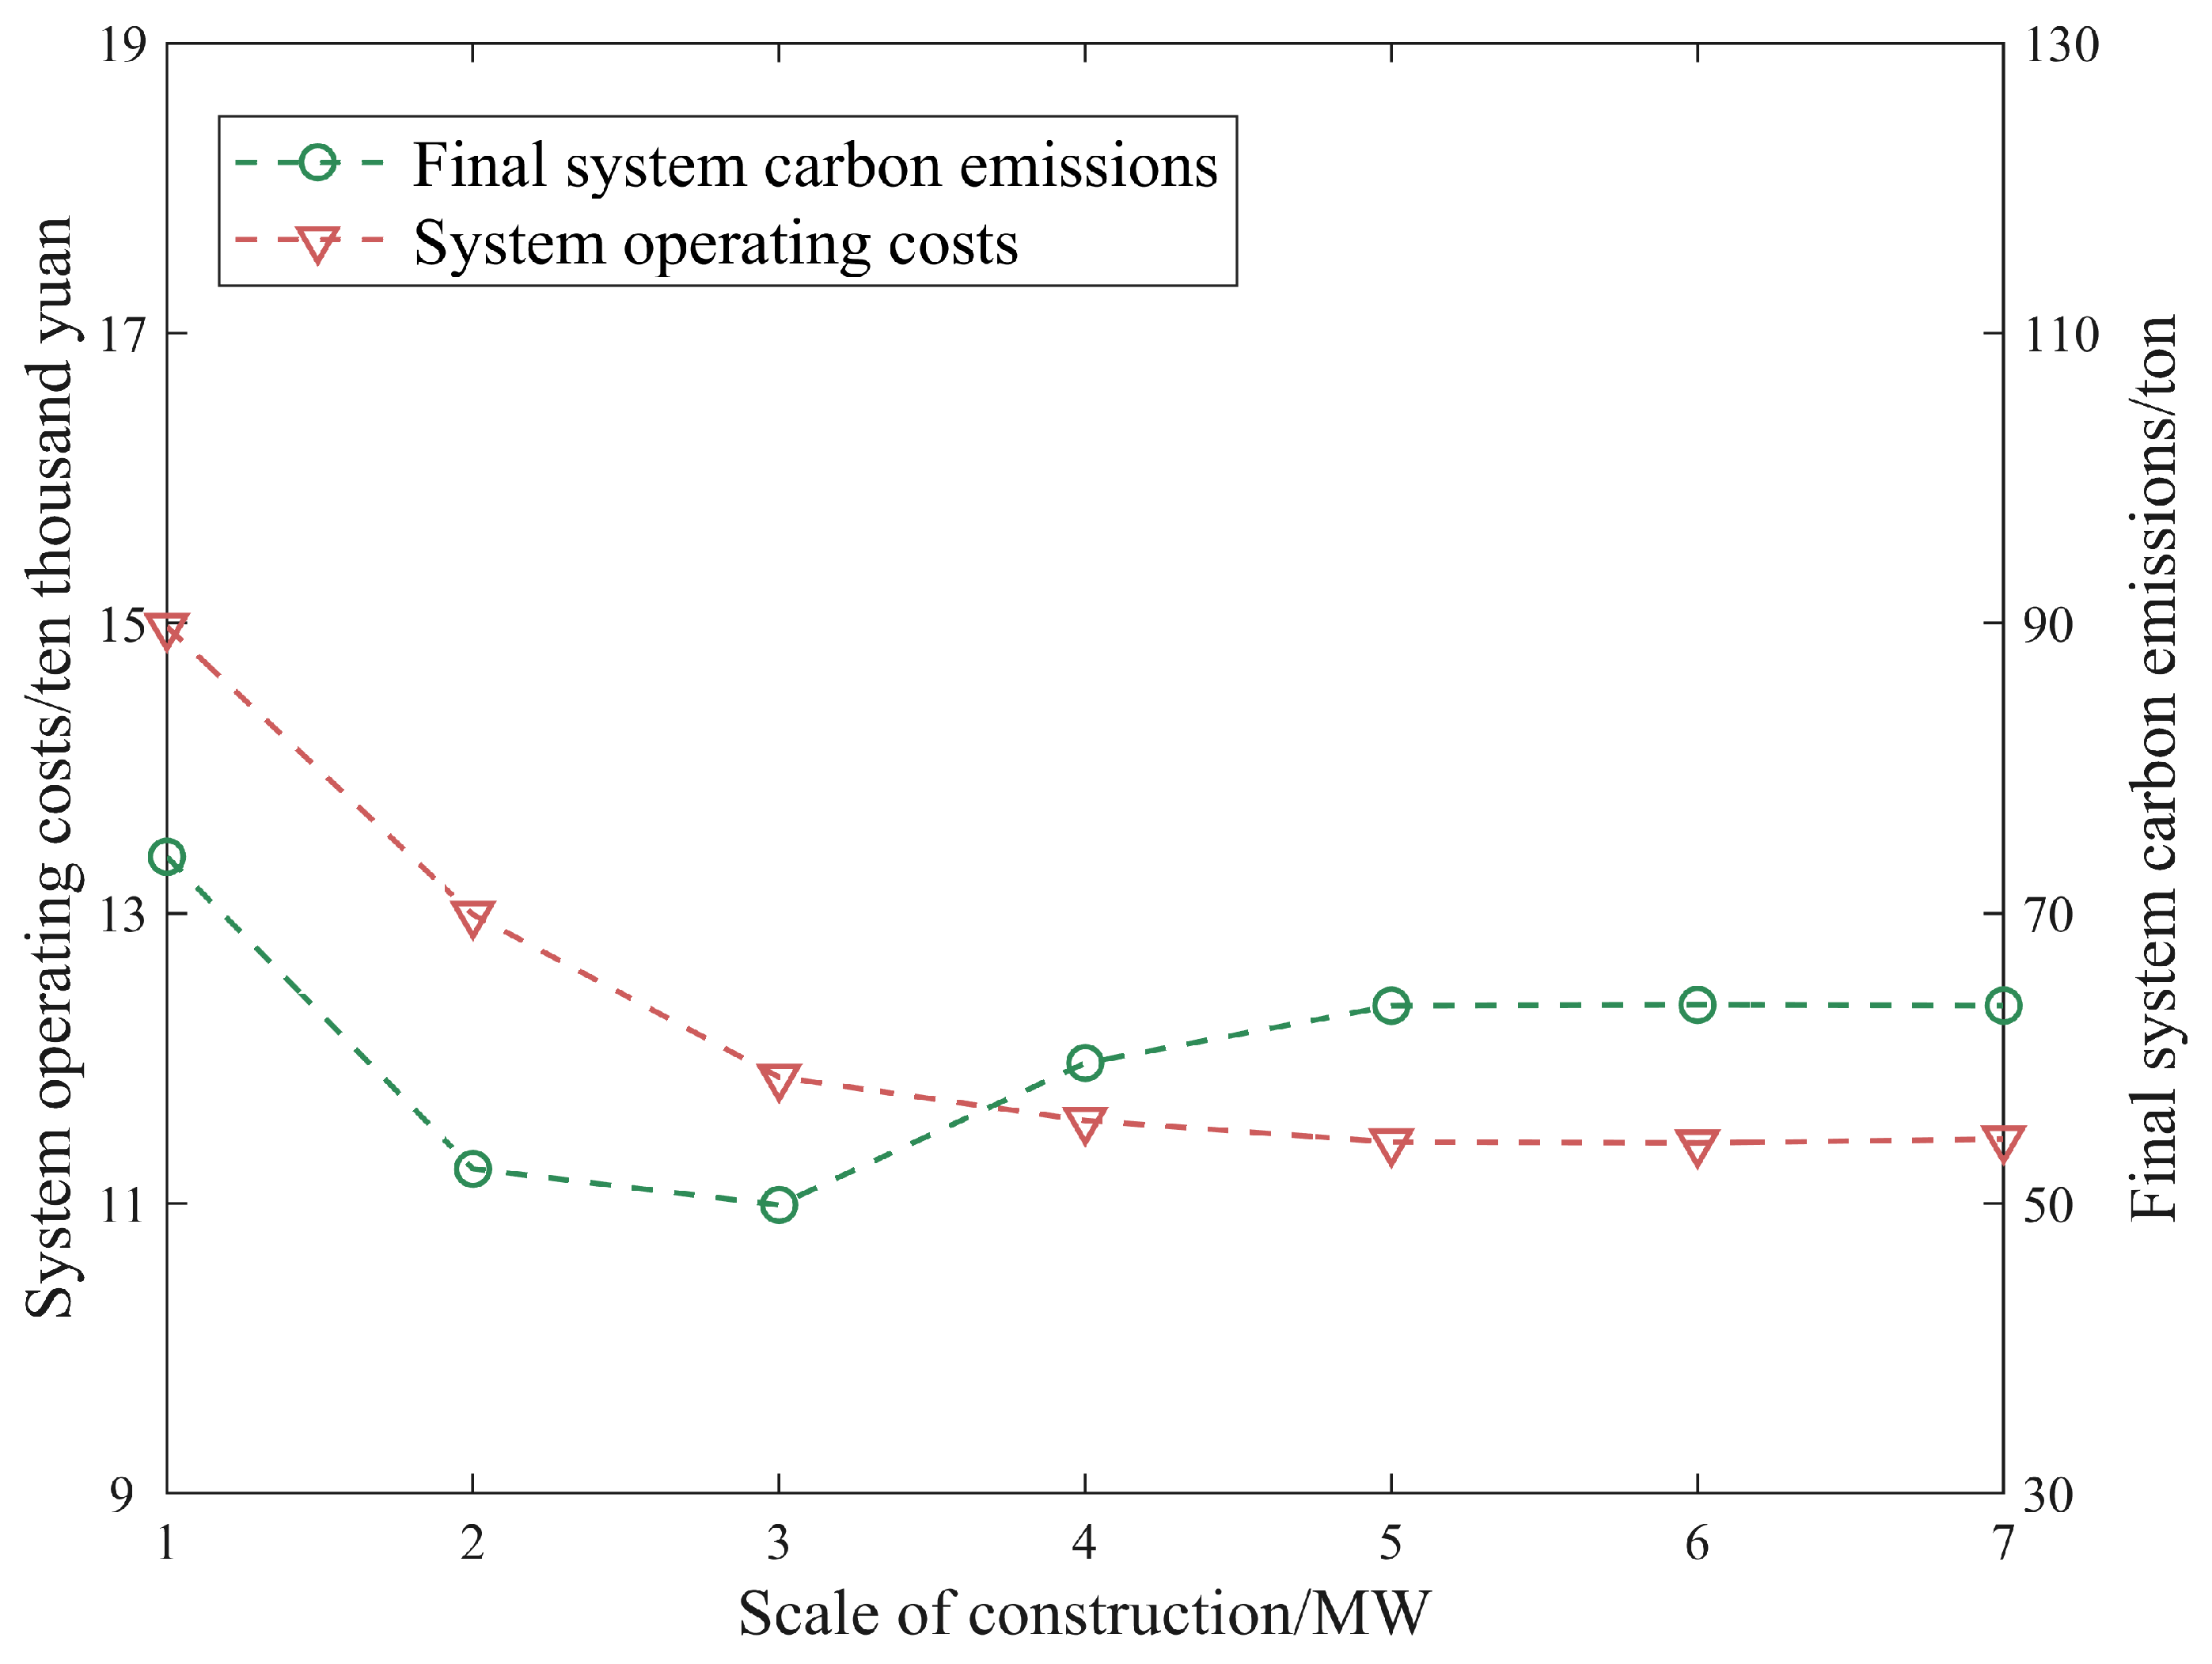
In order to analyze the impact of changing the construction scale of P2G-CCS on the operating costs and carbon emissions of the PIES, this paper proceeds with the sensitivity analysis of the P2G-CCS construction scale parameter in Scenario 4, as shown in Figure 12, which shows that, with the increase in the P2G-CCS construction scale parameter, the operating cost of the system is gradually reduced, and the total carbon emissions of the system decrease first and then increase. Therefore, this paper suggests that in the system architecture of this paper, the value of the P2G-CCS construction scale parameter between 3 MWh and 4 MWh can better achieve the goal of the system’s low-carbon and economic operation, and this paper chooses to introduce the P2G-CCS construction scale of 3 MW in consideration of the environmental and economic aspects of the system’s operation.

6. Conclusions

Aimed at solving the problem of the low-carbon economic operation of a multi-energy coupling industrial park system with wind–solar new energy, this paper proposes the economic optimization research of an integrated energy system considering the uncertainty of wind–solar output and P2G-CCS. Through the simulation analysis of the example, the following conclusions can be obtained:
  • Considering the uncertainty of wind and solar output, the proposed model can more effectively improve the reliability, stability and economy of the IES, and reduce the operating costs of the system.
  • The introduction of P2G-CCS can more effectively help the system to solve the problem of wind and solar consumption, achieve the balance of energy supply, reduce the carbon emissions of the system and achieve the goal of the low-carbon economic operation of the system.
  • With the increase in P2G-CCS construction scale parameters, the system’s operating costs gradually decrease. However, due to the influence of the scale of other equipment architecture of the system, the carbon emissions of the system show a trend of decreasing first and then increasing. Therefore, in the system architecture of this paper, it is suggested that the value of the P2G-CCS construction scale parameters should be between 3 MWh and 4 MWh.
  • The integrated energy system optimization model proposed in this paper, which takes into account the wind and light uncertainty and introduces P2G-CCS, can greatly improve the wind and light consumption rate, reduce the system’s operating costs and carbon emissions, and achieve stable, efficient and environmentally friendly operation of the system.
Since the natural gas produced by P2G is incorporated into the natural gas pipeline to supply energy to the system’s equipment, the impact of the dynamic response of the natural gas pipeline network on the low-carbon economic operation of the system can be considered in future research. The hot and cold pipe network in the system has certain delay characteristics. In future research, the optimal scheduling of the IES’s hot and cold pipe network can be studied based on user-side comfort.

Author Contributions

Conceptualization, Y.Z. and P.Z.; methodology, Y.Z.; software, H.D.; validation, S.D.; formal analysis, P.Z.; investigation, H.D.; resources, S.D.; data curation, P.Z.; writing—original draft preparation, Y.Z.; writing—review and editing, P.Z.; visualization, H.D.; supervision, S.D.; project administration, Y.Z.; funding acquisition, Y.Z. All authors have read and agreed to the published version of the manuscript.

Funding

This research was funded by Power China Hubei Electric Engineering Co., Ltd., grant number DJ-ZDXM-2021-23.

Data Availability Statement

The original contributions presented in the study are included in the article, further inquiries can be directed to the corresponding author.

Conflicts of Interest

Authors Yunlong Zhang and Hanlin Dong were employed by the Power China Hubei Electric Engineering. The remaining authors declare that the research was conducted in the absence of any commercial or financial relationships that could be construed as a potential conflict of interest. The funder was not involved in the study design, collection, analysis, interpretation of data, the writing of this article or the decision to submit it for publication.

Abbreviations

CScold energy storage
CCScarbon capture and storage
CCUcarbon capture and utilization
CSP-CHPconcentrated solar power and combined heat and power
CvaRconditional value-at-risk
ELelectrolysis system
ESelectrical energy storage
GBgas boiler
GEgas engine
GPCgeneralized polynomial chaos
HGThydrogen-doped gas units
HSthermal energy storage
IEGSIntegrated Electricity–Gas System
IESintegrated energy systems
LBlithium bromide
LHSLatin hypercube sampling
MRmethane reactor
PIESpark integrated energy system
P2Gpower to gas
PDFprobability density functions
PVphotovoltaic power generation
S-CO2supercritical carbon dioxide
WTwind turbine power generation

References

  1. Fan, M.; Li, Z.; Ding, T.; Huang, L.; Dong, F.; Ren, Z.; Liu, C. Uncertainty Evaluation Algorithm in Power System Dynamic Analysis with Correlated Renewable Energy Sources. IEEE Trans. Power Syst. 2021, 36, 5602–5611. [Google Scholar] [CrossRef]
  2. Tan, Z.; De, G.; Li, M.; Lin, H.; Yang, S.; Huang, L.; Tan, Q. Combined Electricity-Heat-Cooling-Gas Load Forecasting Model for Integrated Energy System Based on Multi-Task Learning and Least Square Support Vector Machine. J. Clean. Prod. 2020, 248, 119252. [Google Scholar] [CrossRef]
  3. Gilani, M.A.; Kazemi, A.; Ghasemi, M. Distribution System Resilience Enhancement by Microgrid Formation Considering Distributed Energy Resources. Energy 2020, 191, 116442. [Google Scholar] [CrossRef]
  4. Li, F.; Chen, S.; Ju, C.; Zhang, X.; Ma, G.; Huang, W. Research on Short-Term Joint Optimization Scheduling Strategy for Hydro-Wind-Solar Hybrid Systems Considering Uncertainty in Renewable Energy Generation. Energy Strategy Rev. 2023, 50, 101242. [Google Scholar] [CrossRef]
  5. Nayak, A.; Maulik, A.; Das, D. An Integrated Optimal Operating Strategy for a Grid-Connected AC Microgrid under Load and Renewable Generation Uncertainty Considering Demand Response. Sustain. Energy Technol. Assess. 2021, 45, 101169. [Google Scholar] [CrossRef]
  6. Abdelmalak, M.; Benidris, M. A Polynomial Chaos-Based Approach to Quantify Uncertainties of Correlated Renewable Energy Sources in Voltage Regulation. IEEE Trans. Ind. Appl. 2021, 57, 2089–2097. [Google Scholar] [CrossRef]
  7. Cao, W.; Yu, J.; Xu, M. Optimization Scheduling of Virtual Power Plants Considering Source-Load Coordinated Operation and Wind–Solar Uncertainty. Processes 2023, 12, 11. [Google Scholar] [CrossRef]
  8. Dupačová, J.; Gröwe-Kuska, N.; Römisch, W. Scenario Reduction in Stochastic Programming. Math. Program. 2003, 95, 493–511. [Google Scholar] [CrossRef]
  9. Duan, J.; Xia, Y.; Cheng, R.; Gao, Q.; Liu, F. Low Carbon and Economic Optimal Operation of Electricity-Gas Integrated Energy System Considering Demand Response. Sustain. Energy Grids Netw. 2024, 38, 101290. [Google Scholar]
  10. Wang, R.; Wen, X.; Wang, X.; Fu, Y.; Zhang, Y. Low Carbon Optimal Operation of Integrated Energy System Based on Carbon Capture Technology, LCA Carbon Emissions and Ladder-Type Carbon Trading. Appl. Energy 2022, 311, 118664. [Google Scholar] [CrossRef]
  11. Yan, N.; Ma, G.; Li, X.; Guerrero, J.M. Low-Carbon Economic Dispatch Method for Integrated Energy System Considering Seasonal Carbon Flow Dynamic Balance. IEEE Trans. Sustain. Energy 2023, 14, 576–586. [Google Scholar] [CrossRef]
  12. Chen, H.; Wu, H.; Kan, T.; Zhang, J.; Li, H. Low-Carbon Economic Dispatch of Integrated Energy System Containing Electric Hydrogen Production Based on VMD-GRU Short-Term Wind Power Prediction. Int. J. Electr. Power Energy Syst. 2023, 154, 109420. [Google Scholar] [CrossRef]
  13. Li, M.; Qin, J.; Han, Z.; Niu, Q. Low-carbon Economic Optimization Method for Integrated Energy Systems Based on Life Cycle Assessment and Carbon Capture Utilization Technologies. Energy Sci. Eng. 2023, 11, 4238–4255. [Google Scholar] [CrossRef]
  14. Li, W.; He, M.; Cai, T. Low-Carbon Economic Dispatch of Hydrogen-Containing Integrated Energy System Considering Stepped Demand Response. Energy Rep. 2024, 11, 4222–4232. [Google Scholar] [CrossRef]
  15. Wu, M.; Wu, Z.; Shi, Z. Low Carbon Economic Dispatch of Integrated Energy Systems Considering Utilization of Hydrogen and Oxygen Energy. Int. J. Electr. Power Energy Syst. 2024, 158, 109923. [Google Scholar] [CrossRef]
  16. Zhang, Z.; Du, J.; Li, M.; Guo, J.; Xu, Z.; Li, W. Bi-Level Optimization Dispatch of Integrated-Energy Systems with P2G and Carbon Capture. Front. Energy Res. 2022, 9, 784703. [Google Scholar] [CrossRef]
  17. Li, X.; Li, T.; Liu, L.; Wang, Z.; Li, X.; Huang, J.; Huang, J.; Guo, P.; Xiong, W. Operation Optimization for Integrated Energy System Based on Hybrid CSP-CHP Considering Power-to-Gas Technology and Carbon Capture System. J. Clean. Prod. 2023, 391, 136119. [Google Scholar] [CrossRef]
  18. Liang, Y.-L.; Zhang, H.; Yang, C.-T.; Li, K.-J. Research on Optimization Scheduling of Integrated Electricity-Gas System Considering Carbon Trading and P2G Operation Characteristics. Electr. Power Syst. Res. 2023, 225, 109797. [Google Scholar] [CrossRef]
  19. Zhang, G.; Wang, W.; Chen, Z.; Li, R.; Niu, Y. Modeling and Optimal Dispatch of a Carbon-Cycle Integrated Energy System for Low-Carbon and Economic Operation. Energy 2022, 240, 122795. [Google Scholar] [CrossRef]
  20. Zhu, X.; Xue, J.; Hu, M.; Liu, Z.; Gao, X.; Huang, W. Low-Carbon Economy Dispatching of Integrated Energy System with P2G-HGT Coupling Wind Power Absorption Based on Stepped Carbon Emission Trading. Energy Rep. 2023, 10, 1753–1764. [Google Scholar] [CrossRef]
  21. Zhang, X.; Zhang, Y.; Ji, X.; Ye, P.; Li, J. Unit Commitment of Integrated Energy System Considering Conditional Value-at-Risk and P2G. Electr. Power Syst. Res. 2023, 221, 109398. [Google Scholar] [CrossRef]
  22. Sun, H.; Sun, X.; Kou, L.; Ke, W. Low-Carbon Economic Operation Optimization of Park-Level Integrated Energy Systems with Flexible Loads and P2G under the Carbon Trading Mechanism. Sustainability 2023, 15, 15203. [Google Scholar] [CrossRef]
  23. Pan, C.; Jin, T.; Li, N.; Wang, G.; Hou, X.; Gu, Y. Multi-Objective and Two-Stage Optimization Study of Integrated Energy Systems Considering P2G and Integrated Demand Responses. Energy 2023, 270, 126846. [Google Scholar] [CrossRef]
  24. Yang, B. Multi-objective Optimization of Integrated Gas–Electricity Energy System Based on Improved Multi-object Cuckoo Algorithm. Energy Sci. Eng. 2021, 9, 1839–1857. [Google Scholar] [CrossRef]
  25. Wu, D.; Han, S.; Wang, L.; Li, G.; Guo, J. Multi-Parameter Optimization Design Method for Energy System in Low-Carbon Park with Integrated Hybrid Energy Storage. Energy Convers. Manag. 2023, 291, 117265. [Google Scholar] [CrossRef]
  26. Qiao, Y.; Hu, F.; Xiong, W.; Li, Y. Energy Hub-based Configuration Optimization Method of Integrated Energy System. Int. J. Energy Res. 2022, 46, 23287–23309. [Google Scholar] [CrossRef]
  27. Sun, H.; Zou, H.; Wen, J.; Ke, W.; Kou, L. Optimal Scheduling Considering Carbon Capture and Demand Response under Uncertain Output Scenarios for Wind Energy. Sustainability 2024, 16, 970. [Google Scholar] [CrossRef]
  28. Haghighat Mamaghani, A.; Avella Escandon, S.A.; Najafi, B.; Shirazi, A.; Rinaldi, F. Techno-Economic Feasibility of Photovoltaic, Wind, Diesel and Hybrid Electrification Systems for off-Grid Rural Electrification in Colombia. Renew. Energy 2016, 97, 293–305. [Google Scholar] [CrossRef]
  29. Ju, L.; Tan, Z.; Yuan, J.; Tan, Q.; Li, H.; Dong, F. A Bi-Level Stochastic Scheduling Optimization Model for a Virtual Power Plant Connected to a Wind–Photovoltaic–Energy Storage System Considering the Uncertainty and Demand Response. Appl. Energy 2016, 171, 184–199. [Google Scholar] [CrossRef]
  30. Li, Y.; Yang, Z.; Li, G.; Zhao, D.; Tian, W. Optimal Scheduling of an Isolated Microgrid With Battery Storage Considering Load and Renewable Generation Uncertainties. IEEE Trans. Ind. Electron. 2019, 66, 1565–1575. [Google Scholar] [CrossRef]
  31. Mckay, M.D.; Beckman, R.J.; Conover, W.J. A Comparison of Three Methods for Selecting Values of Input Variables in the Analysis of Output From a Computer Code. Technometrics 2000, 42, 55–61. [Google Scholar] [CrossRef]
  32. Lei, K.; Chang, J.; Wang, X.; Guo, A.; Wang, Y.; Ren, C. Peak Shaving and Short-Term Economic Operation of Hydro-Wind-PV Hybrid System Considering the Uncertainty of Wind and PV Power. Renew. Energy 2023, 215, 118903. [Google Scholar] [CrossRef]
  33. Cho, J.; Jeong, S.; Kim, Y. Commercial and Research Battery Technologies for Electrical Energy Storage Applications. Prog. Energy Combust. Sci. 2015, 48, 84–101. [Google Scholar] [CrossRef]
  34. Zhang, W.; Wang, W.; Fan, X.; He, S.; Wang, H.; Wu, J.; Shi, R. Low-Carbon Optimal Operation Strategy of Multi-Park Integrated Energy System Considering Multi-Energy Sharing Trading Mechanism and Asymmetric Nash Bargaining. Energy Rep. 2023, 10, 255–284. [Google Scholar] [CrossRef]
  35. Chen, J.; Tang, Z.; Huang, Y.; Qiao, A.; Liu, J. Asymmetric Nash Bargaining-Based Cooperative Energy Trading of Multi-Park Integrated Energy System under Carbon Trading Mechanism. Electr. Power Syst. Res. 2024, 228, 110033. [Google Scholar] [CrossRef]
  36. Amrollahi, M.H.; Bathaee, S.M.T. Techno-Economic Optimization of Hybrid Photovoltaic/Wind Generation Together with Energy Storage System in a Stand-Alone Micro-Grid Subjected to Demand Response. Appl. Energy 2017, 202, 66–77. [Google Scholar] [CrossRef]
Figure 1. P2G-CCS flowchart.
Energies 17 02770 g001
Figure 2. The architectural framework of the PIES system.
Energies 17 02770 g002
Figure 3. System architecture and algorithm correlation diagram.
Energies 17 02770 g003
Figure 4. Flow chart of system optimized scheduling.
Energies 17 02770 g004
Figure 5. Generation and reduction of landscape scenes. Note: (a) generation of WT output scenarios; (b) generation of PV output scenarios; (c) scenario reduction diagram for WT output; (d) scenario reduction diagram for PV output.
Energies 17 02770 g005
Figure 6. Initial system data diagram.
Energies 17 02770 g006
Figure 7. Optimized scheduling diagram for system power supply.
Energies 17 02770 g007
Figure 8. Optimized scheduling diagram for system cooling energy.
Energies 17 02770 g008
Figure 9. Optimized scheduling diagram for system heating energy.
Energies 17 02770 g009
Figure 10. Systematic carbon emission relationships.
Energies 17 02770 g010
Figure 11. Utilization map between carbon capture and storage in the system.
Energies 17 02770 g011
Figure 12. P2G construction scale sensitivity analysis chart.
Energies 17 02770 g012
Table 1. Initial carbon emission allowances for each carbon emitting device.
Source of Carbon EmissionsCarbon Allowance/(kg/kWh)
Wind turbine0.078
Photovoltaic generator0.078
Gas boiler0.152
Energy storage0
Grids0.798
Table 2. Time division tariff schedule.
TimeElectricity Price/yuan
00:00–07:000.62
08:00–11:001.14
12:00–16:000.83
17:00–20:001.14
21:00–23:000.62
Main grid electricity tariff0.36
Table 3. System carbon emission factor.
Source of Carbon EmissionsCarbon Emission Factor (kg/kWh)
Wind turbine0.105
Photovoltaic generator0.111
Natural gas (gas boiler)0.236
Energy storage0.112
Grids1.303
Table 4. Partial equipment parameters of the system.
Parameter NameValueUnit
P t g r i d , max 3000kW
P t G E , max 4000kW
P t G E , min 2830kW
P t G B , max 4000kW
P t P 2 G , max 3000kW
P t C C S , max 3000kW
P t B L , max 5000kW
P t e s , max 2000kW
S O C e s , max 10,000kWh
H t h s , max 2000kW
S O C h s , max 10,000kWh
Q t c s , max 2000kW
S O C c s , max 10,000kWh
R e s 10times
R c s 10times
R h s 10times
X G B 1.07
X M T 0.25
X M R 0.55
Table 5. Corresponding probability for each scenario.
ScenarioProbability Value
10.158
20.258
30.133
40.195
50.256
Table 6. Comparative analysis table of system operating costs under different scenarios.
ScenarioTotal System Operating
Cost/million
Carbon Trading
Costs/USD million
Carbon
Emissions/ton
Cost of Wind and Light
Abandonment/yuan
Wind and Light
Rejection Rate
120.311.04118.68833912.07
213.12−1.8361.3720963.24
318.740.93106.07623110.64
411.61−2.2557.4200
Disclaimer/Publisher’s Note: The statements, opinions and data contained in all publications are solely those of the individual author(s) and contributor(s) and not of MDPI and/or the editor(s). MDPI and/or the editor(s) disclaim responsibility for any injury to people or property resulting from any ideas, methods, instructions or products referred to in the content.