Abstract
Over the past decades, considerable research has been conducted on extracting energy from superhot geothermal reservoirs, where temperatures are higher than at the critical point of water. A major challenge when operating wells under such conditions is managing scaling in an effective manner. In this study, the thermodynamics of the precipitation and scaling of crystalline NaCl (halite) under superhot conditions is explored using the – system as a proxy. Phase diagrams in pressure–enthalpy and pressure–entropy coordinates are used to illustrate how scaling occurs in idealized processes, such as the isenthalpic expansion of geothermal fluid to the wellhead or the isentropic power generation of a steam turbine. Particular emphasis is placed on explaining the non-trivial graphical composition of these phase diagrams in an accessible manner. A wellhead sample and an estimate of the downhole conditions are used as points of reference in the discussion of scaling. All thermodynamic properties, including the solubility of in water vapor, are calculated using a newly developed equation of state by the same authors as in this article.
Keywords:
NaCl; brine; saline; salt; phase diagram; enthalpy; entropy; equation of state; solubility; precipitation; supercritical 1. Introduction
Most developed geothermal systems are operated within a temperature range of 150 to 300 °C. For systems above °C, the underlying heat source is almost always shallow intrusions of magmatic rock, where temperatures range from approximately 800 to °C. The large temperature difference between the typical operating conditions of a surface plant and its underlying heat source suggests that higher temperature reservoirs could also be used for power generation. As a result, there is a large focus on exploring the potential of superhot reservoirs, where temperatures range from approximately 400 to °C. The geothermal fluids in these reservoirs can be at pressures both above and below , the critical pressure of water [1,2,3,4].
During the extraction of fluid from a geothermal reservoir, the temperature and pressure decrease. These changes can reduce the solubility of dissolved minerals, causing them to precipitate. In a process known as scaling, the precipitated minerals start accumulating on the well walls and in the production equipment. Failure to control scaling can lead to several issues, such as clogging of the wells and damage to the equipment, which can effectively halt geothermal energy production [5,6,7]. The focus of this work is the scaling of crystalline (halite), which is expected to be an issue for superhot reservoirs with high concentrations of dissolved , such as the saline Reykjanes system in Iceland [8,9].
Thermodynamic models are useful for predicting the solubility of minerals that cause scaling. However, there are currently no equations of state (EOSs) that fully cover the compositions, pressures, and temperatures of geothermal systems. For example, the Helgeson–Kirkham–Flowers EOS, which is widely used in geochemical modeling, has inherent limitations that prevent it from being used to describe superhot systems. One problem is that it is a Gibbs energy model, which cannot handle properties such as partial molar volume that diverge at near-critical conditions. Another limitation is that the EOS includes terms that were developed for subcritical liquids. For example, it addresses the hydration of ions using so-called Born terms, which are derived under the assumption of an incompressible fluid and therefore cannot describe the physics of the vapor-like fluids found in superhot reservoirs [10,11].
Driesner [10] identified four major tasks for improving the thermodynamic models of geothermal fluids. The fourth task emphasized the importance of:
[…] identifying mathematical expressions for the temperature, pressure, and composition dependence of solute thermodynamic properties that allow robust extrapolation to experimentally unstudied conditions. The latter is particularly relevant for conditions that are experimentally difficult to handle, namely at moderate pressures between ca. 10 and for temperatures in excess of °C.
The pressures and temperatures the author mentioned align with those of superhot geothermal fluids [3,4,12].
A novel Helmholtz energy model for the – system, addressing the fourth task identified by Driesner [10], was recently developed by Ellingsen and Haug-Warberg [13]. Notably, it encompasses the vapor–halite coexistence region from °C to the triple point temperature of ( °C). This region includes most of the pressures and temperatures relevant to superhot geothermal energy production, from the reservoir to the wellhead. Similar to the superhot and saline geothermal well model by Lamy-Chappuis et al. [9,14], the current work restricts the scope of modeling to the – system. This binary system is taken to be a reasonable simplification of the multi-component aqueous fluids found in real saline geothermal reservoirs.
In short, the purpose of this communication is to discuss the thermodynamics of halite scaling in superhot systems in an accessible manner. Phase diagrams of – are presented and discussed along with idealized geothermal energy processes.
2. Method
The enthalpy–pressure and entropy–pressure diagrams presented in this study are calculated using the thermodynamic models for vapor and halite by Ellingsen and Haug-Warberg [13]. The only thermodynamic difference from that article is the choice of reference state for halite. For context, the referenced article presented pressure–composition, pressure–temperature, and temperature–composition diagrams. The conditions corresponding to a wellhead sample from one well and the downhole conditions of another well are used as points of reference in all phase diagrams.
2.1. Overview of Thermodynamic Models
To limit unwieldy notation, only properties that differ from those of the vapor have a superscript denoting the phase. The model of the vapor phase is expressed in terms of Helmholtz energy and consists of two terms:
where is the mass of . The term describes pure water and is modeled using the existing and precise IAPWS-95 equation of state, while the term incorporates the effect of – interactions using three so-called cross virial coefficients. Analogous to Equation (1), the Gibbs energy model for halite is given by
2.2. Representative Conditions from Superhot Wells
The first point of reference included in all of the phase diagrams represents a sample taken at the wellhead of the IDDP-1 well in Krafla, Iceland (8 March 2012), as reported by Ármannsson et al. [15]. For context, IDDP-1 was the first well of the Icelandic Deep Drilling Project, which aims to evaluate the economic feasibility of exploiting geothermal energy at supercritical conditions. The sample was recorded at a temperature of °C and a gauge pressure of . Additionally, the mass fraction of was calculated from the measured amount of as . Note that the current work only considers the presence of and not the other solutes measured in the sample.
The IDDP-1 well did not achieve the Iceland Deep Drilling Project’s objective of reaching supercritical pressures, which led to the drilling of the IDDP-2 well at Reykjanes. Notably, the Reykjanes geothermal system is recharged by seawater and thus contains significant amounts of sodium chloride [16]. During the thermal equilibration period after drilling, the downhole temperature and pressure were logged at °C and [16,17]. Later, a constriction in the casing of the well prevented the deployment of logging tools and hindered further investigation of the downhole conditions. It was estimated that the well would have stabilized at a temperature of °C [18]. The second point of reference represents the stabilized temperature and logged pressure, providing a rough estimate of the downhole conditions of an operational IDDP-2 well. Because no experimental measurements of the fluid composition of the well exist [19], to the best of the authors’ knowledge, pure water is assumed for simplicity. The thermodynamic properties of the first and second reference points are presented in Table 1 for easy reference.

Table 1.
Thermodynamic properties for the (static) vapor phase at the points of reference plotted in the phase diagrams. The first point corresponds to a sample taken at the wellhead of the IDDP-1 well [15], while the second point is an estimate of the downhole conditions of an operational IDDP-2 well.
2.3. The Impact of the Reference State
Unambiguous interpretation of specific enthalpy and specific entropy requires knowledge of the reference state used. The reference state is clearly defined when the specific internal energy (or specific enthalpy) and specific entropy are specified at a particular pressure and temperature for each constituent species. Importantly, the choice of reference state can result in phase diagrams that are visually different.
The current work follows the convention of the International Association for the Properties of Water and Steam (IAPWS) by assigning the specific internal energy and specific entropy of saturated liquid water a value of zero at its triple point [20,21]. For context, the JANAF Thermochemical tables and the International Union of Pure and Applied Chemistry (IUPAC) use a different convention. They assign the specific enthalpy of the most stable phase of each element a value of 0 at and . To avoid introducing an additional pressure and temperature to the reference state, the specific internal energy and specific entropy of halite are also assigned a value of zero at the triple point of water. Any deviation from this convention is explicitly stated where applicable. An introduction to reference states and a comprehensive description of the reference state used in each phase diagram are presented in Appendix A.
3. Results and Discussion
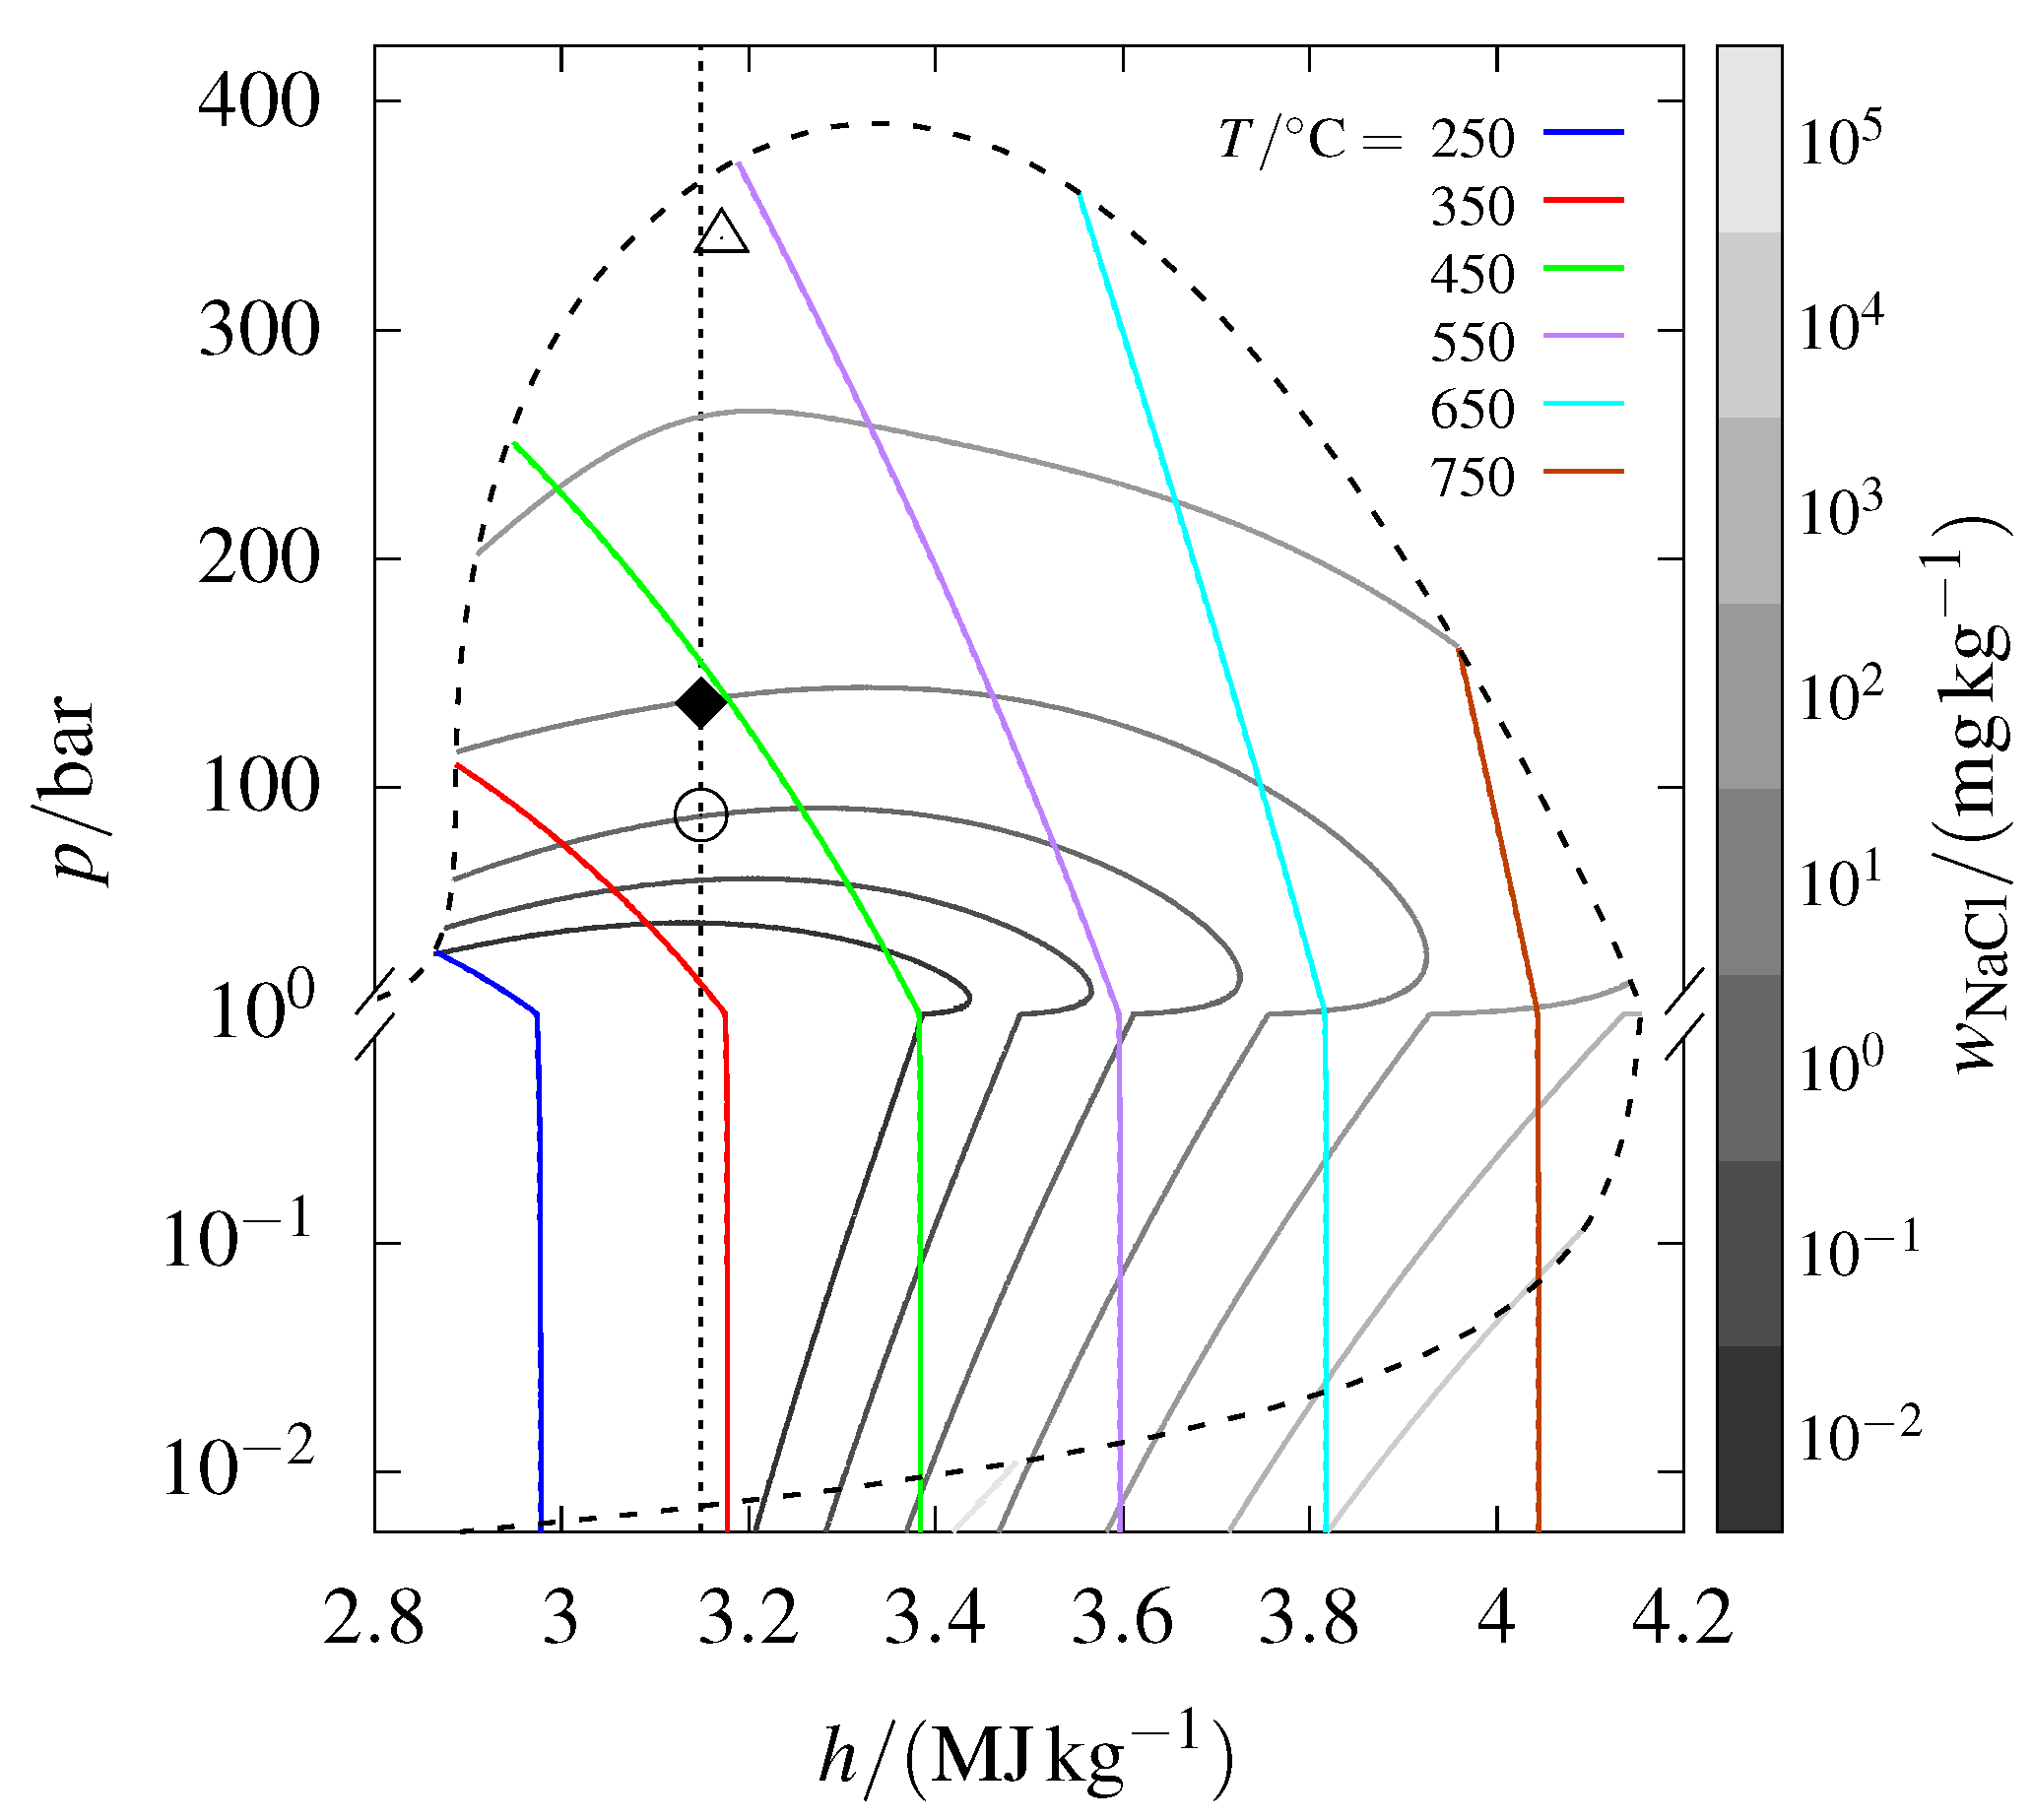
The phase diagram calculated for the – system, in terms of pressure and specific enthalpy, is shown in Figure 1. This figure includes isotherms and isopleths for the solubility of , all confined by the vapor–liquid–halite coexistence curve. For pressures above this coexistence curve, precipitation would result in liquid brine rather than halite. Additionally, the figure includes an isenthalp that crosses the conditions measured at the wellhead of the IDDP-1 well and a point marking an estimate of the downhole conditions of the IDDP-2 well. Each part of the phase diagram will be introduced and examined in the upcoming discussion. The same conditions will also be illustrated with a pressure–entropy diagram and using a difference reference state near the end of this section.
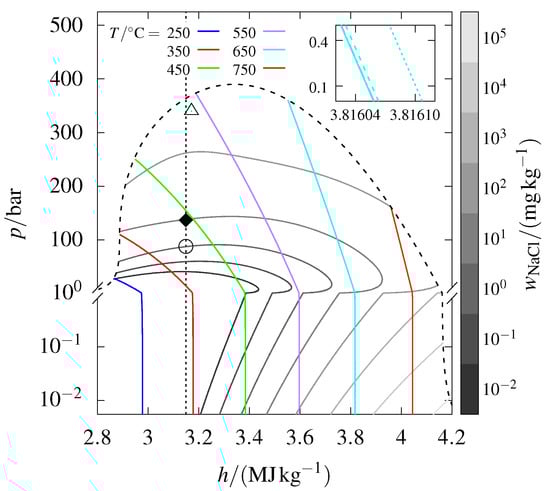
Figure 1.
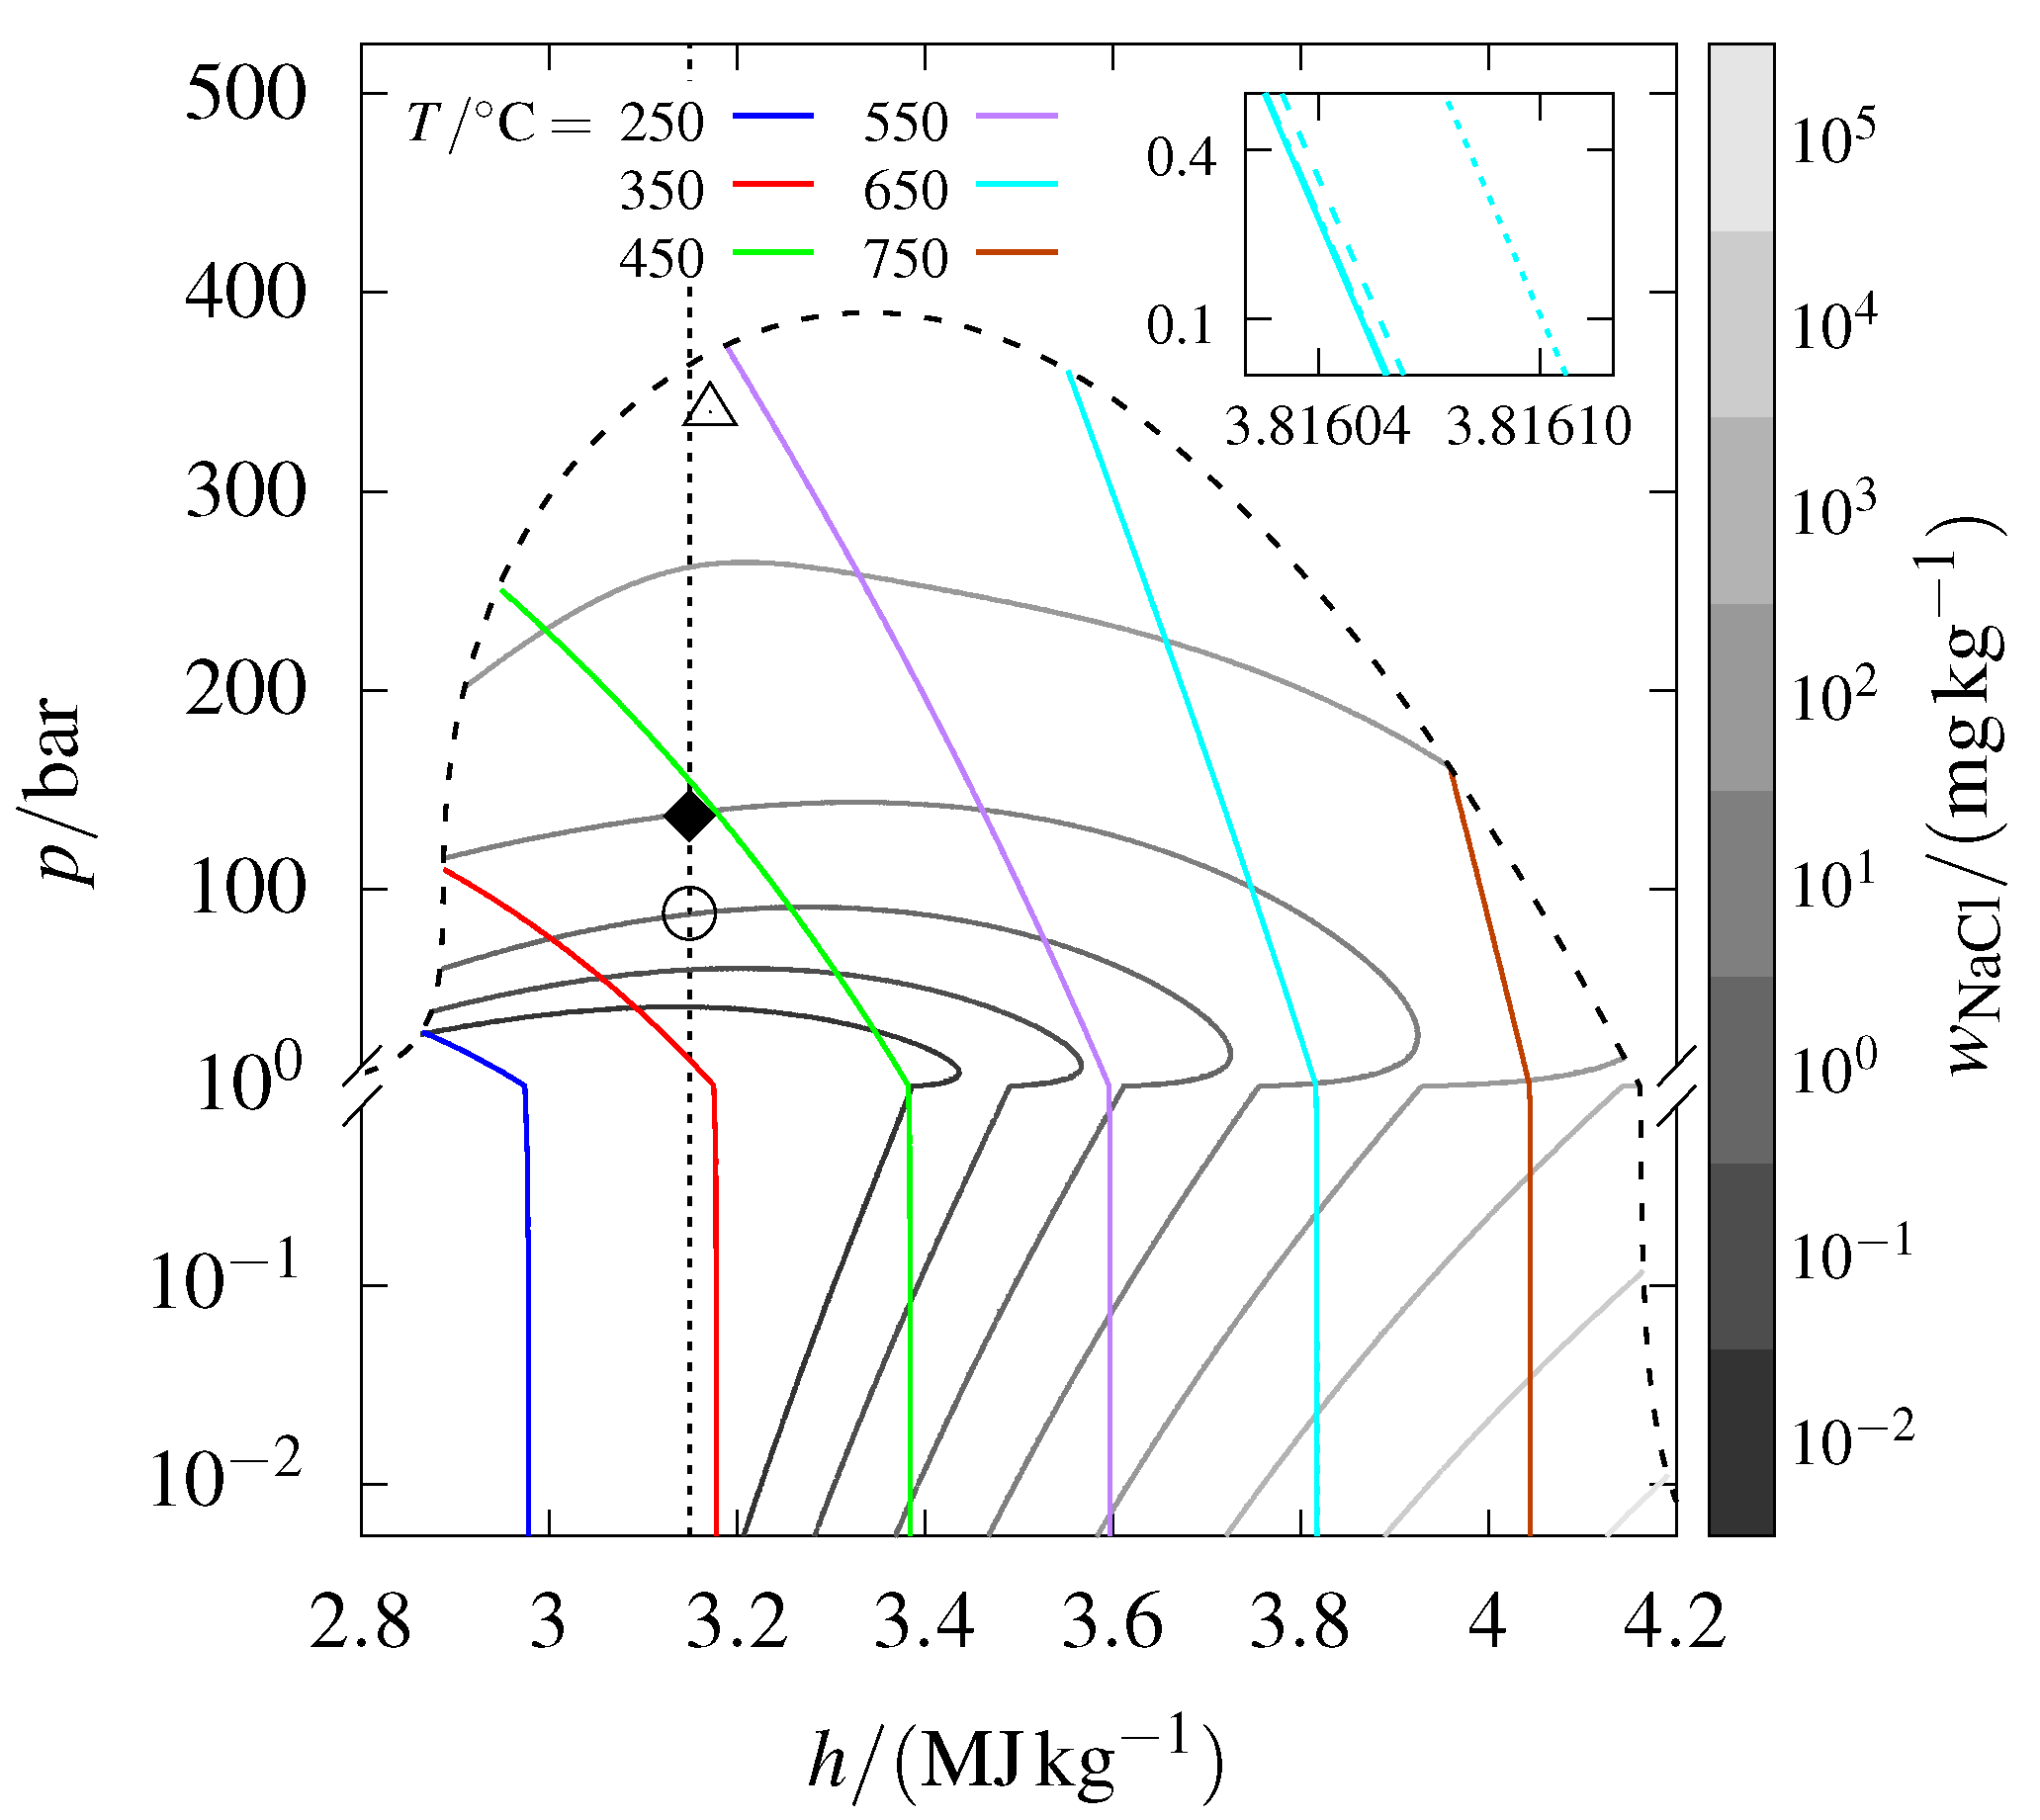
Pressure–specific enthalpy diagram for the – system, calculated using the equation of state of Ellingsen and Haug-Warberg [13]. The diagram features isotherms ranging from 250 to °C (colored lines) and isopleths for the solubility of sodium chloride in water vapor from to (gray lines). These are delimited to pressures below the vapor–liquid–halite coexistence curve (dashed line). Five isotherms corresponding to of every order of magnitude ranging from to are plotted, but these are visually indistinguishable in the main figure. The inset provides a zoomed-in view of the low-pressure behavior of the isotherms at °C, with the rightmost isotherm corresponding to . The solid diamond corresponds to a sample from the wellhead of the IDDP-1 well [15], and the open circle is where precipitation sets in for isenthalpic decompression along the dotted line. The open triangle marks an estimate of the downhole conditions of the IDDP-2 well. Further details are provided in the main text.
3.1. Isotherms
Isotherms are presented for six different temperatures, ranging from 250 to °C. For each temperature, five curves corresponding to mass fractions () of orders of magnitude ranging from to have been plotted. The inset shows that these curves are indeed separate, although they appear as single isotherms in the main figure. This behavior indicates that the negligible solubility of sodium chloride in steam at the prevailing p, T conditions leads to the enthalpy and pressure being dominated by water. Notably, all isotherms converge to the ideal gas behavior of constant specific enthalpy in the limit of .
Other bulk fluid properties, such as total density, heat capacity, and viscosity, are also approximately those of water for the – system under superhot conditions. Flow assurance models that utilize these bulk properties to predict fluid flow, heat transfer, and the performance of geothermal wells can thus effectively approximate hydrothermal fluids with dissolved salts as pure water rather than as a mixture. For example, the model of Hasan and Kabir [22] could be used to simulate the p, T profile of a well or the heat loss to the surrounding earth, from the wellhead to the downhole, using this approach. Whether the simulated p, T conditions lead to precipitation and scaling can then be addressed separately using post-simulation thermodynamic phase equilibrium calculations.
Of course, fluid properties being approximately those of does not mean that flow and heat transfer are unaffected once scaling has started. Scaling restricts flow, and the heat loss to the surroundings is undoubtedly affected by the addition of a scale layer to the walls of a well. To model a well that experiences scaling, it becomes necessary to make assumptions about the nucleation, agglomeration, and deposition of halite, as well as to include at least a mass balance for in the well model [23].
3.2. Solubility Isopleths
Isopleths of eight different solubilities are presented in the phase diagram. The isopleths correspond to of each order of magnitude ranging from to . Note that the wellhead sample with is undersaturated with . Consequently, the scaling of is not an issue at the measured temperature and pressure. When the amount of exceeds its solubility, for example due to a pressure drop, halite precipitates from the vapor phase until saturation is reached. This precipitation begins at the point marked with an open circle for a fluid with the same composition and enthalpy as the wellhead sample.
The isopleth for (upper gray line) appears quite flat between 550 and °C. At even larger mass fractions, the isopleths lose their strict convexity. This anomaly is likely due to truncated higher-order cross virial coefficients, which are not accounted for in the EOS, becoming significant at high water densities. Notably, a dent in the vapor–liquid–halite coexistence curve, as discussed by Ellingsen and Haug-Warberg [13], occurs at approximately the same temperatures and pressures.
3.3. Isenthalp
The line intersecting the IDDP-1 measurement indicates constant enthalpy. A steady flow process is isenthalpic when there is no heat loss, only p, V work, and negligible kinetic contributions. Treating the expansion of a fluid from a deep geothermal reservoir to the surface as isenthalpic is reasonable provided the flow is rapid enough for heat not to be lost to the surroundings. Assuming fast flow, the downhole condition of the IDDP-1 well corresponds to a point along the isenthalp that is above the wellhead sample in the phase diagram.
As previously mentioned, the p, T condition along the isenthalp at which the solubility limit is reached is marked by an open circle. Halite will precipitate if the fluid is expanded past this point, leading to scaling. Note in particular that there is 90% precipitation between each successive isopleth for a geothermal fluid that is already saturated with . Thermodynamically, a well is thus much more prone to halite plugging in the downhole area than near the wellhead.
Superhot geothermal energy offers two advantages over low to medium T geothermal energy. The first is the higher heat content of superhot fluids. The second is higher pressures and thereby larger densities, which ensure a high mass flow rate. For context, a preliminary calculation suggested that these advantages could enable a supercritical well to achieve a tenfold increase in power output compared with a conventional well, assuming the same volumetric flow rate [24]. Graphically, a higher-temperature reservoir and its accompanying isenthalpic flow would be further to the right in Figure 1 than a low-temperature reservoir.
3.4. Brine
The isotherms and solubility isopleths in Figure 1 are bounded by the vapor–liquid–halite coexistence curve, which also marks the applicability limit of the EOS of Ellingsen and Haug-Warberg [13]. For pressures beyond this curve, precipitation would result in brine instead of halite. For information, the vapor–liquid–halite coexistence curve is calculated by matching, where the pressures of the model are equal to the vapor–liquid–halite coexistence pressure correlation by Driesner and Heinrich [25].
As mentioned in Section 2, the downhole temperature and pressure of the IDDP-2 well were logged at °C and during the thermal equilibration period after drilling. The specific enthalpy at these conditions is approximately , which is below the range shown in Figure 1. Any well operating along an isenthalp at this value would only result in the precipitation of brine. The plotted triangle represents the conditions after the well has stabilized to a temperature of °C. Graphically, it is clear that any precipitation would then result in halite. In this scenario, the well would have transitioned from an initial state where any precipitate was brine to a stabilized state where any precipitate was halite. Therefore, there must have been an intermediate period where the p, T conditions corresponded to brine precipitation at higher pressures near the downhole and halite precipitation at lower pressures near the wellhead.
Understanding the phase of the precipitate at different p, T conditions is essential for both understanding and controlling scaling. This is exemplified by the work of Lamy-Chappuis et al. [14], who developed a model for a geothermal well operated under superhot and saline conditions. Their study included a “hot scenario”, where the well operated in the vapor–halite coexistence region, and a “cold scenario”, where the well operated in the vapor–liquid coexistence region. They modeled precipitated halite to accumulate on the well walls, whereas brine was to be transported along with the vapor to the surface. Halite scaling clogged the well in the hot scenario, thus limiting further production. The authors concluded that “it seems safer to target lower temperature regions in saline formations”, where precipitation results in brine rather than halite.
3.5. Specific Entropy Phase Diagram
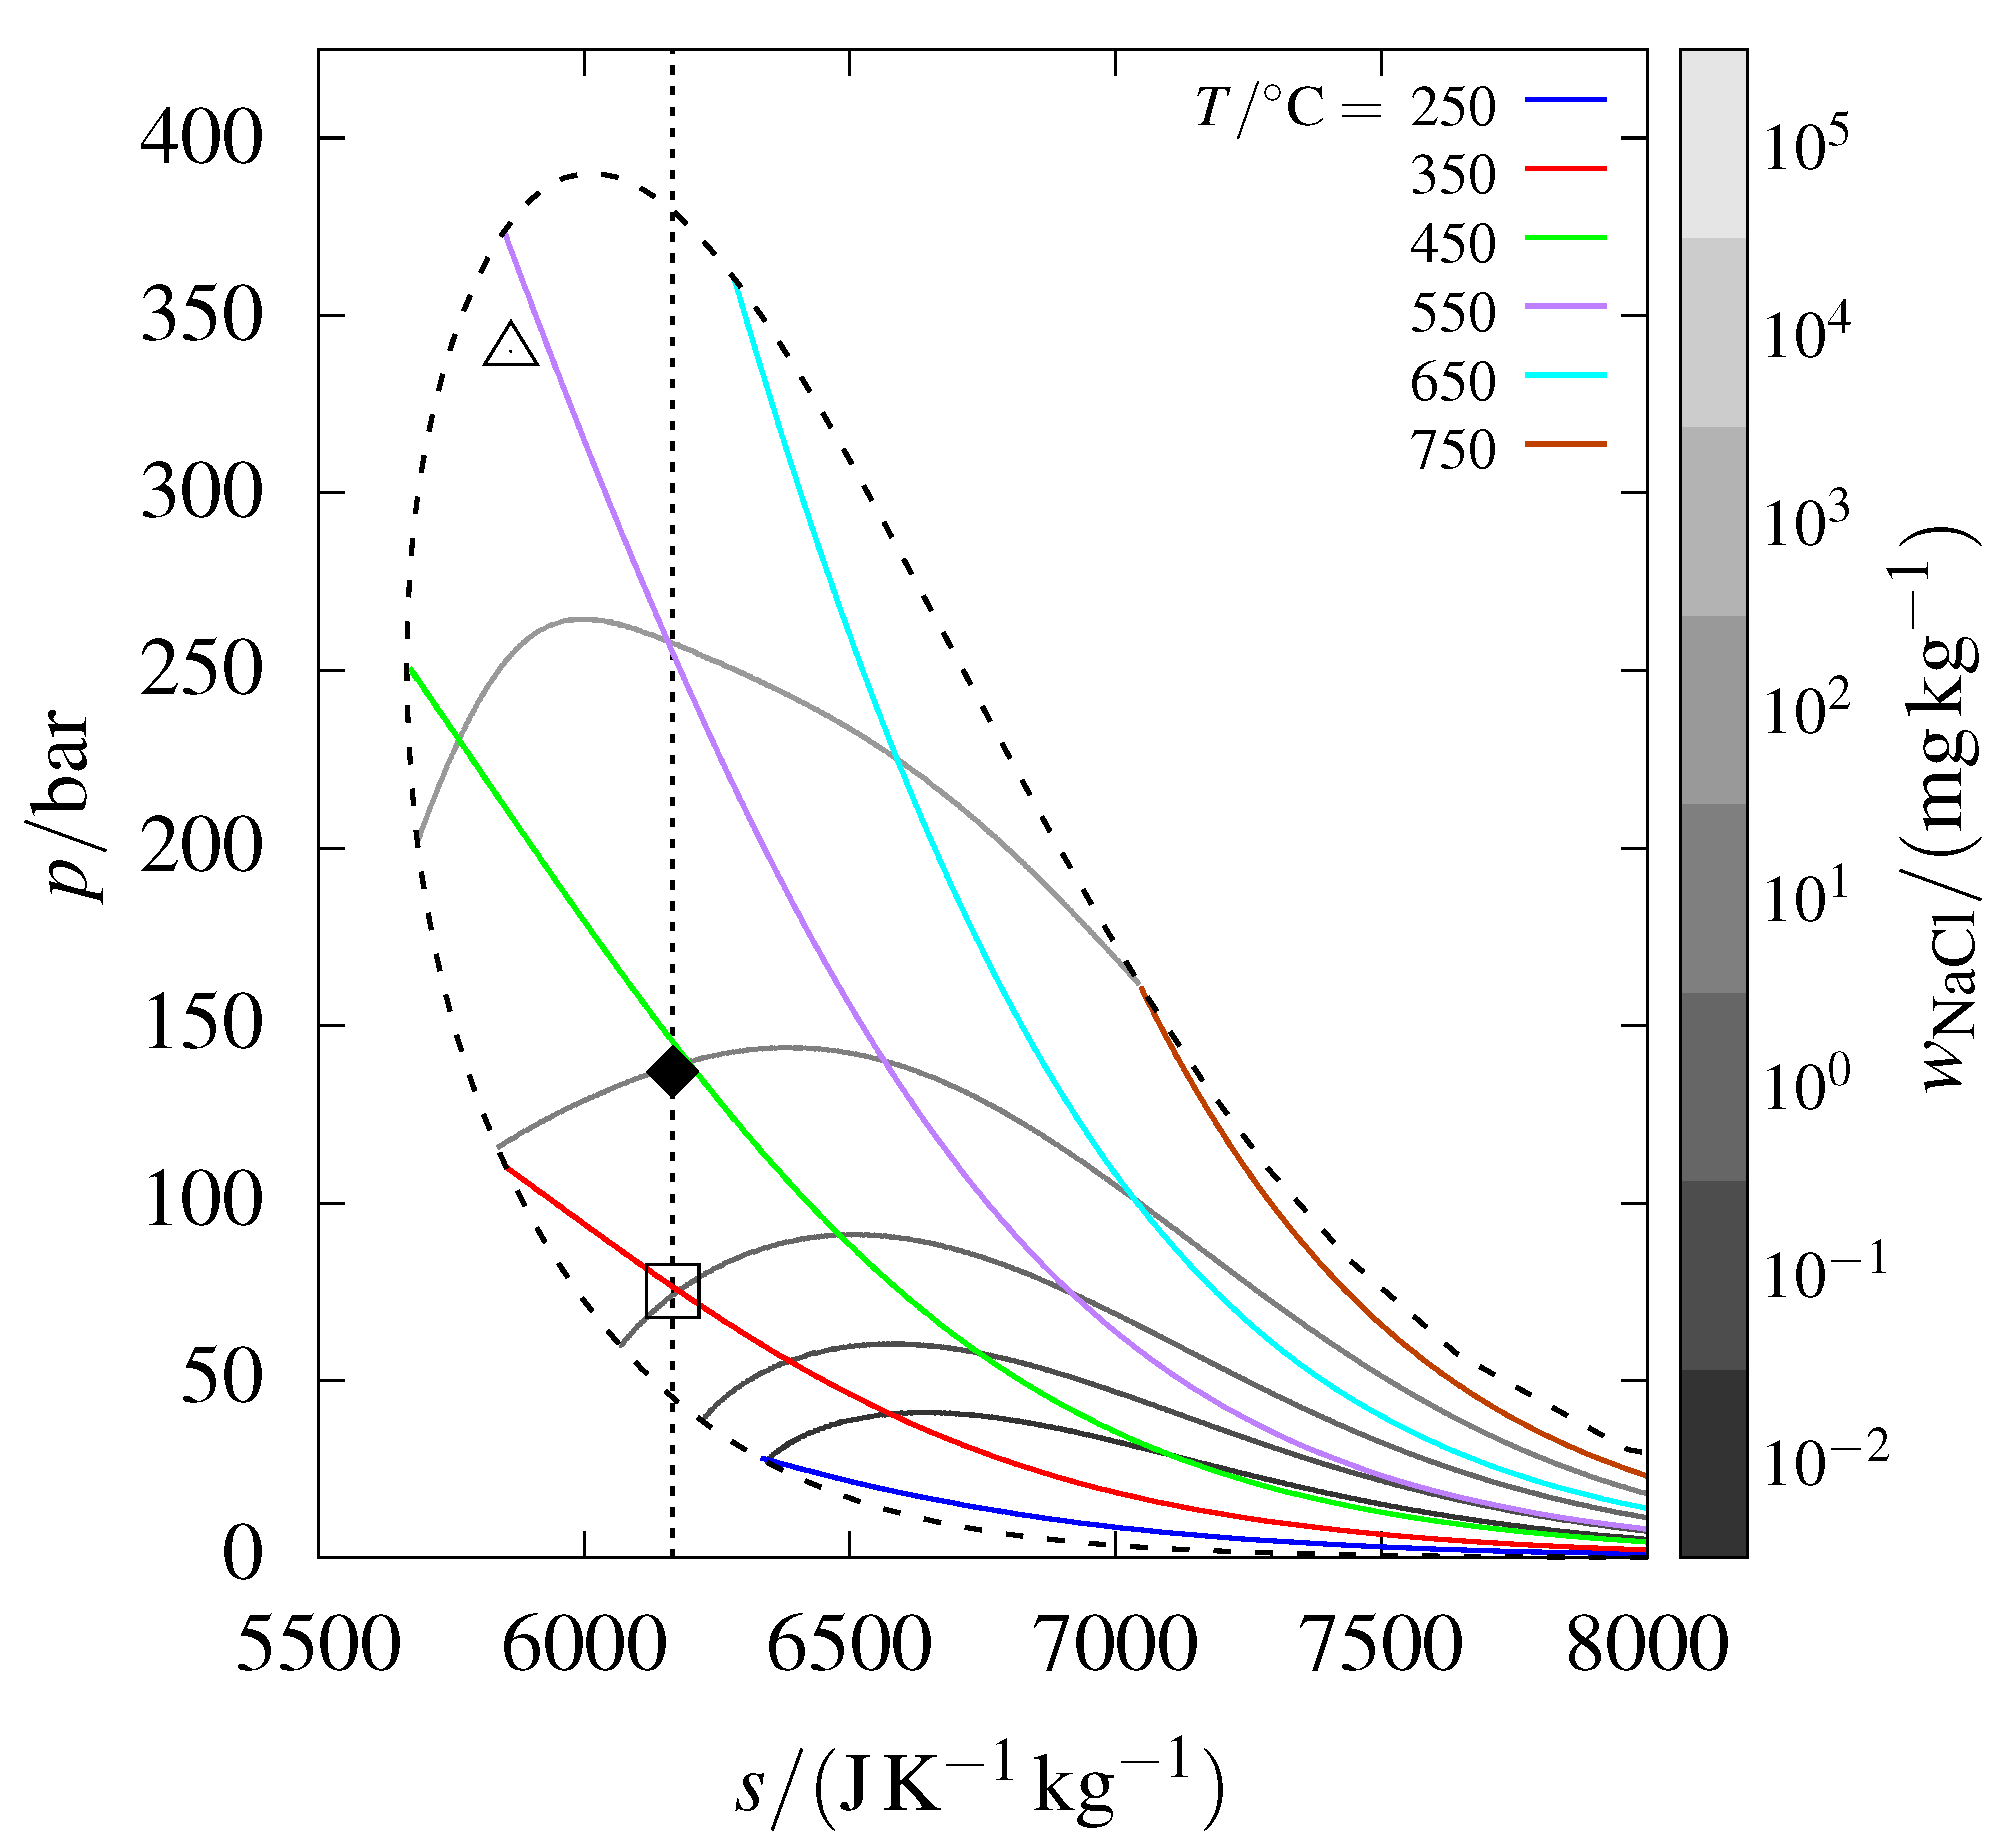
A similar phase diagram for –, represented in terms of pressure and specific entropy, is shown in Figure 2. This diagram features an isentrope that passes through the IDDP-1 sample point, analogous to the isenthalp shown in Figure 1.
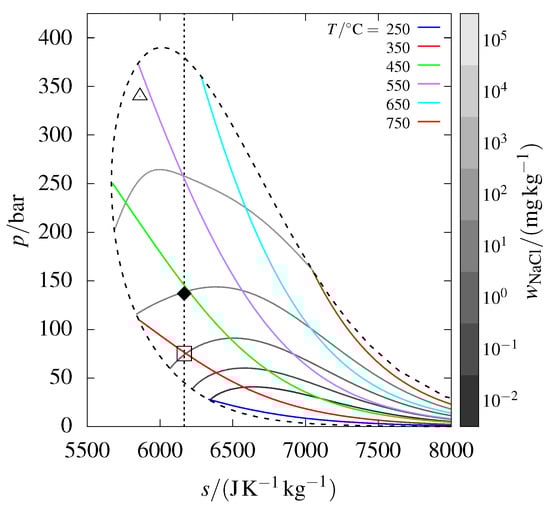
Figure 2.
The phase diagram from Figure 1, but in pressure–specific entropy coordinates; the isenthalp passing through the emphasized point is replaced by an isentrope. The open square denotes where the sample would begin precipitating along the isentrope.
The expansion of a fluid in the turbine of a dry steam power plant can be idealized as an isentropic process. Now, consider the conditions of the IDDP-1 wellhead sample as the inlet conditions of a turbine. During expansion, halite would begin precipitating at the point marked by the open square in Figure 2. If the expansion extends outside the vapor–liquid–halite coexistence curve, precipitation would be brine rather than halite. In contrast, the isenthalpic expansion to atmospheric conditions, following the isenthalp depicted in Figure 1, results exclusively in the precipitation of halite, with no formation of brine. Understanding whether precipitation occurs and the phase (nature) of the precipitate is, of course, essential for avoiding corrosion and scaling in a turbine.
3.6. Changing the Reference State
The H, p diagram in Figure 1 depends on the reference state of internal energy. Using the reference enthalpies from the JANAF Thermochemical tables [26] for results in the pressure–specific enthalpy diagram presented in Figure 3, which differs significantly from the one in Figure 1. For a more comprehensive explanation of the reference state used in Figure 3, see Appendix A.
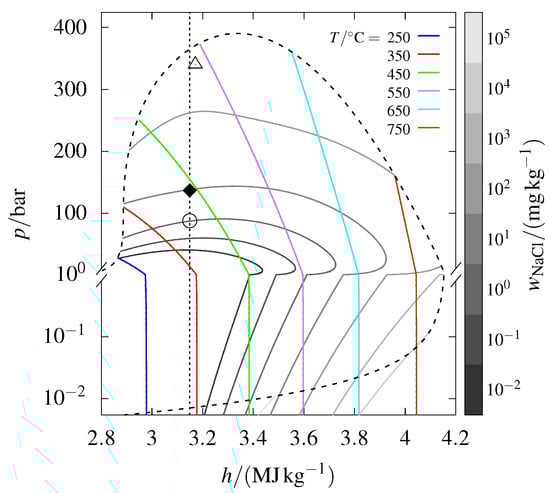
Figure 3.
The phase diagram from Figure 1, but using the standard enthalpy reference values for from the JANAF Thermochemical tables [26].
The most striking feature of Figure 3 is that the vapor–liquid–halite coexistence curve changes direction near the triple point temperature of ( °C). This occurs as increases, causing the specific enthalpy to shift from being dominated by to being increasingly influenced by . The change in reference state of (to the standard used by JANAF and IUPAC) shifts the direction of the coexistence curve because the specific enthalpy of pure is then smaller than that of .
3.7. Limitations
The – system is a simplification of actual hydrothermal fluids, which contain many more inorganic species. As discussed in Ellingsen and Haug-Warberg [13], the chemical potential of a solute dissolved in water is largely unaffected by other dissolved solutes that are present at low concentrations. However, if a species other than water is present at high concentrations, a thermodynamic model capable of describing mixed solvents would be required for the vapor phase. Many species that cause scaling are dissolved at low concentrations under superhot conditions, including [13], [27], and [28]. A species that can be found in geothermal fluids at high concentrations is , which can lead to calcium carbonate scaling [29]. If the scale deposits form a solid solution consisting of multiple species, the model of the solid phase would also need to be more complex [30].
4. Conclusions
Halite scaling in superhot geothermal systems has been explored from a thermodynamic perspective using the – system as a proxy. Phase diagrams in pressure–specific enthalpy and pressure–specific entropy coordinates have been used to visualize how precipitation occurs in different idealized de-pressurization processes. Scaling is discussed for the isenthalpic expansion of a geothermal fluid from the reservoir to the wellhead and for an isentropic turbine used for power generation. In this discussion, a sample from the IDDP-1 superhot geothermal well and an estimate of the downhole conditions of the IDDP-2 well have been used as points of reference. All phase diagrams were calculated using the equation of state described by Ellingsen and Haug-Warberg [13]. The enthalpy–pressure diagram depends on the reference state in a non-trivial way.
Author Contributions
Conceptualization, L.E. and T.H.-W.; methodology, L.E. and T.H.-W.; software, L.E.; validation, L.E.; formal analysis, L.E.; investigation, L.E.; resources, L.E. and T.H.-W.; data curation, L.E.; writing—original draft preparation, L.E.; writing—review and editing, L.E. and T.H.-W.; visualization, L.E.; supervision, T.H.-W.; project administration, T.H.-W.; funding acquisition, T.H.-W. All authors have read and agreed to the published version of the manuscript.
Funding
This publication was funded in part by the Research Council of Norway, grant number 295007, and by EU2020 project GEOPRO, grant agreement ID 851816.
Data Availability Statement
The original contributions presented in this study are included in this article; further inquiries can be directed to the corresponding author.
Conflicts of Interest
The authors declare no conflicts of interest.
Abbreviations
The following abbreviations are used in this manuscript:
| EOS | Equation of state |
| IAPWS | International Association for the Properties of Water and Steam |
| IDDP | Icelandic Deep Drilling Project |
| IUPAC | International Union of Pure and Applied Chemistry |
Appendix A. Reference States
The thermodynamic potentials Helmholtz energy (), enthalpy (), and Gibbs energy () are all related to the internal energy () through Legendre transforms:
Here, is the pressure and is the entropy. The enthalpy and entropy of the vapor and halite phases can be calculated by substituting the Helmholtz and Gibbs energy expressions from Equations (1) and (2) into Equation (A1).
Internal energy is not an absolute property and is typically defined relative to a chosen reference state. Thus, according to Equation (A1), Helmholtz energy, enthalpy, and Gibbs energy are also not absolute. The preferred reference state can vary depending on the scientific field and the system in question.
Appendix A.1. Reference States Used in Figure 1 and Figure 2
As mentioned in the main text, the convention of the IAPWS is used in Figure 1 and Figure 2. Specifically, the specific internal energy and specific entropy of both saturated liquid water and halite are assigned a value of zero at the triple point of pure water. At the triple point, the temperature is by definition , while the pressure () and the specific volume of the liquid phase () can be calculated from the IAPWS-95 EOS [20,21].
Let U, , and represent the internal energy of the vapor phase, pure water, and halite, respectively. In the current work, these are modeled by performing Legendre transforms on the Helmholtz and Gibbs energy terms from Equations (1) and (2). The specific internal energy of the vapor can then be calculated as
where is the total volume of the liquid phase at the triple point of pure water. The specific enthalpy of the vapor is then given by , where is the specific volume.
Entropy is a thermodynamic property that is defined unambiguously without any reference state. However, the IAPWS also assigns the specific entropy of liquid water a value of zero at its triple point. This work adheres to their convention, so the specific entropy is calculated analogously to Equation (A2) as follows:
Appendix A.2. Reference State Used in Figure 3
In Figure 3, the enthalpy of is calculated using the JANAF Thermochemical tables, where the specific enthalpy of one phase of each element is assigned a value of zero at the standard pressure and the temperature [26]. For the elements that make up , the chosen phases are solid and ideal gas, with the enthalpies and . The expression for the specific internal energy under this alternative convention is obtained by replacing the term in Equation (A2) with
Here, and , where is the molar mass of .
References
- Friðleifsson, G.Ó.; Elders, W.A.; Albertsson, A. The concept of the Iceland deep drilling project. Geothermics 2014, 49, 2–8. [Google Scholar] [CrossRef]
- Reinsch, T.; Dobson, P.; Asanuma, H.; Huenges, E.; Poletto, F.; Sanjuan, B. Utilizing supercritical geothermal systems: A review of past ventures and ongoing research activities. Geotherm. Energy 2017, 5, 16. [Google Scholar] [CrossRef]
- Driesner, T. Supercritical and Superhot Geothermal Resources-Some Fundamental Insights. Proc. World Geotherm. Congr. 2020, 1, 1–6. [Google Scholar]
- Gunnarsson, G.; Pálsdóttir, A.; Ragnarsdóttir, K.R.; Friðriksson, Þ. Towards Utilization of Superhot Geothermal Resources–the IDDP Project and Beyond. In Proceedings of the 49th Workshop on Geothermal Reservoir Engineering, Stanford, CA, USA, 12–14 February 2024. [Google Scholar]
- Stober, I.; Bucher, K. Scaling in Geothermal Energy Production: From Theoretical Models to Exploration and Development; Springer Nature: Cham, Switzerland, 2021; Chapter 15.7; pp. 379–390. [Google Scholar] [CrossRef]
- Andritsos, N.; Karabelas, A.; Koutsoukos, P. Scale formation in geothermal plants. Int. Summer Sch. Direct Appl. Geotherm. Energy 2002, 179–189. [Google Scholar]
- Hesshaus, A.; Houben, G.; Kringel, R. Halite clogging in a deep geothermal well – Geochemical and isotopic characterisation of salt origin. Phys. Chem. Earth, Parts A/B/C 2013, 64, 127–139. [Google Scholar] [CrossRef]
- Scott, S.; Driesner, T.; Weis, P. Boiling and condensation of saline geothermal fluids above magmatic intrusions. Geophys. Res. Lett. 2017, 44, 1696–1705. [Google Scholar] [CrossRef]
- Lamy-Chappuis, B.; Yapparova, A.; Driesner, T. Simulations of the IDDP-2 well, Reykjanes, Iceland, and its behavior in different operation scenarios. Geothermics 2023, 114, 102790. [Google Scholar] [CrossRef]
- Driesner, T. The Molecular-Scale Fundament of Geothermal Fluid Thermodynamics. Rev. Mineral. Geochem. 2013, 76, 5–33. [Google Scholar] [CrossRef]
- Dolejš, D. Thermodynamics of Aqueous Species at High Temperatures and Pressures: Equations of State and Transport Theory. Rev. Mineral. Geochem. 2013, 76, 35–79. [Google Scholar] [CrossRef]
- Feng, G.; Xu, T.; Zhao, Y.; Gherardi, F. Heat mining from super-hot horizons of the Larderello geothermal field, Italy. Renew. Energy 2022, 197, 371–383. [Google Scholar] [CrossRef]
- Ellingsen, L.; Haug-Warberg, T. Thermodynamics of NaCl in dense water vapor via cross virial coefficients. Geochim. Cosmochim. Acta 2024, 375, 19–35. [Google Scholar] [CrossRef]
- Lamy-Chappuis, B.; Yapparova, A.; Driesner, T. Advanced well model for superhot and saline geothermal reservoirs. Geothermics 2022, 105, 102529. [Google Scholar] [CrossRef]
- Ármannsson, H.; Fridriksson, T.; Gudfinnsson, G.H.; Ólafsson, M.; Óskarsson, F.; Thorbjörnsson, D. IDDP—The chemistry of the IDDP-01 well fluids in relation to the geochemistry of the Krafla geothermal system. Geothermics 2014, 49, 66–75. [Google Scholar] [CrossRef]
- Friðleifsson, G.O.; Elders, W.A.; Zierenberg, R.A.; Stefánsson, A.; Fowler, A.P.G.; Weisenberger, T.B.; Harðarson, B.S.; Mesfin, K.G. The Iceland Deep Drilling Project 4.5 km deep well, IDDP-2, in the seawater-recharged Reykjanes geothermal field in SW Iceland has successfully reached its supercritical target. Sci. Drill. 2017, 23, 1–12. [Google Scholar] [CrossRef]
- Weisenberger, T.B.; Harðarson, B.S.; Mesfin, K.G.; Einarsson, G.M.; Níelsson, S.; Zierenberg, R.A.; Friðleifsson, G.Ó. The Iceland Deep Drilling Project at Reykjanes—4.5 km Deep Drilling into Supercritical Conditions. In Proceedings of the 44th Workshop on Geothermal Reservoir Engineering, Stanford, CA, USA, 11–13 February 2019. [Google Scholar]
- The Iceland Deep Drilling Project at Reykjanes: Drilling into the root zone of a black smoker analog. J. Volcanol. Geotherm. Res. 2020, 391, 106435. [CrossRef]
- Óskarsson, F. Composition of Reservoir Fluids in Well IDDP-2. In Proceedings of the World Geothermal Congress, Reykjavik, Iceland, 21–26 May 2021; Volume 1. [Google Scholar]
- Wagner, W.; Pruß, A. The IAPWS formulation 1995 for the thermodynamic properties of ordinary water substance for general and scientific use. J. Phys. Chem. Ref. Data 2002, 31, 387–535. [Google Scholar] [CrossRef]
- International Association for the Properties of Water and Steam. IAPWS R6-95(2018), Revised Release on the IAPWS Formulation 1995 for the Thermodynamic Properties of Ordinary Water Substance for General and Scientific Use. IAPWS 2018, 31, 387–535. [Google Scholar]
- Hasan, A.; Kabir, C. Modeling two-phase fluid and heat flows in geothermal wells. J. Pet. Sci. Eng. 2010, 71, 77–86. [Google Scholar] [CrossRef]
- Bordvik, S.; van Erp, T.S.; Ucar, S.; Næss, E. Predicting Silica Deposition from Superheated, Pressurized Steam Using Numerical Modeling of Nucleation, Agglomeration and Deposition. Energies 2023, 16, 6906. [Google Scholar] [CrossRef]
- Friðleifsson, G.Ó.; Elders, W.A. The Iceland Deep Drilling Project: A search for deep unconventional geothermal resources. Geothermics 2005, 34, 269–285. [Google Scholar] [CrossRef]
- Driesner, T.; Heinrich, C.A. The system H2O–NaCl. Part I: Correlation formulae for phase relations in temperature–pressure–composition space from 0 to 1000 °C, 0 to 5000 bar, and 0 to 1 XNaCl. Geochim. Cosmochim. Acta 2007, 71, 4880–4901. [Google Scholar] [CrossRef]
- Chase, M.W. JANAF—Thermochemical Tables, 4th ed.; American Institute of Physics: Woodbury, NY, USA, 1998. [Google Scholar]
- Higashi, H.; Iwai, Y.; Matsumoto, K.; Kitani, Y.; Okazaki, F.; Shimoyama, Y.; Arai, Y. Measurement and correlation for solubilities of alkali metal chlorides in water vapor at high temperature and pressure. Fluid Phase Equilibria 2005, 228–229, 547–551. [Google Scholar] [CrossRef]
- Plyasunov, A.V. Thermodynamics of Si(OH)4 in the vapor phase of water: Henry’s and vapor–liquid distribution constants, fugacity and cross virial coefficients. Geochim. Cosmochim. Acta 2012, 77, 215–231. [Google Scholar] [CrossRef]
- Arnórsson, S. Deposition of calcium carbonate minerals from geothermal waters—Theoretical considerations. Geothermics 1989, 18, 33–39. [Google Scholar] [CrossRef]
- Fournier, R.O.; Thompson, J. Composition of steam in the system NaCl-KCl-H2O-quartz at 600 °C. Geochim. Cosmochim. Acta 1993, 57, 4365–4375. [Google Scholar] [CrossRef]
Disclaimer/Publisher’s Note: The statements, opinions and data contained in all publications are solely those of the individual author(s) and contributor(s) and not of MDPI and/or the editor(s). MDPI and/or the editor(s) disclaim responsibility for any injury to people or property resulting from any ideas, methods, instructions or products referred to in the content. |
© 2024 by the authors. Licensee MDPI, Basel, Switzerland. This article is an open access article distributed under the terms and conditions of the Creative Commons Attribution (CC BY) license (https://creativecommons.org/licenses/by/4.0/).