Article

A Modified Variable Power Angle Control for Unified Power Quality Conditioner in a Distorted Utility Source

by
Krittapas Chaiyaphun
1,
Phonsit Santiprapan
1,* and
Kongpol Areerak
2
1
Department of Electrical and Biomedical Engineering, Faculty of Engineering, Prince of Songkla University, Songkhla 90110, Thailand
2
School of Electrical Engineering, Institute of Engineering, Suranaree University of Technology, Nakhon Ratchasima 30000, Thailand
*
Author to whom correspondence should be addressed.
Energies 2024, 17(12), 2830; https://doi.org/10.3390/en17122830
Submission received: 29 April 2024 / Revised: 28 May 2024 / Accepted: 6 June 2024 / Published: 8 June 2024
(This article belongs to the Section F: Electrical Engineering)

Abstract

:
The distorted supply voltage degrades the control performance of a unified power quality conditioner (UPQC). This problem causes incorrect calculations in the harmonic identification and reference signal generation processes. This paper proposes a modified harmonic identification of the UPQC. The reference compensating current calculation for the shunt active power filter (shunt APF) is developed using the sliding window with the Fourier analysis (SWFA) method. In addition, the variable power angle control (PAC) is applied to operate the reference signal generation of the series APF and the shunt APF of the UPQC. Under the distorted voltage and nonlinear load conditions, the proposed approach can provide accurate reference compensating signals and successfully share the load reactive power compensation between the shunt APF and the series APF. In this work, a three-phase, three-wire power system with linear and nonlinear loads was implemented. The proposed method was validated using the processor-in-the-loop technique on an eZdsp™ F28335 board and the MATLAB/Simulink program. The testing results indicated that SWFA has excellent filtering performance and enhances harmonic identification compared to the operation without any filter or with low pass filters (LPF). With the proposed approach, the percentage of total harmonic distortion of voltage and current could be maintained within the IEEE519-2022 standard, and the magnitude of the RMS voltage across the load was in the recommended range specified by ANSI C84.1-2016.

1. Introduction

Modern power distribution systems are facing various power quality (PQ) problems. The widespread of renewable energy distributed generation [1] and the increase in nonlinear loads in industrial and domestic appliances [2] can potentially degrade both the voltage and current quality of the power system. Voltage sag, voltage swell, harmonic current, and harmonic supply voltage are common power quality problems [3]. These may lead to power system issues such as power losses in transmission lines [4], overheating of capacitors and transformers, and malfunctioning of protective relays [5]. Moreover, electronics-based instruments (e.g., computers and micro-controller systems) are growing rapidly in domestic and industrial applications. These devices require a high standard of power quality for a safe and stable operation [6]. Considering the distribution side and load side of the power system, it is essential to ensure a pure sinusoidal waveform of constant magnitude and frequency of supply.
To mitigate the problems mentioned above, capacitor banks and passive power filters are commonly selected in the conventional approach. Capacitor banks are used for reactive power compensation. Passive power filters (PPFs) are installed to mitigate harmonic issues due to their simplicity and low cost [7]. However, these devices are inflexible as they are generally setup for one particular load. In other words, a change in load demand can worsen the compensation performance. PPFs are also sensitive to resonance between the system and filter [8]. This effect can cause an amplification of harmonic current, which may lead to excessive heat and machine breakdown. Therefore, active power filters (APFs) have been mostly adopted as they are more flexible and can suppress various PQ problems compared to PPFs [9]. APFs are classified into three configurations: shunt APFs, series APFs, and hybrid APFs. The combination of a series APF and a shunt APF called unified power quality conditioning (UPQC) is designed to simultaneously suppress disturbances on the load and supply sides [10]. A common UPQC structure is shown in Figure 1. This structure is called UPQC-R according to the position of the shunt APF with respect to the series APF. The control of UPQC can be divided into three main parts: reference signal generation, reference signal tracking control, and DC bus voltage control.
This paper focused solely on the reference signal generation process. This process is the first and crucial step to ensure the performance of reference signal tracking control. The reference signal generation process concerns the voltage compensation strategy and harmonic identification methods. There are four main voltage compensation strategies for UPQC, including UPQC-P, UPQC-Q, UPQC-VAmin, and UPQC-S. In the UPQC-P strategy, active power is injected through the series transformer for the voltage sag and voltage swell compensation [11]. In the UPQC-Q approach, only voltage sag is mitigated by the reactive power compensation [12,13]. The UPQC-VAmin has been developed to compensate for the voltage swell. Moreover, a minimum VA rating of UPQC is considered in this approach [14,15]. Recently, UPQC-S was proposed [16,17,18]. This approach cooperates with the power angle control (PAC) method. The PAC method can be considered for both voltage sag and voltage swell conditions. Simultaneously, the reactive power compensation is shared between a shunt APF and a series APF. This results in a reduction in the shunt APF rating and its cost. However, in voltage sag/swell conditions, the UPQC with the PAC method cannot share equal reactive power compensation. The variable PAC method [18] has been proposed. The power angle is regulated by the voltage fluctuation factor. Here, this approach can maintain a balanced reactive power compensation between a shunt APF and a series APF. Due to these advantages, the UPQC-S with variable PAC is also adopted in this study.
Apart from the voltage compensation strategy, harmonic identification of the shunt and series APFs is also an important process for reference signal generation. The harmonic identification of UPQC is classified mainly as frequency domain methods [19] and time domain methods [16,17,20,21,22,23,24,25,26,27,28]. The frequency domain method required a large dataset and high computational capability. This results in a delay in calculation, which is not suitable for the real-time performance of UPQC. Therefore, time-domain methods are more widely considered for identifying the harmonics. From the literature reviews, the instantaneous p-q theory (PQ) [16,17,20,21,22,23,24], the synchronous reference frame (SRF) or d-q theory [25,26], unit vector template generation (UVTG) [27], and machine learning-based techniques [28] have been presented.
It was found that the PQ method can operate suitably with the UPQC-S approach, leading to simple and fast computation in the digital signal processor implementation. However, in a distorted voltage source condition, a harmonic voltage extraction process for the reference signal generation must be considered. The harmonic voltage on the utility source side can cause an incorrect calculation of the reference signal [29]. This problem also affects the UPQC control performance for power quality improvement. The design and development of the filtering method to obtain the fundamental component of the source voltage has been researched to overcome this condition. In [25], an LPF method was adopted. This filter is simple, but it has limitations, including cut-off frequency tuning and a non-ideal characteristic of filters. Thus, the LPF cannot accurately draw the fundamental component from the distorted source voltage. In [26], under distorted voltage conditions, a modified PLL was applied to track the fundamental frequency and phase angle of the PCC voltage for the SRF method. However, according to the functional block diagram of the modified PLL circuit, the PI controller cannot attenuate the oscillating component of the three-phase power well. The appropriate design of the PI controller parameter is required to avoid instability. In the study in [21], generalized cascaded delay signal cancellation (GCDSC) was proposed to extract the fundamental source voltage. However, this technique can still cause magnitude and phase errors at high frequencies. Thus, additional bandpass filters (BPF) were used to draw these high-frequency components. In [24], the fundamental source voltage was calculated by the limit cycle oscillator–frequency lock loop (LCO-FLL) circuit. To obtain the fundamental source voltage, this technique requires the Jacobian matrix analysis, the Lyapunov theory, and the BPF. From the studies in [21,24], it can be observed that more design procedures, computational complexity, and processing delay must be taken into account in the reference signal generation process when the distorted voltage source is presented.
The sliding window with Fourier analysis (SWFA) as a filter has been applied in the harmonic identification process [30]. The SWFA mechanism can be designed to calculate a signal component at a specific frequency. The considered component is accurately calculated based on the discrete Fourier transform. Here, multiple processes are not required in the harmonic voltage extraction, thereby reducing the complexity and the computational burden of the filtering procedure. In this work, the SWFA method is applied to improve power quality using UPQC.
Based on existing works in the literature, a summary comparison between the related work and the proposed work is presented in Table 1. The main contributions of this work are as follows:
  • A distorted voltage source was not studied in many literature [17,18,19,20,23,28]. In this work, the reference compensating current calculation with the SWFA is proposed to achieve robustness of harmonic identification in a distorted utility source.
  • For the control of UPQC, the use of SWFA in the harmonic voltage extraction process is presented. The use of multiple filters and design complexity are not required in this proposed approach.
As mentioned above, these two points can provide accurate reference signals for the UPQC control. This results in an excellent performance of the power quality improvement under voltage sag, voltage swell, harmonic source voltage, and harmonic current. According to performance indices, the total harmonic distortions ( % T H D i , % T H D v ) and the RMS voltage magnitude are maintained within the IEEE519-2022 [31] and ANSI C84.1-2016 [32] standards, respectively. Moreover, the PAC method operated with the proposed reference signal generation can still share the load-reactive power compensation between the shunt APF and the series APF. Therefore, this approach can reduce the required VA rating of shunt APF and installation cost.
The rest of this paper is organized as follows: Section 2 describes the structure of the UPQC and the power system investigated in this study. Section 3 explains the proposed methodology, including the principles of harmonic identification and reference signal generation using the SWFA filter. Section 4 explains the processor-in-the-loop (PIL) simulation setup and the testing conditions for the UPQC. The performances of the SWFA and the UPQC operation are presented and discussed in Section 5. Finally, the significant results of this paper are summarized in Section 6.

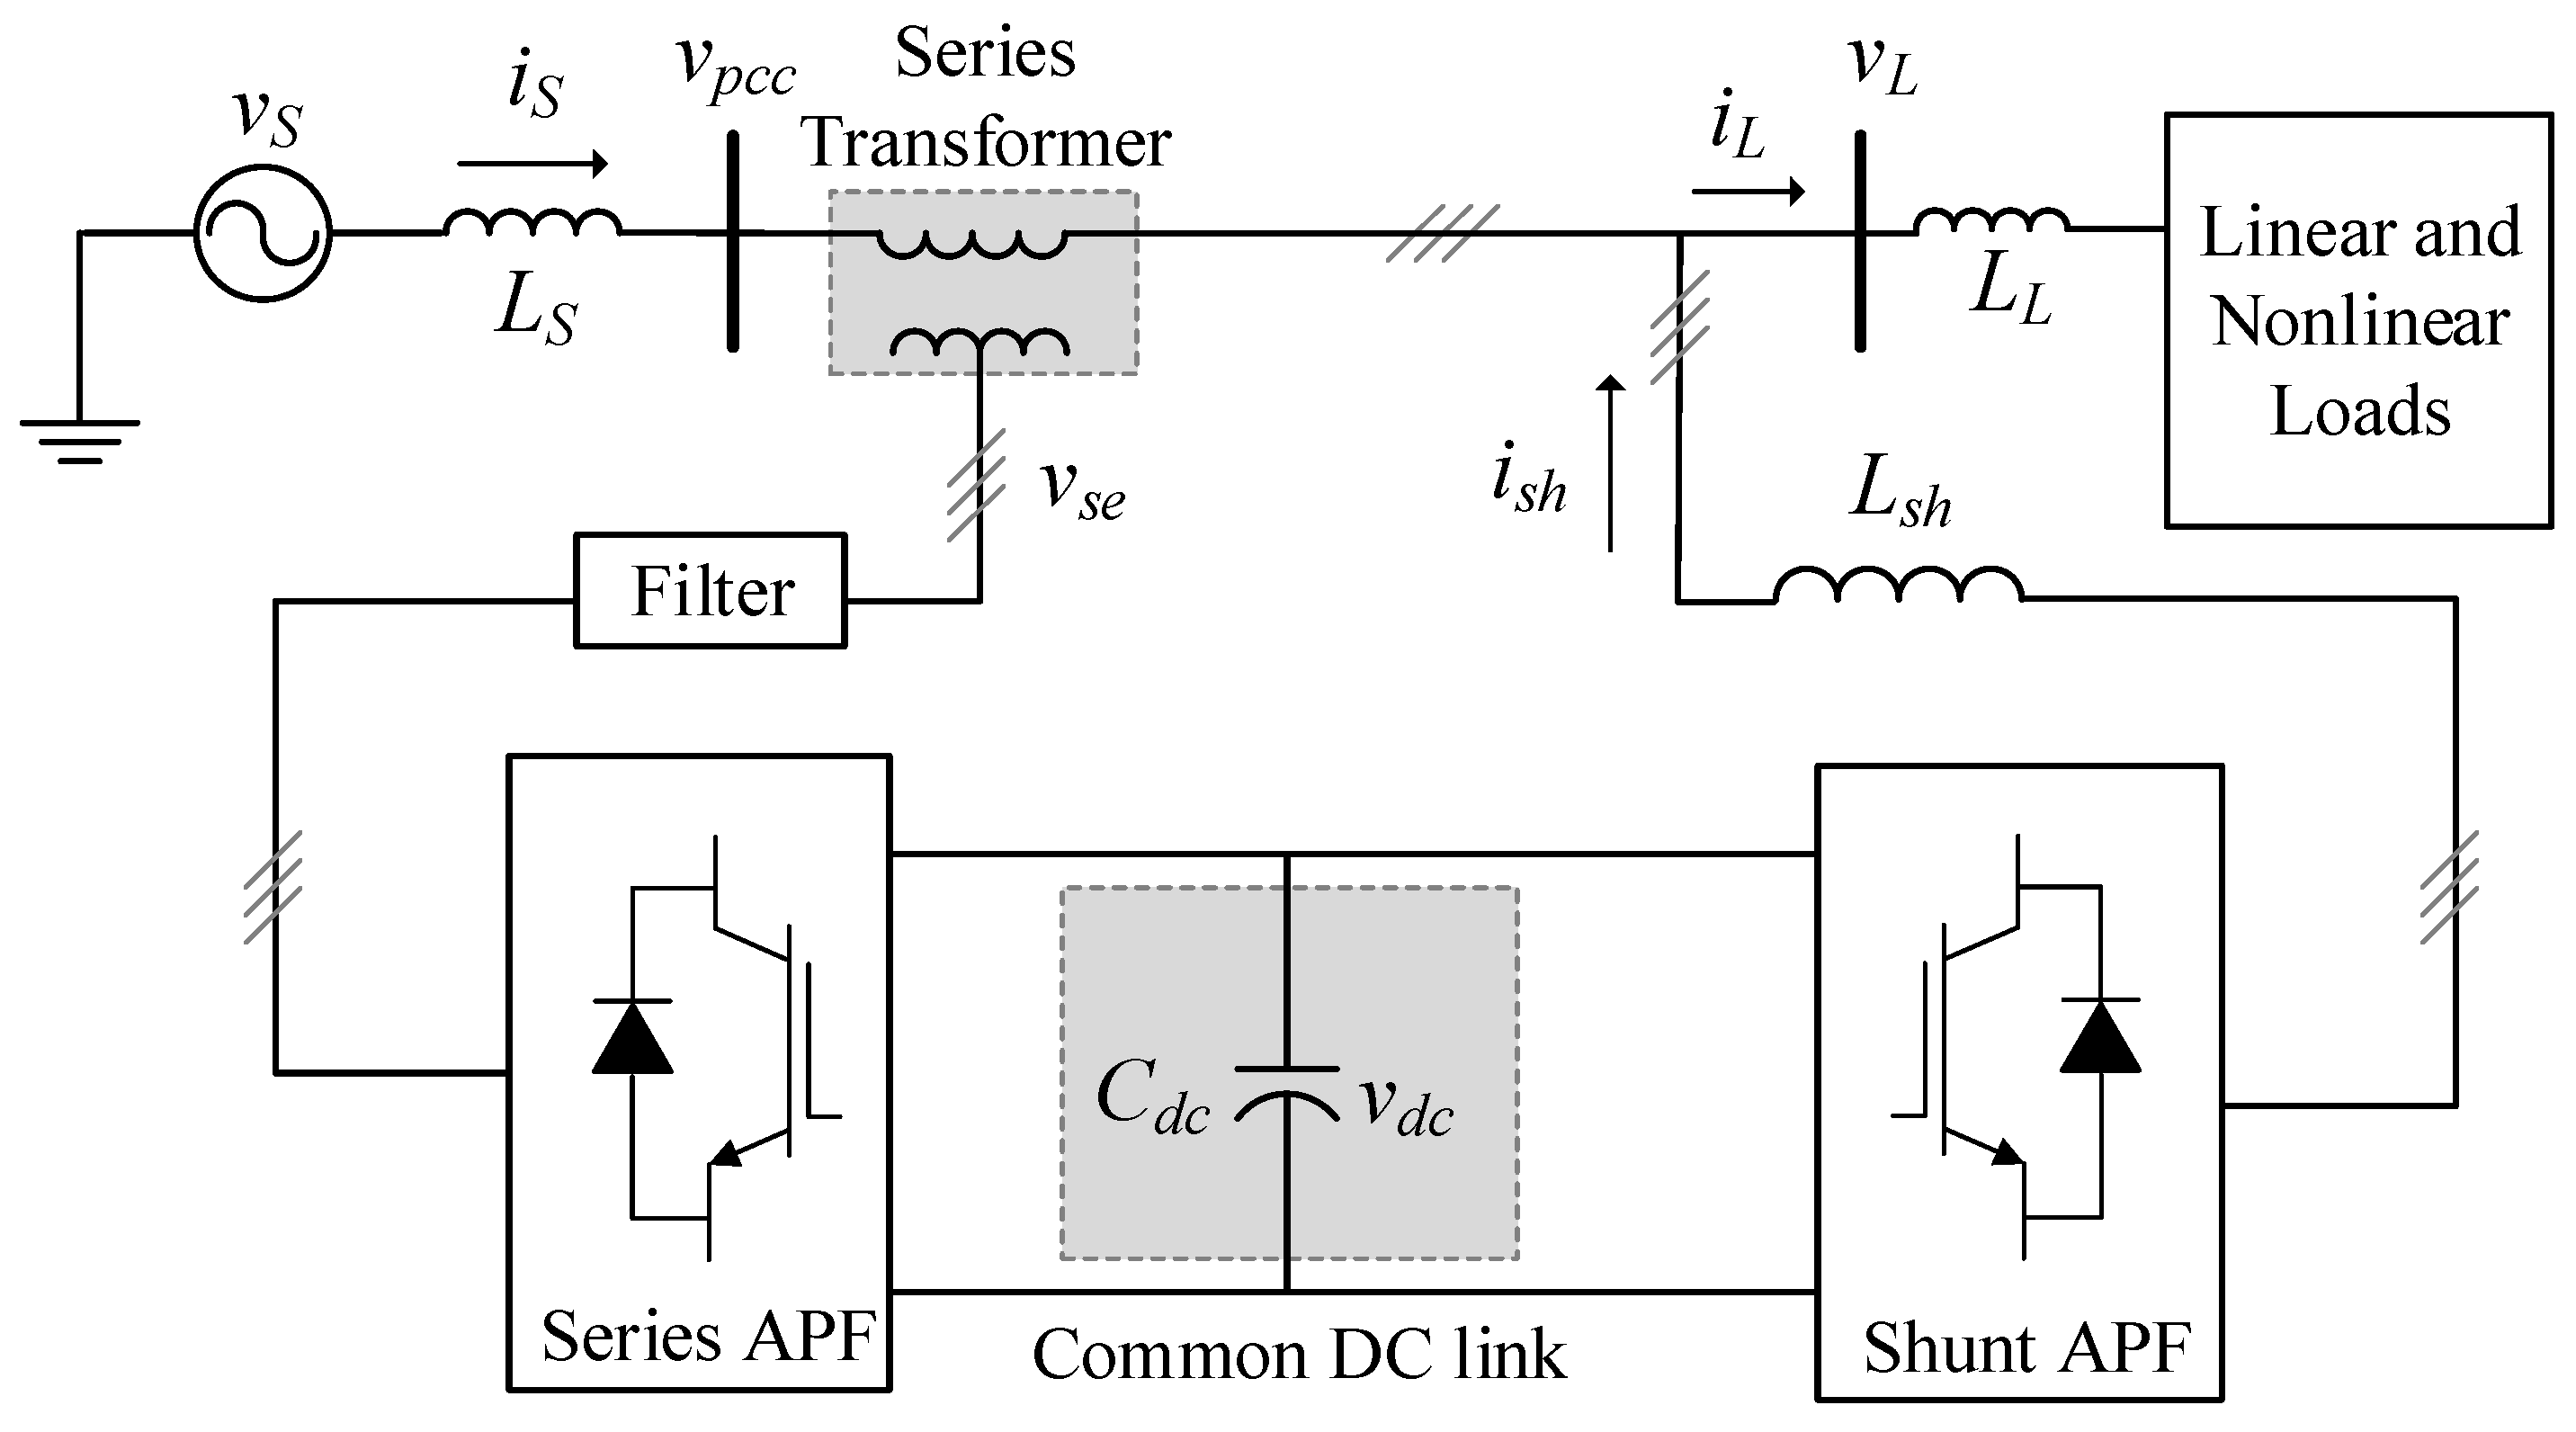
2. Structure of the Studied Unified Power Quality Conditioner System

As illustrated in Figure 1, a UPQC consists of a series APF and a shunt APF. The APFs are connected back-to-back through a common DC voltage link. The series APF is used to mitigate load voltage problems such as voltage sag, voltage swell, and harmonic voltages on the supply utility, whereas the shunt APF is used to compensate for the distorted current due to nonlinear load.
This study focused exclusively on the harmonic identification and reference signal generation of the UPQC in the balanced three-phase three-wire system. To avoid the performance factor of the UPQC control, the ideal voltage sources and the ideal current sources were used as the series APF and the shunt APF, respectively. Hence, the capacitor and DC bus voltage control were excluded. The UPQC topology and the considered power system are presented in Figure 2. In this configuration, the reference compensating currents ( i s h , a b c * ) and the reference compensating voltages ( v s e , a b c * ) are injected by the ideal sources. Therefore, the generated reference signals can be taken directly as the compensating signals of the UPQC. It should be noted that the line impedances between the supply and the point of common coupling (PCC) were negligible in the system studied. Therefore, the source voltage ( v S ) was assumed to be the same as the PCC voltage ( v p c c ).

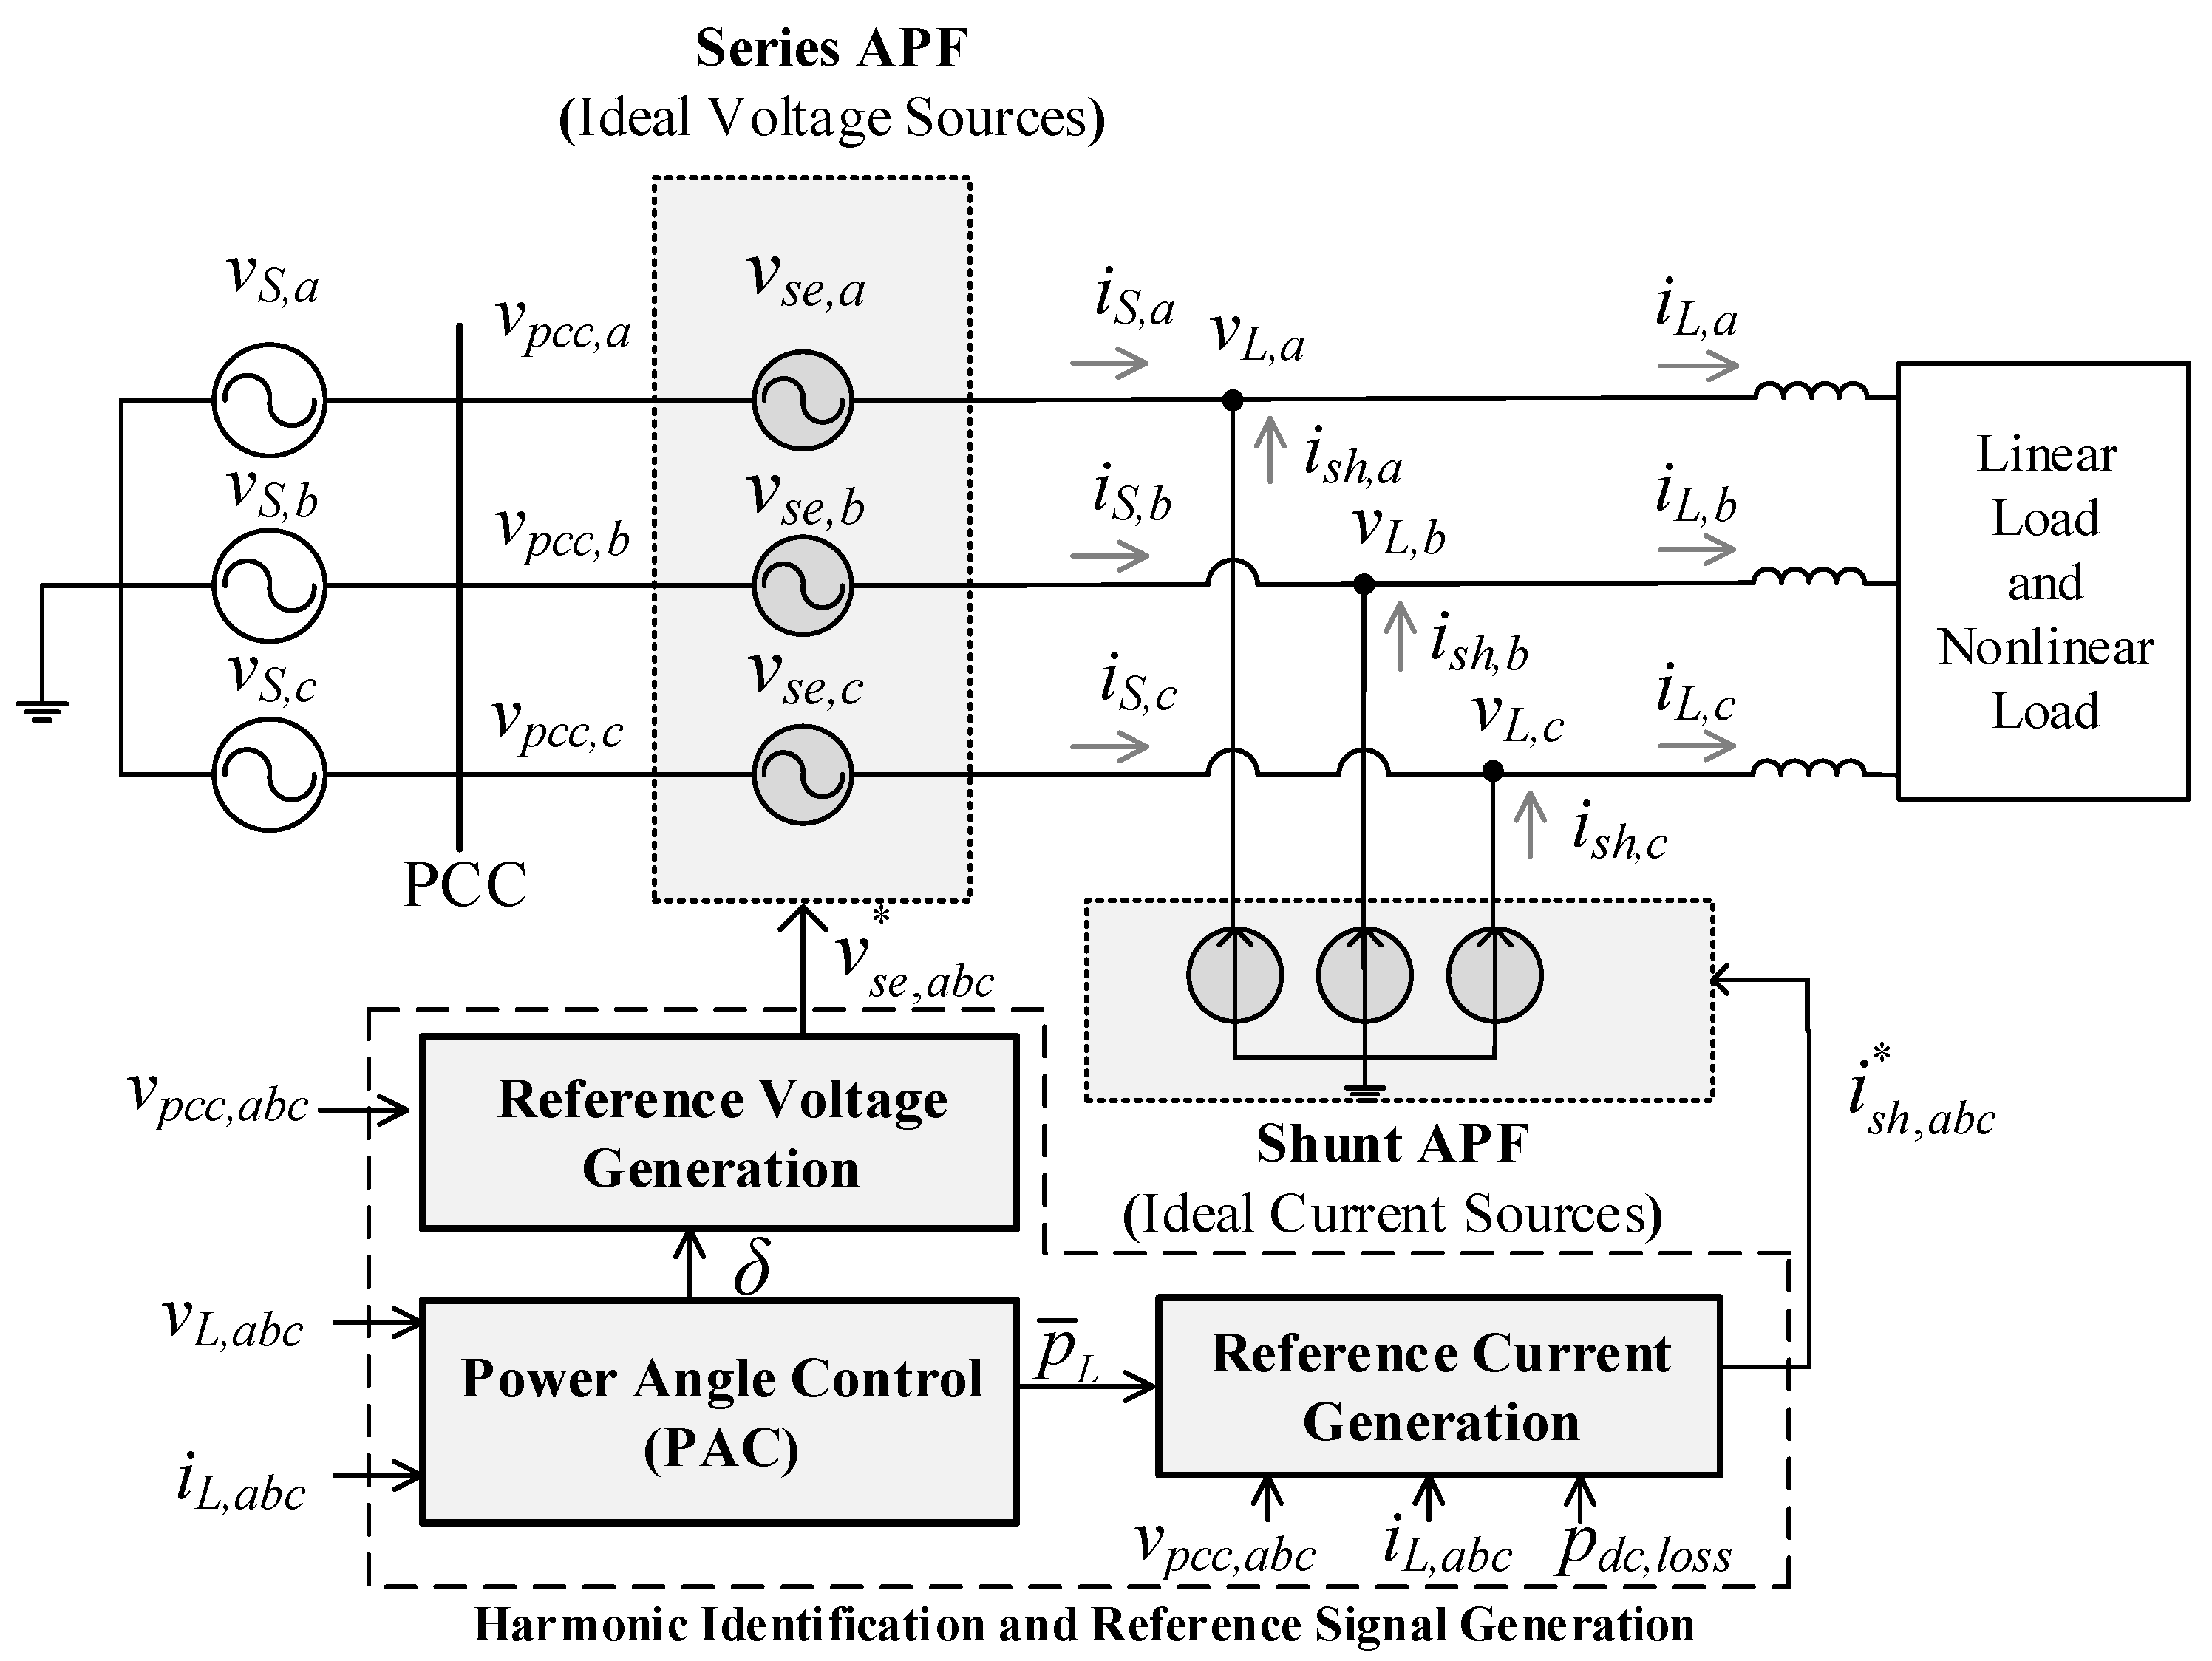
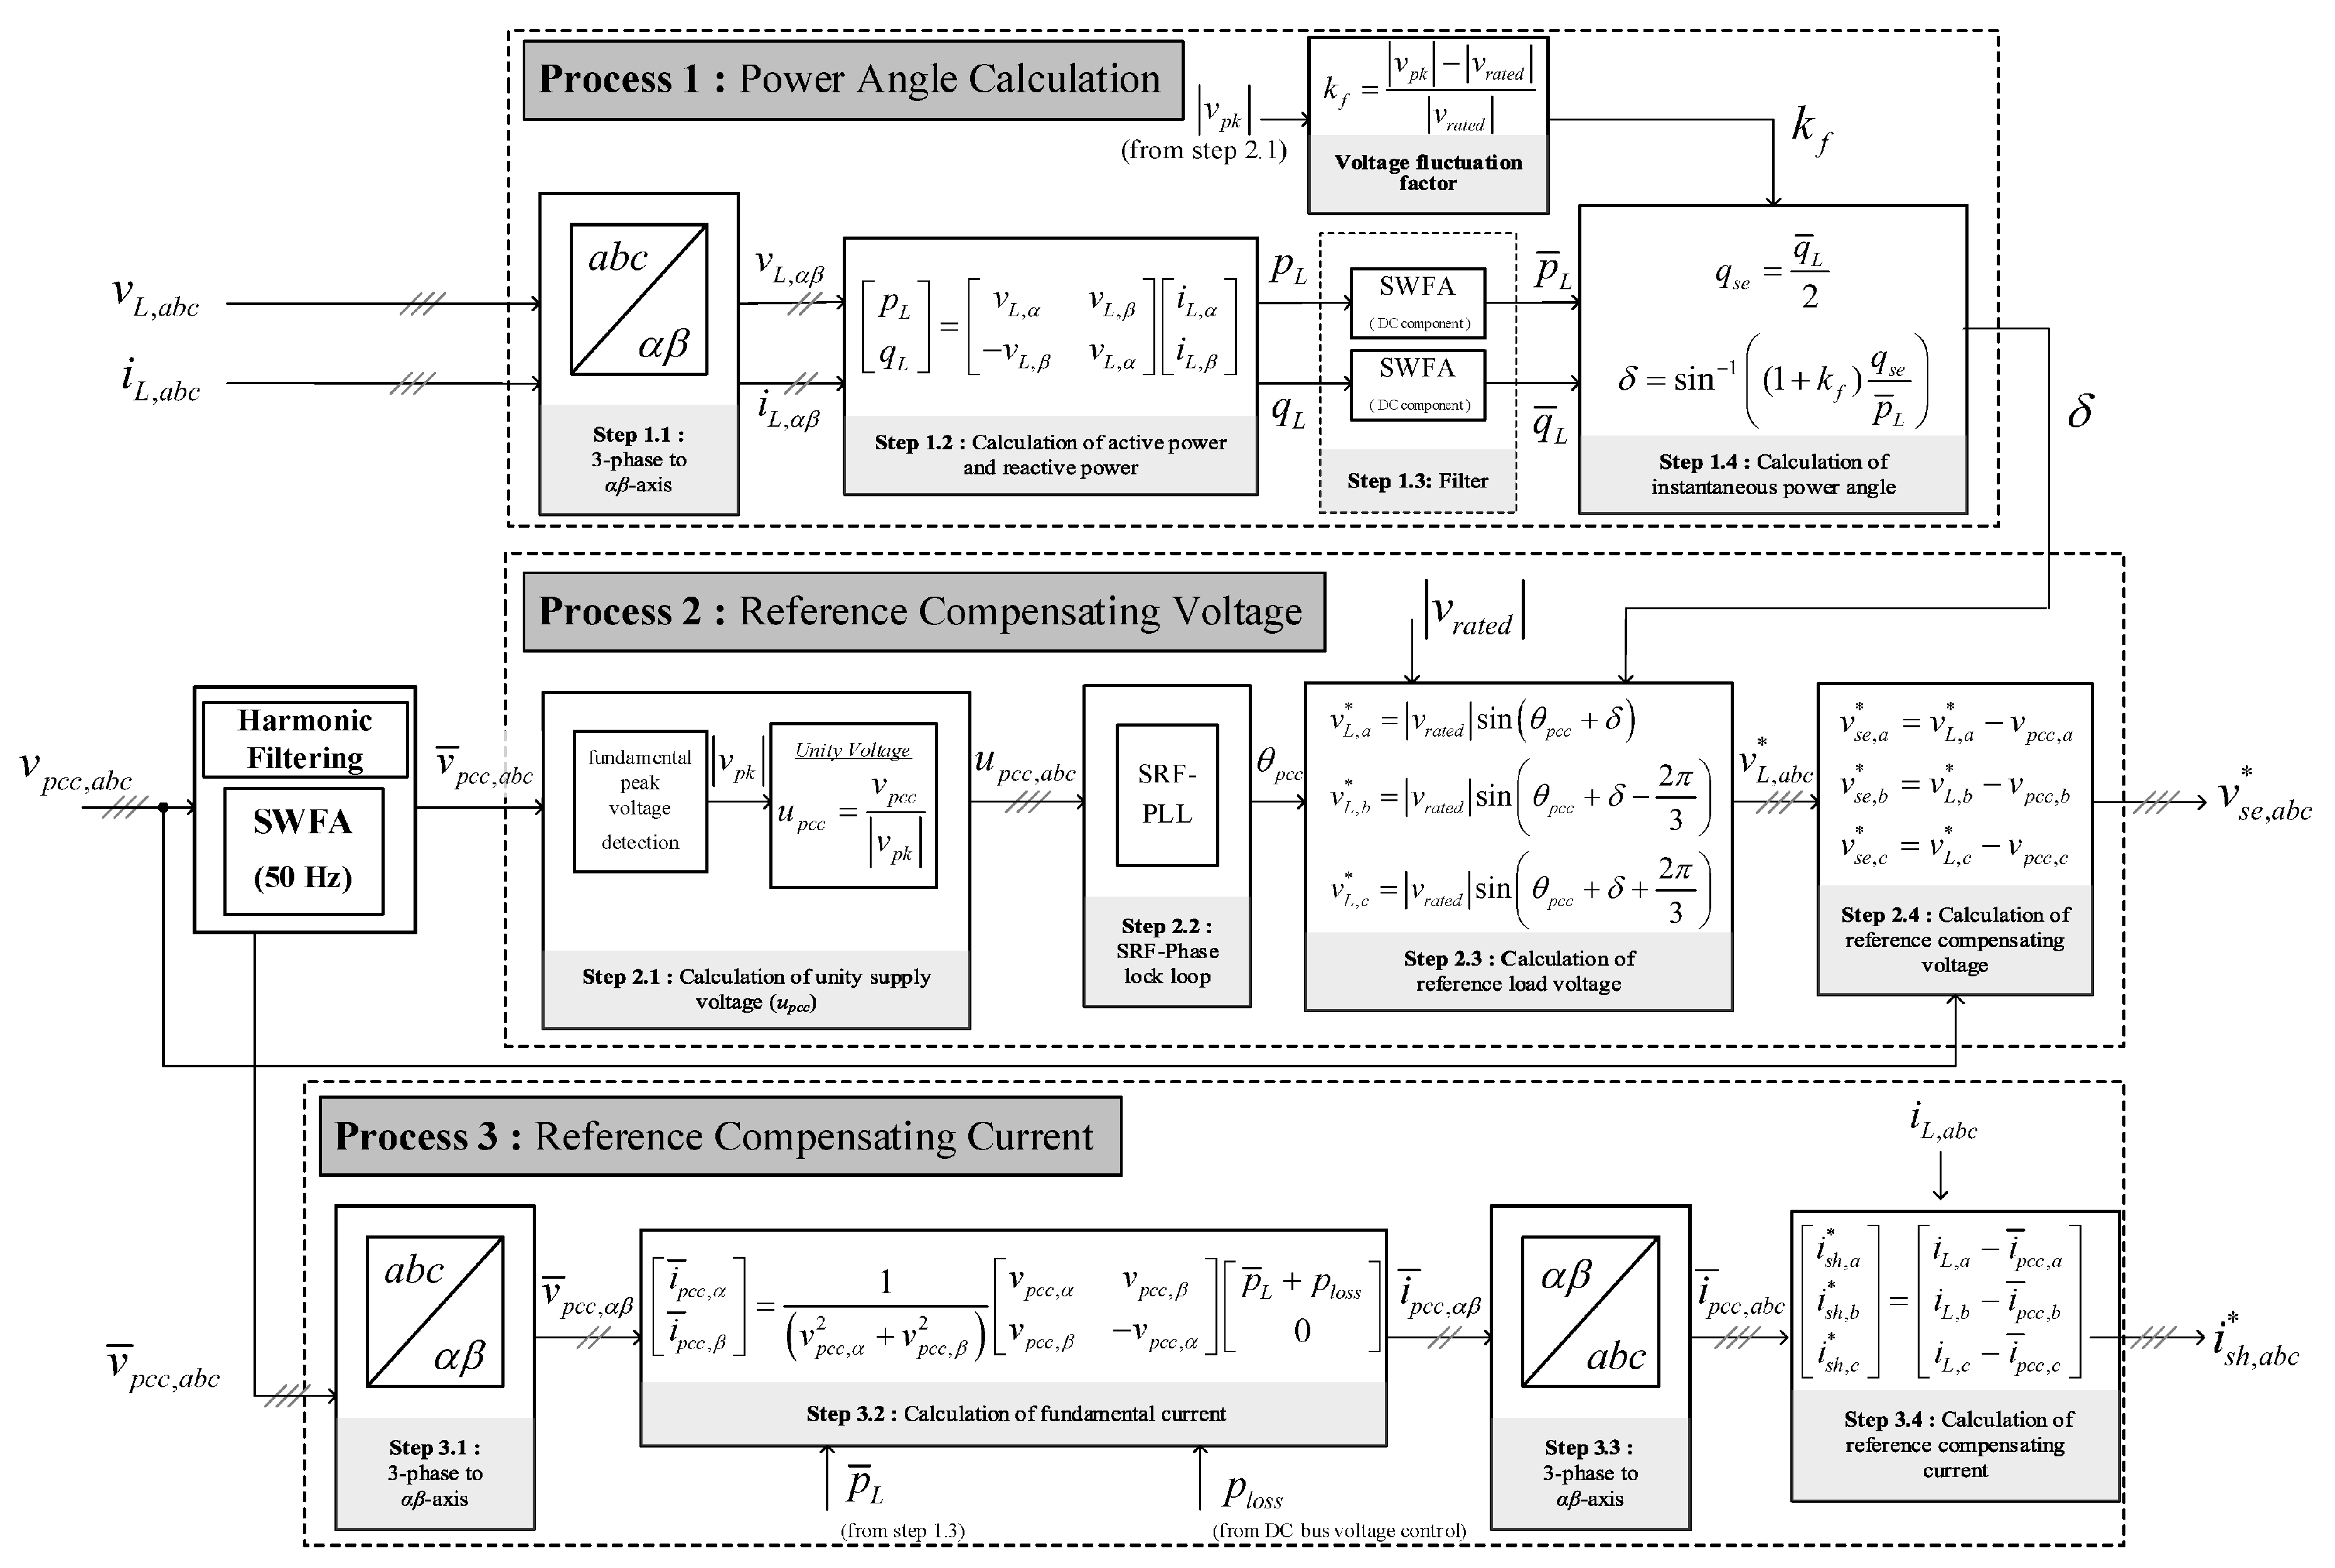
3. Harmonic Identification and Reference Signal Generation

The harmonic identification and the reference signal generation of the UPQC consist of three main processes, including the calculation of the power angle ( δ ) using the variable PAC method, the calculation of the v s e , a b c * , and the calculation of the i s h , a b c * . The first process is the power angle calculation. This process determines the sharing of the load reactive power ( q L ) compensation between the series APF and the shunt APF. The second process is the reference compensating voltage calculation. This process generates the v s e , a b c * . The third process is the reference compensating current calculation. This process generates the i s h , a b c * . The overall procedure is shown in Figure 3.

3.1. Variable Power Angle Calculation

Power angle control (PAC) was introduced by V. Khadkikar in 2008, cooperating with the apparent power approach of UPQC (UPQC-S). Refs. [16,17] explained PAC with normal supply and sag/swell supply, respectively. The main advantage of PAC over other approaches is that the load reactive power ( q L ) can be compensated by both series and shunt APFs. This feature reduces the shunt APF rating needed to compensate for reactive power demand and increases the utilization rate of the series APF.
Process 1 in Figure 3 shows the calculation of the power angle ( δ ), which enforces the sharing of q L between the two APFs. The details of this process are as follows:
Step 1: Transform three-phase load voltages ( v L , a b c ) and currents ( i L , a b c ) into the αβ-axis using the power-invariant Clarke transform.
Step 2: Calculate the load active power ( p L ) and load reactive power ( q L ) in αβ-axis.
Step 3: Filter out any harmonic component in the load power using SWFA. This step extracts the DC component to obtain fundamental instantaneous powers ( p ¯ L , q ¯ L ).
In the original PAC [16], low pass filters (LPF) are needed to eliminate the harmonic or AC components of load-active and load-reactive powers ( p ˜ L , q ˜ L ). However, an optimal cut-off frequency ( f c ) of LPF must be determined. Moreover, LPFs cannot perfectly filter out the harmonic contents, leading to inaccurate instantaneous fundamental load-active and load-reactive powers ( p ¯ L , q ¯ L ). This could affect the reference signal generation. Therefore, LPFs are replaced by SWFA filters for DC components, as proposed in [33].
Step 4: Calculate reactive power compensation for series APF ( q s e ) and its corresponding power angle ( δ ). The method used for the determination of the δ is called variable PAC [18]. This method results in a constant sharing of reactive power compensation during voltage sag/swell by considering the voltage supply condition. The voltage fluctuation factor ( k f ) can be calculated using (1).
k f = v p k v r a t e d v r a t e d
where v r a t e d represents the magnitude of the rated value of the desired load voltage and v p k represents the magnitude of the supply voltage, which is obtained from step 2.1 of process 2 in Figure 3.

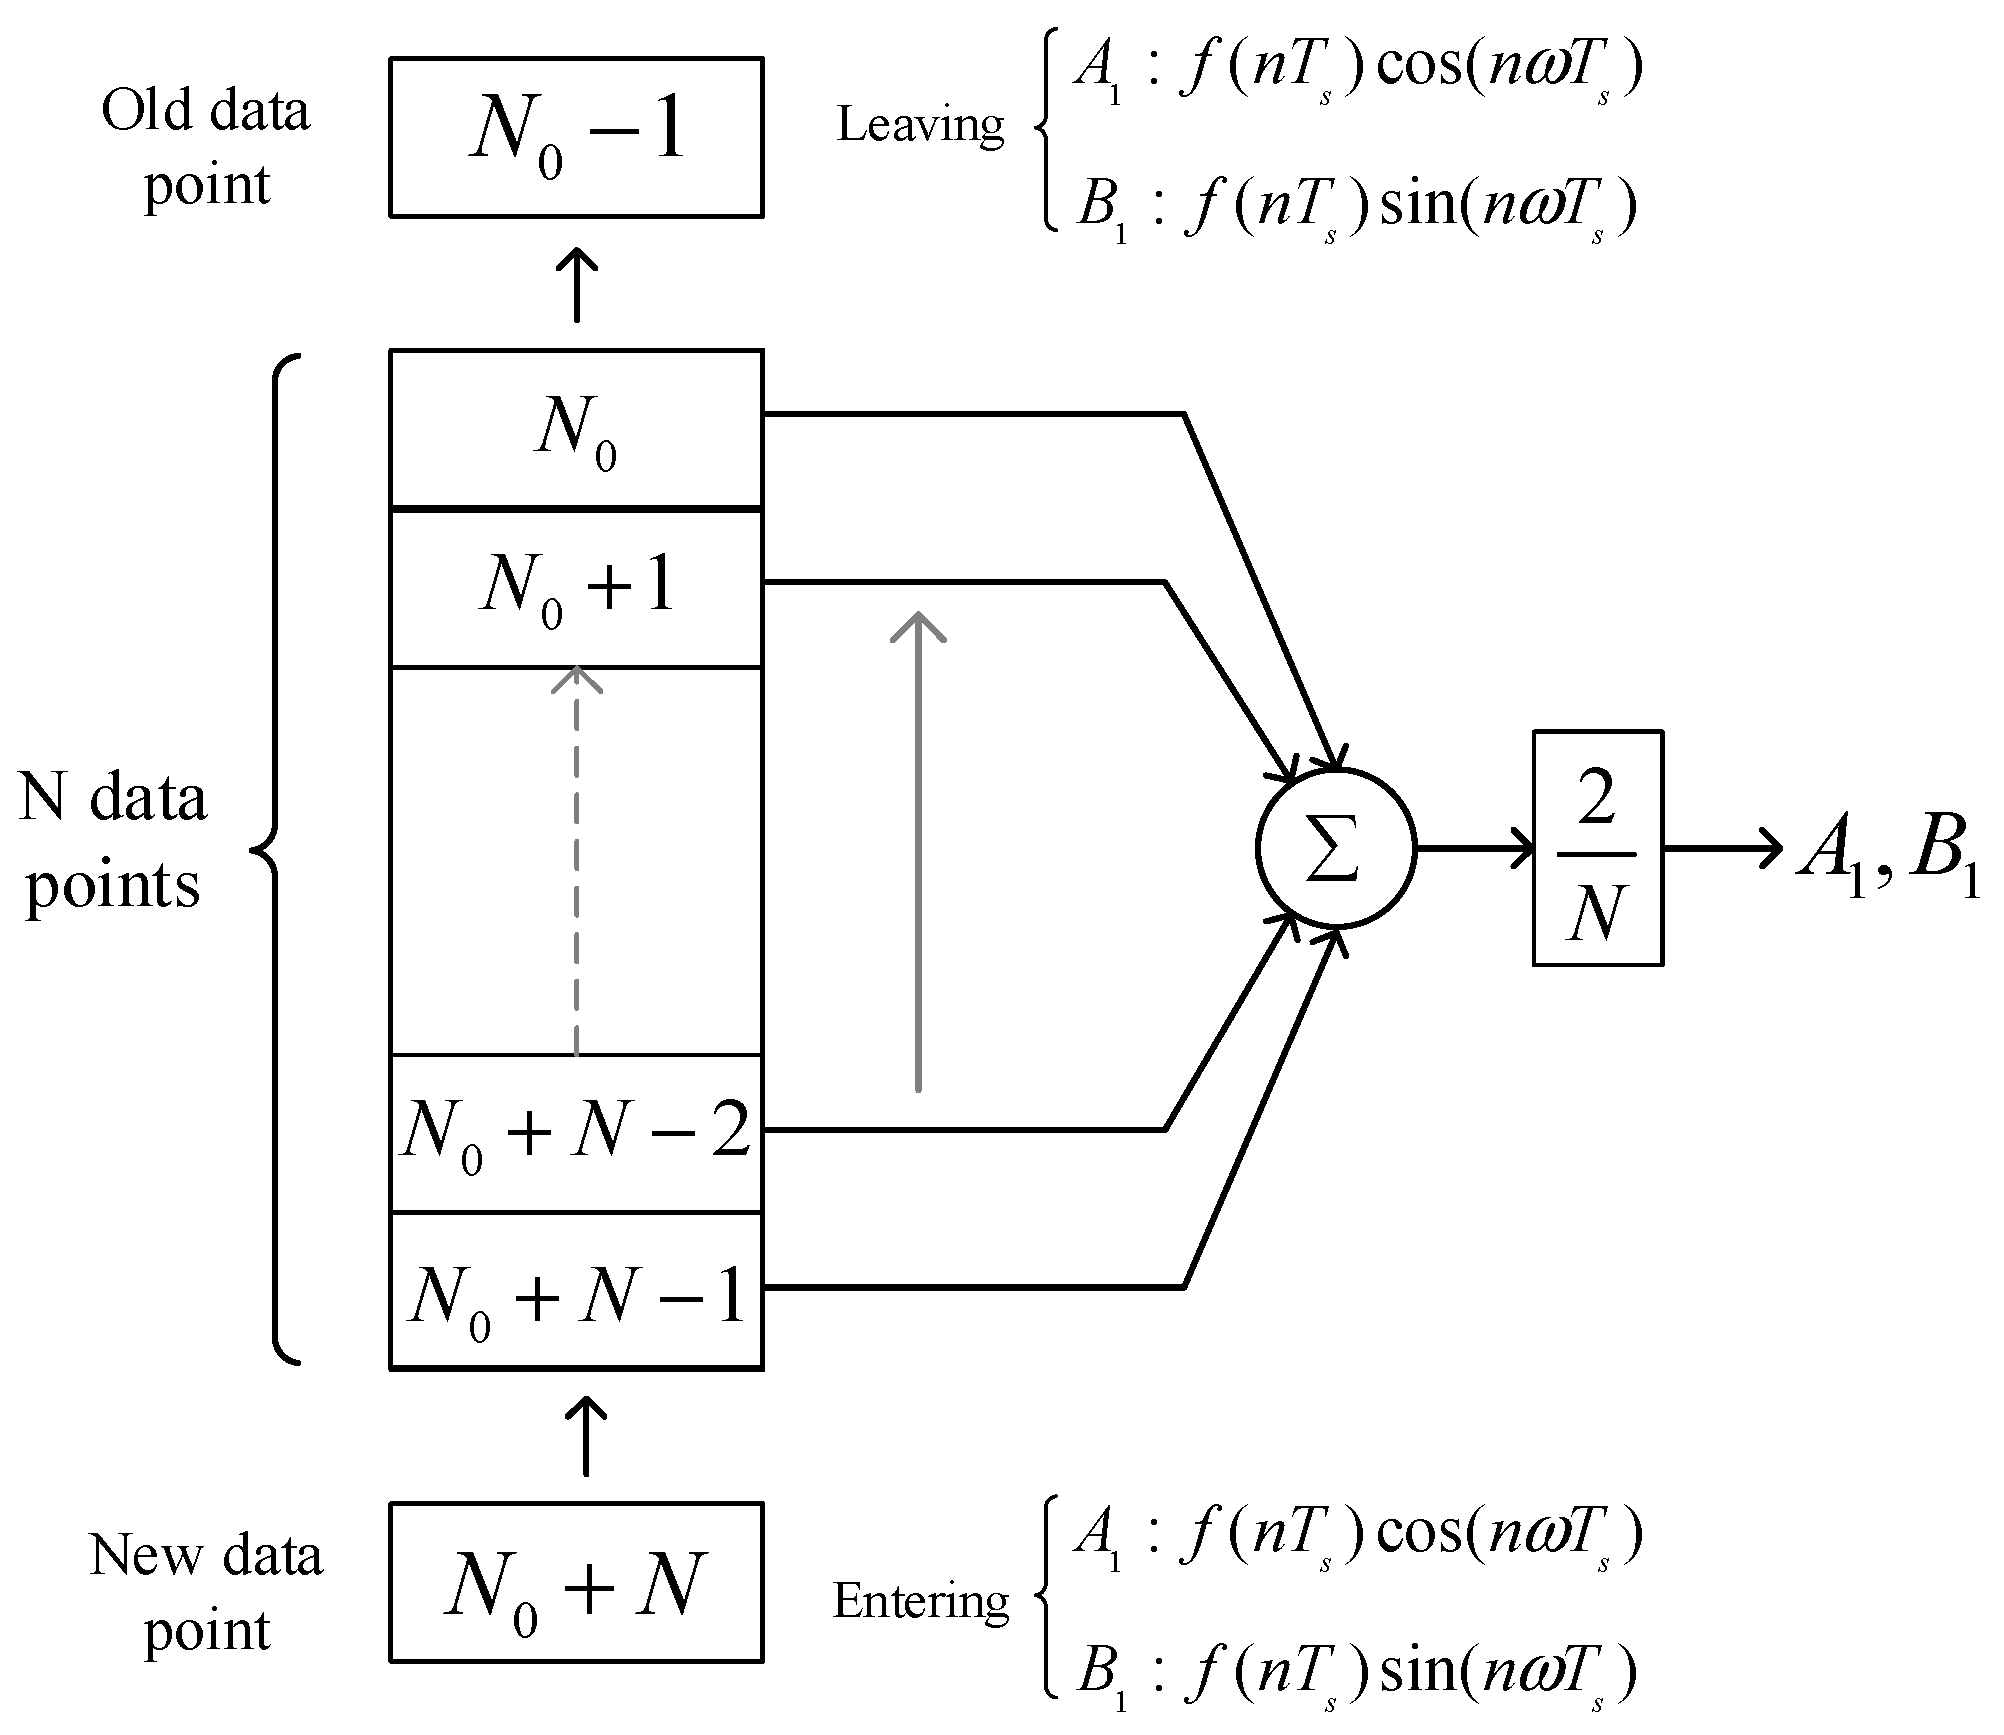
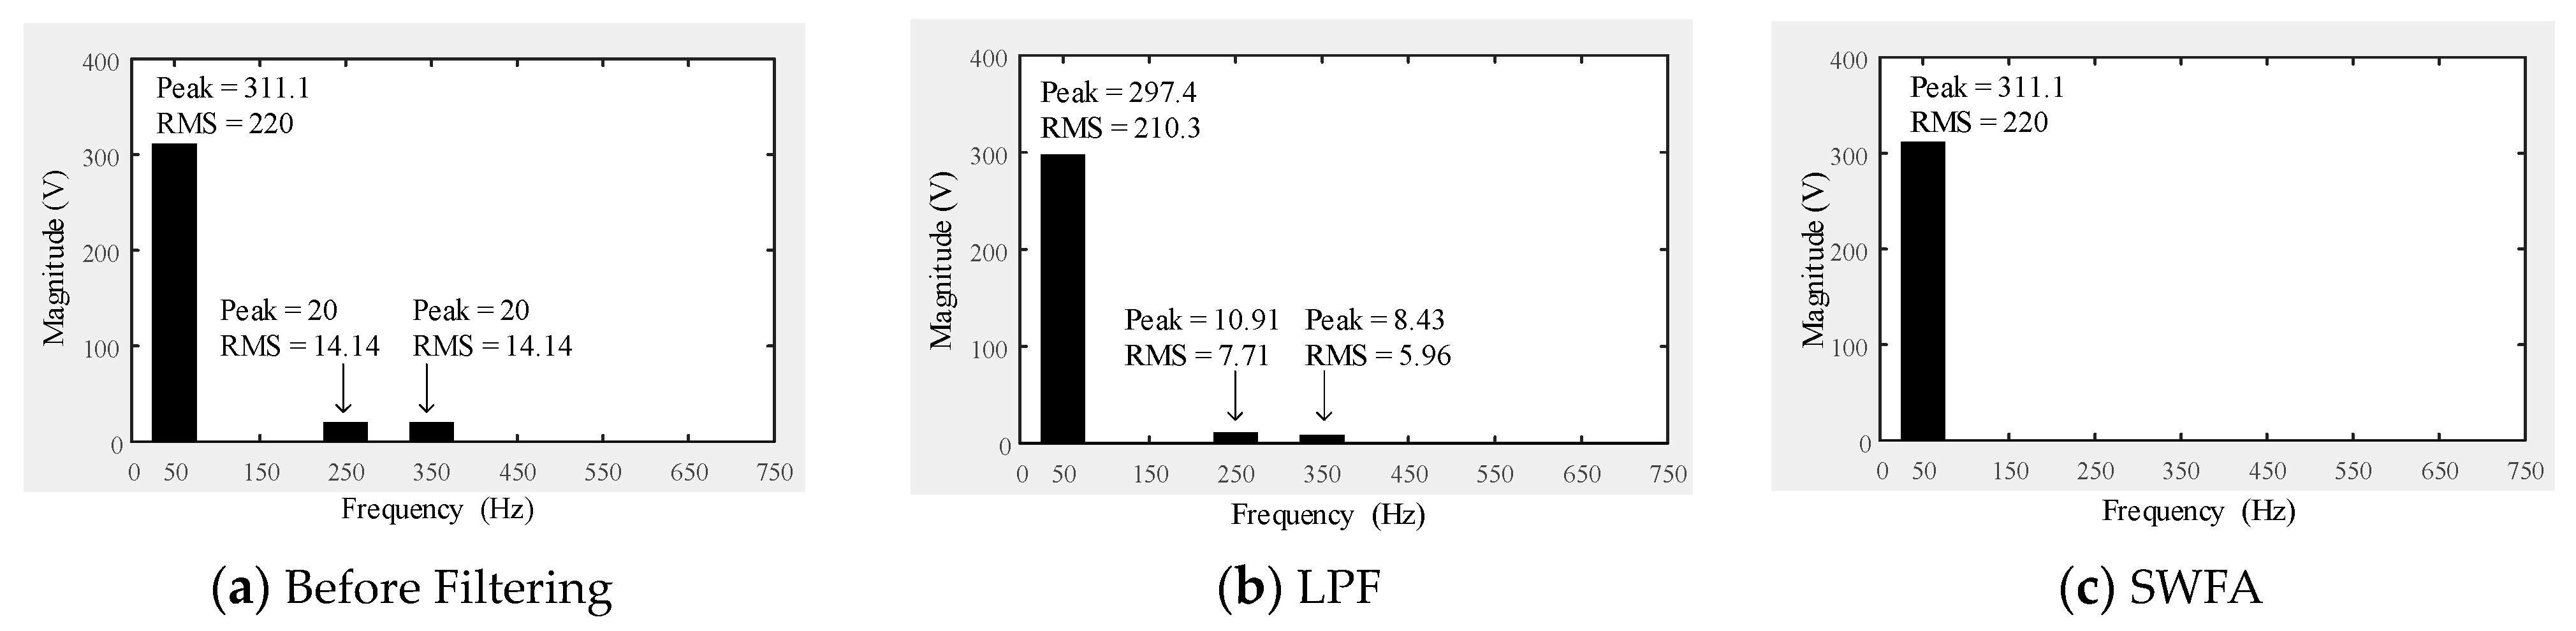
3.2. Sliding Window with Fourier Analysis Filter

Sliding window with Fourier analysis (SWFA) is a filtering method [30]. The signal values at every sampling time in one period are utilized for the computation. Considering the Euler–Fourier formula of a signal f ( k T s ) in (2), it consists of a DC component term and an AC component term. To extract a signal at the fundamental frequency from the v p c c , a b c , only the AC component at the first order (h = 1) is considered. Therefore, (2) can be rearranged to (3), where the coefficients A 1 and B 1 are determined as shown in (4) and (5), respectively.
f ( k T s ) = A 0 2 + h = 1 A h cos ( h ω k T s ) + B h sin ( h ω k T s )
where h = 1, 2, 3, …
f ( k T s ) = A 1 cos ( ω k T s ) + B 1 sin ( ω k T s )
A 1 = 2 N n = N 0 N 0 + N 1 f ( n T s ) cos ( n ω T s )
B 1 = 2 N n = N 0 N 0 + N 1 f ( n T s ) sin ( n ω T s )
where T s is the sampling time in seconds.
ω is the fundamental angular frequency in rad/s.
N is the number of data points in one period.
n is the index of the data point.
The computation process of a SWFA filter is as follows:
Firstly, receive the data of the considered signal during the first period of N data points and compute the initial A 1 and B 1 coefficients using (4) and (5), respectively. In this step, the data point indices are considered as n = N 0 , N 0 + 1 , , N 0 + N 1 .
Then, compute a new value of A 1 and B 1 coefficients ( A 1 n e w , B 1 n e w ) using (6) and (7), respectively. A 1 o l d and B 1 o l d denote the coefficient calculated in the previous step. In this step, the first or old data point ( n = N 0 ) collected in the first step is removed from the data set, and its index now becomes n = N 0 1 . Then, a new data point ( n = N 0 + N ) is added to the dataset, where its index becomes n = N 0 + N 1 for the coefficient calculations.
A 1 n e w = A 1 o l d + 2 N f { ( N 0 + N ) T s } cos { ( N 0 + N ) ω T s } 2 N f { ( N 0 1 ) T s } cos { ( N 0 1 ) ω T s }
B 1 n e w = B 1 o l d + 2 N f { ( N 0 + N ) T s } sin { ( N 0 + N ) ω T s } 2 N f { ( N 0 1 ) T s } sin { ( N 0 1 ) ω T s }
After that, compute f ( k T s ) with A 1 n e w and B 1 n e w using (3) and repeat the SWFA process for the derivation of the new f ( k T s ) with the next data point. The calculation mechanism of the coefficients is illustrated in Figure 4.
The SWFA filter for h = 1 (50 Hz in the studied power system) is implemented to extract fundamental source voltages at the point of common coupling ( v ¯ p c c , a b c ), which are utilized for the generation of reference signals explained in Section 3.3 and Section 3.4.

3.3. Reference Voltage Signal Generation for Series Active Power Filter

In this process, unit vector template generation (UVTG) is implemented due to its simplicity and fast processing time. In addition, a synchronous reference frame phase-locked loop (SRF-PLL) is required for this approach to synchronize the system. The details of this process are as follows:
Step 1: Calculate the unit vector signals ( u p c c , a b c ) of the source voltages by dividing the v ¯ p c c by its peak value. These peak values are obtained by multiplying the RMS value by 2 , where the RMS values are determined using the moving RMS method.
Step 2: Extract the phase angle ( θ p c c ) of the unit vector signals using SRF-PLL.
Step 3: Calculate the three-phase reference load voltages ( v L , a b c * ) cooperating the θ p c c and the δ of the previous process.
Step 4: Compare v L , a b c * with v p c c , a b c to generate the v s e , a b c * .

3.4. Reference Current Signal Generation for Shunt Active Power Filter

An indirect control based on the instantaneous pq theory approach is utilized in Process 3 to produce the reference current signals ( i s h , a b c * ).
Step 1: Transform v ¯ p c c , a b c into αβ-axis using the power-invariant Clarke transformation.
Step 2: Calculate the fundamental currents ( i ¯ p c c ) in the αβ-axis with the use of p ¯ L calculated in Process 1.
Step 3: Transform i ¯ p c c , α and i ¯ p c c , β into the abc-frame to obtain the fundamental currents in a three-phase system ( i ¯ p c c , a b c ) using the inverse Clarke transformation.
Step 4: Compare i ¯ p c c , a b c with the load currents to produce the i s h , a b c * .

4. Processor-in-the-Loop (PIL) Simulation

In this section, the proposed harmonic identification with the power system under different test scenarios was implemented to verify the feasibility and the performance of the proposed harmonic identification and reference signal generation of UPQC.

4.1. Processor-in-the-Loop Setup

The PIL simulation model was developed using MATLAB/Simulink R2018a and the eZdsp™ F28335 board to validate the performance of the proposed algorithm of a UPQC with the SWFA filters under linear and nonlinear loads. To record the data, a discrete time domain was implemented at the sampling time of 32 μs. Figure 5 demonstrates the implementation of PIL. The ‘ReferenceSignalGeneration’ block is computed by the eZdsp™ F28335 board. This block comprises the three UPQC processes, as shown in Figure 6, while the balanced three-phase, three-wire system is executed by MATLAB/Simulink on the host computer. The board is connected to a host computer via a USB port. The parameters of the simulation model are specified in Table 2.

4.2. Test Scenarios

The simulation was divided according to the situations shown in Table 3. At t = 0 s, an ideal three-phase balanced supply was connected to a load system consisting of linear load (L1). At t = 0.1 s, the UPQC was then ON. This step was carried out to verify that the UPQC system operated successfully during ideal waveforms of current and voltage. Subsequently, disturbances, including load changes, voltage sag, voltage swell, and harmonics of the supply, were introduced individually.
The details of each disturbance are as follows:
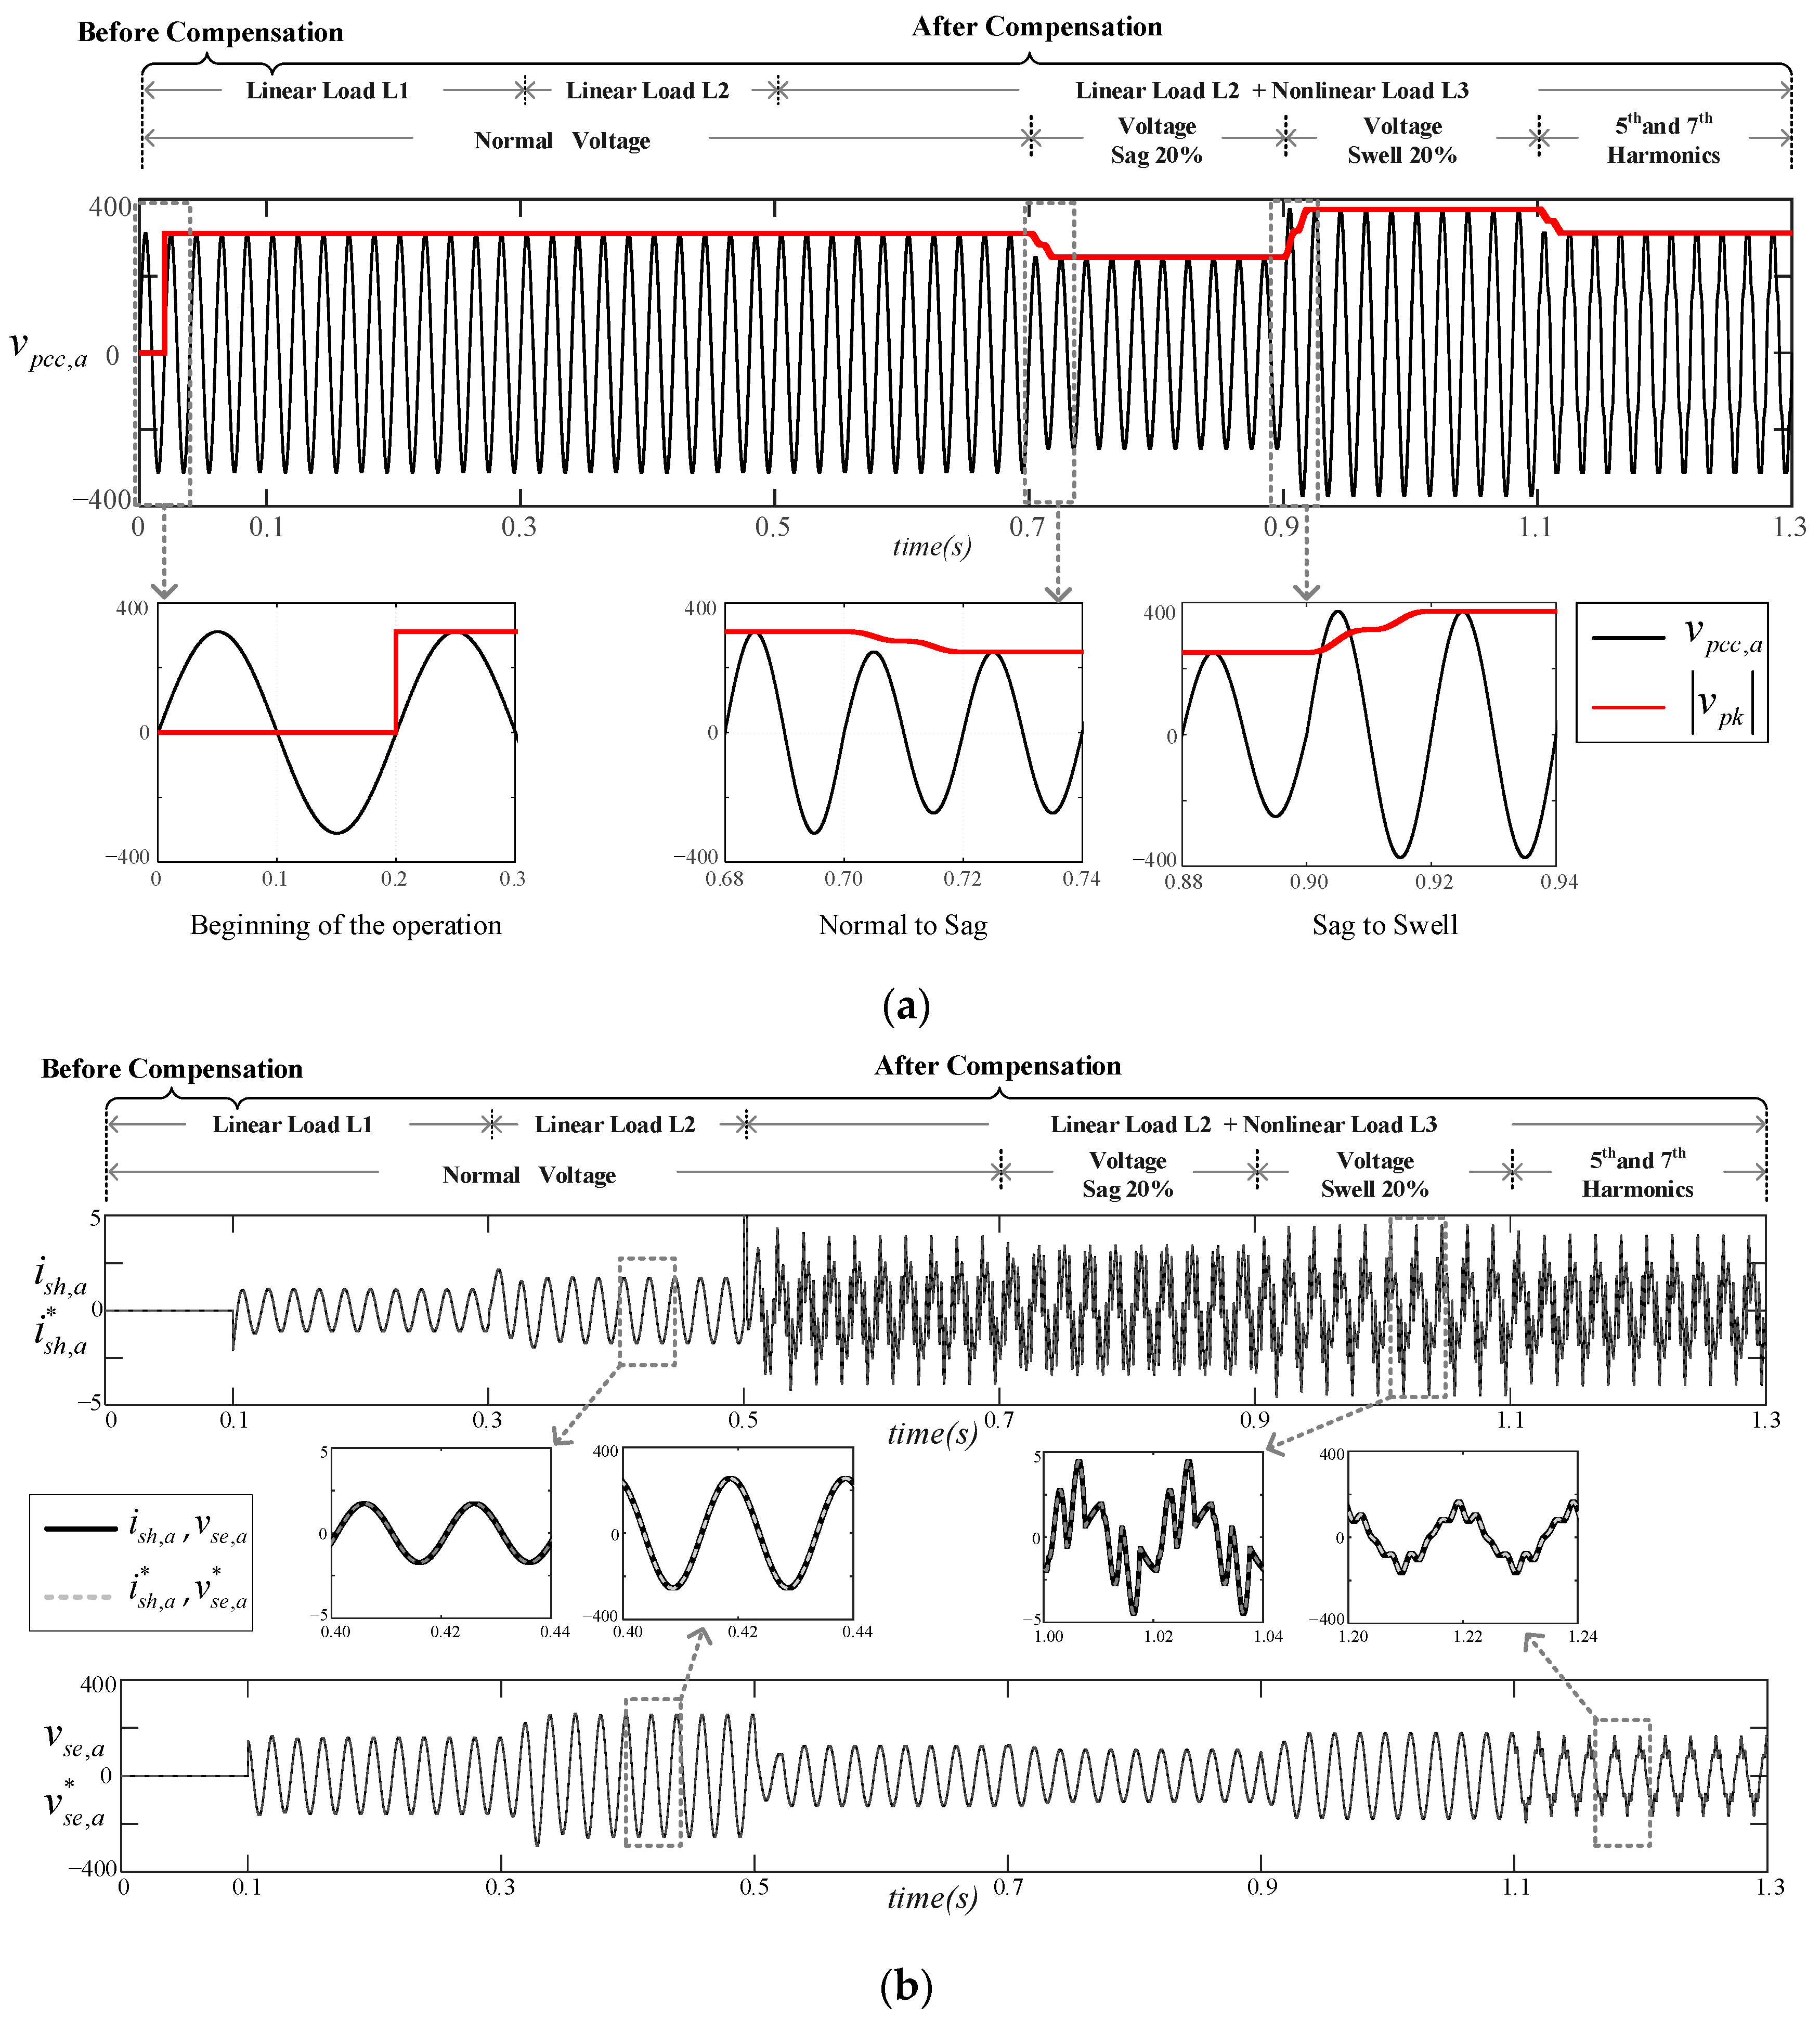
  • Load Change—two stages of load changes. Firstly, an increase in the reactive power demand by switching to load (L2). Secondly, a nonlinear load (L3) was connected, resulting in a 25.3%THD of the load current.
  • Voltage Sag—a decrease in supply voltage magnitude by 20%.
  • Voltage Swell—an increase in supply voltage magnitude by 20%.
  • Harmonic Voltage—20V of the 5th harmonics and 20V of the 7th harmonics are added to the source voltage, resulting in a 9.09%THD of the source voltage.

4.3. Performance Evaluation

The RMS values and the percent of total harmonic distortion ( % T H D ) of the source current and the load voltage were used as performance evaluation metrics. The Fast Fourier Transform (FFT) analysis was applied to obtain the peak values of the signals at each harmonic order. These peak values are then converted to RMS values to calculate the corresponding % T H D .
According to the IEEE519-2022 standard, the percent of total harmonic voltage distortion ( % T H D v ) of a low voltage system (<1.0 kV) limit is 8.0%, and the percent of total harmonic current distortion ( % T H D i ) should not exceed 5.0%. The voltage fluctuation range is normally between 0.95 pu and 1.05 pu, as specified by ANSI C84.1-2016. Therefore, the RMS value of the voltage supply in a 220 V supply system should be kept in the range of 209–231 V.

5. Results and Discussion

As the simulation study was conducted with a balanced three-phase, three-wire system, the simulation results of only one phase (i.e., phase a) are illustrated in this section.

5.1. Filter Performance

To mitigate the effects of harmonic voltage (1.1–1.3 s), a filter was placed before the voltage reference and current reference processes, as explained in Section 3. The performance of the proposed SWFA filtering was compared with an LPF. A suitable cut-off frequency ( f c ) of the LPF had to be determined. As the supply voltage had the 5th and 7th harmonic components, the f c of under 250 Hz were experimented to determine the most suitable value of f c . The % T H D v and RMS values of the filtered signals ( v ¯ p c c , a b c ) were measured. It was found that LPF reduced both the % T H D v and RMS values of the v ¯ p c c , a b c when f c decreased, as shown in Table 4. In compliance with the IEEE519-2022 and ANSI C84.1-2016 standards, a cut-off frequency of 160 Hz was chosen because the % T H D v of the filtered signal was minimal while staying within the RMS limit of the normal supply range.
Considering only the filter performance, the % T H D v of the signal filtered by LPF ( f c = 160 Hz) is equal to 4.64% and the RMS value is equal to 210.29 V. In comparison with the SWFA, the % T H D v is equal to 0% and the RMS value is equal to 220.76 V.
Figure 7 shows the waveforms of the v p c c , a before and after the filtering process. The v p c c , a waveforms from the LPF and the SWFA filtering were compared with the reference signal. Considering the transient response of the filters, the LPF signal reached the steady state immediately in the first cycle with a slight phase shift compared to the reference signal. In contrast, the SWFA filter required one period (0.02 s) of computation to reach a steady state. The resulting signal matched perfectly with the reference signal without any phase shift. Furthermore, the selection of f c is not required by the SWFA approach. The harmonic content of v p c c , a before and after the filtering process are shown in Figure 8. Both the fifth and seventh harmonic components still appeared after the LPF process, even though their magnitudes decreased. In comparison, all harmonic components were eliminated after the SWFA process. Furthermore, the magnitude of the fundamental component remained the same as the fundamental component of the input v p c c , a .
The results suggested that the utilization of SWFA for the reference signal generation should lead to a better performance of UPQC under the harmonic voltage.

5.2. Unified Power Quality Conditioner Performance

The simulation results of the UPQC performance between the use of LPF, SWFA, and without filter in the reference signal generation are shown in Table 5 and Table 6. Table 5 shows the % T H D v and RMS values of the load voltage ( v L ), and Table 6 shows the % T H D i and RMS values of the source current ( i S ). These tables compared the % T H D and RMS values of the signals in different situations, including the load changes and the supply disturbances. Moreover, the comparison of UPQC performance between three approaches of filtering (no filter, LPF, and SWFA) is presented in these tables.
In the process of reference voltage signal generation for series APF, peak voltage detection using the moving RMS method is performed. For the first period, this method requires the data in one period (0.02 s) to calculate the magnitude of v p c c . Then, the peak value is updated at every sampling time. The performance of the moving RMS method for the magnitude detection of v p c c , a is shown in Figure 9a.
To ensure that the compensation of v L and i S was conducted correctly, the actual compensating signal and the reference compensating signal were compared. As seen in Figure 9b, i s h , a and v s e , a were identical with i s h , a * and v s e , a * , respectively. This conformed with the use of ideal current sources and ideal voltage sources as the shunt APF and the series APF.
During normal, sag, and swell supply, the three filtering methods resulted in a similar performance of i S and v L compensation. However, the harmonic voltage source resulted in the different % T H D i levels of i S in which the SWFA significantly outperformed the other options. Therefore, the waveform performances of UPQC presented in this section are only the simulation results with the SWFA integration.

5.2.1. Load Changes

During t = 0.1 to 0.7 s, the loads were varied to demonstrate the behavior of the UPQC compensation when there was a change in linear load by increasing reactive power demand and an addition of a nonlinear load under normal supply conditions. It can be seen in Figure 10 that the voltage across the load ( v L ) maintained a pure sine waveform with a relatively constant RMS value. At t = 0.5 s, a nonlinear load (L2 and L3) was connected, resulting in an increase in the load active power and a harmonic load current of 25.31%. The i S was increased as expected to supply the increase of p L . UPQC successfully compensated the harmonic content, reducing the % T H D i to 1.91%.

5.2.2. Supply Disturbances

After t = 0.7 s, the load was fixed as a combination of L2 and L3, while supply conditions were varied, as stated in Table 3. During voltage sag and voltage swell conditions, the RMS values of v L could be maintained close to the nominal value of 220 V while keeping the pure sine waveform. The i S was adjusted to supply the load active power, where i S increased during the voltage sag and decreased during the voltage swell, and the % T H D i was kept to 1.53% and 2.29%, respectively. At t = 1.1–1.3 s, the harmonic supply condition was introduced, the % T H D v of v L was decreased from 9.09% to 0.55% and the % T H D i of i S was reduced to 1.93%. The waveforms of these signals are illustrated in Figure 10. The % T H D and RMS values presented in Table 5 and Table 6 were within the IEEE standard limits.
It can be concluded that the proposed harmonic identification and reference signal generation of the UPQC system with the SWFA filters responded successfully under different operating conditions of supply and loads.

5.3. Power Flow Analysis

This section reported the active power and reactive power flow of the studied system, including the source side, load side, and the series and shunt APFs of the UPQC. It should be noted that the harmonic supply could be considered as a small voltage swell in the power flow analysis.

5.3.1. Active Power

Typically, the series and shunt APFs provide the active power for the compensation of voltage sag, voltage swell, and any losses associated with transmission lines, DC link, and active power filter operation. However, in this study, only the transmission line losses were accounted for, as the ideal sources were used as the APFs, and the DC link was not included in the system. During the normal supply t = 0.1–0.7 s, the active power of the series APF and shunt APF in the UPQC system were only responsible for compensating the power losses in the transmission lines.
However, during voltage sag (t = 0.7–0.9 s), the series APF injected additional p s e to maintain the level of v L ; therefore, the shunt APF drew an equal amount of active power p s h from the system to maintain the operation of the UPQC. In comparison, during voltage swell, the active power was absorbed from the system by the series APF to maintain the level of v L while the shunt APF injected an equal amount of active power p s h back into the system to maintain the operation of the UPQC. The power flow of active power is shown in Figure 11.

5.3.2. Reactive Power

Apart from the current and voltage compensations, the other main characteristic of UPQC operation is the power factor correction. It can be seen in Figure 11 and Figure 12 that after the UPQC is operating at t = 0.1 s, the distribution system only supplied the active power to the load as the reactive power of the supply became close to zero as the two APFs were responsible for the reactive power compensation in all scenarios. As shown in Table 6, the power factor of the worst case was improved from 0.556 to 0.999 after the compensation. This power factor correction achieved a value close to 1 in every test scenario.
As the proposed method cooperated with the UPQC-S system with the PAC approach, the simulation results confirmed that the series APF shared the reactive power compensation burden from the shunt APF. It can be observed that half of the reactive power is compensated by the series APF, as the proposed model was designed for a 50% sharing of reactive power demand compensation between the two APFs. Moreover, the variable PAC approach automatically adjusts the power angle and its corresponding reactive power compensation during the disturbances of the source voltage. As illustrated in Figure 12 at t = 0.7–1.3 s, the reactive power provided by both APFs remains relatively constant. It can be observed that in any condition, the sum of the reactive power supplied by the two APFs is always equal to the reactive power demand. The feature of applying the variable PAC approach is for better management and installation of the UPQC, where the rating of the shunt APF and the series APF can be the same and also have a high utilization rate.

6. Conclusions

In this work, harmonic identification and reference signal generation, which is an important process for power quality improvement using the UPQC, are intensively studied. A modified harmonic identification based on SWFA with the utilization of instantaneous pq theory, variable PAC, and UVGT is proposed to mitigate the power quality problems, including voltage sag, voltage swell, harmonic supply voltage, and harmonic current due to nonlinear loads. The utilization of SWFA can notably suppress the effect of the distorted utility source in three-phase, three-wire systems. Additionally, the performance comparison of the proposed SWFA and LPF showed that SWFA could accurately extract the fundamental component of the supply voltage after one time period of the signal. The performance verification of the modified harmonic identification is performed based on the PIL technique. The proposed algorithm was implemented on an eZdsp™ F28335 board and the MATLAB/Simulink program. During the harmonic supply voltage, the THD of the source current was reduced from 22.16% to 1.93% when SWFA was implemented. This performance is superior to the compensation without any filter and with LPF, which reduced the THD to 9.59% and 4.78%, respectively. Moreover, the use of SWFA provides a less complex calculation and requires a smaller number of filters compared to the method in the existing literature. The testing results confirm that the total harmonic distortion and RMS values were maintained within the IEEE519-2022 and ANSI C84.1-2016 standards. The power flow analysis also showed that the load reactive power compensation was shared by a series of APFs as the PAC method was implemented. This resulted in an equal rating of the UPQC, which may lessen the burden on the UPQC installation and cost.

Author Contributions

Conceptualization, P.S. and K.A.; methodology, K.C.; software, K.C.; validation, P.S., K.C. and K.A.; formal analysis, P.S.; investigation, P.S. and K.A.; resources, P.S. and K.A.; data curation, K.C.; writing—original draft preparation, P.S. and K.C.; writing—review and editing, K.A.; visualization, K.C.; supervision, P.S.; project administration, P.S.; funding acquisition, P.S. All authors have read and agreed to the published version of the manuscript.

Funding

This research was supported by the National Science Research and Innovation Fund (NSRF) and the Prince of Songkla University (Grant No ENG6601105S).

Data Availability Statement

No new data were created.

Conflicts of Interest

The authors declare no conflicts of interest.

References

  1. Zanib, N.; Batool, M.; Riaz, S.; Nawaz, F. Performance Analysis of Renewable Energy Based Distributed Generation System Using ANN Tuned UPQC. IEEE Access 2022, 10, 110034–110049. [Google Scholar] [CrossRef]
  2. Gomez, Y.A.G.; García, N.T.; Hoyos, F.E. New Application’s Approach to Unified Power Quality Conditioners for Mitigation of Surge Voltages. J. Electr. Comput. Eng. 2016, 6384390. [Google Scholar] [CrossRef]
  3. Brumsickle, W.E.; Schneider, R.S.; Luckjiff, G.; Divan, D.; McGranaghan, M. Dynamic sag correctors: Cost-effective industrial power line conditioning. IEEE Trans. Ind. Appl. 2001, 37, 212–217. [Google Scholar] [CrossRef]
  4. Ghorbani, M.; Mokhtari, H. Impact of harmonics on power quality and losses in power distribution systems. Int. J. Electr. Comput. Eng. 2015, 5, 166–174. [Google Scholar] [CrossRef]
  5. Prasad, D.; Dhanamjayulu, C. A Review of Control Techniques and Energy Storage for Inverter-Based Dynamic Voltage Restorer in Grid-Integrated Renewable Sources. Math. Probl. Eng. 2022, 6389132. [Google Scholar] [CrossRef]
  6. Mohammed, B.S.; Rao, K.S.; Ibrahim, R.; Perumal, N. Performance evaluation of R-UPQC and L-UPQC based on a novel voltage detection algorithm. In Proceedings of the 2012 IEEE Symposium on Industrial Electronics and Applications, Bandung, Indonesia, 23–26 September 2012. [Google Scholar] [CrossRef]
  7. Beres, R.N.; Wang, X.F.; Liserre, M.; Blaabjerg, F.; Bak, C.L. A Review of Passive Power Filters for Three-Phase Grid-Connected Voltage-Source Converters. IEEE J. Emerg. Sel. Top. Power Electron. 2016, 4, 54–69. [Google Scholar] [CrossRef]
  8. Li, J.W.; Tang, Y.F.; Li, J.K. Research on Adaptive Suppression of LCL Converter Resonance Grid-Connected System. J. Electr. Comput. Eng. 2020, 1959073. [Google Scholar] [CrossRef]
  9. Singh, B.; Al-Haddad, K.; Chandra, A. A review of active filters for power quality improvement. IEEE Trans. Ind. Electron. 1999, 46, 960–971. [Google Scholar] [CrossRef]
  10. Fujita, H.; Akagi, H. The unified power quality conditioner: The integration of series- and shunt-active filters. IEEE Trans. Power Electron. 1998, 13, 315–322. [Google Scholar] [CrossRef]
  11. Khadkikar, V.; Chandra, A.; Barry, A.O.; Nguyen, T.D. Conceptual study of unified power quality conditioner (UPQC). In Proceedings of the 2006 IEEE International Symposium on Industrial Electronics, Montreal, QC, Canada, 9–13 July 2006; Volume 1–7, pp. 1088–1093. [Google Scholar] [CrossRef]
  12. Lee, W.C.; Lee, D.M.; Lee, T.K. New Control Scheme for a Unified Power-Quality Compensator-Q with Minimum Active Power Injection. IEEE Trans. Power Deliv. 2010, 25, 1068–1076. [Google Scholar] [CrossRef]
  13. Basu, M.; Das, S.P.; Dubey, G.K. Performance study of UPQC-Q for load compensation and voltage sag mitigation. In Proceedings of the IEEE 2002 28th Annual Conference of the Industrial Electronics Society, Seville, Spain, 5–8 November 2002; pp. 698–703. [Google Scholar]
  14. Kolhatkar, Y.Y.; Das, S.P. Experimental investigation of a single-phase UPQC with minimum VA loading. IEEE Trans. Power Deliv. 2007, 22, 373–380. [Google Scholar] [CrossRef]
  15. Kolhatkar, Y.Y.; Errabelli, R.R.; Das, S.P. A sliding mode controller based optimum UPQC with minimum VA loading. In Proceedings of the IEEE Power Engineering Society General Meeting, San Francisco, CA, USA, 16 June 2005; pp. 871–875. [Google Scholar]
  16. Khadkikar, V.; Chandra, A. A new control philosophy for a unified power quality conditioner (UPQC) to coordinate load-reactive power demand between shunt and series inverters. IEEE Trans. Power Deliv. 2008, 23, 2522–2534. [Google Scholar] [CrossRef]
  17. Khadkikar, V.; Chandra, A. UPQC-S: A Novel Concept of Simultaneous Voltage Sag/Swell and Load Reactive Power Compensations Utilizing Series Inverter of UPQC. IEEE Trans. Power Electr. 2011, 26, 2414–2425. [Google Scholar] [CrossRef]
  18. Khadkikar, V. Fixed and variable power angle control methods for unified power quality conditioner: Operation, control and impact assessment on shunt and series inverter kVA loadings. IET Power Electron. 2013, 6, 1299–1307. [Google Scholar] [CrossRef]
  19. Forghani, M.; Afsharnia, S. Online Wavelet Transform-Based Control Strategy for UPQC Control System. IEEE Trans. Power Deliv. 2007, 22, 481–491. [Google Scholar] [CrossRef]
  20. Ye, J.; Gooi, H.B.; Wu, F.J. Optimal Design and Control Implementation of UPQC Based on Variable Phase Angle Control Method. IEEE Trans. Ind. Inform. 2018, 14, 3109–3123. [Google Scholar] [CrossRef]
  21. Devassy, S.; Singh, B. Modified -Theory-Based Control of Solar-PV-Integrated UPQC-S. IEEE Trans. Ind. Appl. 2017, 53, 5031–5040. [Google Scholar] [CrossRef]
  22. Panda, A.K.; Patnaik, N. Management of reactive power sharing & power quality improvement with SRF-PAC based UPQC under unbalanced source voltage condition. Int. J. Electr. Power 2017, 84, 182–194. [Google Scholar] [CrossRef]
  23. Ni, F.Y.; Wo, S.L.; Li, Z.M. A Harmonic Detection Method of UPQC Based on LSL Algorithm in Photovoltaic Microgrids. J. Control Autom. Electr. 2020, 31, 1567–1575. [Google Scholar] [CrossRef]
  24. Arya, S.R.; Alam, S.J.; Ray, P. Control Algorithm Based on Limit Cycle Oscillator-FLL for UPQC-S with Optimized PI Gains. CSEE J. Power Energy 2020, 6, 649–661. [Google Scholar] [CrossRef]
  25. Jin, T.; Chen, Y.L.; Guo, J.T.; Wang, M.Q.; Mohamed, M.A. An effective compensation control strategy for power quality enhancement of unified power quality conditioner. Energy Rep. 2020, 6, 2167–2179. [Google Scholar] [CrossRef]
  26. Patnaik, N.; Panda, A.K. Performance analysis of a 3 phase 4 wire UPQC system based on PAC based SRF controller with real time digital simulation. Int. J. Electr. Power 2016, 74, 212–221. [Google Scholar] [CrossRef]
  27. Khadkikar, V.; Chandra, A.; Barry, A.O.; Nguyen, T.D. Application of UPQC to protect a sensitive load on a polluted distribution network. In Proceedings of the 2006 Power Engineering Society General Meeting, Montreal, QC, Canada, 18–22 June 2006; Volume 1–9, p. 15. [Google Scholar] [CrossRef]
  28. Kumar, G.S.; Kumar, B.K.; Mishra, M.K. Mitigation of Voltage Sags with Phase Jumps by UPQC with PSO-Based ANFIS. IEEE Trans. Power Deliv. 2011, 26, 2761–2773. [Google Scholar] [CrossRef]
  29. Santiprapan, P.; Areerak, K.; Areerak, K. A Novel Harmonic Identification Algorithm for the Active Power Filters in Non-Ideal Voltage Source Systems. J. Power Electron. 2017, 17, 1637–1649. [Google Scholar] [CrossRef]
  30. El-Habrouk, M.; Darwish, M. Design and implementation of a modified Fourier analysis harmonic current computation technique for power active filters using DSPs. IEE Proc. Electr. Power Appl. 2001, 148, 21. [Google Scholar] [CrossRef]
  31. IEEE Std. 519-2022; IEEE Standard for Harmonic Control in Electric Power Systems. IEEE: New York, NY, USA, 2022.
  32. ANSI C84.1-2016; American National Standard for Electric Power Systems and Equipment—Voltage Ratings (60 Hz). NEMA: Arlington, VA, USA, 2016.
  33. Narongrit, T.; Areerak, K.; Areerak, K. Adaptive Fuzzy Control for Shunt Active Power Filters. Electr. Power Compon. Syst. 2016, 44, 646–657. [Google Scholar] [CrossRef]
Figure 1. Schematic of a basic UPQC-based system.
Energies 17 02830 g001
Figure 2. UPQC system with ideal current and voltage sources.
Energies 17 02830 g002
Figure 3. Procedure of the proposed harmonic identification and the reference signal generation of the UPQC system.
Energies 17 02830 g003
Figure 4. Computation of A1 and B1 coefficients.
Energies 17 02830 g004
Figure 5. The proposed UPQC model with the eZdsp™ F28335 board.
Energies 17 02830 g005
Figure 6. MATLAB/Simulink model of the proposed harmonic identification and the reference signal generation.
Energies 17 02830 g006
Figure 7. Waveforms of v p c c , a in the filtering process. (a) LPF (b) SWFA.
Energies 17 02830 g007
Figure 8. Harmonic Spectrum of the signal (a) before filtering and after being filtered by (b) LPF and (c) SWFA.
Energies 17 02830 g008
Figure 9. The performance of moving RMS method and the tracking performance of the compensating values. (a) The magnitude detection of v p c c , a . (b) The actual compensating signal and the reference compensating signal.
Energies 17 02830 g009
Figure 10. Voltage and current waveforms of phase a during different test scenarios.
Energies 17 02830 g010
Figure 11. Active power flow of the UPQC system during different test scenarios.
Energies 17 02830 g011
Figure 12. Reactive power flow of the UPQC system during different test scenarios.
Energies 17 02830 g012
Table 1. Comparative studies of harmonic identification method for the UPQC control strategy.
Publication YearPower
System
Compensation StrategyHarmonic Identification MethodOperating Conditions
/Disturbances
Sharing of Load Reactive Power
Series APFShunt APFVoltage SourceLoad System
2007 [19]3P4Wproposed methodDiscrete Wavelet Transform (DWT) and MRADiscrete Wavelet Transform (DWT) and MRA
-
Frequency change from 50 to 51 Hz
-
Nonlinear load
-
Load change
NO
2008 [16]3P3WUPQC-SUVTG with PACInstantaneous pq theory
-
Normal
-
voltage
-
5th and 7th harmonic
-
Nonlinear load
-
Load change
YES
2011 [17]3P3WUPQC-SUVTG with PACInstantaneous pq theory
-
20% Voltage sag/swell
-
Nonlinear load
-
Load change
YES
2011 [28]3P4WUPQC-PSO based ANFISState Space
Extraction
State Space
Extraction
-
Unbalanced sag
-
Phase jump
-
Nonlinear load
-
Load change
NO
2015 [26]3P4WUPQC-SSRF theorySRF theory
-
15% Voltage sag
-
Voltage sag with harmonics
-
Unbalanced voltage with harmonic
-
Nonlinear load
-
Unbalanced load
YES
2017 [21]3-phase
with PV
UPQC-SUVTG with PACInstantaneous pq theory with GCDSC+BPF
-
Change of irradiation affecting DC bus
-
30% Voltage sag/swell
-
Harmonic
-
Nonlinear load
-
Unbalanced load
YES
2018 [20]3P3WUPQC-SProposed
controllable PAC
Instantaneous pq theory
-
Abrupt phase change
-
40% Voltage sag/swell
-
Nonlinear load
-
Load change
YES
2020 [23]3P3WNot mentionedNot mentionedProposed
Adaptive LSL
-
Normal voltage
-
Nonlinear load
NO
2020 [25]3P3WNot mentionedSRF theory with LPF and PLLDouble closed-loop control based
-
20%/40% voltage sag
-
5th and 7th harmonic
-
Nonlinear load
-
Load change
-
Unbalanced load
NO
2020 [24]3P3WUPQC-SInstantaneous pq theory with LCO-FLLInstantaneous pq theory with LCO-FLL
-
20% Voltage sag/swell
-
5th and 7th Harmonic
-
Nonlinear load
-
Unbalanced load
YES
This work3P3WUPQC-SUVTG with
variable PAC
Instantaneous pq theory with SWFA filtering
-
20%Voltage sag/swell
-
5th and 7th harmonic
-
Nonlinear load
-
Load change
YES
Table 2. System parameters for the simulation model.
ParametersValue
Supply Voltage Frequencyvs = 380 VL-L, fs = 50 Hz
Line ImpedanceLL = 10 mH
Linear Loads (L1, L2)SL1 = 1 kW + j1kVar, SL2 = 1 kW + j1.5kVar
Nonlinear Load (L3)Diode Bridge Rectifier with RL3 = 160 Ω, LL3 = 0.5 H, CL3 = 40 μF
Series APFIdeal voltage sources
Shunt APFIdeal current sources
Table 3. Simulation time and situations of the system.
Time (s)Situations
0–0.1Normal supply system connected to Load L1
0.1–0.3Shunt and Series APFs ON
0.3–0.5Switch to Load L2 (L1 disconnected)
0.5–0.7Nonlinear Load L3 added (Load = L2 + L3)
0.7–0.920% Voltage Sag
0.9–1.120% Voltage Swell
1.1–1.3Harmonic Voltage
Table 4. LPF performance at different cut-off frequencies.
f c v R M S % T H D v
140207.544.23
160210.294.64
180212.275.01
200213.695.35
220214.755.67
240215.605.95
Table 5. Performance of UPQC considering load voltage waveform.
CaseIndexLoad/Supply Situation
Normal VoltageNormal VoltageVoltage SagVoltage SwellHarmonic Voltage
L1L2L2 and L3
Before
Compensation
%THDv0.000.000.000.000.009.09
RMS220220220176264220
After
Compensation
Without Filter [16]%THDv0.000.000.000.000.003.67
RMS221.1221.6220.9220.6221.3220.7
LPF
(fc = 160 Hz)
%THDv0.020.050.000.000.001.67
RMS220.4221.1220.2220220.4220.90
With SWFA%THDv0.030.040.000.010.000.55
RMS221.1221.6220.9220.5221.3220.9
Table 6. Performance of UPQC considering source current waveform and power factor.
CaseIndexLoad/Supply Situation
Normal VoltageNormal VoltageVoltage SagVoltage SwellHarmonic Voltage
L1L2L2 and L3
Before
Compensation
%THDi0.000.0025.3125.3125.3122.16
RMS2.152.694.763.815.714.75
Power Factor0.7090.5560.7600.7600.7600.758
After
Compensation
Without Filter [16]%THDi0.000.071.911.532.299.59
RMS1.551.523.774.703.153.77
LPF
(fc = 160 Hz)
%THDi0.000.051.831.472.204.78
RMS1.611.583.924.893.273.93
With SWFA%THDi0.000.071.911.532.291.93
RMS1.551.523.774.703.153.76
Power Factor1.000.9990.9990.9990.9990.996
Disclaimer/Publisher’s Note: The statements, opinions and data contained in all publications are solely those of the individual author(s) and contributor(s) and not of MDPI and/or the editor(s). MDPI and/or the editor(s) disclaim responsibility for any injury to people or property resulting from any ideas, methods, instructions or products referred to in the content.

