Article

Thermodynamic Analysis of the Combustion Process in Hydrogen-Fueled Engines with EGR

1
Department of Thermal Machinery, Faculty of Mechanical Engineering and Computer Science, Czestochowa University of Technology, Dabrowskiego 69, 42-200 Czestochowa, Poland
2
Department of Technology and Automation, Faculty of Mechanical Engineering and Computer Science, Czestochowa University of Technology, Dabrowskiego 69, 42-200 Czestochowa, Poland
3
Faculty of Production Engineering and Materials Technology, Czestochowa University of Technology, Dabrowskiego 69, 42-200 Czestochowa, Poland
*
Author to whom correspondence should be addressed.
Energies 2024, 17(12), 2833; https://doi.org/10.3390/en17122833
Submission received: 13 May 2024 / Revised: 4 June 2024 / Accepted: 5 June 2024 / Published: 8 June 2024

Abstract

:
This article presents a novel approach to the analysis of heat release in a hydrogen-fueled internal combustion spark-ignition engine with exhaust gas recirculation (EGR). It also discusses aspects of thermodynamic analysis common to modeling and empirical analysis. This new approach concerns a novel method of calculating the specific heat ratio (cp/cv) and takes into account the reduction in the number of moles during combustion, which is characteristic of hydrogen combustion. This reduction in the number of moles was designated as a molar contraction. This is particularly crucial when calculating the average temperature during combustion. Subsequently, the outcomes of experimental tests, including the heat-release rate, the initial combustion phase (denoted CA0-10) and the main combustion phase (CA10-90), are presented. Furthermore, the impact of exhaust gas recirculation on the combustion process in the engine is also discussed. The efficacy of the proposed measures was validated by analyzing the heat-release rate and calculating the mean combustion temperature in the engine. The application of EGR in the range 0-40% resulted in a notable prolongation of both the initial and main combustion phases, which consequently influenced the mean combustion temperature.

1. Introduction

Those wishing to calculate combustion progress in an internal combustion (IC) engine may encounter several difficulties when determining the most appropriate approach for their calculations. According to the Energy Conservation Law, it is necessary to accept the simplification of assuming the reacting species (fuel and oxidizer) as a non-reacting ideal gas at the outset. As is well known, the in-cylinder combustion process is a chemical reaction between fuel and oxidizer, which ultimately produces exhaust gases. Consequently, the heat released during combustion originates from the internal energy change between the products and reactants under real pressure–temperature working conditions. The simplification of applying the ideal gas instead of a real reacting working fluid into the thermodynamic analysis and combustion modeling of the engine work cycle is a widely utilized approach. Therefore, under these conditions and with the intake and exhaust valves closed, the energy balance in the engine cylinder can be described with Equation (1). This approach is a common methodology employed in thermodynamic analysis of the IC engine work cycle, among others proposed by Heywood, and Zeleznik and McBride [1,2].
Q I n = Δ U + W + Q O u t + Q L o s s
where:
  • ΔU—internal energy change before and after combustion;
  • QIn—heat released inside the engine cylinder;
  • QOut—heat transferred outside the engine;
  • W—useful work generated by the piston on the crankshaft.
Heat QOut usually is taken as QWall which stands for heat transferred to the engine cooling system through the walls of a cylinder sleeve, a piston and a cylinder head.
Q O u t = Q W a l l
The heat denoted QLoss comprises three distinct components: QIC, which represents the heat loss from incomplete combustion of fuel within the engine cylinder; QCR, which denotes the heat loss from crevices; and QBL, which signifies the heat loss from a combustible mixture blow-by to the crankcase (Equation (3)). As this analysis aims to eliminate the total heat released and concentrate on the net heat, these losses can be neglected as stated by Goldsborough, Nande and Ihsan et al. [3,4,5], respectively.
Q L o s s = Q I C + Q C R + Q B L
where:
  • QIC—heat loss from incomplete combustion;
  • QCR—heat loss from crevices effect;
  • QBL—heat loss from blow-by to the crankcase.
Finally, the heat of vaporization of liquid fuel directly injected into the engine cylinder is omitted in this research case as the fuel is hydrogen.
Heat QIn is the heat coming from combusting fuel (QF) and the heat coming from electric spark discharge QE. This heat can also be regarded as marginal (Figure 1).
Q I n = Q F + Q E
Consequently, Equation (1) can be simplified to the form of Equation (5).
Q F = Δ U + W + Q W a l l
Furthermore, by considering Equation (6) for the ideal gas, one can derive the formula for the heat-release rate (HRR) dQ/dα (Equation (7)), which is a typical approach for calculating the HRR in the IC engine.
p · V = n · R u · T
where:
  • p—in-cylinder combustion pressure;
  • V—in-cylinder volume;
  • T—in-cylinder mean temperature;
  • N—number of moles of working fluid;
  • Ru—universal gas constant, Ru = 8.31 J/mol/K.
As illustrated, the combustion process can be analyzed on the basis of the in-cylinder combustion pressure p, as demonstrated by Equation (7).
d Q G r o s s d α = γ γ 1 p d V d α + 1 γ 1 V d p d α + d Q W a l l d α
where:
  • γ—the ratio of specific heats (cp/cv) at constant pressure and constant volume, respectively;
  • p—in-cylinder combustion pressure;
  • V—in-cylinder volume;
  • α—crank angle (CA) deg;
  • Qgross—gross heat released during combustion;
  • Qwall—heat losses to walls.
Here, one is faced with the first serious problem, which is the correct determination of the heat transferred to walls QWall. Commonly used formulas by Woschni [6], Annand [7], Hohenberg [8] and others were developed for an engine in which the combustible mixture was gasoline premixed with air. In this case, the fuel is hydrogen, so it should be recognized that the calculations according to those heat-transfer formulas may differ from the actual heat flow to the walls. To circumvent this potential error, it was deemed prudent to calculate the net heat according to Equation (8). It is acknowledged that there are known issues in calculating heat loss to walls (Qwall), particularly in instances where the engine is fed with a fuel other than gasoline. Consequently, it is recommended that this heat loss be omitted and the heat be calculated as the net heat QNet.
d Q N e t d α = d Q G r o s s d α d Q W a l l d α = γ γ 1 p d V d α + 1 γ 1 V d p d α

Determination of cp/cv (γ)

Lanzafame and Messina tested several models for heat-release rate and found strong impact of specific heat ratio cp/cv on gross cumulative heat (Qgross) from the IC engine [9]. Thus, methodology for net heat released (Qnet) is fully justified. In the case where both p(α) and V(α) are known values, the solution of Equation (8) can be obtained with relative ease. However, numerous studies have demonstrated that the heat-release rate is highly sensitive to the cp/cv coefficient, as evidenced by [10,11,12] and others. Consequently, the challenge arises when attempting to accurately determine the γ (cp/cv) ratio. There are several methods for calculating γ. In general, these methods are based on empirical results. In the available literature, one can find several models for determining γ. Gatowski et al. [13] proposed that γ can be determined as follows (Equation (9)):
γ = 1.38 0.08 T 300 1000
where T is the temperature of the working fluid in K.
There are also other slightly different empirical formulas for γ determination (Equations (10) and (11)) in the [14] by Brunt et al. and [15] by Egnell, respectively.
γ = 1.338 6 · 10 5 T + 10 8 T 2
γ = 1.38 k 1 e k 2 T
where k1 and k2 are constants from the range 0.2–900.
As is evident, these equations are also functions of temperature and they deal with gasoline combustible mixtures. Olanrevaju proposed an extension to these solutions [16]. His group proposed the calculation of γ as a function of temperature and λ (relative equivalence ratio). Ebrahimi in his study [17] stated that specific heat ratio γ affects more the heat-release rate in the natural gas-fueled engine in comparison to a gasoline engine.
Furthermore, γ can be determined directly, following its definition based on separate calculation of cp and cv. In this case both cp and cv can be determined from e.g., the NASA polynomials. During combustion, the relation between burnt and unburnt air-fuel mixture varies, resulting in a change in γ. Thus, γ is altered from γu to γb, which represents the unburnt and burnt mixture, respectively. To compute the final γ for the total burnt and unburnt compounds of the working fluid, the mass-based ratio between burnt and unburnt content has to be provided. This approach was introduced by Ceviz and Kaymaz [18]. As the combustion progress requires the γ value for its computation, thus both the combustion progress represented by the released heat and γ can be determined through an iteration process. As previously stated, the total γ of the burnt and unburnt species can be determined based on their mass fractions during the combustion process. The mass of fuel fraction burnt (MFB) profile is required for the combustion progress. The most well-known function for calculating Mass Fraction Burnt (MFB) is the empirical formula developed by Rassweiler and Withrow [19]. It is presented with Equation (12).
M F B α = α Δ p α α Δ p b e g i n e n d
where:
  • α—crank angle;
  • Δ—corrected pressure rise concerning combustion;
  • begin–end—location of begin and end of combustion.
Although Equation (6) is commonly used for the determination of combustion progress in the IC engine, it is acknowledged that there is difficulty in the proper determination of the end of combustion, which is necessary for the MFB computation. However, there are some shortcomings within this formula by Rassweiler and Withrow concerning determination of the end of combustion. Among others, Brunt et al. [20] assumed that the end of combustion is located at the maximum of pV1.15. Therefore, the combustion progress Q(α) is recommended to be determined by integrating heat-release rate dQ/dα over the crank angle. Anyway, Rassweiler–Withrow formula as the simplest one, can be applied in the first step for determining mass of burnt and unburnt gases for preliminary calculation of cp/cv following recommendations by Ceviz et al. [18].
Another source of error in the dQ/dα calculation method (Equations (7) and (8)) is the assumption of a fixed number of moles for the gases filling the engine’s combustion chamber throughout the combustion process. As previously stated, the gases filling the engine cylinder were assumed to be ideal gases. However, to more accurately approximate these gases to real gases, it was assumed that cp and cv are temperature dependent. The subsequent modification to thermodynamic analysis was to implement another approximation to real conditions. This can be made in terms of the number of moles of gases filling the cylinder. As is well known, hydrogen and oxygen form water when burned. Although the mass during a chemical reaction does not change, the number of moles of water as the final product relative to the total number of moles of hydrogen and oxygen changes (Equation (13)).
2 H 2 + O 2 + 3.76 N 2 = 2 H 2 O + 3.76 N 2
This modification is of particular significance for the calculation of the average combustion temperature in accordance with Equation (6). Additionally, when exhaust gases recirculation (EGR) is applied into spark-ignited engine with the strict regime of stoichiometric air-to-fuel, then the in-cylinder pressure at the intake valve closure is higher; hence, the pumping losses become lower and finally IMEP increases.
In summary, the article presents improvements to the dQ/dα calculation method for hydrogen–air combustible mixture as follows:
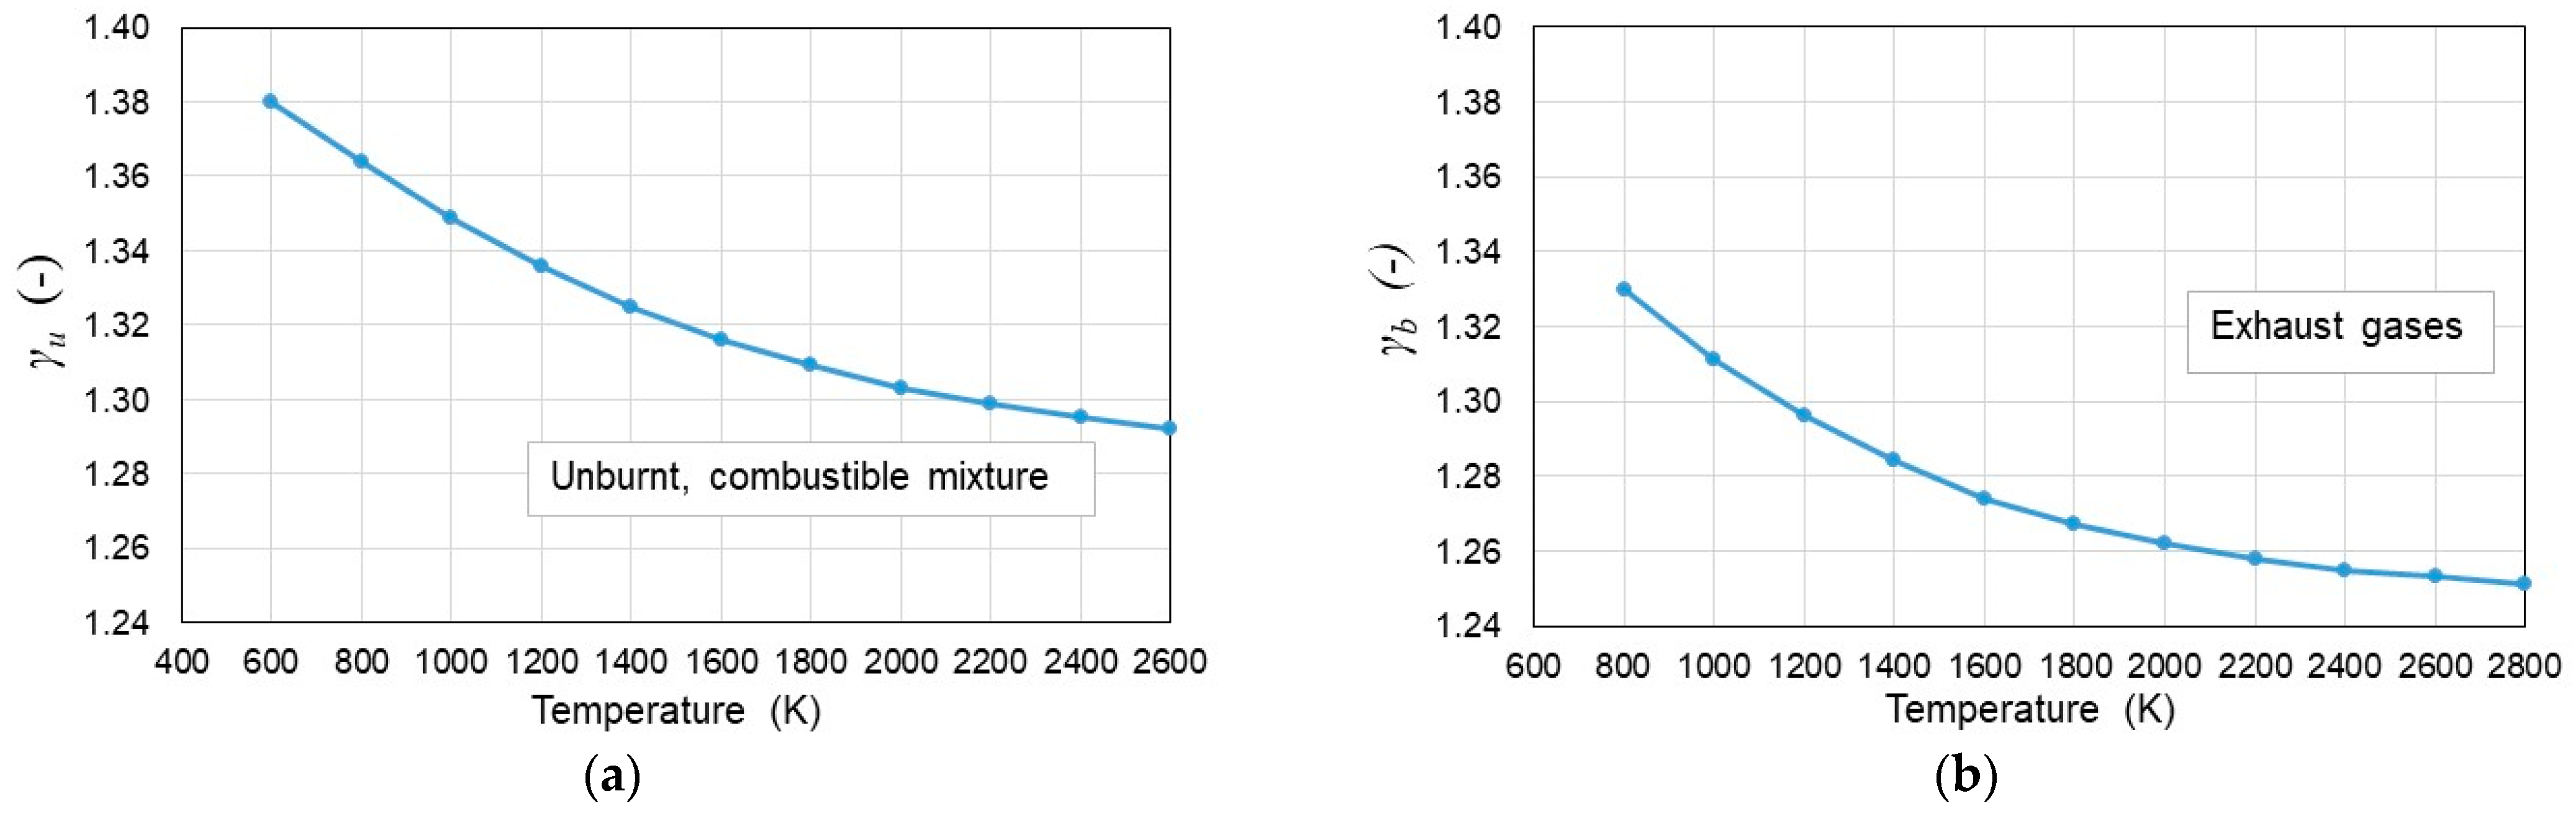
  • The calculation of cp/cv is based on the current composition of the amount of combustible mixture and exhaust gases, with the resulting value dependent on the mean combustion temperature;
  • The calculation of the current number of moles of gases filling the engine cylinder during combustion to compensate for the molar contraction after combustion.
The presented improvements were utilized to analyze the heat-release rate and calculate the average combustion temperature inside the cylinder of a hydrogen-fueled engine with varying the EGR ratios. As evidenced by a comprehensive literature survey, numerous papers present the results of combustion tests conducted on hydrogen in IC engines. Among these, recently published review papers demonstrate that there is a significant interest in the implementation of hydrogen in IC engines [21,22]. Moreover, EGR strategy is one of the effective measures to reduce combustion knock and NOx exhaust emissions from hydrogen-fueled engines [4,23,24,25].

2. Methodology

The proposed methodology for thermodynamic analysis, including heat-release rate (HRR) determination, is based on a zero-dimensional (0D) analysis of the combustion process vs. time. This approach is well-known and is commonly used for both experimental data analysis and modeling the thermodynamic cycle of the hydrogen-fueled IC engine. This 1D approach involves various modifications to calculations of cp/cv, the Wiebe function, and modeling EGR and lean mixtures as stated by Misul et al. [26], Lebedevas et al. [27,28] and others [5,16,29].
The research methodology presented in this section includes formulas for calculating cp/cv and the mean combustion temperature along the combustion process as well as a description of the processing of combustion pressure data to calculate the heat-release rate denoted dQ/dα.

2.1. Determination of cp/cv

The issue of calculating the cp/cv ratio (hereinafter referred to as γ is the determination of an accurate value for this quotient, contingent on the temperature. In general, it can be assumed that the resulting γ can be calculated according to Equation (14).
γ = ( n i · γ i ) n i
where:
  • γ—final cp/cv;
  • γicp/cv for a specific gas (e.g., γu for unburnt mixture and exhaust gases γb);
  • ni—number of moles for a specific gas.
Hence, γu and γb for unburnt combustible mixture and exhaust gases can be determined with Equations (15) and (16), respectively.
γ u T = 2 · γ H 2 + γ O 2 + 3.76 · γ N 2 / 6.76
γ b T = 2 · γ H 2 O + 3.76 · γ N 2 / 5.76
Consequently, the final γ for both gases filling the engine cylinder can be calculated using Equation (17). It should be noted that the EGR gases have the same chemical composition as the combustion products (exhaust gases).
γ T = n u · γ u ( T ) + n b + n E G R · γ b ( T ) n u + n b + n E G R
It can be concluded at this point that γ is not solely dependent on temperature but also on the ratio between the mass of the unburned combustible mixture and the mass of exhaust gases. Furthermore, if EGR is used, γ will depend on the amount of EGR, and therefore the mass of EGR gases is included in this equation. The mass of fuel that has undergone combustion can be determined by integrating Equation (8), which leads to obtaining the cumulative heat released. However, as previously mentioned, there is a more straightforward formula to determine combustion progress based on the MFB equation (Equation (12)), which can be calculated based on the in-cylinder combustion pressure. Therefore, there is no need to use any iterative methods to solve Equation (18).
M F B α = m b m u + m b
Number of moles ni can be determined from this simple Equation (19):
n i = m i M W i
where:
  • mi—mass of a specific compound;
  • MWi—molecular weight of a specific compound.
In case the EGR is applied, the definition (Equation (20)) for EGR introduced by Heywood [1] is used.
E G R % = m E G R m A i r + m F u e l + m E G R 100 %
Assuming stoichiometric combustion, mass of air mAir required for hydrogen (mH2) combustion is expressed by Equation (21).
m A i r = ( A / F ) s t · m H 2
(A/F)st—air-to-Fuel ratio at stoichiometric combustion. It equals 34.3 kg/kg for hydrogen.
Mass of EGR gases mEGR can be calculated with Equation (22).
m E G R = 35.3 34.3 · E G R % / 100 1 E G R % / 100 m A i r
The number of moles in the nEGR of EGR can be determined from Equation (19).
In summary, γ as the specific heat ratio cp/cv is a function of the following: temperature, MFB and exhaust gas-recirculation ratio (Equation (23)).
γ = f ( T , M F B , E G R % )
Figure 2a,b illustrate the dependence of γu and γb on temperature. The polynomials (Equation (24)) for γu and γb are based on polynomials for hydrogen, oxygen, nitrogen and water separately and were determined by the authors. The coefficients for the γu and γb polynomials are presented in Table 1.
γ = a 0 + a 1 · T + a 2 · T 2 + a 3 · T 3

2.2. Molar Contraction

As demonstrated by the chemical reaction equation for hydrogen combustion in air (Equation (13)), the final number of moles of combustion products is less than the number of moles of reactants. This phenomenon, known as molar contraction, is also observed in the chemical reaction with the EGR reactant (Equation (25)). This phenomenon has a significant impact on the calculation of the temperature in the engine cylinder from the ideal gas equation of state (Equation (6)). If the same number of moles is assumed for the reactants and the combustion products, the temperature will be underestimated.
2 H 2 + O 2 + 3.76 N 2 + E G R = 2 H 2 O + 3.76 N 2 + E G R
where:
E G R = k · 2 H 2 O + 3.76 N 2
k—EGR molar coefficient in the range from 0 to 1. The coefficient k cannot linearly correspond to EGR%, as k is the molar ratio and EGR% is expressed in mass units.
Under no EGR on the reactant site, there are 6.76 moles, whereas on the product site, the total number of moles is 5.76. The classic approach assumes a fixed number of moles in the equation of state. Thus, based on this assumption it leads to the relative error of 15% which propagates further on temperature calculations as determined in Section 5.
Considering this molar contraction, the coefficient kMC was introduced as the ratio between the initial number of moles ninit for reactants to the final number of moles nfinal for products (Equation (27)).
k M C = n f i n a l n i n i t
Taking EGR into consideration for hydrogen combustion one can obtain the following Formula (28):
k M C = 5.76 · ( k + 1 ) 6.76 + 5.76 · k
Thus, nfinal is determined with Equation (29).
n f i n a l = 5.76 · ( k + 1 ) 6.76 + 5.76 · k · n i n i t
In conclusion, the current number of moles n(α) during combustion varies from ninit to nfinal depending on the crank angle alpha, the progress of combustion (MFB), the coefficient of molar contraction and the EGR ratio (Equation (30)).
n ( α ) = f ( α ,   M F B , k M C , k )
It is, therefore, necessary to take this dependence into account when calculating the mean combustion temperature T from the ideal gas equation of state (Equation (6)).
In summary, when hydrogen is burned, the number of moles of combustion products decreases compared to the number of moles of reactants. The proposed molar contraction coefficient kMC should be taken into account when calculating the combustion temperature with the equation of state of the ideal gas. The current number of moles should be determined ongoing along with the progress of combustion based on the MFB profile. The molar fraction k of exhaust gas recirculation affects the molar contraction coefficient kMC, causing its increase.

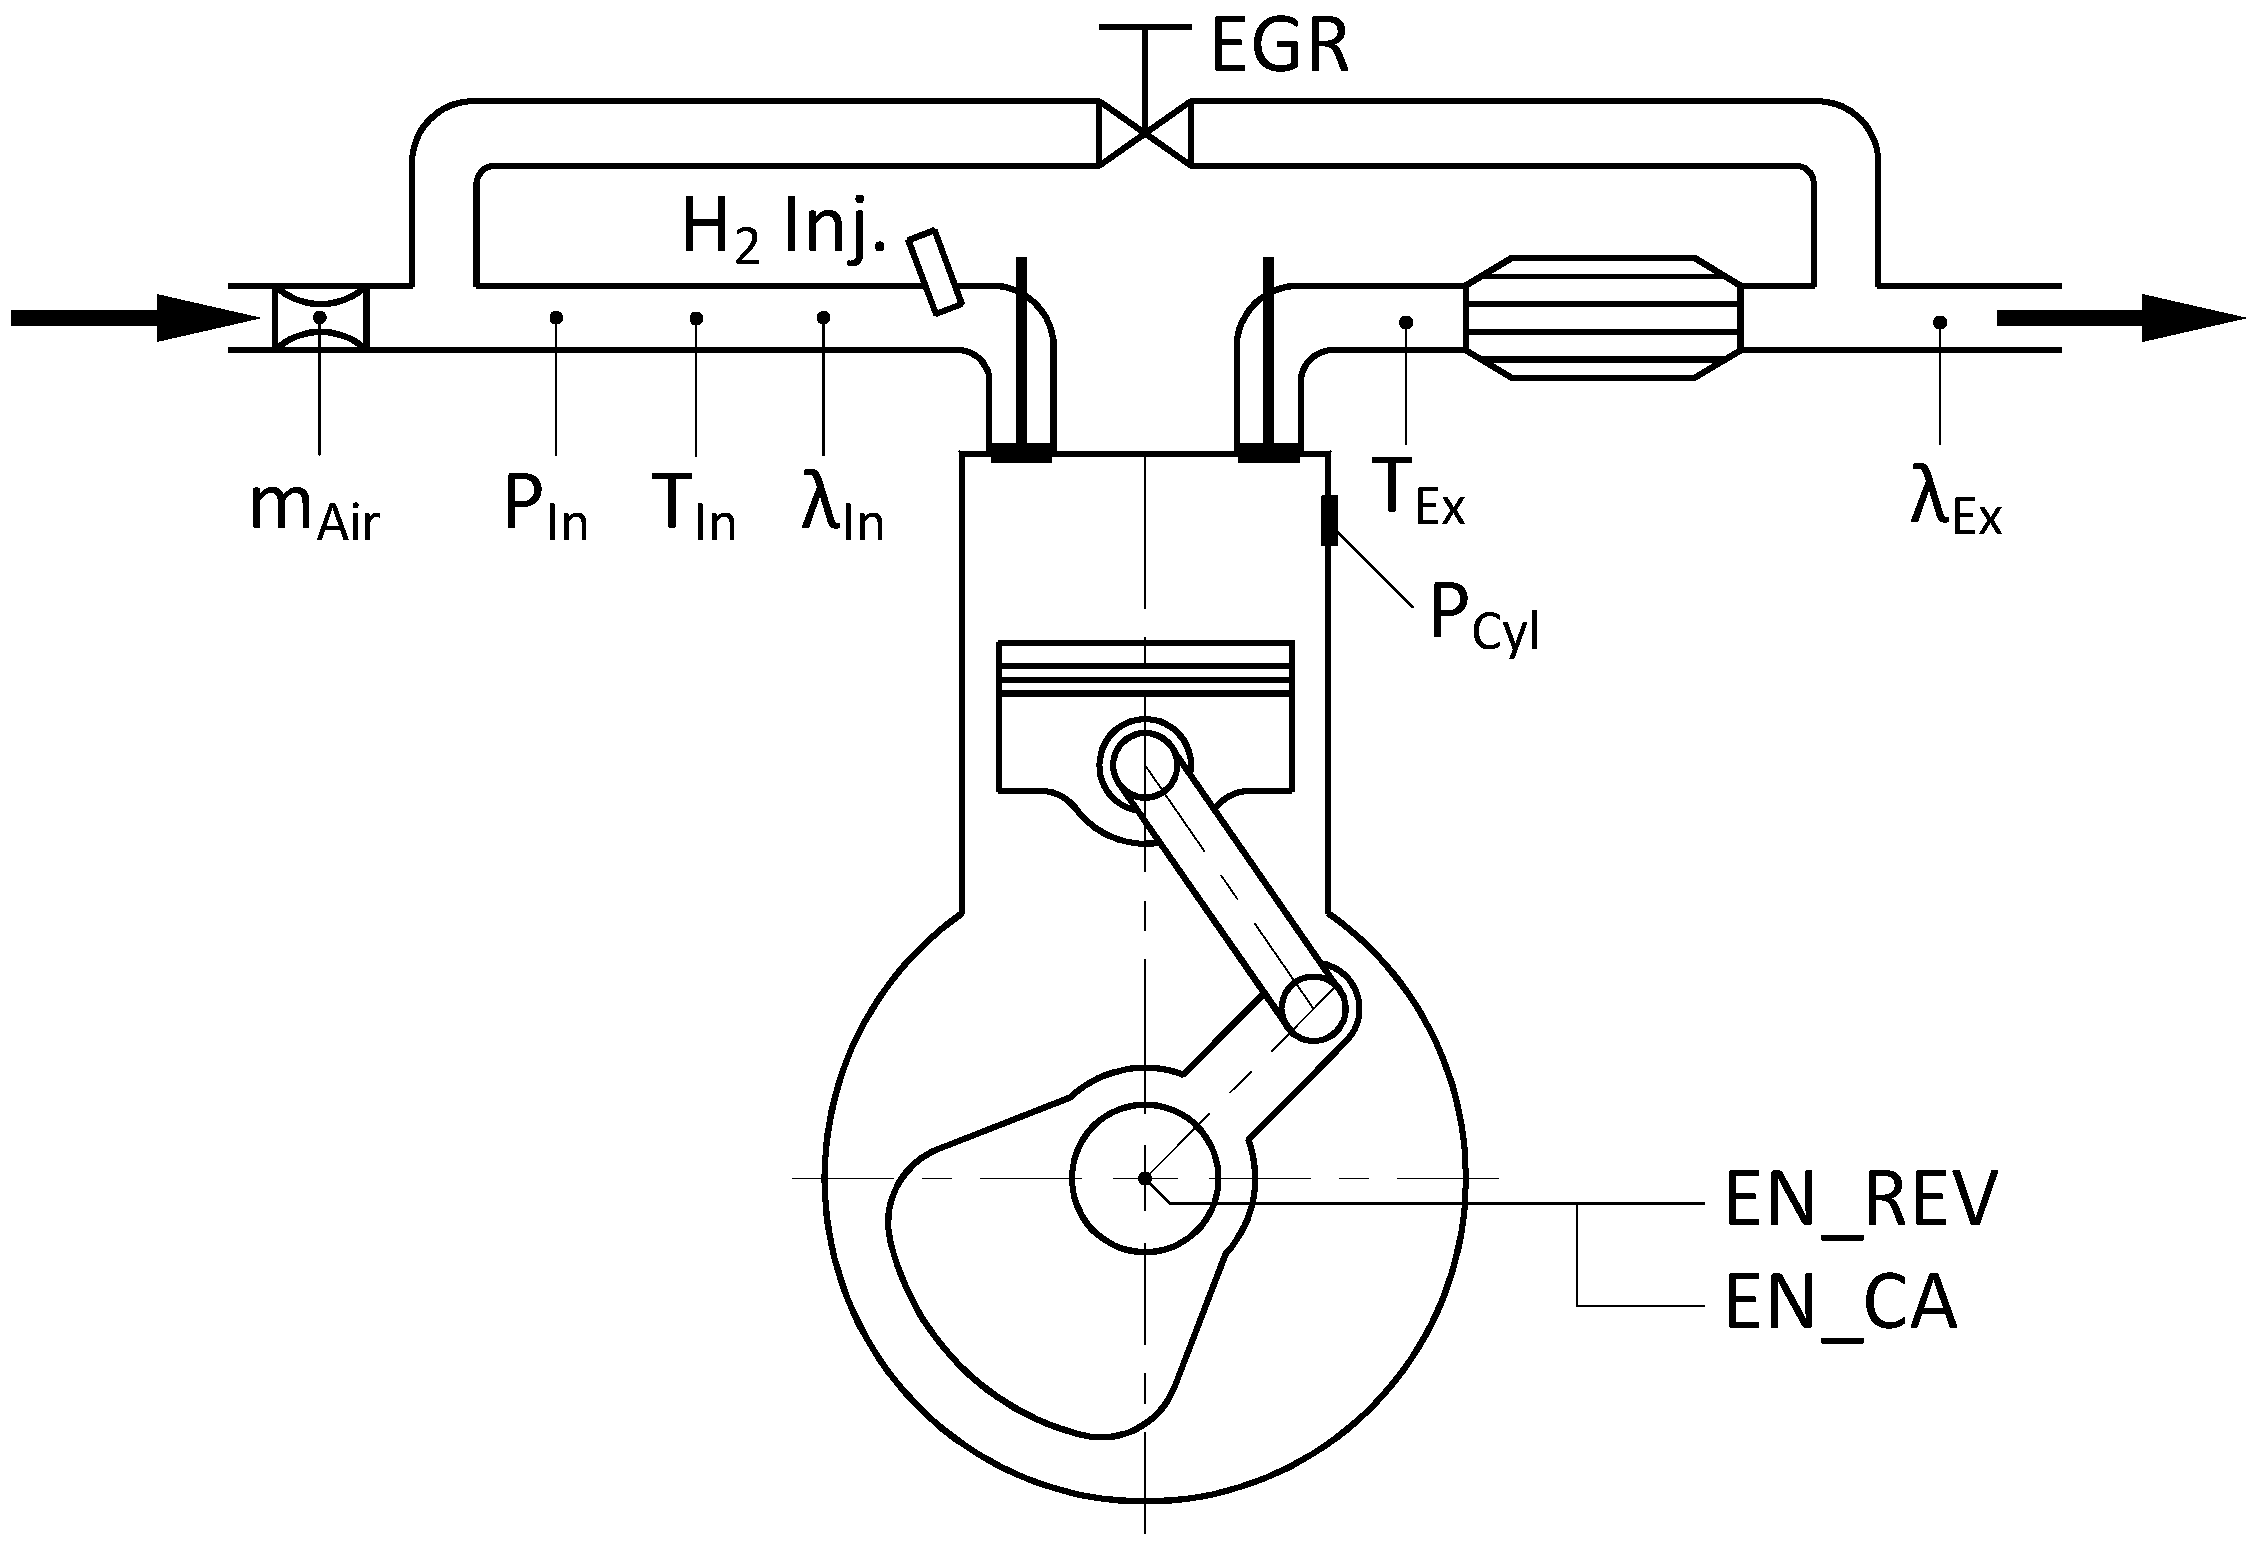
3. Experimental Setup

The engine used for this research is a single-cylinder CFR (Cooperative Fuels Research) engine manufactured by the CFR Engines Inc., Pewaukee, USA. A specialized attribute of this engine is its capacity to alter the compression ratio without disassembling the engine. The engine specifications and characteristics of the test bed are presented in Table 2 and illustrated in Figure 3, respectively. Numerous modifications to the engine were made to meet the requirements in these studies. This entailed modifying the compression ratio of the engine by altering the piston. The range of compression ratio that could be studied is in the range 4.5–17.5. However, the compression ratio for the conducted tests was set to 8.
A test bench equipped with sensors was utilized to monitor the air flowrate, intake pressure, in-cylinder combustion pressure and the temperature of the working fluid. Additionally, the piston position of the engine was determined from an encoder mounted on the crankshaft. The Universal Exhaust Gas Oxygen sensor (UEGO) Niterra, Nagoya, Japan was implemented to measure the stoichiometry of the combustible air-hydrogen mixture. Furthermore, electronic actuators incorporated a digital ignition coil, a throttle and a port fuel injector for hydrogen. The data from the in-cylinder pressure pick-up, along with the crank position encoder, were acquired with the NI BN-2111 analog-to-digital converter, National Instruments Corp., Austin, USA, at a sampling frequency of 100 kHz. The data for 300 engine cycles at 100 kSamples/second channel were acquired. The parameters of the engine combustion tests are presented in Table 3. As can be seen, the combustible air-hydrogen mixture was nearly stoichiometric. Hydrogen purity was 99.995%. The EGR percentage ratio was the only parameter that varied. The EGR ratio was measured on the basis of λIn and λEx as depicted in Figure 3, following formulas described in detail in [30].

4. Results and Discussion

The process of hydrogen combustion in the CFR research engine was analyzed thermodynamically, with particular emphasis on proposed modifications in the calculation of HRR and the temperature assuming a variable γ = cp/cv value and molar contraction. Adopting the proposed modifications for thermodynamic analysis was particularly important when testing hydrogen combustion under various EGR ratios. Figure 4a shows a part of the CA-pressure plot focused on the combustion process. Fixed spark timing was adopted to ensure similar initial conditions during ignition for the combustion process. It is evident that there is a discernible difference in the location and value of the maximum pressure with EGR change. Figure 4b presents these tests in p-v coordinates in a fully logarithmic scale, which shows the linearity of log(p) vs. log(v). This leads to the conclusion that the γ ratio is constant in both the compression and expansion processes.
As illustrated in Figure 4 and Figure 5, there is little difference between the combustion tests for EGR% = 0 and EGR% = 10%. These two courses exhibit a high degree of overlap, rendering the distinction between them challenging to discern visually. This small difference can be explained when taking into account the so-called internal residue of the remaining exhaust gases, which influences the combustion process in the same way as the external exhaust gas recirculation. The determination of this remaining exhaust gas is a relatively difficult issue to correctly estimate because it depends on several parameters. These parameters among others are the following: the efficiency of emptying the cylinder of exhaust gases, (i.e., mainly on the timings of the valves and the valve overlap, especially the location of the exhaust valve closure and the intake valve opening). Additionally, the pressure in the cylinder, the compression ratio, the real volume of the combustion chamber at the top dead center (TDC) of a piston, the shape of the combustion chamber and the shape of the piston crown are crucial factors. Based on theoretical analysis, it can be assumed that the remains of the exhaust gases ranged between 6.5 and 8% [31]. With this assumption, the additional 10% of external EGR generates a smaller difference than if the remaining of the exhaust gases were equal to 0. As depicted, Figure 5a presents heat-release rate determined with Equation (8) as net heat rate (Qnet); hence, negative values are correct, due to heat transfer Qwall into the cooling system. Figure 5b illustrates the maximum Qmax of the cumulative heat released (CHR) obtained by integrating HRR for each test.
The Qmax results in a form of the bar graph for the tests performed are presented in Figure 6. It can be considered that Qmax is practically constant, confirming almost the same input conditions for the tests performed. However, as one can observe, there is a slight increase in Qmax with EGR increase. As mentioned, the heat released is calculated as Qnet, i.e., Qgross minus the heat to the cooling system Qwall (Equation (8)). As a result of lowering the mean cylinder temperature with increasing EGR, it is expected that the amount of heat Qwall transferred to the cooling system will decrease and thus Qnet and Qmax will increase.
The accumulated heat plots were converted to normalized values in the range 0–100% as MFB and are presented in Figure 7. This is correct approach, the MFB course was counted as the cumulative heat (CHR) after integrating HRR. Assuming that calorific value of a fuel does not change with temperature and pressure in the cylinder, it can be assumed that MFB is the same as CHR after its normalization to the range 0–1. Based on the MFB profiles, the initial combustion phase CA0_10 was determined. The CA0_10 was measured from the ignition point to the burnout of 10% of the fuel. The main combustion phase of CA10_90 was similarly determined from 10 to 90% fuel burned. The results of both combustion phases, CA0_10 and CA10_90, are shown in Figure 8a and Figure 8b, respectively.
As illustrated in Figure 8a,b, as the ratio of exhaust gas recirculation increases, both the initial CA0_10 and the main combustion phase CA10_90 lengthen. This expansion is nearly twice as long, which corroborates the impact of EGR on the deceleration of hydrogen combustion in the IC spark-ignited engine. As observed, with an increase in EGR ratio both combustion phases are lengthened. This is due to the increased share of non-combustible gases in the premixed combustible mixture. These gases contribute to diluting hydrogen in the combustible mixture. Hence, according to Arrhenius’ law, a lower concentration of the reactant, i.e., hydrogen, lowers the coefficient of the chemical reaction, i.e., combustion reaction, reduces the flame propagation speed, and thus the combustion slows down, which is reflected in the extension of both combustion phases CA0_10 and CA10_90. Furthermore, with the increase in the EGR ratio, the mean combustion temperature decreases, as shown in Figure 9. This is the result of the accumulation of some heat in the inert gas which is additionally flown into the cylinder by i.e., exhaust gases recirculation. The combustion temperature was determined from the equation of state of the ideal gas (Equation (6)), assuming a change (molar contraction) in the number of moles of the working medium treated as the ideal gas. Moreover, it is important to note that the ideal gas equation provides the averaged combustion temperature over the space of the entire cylinder combustion chamber.

5. Error Analysis

The error analysis discussed here concerns the following:
  • the accuracy of the analytical method for calculating the released heat,
  • the accuracy of the measuring equipment.

5.1. Error in Calculating Released Heat

The derivation of the equation for dQ/dα (Equations (7) and (8)) assumes the use of the equation of state and the assumption of the constant number of moles of the working medium (Equation (6)). However, in the real hydrogen combustion process, there is a change in the number of moles under Equation (25). Consequently, the inaccuracy of the heat calculation method results from keeping the classic calculation approach, which does not take into account the change in the number of moles. Upon rearrangement to the total differential, Equation (6) takes the form (31):
d p d · V + p · d V d = d n d · R u · T + n · d R u d · T + n · R u · d T d
Typically, dn/dα is assumed to be 0 and this simplification leads to error in calculation, particularly, when ninit significantly differs from nfinal. Thus, for this purpose denote expression (32) as x1.
d n d · R u · T = x 1
Derivative of Universal Gas Constant Ru is obviously 0 (33).
n · d R u d · T = 0
And denote expression (34) as x2.
n · R u · d T d = x 2
Now, let anyone find the relative difference x1 referred to x2 with Equation (35).
x 1 x 2 = T n · d n d T T n · Δ n Δ T
One can preliminarily evaluate the ratio x1/x2 by taking the data from the initial and final states, respectively, before and after combustion, as follows:
  • T = 1/2(Tfinal + Tinit)—mean temperature during the combustion process;
  • n = 1/2(nfinal + ninit)—mean number of moles during combustion;
  • Δn = nfinal − ninit—change in the number of moles during combustion;
  • ΔT = Tfinal − Tinit—change in temperature during combustion.
  • The results of the conducted experiments, which took into account the most unfavorable conditions for temperature and mole number from the test with EGR% = 0 one can obtain as follows: Tfinal = 2353 K (2080 °C), Tinit = 733 K (460 °C), nfinal = 6.76, ninit = 5.76 and finally can obtain the result for the x1/x2 ratio (36).
x 1 x 2 0.15
As calculated, the expression x1, which is neglected in the classic approach stands approximately for 0.15 fraction of x2. On the percentage scale this is 15% additional change in the total differential of the equation of state between the initial (ignition) and final state (after combustion).
The second inaccuracy in the calculation method arises from the assumption that dn/dα = 0 in Equation (37), which presents the total differential of Equation (8) expressing internal energy U.
d U d = d ( n · c v · T ) d = d n d · c v · T + n · d c v d · T + n · c v · d T d
As previously made, x3 is expressed with Equation (38).
d n d · c v · T = x 3
With the assumption the gas filling the engine cylinder is the ideal gas; hence, dcv/dα=0 (Equation (39)).
n · d c v d · T 0
And finally, define x4 with Equation (40).
n · c v · d T d = x 4
The fraction of x3 over x4 introduced by Equation (41) is determined with the exact correlation according to Equation (35).
x 3 x 4 = T n · d n d T T n · Δ n Δ T 0.15
In conclusion, the neglect of the hydrogen molar contraction has resulted in a discrepancy of approximately 0.15 (or 15% in percentage ratio) between the expressions dU/dα and the total differential of the equation of state of the ideal gas.

5.2. Error in Combustion Temperature Calculation

Mean combustion temperature T vs. crank angle α was determined from the equation of state (42).
T ( α ) = p ( α ) · v ( α ) n ( α ) · R u
The initial temperature Tinit at the beginning of combustion (at the ignition point) is determined according to Equation (43).
T i n i t = p i n i t · v i n i t n i n i t · R u
The final temperature Tfinal after combustion can be expressed with Equation (44).
T f i n a l = p f i n a l · v f i n a l n f i n a l · R u
When applying the classic approach in the calculation method for the combustion temperature where ninit = nfinal, one can derive the following Equation (45) for calculating the ratio Tfinal to Tinit.
T f i n a l c l a s s i c T i n i t = p f i n a l · v f i n a l p i n i t · v i n i t
Under assuming molar contraction, one can obtain the result for Tfinal/Tinit (Equation (46)), keeping in mind that the coefficient 1.17 comes from ninit/nfinal = 6.76/5.76 = 1.17.
T f i n a l m o l a r   c o n t r a c t i o n T i n i t = p f i n a l · v f i n a l p i n i t · v i n i t · 1.17
To sum up, the final temperature Tfinal after combustion is nearly 17% higher when molar contraction is taken into account in comparison to the classic approach following the calculation with Equation (47).
T f i n a l m o l a r   c o n t r a c t i o n T f i n a l c l a s s i c = 1.17

5.3. Uncertainties in Measuring Apparatus

The test engine was equipped with the requisite measurement apparatus, which registered measurement data of in-cylinder pressure, intake temperature and crankshaft position against time with a sampling frequency of 100 kHz. The instrumentation and the uncertainties used in tests are presented in Table 4. The presented uncertainties concern the statistical error relative to the measurement range and are presented as relative percentage errors. As can be seen, these relative percentage errors resulting directly from the measurements are at a level acceptable for scientific research and do not constitute cardinal errors, so on their basis, it can be concluded that the errors for the computational results calculated based on error analysis methods will also be at an acceptable level.

6. Conclusions

As part of the research, improvements to the analytical method for determining the heat-release rate and calculating the mean combustion temperature in the cylinder were developed and tested. Then, the modified method was used for thermodynamic analysis of the combustion process in the internal combustion, hydrogen-powered engine with various ratios of exhaust gas recirculation. The following conclusions were obtained:
  • Taking into account the change in the number of moles during combustion (molar contraction) is the correct approach that eliminates the simplification of assuming a constant number of moles for the equation of state and the equation for internal energy;
  • The error of the classical approach resulting from the assumption of a constant number of moles was calculated. This relative error of the method with the classic approach was approximately 15% both for the calculation of internal energy and for the equation of state in the case of combustion of a hydrogen–air mixture under a stoichiometric ratio;
  • Furthermore, the avoidance of molar contraction during hydrogen combustion results in a relative error of up to 17% when calculating the mean combustion temperature inside the cylinder;
  • The calculation of the resultant specific heat ratio cp/cv based on separate calculations of cp and cv for the combustible mixture and for exhaust gases depending on the temperature gives better computational accuracy from the HRR method because it eliminates the simplification of assuming a constant cp/cv ratio;
  • Using a new approach to the analysis of both heat release and temperature with a single-zone, 0D computational model for a hydrogen-powered engine confirms its usefulness;
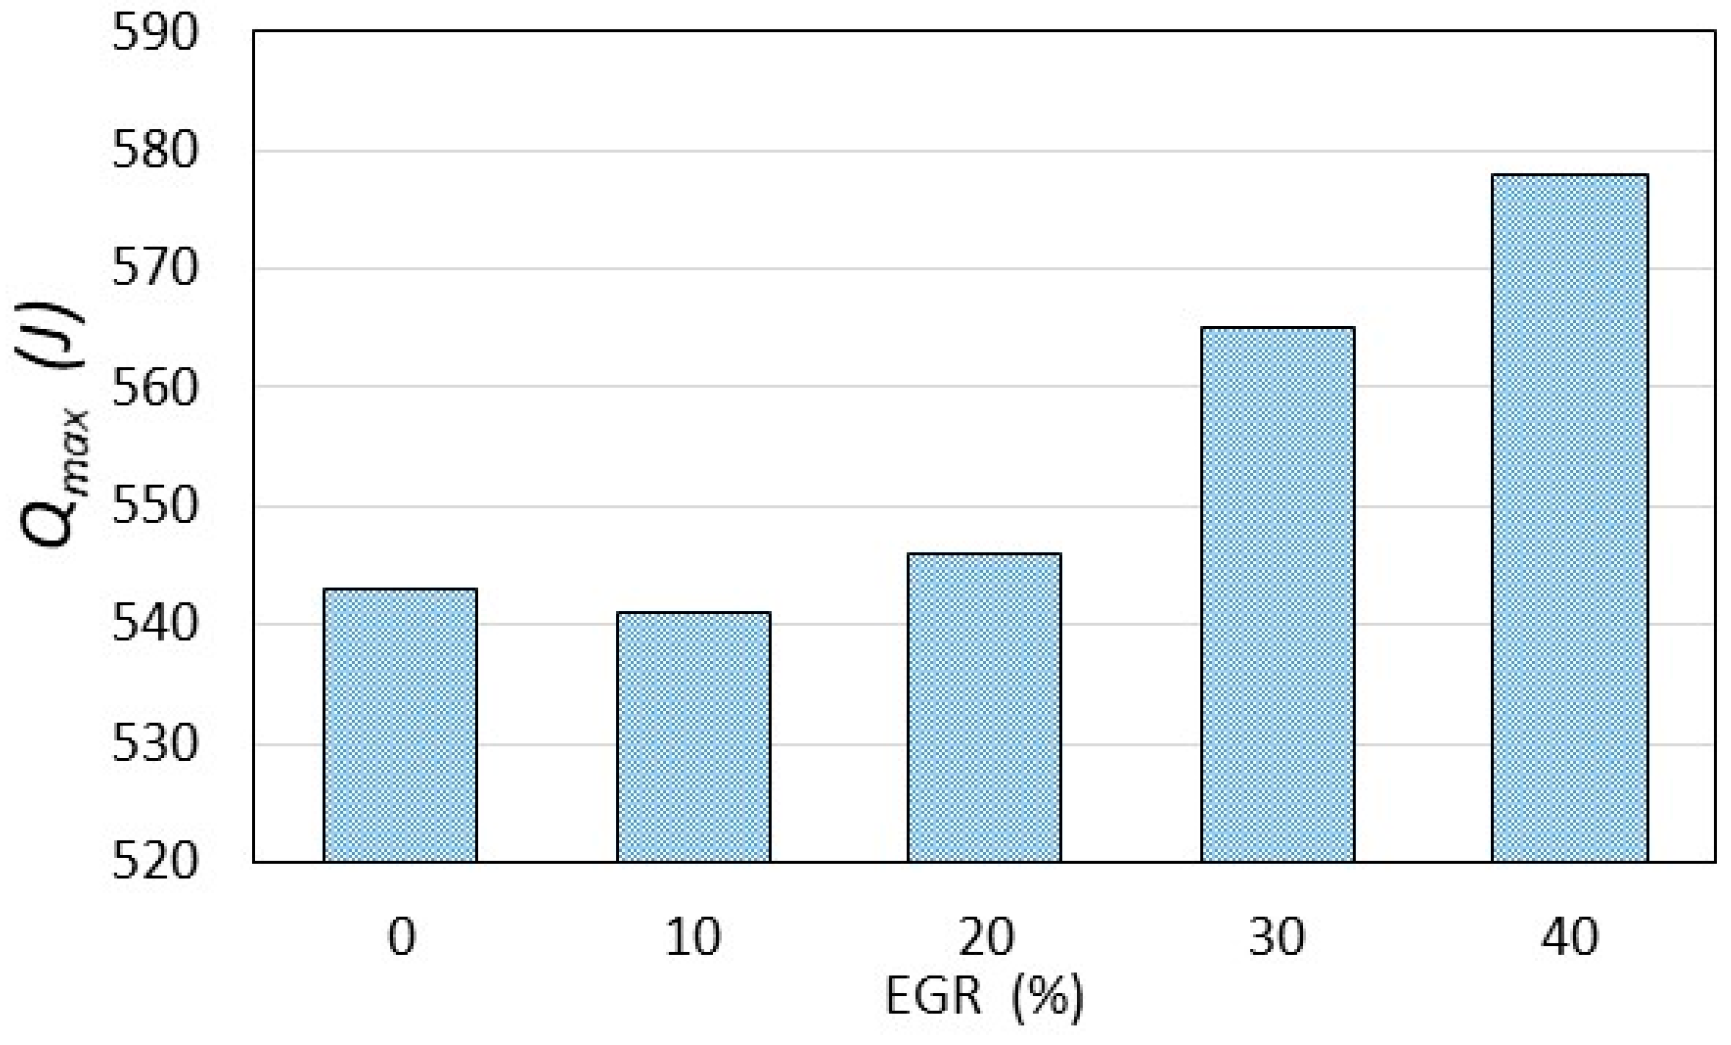
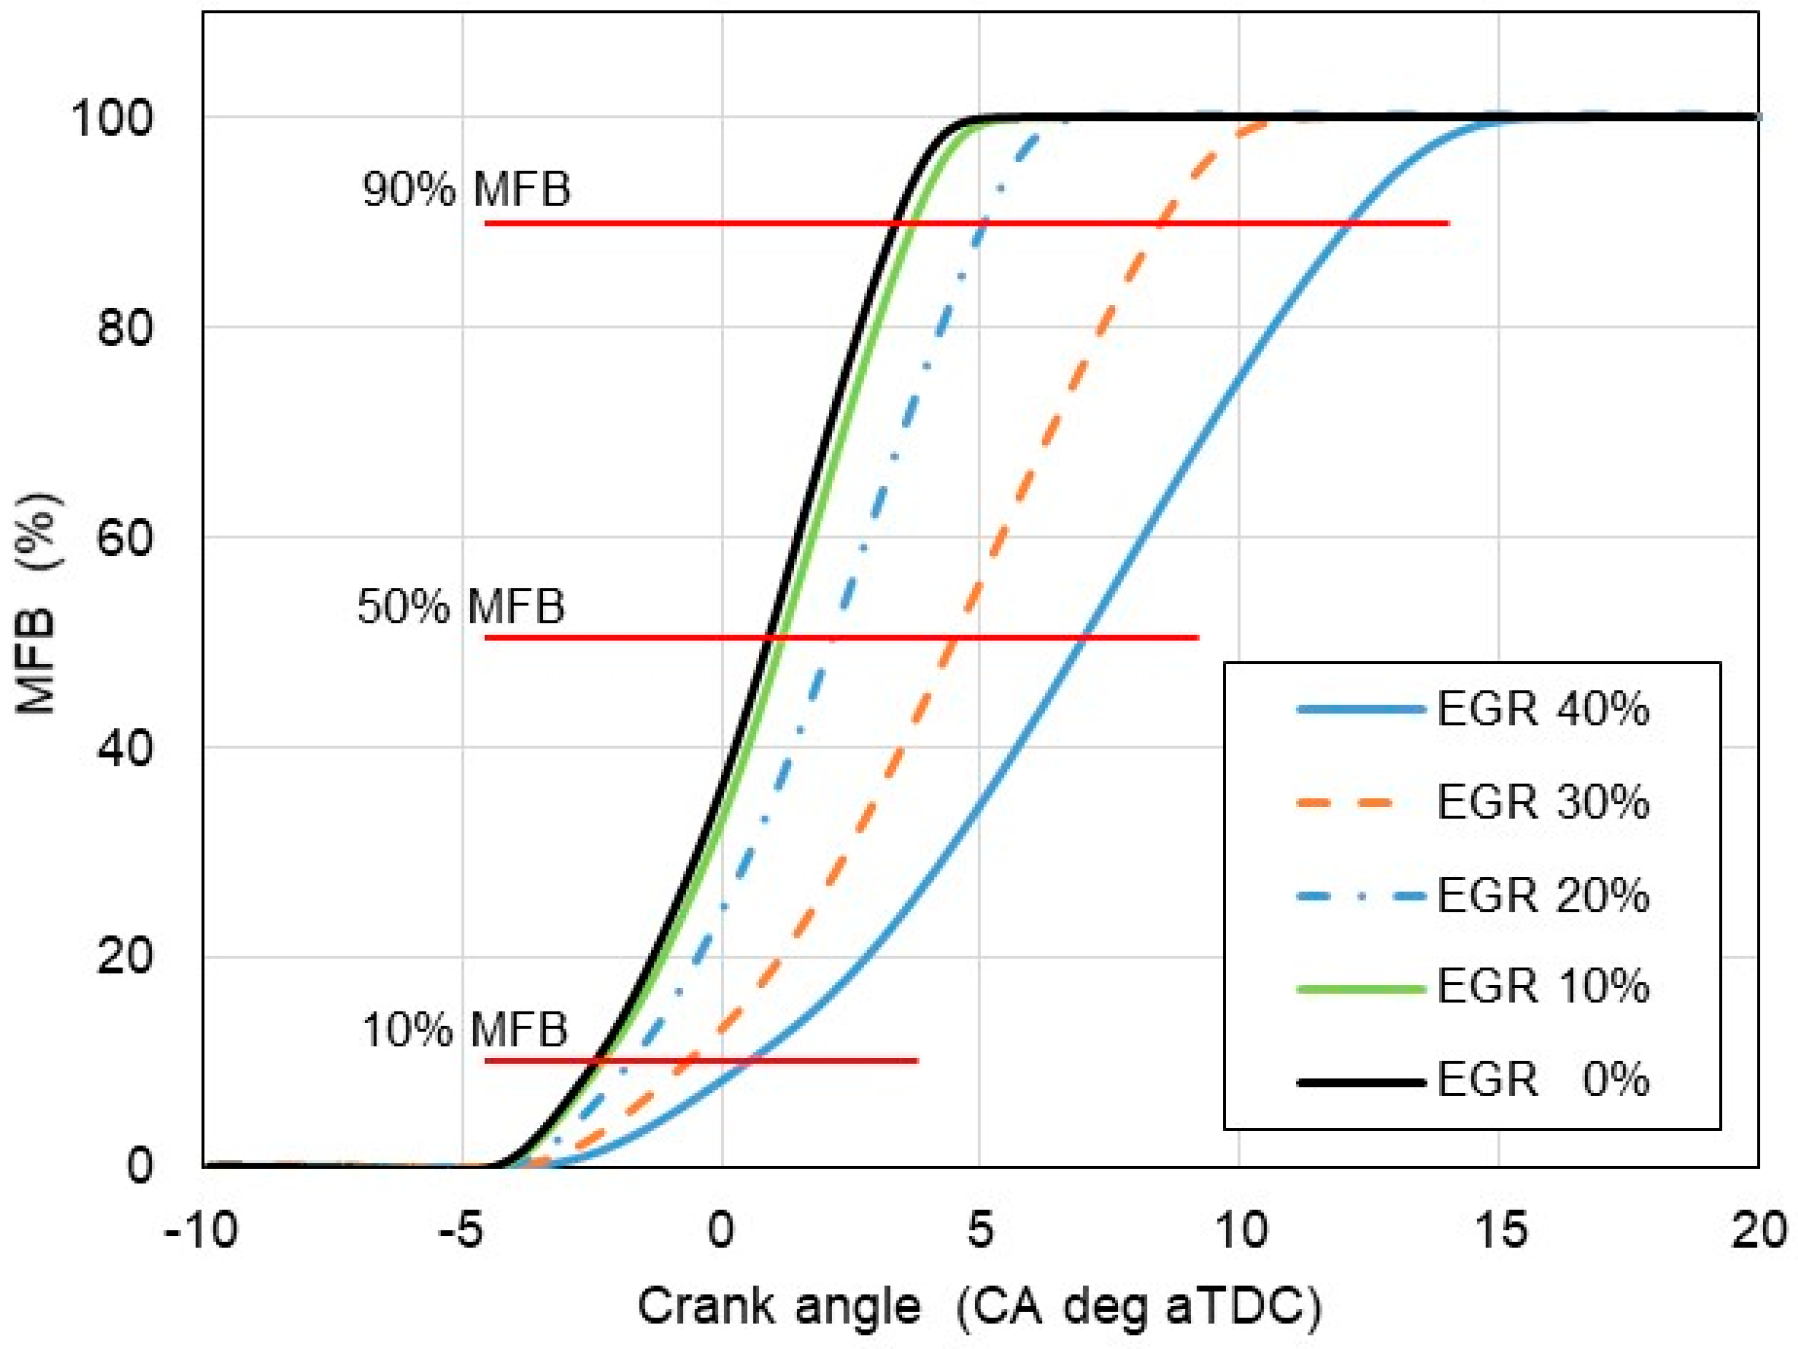
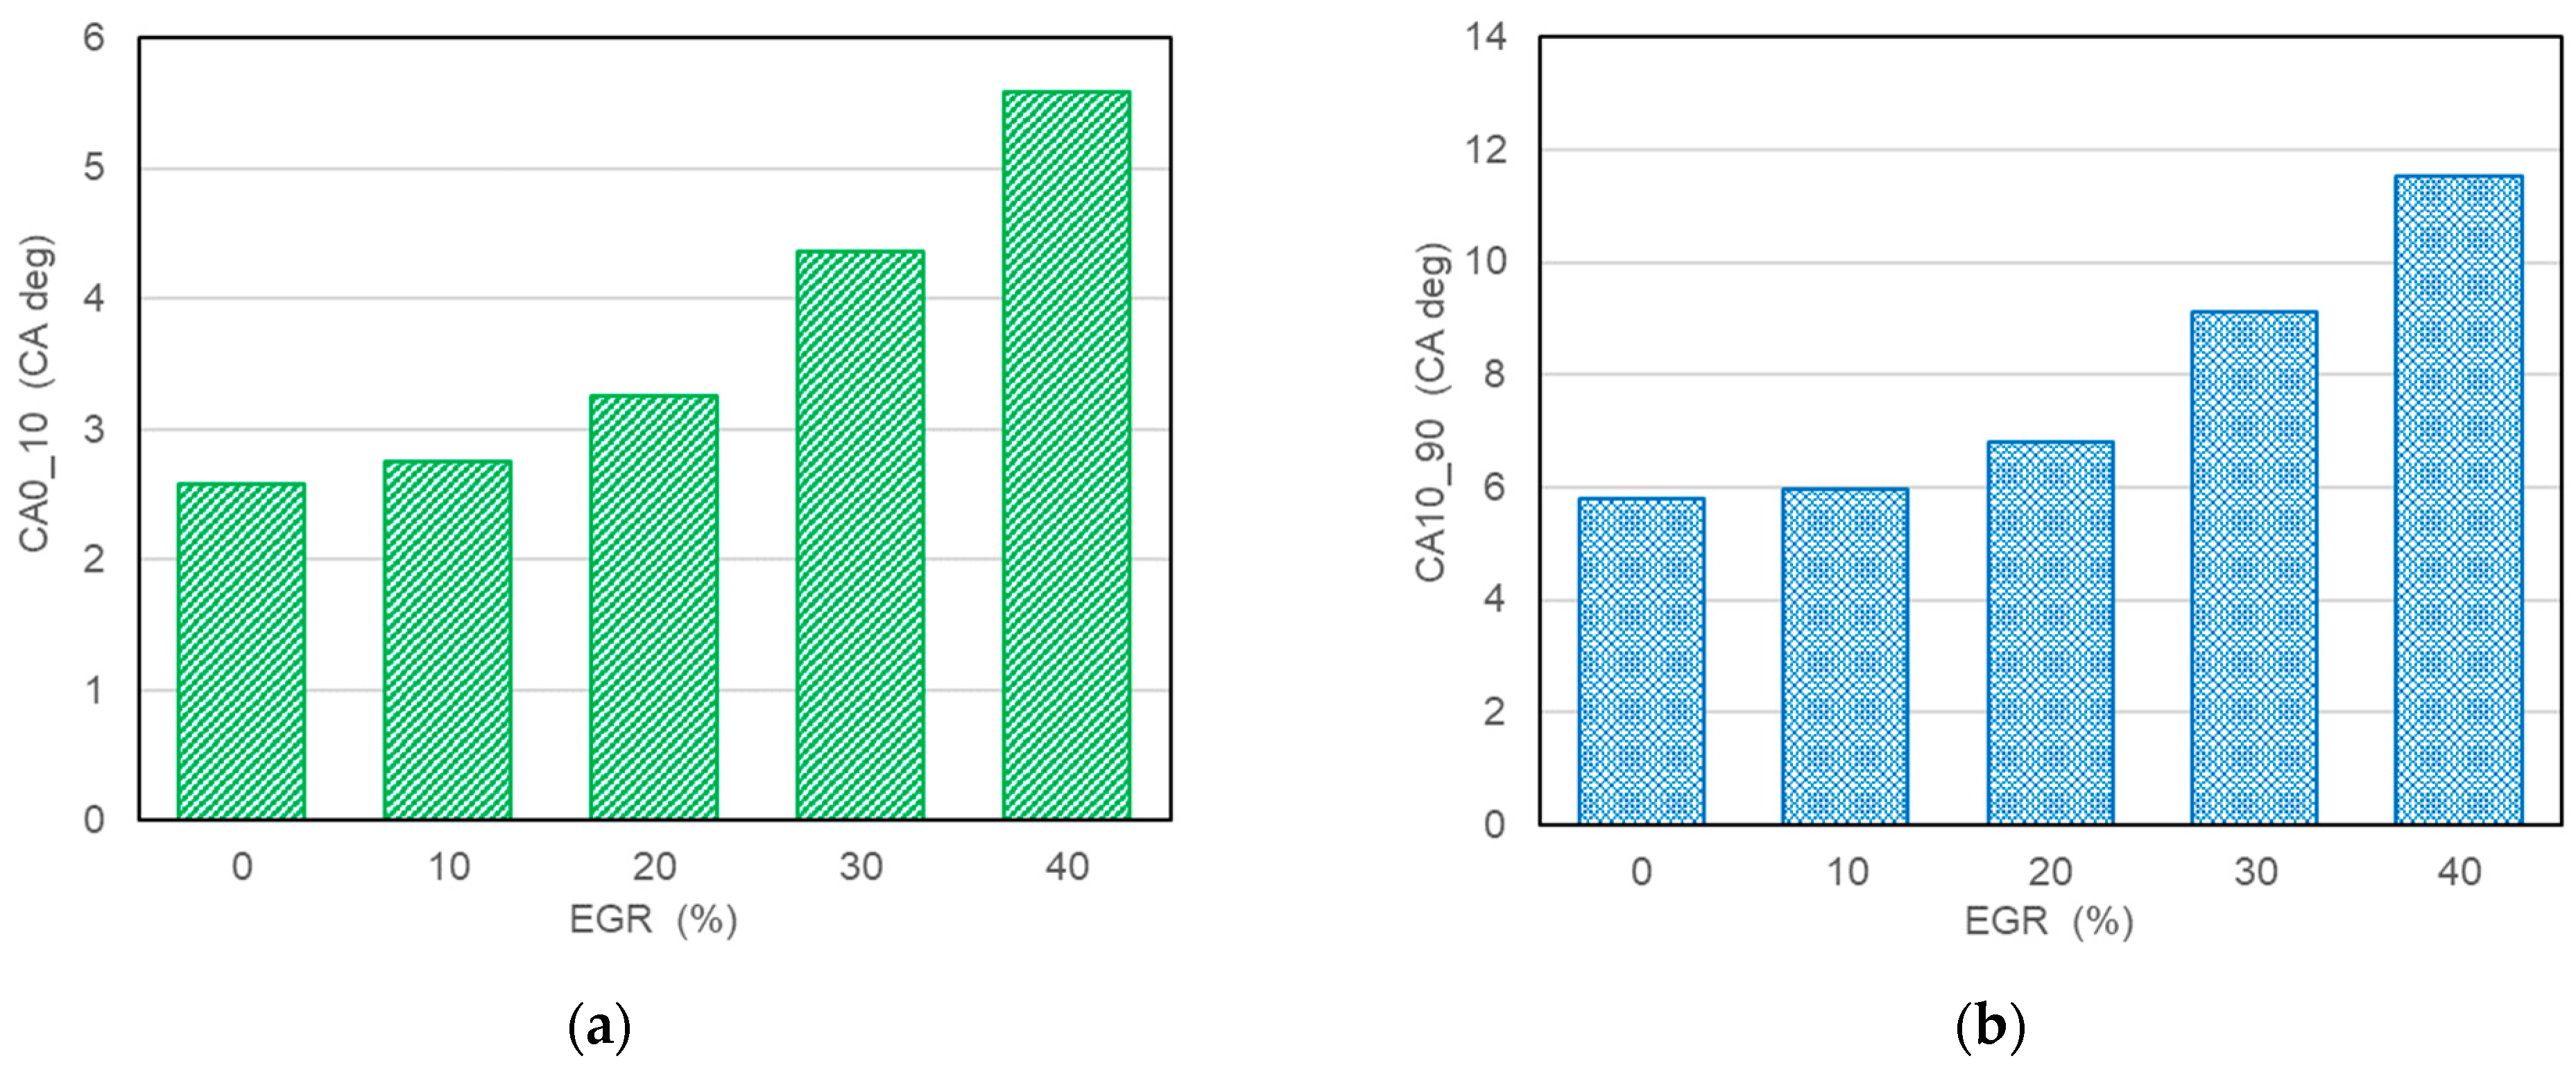
  • The results of experimental tests confirm a slowdown in the combustion process with an increase in the exhaust gas recirculation ratio in a hydrogen-powered engine. This implies lower combustion temperature, indicated mean effective pressure and, finally lower NOx formation according to the thermal NOx mechanism proposed by Zeldovich;
  • The highest EGR was 40% at which the engine operated stably.

Author Contributions

Conceptualization, M.S. and S.S.; methodology, S.S.; software, A.P. and S.S.; validation, S.S., D.M. and M.S.; formal analysis, S.S., D.M. and A.P.; investigation, S.S., M.S. and A.P.; resources, M.S. and D.M.; data curation, S.S. and A.P.; writing—original draft preparation, S.S.; writing—review and editing, S.S. and A.P.; visualization, M.S.; supervision, S.S. All authors have read and agreed to the published version of the manuscript.

Funding

This research received no funding.

Data Availability Statement

The raw data supporting the conclusions of this article will be made available by the authors on request.

Acknowledgments

The authors acknowledge the support of Michigan Technological University and specifically the Mechanical Engineering and Engineering Mechanics Department and the Advanced Power Systems Research Center, particularly Jeffrey D. Naber for support and facilities utilized in this work.

Conflicts of Interest

The authors declare no conflicts of interest.

Abbreviations

aTDCafter top dead center
CAcrank angle
CA0_10initial combustion phase
CA10_90final combustion phase
EGRexhaust gases recirculation
HRRheat-release rate
ICinternal combustion
MFBmass fraction of fuel burnt
MWmolecular weight
NOxnitric oxides
Qheat
Ttemperature
Wengine useful work
Uinternal energy
cpspecific heat at constant pressure
cvspecific heat at constant volume
kcoefficient for EGR share
mmass
nnumber of moles
pin-cylinder pressure
Subscripts
initbegin of combustion
finalend of combustion
bburnt
uunburnt

References

  1. Heywood, J.B. Internal Combustion Engine Fundamentals, 2nd ed.; McGraw-Hill College: New York, NY, USA, 2018; ISBN 9781260116106. [Google Scholar]
  2. Zeleznik, F.J.; McBride, B.J. Modeling the Internal Combustion Engine. NASA Ref. Publ. 1985, 1094, 19850011423. [Google Scholar]
  3. Goldsborough, S.S. On the Rate of Heat Release for High-Boost, Low-Temperature Combustion Schemes: Accounting for Compressibility Effects. Combust. Sci. Technol. 2009, 181, 729–755. [Google Scholar] [CrossRef]
  4. Nande, A.M.; Szwaja, S.; Naber, J. Impact of EGR on Combustion Processes in a Hydrogen Fuelled SI Engine; SAE Technical Paper 2008-01-1039; SAE International: Warrendale, PA, USA, 2008. [Google Scholar]
  5. Ihsan Shahid, M.; Rao, A.; Farhan, M.; Liu, Y.; Ma, F. Comparative Analysis of Different Heat Transfer Models, Energy and Exergy Analysis for Hydrogen-Enriched Internal Combustion Engine under Different Operation Conditions. Appl. Therm. Eng. 2024, 247, 123004. [Google Scholar] [CrossRef]
  6. Woschni, G. A Universally Applicable Equation for the Instantaneous Heat Transfer Coefficient in the Internal Combustion Engine; SAE Technical Paper 670931; SAE International: Warrendale, PA, USA, 1967. [Google Scholar]
  7. Annand, W.J.D. Heat Transfer in the Cylinders of Reciprocating Internal Combustion Engines. Proc. Inst. Mech. Eng. 1963, 177, 973–996. [Google Scholar] [CrossRef]
  8. Hohenberg, G.F. Advanced Approaches for Heat Transfer Calculations; SAE International: Warrendale, PA, USA, 1979. [Google Scholar]
  9. Lanzafame, R.; Messina, M. Ice Gross Heat Release Strongly Influenced by Specific Heat Ratio Values. Int. J. Automot. Technol. 2003, 4, 125–133. [Google Scholar]
  10. Tunestål, P. Self-Tuning Gross Heat Release Computation for Internal Combustion Engines. Control Eng. Pract. 2009, 17, 518–524. [Google Scholar] [CrossRef]
  11. Garcia, M.T.; Jiménez-Espadafor Aguilar, F.J.; Becerra Villanueva, J.A.; Trujillo, E.C. Analysis of a New Analytical Law of Heat Release Rate (HRR) for Homogenous Charge Compression Ignition (HCCI) Combustion Mode versus Analytical Parameters. Appl. Therm. Eng. 2011, 31, 458–466. [Google Scholar] [CrossRef]
  12. Mauro, S.; Şener, R.; Gül, M.Z.; Lanzafame, R.; Messina, M.; Brusca, S. Internal Combustion Engine Heat Release Calculation Using Single-Zone and CFD 3D Numerical Models. Int. J. Energy Environ. Eng. 2018, 9, 215–226. [Google Scholar] [CrossRef]
  13. Gatowski, J.A.; Balles, E.N.; Chun, K.M.; Nelson, F.E.; Ekchian, J.A.; Heywood, J.B. Heat Release Analysis of Engine Pressure Data; SAE International: Warrendale, PA, USA, 1984. [Google Scholar]
  14. Brunt, M.F.J.; Rai, H.; Emtage, A.L. The Calculation of Heat Release Energy from Engine Cylinder Pressure Data; SAE International: Warrendale, PA, USA, 1998. [Google Scholar]
  15. Egnell, R. Combustion Diagnostics by Means of Multizone Heat Release Analysis and No Calculation; SAE International: Warrendale, PA, USA, 1998. [Google Scholar]
  16. Olanrewaju, F.O.; Wu, Y.; Li, H.; Andrews, G.; Phylaktou, H. An Improved Heat Release Rate (HRR) Model for the Analysis of Combustion Behaviour of Diesel, GTL, and HVO Diesel; SAE Technical Paper No. 2020-01-2060; SAE International: Warrendale, PA, USA, 2020. [Google Scholar]
  17. Ebrahimi, R. Effect of Specific Heat Ratio on Heat Release Analysis in a Spark Ignition Engine. Sci. Iran. 2011, 18, 1231–1236. [Google Scholar] [CrossRef]
  18. Ceviz, M.A.; Kaymaz, İ. Temperature and Air–Fuel Ratio Dependent Specific Heat Ratio Functions for Lean Burned and Unburned Mixture. Energy Convers. Manag. 2005, 46, 2387–2404. [Google Scholar] [CrossRef]
  19. Rassweiler, G.M.; Withrow, L. Motion Pictures of Engine Flames Correlated with Pressure Cards; SAE International: Warrendale, PA, USA, 1938. [Google Scholar]
  20. Brunt, M.F.J.; Emtage, A.L. Evaluation of Burn Rate Routines and Analysis Errors; SAE Technical Paper No. 970037; SAE International: Warrendale, PA, USA, 1997. [Google Scholar]
  21. Durkin, K.; Khanafer, A.; Liseau, P.; Stjernström-Eriksson, A.; Svahn, A.; Tobiasson, L.; Andrade, T.S.; Ehnberg, J. Hydrogen-Powered Vehicles: Comparing the Powertrain Efficiency and Sustainability of Fuel Cell versus Internal Combustion Engine Cars. Energies 2024, 17, 1085. [Google Scholar] [CrossRef]
  22. Shadidi, B.; Najafi, G.; Yusaf, T. A Review of Hydrogen as a Fuel in Internal Combustion Engines. Energies 2021, 14, 6209. [Google Scholar] [CrossRef]
  23. Szwaja, S.; Naber, J.D. Dual Nature of Hydrogen Combustion Knock. Int. J. Hydrogen Energy 2013, 38, 12489–12496. [Google Scholar] [CrossRef]
  24. Szwaja, S. Dilution of Fresh Charge for Reducing Combustion Knock in the Internal Combustion Engine Fueled with Hydrogen Rich Gases. Int. J. Hydrogen Energy 2019, 44, 19017–19025. [Google Scholar] [CrossRef]
  25. Verhelst, S.; Vancoillie, J.; Naganuma, K.; De Paepe, M.; Dierickx, J.; Huyghebaert, Y.; Wallner, T. Setting a Best Practice for Determining the EGR Rate in Hydrogen Internal Combustion Engines. Int. J. Hydrogen Energy 2013, 38, 2490–2503. [Google Scholar] [CrossRef]
  26. Misul, D.A.; Scopelliti, A.; Baratta, M. High-Performance Hydrogen-Fueled Internal Combustion Engines: Feasibility Study and Optimization via 1D-CFD Modeling. Energies 2024, 17, 1593. [Google Scholar] [CrossRef]
  27. Lebedevas, S.; Raslavičius, L.; Drazdauskas, M. Comprehensive Correlation for the Prediction of the Heat Release Characteristics of Diesel/CNG Mixtures in a Single-Zone Combustion Model. Sustainability 2023, 15, 3722. [Google Scholar] [CrossRef]
  28. Lebedevas, S.; Žaglinskis, J.; Drazdauskas, M. Development and Validation of Heat Release Characteristics Identification Method of Diesel Engine under Operating Conditions. J. Mar. Sci. Eng. 2023, 11, 182. [Google Scholar] [CrossRef]
  29. Tang, Y.; Li, H.; Jiang, Y.; Liang, W.; Zhang, J. The Control-Oriented Heat Release Rate Model for a Marine Dual-Fuel Engine under All the Operating Modes and Loads. J. Mar. Sci. Eng. 2023, 11, 64. [Google Scholar] [CrossRef]
  30. Szwaja, S.; Naber, J.D. Exhaust Gas Recirculation Strategy in the Hydrogen SI Engine. J. Kones-Powertrain Transp. 2007, 14, 457–464. [Google Scholar]
  31. Szwaja, S.; Ansari, E.; Rao, S.; Szwaja, M.; Grab-Rogalinski, K.; Naber, J.D.; Pyrc, M. Influence of Exhaust Residuals on Combustion Phases, Exhaust Toxic Emission and Fuel Consumption from a Natural Gas Fueled Spark-Ignition Engine. Energy Convers. Manag. 2018, 165, 440–446. [Google Scholar] [CrossRef]
Figure 1. Energy distribution inside the engine cylinder.
Energies 17 02833 g001
Figure 2. (a) Specific heat ratio γu for unburnt, combustible mixture; (b) specific heat ratio γb exhaust gases—products of combustion.
Energies 17 02833 g002
Figure 3. Outline of the test bench measuring apparatus.
Energies 17 02833 g003
Figure 4. (a) In-cylinder pressure vs. crank angle; (b) In-cylinder pressure vs. cylinder volume in log scales.
Energies 17 02833 g004
Figure 5. (a) Heat-release rate (HRR) vs. crank angle; (b) Cumulative heat released from combustion vs. crank angle.
Energies 17 02833 g005
Figure 6. Maximum cumulative heat vs. EGR percentage.
Energies 17 02833 g006
Figure 7. Normalized to percentage scale mass fraction of fuel burnt (MFB) vs. crank angle.
Energies 17 02833 g007
Figure 8. (a) Initial combustion phase CA0_10 vs. EGR percentage ratio; (b) Main combustion phase CA10_90 vs. EGR percentage ratio.
Energies 17 02833 g008
Figure 9. In-cylinder means temperature vs. crank angle.
Energies 17 02833 g009
Table 1. CFR Engine Specifications.
γua0a1a2a3
1.4485−0.00014 × 10⁻⁸−4 × 10⁻¹²
γba0a1a2a3
1.4482−0.00027 × 10⁻⁸−9 × 10⁻¹²
Table 2. CFR Engine Specifications.
ParameterUnitData
Compression Ratio-8
Cylinder Boremm82.6
Strokemm114.3
Connecting Rod Lengthmm254
Displacementcm3611
Intake Valve OpenCA deg aTDC10°
Intake Valve ClosureCA deg aBDC34°
Exhaust Valve OpenCA deg bBDC40°
Exhaust Valve ClosureCA deg aTDC15°
Engine Speedrpm900
Table 3. Test matrix.
No.Spark Timing
(CA Deg aTDC)
λ
(−)
EGR%
(%)
1−51.00–1.030
2−51.01–1.0310
3−51.00–1.0220
4−51.01–1.0430
5−51.01–1.0340
Table 4. Instrumentation of the measurement system.
InstrumentRangeAccuracy
Air laminar flowmeter0.05…10 m3/h0.1%
Charge amplifier Kistler2…10 pC
10…100 pC
100…2,200,000 pC
<±2%
<±0.6%
<±0.3%
Pressure sensor: Kistler 60610…200 bar<±1%
Data acq. system: NI BN-2111±10 V±0.07%
16 bits ± 1 LSB
Thermocouple NiCR-NiAl (K)(−40)…1140 °C1.5 °C
Spark timing−20 ÷ 0 CA deg aTDCuncertainty: ±0.1 CA deg
Combustion phases: CA0-10, CA10-90 uncertainty: ±0.3 CA deg
Encodermax. 6000 rpm0.3 deg/rev
Disclaimer/Publisher’s Note: The statements, opinions and data contained in all publications are solely those of the individual author(s) and contributor(s) and not of MDPI and/or the editor(s). MDPI and/or the editor(s) disclaim responsibility for any injury to people or property resulting from any ideas, methods, instructions or products referred to in the content.

