

Modeling and Simulation of Distribution Networks with High Renewable Penetration in Open-Source Software: QGIS and OpenDSS
 , , ,
, , , 
Abstract
:1. Introduction
- Direct Integration of Real Data: This study implements the QGIS2OpenDSS plugin with real-world data from a georeferenced high PV penetration network, unlike studies which relied on synthetic data or simplified models. This ensures more accurate and reliable simulation results.
- Detailed Explanation on the procedure required for the use of the QGIS2OpenDSS plugin: The original publications presenting this plugin [8,27] do not discuss in detail the necessary steps for using the plugin in different regions. By addressing this gap, this work contributes to extending the usage of the plugin and documents the required adaptations and modifications for its implementation in other locations. Furthermore, guidelines for extracting the required data for the plugin from the DNO data are presented. This effort enhances the utility of the plugin and supports its broader applicability.
- Automated Data Processing: The development of an automated data processing algorithm allows for the conversion of legacy GIS data from the DNO into the format needed for QGIS2OpenDSS, reducing the time and effort required for manual data handling and minimizing the risk of errors associated with repetitive data exchanges.
- Open-Source and Customizable Tool: The use of open-source tools like QGIS and OpenDSS eliminates dependency on costly, proprietary software, and allows for customization. This enables users to modify the tools according to specific project needs and enhances flexibility in performing various analyses.
- Practical Application: By applying the developed tool in the context of the Dominican Republic’s distribution network, the study provides practical insights and validates the effectiveness of the tool in a real-world scenario, potentially accelerating DER integration and supporting the local energy market’s growth.
2. Materials and Methods
2.1. QGIS
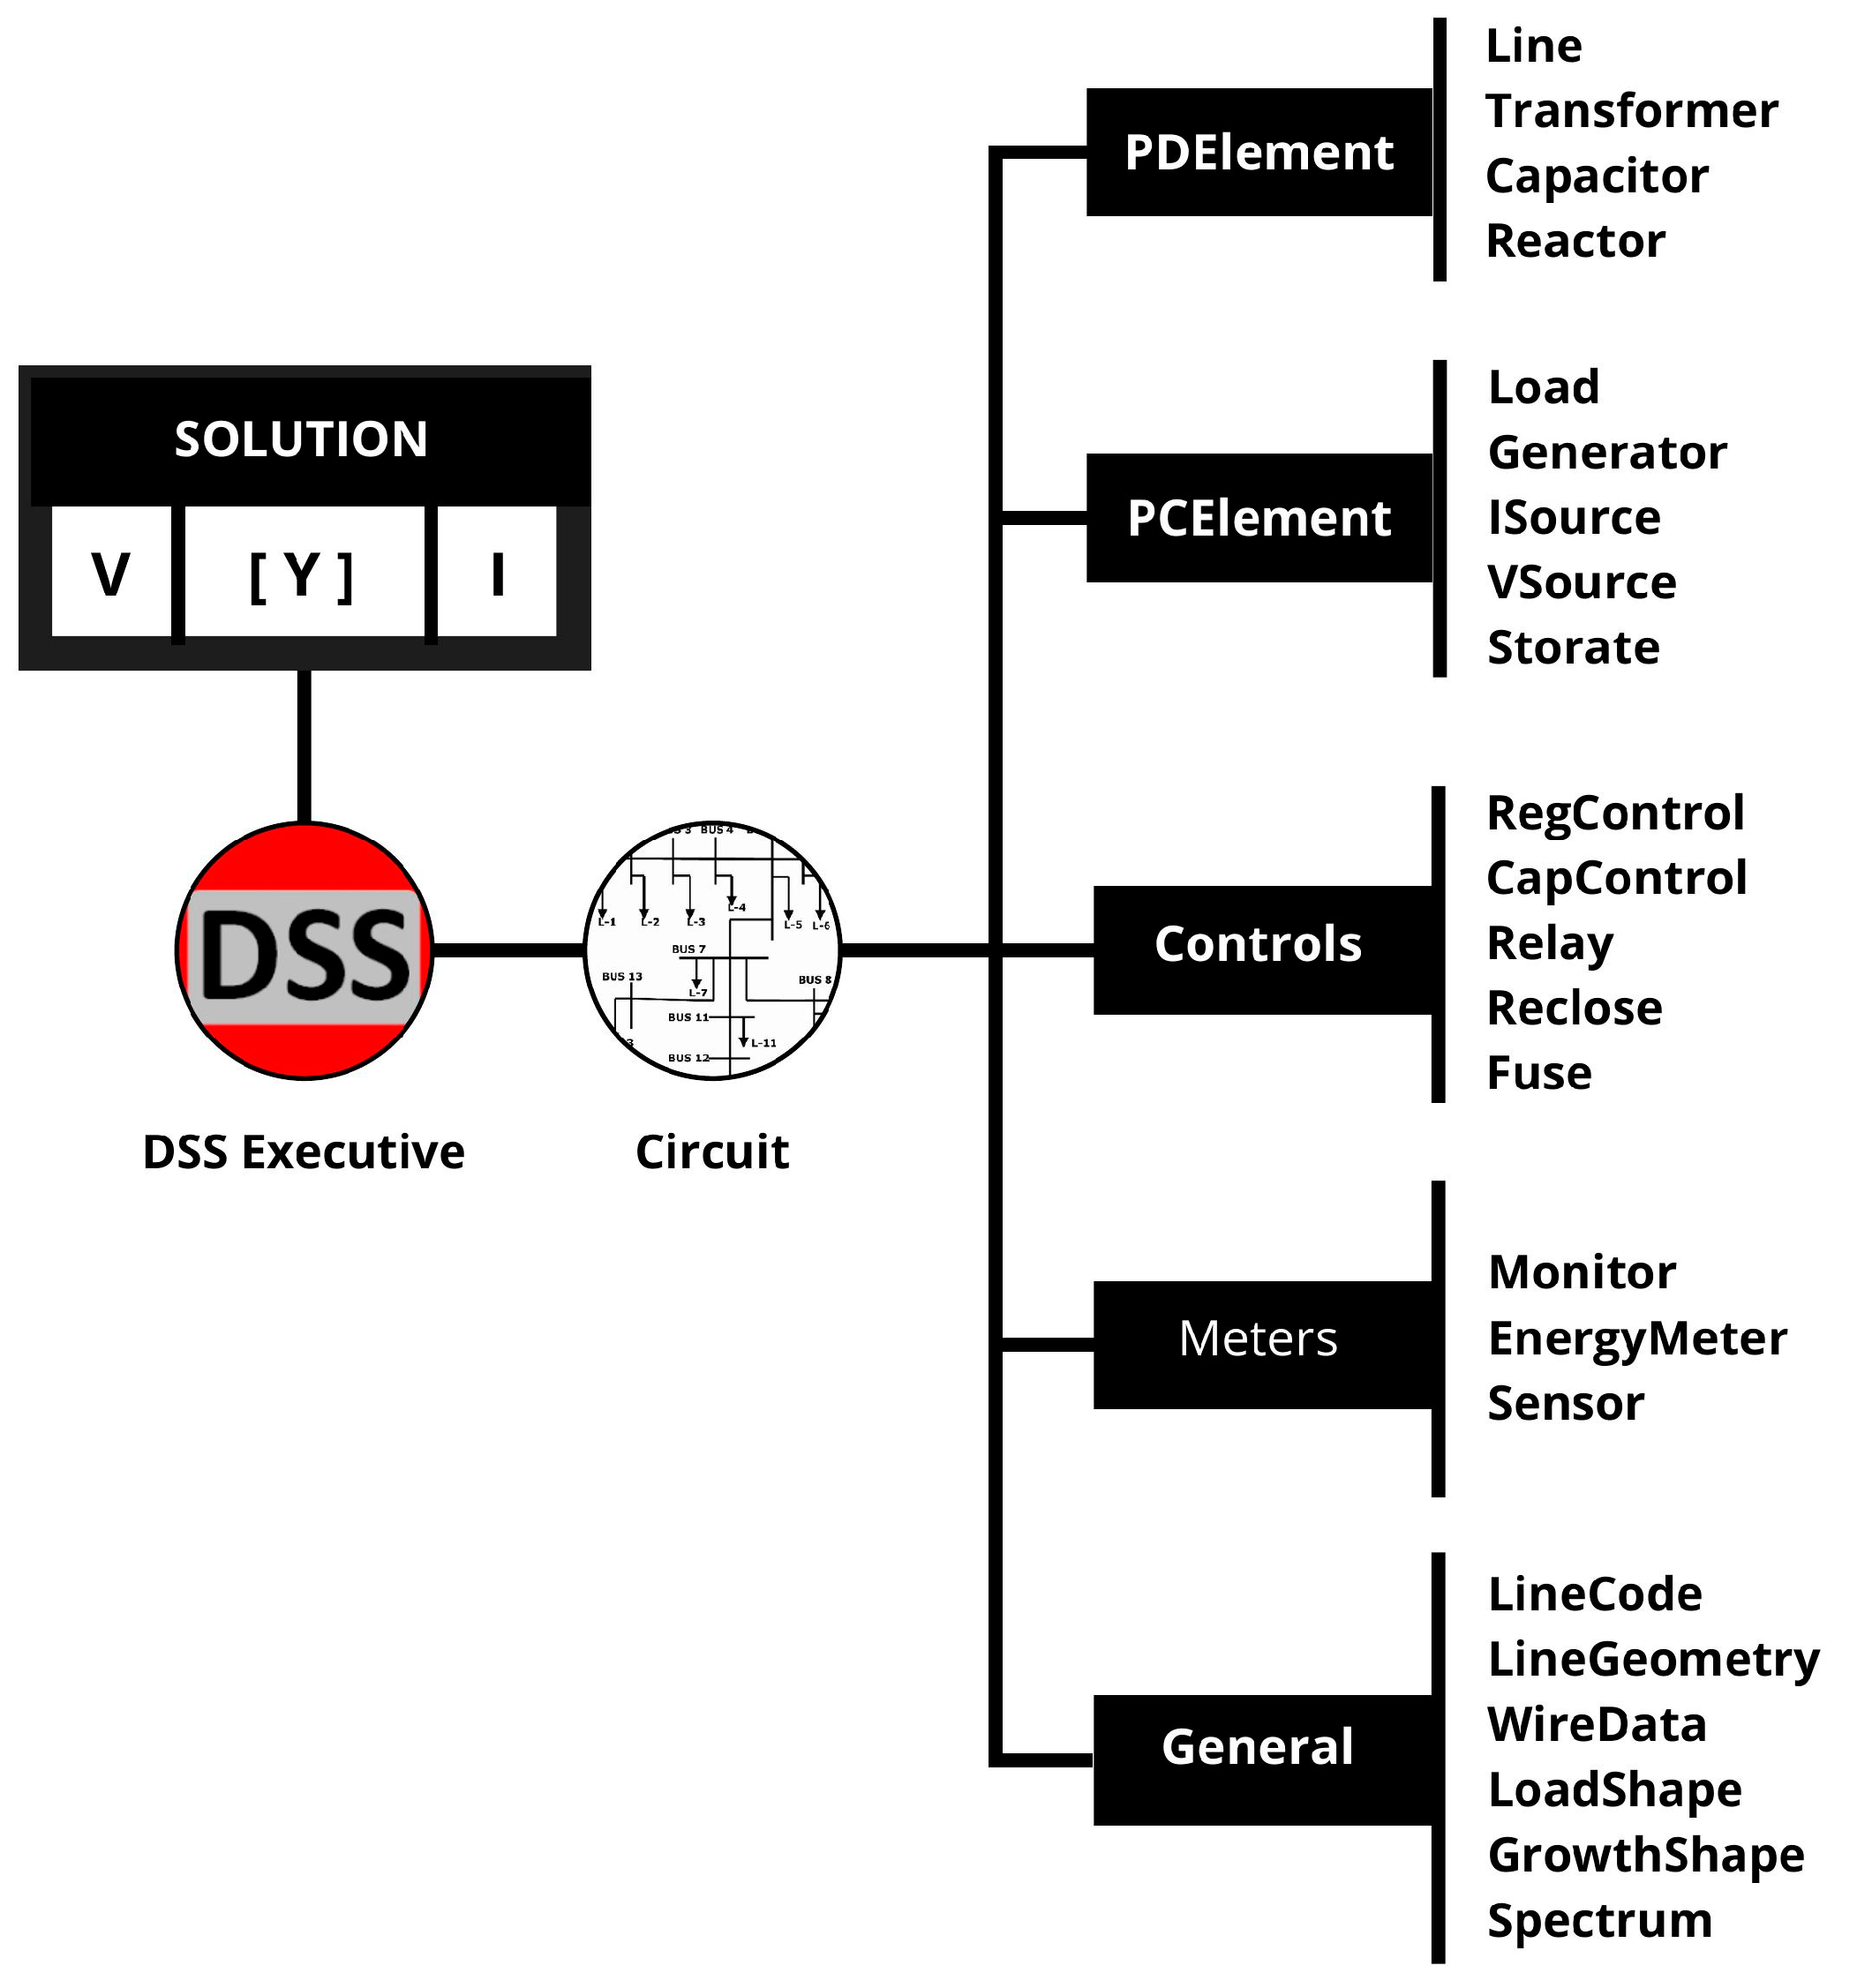
2.2. OpenDSS
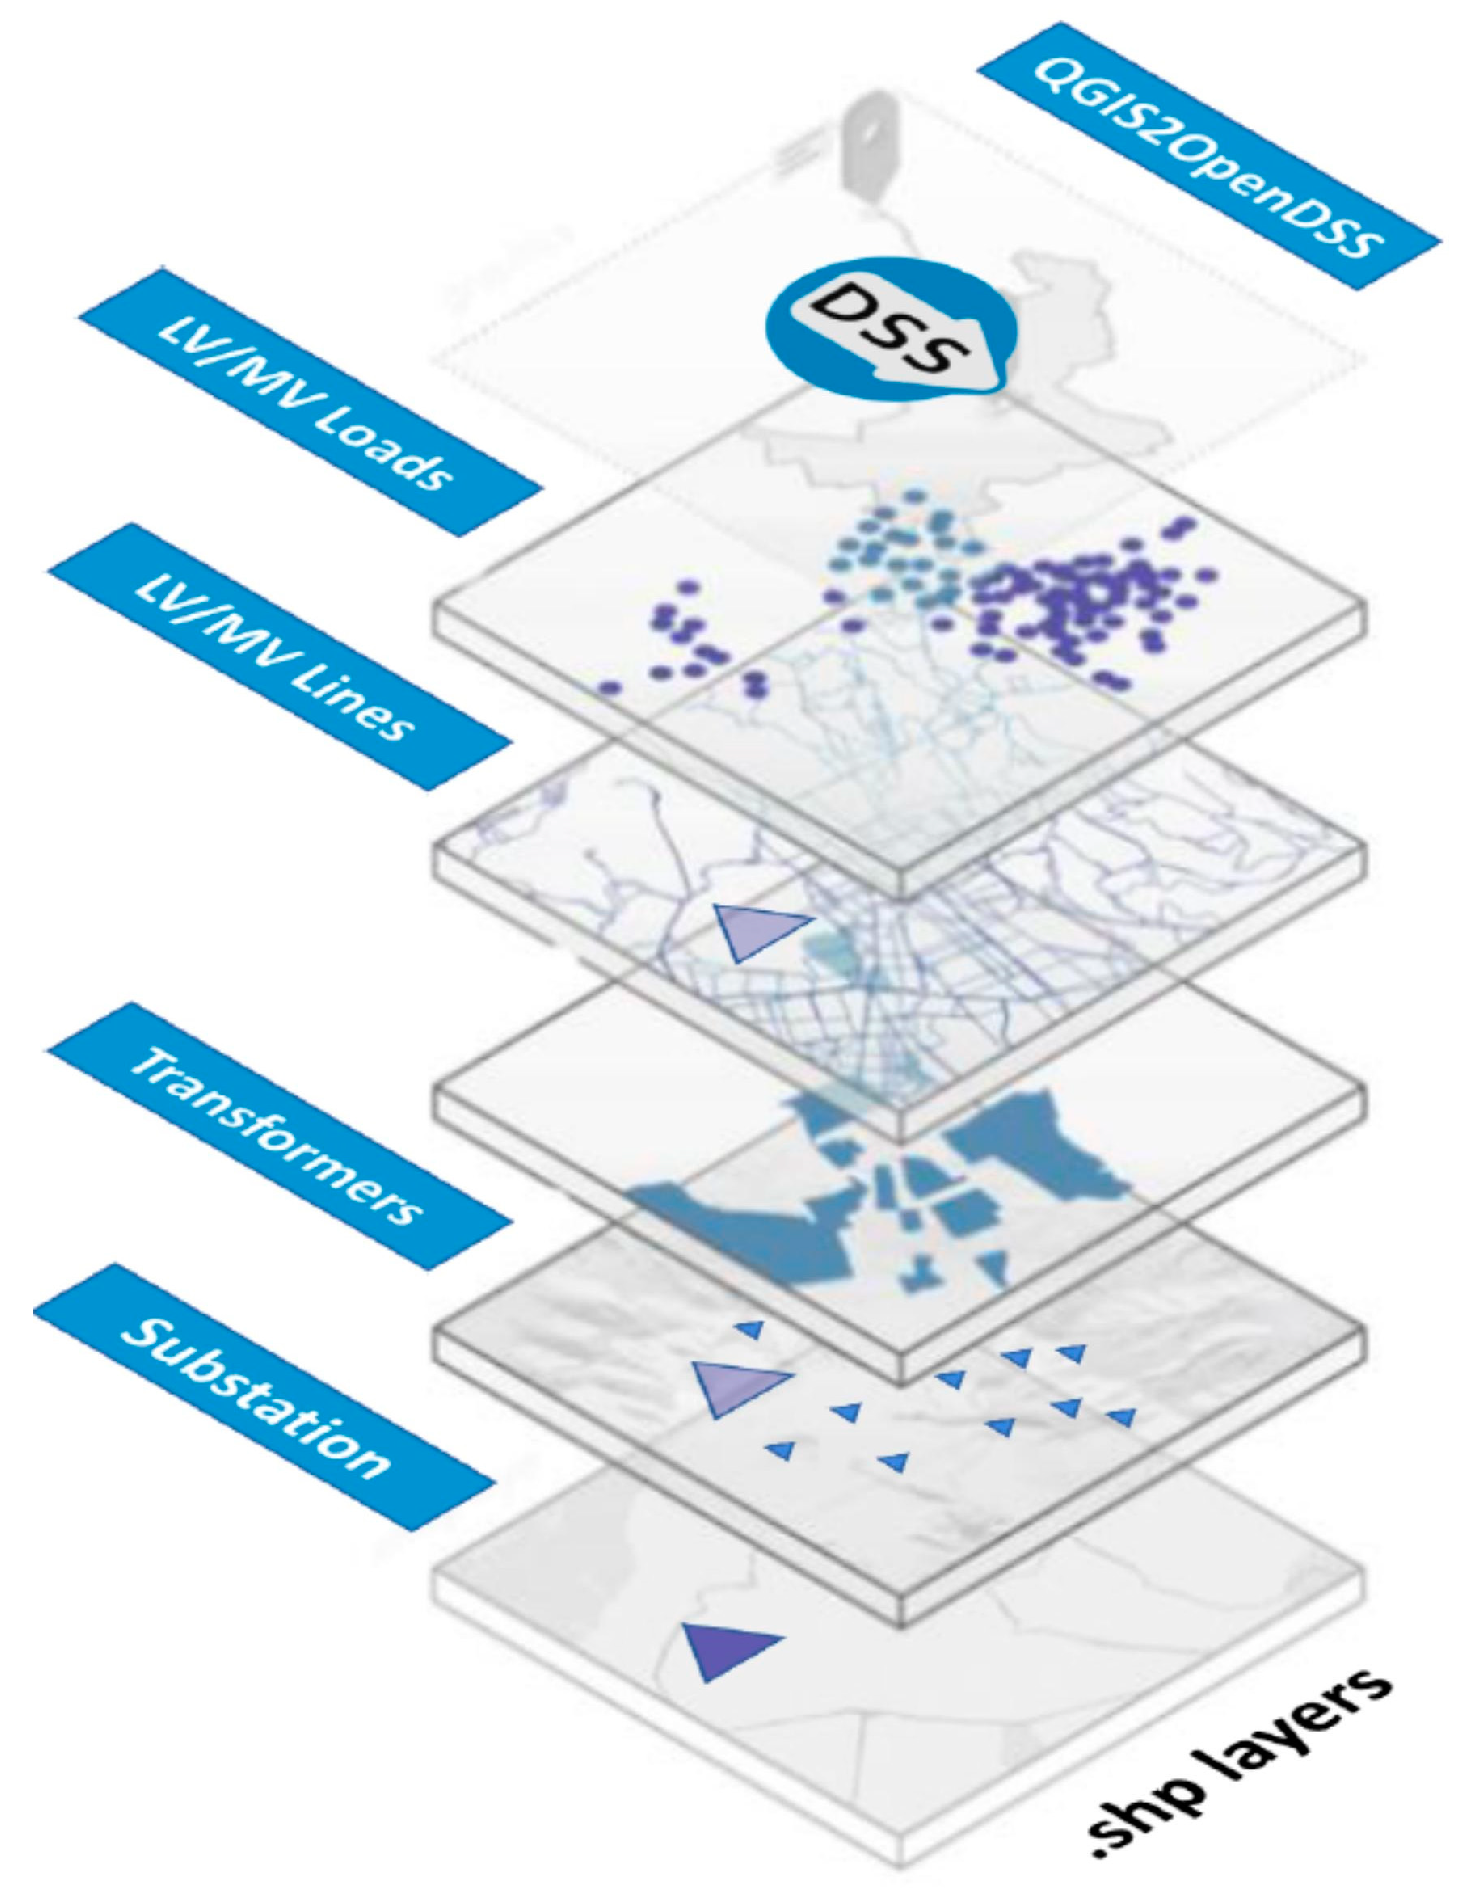
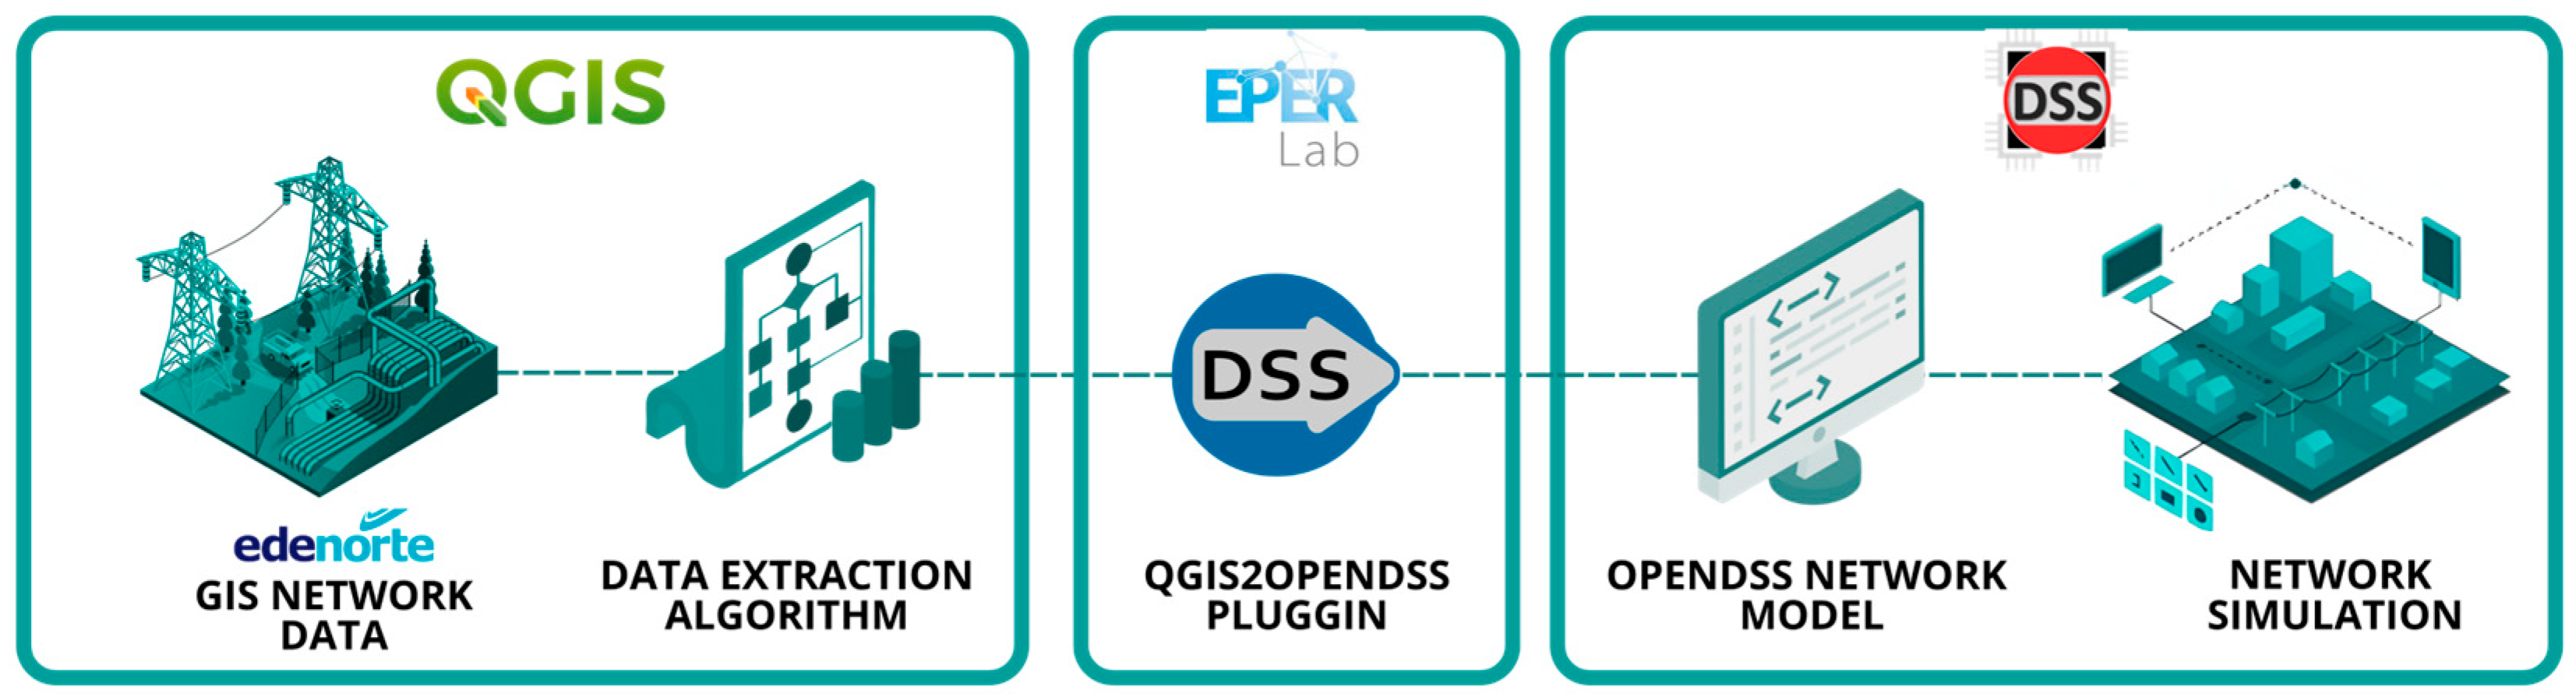
2.3. QGIS2OPENDSS Plugin
2.3.1. Data Requirements in QGIS2OpenDSS
- Overhead MV/LV Lines
- NEUTMAT: Neutral conductor material (CU, AAC, AAAC, ACSR).
- NEUTZIZ: Neutral conductor gauge—Can be specified in AWG, mm2, MCM.
- PHASEMAT: Phase conductor material (CU, AAC, AAAC, ACSR).
- PHASESIZ: Phase conductor gauge—Can be specified in AWG, mm2, MCM.
- LINEGEO: Geometry of the line—These data characterize the geometry used in the conductors. Only one letter is used to indicate the type (H—Horizontal, B- Biphasic, V-Vertical, T-Triangular).
- PHASEDESIG: Designation of the phases. The user can use letters or numbers as encoding.
- NOMVOLT: Coding for nominal voltage. The user must select one of the predefined codes for the voltage selection.
- Small Scale DERs (PV)
- TECH: Distributed generator type (PV, hydro, wind).
- KVA: Generator installed power in kVA.
- CURVE1: Irradiance curve file name for photovoltaic systems, must include the extension.
- Curve2: File name of the temperature curve for photovoltaic systems.

| Required Attributes | Optional Attributes |
|---|---|
| Tech | X1 |
| KVA | Y1 |
| PHASEMAT | |
| Curve 1 (Irradiance) | |
| Curve 2 (temperature) |
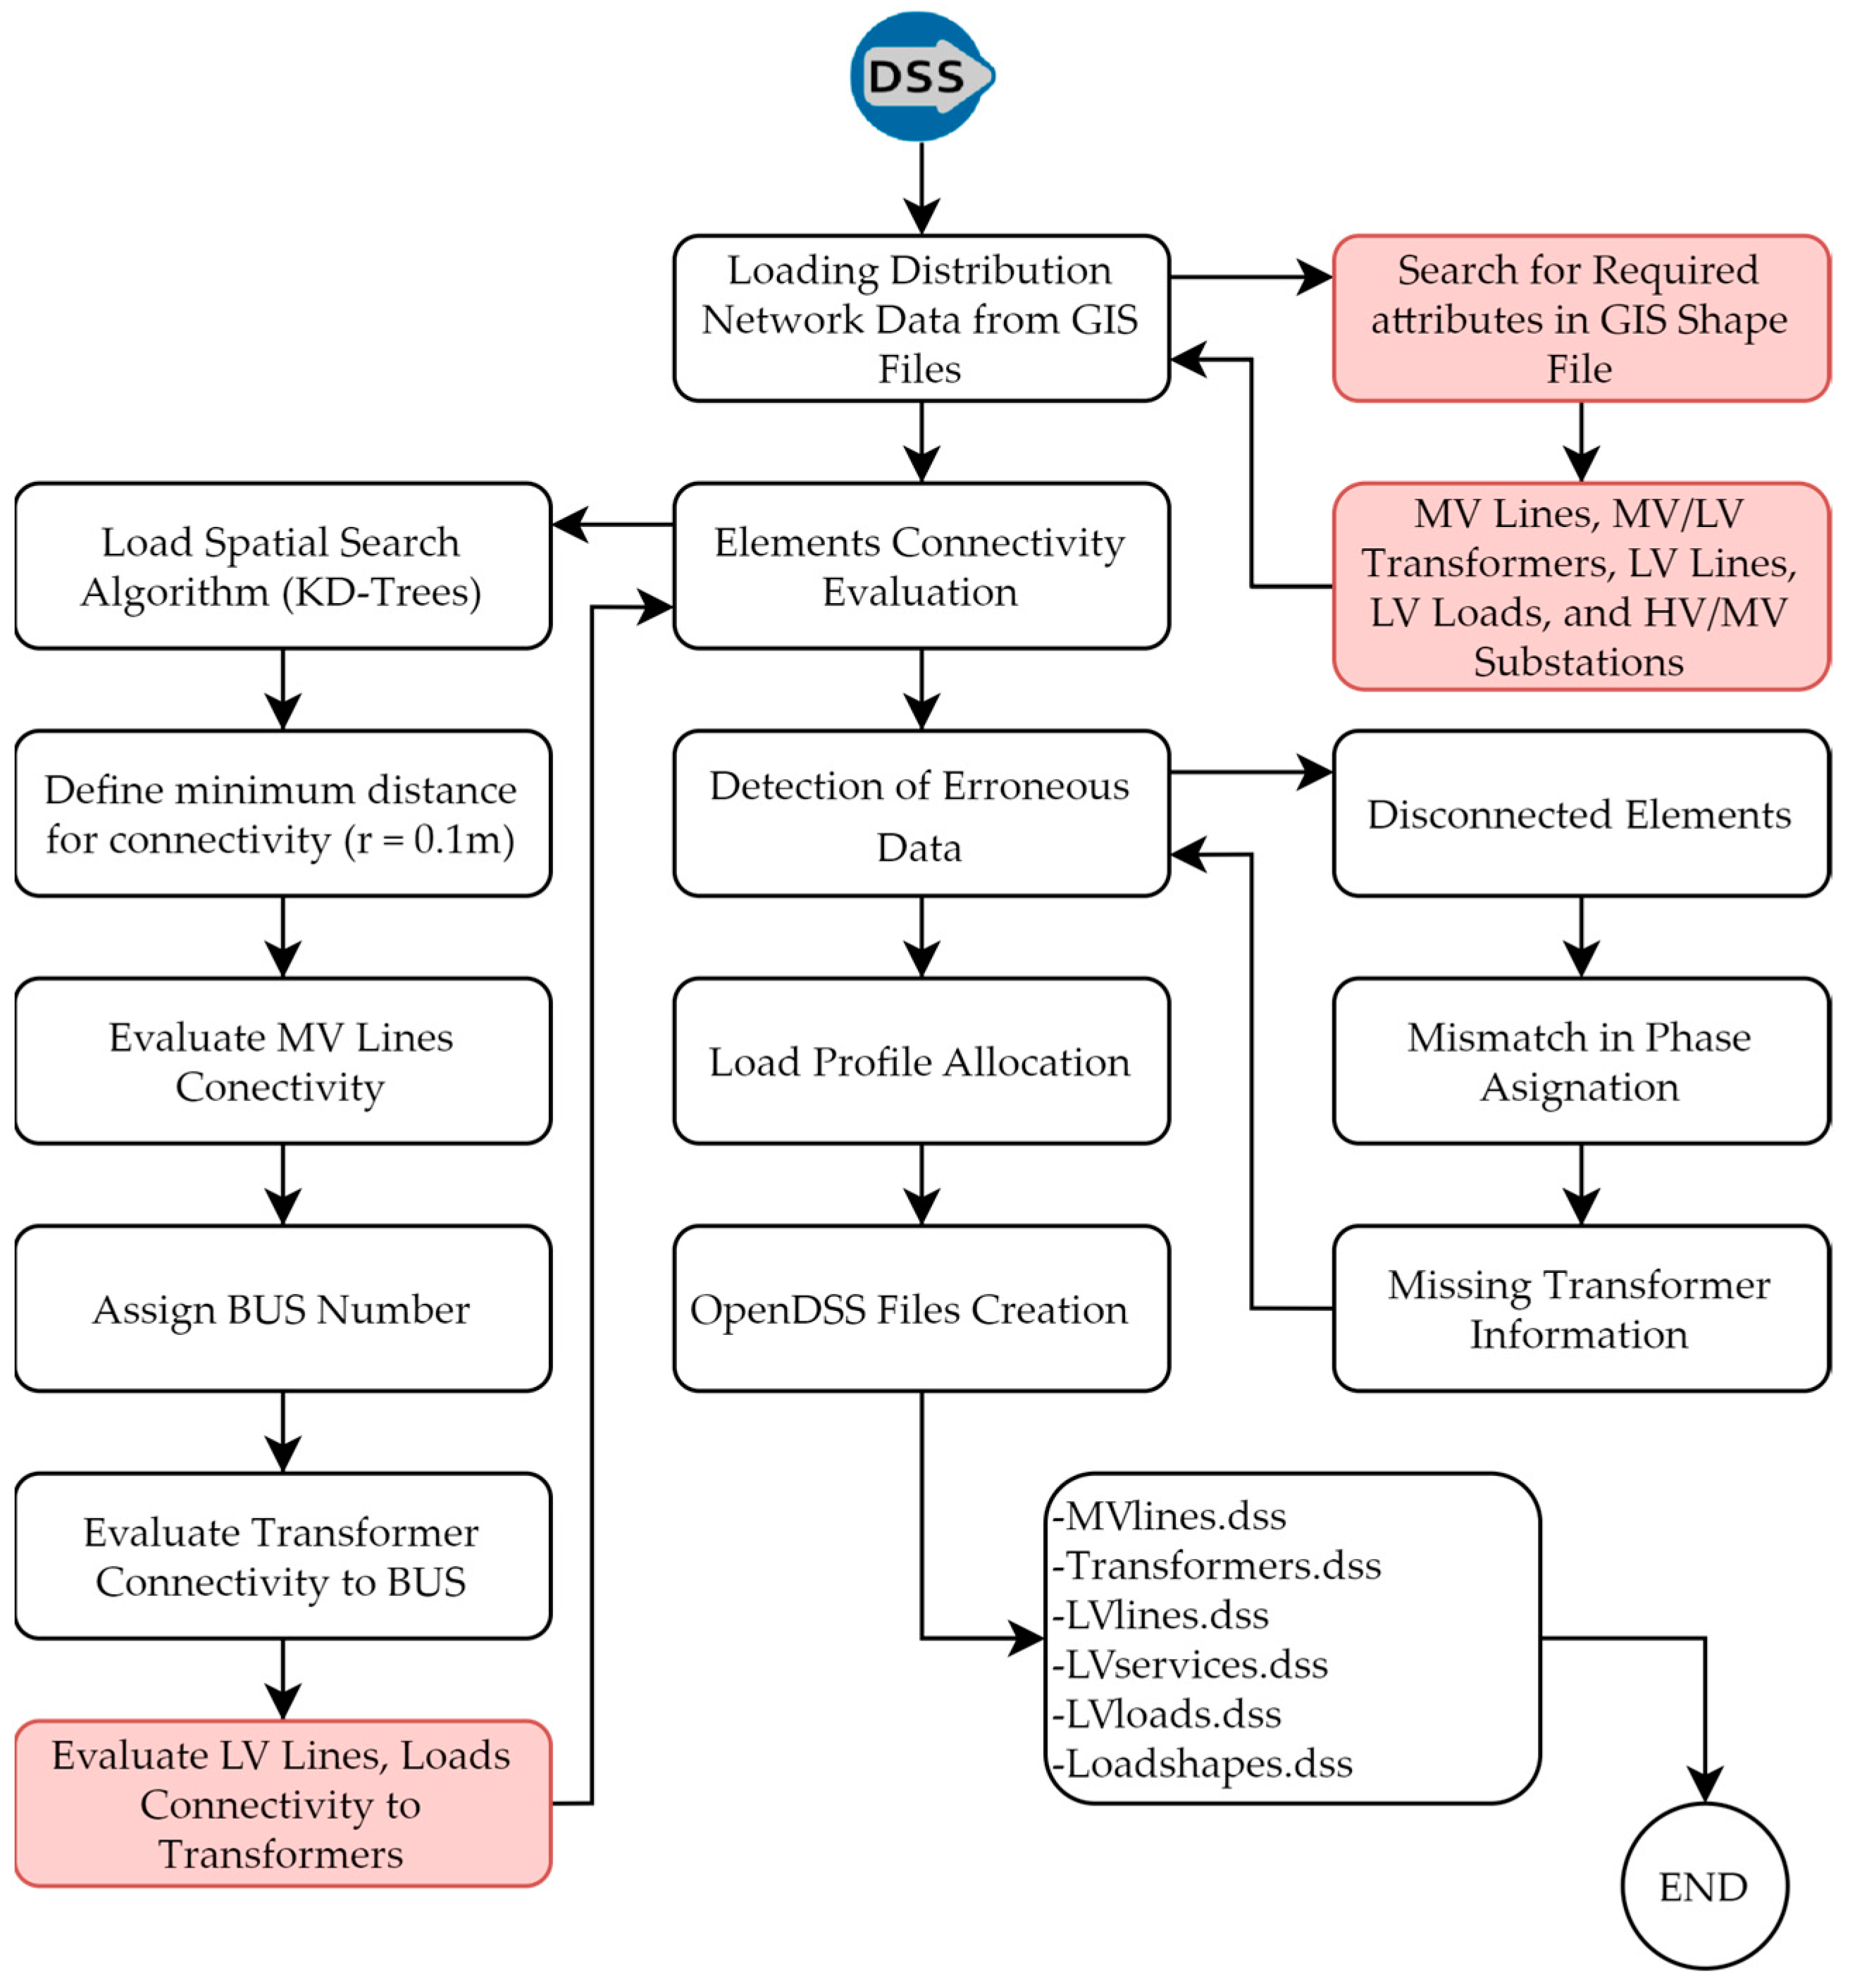
2.3.2. Erroneous Data
- Detecting disconnected elements due to small coordinate displacements.
- Wrong phase designation: The plugin verifies that the elements being connected have the correct phase designation.
- Unknown transformer model capacity or nominal voltage:
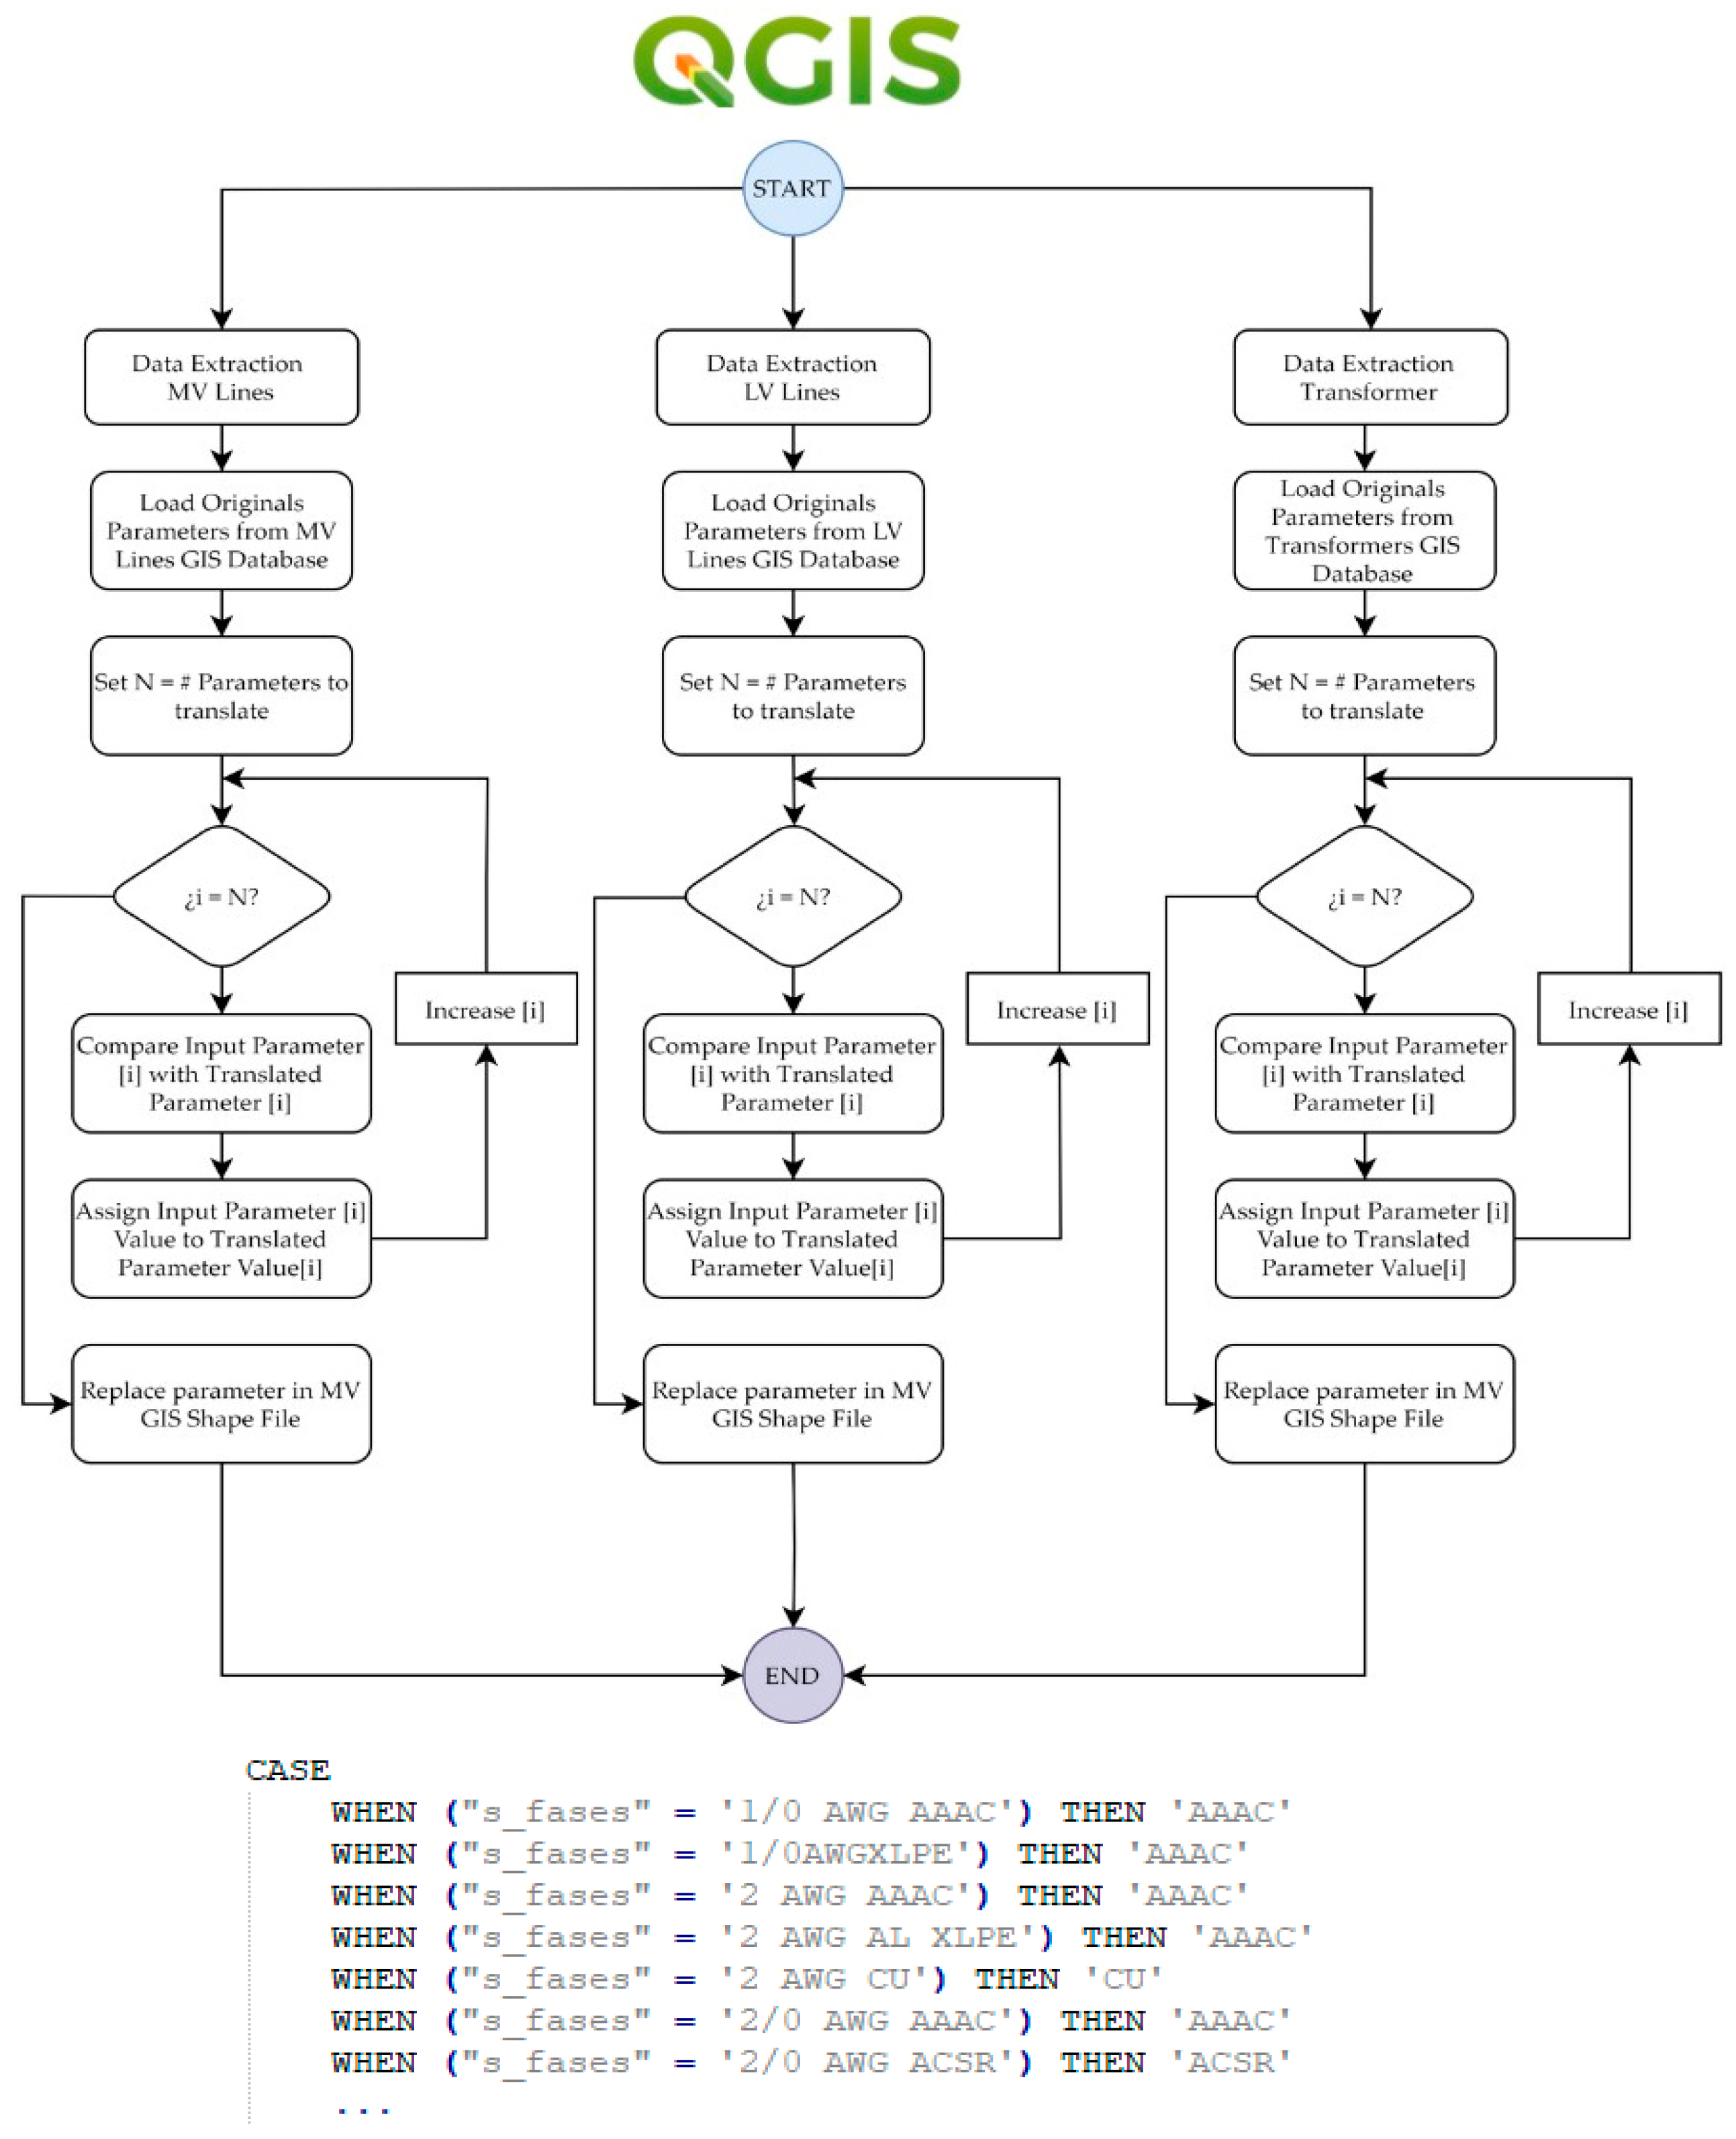
2.3.3. Adaptations and Updates to the Plugin for the Dominican Republic Case Study
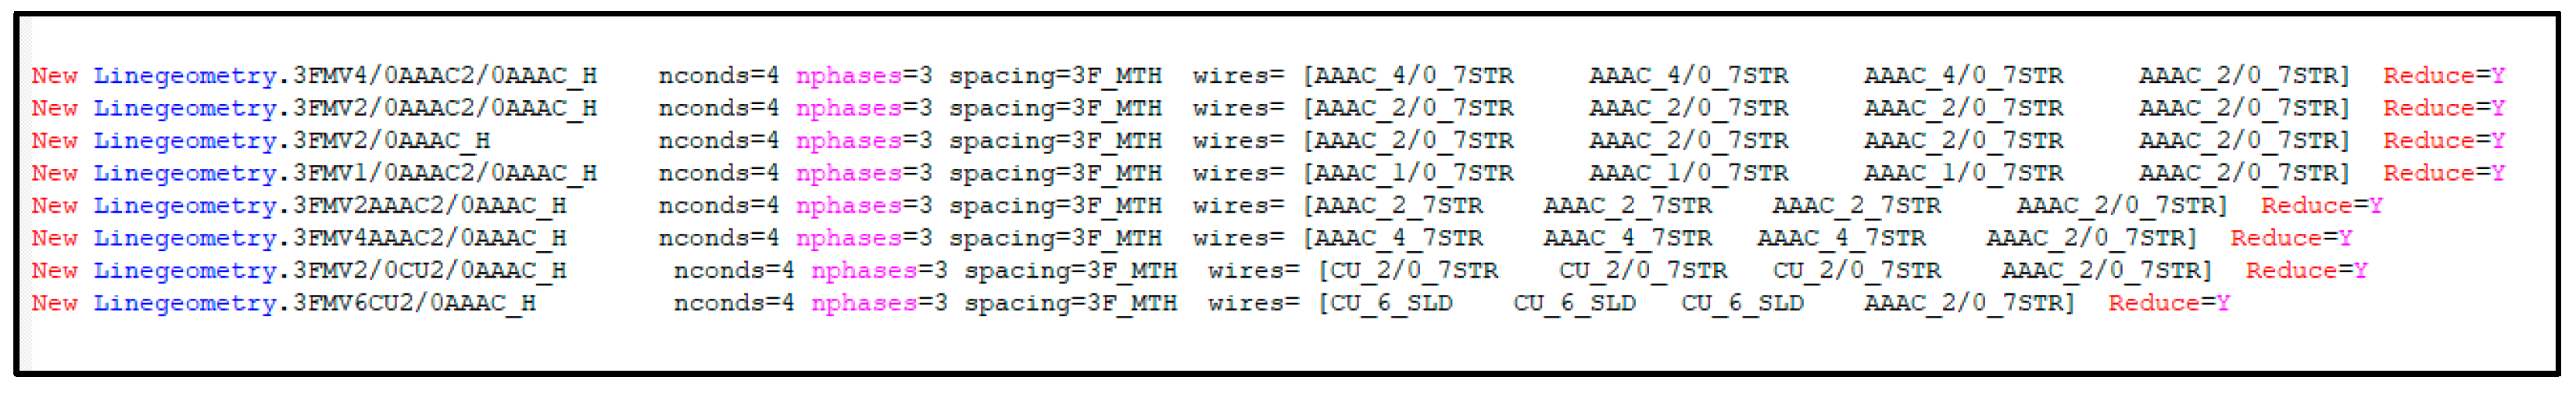
- Line configuration library.
- List of reactance and resistance for single phase three winding transformers.
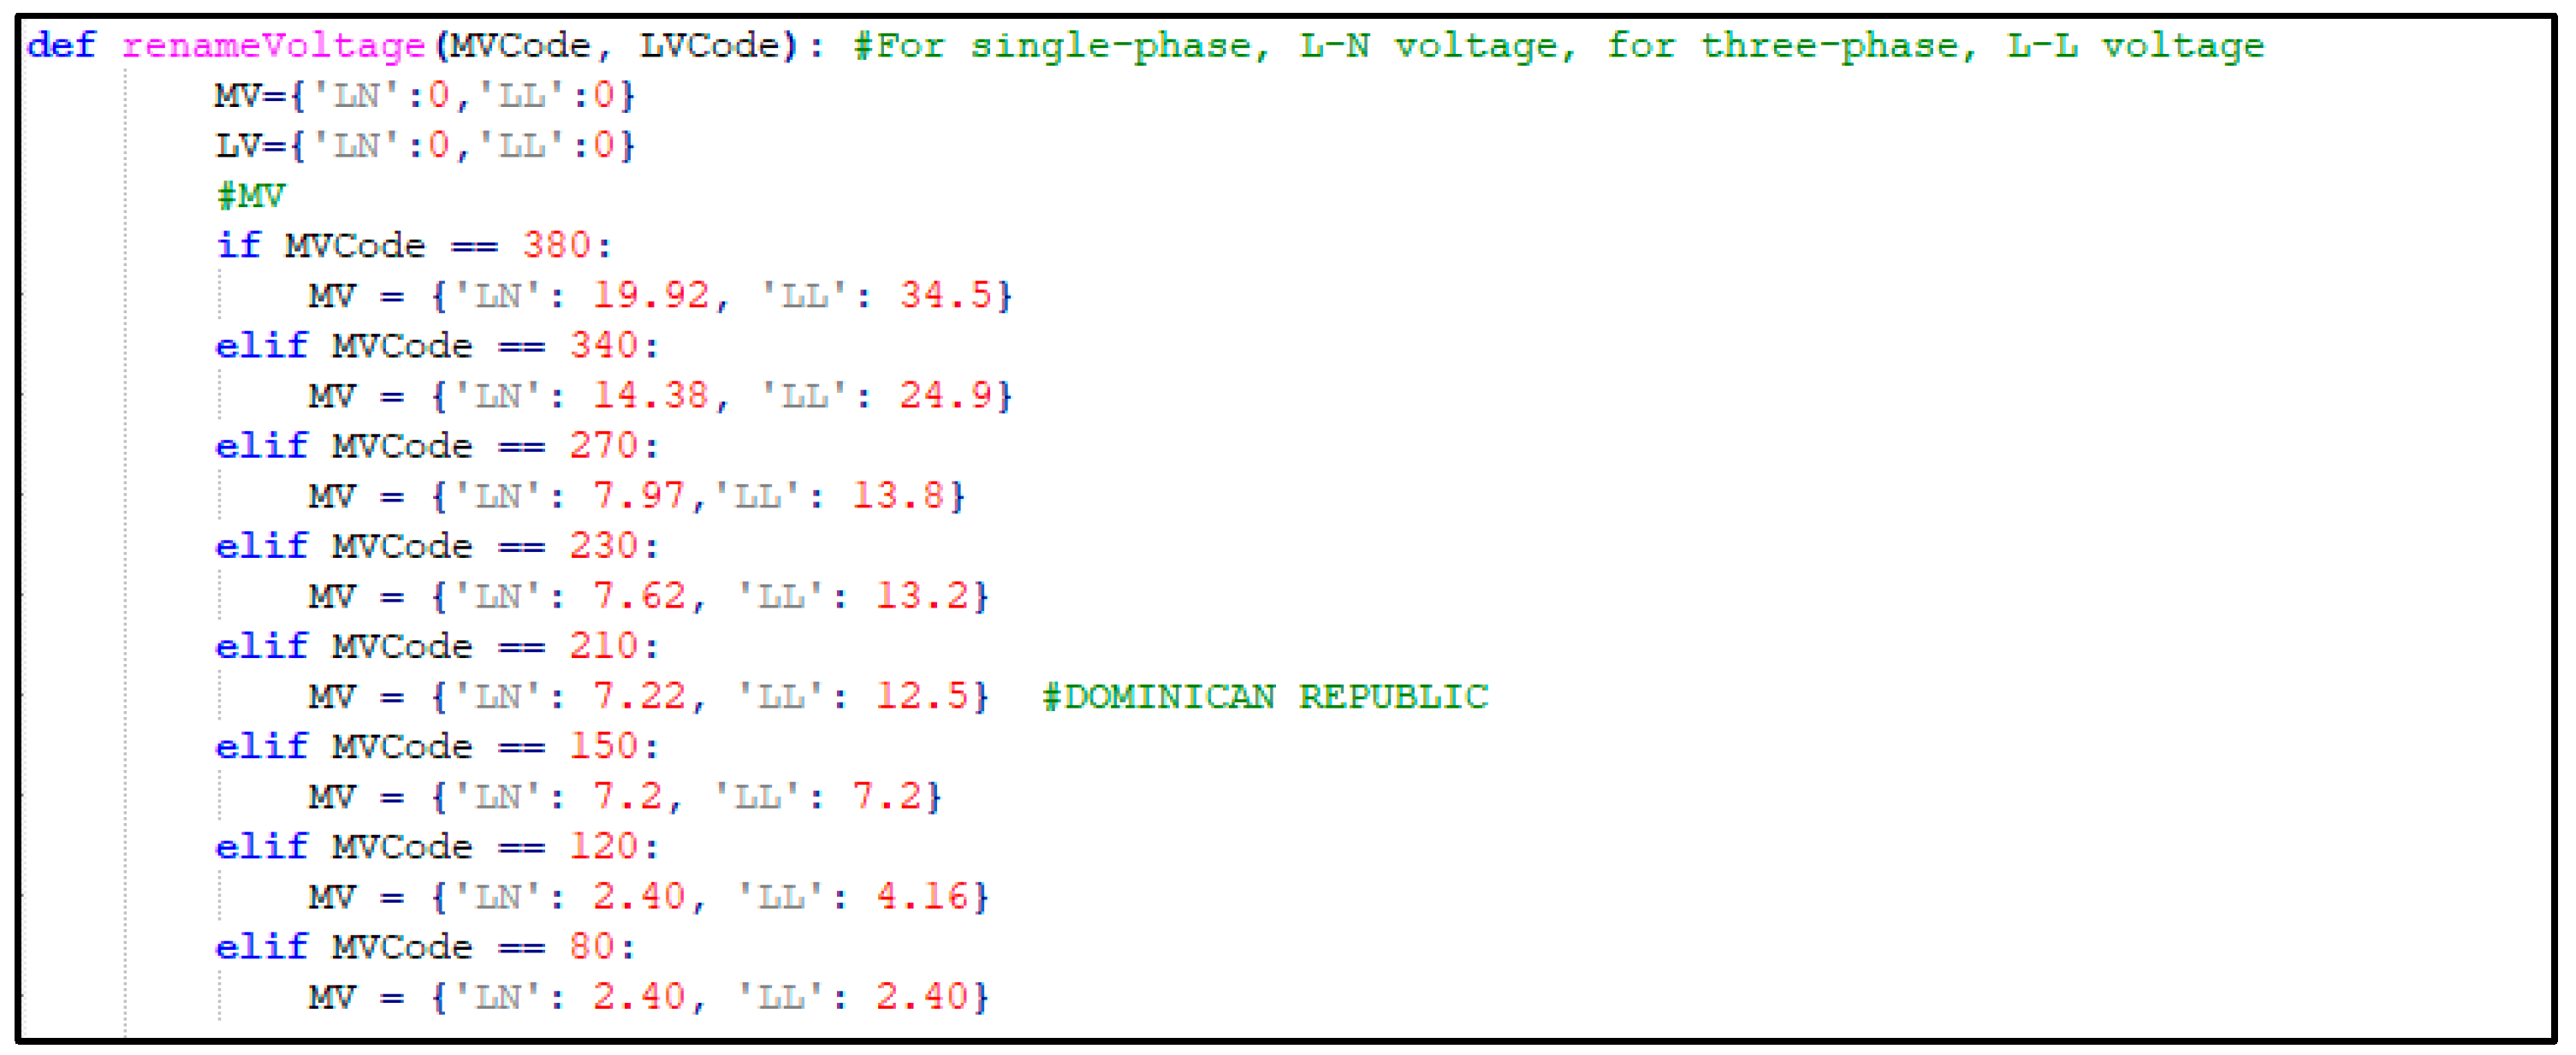
- Function related to single-phase L-N voltage and three-phase L-L voltage assignation.
- Functions related to service connection to loads.
3. Case Study: Distribution Network Data Extraction Process
4. Demonstration
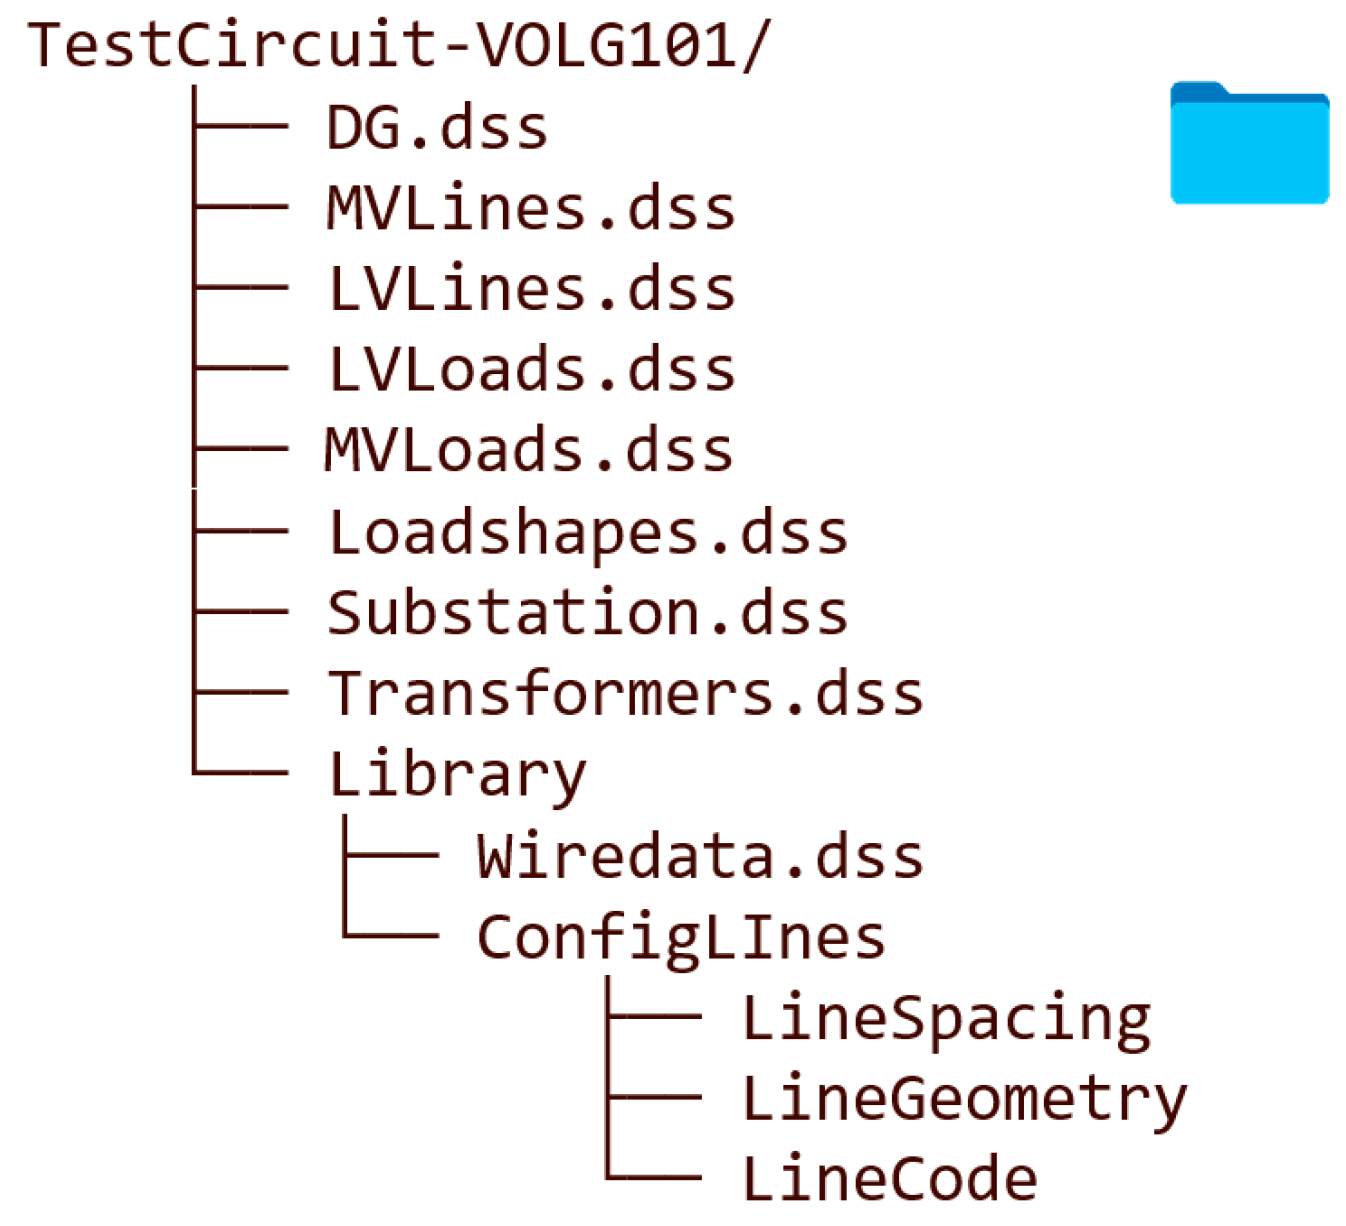
QGIS2OpenDSS File Creator
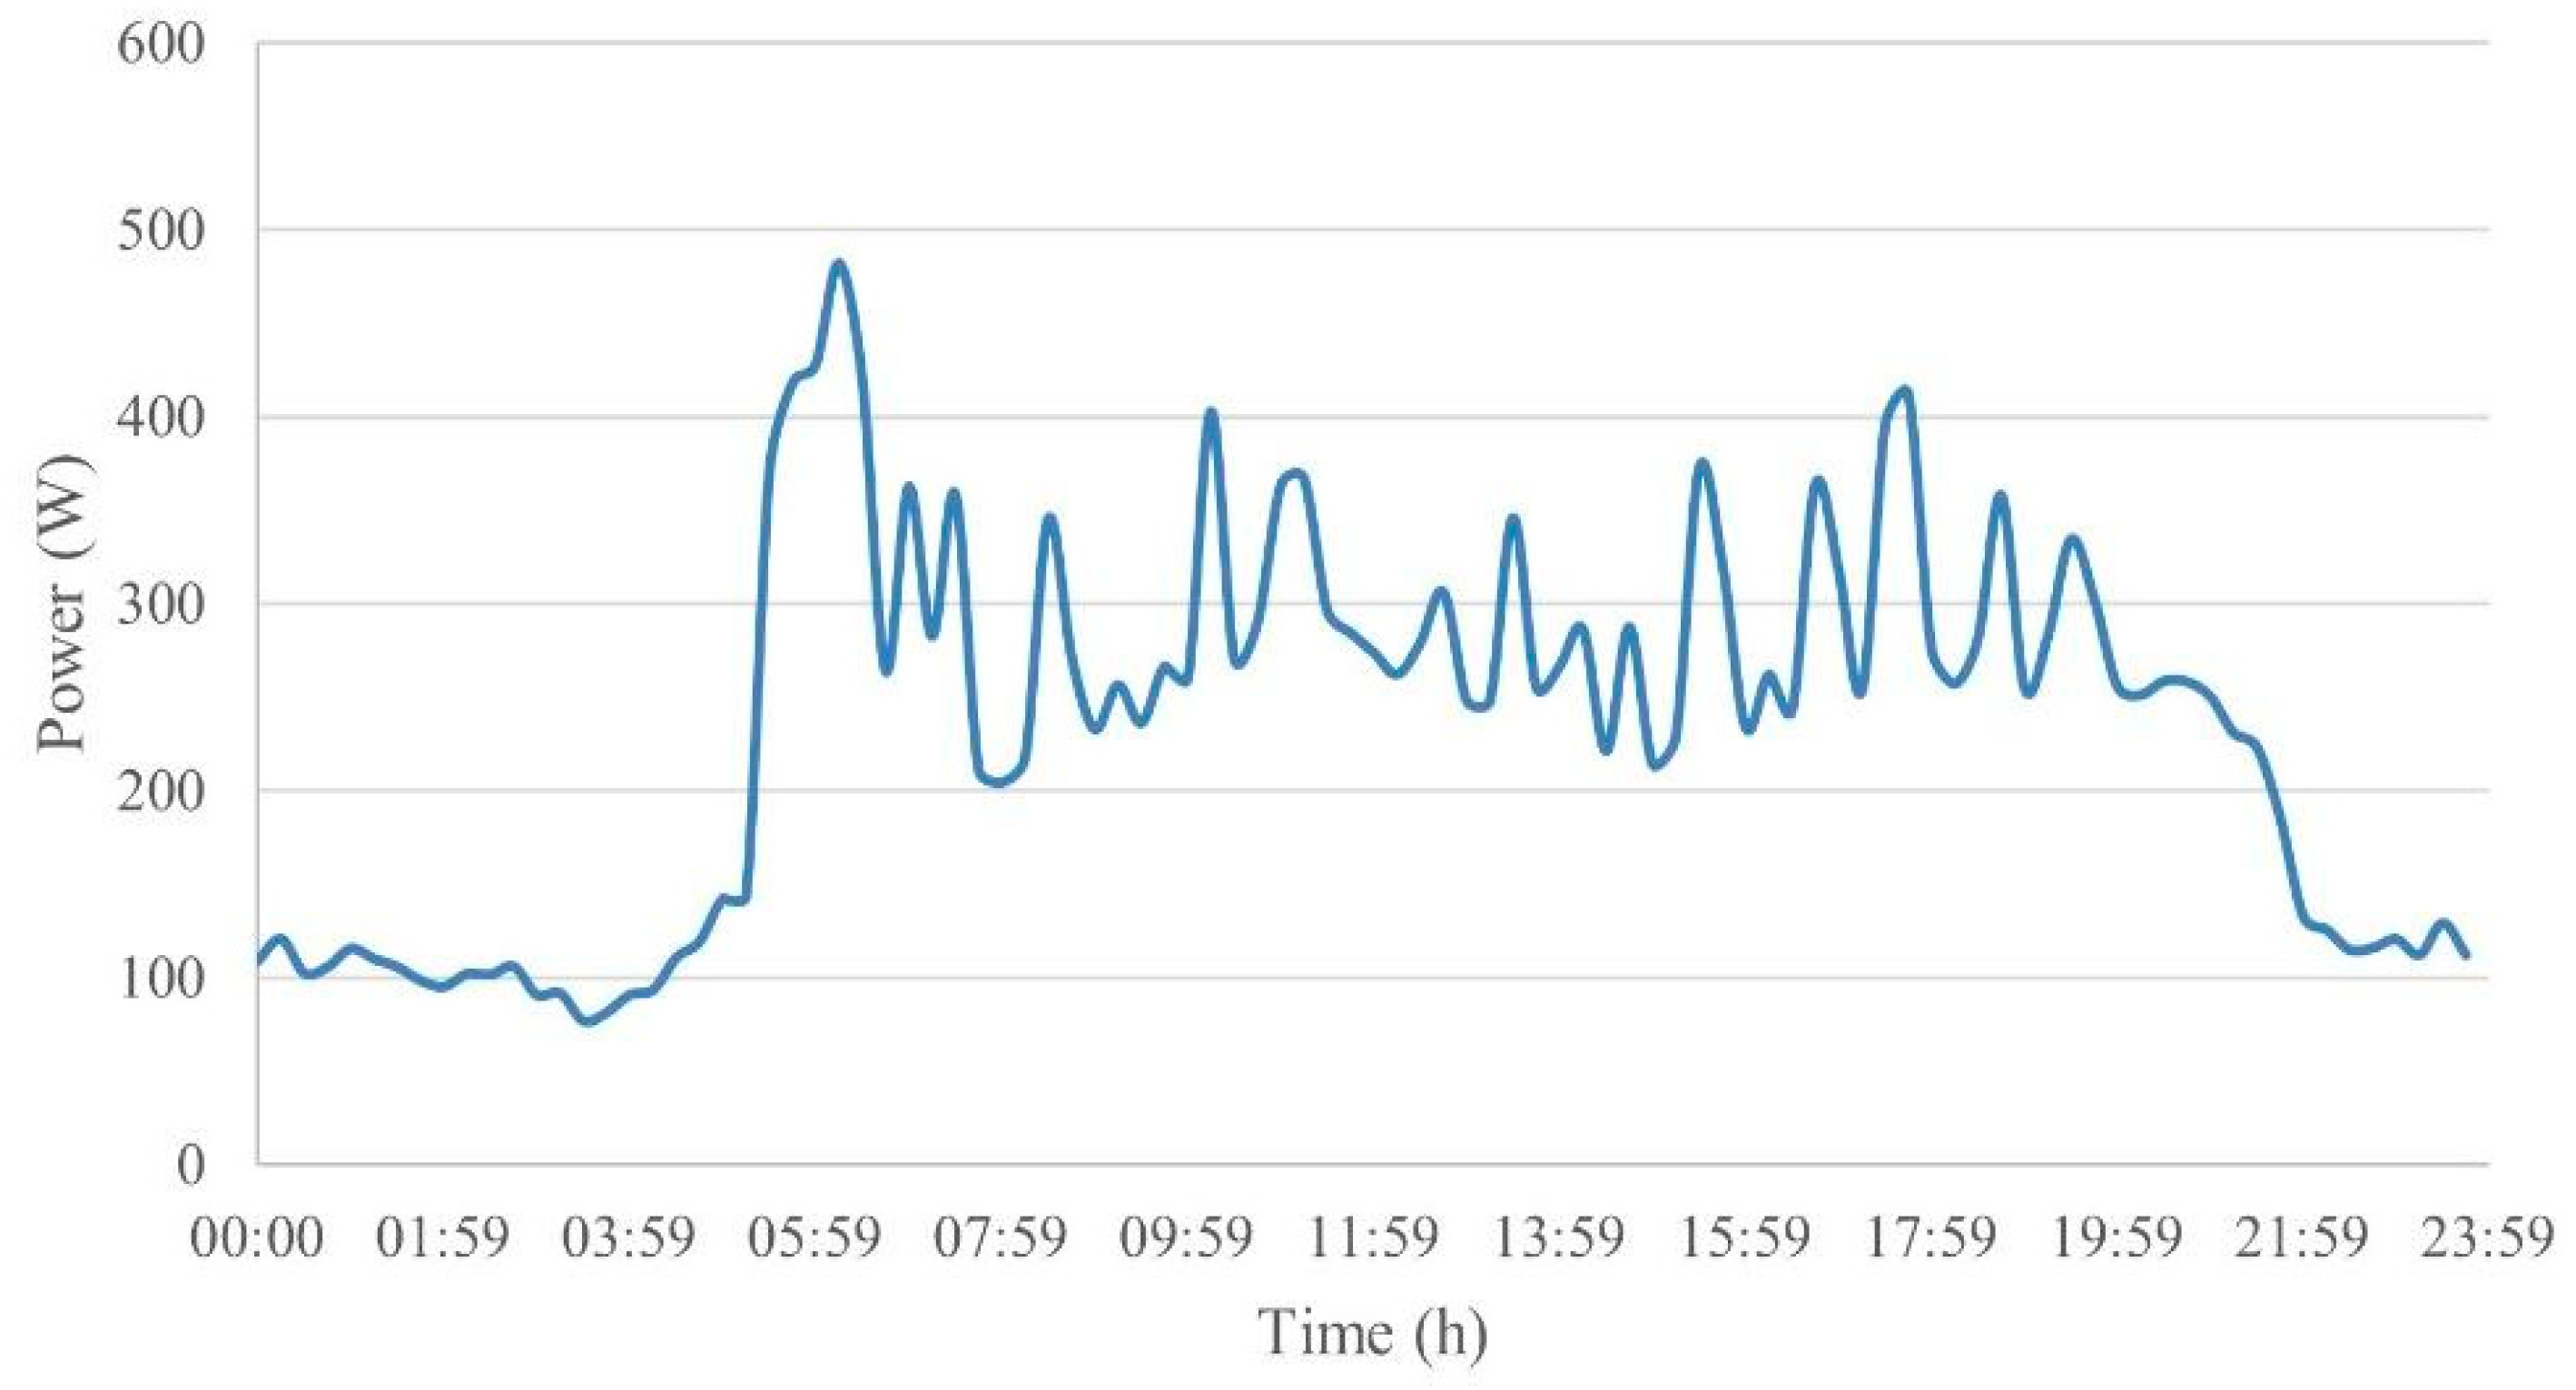
- DG.dss: Includes the bus name, phases, nominal voltage, connection type, power rating, irradiance, and temperature. Figure 11 shows the typical irradiance curve in Santiago used to model the PV generation.
- MVLines.dss: Details the connectivity of each MVline/cable segment, geometry of line/cable, and its length.
- LVLines.dss: Details the connectivity of each LV line/cable segment, geometry of line/cable, and its length.
- MV/LVLoads.dss: Indicates load location, type, nominal voltage, and power factor and the associated load-shape.
- Substation.dss: Provides information on the source bus, phases, connection, windings, power rating.
- Transformers.dss: Provides information on all transformers (e.g., losses, impedance, voltages, etc.).
- Wiredata: Database that contains the characteristics (name, resistance, diameter, and GMR, etc.) of each wire.
- ConfigLines: Database that contains the geometry (spacing, number of conductors, phases) of each line.
- Loadshapes: Provides the electrical behavior of a load along a given period.
5. Results and Discussion
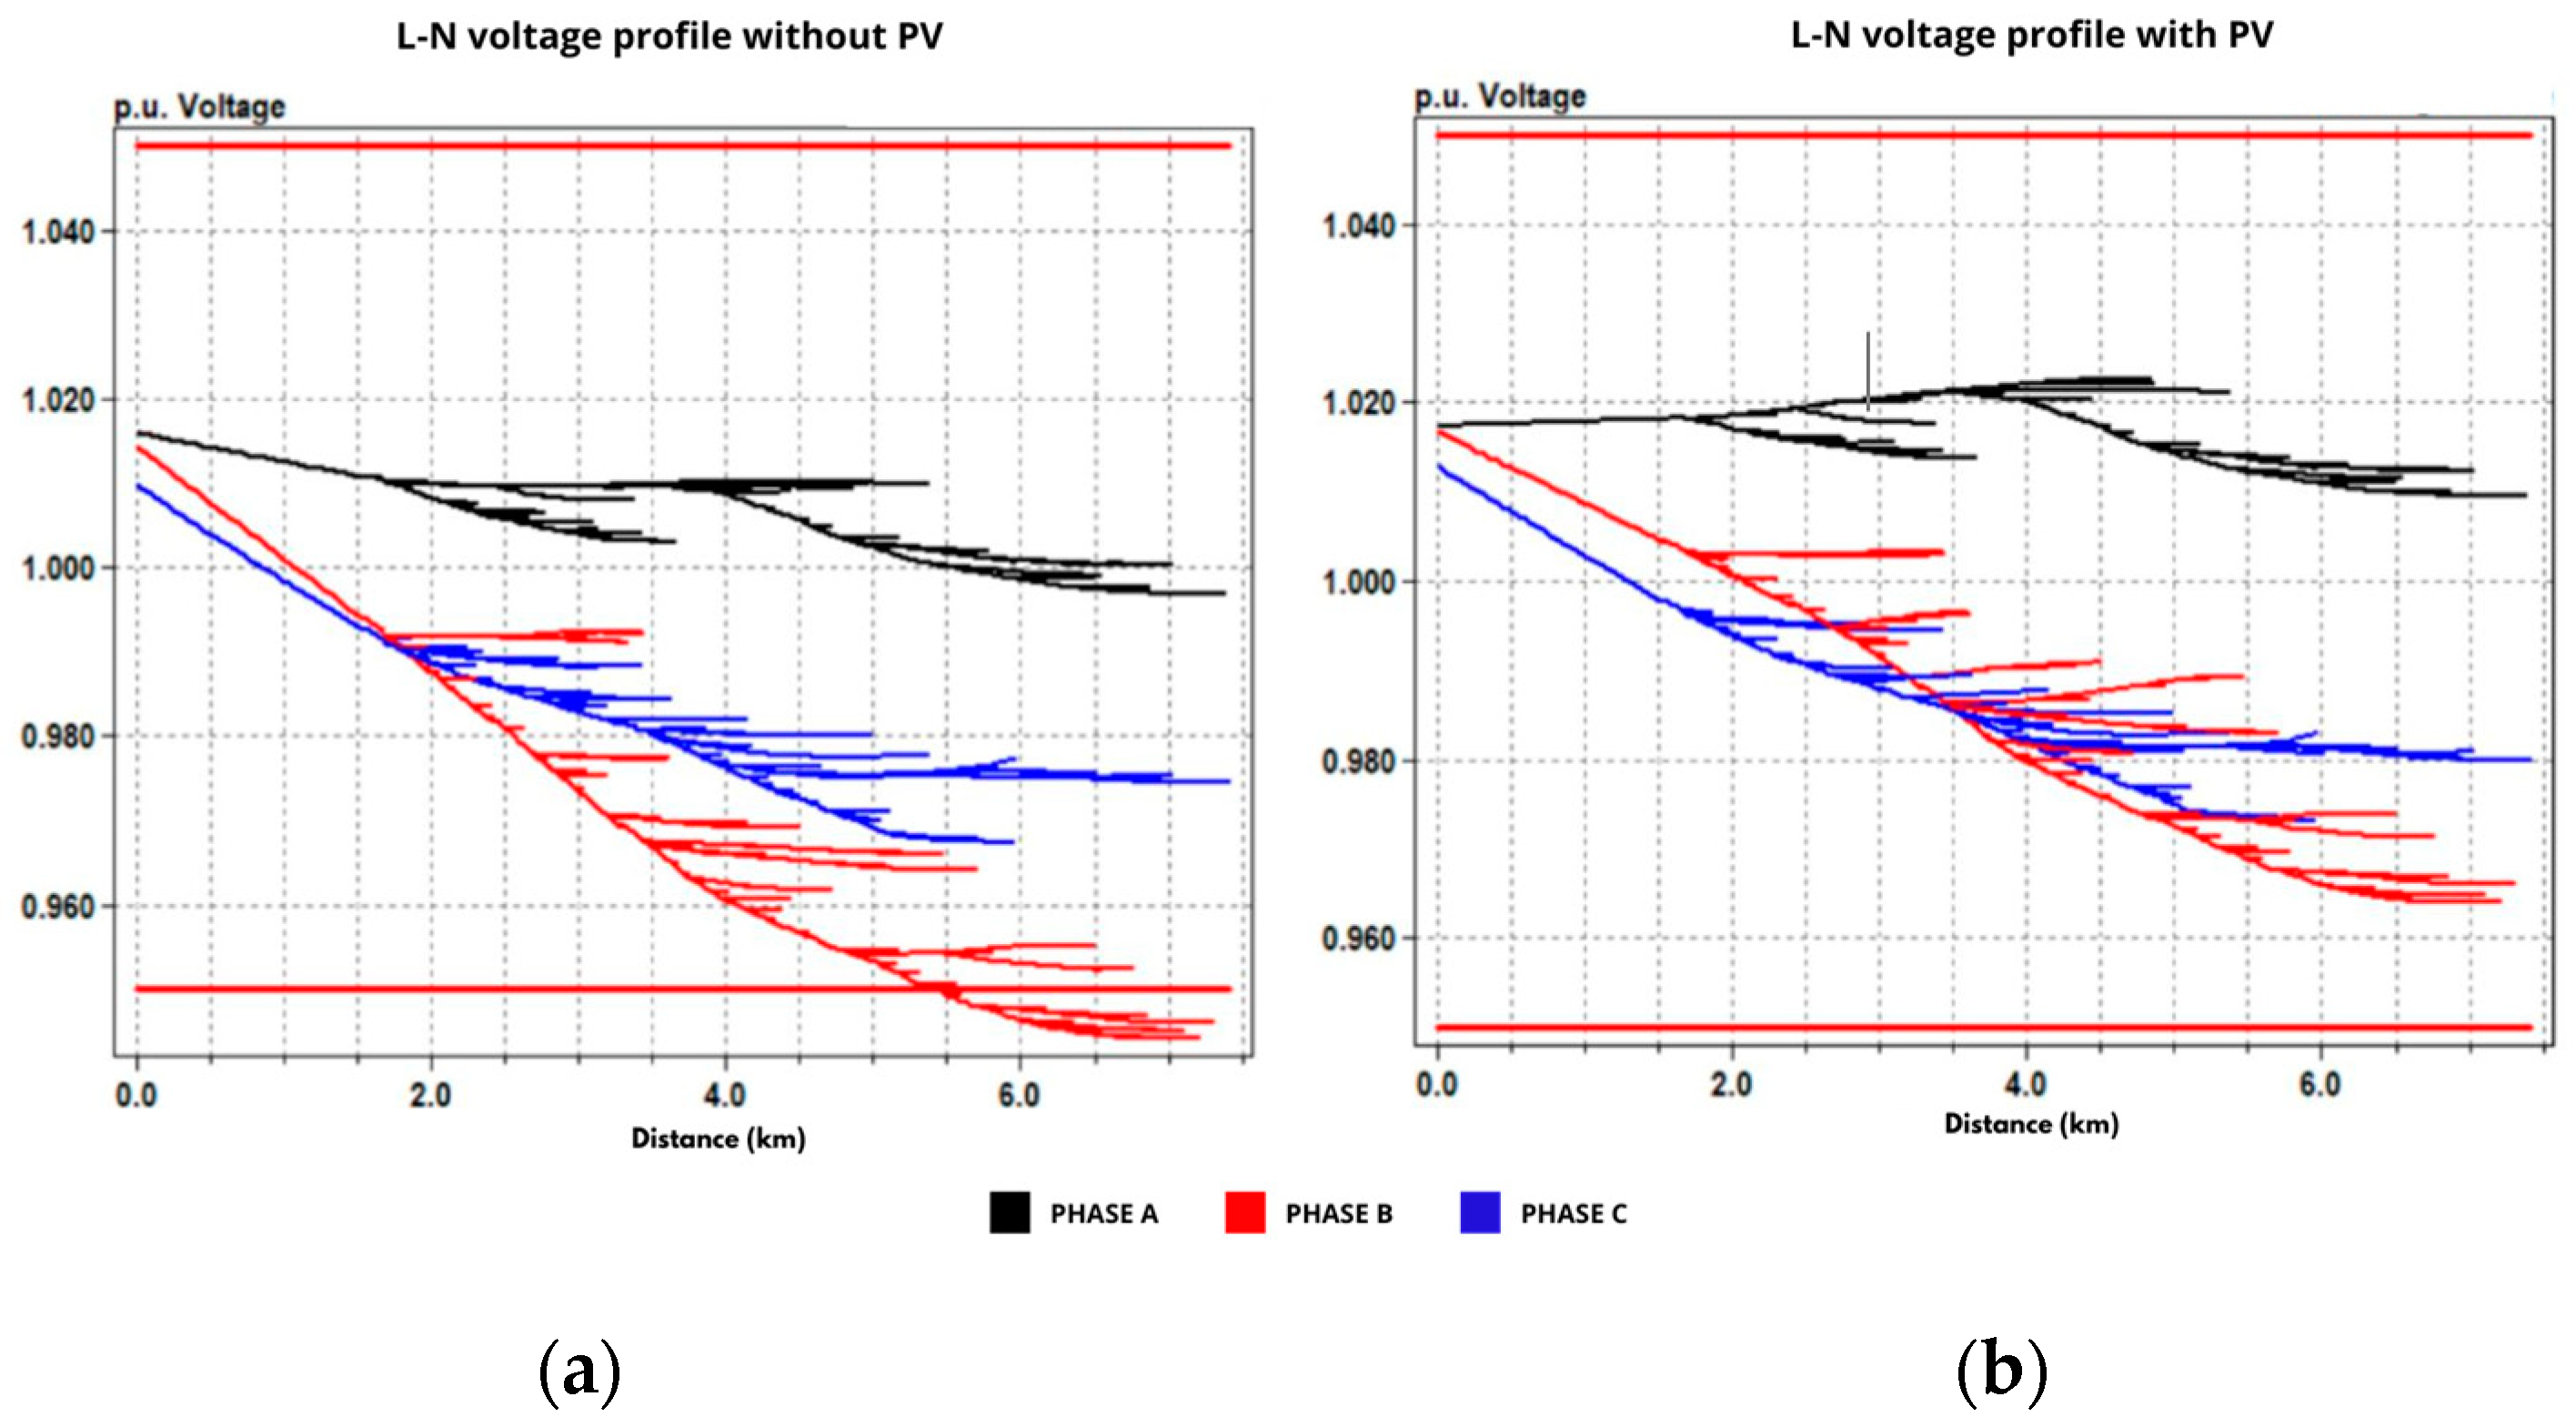
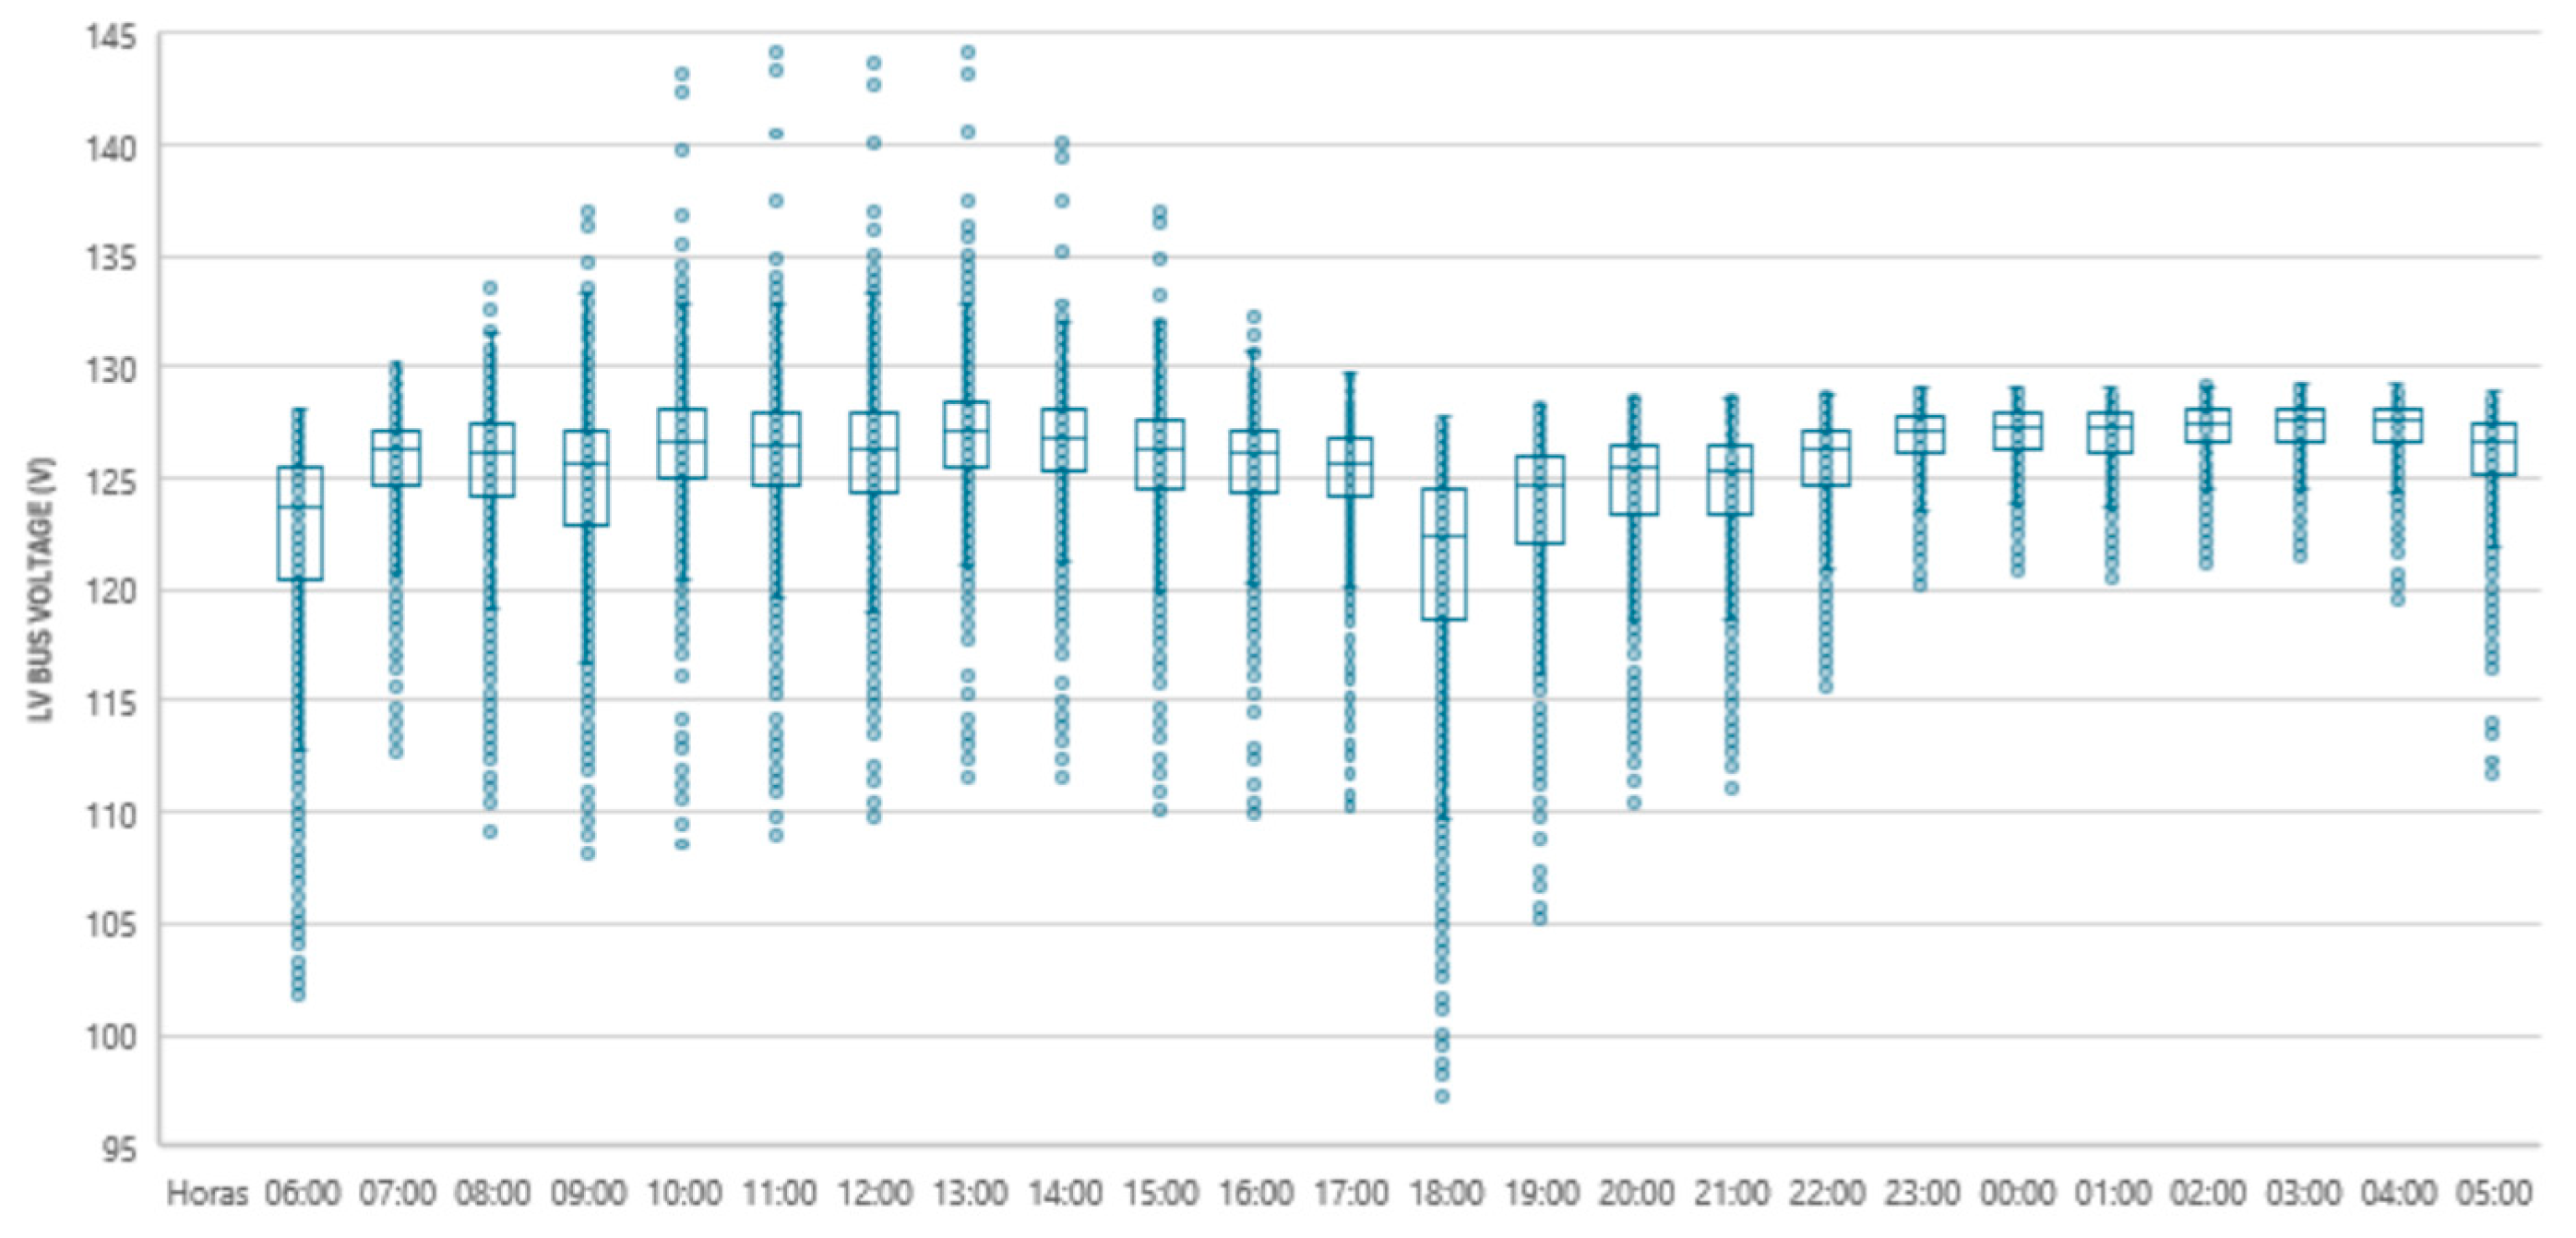
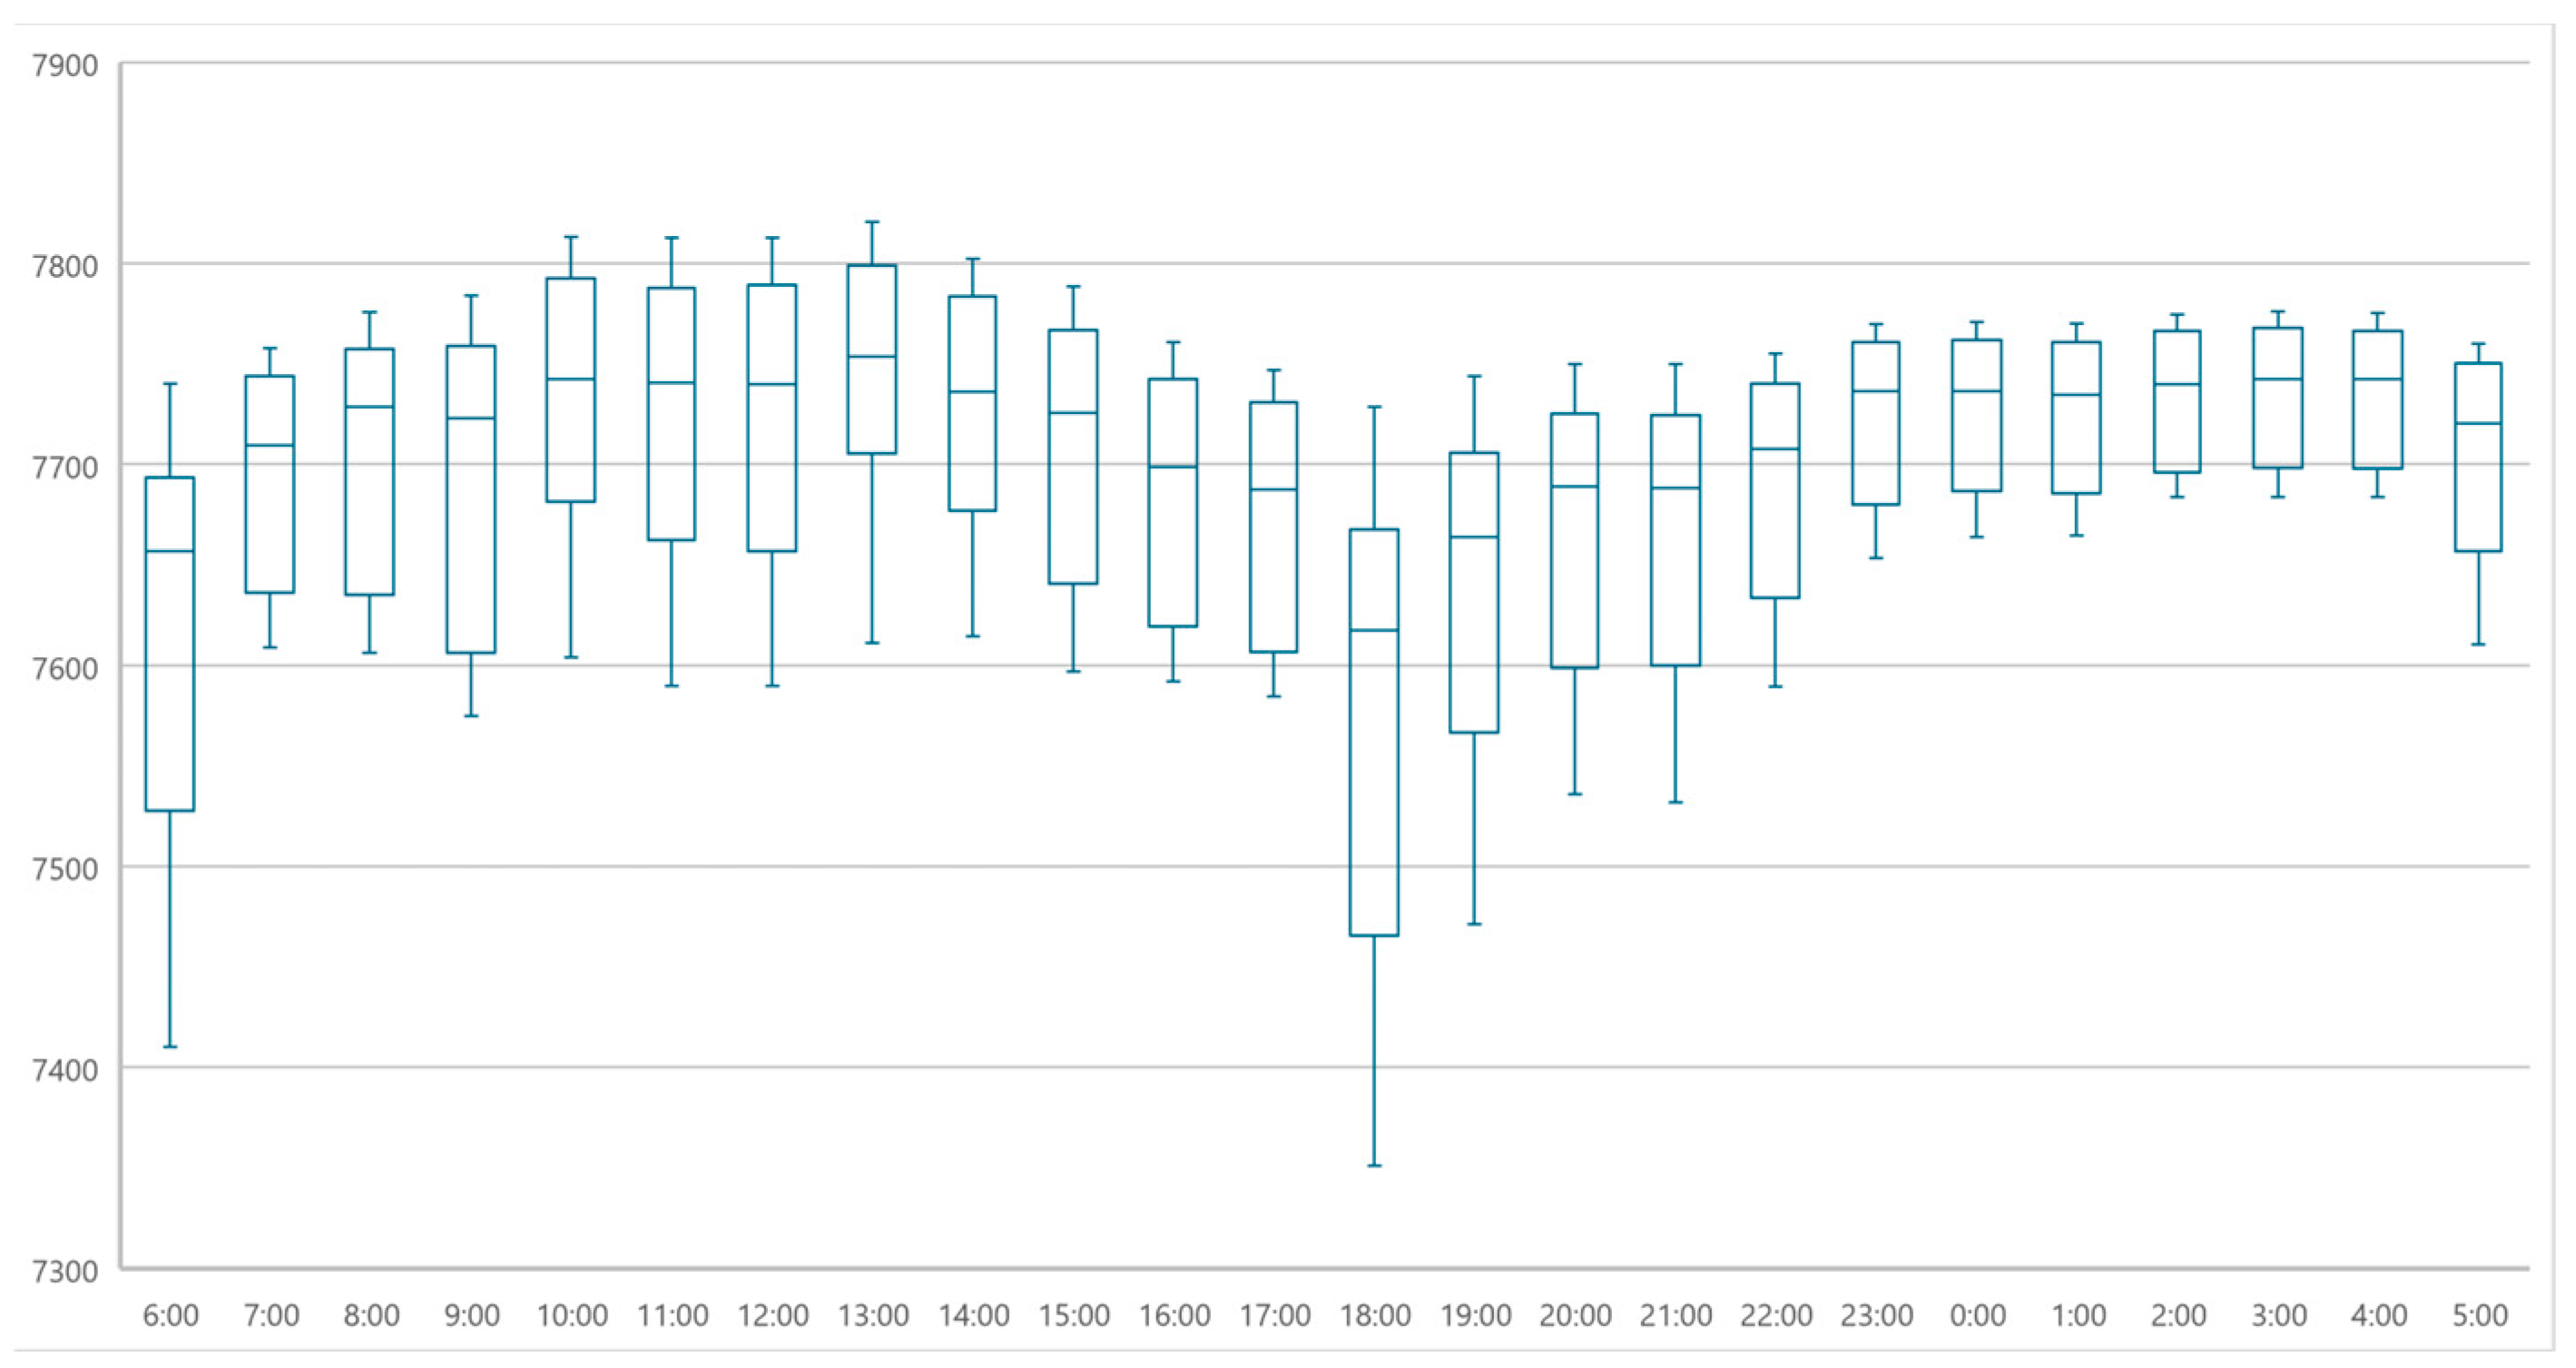
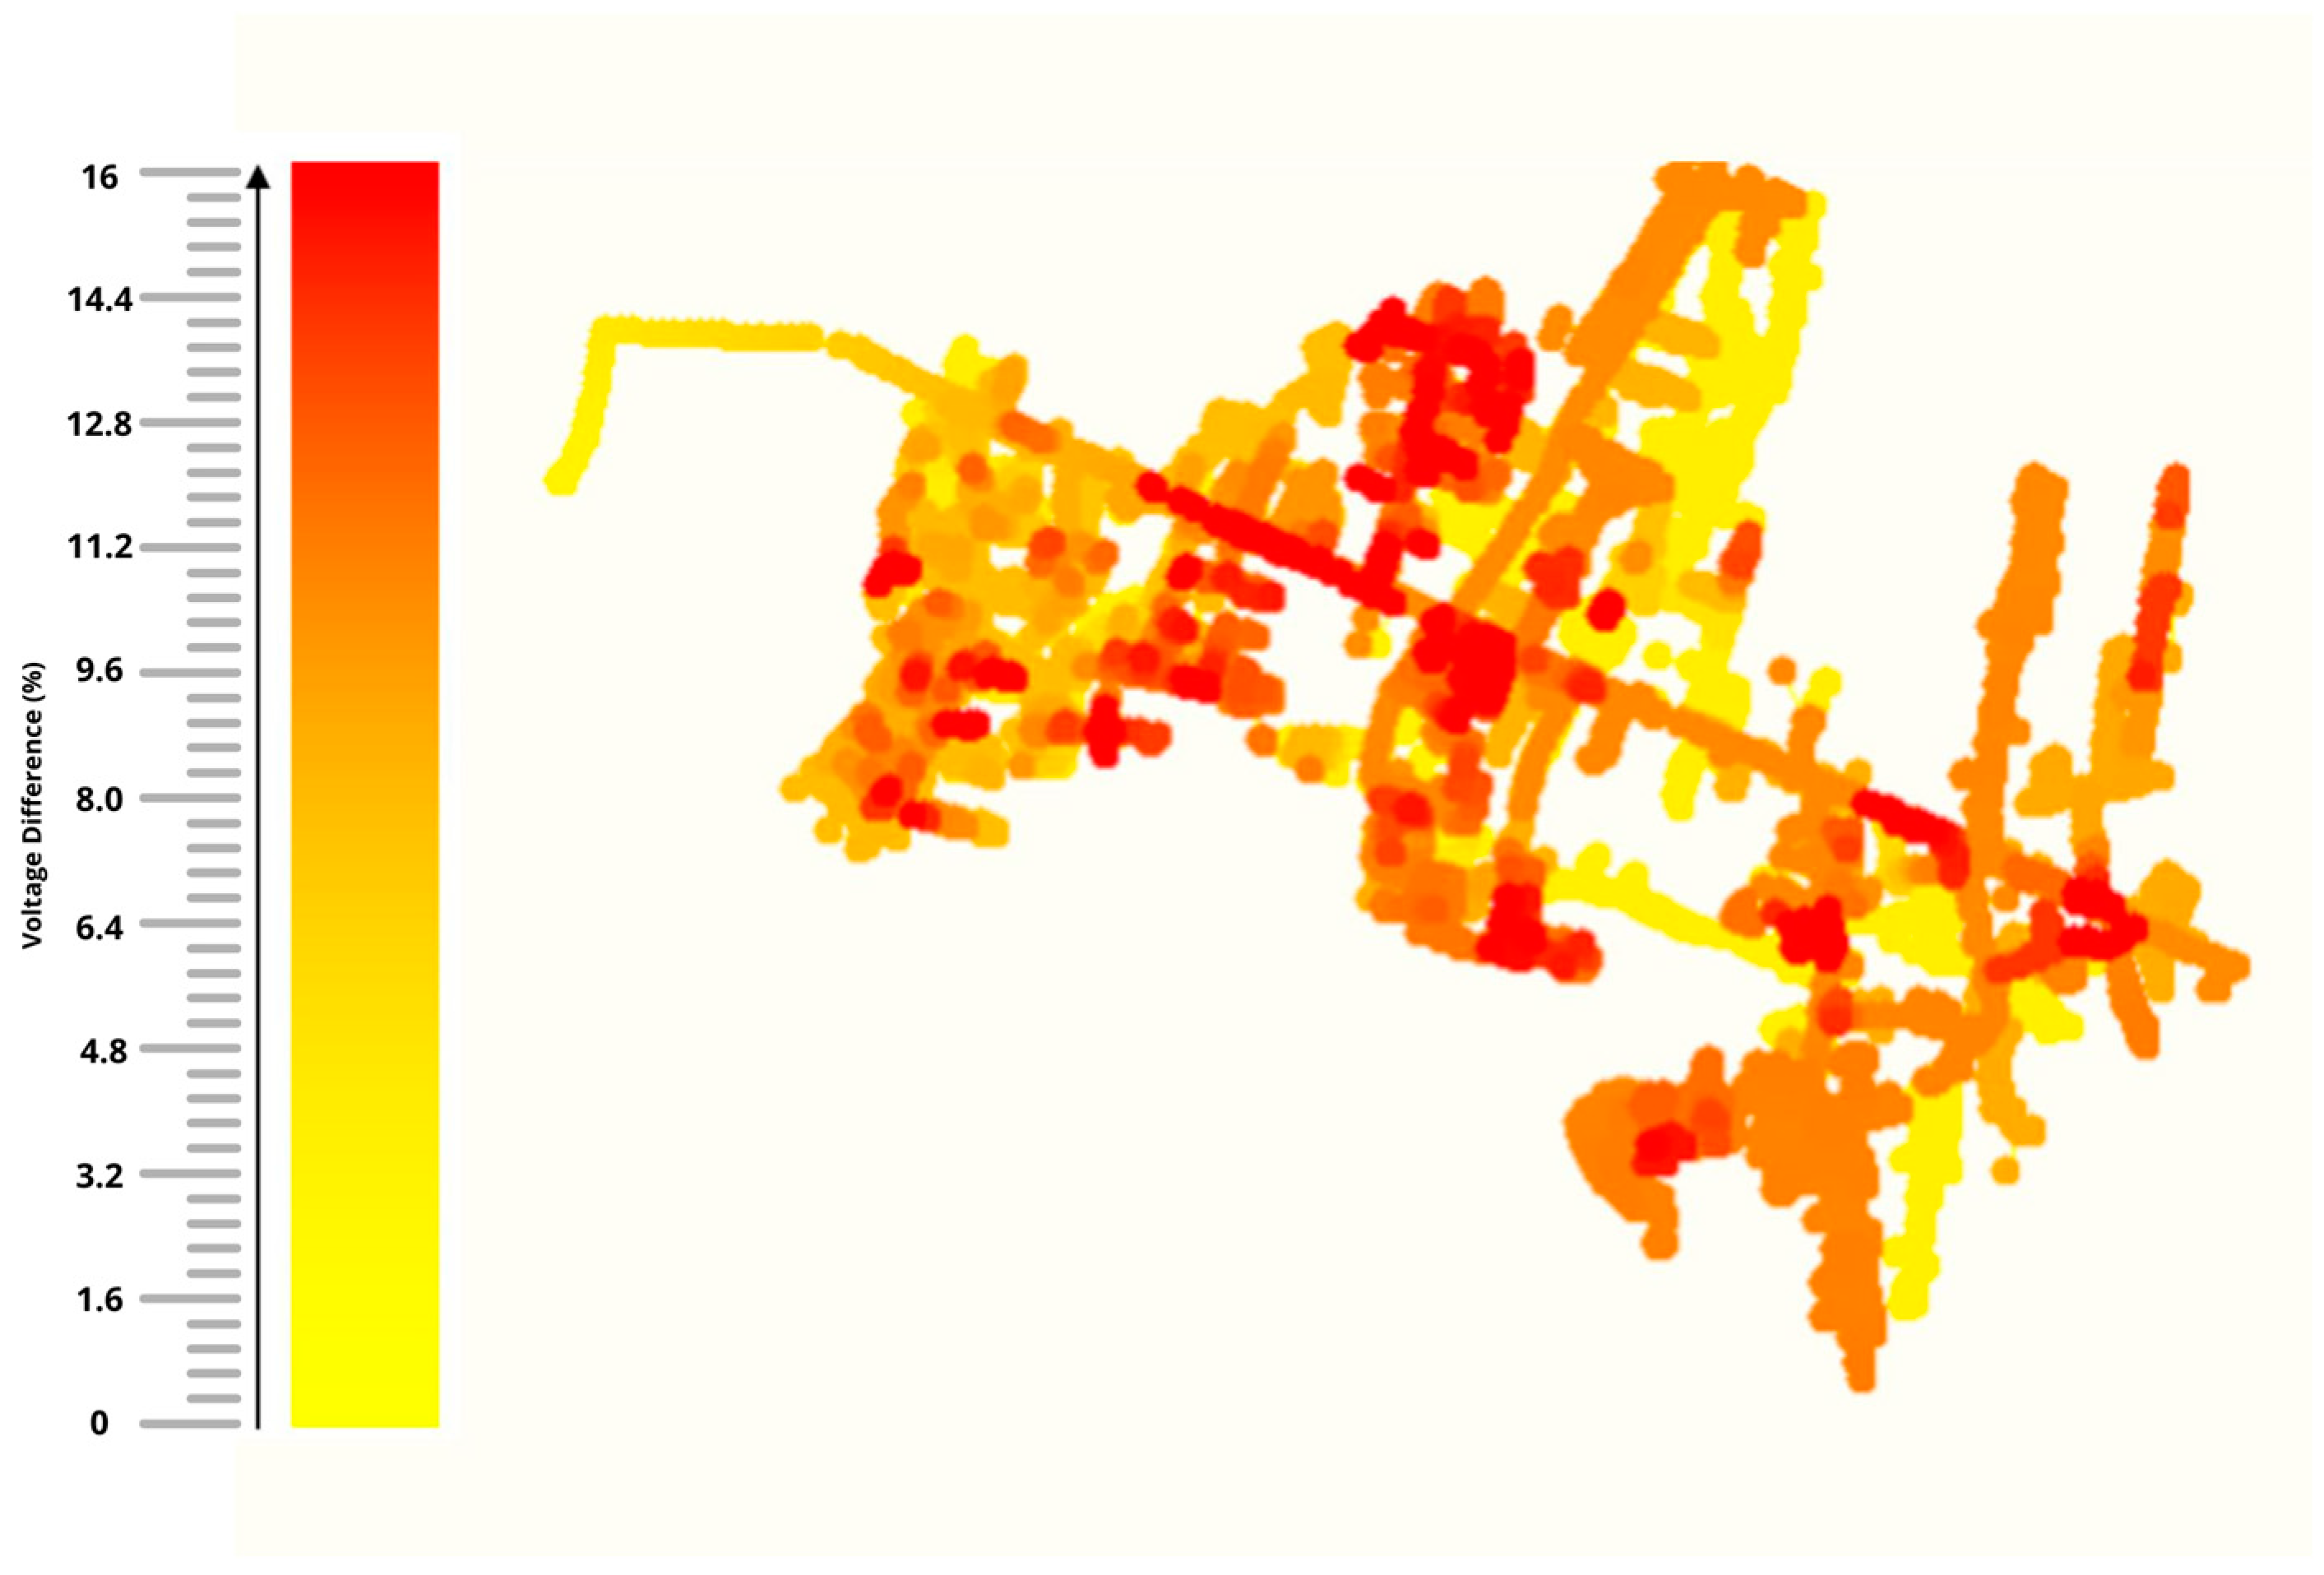
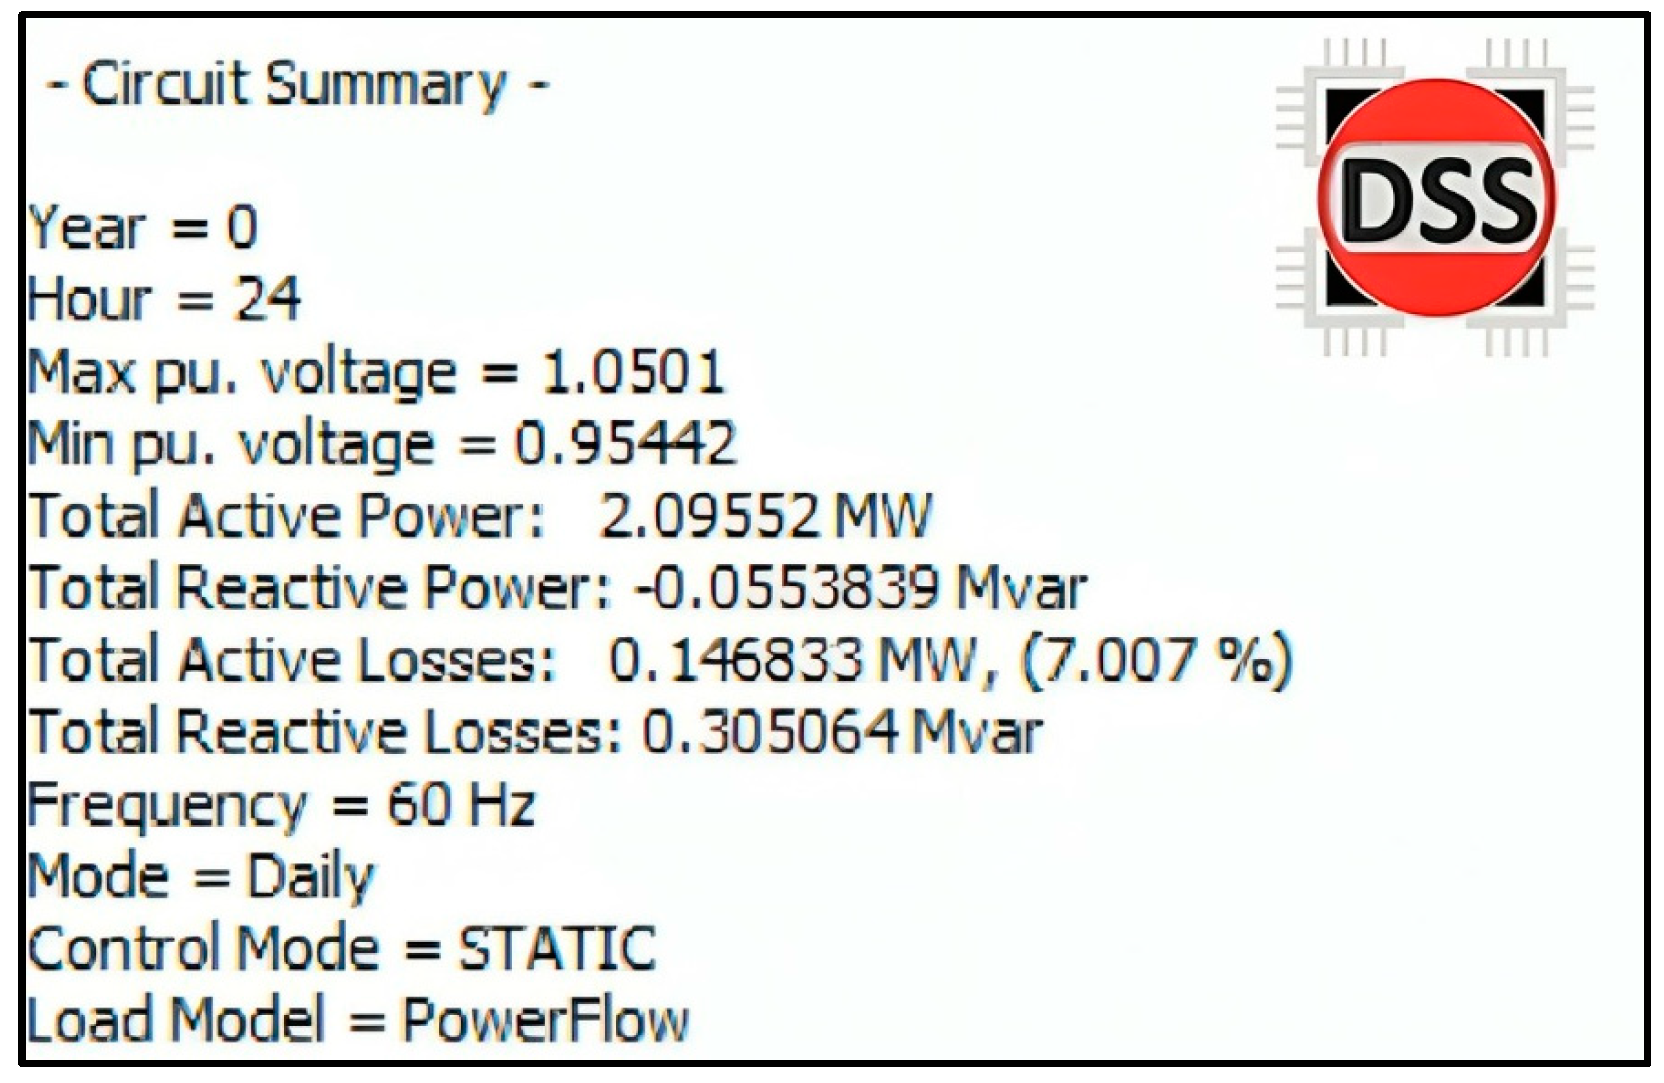
5.1. Simulation in OpenDSS
5.2. Discussion
6. Conclusions
Author Contributions
Funding
Data Availability Statement
Acknowledgments
Conflicts of Interest
References
- Shirek, G.; Lassiter, B.; Carr, W.; Kersting, W.H. Modeling Secondary Services in Engineering and Mapping. In Proceedings of the 2010 IEEE Rural Electric Power Conference (REPC), Orlando, FL, USA, 16–19 May 2010; pp. 254–262. [Google Scholar]
- Adesina, L.M.; Abdulkareem, A.; Katende, J.; Fakolujo, O. Newton-Raphson Algorithm as a Power Utility Tool for Network Stability. Adv. Sci. Technol. Eng. Syst. J. 2020, 5, 444–451. [Google Scholar] [CrossRef]
- Lazarou, S.; Vita, V.; Karampelas, P.; Ekonomou, L. A Power System Simulation Platform for Planning and Evaluating Distributed Generation Systems Based on GIS. Energy Syst. 2013, 4, 379–391. [Google Scholar] [CrossRef]
- Alhamwi, A.; Medjroubi, W.; Vogt, T.; Agert, C. Development of a GIS-Based Platform for the Allocation and Optimisation of Distributed Storage in Urban Energy Systems. Appl. Energy 2019, 251, 113360. [Google Scholar] [CrossRef]
- Bottaccioli, L.; Patti, E.; Macii, E.; Acquaviva, A. GIS-Based Software Infrastructure to Model PV Generation in Fine-Grained Spatio-Temporal Domain. IEEE Syst. J. 2018, 12, 2832–2841. [Google Scholar] [CrossRef]
- Parajeles, M.J.; Quirós-Tortós, J.; Valverde, G. Assessing the Performance of Smart Inverters in Large-Scale Distribution Networks with PV Systems. In Proceedings of the 2017 IEEE PES Innovative Smart Grid Technologies Conference-Latin America (ISGT Latin America), Quito, Ecuador, 20–22 September 2017; pp. 1–6. [Google Scholar] [CrossRef]
- Massano, M.; Macii, E.; Lanzini, A.; Patti, E.; Bottaccioli, L. A GIS Open-Data Co-Simulation Platform for Photovoltaic Integration in Residential Urban Areas. Engineering 2022, 26, 198–213. [Google Scholar] [CrossRef]
- González, R.; Arguello, A.; Valverde, G.; Quirós-Tortós, J. OpenDSS-Based Distribution Network Analyzer in Open Source GIS Environment. In Proceedings of the 2016 IEEE PES Transmission & Distribution Conference and Exposition-Latin America (PES T&D-LA), Dallas, TX, USA, 3–5 May 2017. [Google Scholar] [CrossRef]
- Jain, A.K.; Horowitz, K.; Ding, F.; Sedzro, K.S.; Palmintier, B.; Mather, B.; Jain, H. Dynamic Hosting Capacity Analysis for Distributed Photovoltaic Resources—Framework and Case Study. Appl. Energy 2020, 280, 115633. [Google Scholar] [CrossRef]
- Hariri, A.; Newaz, A.; Faruque, M.O. Open-source Python-OpenDSS Interface for Hybrid Simulation of PV Impact Studies. IET Gener. Transm. Distrib. 2017, 11, 3125–3133. [Google Scholar] [CrossRef]
- Rathbun, M.; Xu, Y.; Nejad, R.R.; Qu, Z.; Sun, W. Impact Studies and Cooperative Voltage Control for High PV Penetration. IFAC-PapersOnLine 2018, 51, 684–689. [Google Scholar] [CrossRef]
- García-Muñoz, F.; Jiménez-Martínez, M.; Eichman, J.; Corchero, C.; Benveniste, G. Exploring the Viability of Local Electricity Markets for Managing Congestion in Spanish Distribution Networks. Energies 2024, 17, 659. [Google Scholar] [CrossRef]
- Vega-Fuentes, E.; Yang, J.; Lou, C. Power Flow Visualization in DER-Rich Low Voltage Networks. In Proceedings of the 2020 IEEE PES Innovative Smart Grid Technologies Europe (ISGT-Europe), The Hague, The Netherlands, 26–28 October 2020; pp. 735–738. [Google Scholar] [CrossRef]
- Sigurdsson, G.Á.; Abdel-Fattah, M.F. Smart Grids Simulation Tools: Overview and Recommendations. In Proceedings of the 2021 IEEE 62nd International Scientific Conference on Power and Electrical Engineering of Riga Technical University (RTUCON), Riga, Latvia, 15–17 November 2021. [Google Scholar] [CrossRef]
- Antoncic, M.; Mikec, M.; Blazic, B. Development of Distribution Network Model in OpenDSS Using Matlab and GIS Data. In Proceedings of the 2019 7th International Youth Conference on Energy (IYCE), Bled, Slovenia, 3–6 July 2019; pp. 1–6. [Google Scholar] [CrossRef]
- Abdulrahman, I.; Radman, G. Power System Spatial Analysis and Visualization Using Geographic Information System (GIS). Spat. Inf. Res. 2020, 28, 101–112. [Google Scholar] [CrossRef]
- Olauson, J.; Marin, M.; Soder, L. Creating Power System Network Layouts: A Fast Parallel Algorithm. IEEE Syst. J. 2020, 14, 3687–3694. [Google Scholar] [CrossRef]
- Quiros-Tortos, J.; Valverde, G.; Arguello, A.; Ochoa, L.N. Geo-Information Is Power: Using Geographical Information Systems to Assess Rooftop Photovoltaics in Costa Rica. IEEE Power Energy Mag. 2017, 15, 48–56. [Google Scholar] [CrossRef]
- Martinez-Velasco, J.; Guerra, G. Reliability Analysis of Distribution Systems with Photovoltaic Generation Using a Power Flow Simulator and a Parallel Monte Carlo Approach. Energies 2016, 9, 537. [Google Scholar] [CrossRef]
- de Negreiros, G.F.; Lobo, F.X.; Torres, I.C.; Tiba, C. Impact on Voltage Regulation in Medium Voltage Distribution Networks Due to the Insertion of Photovoltaic Generators. Energies 2023, 16, 1307. [Google Scholar] [CrossRef]
- Ebad, M.; Grady, W.M. An Approach for Assessing High-Penetration PV Impact on Distribution Feeders. Electr. Power Syst. Res. 2016, 133, 347–354. [Google Scholar] [CrossRef]
- Radatz, P.; Kagan, N.; Rocha, C.; Smith, J.; Dugan, R.C. Assessing Maximum DG Penetration Levels in a Real Distribution Feeder by Using OpenDSS. In Proceedings of the 2016 17th International Conference on Harmonics and Quality of Power (ICHQP), Belo Horizonte, Brazil, 16–19 October 2016; pp. 71–76. [Google Scholar] [CrossRef]
- Weber, M.; Cakmak, H.K.; Kuhnapfel, U.; Hagenmeyer, V. A Novel Method for Topology Preserving Static Network Reduction. In Proceedings of the 2023 IEEE 11th International Conference on Smart Energy Grid Engineering (SEGE), Oshawa, ON, Canada, 13–15 August 2023; pp. 58–63. [Google Scholar] [CrossRef]
- Pereira, O.; Quiros-Tortos, J.; Valverde, G. Phase Rebalancing of Distribution Circuits Dominated by Single-Phase Loads. IEEE Trans. Power Syst. 2021, 36, 5333–5344. [Google Scholar] [CrossRef]
- Jovanović, D. From Qgis To Python: Comparison of Free and Open Tools for Statistical Analysis of Cultural Heritage and Data Representation. Int. Arch. Photogramm. Remote Sens. Spat. Inf. Sci. 2022, 48, 229–236. [Google Scholar] [CrossRef]
- McGarry, C.; Anderson, A.; Elders, I.; Galloway, S. A Scalable Geospatial Data-Driven Localization Approach for Modeling of Low Voltage Distribution Networks and Low Carbon Technology Impact Assessment. IEEE Access 2023, 11, 64567–64585. [Google Scholar] [CrossRef]
- Quesada, P.; Arguello, A.; Quirós-Tortós, J.; Valverde, G. Distribution Network Model Builder for OpenDSS in Open Source GIS Software. In Proceedings of the 2016 IEEE PES Transmission & Distribution Conference and Exposition-Latin America (PES T&D-LA), Morelia, Mexico, 20–24 September 2016. [Google Scholar] [CrossRef]
- Donastorg, A.; Renukappa, S.; Suresh, S. Evaluating Critical Success Factors for Implementing Renewable Energy Strategies in the Dominican Republic. Renew. Energy 2020, 149, 329–335. [Google Scholar] [CrossRef]
- Wang, S.; Liu, S.; Huang, C.; Tang, J.; Pang, Y. Integration Implementation and Application of Power Grid GIS Platform and Production Management System Based on ESB. In Proceedings of the 2022 International Seminar on Computer Science and Engineering Technology (SCSET), Indianapolis, IN, USA, 8–9 January 2022; pp. 287–290. [Google Scholar] [CrossRef]
- Domoto, E.; Okuhara, K.; Rene, A.O.N. Development of QGIS Plugin for Seamless Integration of Ideation Support and Geoprocessing. In Proceedings of the 2021 10th International Congress on Advanced Applied Informatics (IIAI-AAI), Niigata, Japan, 11–16 July 2021; pp. 569–574. [Google Scholar] [CrossRef]
- Assis, F.A.; Coelho, F.C.R.; Castro, J.F.C.; Donadon, A.R.; Roncolatto, R.A.; Rosas, P.A.C.; Andrade, V.E.M.S.; Bento, R.G.; Silva, L.C.P.; Cypriano, J.G.I.; et al. Assessment of Regulatory and Market Challenges in the Economic Feasibility of a Nanogrid: A Brazilian Case. Energies 2024, 17, 341. [Google Scholar] [CrossRef]
- Dugan, R.C.; McDermott, T.E. An Open Source Platform for Collaborating on Smart Grid Research. In Proceedings of the 2011 IEEE Power and Energy Society General Meeting, Detroit, MI, USA, 24–28 July 2011; pp. 1–7. [Google Scholar] [CrossRef]
- Ram, P.; Sinha, K. Revisiting Kd-Tree for Nearest Neighbor Search. In Proceedings of the 25th ACM SIGKDD International Conference on Knowledge Discovery & Data Mining, Anchorage, AK, USA, 4–8 August 2019; ACM: New York, NY, USA, 2019; pp. 1378–1388. [Google Scholar]
- Leiva, D.; Araya, C.; Valverde, G.; Quiros-Tortos, J. Statistical Representation of Demand for GIS-Based Load Profile Allocation in Distribution Networks. In Proceedings of the 2017 IEEE Manchester PowerTech, Manchester, UK, 18–22 June 2017; pp. 1–6. [Google Scholar] [CrossRef]
- Brusilowicz, B.; Herlender, J. Transmission Line Modelling and Simulating for Transient Analysis. In Proceedings of the 2019 Modern Electric Power Systems (MEPS), Wroclaw, Poland, 9–12 September 2019. [Google Scholar] [CrossRef]
- Soluzione Solare. User Manual: PYRANOMETER PYRA-485 2019. Available online: https://www.soluzionesolare.com/documenti/Manual_Pyr-485.pdf (accessed on 25 May 2024).
- Zanocco, C.; Sun, T.; Stelmach, G.; Flora, J.; Rajagopal, R.; Boudet, H. Assessing Californians’ Awareness of Their Daily Electricity Use Patterns. Nat. Energy 2022, 7, 1191–1199. [Google Scholar] [CrossRef]
- Azzopardi, B.; Gabdullin, Y. Assessing Combined High Photovoltaic and Electric Vehicle Charging Penetration in Low-Voltage Distribution Networks: A Case Study in Malta. Energies 2024, 17, 263. [Google Scholar] [CrossRef]
- Haces-Fernandez, F. Risk Assessment Framework for Electric Vehicle Charging Station Development in the United States as an Ancillary Service. Energies 2023, 16, 8035. [Google Scholar] [CrossRef]
- Ni, Q.; Jiang, H. Topology Identification of Low-Voltage Distribution Network Based on Deep Convolutional Time-Series Clustering. Energies 2023, 16, 4274. [Google Scholar] [CrossRef]
- Garabitos Lara, E.; Vallejo Díaz, A.; Ocaña Guevara, V.S.; Santos García, F. Tecno-Economic Evaluation of Residential PV Systems under a Tiered Rate and Net Metering Program in the Dominican Republic. Energy Sustain. Dev. 2023, 72, 42–57. [Google Scholar] [CrossRef]
- Li, S.; Lian, J.; Conejo, A.J.; Zhang, W. Transactive Energy Systems: The Market-Based Coordination of Distributed Energy Resources. IEEE Control Syst. 2020, 40, 26–52. [Google Scholar] [CrossRef]


| Required Attributes | Optional Attributes |
|---|---|
| NEUTMAT | LENGTH |
| NEUTSIZ | LENUNIT |
| PHASEMAT | X1 |
| PHASESIZ | Y1 |
| LINEGEO | X2 |
| PHASEDESIG | Y2 |
| NOMVOLT |
| Circuit Alias | VOLG101 |
|---|---|
| System voltage (kV): | 12.47 |
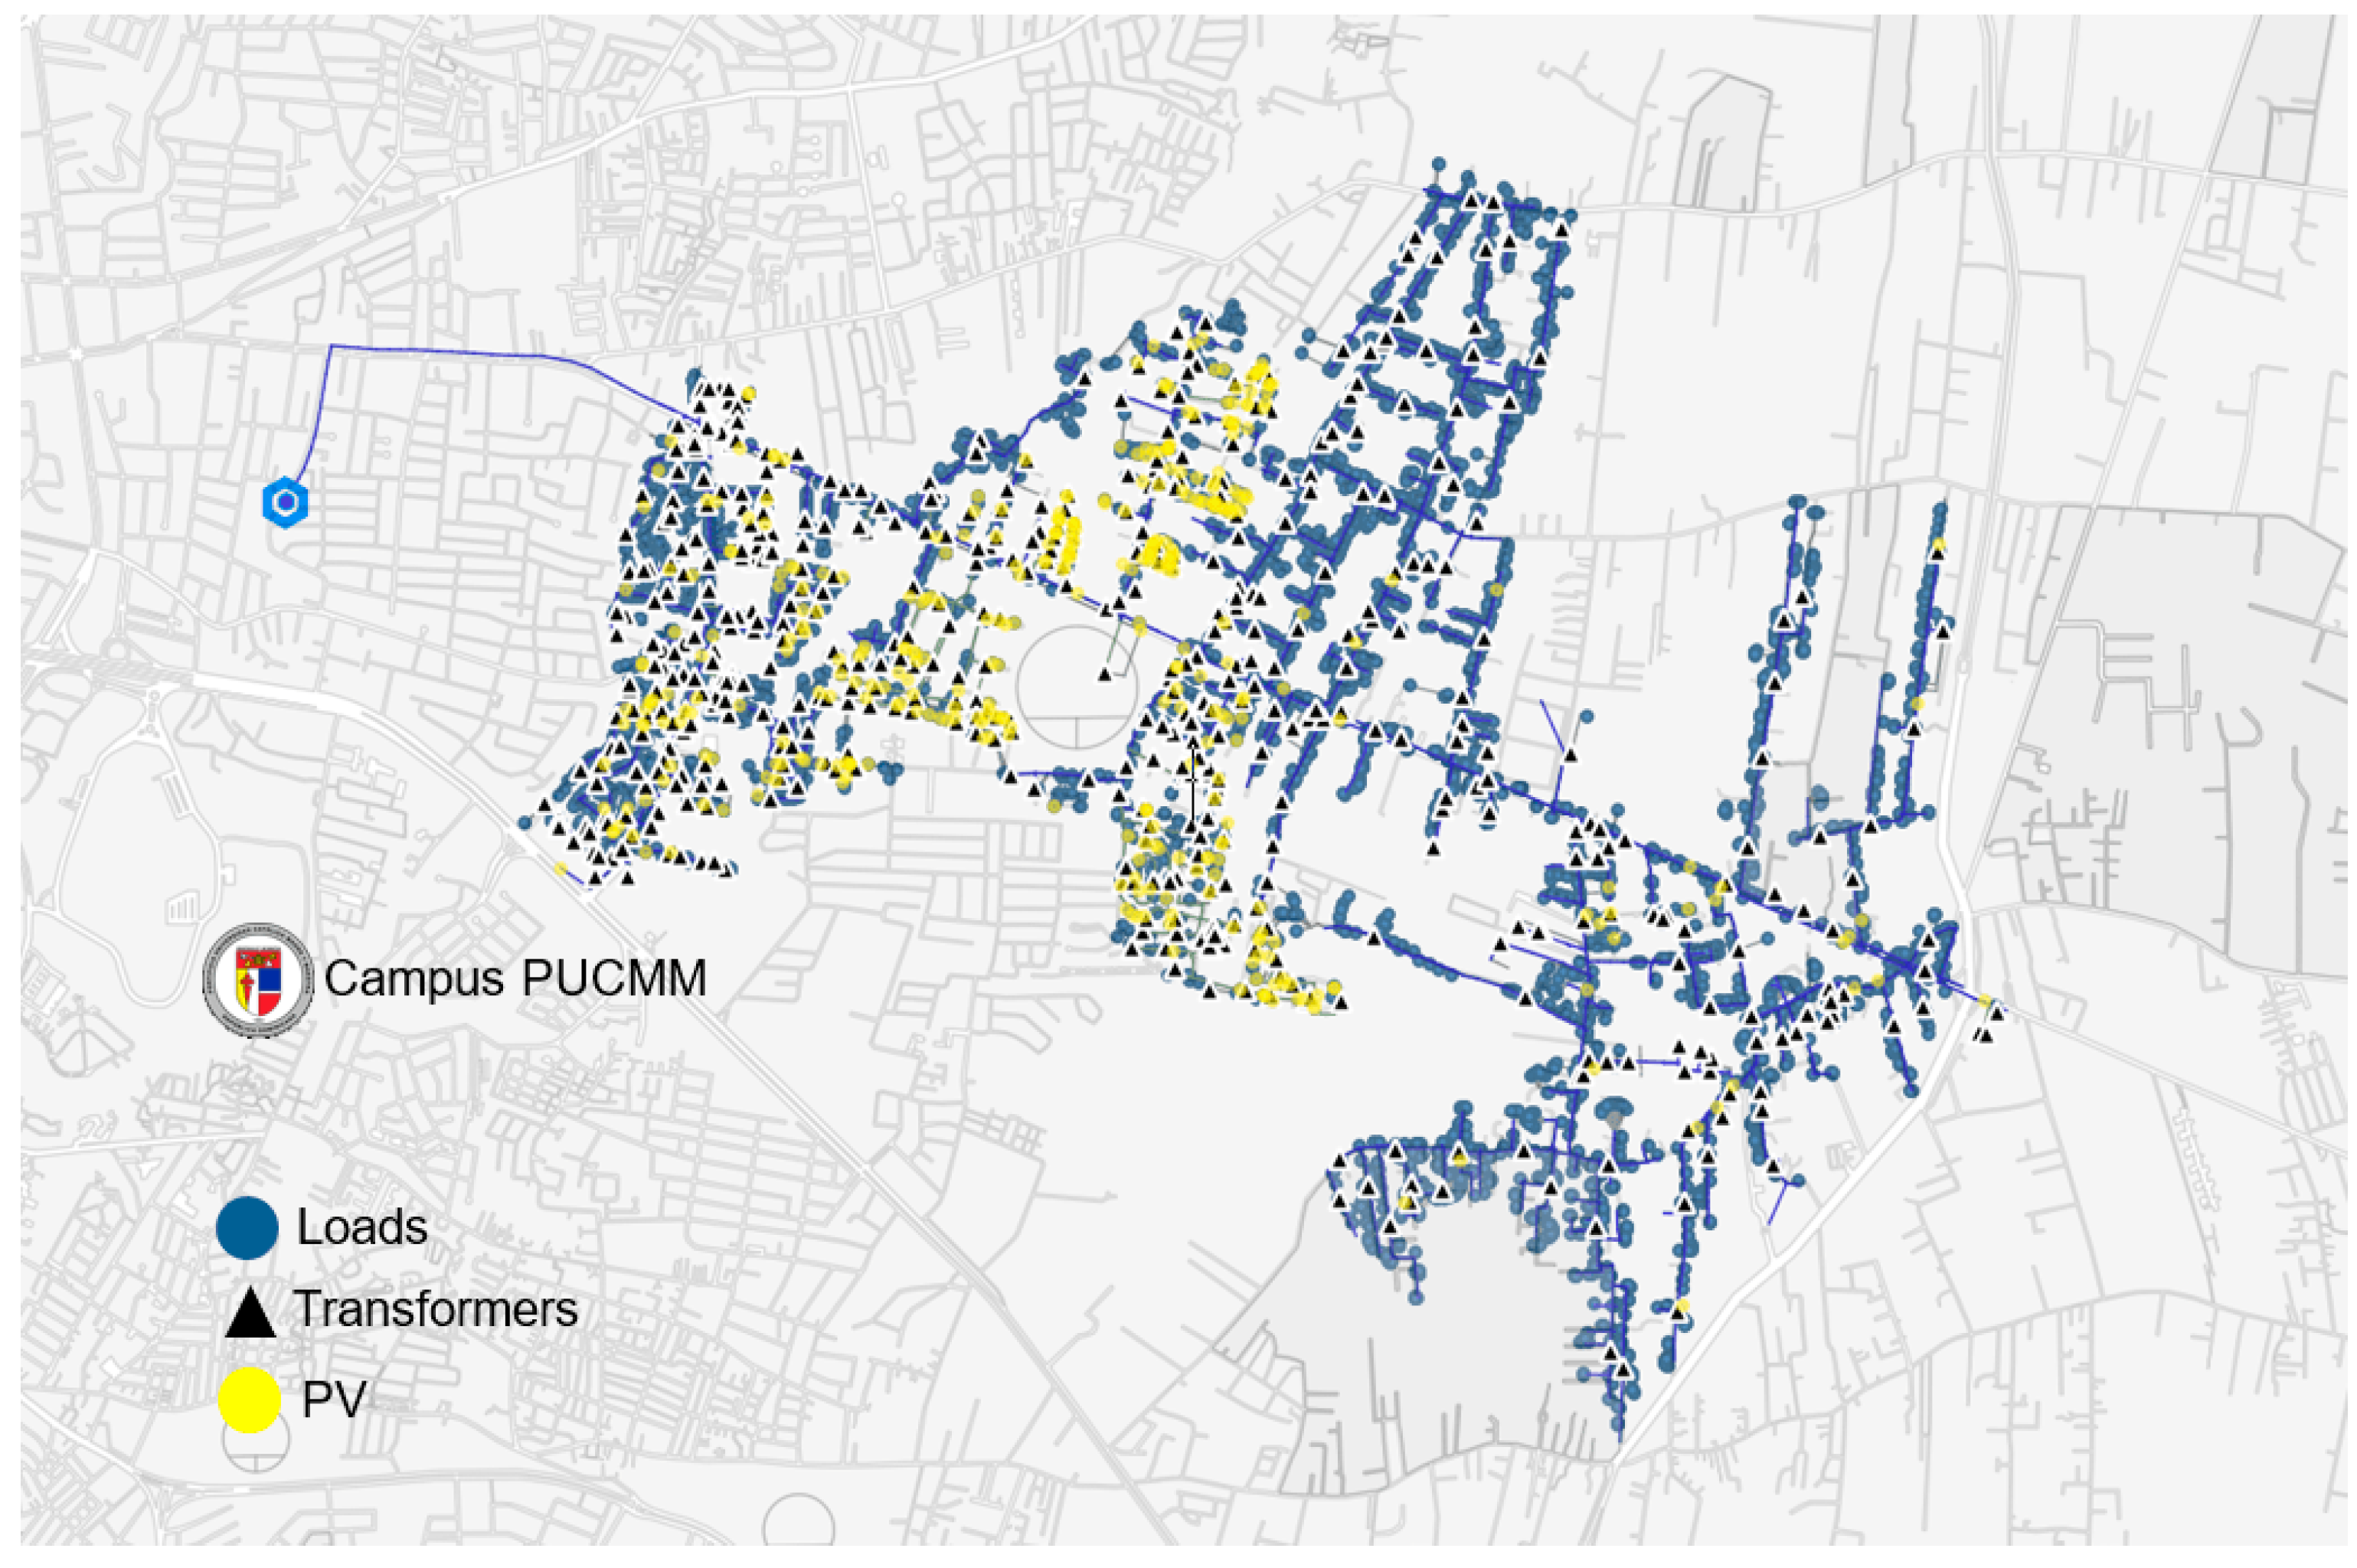
| Number of customers: | 7428 |
| Sub transmission voltage (kV): | 69 |
| Circuit MV lines (kM): | 78 |
| Circuit LV and service lines (kM): | 145 |
| Number of transformers: | 578 |
| Number of PV installations: | 394 |
| Reported technical losses (2021) | 6.4% |
| Renewable penetration: | 60% |
| Hour | Average | Minimum | Maximum | 50th Percentile | Standard Deviation | Selected Day |
|---|---|---|---|---|---|---|
| 28 March 2023 | ||||||
| 23:45 | 0.000 | 0.000 | 0.000 | 0.000 | 0.000 | 0 |
| 22:45 | 0.000 | 0.000 | 0.000 | 0.000 | 0.000 | 0 |
| 21:45 | 0.000 | 0.000 | 0.000 | 0.000 | 0.000 | 0 |
| 20:45 | 0.000 | 0.000 | 0.000 | 0.000 | 0.000 | 0 |
| 19:45 | 0.001 | 0.000 | 0.179 | 0.000 | 0.010 | 0 |
| 18:45 | 2.375 | 0.000 | 22.134 | 0.196 | 4.264 | 0.017884 |
| 17:45 | 29.752 | 0.179 | 144.252 | 22.156 | 26.983 | 41.68653 |
| 16:45 | 130.993 | 1.717 | 332.588 | 119.907 | 75.274 | 191.4456 |
| 15:45 | 289.866 | 1.717 | 532.806 | 292.279 | 139.361 | 378.2549 |
| 14:45 | 483.396 | 1.198 | 773.078 | 533.772 | 187.047 | 665.2928 |
| 13:45 | 653.514 | 1.169 | 909.129 | 718.881 | 218.493 | 825.4596 |
| 12:45 | 771.808 | 0.828 | 1033.303 | 840.484 | 219.235 | 1013.152 |
| 11:45 | 812.093 | 0.828 | 1052.026 | 890.686 | 223.063 | 1052.026 |
| 10:45 | 770.307 | 0.828 | 1025.436 | 840.943 | 209.990 | 1025.436 |
| 9:45 | 654.453 | 0.828 | 948.757 | 714.060 | 188.165 | 948.757 |
| 8:45 | 476.251 | 0.828 | 699.502 | 512.404 | 155.591 | 693.829 |
| 7:45 | 261.228 | 18.931 | 452.867 | 269.825 | 110.564 | 450.0188 |
| 6:45 | 71.061 | 1.676 | 203.709 | 65.157 | 51.991 | 203.7091 |
| 5:45 | 3.839 | 0.000 | 37.269 | 1.539 | 5.386 | 37.26907 |
| 4:45 | 0 | 0 | 0 | 0 | 0 | 0 |
| 3:45 | 0 | 0 | 0 | 0 | 0 | 0 |
| 2:45 | 0 | 0 | 0 | 0 | 0 | 0 |
| 1:45 | 0 | 0 | 0 | 0 | 0 | 0 |
| 0:45 | 0 | 0 | 0 | 0 | 0 | 0 |
Disclaimer/Publisher’s Note: The statements, opinions and data contained in all publications are solely those of the individual author(s) and contributor(s) and not of MDPI and/or the editor(s). MDPI and/or the editor(s) disclaim responsibility for any injury to people or property resulting from any ideas, methods, instructions or products referred to in the content. |
© 2024 by the authors. Licensee MDPI, Basel, Switzerland. This article is an open access article distributed under the terms and conditions of the Creative Commons Attribution (CC BY) license (https://creativecommons.org/licenses/by/4.0/).
Share and Cite
De-Jesús-Grullón, R.E.; Batista Jorge, R.O.; Espinal Serrata, A.; Bueno Díaz, J.E.; Pichardo Estévez, J.J.; Guerrero-Rodríguez, N.F. Modeling and Simulation of Distribution Networks with High Renewable Penetration in Open-Source Software: QGIS and OpenDSS. Energies 2024, 17, 2925. https://doi.org/10.3390/en17122925
De-Jesús-Grullón RE, Batista Jorge RO, Espinal Serrata A, Bueno Díaz JE, Pichardo Estévez JJ, Guerrero-Rodríguez NF. Modeling and Simulation of Distribution Networks with High Renewable Penetration in Open-Source Software: QGIS and OpenDSS. Energies. 2024; 17(12):2925. https://doi.org/10.3390/en17122925
Chicago/Turabian StyleDe-Jesús-Grullón, Ramón E., Rafael Omar Batista Jorge, Abraham Espinal Serrata, Justin Eladio Bueno Díaz, Juan José Pichardo Estévez, and Nestor Francisco Guerrero-Rodríguez. 2024. "Modeling and Simulation of Distribution Networks with High Renewable Penetration in Open-Source Software: QGIS and OpenDSS" Energies 17, no. 12: 2925. https://doi.org/10.3390/en17122925