
Exploring Energy Poverty in Urban and Rural Contexts in the Era of Climate Change: A Comparative Analysis of European Countries and Israel

 , ,
, ,  ,
,  ,
,  , , , , , and
Abstract
:1. Introduction
2. Literature Review
2.1. Factors Contributing to Energy Poverty
2.2. Impacts of Climate Change on Energy Poverty
2.3. Spatial Dimensions of Energy Poverty
3. Methodology
4. Results
4.1. Urban–Rural Divide Informed by Sociodemographic Data
4.2. Urban-Rural Divide Informed by Housing Data
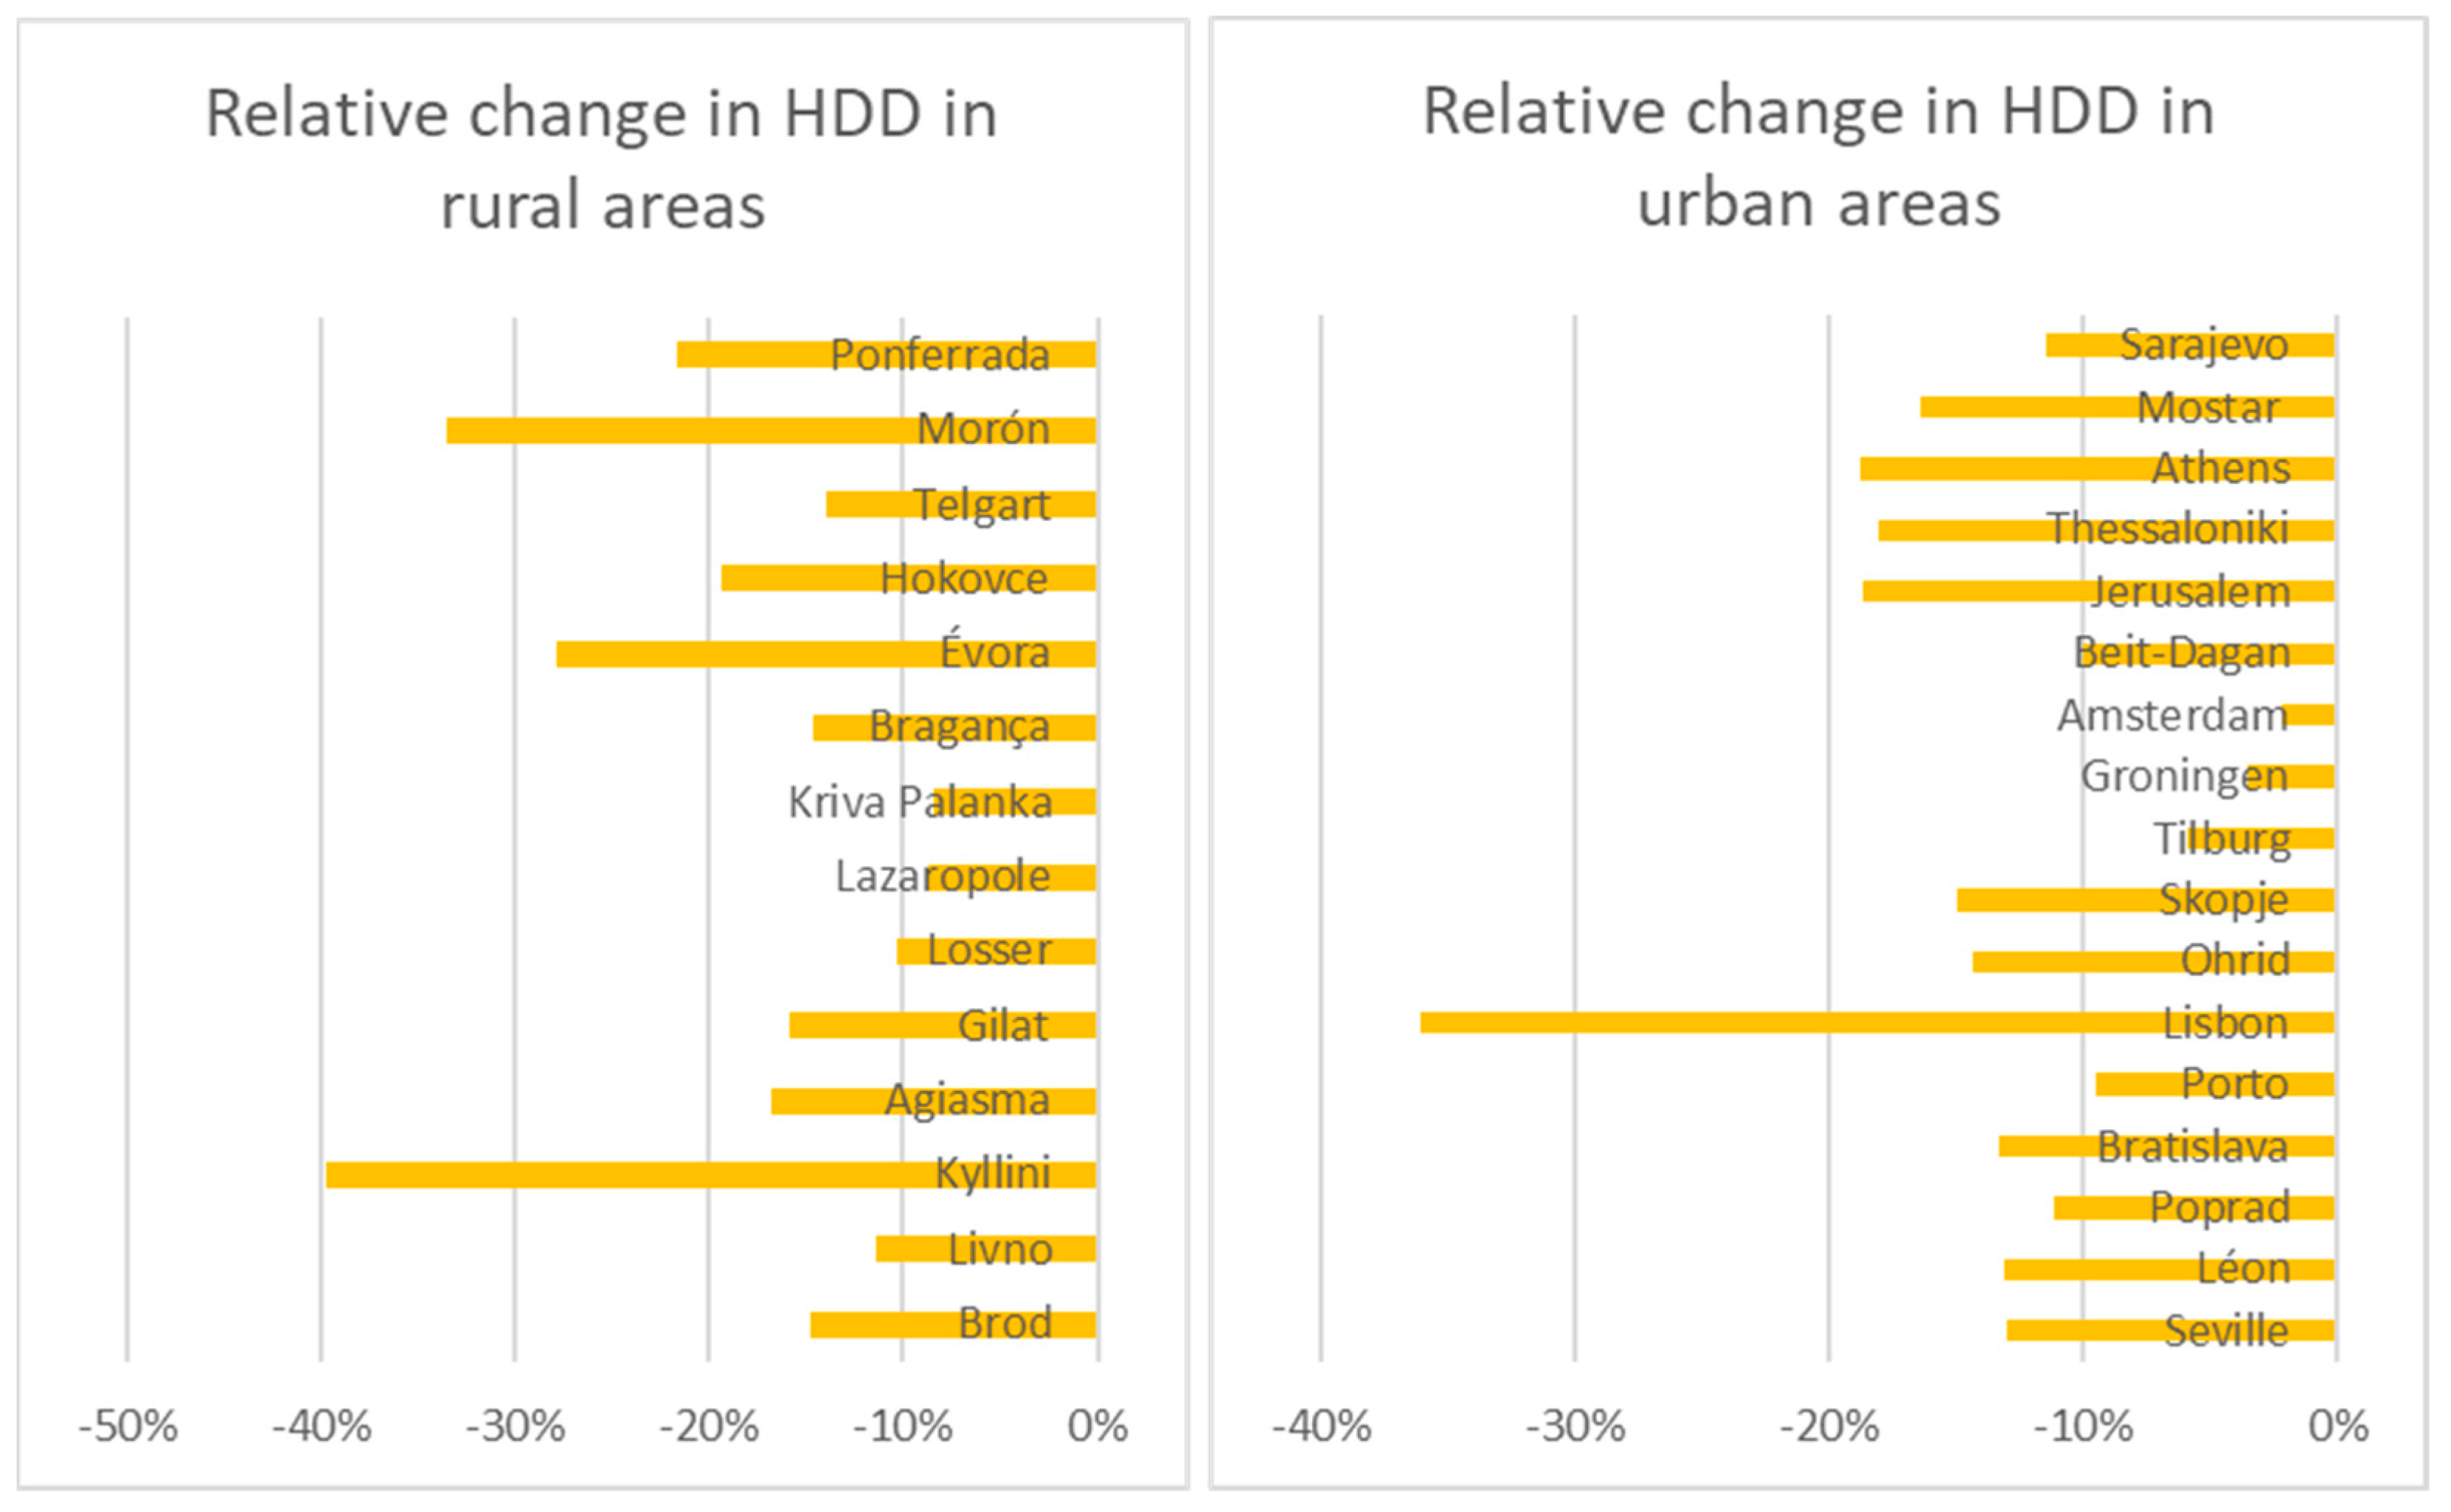
4.3. Climate Change Effects on Rural and Urban Energy Vulnerability
5. Discussion
6. Conclusions
Author Contributions
Funding
Data Availability Statement
Acknowledgments
Conflicts of Interest
Appendix A

| Country | Population (Millions) (2020) [128] | Share of Population Living in Rural Areas (%) (2015) [129] | Real GDP Per Capita at Market Prices (EUR) (2019) [87] | Domestic EEPI (European Energy) Poverty Index) [69] | Arrears on Utility Bills (%) (2019) [130] | Inability to Keep Home Adequately Warm * (%) (2019) [1] | Population in Dwellings with Leaking Roofs * (%) (2019) [2] |
|---|---|---|---|---|---|---|---|
| Bosnia and Herzegovina | 3.5 | 57.3 [131] | 5217 [131] | n/a | n/a | n/a | n/a |
| [131] | |||||||
| Greece | 10.7 | 34.5 | 17,750 | 43.69 | 32.5 | 17.9 | 12.5 |
| The Netherlands | 17.4 | 14.7 | 41,870 | 78.09 | 1.5 | 3 | 14.7 |
| North Macedonia | 2.1 | n/a | 4130 (2018) | n/a | 34.4 | 33.1 | 13.9 |
| Portugal | 10.3 | 26.8 | 18,630 | 36.67 | 4.3 | 18.9 | 24.4 |
| Slovakia | 5.5 | 41.8 | 15,860 | 8.35 | 8.4 | 7.8 | 5.7 |
| Spain | 47.3 | 26.5 | 25,200 | 64.67 | 6.5 | 7.5 | 14.7 |
| Israel | 9.1 [132] | 8.5 [132] | 36,644 [133] | n/a | 40.5% [134] | 38.5 [135] | n/a |
| European average | 447.3 | 29 | 28,020 | n/a | 6.2 | 7.3 | 12.7 |
| Country | Location | Type of Location | Population (Inhabitants) | Köppen Climate Classification | Population Density (Inhabitants/km2) | Heating Degree Days (Own Elaboration from [136] |
|---|---|---|---|---|---|---|
| Bosnia and Herzegovina | Sarajevo | Urban | 274,879 | Cfb | 166 | 2933 |
| Mostar | Urban | 105,797 | Cfb | 91 | 1610 | |
| Brod | Rural | 17,943 | Csb | 76 | 2572 | |
| Livno | Rural | 34,133 | Csb | 35 | 3017 | |
| Greece | Athens | Urban | 664,046 | Csa | 17,043 | 1422 |
| Thessaloniki | Urban | 325,182 | Bsk | 18,251 | 1653 | |
| Kyllini | Rural | 21,581 | Csa | 61 | 1115 | |
| Agiasma | Rural | 22,331 | Bsk | 33 | 1727 | |
| Israel | Jerusalem | Urban | 936,425 | Bsh | 7428 | 1194 |
| Beit Dagan | Urban | 7285 | Bsh | 5131 | 374 | |
| Gilat | Rural | 1451 | Csa | n/a * | 325 | |
| The Netherlands | Amsterdam | Urban | 862,965 | Cfb | 3935 | 2587 |
| Groningen | Urban | 231,299 | Cfb | 2762 | 2903 | |
| Tilburg | Urban | 220,513 | Cfb | 1867 | 2645 | |
| Losser | Rural | 22,622 | Cfb | 227 | 2844 | |
| North Macedonia (2002) | Skopje | Urban | 506,926 | Cfa | over 500 | 2535 |
| Ohrid | Urban | 55,749 | Csa | 100–499 | 2755 | |
| Lazaropole | Rural | 0 * | Csa | 0 ** | 3651 | |
| Kriva Palanka | Rural | 20,820 | Dwa | 20–49 | 2705 | |
| Portugal | Lisbon | Urban | 509,515 | Csa | 5092 | 905 |
| Porto | Urban | 216,606 | Csb | 5230 | 1179 | |
| Bragança | Rural | 33,607 | Csb | 29 | 2250 | |
| Évora | Rural | 52,428 | Csa | 40 | 1307 | |
| Slovakia | Bratislava | Urban | 440,948 | Cfb | 1199 | 2774 |
| Poprad | Urban | 50,998 | Dfb | 808 | 4041 | |
| Hokovce | Rural | 495 | Cfb | 34 | 3047 | |
| Telgárt | Rural | 1519 | Dfb | 27 | 4403 | |
| Spain | Léon | Urban | 131,411 | Csb | 3365 | 2364 |
| Seville | Urban | 698,042 | Csa | 4956 | 659 | |
| Ponferrada | Rural | 68,383 | Csb | 241 | 2194 | |
| Morón | Rural | 28,389 | Csa | 66 | 900 |
References
- Eurostat. Inability to Keep Home Adequately Warm; Eurostat: Luxembourg, 2022. [Google Scholar]
- Eurostat. Total Population Living in a Dwelling with a Leaking Roof, Damp Walls, Floors or Foundation, or Rot in Window Frames or Floor; Eurostat: Luxembourg, 2021. [Google Scholar]
- Bouzarovski, S. Energy Poverty: (Dis) Assembling Europe’s Infrastructural Divide; Palgrave Macmillan: London, UK, 2018. [Google Scholar]
- EuroMOMO. Winter Season 2016/17 Mortality Summary; EuroMOMO: Copenhagen, Denmark, 2021. [Google Scholar]
- Stojilovska, A.; Guyet, R.; Mahoney, K.; Gouveia, J.P.; Castaño-Rosa, R.; Živčič, L.; Barbosa, R.; Tkalec, T. Energy Poverty and Emerging Debates: Beyond the Traditional Triangle of Energy Poverty Drivers. Energy Policy 2022, 169, 113181. [Google Scholar] [CrossRef]
- Simcock, N.; Walker, G.; Day, R. Fuel Poverty in the UK: Beyond Heating? People Place Policy 2016, 10, 25–41. [Google Scholar] [CrossRef]
- Bouzarovski, S.; Thomson, H. Transforming Energy Poverty Policies in The European Union; European Commission: Luxembourg, 2019. [Google Scholar]
- Bouzarovski, S.; Tirado Herrero, S. The energy divide: Integrating energy transitions, regional inequalities and poverty trends in the European Union. Eur. Urban Reg. Stud. 2017, 24, 69–86. [Google Scholar] [CrossRef]
- Scarpellini, S.; Hernández, M.A.S.; Moneva, J.M.; Portillo-Tarragona, P.; Rodríguez, M.E.L. Measurement of spatial socioeconomic impact of energy poverty. Energy Policy 2019, 124, 320–331. [Google Scholar] [CrossRef]
- Brereton, F.; Bullock, C.; Clinch, J.P.; Scott, M. Rural change and individual well-being: The case of Ireland and rural quality of life. Eur. Urban Reg. Stud. 2011, 18, 203–227. [Google Scholar] [CrossRef]
- Horlings, L.G.; Marsden, T.K. Exploring the ‘New Rural Paradigm’ in Europe: Eco-economic strategies as a counterforce to the global competitiveness agenda. Eur. Urban Reg. Stud. 2014, 21, 4–20. [Google Scholar] [CrossRef]
- Dobbins, A.; Nerini, F.F.; Deane, P.; Pye, S. Strengthening the EU response to Energy Poverty. Nat. Energy 2019, 4, 2–5. [Google Scholar] [CrossRef]
- Pye, S.; Dobbins, A.; Baffert, C.; Brajković, J.; Grgurev, I.; De Miglio, R.; Deane, P.; Lapillone, B. Energy poverty and vulnerable consumers in the energy sector across the EU: Analysis of policies and measures, in INSIGHT_E 2015. L’Eur. For. 2014, 4, 64–89. [Google Scholar]
- EPOV, Energy Poverty Observatory. Guidance for Policy-Makers; EPOV, Energy Poverty Observatory: Brussels, Belgium, 2020. [Google Scholar]
- Thomson, H.; Snell, C. Quantifying the prevalence of fuel poverty across the European Union. Energy Policy 2013, 52, 563–572. [Google Scholar] [CrossRef]
- Walker, G.; Day, R. Fuel poverty as injustice: Integrating distribution, recognition and procedure in the struggle for affordable warmth. Energy Policy 2012, 49, 69–75. [Google Scholar] [CrossRef]
- Feenstra, M.; Middlemiss, L.; Hesselman, M.; Straver, K.; Herrero, S.T. Humanising the Energy Transition: Towards a National Policy on Energy Poverty in The Netherlands. Front. Sustain. Cities 2021, 3, 645624. [Google Scholar] [CrossRef]
- Teschner, N.; Sinea, A.; Vornicu, A.; Abu-Hamed, T.; Negev, M. Extreme energy poverty in the urban peripheries of Romania and Israel: Policy, planning and infrastructure. Energy Res. Soc. Sci. 2020, 66, 101502. [Google Scholar] [CrossRef]
- IPCC. Climate Change 2022. Impacts, Adaptation and Vulnerability; Cambridge University Press: Cambridge, UK; New York, NY, USA, 2022; 3056p. [Google Scholar] [CrossRef]
- Thomson, H.; Bouzarovski, S.; Snell, C. Rethinking the measurement of energy poverty in Europe: A critical analysis of indicators and data. Indoor Built Environ. 2017, 26, 879–901. [Google Scholar] [CrossRef] [PubMed]
- Tirado-Herrero, S. Energy poverty indicators: A critical review of methods. Indoor Built Environ. 2017, 26, 1018–1031. [Google Scholar] [CrossRef]
- Rademaekers, K.; Yearwood, J.; Ferreira, A.; Pye, S.; Hamilton, I.; Anisimova, P.; Grover, D.; Karásek, J. Selecting Indicators to Measure Energy Poverty; Trinomics: Rotterdam, The Netherlands, 2016. [Google Scholar]
- Kyprianou, I.; Serghides, D. Dealing with energy poverty in Cyprus—An overview. Int. J. Sustain. Energy 2020, 39, 308–320. [Google Scholar] [CrossRef]
- Santamouris, M.; Alevizos, S.; Aslanoglou, L.; Mantzios, D.; Milonas, P.; Sarelli, I.; Karatasou, S.; Cartalis, K.; Paravantis, J. Freezing the poor—Indoor environmental quality in low and very low-income households during the winter period in Athens. Energy Build. 2014, 70, 61–70. [Google Scholar] [CrossRef]
- Ayikoe Tettey, U.Y.; Gustavsson, L. Energy savings and overheating risk of deep energy renovation of a multi-storey residential building in a cold climate under climate change. Energy 2020, 202, 117578. [Google Scholar] [CrossRef]
- Pérez-Andreu, V.; Aparicio-Fernández, C.; Martínez-Ibernón, A.; Vivancos, J.L. Impact of climate change on heating and cooling energy demand in a residential building in a Mediterranean climate. Energy 2018, 165, 63–74. [Google Scholar] [CrossRef]
- Gouveia, J.P.; Seixas, J.; Palma, P.; Duarte, H.; Luz, H.; Cavadini, G.B. Positive Energy District: A model for Historic Districts to address Energy Poverty. Front. Sustain. Cities 2021, 3, 648473. [Google Scholar] [CrossRef]
- Barrella, R.; Priego, I.; Linares, J.I.; Arenas, E.; Romero, J.C. Feasibility Study of a Centralised Electrically Driven Air Source Heat Pump Water Heater to Face Energy Poverty in Block Dwellings in Madrid (Spain). Energies 2020, 13, 2723. [Google Scholar] [CrossRef]
- Palma, P.; Gouveia, J.P.; Simoes, S.G. Mapping the energy performance gap of dwelling stock at high-resolution scale: Implications for thermal comfort in Portuguese households. Energy Build. 2019, 190, 246–261. [Google Scholar] [CrossRef]
- Horta, A.; Gouveia, J.P.; Schmidt, L.; Sousa, J.C.; Palma, P.; Simões, S. Energy poverty in Portugal: Combining vulnerability mapping with household interviews. Energy Build. 2019, 203, 109423. [Google Scholar] [CrossRef]
- Niamir, L.; Ivanova, O.; Filatova, T.; Voinov, A.; Bressers, H. Demand-side solutions for climate mitigation: Bottom-up drivers of household energy behavior change in The Netherlands and Spain. Energy Res. Soc. Sci. 2020, 62, 101356. [Google Scholar] [CrossRef]
- Bouzarovski, S. Energy poverty in the European Union: Landscapes of vulnerability. Energy Environ. 2013, 3, 276–289. [Google Scholar] [CrossRef]
- Lin, J. Affordability and access in focus: Metrics and tools of relative energy vulnerability. Electr. J. 2018, 31, 23–32. [Google Scholar] [CrossRef]
- Llera-Sastresa, E.; Scarpellini, S.; Rivera-Torres, P.; Aranda, J.; Zabalza-Bribián, I.; Aranda-Usón, A. Energy vulnerability composite index in social housing, from a household energy poverty. Sustainability 2017, 9, 691. [Google Scholar] [CrossRef]
- Sánchez-Guevara, C.; Peiró, M.N.; González, J.N. Urban Heat Island and Vulnerable Population. The Case of Madrid. Energy Build. 2017, 190, 132–143. [Google Scholar]
- Papada, L.; Kaliampakos, D. A Stochastic Model for energy poverty. Energy Policy 2018, 116, 153–164. [Google Scholar] [CrossRef]
- Besagni, G.; Borgarello, M. The socio-demographic and geographical dimensions of fuel poverty in Italy. Energy Res. Soc. Sci. 2019, 49, 192–203. [Google Scholar] [CrossRef]
- Gouveia, J.P.; Palma, P.; Simoes, S. Energy Poverty vulnerability index: A multidimensional tool to identify hotspots for local action. Energy Rep. 2019, 5, 187–201. [Google Scholar] [CrossRef]
- Sanchez-Guevara, C.; Peiró, M.N.; Taylor, J.; Mavrogianni, A.; González, J.N. Assessing population vulnerability towards summer energy poverty. Case studies of Madrid and London. Energy Build. 2019, 190, 132–143. [Google Scholar] [CrossRef]
- März, S. Assessing the fuel poverty vulnerability of urban neighborhoods using a spatial multi-criteria decision analysis for the German city of Oberhausen. Renew. Sustain. Energy Rev. 2018, 82, 1701–1711. [Google Scholar] [CrossRef]
- Pérez-Fargallo, A.; Rubio-Bellido, C.; Pulido-Arcas, J.A.; Guevara-García, F.J. Fuel Poverty Potential Risk Index in the context of climate change in Chile. Energy Policy 2018, 113, 157–170. [Google Scholar] [CrossRef]
- Jessel, S.; Sawyer, S.; Hernández, D. Energy, Poverty, and Health in Climate Change: A Comprehensive Review of an Emerging Literature. Front. Public Health 2019, 7, 357. [Google Scholar] [CrossRef] [PubMed]
- Castaño-Rosa, R.; Barrella, R.; Sánchez-Guevara, C.; Barbosa, R.; Kyprianou, I.; Paschalidou, E.; Thomaidis, N.S.; Dokupilova, D.; Gouveia, J.P.; Kádár, J.; et al. Cooling Degree Models and Future Energy Demand in the Residential Sector. A Seven-Country Case Study. Sustainability 2021, 13, 2987. [Google Scholar] [CrossRef]
- Ramon, D.; Allacker, K.; De Troyer, F.; Wouters, H.; van Lipzig, N.P. Future heating and cooling degree days for Belgium under a high-end climate change scenario. Energy Build. 2020, 216, 109935. [Google Scholar] [CrossRef]
- Mancini, F.; Basso, G.L. How Climate Change Affects the Building Energy Consumptions Due to Cooling, Heating, and Electricity Demands of Italian Residential Sector. Energies 2020, 13, 410. [Google Scholar] [CrossRef]
- Mirasgedis, S.; Sarafidis, Y.; Georgopoulou, E.; Kotroni, V.; Lagouvardos, K.; Lalas, D.P. Modelling framework for estimating impacts of climate change on electricity demand at regional level: Case of Greece. Conv. Manag. 2007, 48, 1737–1750. [Google Scholar]
- Vurro, G.; Santamaria, V.; Chiarantoni, C.; Fiorito, F. Climate change impact on energy poverty and energy efficiency in the public housing building stock of Bari, Italy. Climate 2022, 10, 55. [Google Scholar] [CrossRef]
- Silva, S.; Soares, I.; Pinho, C. Climate change impacts on electricity demand: The case of a Southern European Country. Util. Policy 2020, 67, 101115. [Google Scholar] [CrossRef]
- Damm, A.; Köberl, J.; Prettenthaler, F.; Rogler, N.; Töglhofer, C. Impacts of +2 °C global warming on electricity demand in Europe. Clim. Serv. 2017, 7, 12–30. [Google Scholar] [CrossRef]
- Costa-Campi, M.T.; Jové-Llopis, E.; Trujillo-Baute, E. La Pobreza Energética en España. Aproximación Desde una Perspectiva de Ingresos [Energy Povery in Spain. Aproximation from an Income Perspective]; Fundación Naturgy: Barcelona, Spain, 2019. [Google Scholar]
- Hossain, B.; Sohel, M.S.; Ryakitimbo, C.M. Climate change induced extreme flood disaster in Bangladesh: Implications on people’s livelihoods in the Char Village and their coping mechanisms. Prog. Disaster Sci. 2020, 6, 100079. [Google Scholar] [CrossRef]
- Khan, I. Drivers, enablers, and barriers to prosumerism in Bangladesh: A sustainable solution to energy poverty? Energy Res. Soc. Sci. 2019, 55, 82–92. [Google Scholar] [CrossRef]
- Hoegh-Guldberg, O.; Jacob, D.; Taylor, M.; Bindi, M.; Brown, S.; Camilloni, I.; Diedhiou, A.; Djalante, R.; Ebi, K.L.; Engelbrecht, F.; et al. Impacts of 1.5 °C Global Warming on Natural and Human Systems. In Global Warming of 1.5°C. An IPCC Special Report on the Impacts of Global Warming of 1.5 °C above Pre-Industrial Levels and Related Global Greenhouse Gas Emission Pathways, in the Context of Strengthening the Global Response to the Threat of Climate Change, Sustainable Development, and Efforts to Eradicate Poverty; IPCC: Geneva, Switzerland, 2018. [Google Scholar]
- Fabbri, K.; Gaspari, J. Mapping the energy poverty: A case study based on the energy performance certificates in the city of Bologna. Energy Build. 2021, 234, 110718. [Google Scholar] [CrossRef]
- Martín-Consuegra, F.; Gómez Giménez, J.M.; Alonso, C.; Córdoba Hernández, R.; Hernández Aja, A.; Oteiza, I. Multidimensional index of fuel poverty in deprived neighbourhoods. Case study of Madrid. Energy Build. 2020, 224, 110205. [Google Scholar]
- ASBH. Agency for Statistics BH, TB10, Labor Force Survey, 2019; ASBH: Sarajevo, Bosnia and Herzegovina, 2020. [Google Scholar]
- Bardazzi, R.; Bortolotti, L.; Pazienza, M.G. To eat and not to heat? Energy poverty and income inequality in Italian regions. Energy Res. Soc. Sci. 2021, 73, 101946. [Google Scholar] [CrossRef]
- Eurostat. Urban and Rural Living in the EU 2020; Eurostat: Luxembourg, 2020. [Google Scholar]
- Bouzarovski, S.; Thomson, H. Towards an Inclusive Energy Transition in the European Union: Confronting Energy Poverty Amidst a Global Crisis; Publications Office of the European Union: Brussels, Belgium, 2020. [Google Scholar]
- Bouzarovski, S.; Simcock, N. Spatializing energy justice. Energy Policy 2017, 107, 640–648. [Google Scholar] [CrossRef]
- Riva, M.; Kingunza Makasi, S.; Dufresne, P.; O’Sullivan, K.; Toth, M. Energy poverty in Canada: Prevalence, social and spatial distribution, and implications for research and policy. Energy Res. Soc. Sci. 2021, 81, 102237. [Google Scholar] [CrossRef]
- Owen, A.; Mitchell, G.; Unsworth, R. R Reducing carbon, tackling fuel poverty: Adoption and performance of air-source heat pumps in East Yorkshire, UK. Local Environ. 2013, 18, 817–833. [Google Scholar] [CrossRef]
- Mould, R.; Baker, K.J. Uncovering hidden geographies and socio-economic influences on fuel poverty using household fuel spend data: A meso-scale study in Scotland. Indoor Build Environ. 2017, 26, 914–936. [Google Scholar] [CrossRef]
- Golubchikov, O.; O’Sullivan, K. Energy periphery: Uneven development and the precarious geographies of low-carbon transition. Energy Build. 2020, 211, 109818. [Google Scholar] [CrossRef]
- Zhao, C.; Niu, S.; Zhang, X. Effects of household energy consumption on environment and its influence factors in rural and urban areas. Energy Procedia 2012, 14, 805–811. [Google Scholar]
- Snell, C.; Bevan, M.; Thomson, T. Justice, fuel poverty and disabled people in England. Energy Res. Soc. Sci. 2015, 10, 123–132. [Google Scholar] [CrossRef]
- Robic, S.; Ancic, B. Exploring health impacts of living in energy poverty: Case study Sisak-Moslavina County, Croatia’. Energy Build. 2018, 169, 379–387. [Google Scholar] [CrossRef]
- Simcock, N.; Jenkins, K.E.; Lacey-Barnacle, M.; Martiskainen, M.; Mattioli, G.; Hopkins, D. Identifying double energy vulnerability: A systematic and narrative review of groups at-risk of energy and transport poverty in the global north. Energy Res. Soc. Sci. 2021, 82, 102351. [Google Scholar] [CrossRef]
- OpenEx. European Energy Poverty Index; OpenEx, European Commission: Brussels, Belgium, 2019. [Google Scholar]
- European Commission. A Harmonised Definition of Cities and Rural Areas: The New Degree of Urbanisation. WP 2014, 1, 2014. [Google Scholar]
- CBS. What is an Urban Locality? Defining “Urban Locality” in Israel and the Formation of a Statistical Model for Characterizing Localities, in WP No. 28; CBS: Tel-Aviv, Israel, 2017. [Google Scholar]
- Goss, S. National Human Development Report for B&H; UNDP: Sarajevo, Bosnia and Herzegovina, 2013. [Google Scholar]
- Official_Gazette_of_North_Macedonia. Списoк на Рурални Пoдрачја вo Република Македoнија (List of Rural Areas in the Republic of Macedonia); Official Gazette of the Republic of North Macedonia: Skopje, North Macedonia, 2008. [Google Scholar]
- EPAH. Energy Poverty National Indicators Dashboard, in EU Energy Poverty Advisory HUB. DG Energy, European Commission. 2023. Available online: https://energy-poverty.ec.europa.eu/observing-energy-poverty/national-indicators_en (accessed on 18 April 2024).
- Gouveia, J.P.; Palma, P.; Bessa, S.; Mahoney, K.; Sequeira, M. Energy Poverty National Indicators: Insights for a more effective measurement. In EU Energy Poverty Advisory HUB; DG Energy, European Commission: Brussels, Belgium, 2022; Available online: https://indicator.energypoverty.eu/modules/custom/epah_inidcator_frontend/pdfs/EPAH_Energy_Poverty_Indicators_Report_20221109.pdf (accessed on 18 April 2024).
- Healy, J.D.; Clinch, J.P. Quantifying the severity of fuel poverty, its relationship with poor housing and reasons for non-investment in energy-saving measures in Ireland. Energy Policy 2004, 32, 207–220. [Google Scholar] [CrossRef]
- Fahmy, E.; Gordon, D.; Patsios, D. Predicting fuel poverty at a small-area level in England. Energy Policy 2011, 39, 4370–4377. [Google Scholar] [CrossRef]
- Brunner, K.-M.; Spitzer, M.; Christanell, A. Experiencing fuel poverty. Coping strategies of low-income households in Vienna/Austria. Energy Policy 2012, 49, 53–59. [Google Scholar] [CrossRef]
- Bouzarovski, S.; Herrero, S.T.; Petrova, S.; Ürge-Vorsatz, D. Unpacking the spaces and politics of energy poverty: Path-dependencies, deprivation and fuel switching in post-communist Hungary. Local Environ. 2016, 21, 1151–1170. [Google Scholar] [CrossRef]
- Chard, R.; Walker, G. Living with fuel poverty in older age: Coping strategies and their problematic implications. Energy Res. Soc. Sci. 2016, 18, 62–70. [Google Scholar] [CrossRef]
- Eurostat. Energy Statistics—Cooling and Heating Degree Days; Eurostat. 2020. Available online: https://ec.europa.eu/eurostat/cache/metadata/en/nrg_chdd_esms.htm (accessed on 15 June 2022).
- Niamir, L.; Ivanova, O.; Filatova, T. Economy-wide impacts of behavioral climate change mitigation: Linking agent-based and computable general equilibrium models. Environ. Model. Softw. 2020, 134, 104839. [Google Scholar] [CrossRef]
- Eurostat. People in the EU—Statistics on Housing Conditions; Eurostat: Luxembourg, 2015. [Google Scholar]
- Daniel, L.; Moore, T.; Baker, E.; Beer, A.; Willand, N.; Horne, R.; Hamilton, C. Warm, Cool and Energy-Affordable Housing Policy Solutions for Low-Income Renters; HURi: Melbourne, Australia, 2020. [Google Scholar]
- Olonscheck, M.; Holsten, A.; Kropp, J.P. Heating and cooling energy demand and related emissions of the German residential building stock under climate change. Energy Policy 2011, 39, 4795–4806. [Google Scholar] [CrossRef]
- SIEA. Náklady na Vykurovanie; SIEA: Bratislava, Slovakia, 2019. [Google Scholar]
- Eurostat. Real GDP per Capita; Eurostat: Luxembourg, 2020. [Google Scholar]
- Economic Characteristics/2011; Hellenic Statistical Authority: Piraeus, Greece, 2011; Available online: https://www.statistics.gr/el/statistics/-/publication/SAM04/2011 (accessed on 22 April 2021).
- Characteristics of Houses—Households/2011; Hellenic Statistical Authority: Piraeus, Greece, 2011; Available online: https://www.statistics.gr/el/statistics/-/publication/SAM05/2011 (accessed on 22 April 2021).
- Demographic Characteristics; Hellenic Statistical Authority: Piraeus, Greece, 2011; Available online: https://www.statistics.gr/el/statistics/-/publication/SAM03/2011 (accessed on 22 April 2021).
- Statistical Bulletin of Tax Data 2011; Greek Ministry of Finance: Athens, Greece, 2011. Available online: https://www.gsis.gr/sites/default/files/2019-06/statdeltio2011.pdf (accessed on 6 June 2024).
- Central Bureau of Statistics Israel. Demography; Central Bureau of Statistics Israel: Jerusalem, Israel, 2020.
- Centraal Bureau voor de Statisriek. Welvaart in Nederland 2019; Centraal Bureau voor de Statisriek: The Hague, The Netherlands, 2019. [Google Scholar]
- State Statistical Office of the Republic of Macedonia. Labour Force Survey 2017; State Statistical Office of the Republic of Macedonia: Skopje, Republic of Macedonia, 2018.
- Instituto Nacional de Estadística. Portuguese CENSUS 2011; Instituto Nacional de Estadística: Lisbon, Portugal, 2011. [Google Scholar]
- Statistical Office of Slovak Republic. 2020. Available online: https://datacube.statistics.sk/ (accessed on 22 April 2021).
- Instituto Nacional de Estadística. Spanish CENSUS 2011; Instituto Nacional de Estadística: Madrid, Spain, 2011. [Google Scholar]
- Sabanovic, E. Basic Consumption and Income Based Indicators of Economic Inequalities in Bosnia and Herzegovina: Evidence from Household Budget Surveys, Expert Meeting on Measure of Poverty and Inequality; UNECE: Budva, Montenegro, 2017. [Google Scholar]
- State Statistical Office. Survey on Income and Living Conditions 2017; State Statistical Office: Sarajevo, Bosnia and Herzegovina, 2018.
- Central Bureau of Statistics. Between Center to the Periphery: Main Findings from the Society in Israel Central Bureau of Statistics Israel; Central Bureau of Statistics: Jerusalem, Israel, 2019.
- Camarero Rioja, L. (Ed.) The Rural Population in Spain. From Disequilibrium to Social Sustainability; Fundación La Caixa: Barcelona, Spain, 2009. [Google Scholar]
- Barrella, R.; Romero, J.C.; Linares, J.I.; Arenas, E.M.; Asín, M.; Centeno, E. The dark side of energy poverty: Who is underconsuming in Spain and why? Energy Res. Soc. Sci. 2022, 86, 102428. [Google Scholar] [CrossRef]
- State Statistical Office of the Republic of Macedonia. Energy Consumption in Households 2014; State Statistical Office of the Republic of Macedonia: Skopje, Republic of Macedonia, 2015.
- Žurovec, O.; Vedeld, P.O. Rural Livelihoods and Climate Change Adaptation in Laggard Transitional Economies: A Case from B&H. Sustainability 2019, 11, 6079. [Google Scholar]
- SOSR. Source of Heating; SOSR: Bratislava, Slovakia, 2019. [Google Scholar]
- Stojilovska, A.; Dokupilová, D.; Gouveia, J.P.; Bajomi, A.Z.; Tirado-Herrero, S.; Feldmár, N.; Kyprianou, I.; Feenstra, M. As essential as bread: Fuelwood use as a cultural practice to cope with energy poverty in Europe. Energy Res. Soc. Sci. 2023, 97, 102987. [Google Scholar] [CrossRef]
- Central Bureau of Statistics Israel. Household Income and Expenditure, Data From the 2018 Household Expenditure Survey; Central Bureau of Statistics Israel: Jerusalem, Israel, 2019.
- Centraal Bureau voor de Statistiek. Warmtemonitor 2019; Centraal Bureau voor de Statistiek: The Hague, The Netherlands, 2020. [Google Scholar]
- Directorate for Energy and Geology. Energy. Statistics; Directorate for Energy and Geology: Lisboa, Portugal, 2020. [Google Scholar]
- Cuchí, A.; Arcas Abella, J.; Pages, R. Estudio de la Distribución del Consumo Energético Residencial para Calefacción en España; UPCommons: Catalonia, Spain, 2017. [Google Scholar]
- Barrella, R.; Linares, J.I.; Romero, J.C.; Arenas, E.M. Evaluating the impact of energy efficiency strategies on households’ energy affordability: A Spanish case study. Energy Build. 2023, 295, 113289. [Google Scholar] [CrossRef]
- GGHR Government Gazette of the Hellenic Republic. Series II 974; GGHR: Athens, Greece, 2021. [Google Scholar]
- Hellenic Ministry of Environment and Energy, Energy Inspection of Buildings. Statistical Analysis for the Year 2019 and 2011–2019 Time Period; Hellenic Ministry of Environment and Energy, Energy Inspection of Buildings: Athens, Greece, 2020.
- Regionale Klimaatmonitor; Nederlandse Rijksoverheid: Hague, the Netherlands. Available online: https://klimaatmonitor.databank.nl/Jive?sel_guid=e4d51b17-0786-4d2a-b1e6-217b54b5a0ba (accessed on 1 November 2021).
- Adene. Certificação Energética de Edifícios [Energy Certification of Buildings]. ADENE—Portuguese Energy Agency. 2021. Available online: https://www.sce.pt/certificacao-energetica-de-edificios-3/consumidores (accessed on 1 November 2021).
- INFOREG. Central Registry of Energy Pefrormance Certificates; INFOREG: Bratislava, Slovakia, 2021. [Google Scholar]
- IDAE. Estado de la Certificación Energética de los Edificios (8o Informe); Ministerio de Fomento, Instituto para la Diversificación y Ahorro de la Energía IDAE: Madrid, Spain, 2019. [Google Scholar]
- Bouzarovski, S.; Petrova, S.; Sarlamanov, R. Energy poverty policies in the EU: A critical perspective. Energy Policy 2012, 49, 76–82. [Google Scholar] [CrossRef]
- Roberts, D.; Vera-Toscano, E.; Phimister, E. Fuel poverty in the UK: Is there a difference between rural and urban areas? Energy Policy 2015, 87, 216–223. [Google Scholar] [CrossRef]
- Stojilovska, A. Energy poverty and the role of institutions: Exploring procedural energy justice—Ombudsman in focus. J. Environ. Policy Plan. 2023, 25, 169–181. [Google Scholar] [CrossRef]
- Petrova, S.; Prodromidou, A. Everyday politics of austerity: Infrastructure and vulnerability in times of crisis. Environ. Plan. C Politics Space 2019, 37, 1380–1399. [Google Scholar] [CrossRef]
- Robinson, C.; Lindley, S.; Bouzarovski, S. The Spatially Varying Components of Vulnerability to Energy Poverty. Ann. Am. Assoc. Geogr. 2019, 109, 1188–1207. [Google Scholar] [CrossRef]
- Jenkins, K.; McCauley, D.; Heffron, R.; Stephan, H.; Rehner, R. Energy justice: A conceptual review. Energy Res. Soc. Sci. 2016, 11, 174–182. [Google Scholar] [CrossRef]
- Barrella, R.; Linares, J.I.; Romero, J.C.; Arenas, E.; Centeno, E. Does cash money solve energy poverty? Assessing the impact of household heating allowances in Spain. Energy Res. Soc. Sci. 2021, 80, 102216. [Google Scholar] [CrossRef]
- Barrella, R.; Romero, J.C.; Centeno, E. Unveiling Hidden Energy Poverty in a Time of Crisis: A Methodological Approach for National Statistics, in Living with Energy Poverty: Perspectives from the Global North and South; Routledge: London, UK, 2024. [Google Scholar]
- Dokupilová, D.; Filčák, R. Regional disparities as roots of energy poverty in Slovakia. In Perspectives on Energy PovertyEP in Post-Communist Europe; Routledge: London, UK, 2021; pp. 206–221. [Google Scholar]
- Gouveia, J.P. Residential Sector Energy Consumption at the Spotlight: From Data to Knowledge; Faculty of Sciences and Technology, Nova University of Lisbon: Lisbon, Portugal, 2017. [Google Scholar]
- Eurostat. Population; Eurostat: Luxembourg, 2020. [Google Scholar]
- Eurostat. Statistics on Rural Areas in the EU; Eurostat: Luxembourg, 2018. [Google Scholar]
- Eurostat. Arrears on Utility Bills—EU-SILC Survey; Eurostat: Luxembourg, 2020. [Google Scholar]
- BHAS. Demography 2019; BHAS: Sarajevo, Bosnia and Herzegovina, 2020. [Google Scholar]
- Central Bureau of Statistics Israel. Population, by Population Group Religion. Age, Sex and Type of Locality; Central Bureau of Statistics Israel: Jerusalem, Israel, 2019.
- World Bank. 2018. Available online: https://data.worldbank.org/ (accessed on 1 November 2021).
- POV. Arrears on Utility Bills; POV: Tel-Aviv, Israel, 2018. Available online: https://www.gov.il/BlobFolder/generalpage/dochpanatz/he/Files_Tzarchanut_doch_tzarchanut_%D7%A0bakara_2019.pdf?fbclid=IwAR26-c9qAbgCfB-qJ1bEN-8Hl-N3Ty7lvA9bGSEjTLQzX8SdYxs7FFj46ao (accessed on 1 November 2021).
- Latet. Alternative Poverty Report; Latet: Tel-Aviv, Israel, 2020; Available online: https://www.latet.org.il/upload/files/16074106265fcf23c27d249266981.pdf?fbclid=IwAR0_zjhQc0H3dC-NNc1XE71iNqqc3BGIWTe4s4cMgN-OYBFCUMjL4rbb1Uo (accessed on 1 November 2021).
- Meteonorm, M. Available online: https://meteonorm.com/en/meteonorm-features (accessed on 12 June 2022).
- BHAS. Federal Hydrometeorological Institute of Bosnia and Herzegovina; BHAS: Sarajevo, Bosnia and Herzegovina, 2013. [Google Scholar]
- Centraal Bureau of Statistiek. Bevolkingsteller; Centraal Bureau of Statistiek: Hague, The Netherlands, 2020. [Google Scholar]
- SSO. Census of Population 2002; SSO: Skopje, Republic of Macedonia, 2005. [Google Scholar]
- SSO. Statistical Yearbook 2013/Population; SSO: Skopje, Republic of Macedonia, 2013. [Google Scholar]
- SOSR. Demography; SOSR: Bratislava, Slovakia, 2011. [Google Scholar]
- Ministerio de Trabajo y Economía Social. Informe del Mercado de Trabajo de Sevilla. Datos 2019; Servicio Público de Empleo Estatal: Madrid, Spain, 2020; Available online: https://www.mites.gob.es/es/sec_trabajo/analisis-mercado-trabajo/index.htm (accessed on 12 June 2022).

| Features Relevant to EP and Climate Change | EP Indicators | Description and Justification |
|---|---|---|
| Sociodemographic | Unemployment rate | (%)—The share of unemployed persons as a percentage of the labour force. When unemployed, households face financial limitations in their ability to afford energy, which can also impact mental well-being and ability to invest in home improvement [13]. |
| Average income per household | (Net per month in EUR)—Available income after income taxes and social contributions. It influences the ability of households to afford adequate levels of energy consumption and invest in energy efficiency measures [13]. | |
| Share of elderly population and children | (%)—Number of people older than 65 years (in Greece 60 years) and younger than five years (in Greece 9 years) to the whole population. The elderly and children are more vulnerable to EP due to higher levels of dependency, while a low share of children reflects population ageing, implying future vulnerability [38,80]. | |
| Share of inhabitants with a university degree | (%)—Number of people with tertiary education to the whole population. It is used as a proxy for the population’s awareness and ability to react to thermal discomfort and search for solutions due to their higher education and knowledge. More educated people live in more energy-efficient dwellings [82]. | |
| Housing | Share of population living in an owner-occupied dwelling | (%)—Proportion of households occupied by homeowners [83]. Dwellers who own the place where they live have a higher ability to implement energy efficiency measures, while renters are more limited in their actions and tend to have poorer quality dwellings compared to other ones [84]. |
| Social housing | Social houses generally have poorer construction and are occupied by lower-income households, hence being potentially more vulnerable to EP [34]. | |
| Dwellings with energy performance certificates (EPC) | (%)—Proportion of buildings with EPC in the housing stock. High energy-efficient buildings usually have lower energy requirements, which translates to lower energy bills for their occupants [85]. | |
| Building stock age (the year of construction) | Older building typologies tend to be more energy-intensive, needing energy renovation and reconstruction to achieve energy performance standards defined in the current legislation [24]. | |
| Type of heating equipment | Along with its energy carrier, varying efficiency rates, and infrastructure, it influences the cost of adequate heating, with impacts on air quality [86]. | |
| Climate zone | Heating degree-days (HDDs) | A difference between the outside daily temperature (if lower than 15 °C) and the value of 18 °C [81]. It is another factor also determining the amount of energy necessary to obtain appropriate indoor temperature, and it is bound to increase due to climate change [85] |
| Location | Urban/Rural | Unemployment Rate (%) | Average Monthly Income (€) per Household | Children under 5 Years Old (%) | Elderly Population 65+ (%) | Population with a University Degree (%) | Dwelling Ownership—Occupancy (%) | Social Housing Dwellings (%) |
|---|---|---|---|---|---|---|---|---|
| Sarajevo | U | 28.10% | 576 | 6.00% | 16.00% | 13.10% | n/a | |
| Mostar | U | 34.60% | 506.5 | 7.00% | 18.00% | 8.40% | n/a | |
| Brod | R | 38.50% | 453 | 4.00% | 17.00% | 2.60% | n/a | 2.81% |
| Livno | R | 39.60% | 431.05 | 5.00% | 13.00% | 7.30% | n/a | |
| Athens | U | 20.38% | 1787 | 7.82% | 24.47% | 24.39% | 56.72% | n/a |
| Thessaloniki | U | 23.28% | 1412 | 10.18% | 22.52% | 25.19% | 62.68% | n/a |
| Kyllini | R | 14.76% | 1119 | 9.00% | 28.13% | 8.18% | 81.53% | n/a |
| Agiasma | R | 18.59% | 1209 | 9.46% | 28.84% | 8.31% | 82.88% | n/a |
| Jerusalem | U | 5.1% | 2630 | 12.50% | 9.00% | 25–5% | n/a | n/a. |
| Beit Dagan | U | n/a | n/a | n/a | n/a | n/a | n/a | n/a |
| Gilat | R | n/a | n/a | n/a | n/a | n/a | n/a | n/a |
| Amsterdam | U | 4.20% | 2408.33 | 5.30% | 12.70% | 45.80% | 29.91% | 40.97% |
| Tilburg | U | 4.00% | 1966.67 | 4.70% | 16.90% | 29.10% | 50.88% | 33.05% |
| Groningen | U | 5.40% | 1941.67 | 4.20% | 14.70% | 38.00% | 41.75% | 34.20% |
| Losser | R | 4.40% | 2016.66 | 4.50% | 25, 08% | 22.70% | 67.00% | 25.00% |
| Skopje | U | 29.00% | n/a | n/a | n/a | n/a | n/a | n/a |
| Ohrid | U | 36.40% | n/a | n/a | n/a | n/a | n/a | n/a |
| Lazaropole | R | 30.70% | n/a | n/a | n/a | n/a | n/a | n/a |
| Kriva Palanka | R | 44.00% | n/a | n/a | n/a | n/a | n/a | n/a |
| Lisbon | U | 5.60% | 1579.20 | 4.40% | 23.90% | 26.80% | 52.80% | 2.10% |
| Porto | U | 8.30% | 1336.97 | 3.60% | 23.20% | 22.30% | 50.70% | 13.80% |
| Bragança | R | 4.10% | 951.2 | 2.10% | 39.50% | 5.90% | 95.90% | 1.90% |
| Évora | R | 4.40% | 1078.10 | 4.20% | 26.90% | 6.30% | 70.00% | 3.50% |
| Bratislava | U | 4.50% | 1348 | 7.70% | 18.54% | 27.20% | 80.00% | 1.00% |
| Poprad | U | (*) 7.08% | (*) 888 | 5.76% | 17.05% | (*) 12.10% | 91.00% | 1.00% |
| Hokovce | R | (*) 6.82% | (*) 895 | 5.53% | 20.29% | (*) 8.20% | 99.00% | 0.00% |
| Telgart | R | (*) 8.68% | (*) 820 | 8.36% | 13.52% | (*) 9.97% | 99.00% | 0.00% |
| León | U | 18.34% | 1112.80 | 3.75% | 23.38% | 22.42% | 74.85% | 0.32% |
| Sevilla | U | 24.54% | 703.4 | 5.36% | 17.10% | 22.26% | 82.55% | 0.29% |
| Morón | R | 24.16% | 938.4 | 5.04% | 16.71% | 7.20% | 87.76% | 0.11% |
| Ponferrada | R | 21.80% | 945.5 | 4.14% | 19.98% | 15.03% | 81.76% | 0.32% |
| Location | Sociodemographic characteristics that determine higher vulnerability (unemployment, income, elderly, children, university degree). |
| Rural | Lower income (Spain, Portugal, B&H, Greece, North Macedonia, Slovakia), higher unemployment (Israel, Slovakia, B&H), higher share of elderly population (Portugal, Greece), lower education (Spain, B&H, Greece, The Netherlands, Portugal, Slovakia), lower availability of social housing (The Netherlands, Slovakia). |
| Urban | Higher unemployment (Greece, The Netherlands, North Macedonia, Portugal), elderly (B&H), single-parent (B&H, Portugal), single-person (North Macedonia), pensioners (North Macedonia), lower dwelling ownership (Greece, The Netherlands, Portugal, Slovakia). |
| Country | Location | With EPC | No EPCs | Source | |||||||
|---|---|---|---|---|---|---|---|---|---|---|---|
| A | B | C | D | E | F | G | |||||
| Greece | Athens | U | 0.04% | 1.40% | 7.80% | 13.47% | 15.22% | 24.69% | 37.39% | 49.21% | [112,113] |
| Thessaloniki | U | 0.05% | 2.59% | 13.04% | 21.55% | 20.26% | 14.77% | 27.73% | 42.19% | ||
| Kyllini | R | 0.00% | 0.70% | 6.96% | 12.99% | 16.47% | 15.78% | 47.10% | 95.69% | ||
| Agiasma | R | 0.20% | 5.36% | 10.27% | 22.14% | 16.73% | 10.19% | 35.11% | 75.56% | ||
| The Netherlands | Amsterdam | U | 23.67% | 16.30% | 24.15% | 16.95% | 9.63% | 5.04% | 4.24% | 0.00% | [114] |
| Groningen | U | 24.63% | 15.27% | 29.41% | 15.60% | 7.79% | 3.90% | 3.40% | 0.00% | ||
| Losser | U | 26.46% | 17.20% | 29.36% | 12.25% | 6.47% | 3.88% | 4.38% | 0.00% | ||
| Tilburg | R | 30.09% | 16.21% | 25.26% | 13.35% | 8.22% | 4.31% | 2.55% | 0.00% | ||
| Portugal | Lisbon | U | 10.53% | 18.42% | 28.95% | 26.32% | 13.16% | 5.26% | 0.00% | 62.00% | [115] |
| Porto | U | 12.20% | 29.27% | 24.39% | 19.51% | 9.76% | 4.88% | 0.00% | 59.00% | ||
| Bragança | R | 25.00% | 25.00% | 12.50% | 12.50% | 12.50% | 12.50% | 0.00% | 84.00% | ||
| Évora | R | 5.00% | 15.00% | 20.00% | 30.00% | 20.00% | 10.00% | 0.00% | 80.00% | ||
| Slovakia | Bratislava | U | 19.57% | 36.96% | 32.61% | 8.70% | 0.00% | 0.00% | 2.17% | 99.54% | [116] |
| Poprad | U | 30.88% | 26.47% | 20.59% | 11.76% | 7.35% | 0.00% | 2.94% | 98.64% | ||
| Hokovce | R | 0.00% | 0.00% | 0.00% | 0.00% | 0.00% | 0.00% | 0.00% | 100% | ||
| Telgart | R | 0.00% | 0.99% | 0.00% | 0.00% | 0.00% | 0.00% | 0.00% | 99.01% | ||
| Spain | Leon | U | 1.11% | 1.04% | 4.44% | 14.07% | 55.72% | 11.02% | 12.61% | 85.57% | [97,117] |
| Seville | U | 0.43% | 1.71% | 4.09% | 10.36% | 53.62% | 9.76% | 20.03% | 76.54% | ||
| Morón | R | 0.43% | 1.71% | 4.09% | 10.36% | 53.62% | 9.76% | 20.03% | 76.54% | ||
| Ponferrada | R | 1.11% | 1.04% | 4.44% | 14.07% | 55.72% | 11.02% | 12.61% | 85.57% | ||
| Housing Characteristics | Bosnia and Herzegovina | Greece | Israel | The Netherlands | North Macedonia | Portugal | Slovakia | Spain |
|---|---|---|---|---|---|---|---|---|
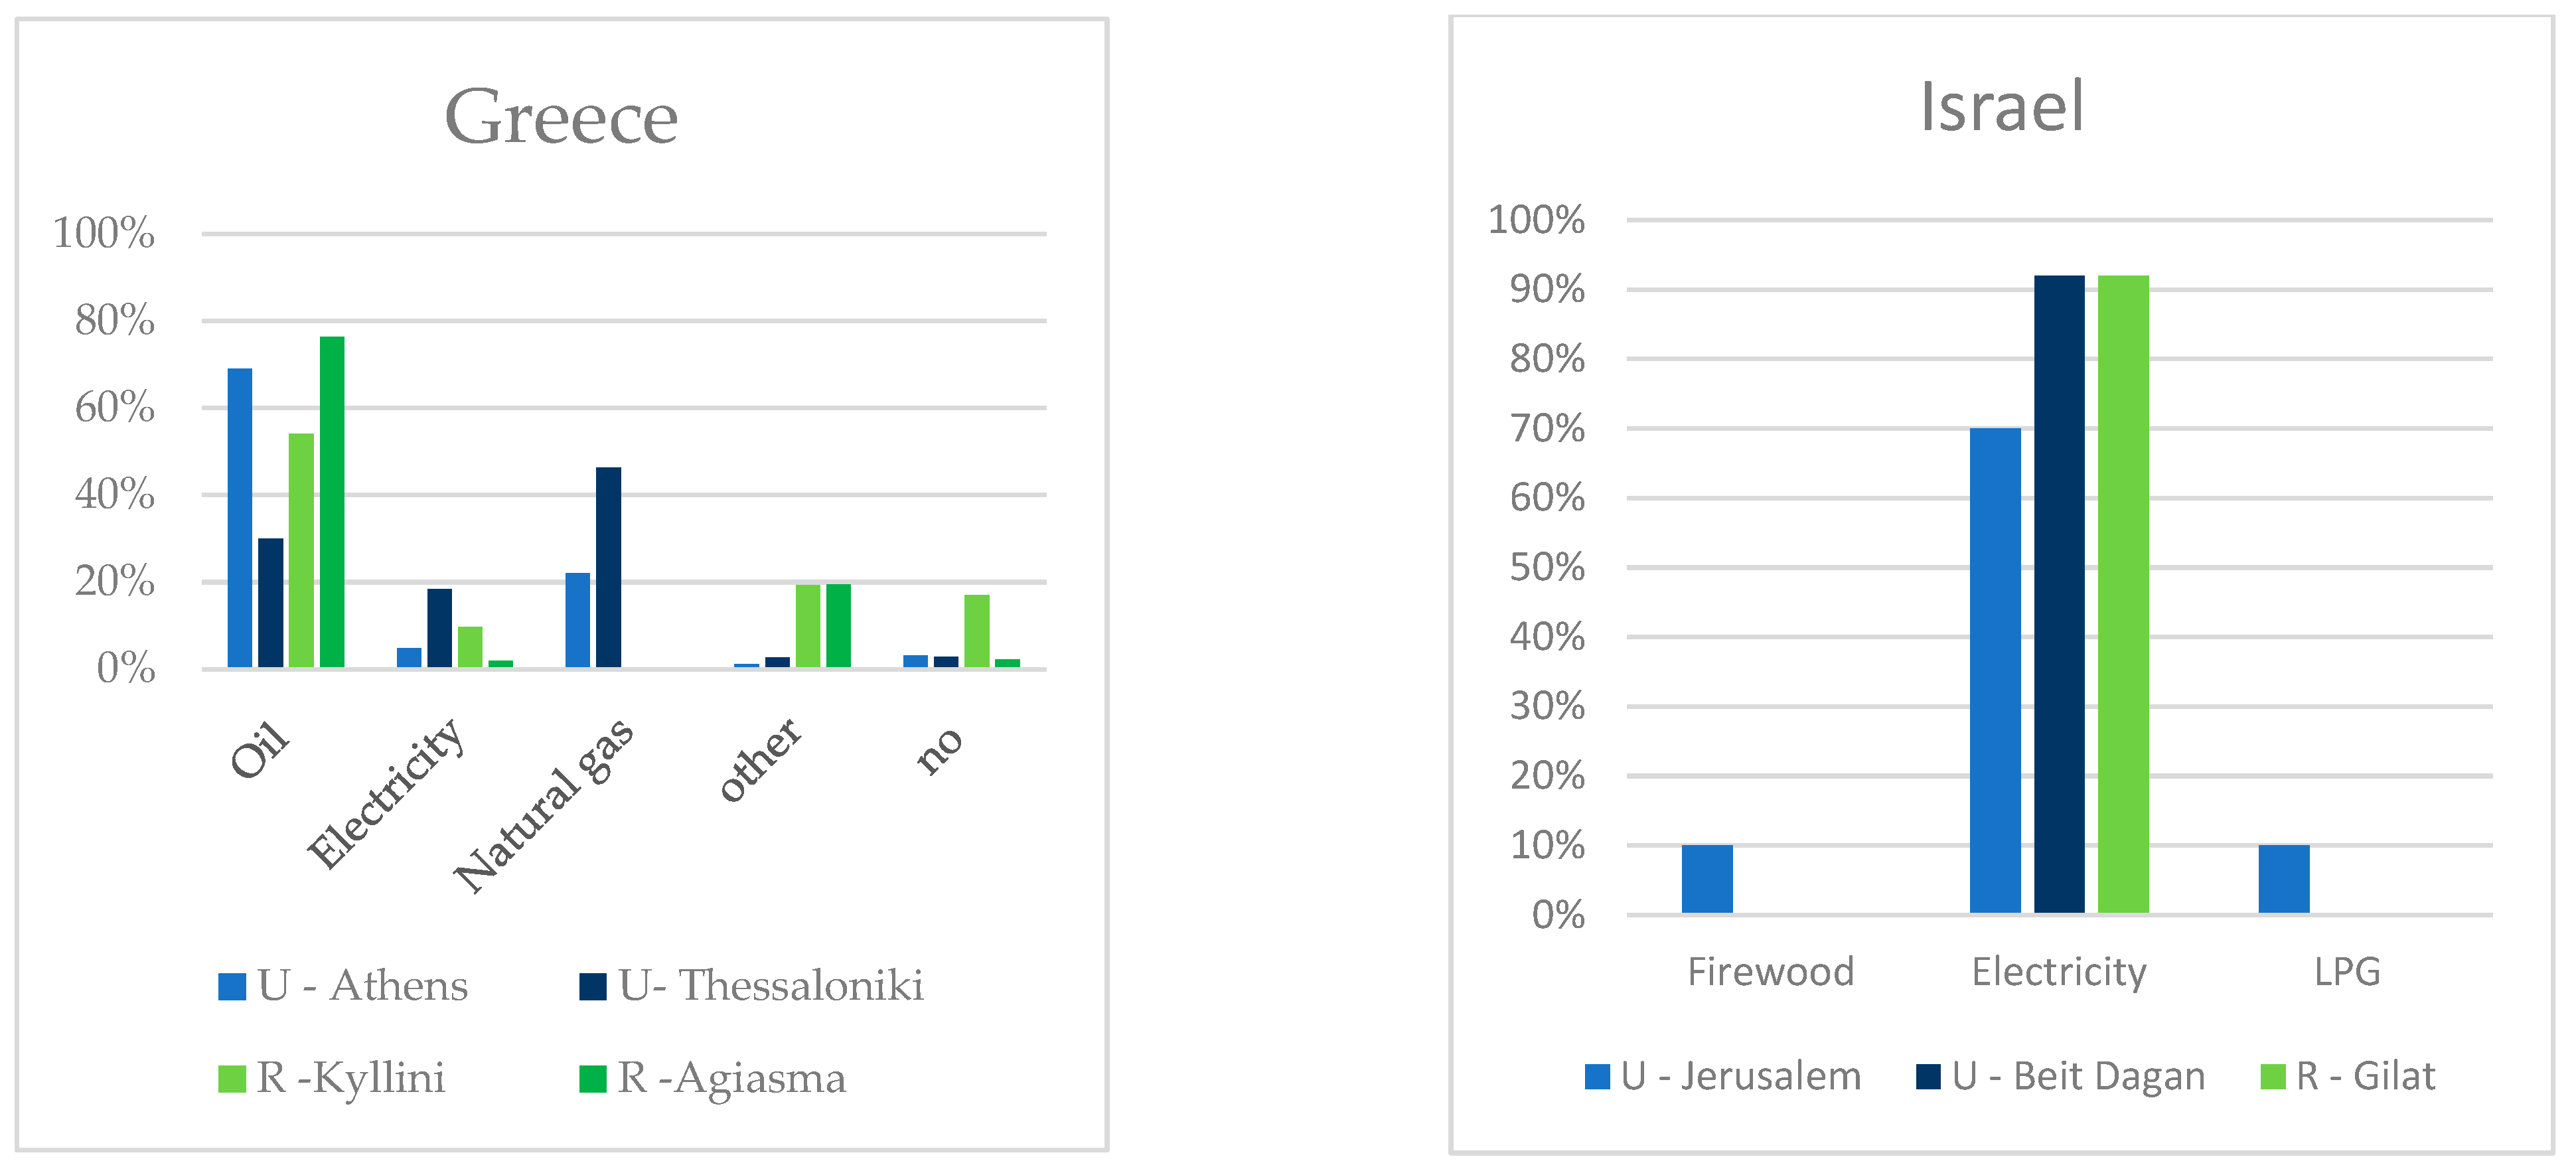
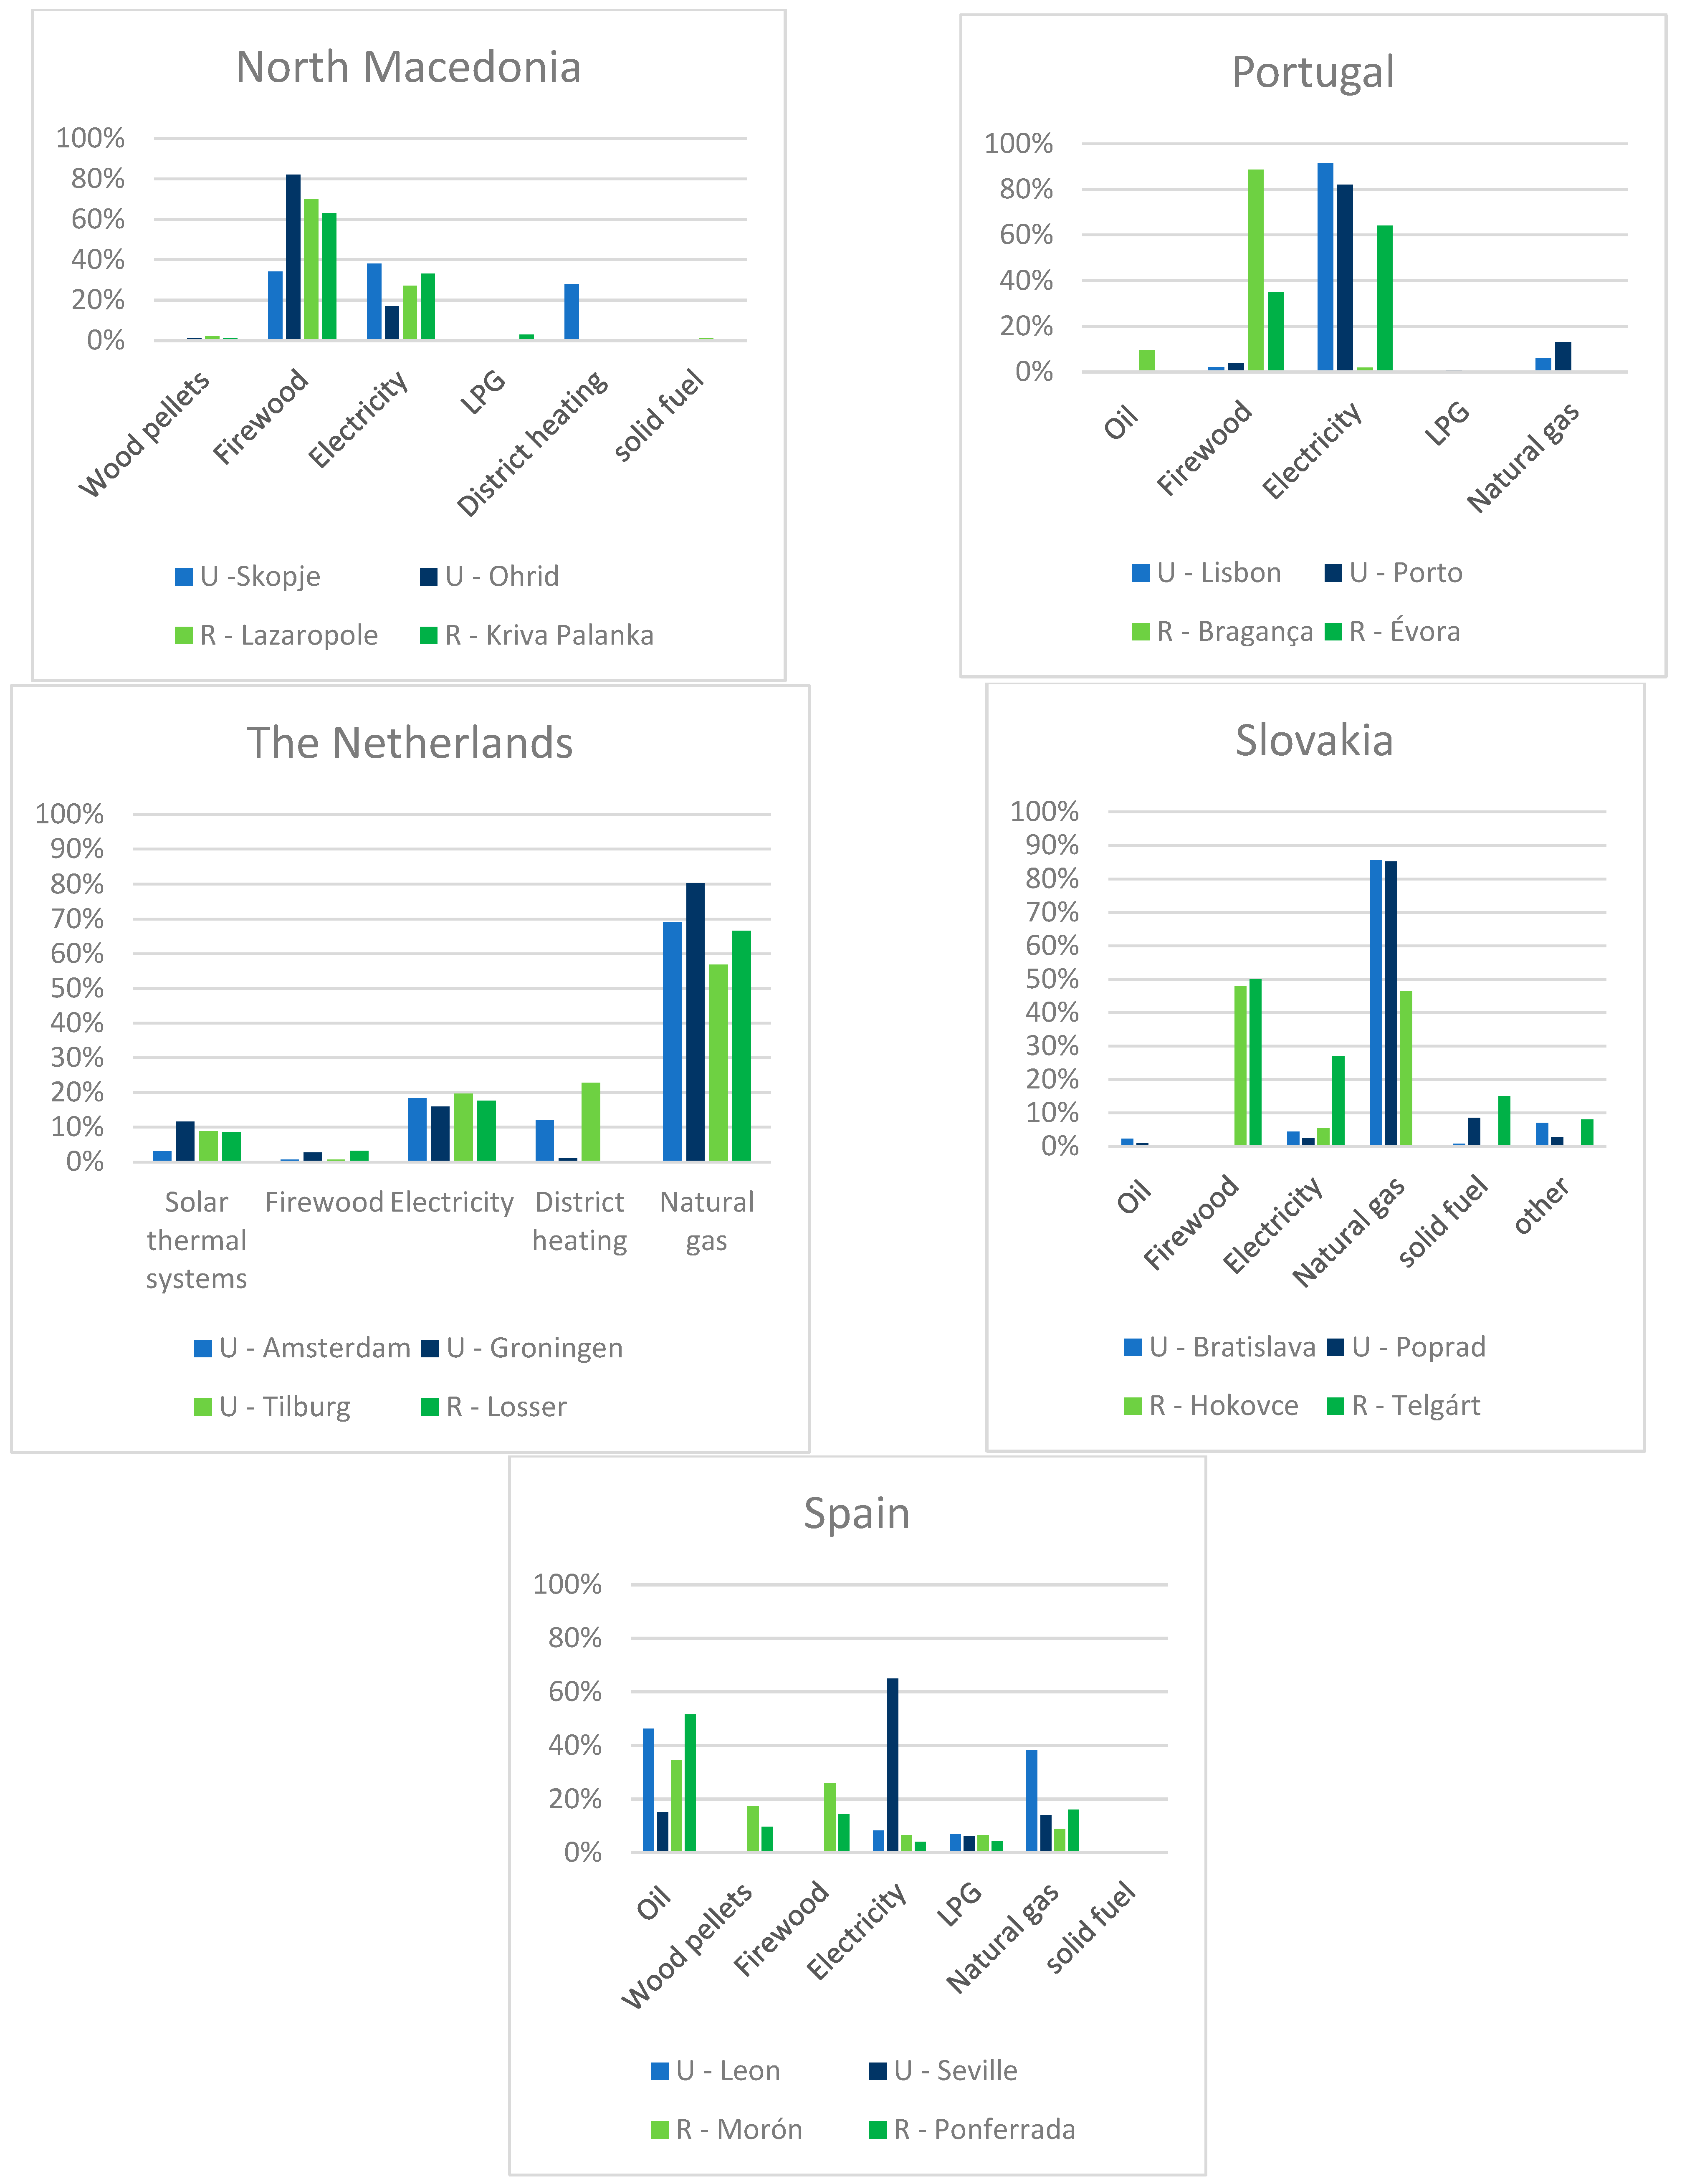
| Prevalent use of fuelwood | R + U | R | R | |||||
| Use of oil for heating | R | |||||||
| Less efficient heating and appliances | R | |||||||
| Poorer dwelling insulation | R | R | ||||||
| Reduced heated space in dwellings | R | |||||||
| Lower share of EPC | R | |||||||
| Higher share of house typology | R | R | R | R | ||||
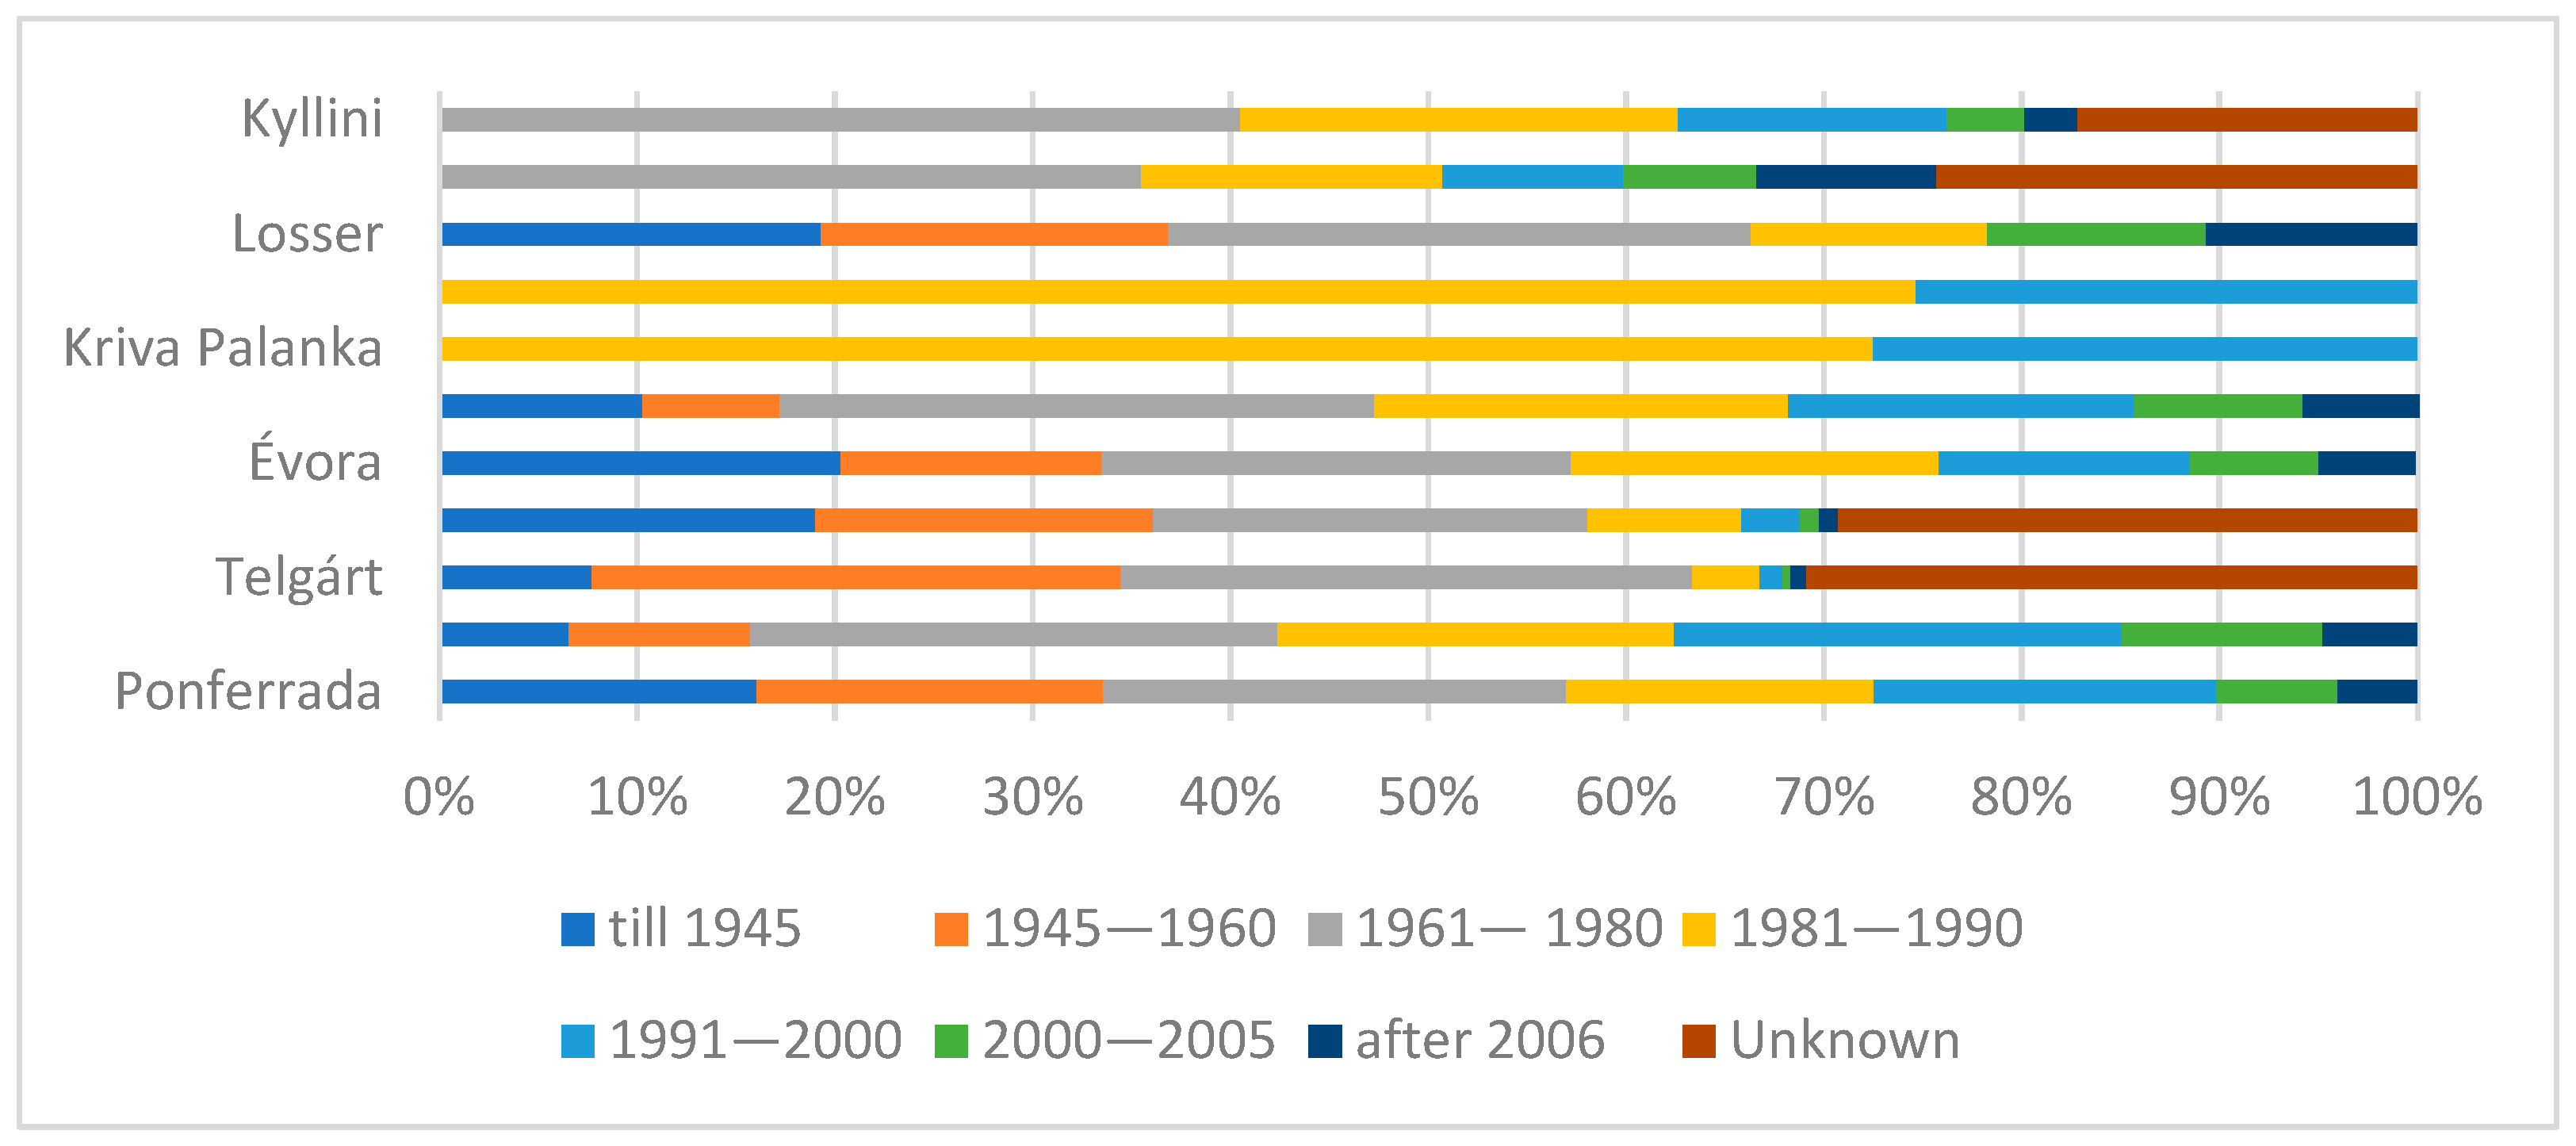
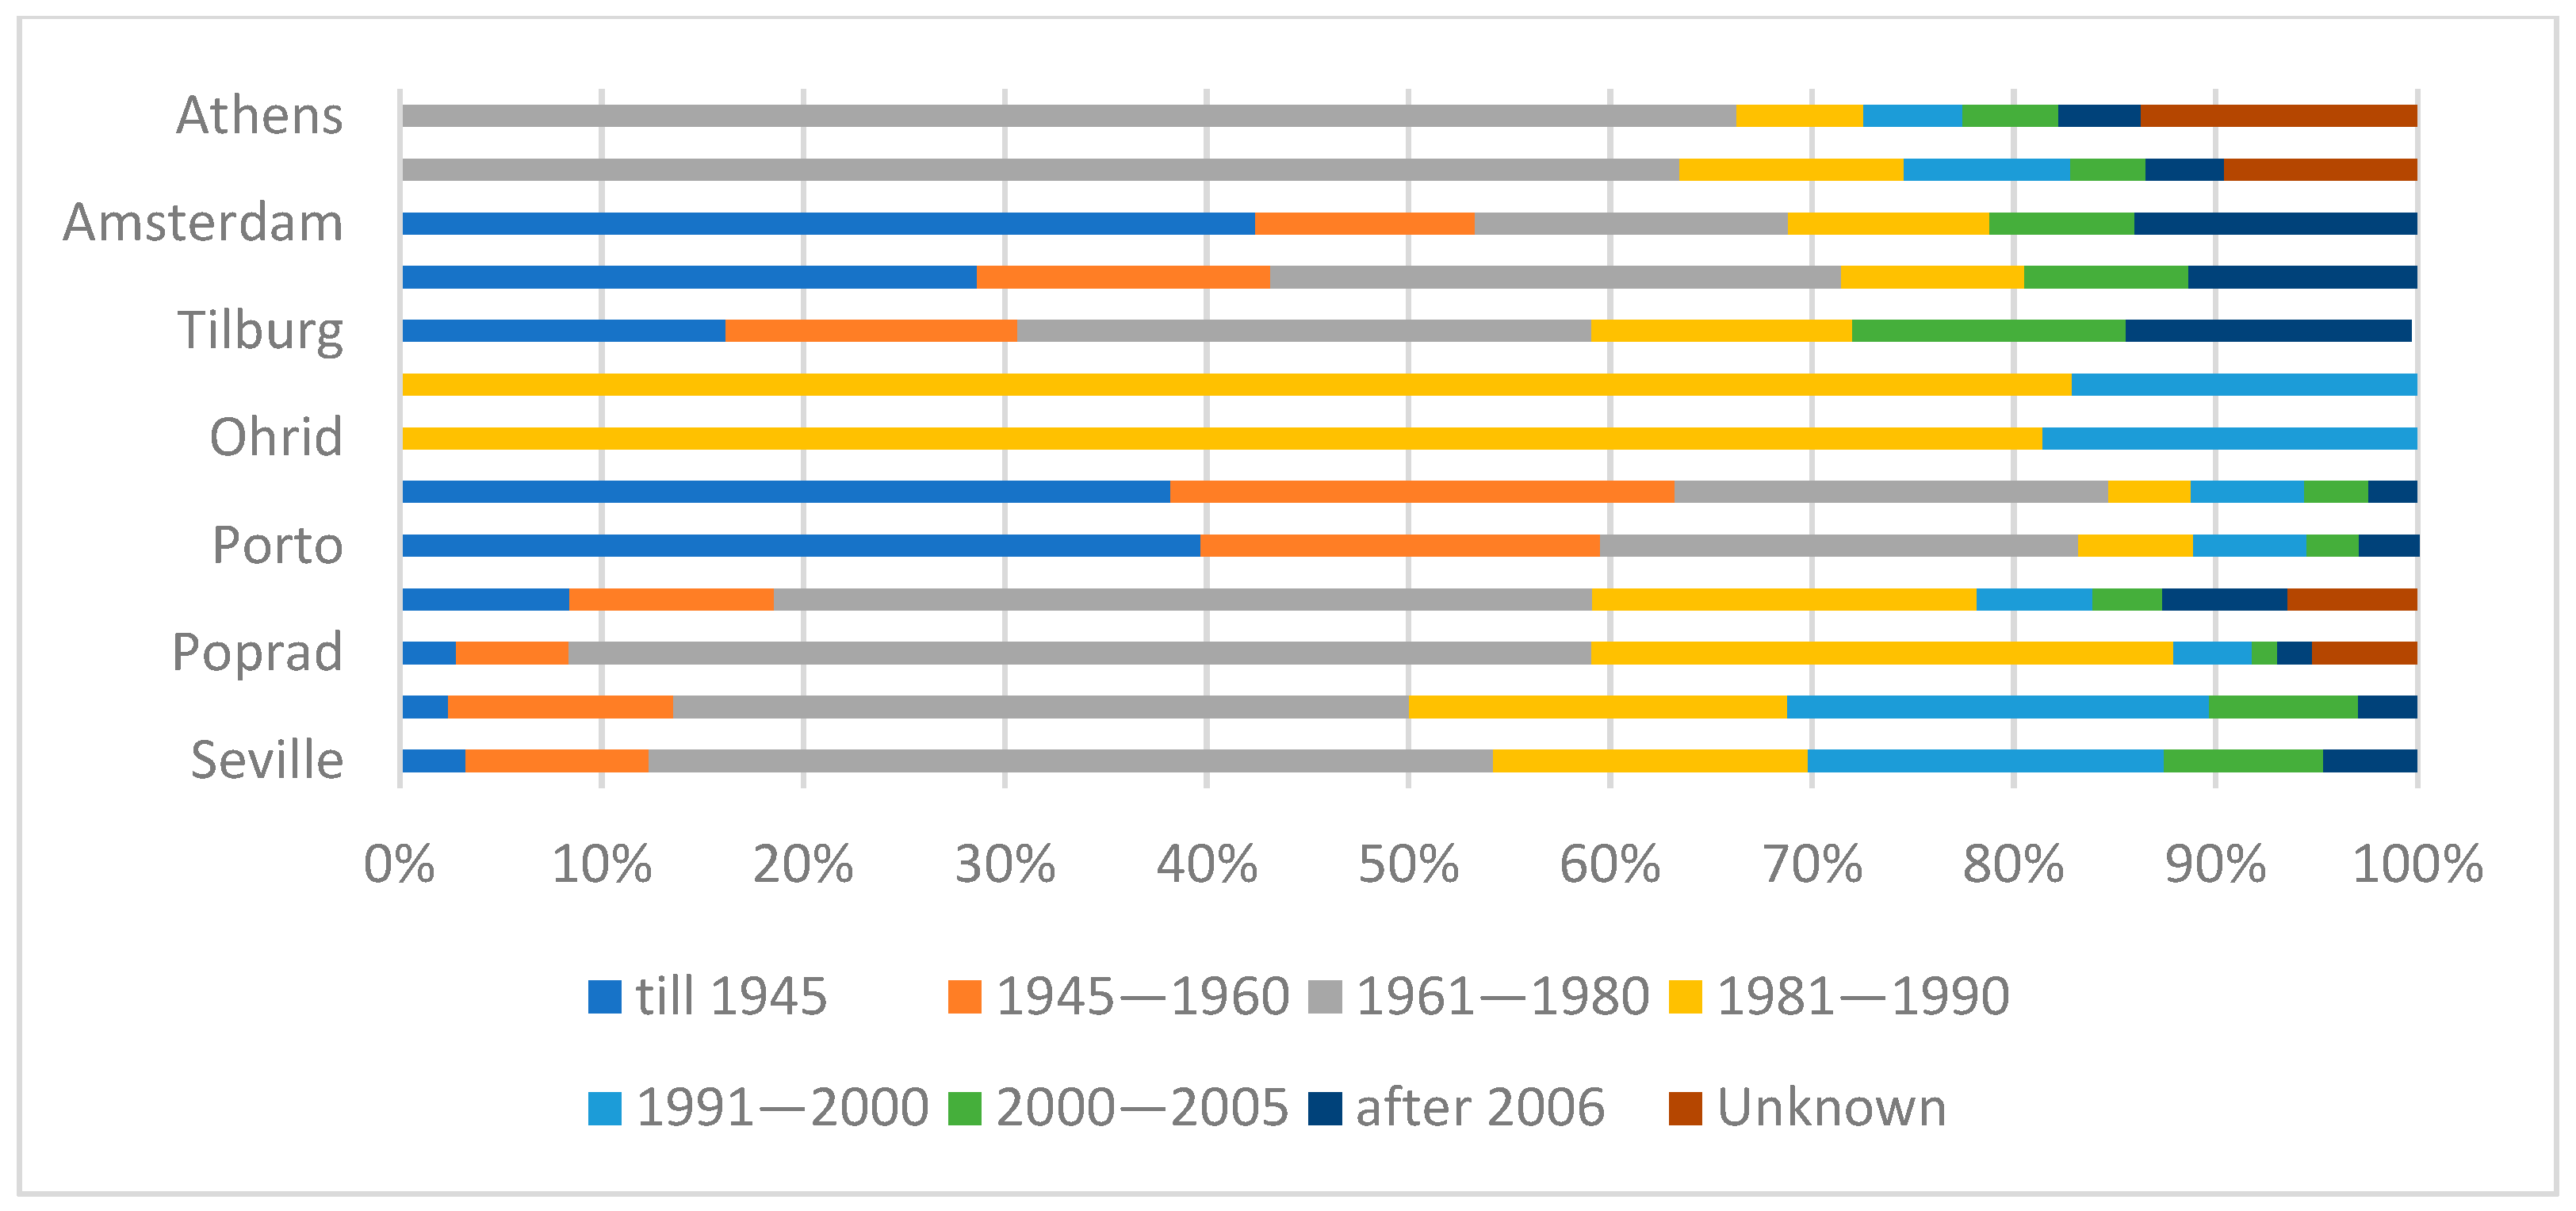
| Older buildings * | R | U | U | U | R | |||
| Lower owner occupancy | U | U | U | U | U | U | ||
| Higher amount of social housing ** | U | U | U |
Disclaimer/Publisher’s Note: The statements, opinions and data contained in all publications are solely those of the individual author(s) and contributor(s) and not of MDPI and/or the editor(s). MDPI and/or the editor(s) disclaim responsibility for any injury to people or property resulting from any ideas, methods, instructions or products referred to in the content. |
© 2024 by the authors. Licensee MDPI, Basel, Switzerland. This article is an open access article distributed under the terms and conditions of the Creative Commons Attribution (CC BY) license (https://creativecommons.org/licenses/by/4.0/).
Share and Cite
Dokupilová, D.; Stojilovska, A.; Palma, P.; Gouveia, J.P.; Paschalidou, E.G.; Barrella, R.; Feenstra, M.; Horta, A.; Sánchez-Guevara, C.; Kádár, J.; et al. Exploring Energy Poverty in Urban and Rural Contexts in the Era of Climate Change: A Comparative Analysis of European Countries and Israel. Energies 2024, 17, 2939. https://doi.org/10.3390/en17122939
Dokupilová D, Stojilovska A, Palma P, Gouveia JP, Paschalidou EG, Barrella R, Feenstra M, Horta A, Sánchez-Guevara C, Kádár J, et al. Exploring Energy Poverty in Urban and Rural Contexts in the Era of Climate Change: A Comparative Analysis of European Countries and Israel. Energies. 2024; 17(12):2939. https://doi.org/10.3390/en17122939
Chicago/Turabian StyleDokupilová, Dušana, Ana Stojilovska, Pedro Palma, João Pedro Gouveia, Eleftheria G. Paschalidou, Roberto Barrella, Marielle Feenstra, Ana Horta, Carmen Sánchez-Guevara, József Kádár, and et al. 2024. "Exploring Energy Poverty in Urban and Rural Contexts in the Era of Climate Change: A Comparative Analysis of European Countries and Israel" Energies 17, no. 12: 2939. https://doi.org/10.3390/en17122939