Navigating Energy and Financial Markets: A Review of Technical Analysis Used and Further Investigation from Various Perspectives


Abstract
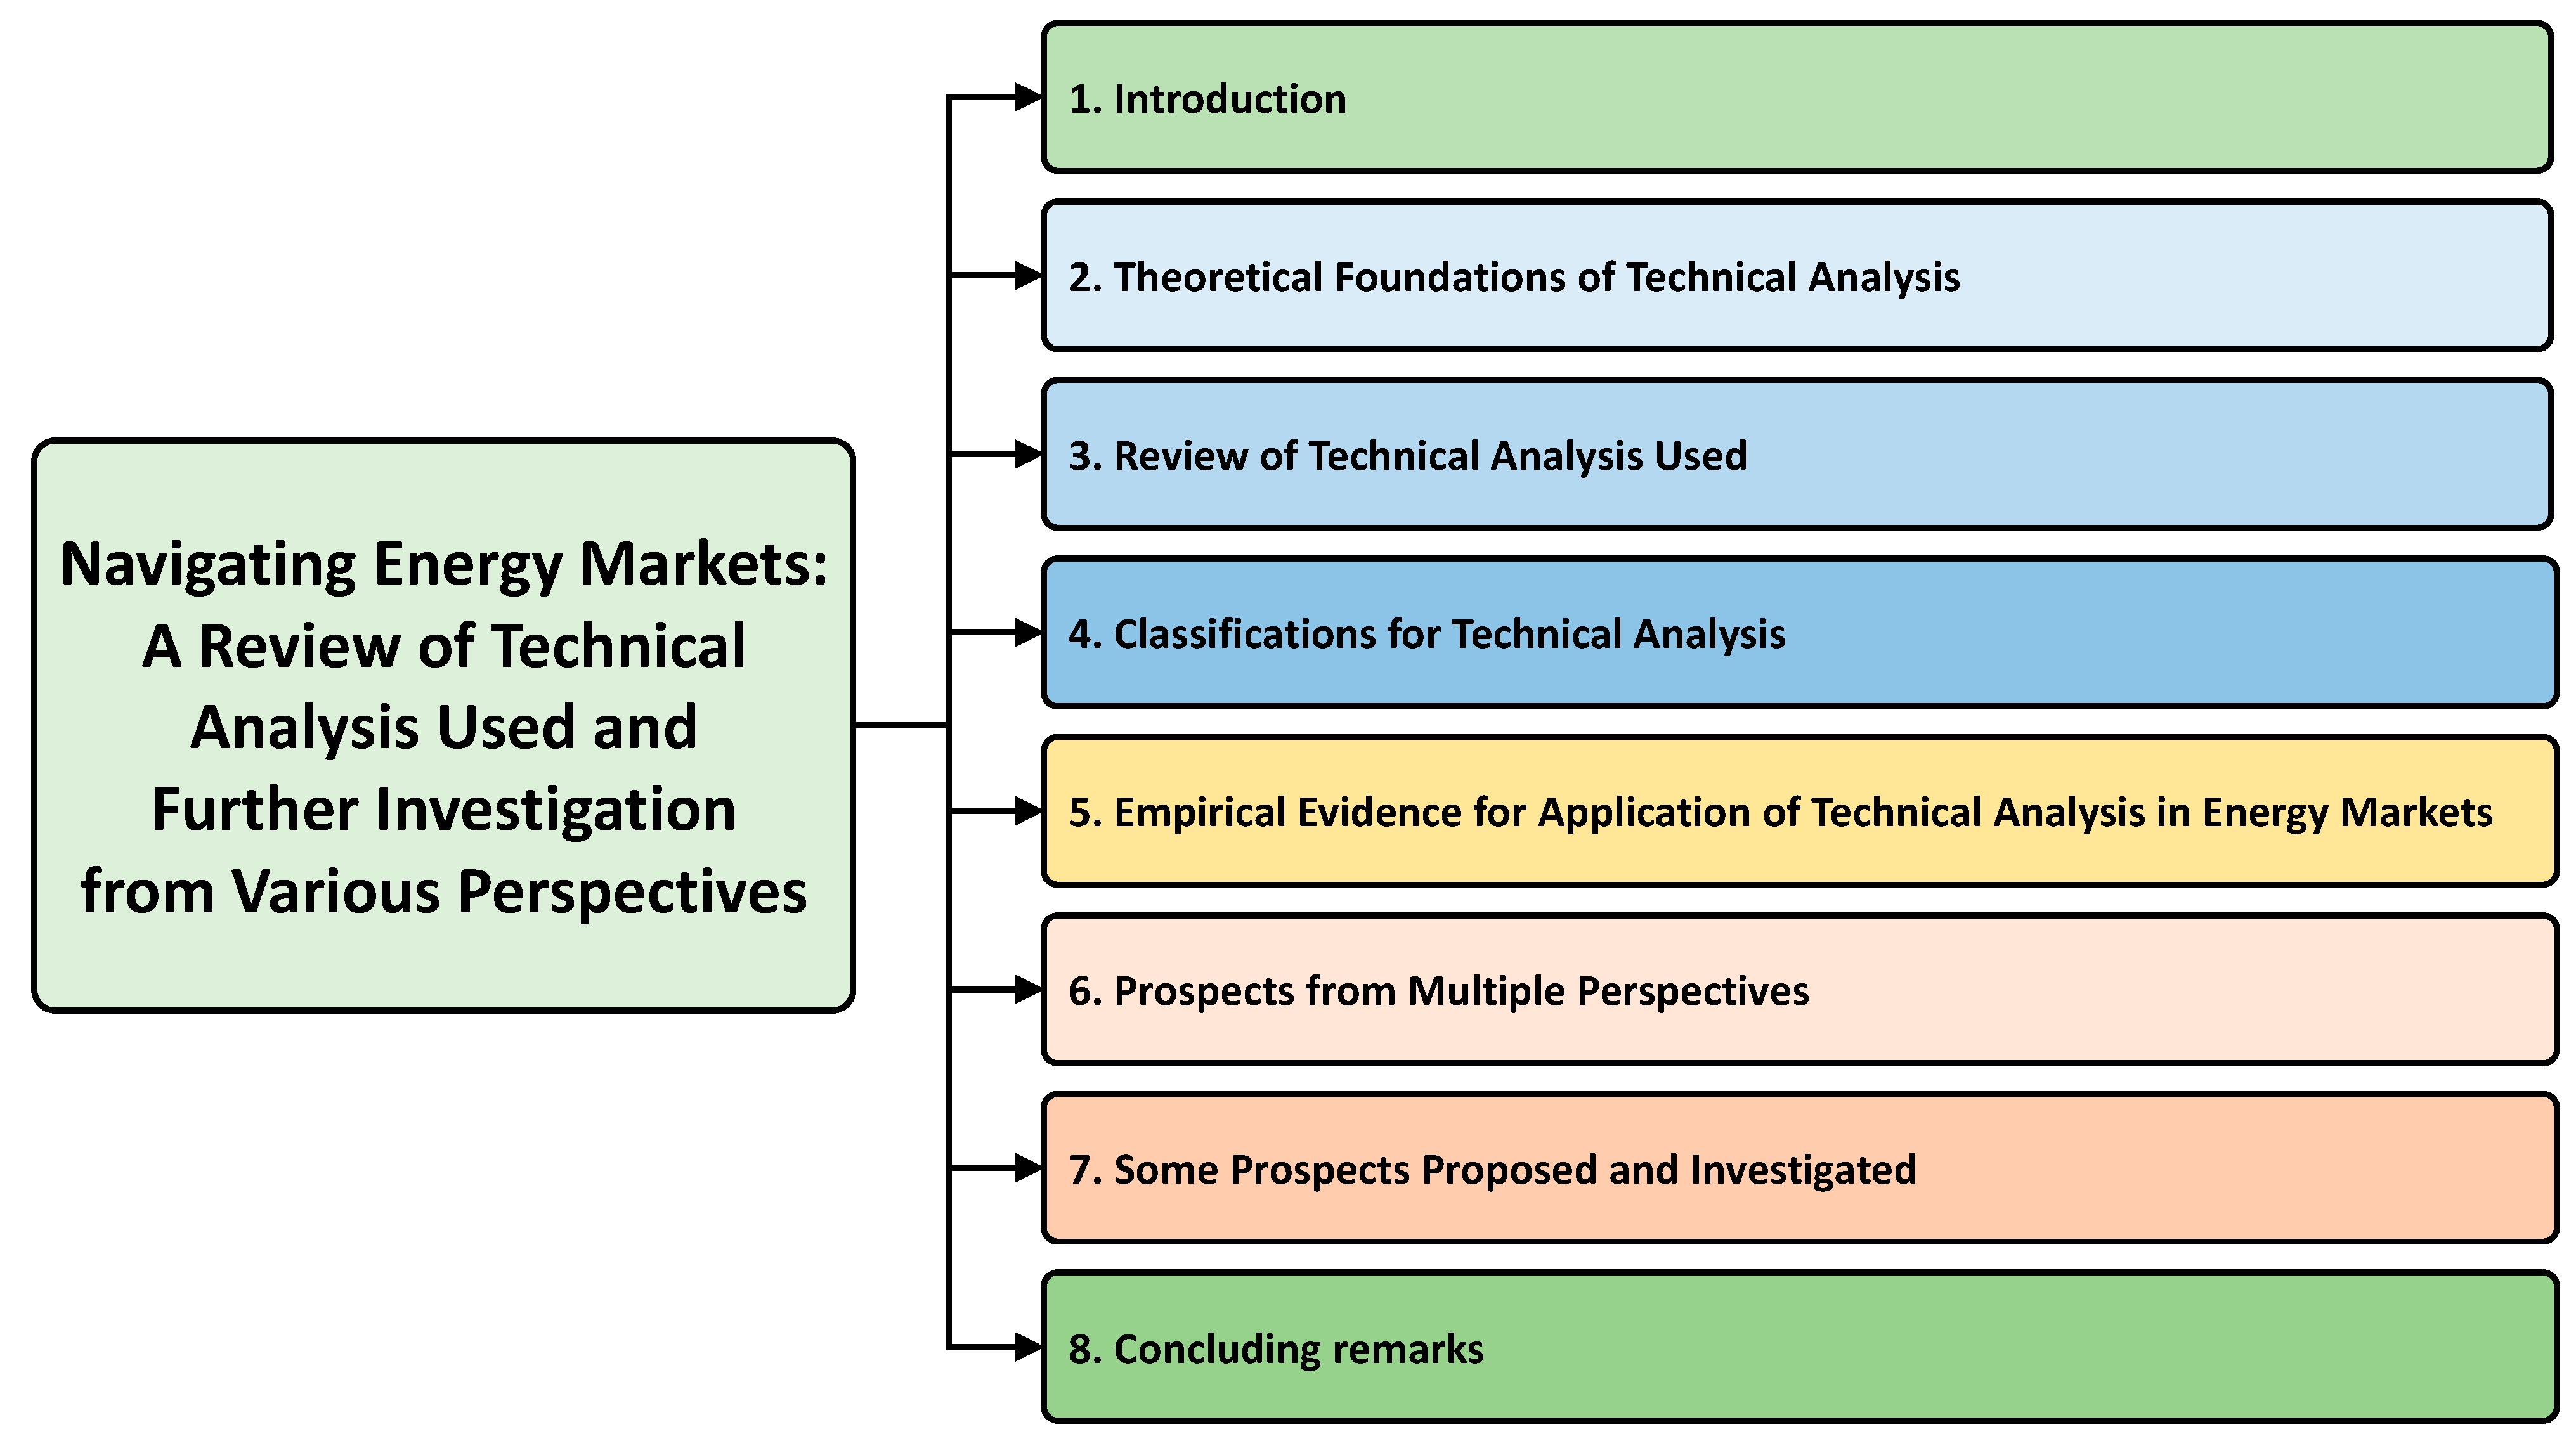
:1. Introduction
2. Theoretical Foundations of Technical Analysis
3. Review of Technical Analysis Used
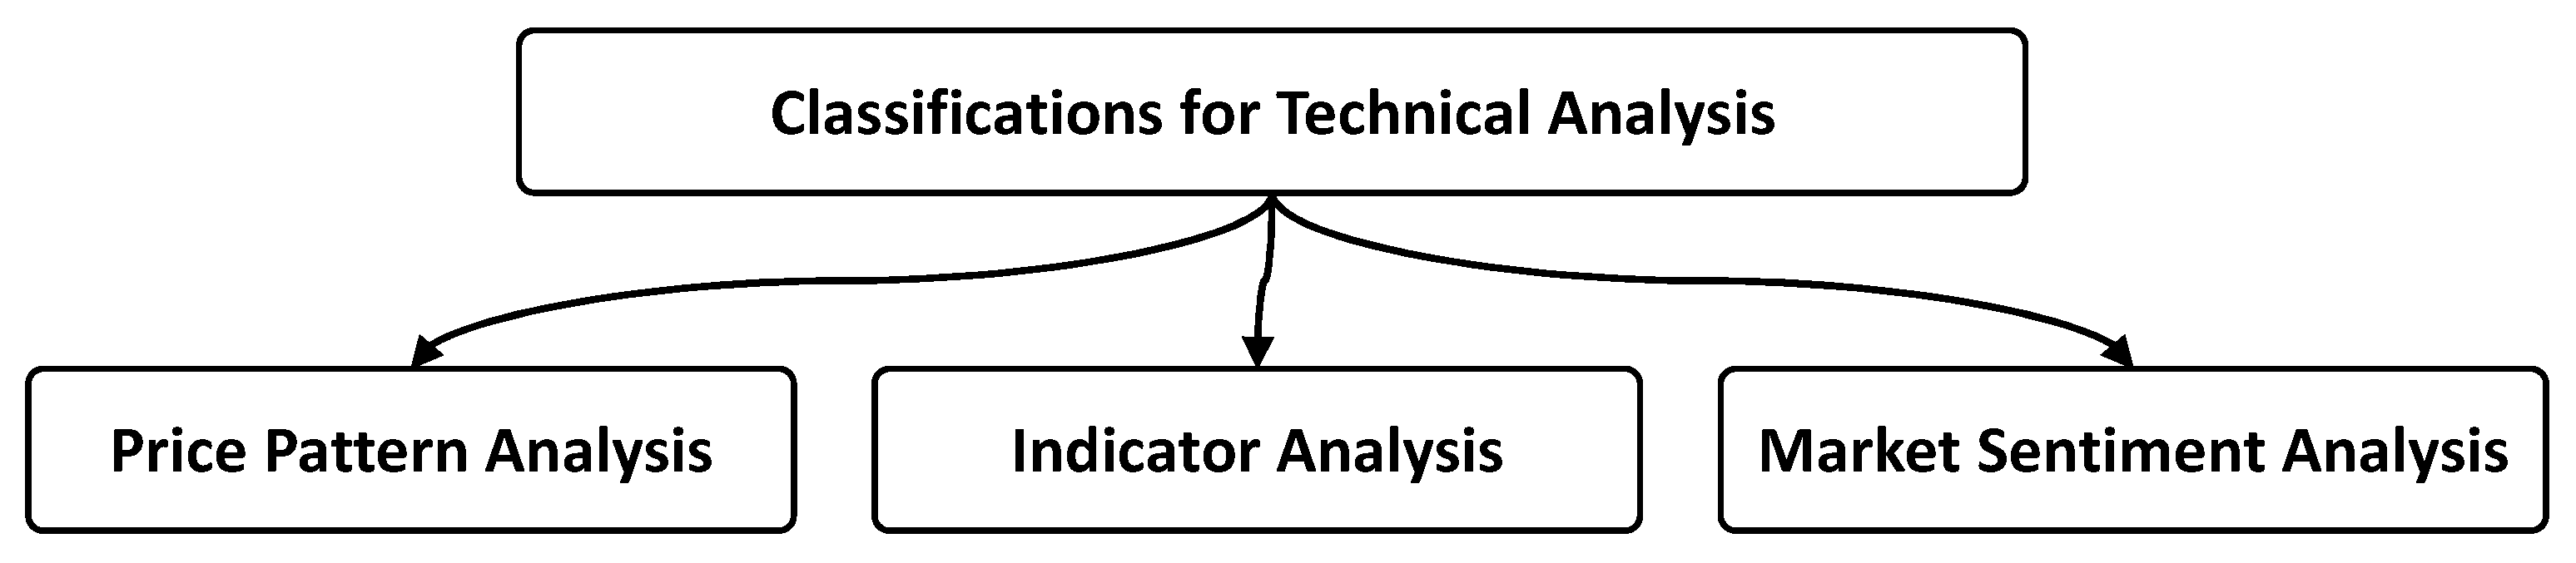
4. Classifications for Technical Analysis
4.1. Price Pattern Analysis
4.2. Indicator Analysis
4.3. Market Sentiment Analysis
5. Empirical Evidence for Application of Technical Analysis in Energy and Financial Markets
5.1. Types of Energy and Financial Markets
5.2. Types of Geographical Areas
5.3. Data Period and Data Frequency
5.4. Methodologies and Performance Metrics
5.5. Technical Indicators Implicated Investment Strategies
5.6. Market Efficiency and Market Anomalies
5.7. Behavioral Finance
5.8. Comparison to Other Analyses
6. Prospects from Multiple Perspectives
6.1. Artificial Intelligence and Big Data
6.2. Algorithmic Trading
6.3. High-Frequency Trading
6.4. Blockchain Technology
6.5. Quantitative Analysis
6.6. Data Visualization
6.7. Risk Management
7. Some Prospects Proposed and Investigated
7.1. Measuring Performance Related to Investments
7.2. Factors Influencing Performance Measured by Technical Analysis
7.3. Flexibility and Extension of Using Technical Parameters
7.4. Concerning Diverse Price Movement Instead of Using Technical Analysis Alone
8. Concluding Remarks
8.1. Conclusions
8.2. Research Implications
8.3. Limitations
Funding
Acknowledgments
Conflicts of Interest
References
- Khan, P.W.; Byun, Y.C.; Lee, S.J.; Kang, D.H.; Kang, J.Y.; Park, H.S. Machine learning-based approach to predict energy consumption of renewable and nonrenewable power sources. Energies 2020, 13, 4870. [Google Scholar] [CrossRef]
- Nti, I.K.; Adekoya, A.F.; Weyori, B.A. A systematic review of fundamental and technical analysis of stock market predictions. Artif. Intell. Rev. 2020, 53, 3007–3057. [Google Scholar] [CrossRef]
- Chang, M.; Thellufsen, J.Z.; Zakeri, B.; Pickering, B.; Pfenninger, S.; Lund, H.; Østergaard, P.A. Trends in tools and approaches for modelling the energy transition. Appl. Energy 2021, 290, 116731. [Google Scholar] [CrossRef]
- Grimes, A. The Art and Science of Technical Analysis: Market Structure, Price Action, and Trading Strategies; John Wiley & Sons: Hoboken, NJ, USA, 2012. [Google Scholar]
- Rizvi SK, A.; Naqvi, B.; Boubaker, S.; Mirza, N. The power play of natural gas and crude oil in the move towards the financialization of the energy market. Energy Econ. 2022, 112, 106131. [Google Scholar] [CrossRef]
- Thomas, S.; Dawe, R.A. Review of ways to transport natural gas energy from countries which do not need the gas for domestic use. Energy 2003, 28, 1461–1477. [Google Scholar] [CrossRef]
- McHugh, C.; Coleman, S.; Kerr, D. Technical indicators for energy market trading. Mach. Learn. Appl. 2021, 6, 100182. [Google Scholar] [CrossRef]
- Rannou, Y.; Barneto, P. Futures trading with information asymmetry and OTC predominance: Another look at the volume/volatility relations in the European carbon markets. Energy Econ. 2016, 53, 159–174. [Google Scholar] [CrossRef]
- Murphy, J.J. Technical Analysis of the Financial Markets: A Comprehensive Guide to Trading Methods and Applications; Penguin: London, UK, 1999. [Google Scholar]
- Chen, J. Essentials of Technical Analysis for Financial Markets; John Wiley & Sons: Hoboken, NJ, USA, 2010. [Google Scholar]
- Scarcioffolo, A.R.; Etienne, X. Testing directional predictability between energy prices: A quantile-based analysis. Resour. Policy 2021, 74, 102258. [Google Scholar] [CrossRef]
- Alqahtani, A.; Klein, T. Oil price changes, uncertainty, and geopolitical risks: On the resilience of GCC countries to global tensions. Energy 2021, 236, 121541. [Google Scholar] [CrossRef]
- Day, M.Y.; Ni, Y. The profitability of seasonal trading timing: Insights from energy-related markets. Energy Econ. 2023, 128, 107132. [Google Scholar] [CrossRef]
- Albahli, S.; Nazir, T.; Mehmood, A.; Irtaza, A.; Alkhalifah, A.; Albattah, W. AEI-DNET: A novel densenet model with an autoencoder for the stock market predictions using stock technical indicators. Electronics 2022, 11, 611. [Google Scholar] [CrossRef]
- Menkhoff, L.; Taylor, M.P. The obstinate passion of foreign exchange professionals: Technical analysis. J. Econ. Lit. 2007, 45, 936–972. [Google Scholar] [CrossRef]
- Park, C.H.; Irwin, S.H. What do we know about the profitability of technical analysis? J. Econ. Surv. 2007, 21, 786–826. [Google Scholar] [CrossRef]
- Wang, J.; Wang, J. Forecasting energy market indices with recurrent neural networks: Case study of crude oil price fluctuations. Energy 2016, 102, 365–374. [Google Scholar] [CrossRef]
- Fama, E.F. Efficient market hypothesis: A review of theory and empirical work. J. Financ. 1970, 25, 28–30. [Google Scholar] [CrossRef]
- Day, M.Y.; Ni, Y. Be greedy when others are fearful: Evidence from a two-decade assessment of the NDX 100 and S&P 500 indexes. Int. Rev. Financ. Anal. 2023, 90, 102856. [Google Scholar]
- Ni, Y.; Liao, Y.C.; Huang, P. MA trading rules, herding behaviors, and stock market overreaction. Int. Rev. Econ. Financ. 2015, 39, 253–265. [Google Scholar] [CrossRef]
- Liao, Y.; Day, M.Y.; Cheng, Y.; Huang, P.; Ni, Y. The profitability of technical trading for hotel stocks under COVID-19 pandemic. J. Comput. 2021, 32, 44–54. [Google Scholar] [CrossRef]
- Morgan, J.; Chu, C.M.; Haines-Doran, T. Competent retrofitting policy and inflation resilience: The cheapest energy is that which you don’t use. Energy Econ. 2023, 121, 106648. [Google Scholar] [CrossRef]
- Cheng, K.; Yao, J.; Zheng, R. Energy Performance of Occupant Behaviors on Windows: A Green Building Based Study. Energies 2023, 16, 2209. [Google Scholar] [CrossRef]
- Ni, Y.; Day, M.Y.; Huang, P. Trading stocks following sharp movements in the USDX, GBP/USD, and USD/CNY. Financ. Innov. 2020, 6, 35. [Google Scholar] [CrossRef]
- Edwards, R.D.; Magee, J.; Bassetti, W.C. Technical Analysis of Stock Trends; CRC Press: Boca Raton, FL, USA, 2018. [Google Scholar]
- Igwemezie, V.; Mehmanparast, A.; Kolios, A. Current trend in offshore wind energy sector and material requirements for fatigue resistance improvement in large wind turbine support structures–A review. Renew. Sustain. Energy Rev. 2019, 101, 181–196. [Google Scholar] [CrossRef]
- Day, M.Y.; Ni, Y.; Huang, P. Trading as sharp movements in oil prices and technical trading signals emitted with big data concerns. Phys. A Stat. Mech. Its Appl. 2019, 525, 349–372. [Google Scholar] [CrossRef]
- Palao, F.; Pardo, A. Do price barriers exist in the European carbon market? J. Behav. Financ. 2018, 19, 111–124. [Google Scholar] [CrossRef]
- Day, M.Y.; Ni, Y. Do clean energy indices outperform using contrarian strategies based on contrarian trading rules? Energy 2023, 272, 127113. [Google Scholar] [CrossRef]
- Day, M.Y.; Cheng, Y.; Huang, P.; Ni, Y. The profitability of trading US stocks in Quarter 4-evidence from trading signals emitted by SOI and RSI. Appl. Econ. Lett. 2023, 30, 1173–1178. [Google Scholar] [CrossRef]
- Ni, Y.; Liao, Y.C.; Huang, P. Momentum in the Chinese stock market: Evidence from stochastic oscillator indicators. Emerg. Mark. Financ. Trade 2015, 51 (Suppl. 1), S99–S110. [Google Scholar] [CrossRef]
- Zhao, J.; Wang, B.; Dong, K.; Shahbaz, M.; Ni, G. How do energy price shocks affect global economic stability? Reflection on geopolitical conflicts. Energy Econ. 2023, 126, 107014. [Google Scholar] [CrossRef]
- Guohua, Y.; Elshkaki, A.; Xiao, X. Dynamic analysis of future nickel demand, supply, and associated materials, energy, water, and carbon emissions in China. Resour. Policy 2021, 74, 102432. [Google Scholar] [CrossRef]
- McIlwaine, N.; Foley, A.M.; Best, R.; Morrow, D.J.; Al Kez, D. Modelling the effect of distributed battery energy storage in an isolated power system. Energy 2023, 263, 125789. [Google Scholar] [CrossRef]
- Day, M.Y.; Huang, P.; Cheng, Y.; Ni, Y. Can Investors Profit from Utilizing Technical Trading Rules During the COVID-19 Pandemic? Int. J. Inf. Technol. Decis. Mak. 2023, 22, 1893–1921. [Google Scholar] [CrossRef]
- Day, M.Y.; Ni, Y.; Hsu, C.; Huang, P. Do Investment Strategies Matter for Trading Global Clean Energy and Global Energy ETFs? Energies 2022, 15, 3328. [Google Scholar] [CrossRef]
- Wang, T.; Wu, F.; Dickinson, D.; Zhao, W. Energy price bubbles and extreme price movements: Evidence from China’s coal market. Energy Econ. 2024, 129, 107253. [Google Scholar] [CrossRef]
- Almeida, L.; Vieira, E. Technical Analysis, Fundamental Analysis, and Ichimoku Dynamics: A Bibliometric Analysis. Risks 2023, 11, 142. [Google Scholar] [CrossRef]
- Day, M.Y.; Ni, Y.; Hsu, C.; Huang, P. Visualizing profitability: A heatmap approach to evaluate Bitcoin futures trading using VMA trading rules. Heliyon 2023, 9, e21376. [Google Scholar] [CrossRef] [PubMed]
- Tudor, C.; Anghel, A. The financialization of crude oil markets and its impact on market efficiency: Evidence from the predictive ability and performance of technical trading strategies. Energies 2021, 14, 4485. [Google Scholar] [CrossRef]
- Chen, J.M.; Rehman, M.U. A pattern new in every moment: The temporal clustering of markets for crude oil, refined fuels, and other commodities. Energies 2021, 14, 6099. [Google Scholar] [CrossRef]
- Chiu, C.L.; Ni, Y.; Hu, H.C.; Day, M.Y.; Chen, Y. Enhancing Crypto Success via Heatmap Visualization of Big Data Analytics for Numerous Variable Moving Average Strategies. Appl. Sci. 2023, 13, 12805. [Google Scholar] [CrossRef]
- Acaroğlu, H.; García Márquez, F.P. Comprehensive review on electricity market price and load forecasting based on wind energy. Energies 2021, 14, 7473. [Google Scholar] [CrossRef]
- Strielkowski, W.; Vlasov, A.; Selivanov, K.; Muraviev, K.; Shakhnov, V. Prospects and challenges of the machine learning and data-driven methods for the predictive analysis of power systems: A review. Energies 2023, 16, 4025. [Google Scholar] [CrossRef]
- Dudjak, V.; Neves, D.; Alskaif, T.; Khadem, S.; Pena-Bello, A.; Saggese, P.; Bowler, B.; Andoni, M.; Bertolini, M.; Zhou, Y.; et al. Impact of local energy markets integration in power systems layer: A comprehensive review. Appl. Energy 2021, 301, 117434. [Google Scholar] [CrossRef]
- Lau VW, H.; Lotsch, B.V. A tour-guide through carbon nitride-land: Structure-and dimensionality-dependent properties for photo (electro) chemical energy conversion and storage. Adv. Energy Mater. 2022, 12, 2101078. [Google Scholar]
- Zhu, Q.; Zhou, X.; Liu, S. High return and low risk: Shaping composite financial investment decision in the new energy stock market. Energy Econ. 2023, 122, 106683. [Google Scholar] [CrossRef]
- Ni, Y.S.; Lee, J.T.; Liao, Y.C. Do variable length moving average trading rules matter during a financial crisis period? Appl. Econ. Lett. 2013, 20, 135–141. [Google Scholar] [CrossRef]
- Day, M.Y.; Huang, P.; Cheng, Y.; Lin, Y.T.; Ni, Y. Profitable day trading Bitcoin futures following continuous bullish (bearish) candlesticks. Appl. Econ. Lett. 2022, 29, 947–954. [Google Scholar] [CrossRef]
- Ho, T.T.; Huang, Y. Stock price movement prediction using sentiment analysis and CandleStick chart representation. Sensors 2021, 21, 7957. [Google Scholar] [CrossRef] [PubMed]
- Huang, W.; Zhao, J.; Wang, X. Model-driven multimodal LSTM-CNN for unbiased structural forecasting of European Union allowances open-high-low-close price. Energy Econ. 2024, 132, 107459. [Google Scholar] [CrossRef]
- Chen, Y.; Huang, P.; Day, M.Y.; Ni, Y.; Liang, M.C. Using Heatmap Visualization to assess the performance of the DJ30 and NASDAQ100 Indices under diverse VMA trading rules. PLoS ONE 2023, 18, e0284918. [Google Scholar] [CrossRef] [PubMed]
- Chen, Y.; Huang, P.; Ku, Y.; Ni, Y.; Chie, B.T.; Lin, Y.T. Does ownership structure matter for overshooting manipulation of hospitality and tourism stocks? Heliyon 2022, 8, e11544. [Google Scholar] [CrossRef]
- Chiu, C.L.; Huang, P.; Day, M.Y.; Ni, Y.; Chen, Y. Mastery of “Monthly Effects”: Big Data Insights into Contrarian Strategies for DJI 30 and NDX 100 Stocks over a Two-Decade Period. Mathematics 2024, 12, 356. [Google Scholar] [CrossRef]
- Nor, S.M.; Zawawi NH, M.; Wickremasinghe, G.; Halim, Z.A. Is technical analysis profitable on renewable energy stocks? Evidence from trend-reinforcing, mean-reverting and hybrid fractal trading systems. Axioms 2023, 12, 127. [Google Scholar] [CrossRef]
- Ni, Y.; Huang, P.; Ku, Y.; Liao, Y.; Day, M.Y. Investing strategies as stochastic oscillator indicators staying in overreaction zones for consecutive days with big data concerns. J. Comput. 2020, 31, 1–17. [Google Scholar]
- Ni, Y.; Chiang, P.; Day, M.Y.; Chen, Y. Using Big Data Analytics and Heatmap Matrix Visualization to Enhance Cryptocurrency Trading Decisions. Appl. Sci. 2023, 14, 154. [Google Scholar] [CrossRef]
- Ni, Y.; Day, M.Y.; Huang, P.; Yu, S.R. The profitability of Bollinger Bands: Evidence from the constituent stocks of Taiwan 50. Phys. A Stat. Mech. Its Appl. 2020, 551, 124144. [Google Scholar] [CrossRef]
- Ciana, P. New Frontiers in Technical Analysis: Effective Tools and Strategies for Trading and Investing; John Wiley & Sons: Hoboken, NJ, USA, 2011. [Google Scholar]
- Schlossberg, B. Technical Analysis of the Currency Market: Classic Techniques for Profiting from Market Swings and Trader Sentiment; John Wiley & Sons: Hoboken, NJ, USA, 2006. [Google Scholar]
- Bulkowski, T.N. Encyclopedia of Chart Patterns; John Wiley & Sons: Hoboken, NJ, USA, 2021. [Google Scholar]
- Friesen, G.C.; Weller, P.A.; Dunham, L.M. Price trends and patterns in technical analysis: A theoretical and empirical examination. J. Bank. Financ. 2009, 33, 1089–1100. [Google Scholar] [CrossRef]
- Jiang, J.; Kelly, B.; Xiu, D. (Re-) Imag (in) ing Price Trends. J. Financ. 2023, 78, 3193–3249. [Google Scholar] [CrossRef]
- Fiorenzani, S.; Ravelli, S.; Edoli, E. The Handbook of Energy Trading; John Wiley & Sons: Hoboken, NJ, USA, 2012. [Google Scholar]
- Uritskaya, O.Y.; Uritsky, V.M. Predictability of price movements in deregulated electricity markets. Energy Econ. 2015, 49, 72–81. [Google Scholar] [CrossRef]
- Chong TT, L.; Poon, K.H. A new recognition algorithm for “head-and-shoulders” price patterns. Stud. Nonlinear Dyn. Econom. 2017, 21, 20150066. [Google Scholar] [CrossRef]
- Savin, G.; Weller, P.; Zvingelis, J. The predictive power of “head-and-shoulders” price patterns in the US stock market. J. Financ. Econom. 2007, 5, 243–265. [Google Scholar]
- Heinz, A.; Jamaloodeen, M.; Saxena, A.; Pollacia, L. Bullish and Bearish Engulfing Japanese Candlestick patterns: A statistical analysis on the S&P 500 index. Q. Rev. Econ. Financ. 2021, 79, 221–244. [Google Scholar]
- Ni, Y.; Cheng, Y.; Huang, P.; Day, M.Y. Trading strategies in terms of continuous rising (falling) prices or continuous bullish (bearish) candlesticks emitted. Phys. A Stat. Mech. Its Appl. 2018, 501, 188–204. [Google Scholar] [CrossRef]
- Detollenaere, B.; Mazza, P. Do Japanese candlesticks help solve the trader’s dilemma? J. Bank. Financ. 2014, 48, 386–395. [Google Scholar] [CrossRef]
- Nison, S. Japanese Candlestick Charting Techniques: A Contemporary Guide to the Ancient Investment; Technique of the Far East, Institute of Finance: New York, NY, USA, 1991. [Google Scholar]
- Wan, Y.; Lau RY, K.; Si, Y.W. Mining subsequent trend patterns from financial time series. Int. J. Wavelets Multiresolution Inf. Process. 2020, 18, 2050010. [Google Scholar] [CrossRef]
- Tsinaslanidis, P.; Guijarro, F. What makes trading strategies based on chart pattern recognition profitable? Expert Syst. 2021, 38, e12596. [Google Scholar] [CrossRef]
- Zafeiriou, T.; Kalles, D. Ultra-short-term trading system using a neural network-based ensemble of financial technical indicators. Neural Comput. Appl. 2023, 35, 35–60. [Google Scholar] [CrossRef]
- Das, A.K.; Mishra, D.; Das, K.; Mohanty, A.K.; Mohammed, M.A.; Al-Waisy, A.S.; Kadry, S.; Kim, J. A deep network-based trade and trend analysis system to observe entry and exit points in the forex market. Mathematics 2022, 10, 3632. [Google Scholar] [CrossRef]
- Gradojevic, N.; Kukolj, D.; Adcock, R.; Djakovic, V. Forecasting Bitcoin with technical analysis: A not-so-random forest? Int. J. Forecast. 2023, 39, 1–17. [Google Scholar] [CrossRef]
- Khand, S.; Anand, V.; Qureshi, M.N. The predictability and profitability of simple moving averages and trading range breakout rules in the Pakistan stock market. Rev. Pac. Basin Financ. Mark. Policies 2020, 23, 2050001. [Google Scholar] [CrossRef]
- Ni, Y.; Cheng, Y.; Liao, Y.; Huang, P. Does board structure affect stock price overshooting informativeness measured by stochastic oscillator indicators? Int. J. Financ. Econ. 2022, 27, 2290–2302. [Google Scholar] [CrossRef]
- Ni, Y.; Huang, P.; Chen, Y. Board structure, considerable capital, and stock price overreaction informativeness in terms of technical indicators. North Am. J. Econ. Financ. 2019, 48, 514–528. [Google Scholar] [CrossRef]
- Day, M.Y.; Cheng, Y.; Huang, P.; Ni, Y. The profitability of Bollinger Bands trading bitcoin futures. Appl. Econ. Lett. 2023, 30, 1437–1443. [Google Scholar] [CrossRef]
- Balvers, R.J.; Wu, Y. Momentum and mean reversion across national equity markets. J. Empir. Financ. 2006, 13, 24–48. [Google Scholar] [CrossRef]
- Dezhkam, A.; Manzuri, M.T. Forecasting stock market for an efficient portfolio by combining XGBoost and Hilbert–Huang transform. Eng. Appl. Artif. Intell. 2023, 118, 105626. [Google Scholar] [CrossRef]
- John, K.; Li, J. COVID-19, volatility dynamics, and sentiment trading. J. Bank. Financ. 2021, 133, 106162. [Google Scholar] [CrossRef] [PubMed]
- Ren, R.; Wu, D.D.; Liu, T. Forecasting stock market movement direction using sentiment analysis and support vector machine. IEEE Syst. J. 2018, 13, 760–770. [Google Scholar] [CrossRef]
- Yang, M.J.; Liu, M.Y. The forecasting power of the volatility index in emerging markets: Evidence from the Taiwan stock market. Int. J. Econ. Financ. 2012, 4, 217–231. [Google Scholar] [CrossRef]
- Blau, B.M.; Brough, T.J. Are put-call ratios a substitute for short sales? Rev. Deriv. Res. 2015, 18, 51–73. [Google Scholar] [CrossRef]
- Vasileiou, E.; Tzanakis, P. The impact of Google searches, Put-Call ratio, and Trading Volume on stock performance using Wavelet Coherence analysis: The AMC case. J. Behav. Financ. 2024, 25, 111–119. [Google Scholar] [CrossRef]
- Albers, S. The fear of fear in the US stock market: Changing characteristics of the VVIX. Financ. Res. Lett. 2023, 55, 103926. [Google Scholar] [CrossRef]
- Lin, J.B.; Tsai, W. The relations of oil price change with fear gauges in global political and economic environment. Energies 2019, 12, 2982. [Google Scholar] [CrossRef]
- Liao, Y.; Day, M.Y.; Cheng, Y.; Huang, P.; Ni, Y. Does CBOE volatility index jumped or located at a higher level matter for evaluating DJ 30, NASDAQ, and S&P500 index subsequent performance. J. Comput. 2021, 32, 057–066. [Google Scholar]
- Manela, A.; Moreira, A. News implied volatility and disaster concerns. J. Financ. Econ. 2017, 123, 137–162. [Google Scholar] [CrossRef]
- Baker, M.; Wurgler, J. Investor sentiment in the stock market. J. Econ. Perspect. 2007, 21, 129–151. [Google Scholar] [CrossRef]
- Chang, T.H.; Su, H.M. The substitutive effect of biofuels on fossil fuels in the lower and higher crude oil price periods. Energy 2010, 35, 2807–2813. [Google Scholar] [CrossRef]
- Kapsalyamova, Z.; Paltsev, S. Use of natural gas and oil as a source of feedstocks. Energy Econ. 2020, 92, 104984. [Google Scholar] [CrossRef]
- Aloui, D.; Gaies, B.; Hchaichi, R. Exploring environmental degradation spillovers in Sub-Saharan Africa: The energy–financial instability nexus. Econ. Chang. Restruct. 2023, 56, 1699–1724. [Google Scholar] [CrossRef]
- Bhattacharya, M.; Paramati, S.R.; Ozturk, I.; Bhattacharya, S. The effect of renewable energy consumption on economic growth: Evidence from top 38 countries. Appl. Energy 2016, 162, 733–741. [Google Scholar] [CrossRef]
- Basher, S.A.; Sadorsky, P. Oil price risk and emerging stock markets. Glob. Financ. J. 2006, 17, 224–251. [Google Scholar] [CrossRef]
- Nguyen, T.V.; Rothuizen, E.D.; Markussen, W.B.; Elmegaard, B. Thermodynamic comparison of three small-scale gas liquefaction systems. Appl. Therm. Eng. 2018, 128, 712–724. [Google Scholar] [CrossRef]
- Apergis, N.; Payne, J.E. Renewable energy consumption and economic growth: Evidence from a panel of OECD countries. Energy Policy 2010, 38, 656–660. [Google Scholar] [CrossRef]
- Apergis, N.; Payne, J.E. Renewable energy, output, CO2 emissions, and fossil fuel prices in Central America: Evidence from a nonlinear panel smooth transition vector error correction model. Energy Econ. 2014, 42, 226–232. [Google Scholar] [CrossRef]
- Perlaviciute, G.; Steg, L. Contextual and psychological factors shaping evaluations and acceptability of energy alternatives: Integrated review and research agenda. Renew. Sustain. Energy Rev. 2014, 35, 361–381. [Google Scholar] [CrossRef]
- Raza, A.; Razzaq, A.; Mehmood, S.S.; Zou, X.; Zhang, X.; Lv, Y.; Xu, J. Impact of climate change on crops adaptation and strategies to tackle its outcome: A review. Plants 2019, 8, 34. [Google Scholar] [CrossRef] [PubMed]
- Aalto, P. Institutions in European and Asian energy markets: A methodological overview. Energy Policy 2014, 74, 4–15. [Google Scholar] [CrossRef]
- Li, Y.; Chevallier, J.; Wei, Y.; Li, J. Identifying price bubbles in the US, European and Asian natural gas market: Evidence from a GSADF test approach. Energy Econ. 2020, 87, 104740. [Google Scholar] [CrossRef]
- Haydt, G.; Leal, V.; Pina, A.; Silva, C.A. The relevance of the energy resource dynamics in the mid/long-term energy planning models. Renew. Energy 2011, 36, 3068–3074. [Google Scholar] [CrossRef]
- Davis, L.W.; Hausman, C. Are energy executives rewarded for luck? Energy J. 2020, 41, 157–180. [Google Scholar] [CrossRef]
- Connolly, D.; Lund, H.; Mathiesen, B.V. Smart Energy Europe: The technical and economic impact of one potential 100% renewable energy scenario for the European Union. Renew. Sustain. Energy Rev. 2016, 60, 1634–1653. [Google Scholar] [CrossRef]
- Pérez MD LE, M.; Scholten, D.; Stegen, K.S. The multi-speed energy transition in Europe: Opportunities and challenges for EU energy security. Energy Strategy Rev. 2019, 26, 100415. [Google Scholar] [CrossRef]
- Aklin, M.; Cheng, C.Y.; Urpelainen, J. Social acceptance of new energy technology in developing countries: A framing experiment in rural India. Energy Policy 2018, 113, 466–477. [Google Scholar] [CrossRef]
- Wang, B.; Wang, J.; Dong, K.; Dong, X. Is the digital economy conducive to the development of renewable energy in Asia? Energy Policy 2023, 173, 113381. [Google Scholar] [CrossRef]
- Wang, Q.; Wang, S. Preventing carbon emission retaliatory rebound post-COVID-19 requires expanding free trade and improving energy efficiency. Sci. Total Environ. 2020, 746, 141158. [Google Scholar] [CrossRef] [PubMed]
- Creti, A.; Joëts, M. Multiple bubbles in the European union emission trading scheme. Energy Policy 2017, 107, 119–130. [Google Scholar] [CrossRef]
- Ghalehkhondabi, I.; Ardjmand, E.; Weckman, G.R.; Young, W.A. An overview of energy demand forecasting methods published in 2005–2015. Energy Syst. 2017, 8, 411–447. [Google Scholar] [CrossRef]
- Vilén, K.; Ahlgren, E.O. Linear or mixed integer programming in long-term energy systems modeling–A comparative analysis for a local expanding heating system. Energy 2023, 283, 129056. [Google Scholar] [CrossRef]
- Herrera, A.M.; Karaki, M.B.; Rangaraju, S.K. Oil price shocks and US economic activity. Energy Policy 2019, 129, 89–99. [Google Scholar] [CrossRef]
- Liu, L.; Song, F.; Fang, J.; Wei, J.; Ho, H.C.; Song, Y.; Zhang, Y.; Wang, L.; Yang, Z.; Hu, C.; et al. Intraday effects of ambient PM1 on emergency department visits in Guangzhou, China: A case-crossover study. Sci. Total Environ. 2021, 750, 142347. [Google Scholar] [CrossRef]
- Baule, R.; Naumann, M. Flexible Short-Term Electricity Certificates—An Analysis of Trading Strategies on the Continuous Intraday Market. Energies 2022, 15, 6344. [Google Scholar] [CrossRef]
- Huang, W.; Gao, T.; Hao, Y.; Wang, X. Transformer-based forecasting for intraday trading in the Shanghai crude oil market: Analyzing open-high-low-close prices. Energy Econ. 2023, 127, 107106. [Google Scholar] [CrossRef]
- Day, M.Y.; Huang, P.; Cheng, Y.; Ni, Y. Investing Strategies for Trading Stocks as Overreaction Triggered by Technical Trading Rules with Big Data Concerns. Rom. J. Econ. Forecast. 2023, 26, 148–161. [Google Scholar]
- Dittmer, C.; Krümpel, J.; Lemmer, A. Power demand forecasting for demand-driven energy production with biogas plants. Renew. Energy 2021, 163, 1871–1877. [Google Scholar] [CrossRef]
- Sadorsky, P. Risk factors in stock returns of Canadian oil and gas companies. Energy Econ. 2001, 23, 17–28. [Google Scholar] [CrossRef]
- Pasupuleti, M.B. AMI Data for Decision Makers and the Use of Data Analytics Approach. Asia Pac. J. Energy Environ. 2017, 4, 65–70. [Google Scholar] [CrossRef]
- Şen, Z. Innovative methodologies in renewable energy: A review. Int. J. Energy Res. 2019, 43, 5621–5658. [Google Scholar] [CrossRef]
- Richter, M. Utilities’ business models for renewable energy: A review. Renew. Sustain. Energy Rev. 2012, 16, 2483–2493. [Google Scholar] [CrossRef]
- Brown, S.J.; Warner, J.B. Using daily stock returns: The case of event studies. J. Financ. Econ. 1985, 14, 3–31. [Google Scholar] [CrossRef]
- Sharpe, W.F. Mutual fund performance. J. Bus. 1966, 39, 119–138. [Google Scholar] [CrossRef]
- Magdon-Ismail, M.; Atiya, A. Density estimation and random variate generation using multilayer networks. IEEE Trans. Neural Netw. 2002, 13, 497–520. [Google Scholar] [CrossRef]
- Bressand, A. The role of markets and investment in global energy. In The Handbook of Global Energy Policy; John Wiley & Sons: Hoboken, NJ, USA, 2013; pp. 15–29. [Google Scholar]
- Urbano, E.M.; Martinez-Viol, V.; Kampouropoulos, K.; Romeral, L. Quantitative and qualitative risk-informed energy investment for industrial companies. Energy Rep. 2023, 9, 3290–3304. [Google Scholar] [CrossRef]
- Creswell, J.W.; Creswell, J.D. Research Design: Qualitative, Quantitative, and Mixed Methods Approaches; Sage Publications: Thousand Oaks, CA, USA, 2017. [Google Scholar]
- Yin, C.Y. Measuring organizational impacts by integrating competitive intelligence into executive information system. J. Intell. Manuf. 2018, 29, 533–547. [Google Scholar] [CrossRef]
- Johnson, P.; Duberley, J. Understanding Management Research: An Introduction to Epistemology; Sage: London, UK, 2000. [Google Scholar]
- Sensoy, A.; Hacihasanoglu, E. Time-varying long range dependence in energy futures markets. Energy Econ. 2014, 46, 318–327. [Google Scholar] [CrossRef]
- Lo, A.W.; MacKinlay, A.C. A Non-Random Walk Down Wall Street; Princeton University Press: Princeton, NJ, USA, 2011. [Google Scholar]
- Brock, W.; Lakonishok, J.; LeBaron, B. Simple technical trading rules and the stochastic properties of stock returns. J. Financ. 1992, 47, 1731–1764. [Google Scholar] [CrossRef]
- Malkiel, B.G. The efficient market hypothesis and its critics. J. Econ. Perspect. 2003, 17, 59–82. [Google Scholar] [CrossRef]
- Barberis, N.; Thaler, R. A survey of behavioral finance. Handb. Econ. Financ. 2003, 1, 1053–1128. [Google Scholar]
- Antonakakis, N.; Gupta, R.; Kollias, C.; Papadamou, S. Geopolitical risks and the oil-stock nexus over 1899–2016. Financ. Res. Lett. 2017, 23, 165–173. [Google Scholar] [CrossRef]
- Ni, Y.; Wu, M.; Day, M.Y.; Huang, P. Do sharp movements in oil prices matter for stock markets? Phys. A Stat. Mech. Its Appl. 2020, 539, 122865. [Google Scholar] [CrossRef]
- De Bondt, W.F.; Thaler, R. Does the stock market overreact? J. Financ. 1985, 40, 793–805. [Google Scholar] [CrossRef]
- Shiller, R.J. Measuring bubble expectations and investor confidence. J. Psychol. Financ. Mark. 2000, 1, 49–60. [Google Scholar] [CrossRef]
- Kahneman, D.; Tversky, A. Prospect theory: An analysis of decision under risk. Econometrica 1979, 47, 363–391. [Google Scholar] [CrossRef]
- Nickerson, R.S. Confirmation bias: A ubiquitous phenomenon in many guises. Rev. Gen. Psychol. 1998, 2, 175–220. [Google Scholar] [CrossRef]
- Tversky, A.; Kahneman, D. Judgment under Uncertainty: Heuristics and Biases: Biases in judgments reveal some heuristics of thinking under uncertainty. Science 1974, 185, 1124–1131. [Google Scholar] [CrossRef] [PubMed]
- Psaradellis, I.; Laws, J.; Pantelous, A.A.; Sermpinis, G. Performance of technical trading rules: Evidence from the crude oil market. Eur. J. Financ. 2019, 25, 1793–1815. [Google Scholar] [CrossRef]
- Bouasabah, M. Analysis of machine learning’s performance in stock market prediction, compared to traditional technical analysis indicators. Int. J. Data Anal. Tech. Strateg. 2024, 16, 32–46. [Google Scholar] [CrossRef]
- Kumbure, M.M.; Lohrmann, C.; Luukka, P.; Porras, J. Machine learning techniques and data for stock market forecasting: A literature review. Expert Syst. Appl. 2022, 197, 116659. [Google Scholar] [CrossRef]
- Addy, W.A.; Ajayi-Nifise, A.O.; Bello, B.G.; Tula, S.T.; Odeyem, O.; Falaiye, T. Algorithmic Trading and AI: A Review of Strategies and Market Impact. World J. Adv. Eng. Technol. Sci. 2024, 11, 258–267. [Google Scholar] [CrossRef]
- Raschka, S.; Patterson, J.; Nolet, C. Machine learning in python: Main developments and technology trends in data science, machine learning, and artificial intelligence. Information 2020, 11, 193. [Google Scholar] [CrossRef]
- Day, M.Y.; Yang, C.Y.; Ni, Y. Portfolio dynamic trading strategies using deep reinforcement learning. Soft Comput. 2023, 1–16. [Google Scholar] [CrossRef]
- Sharma, P.; Barua, S. From data breach to data shield: The crucial role of big data analytics in modern cybersecurity strategies. Int. J. Inf. Cybersecur. 2023, 7, 31–59. [Google Scholar]
- Singh, T.; Kalra, R.; Mishra, S.; Satakshi; Kumar, M. An efficient real-time stock prediction exploiting incremental learning and deep learning. Evol. Syst. 2023, 14, 919–937. [Google Scholar] [CrossRef]
- Biais, B.; Bisiere, C.; Bouvard, M.; Casamatta, C. The blockchain folk theorem. Rev. Financ. Stud. 2019, 32, 1662–1715. [Google Scholar] [CrossRef]
- Kissell, R. Algorithmic Trading Methods: Applications Using Advanced Statistics, Optimization, and Machine Learning Techniques; Academic Press: Cambridge, MA, USA, 2020. [Google Scholar]
- Hasbrouck, J.; Saar, G. Low-latency trading. J. Financ. Mark. 2013, 16, 646–679. [Google Scholar] [CrossRef]
- Budish, E.; Cramton, P.; Shim, J. The high-frequency trading arms race: Frequent batch auctions as a market design response. Q. J. Econ. 2015, 130, 1547–1621. [Google Scholar] [CrossRef]
- Brogaard, J.; Hendershott, T.; Riordan, R. High-frequency trading and price discovery. Rev. Financ. Stud. 2014, 27, 2267–2306. [Google Scholar] [CrossRef]
- Brogaard, J.; Hendershott, T.; Riordan, R. High frequency trading and the 2008 short-sale ban. J. Financ. Econ. 2017, 124, 22–42. [Google Scholar] [CrossRef]
- Kirilenko, A.; Kyle, A.S.; Samadi, M.; Tuzun, T. The flash crash: High-frequency trading in an electronic market. J. Financ. 2017, 72, 967–998. [Google Scholar] [CrossRef]
- Li, K. Do circuit breakers impede trading behavior? A study in Chinese Financial Market. Singap. Econ. Rev. 2019, 64, 1127–1144. [Google Scholar] [CrossRef]
- Hendershott, T.; Jones, C.M.; Menkveld, A.J. Does algorithmic trading improve liquidity? J. Financ. 2011, 66, 1–33. [Google Scholar] [CrossRef]
- Teufel, B.; Sentic, A.; Barmet, M. Blockchain energy: Blockchain in future energy systems. J. Electron. Sci. Technol. 2019, 17, 100011. [Google Scholar] [CrossRef]
- Zohar, A. Bitcoin: Under the hood. Commun. ACM 2015, 58, 104–113. [Google Scholar] [CrossRef]
- Swan, M. Blockchain thinking: The brain as a decentralized autonomous corporation [commentary]. IEEE Technol. Soc. Mag. 2015, 34, 41–52. [Google Scholar] [CrossRef]
- Christidis, K.; Devetsikiotis, M. Blockchains and smart contracts for the internet of things. IEEE Access 2016, 4, 2292–2303. [Google Scholar] [CrossRef]
- Creti, A.; Nguyen, D.K. Energy markets׳ financialization, risk spillovers, and pricing models. Energy Policy 2015, 82, 260–263. [Google Scholar] [CrossRef]
- Giovanelli, C.; Sierla, S.; Ichise, R.; Vyatkin, V. Exploiting artificial neural networks for the prediction of ancillary energy market prices. Energies 2018, 11, 1906. [Google Scholar] [CrossRef]
- Huang, A.H.; You, H. Artificial intelligence in financial decision-making. Handb. Financ. Decis. Mak. 2023, 15, 315. [Google Scholar]
- Cartea, Á.; Jaimungal, S.; Penalva, J. Algorithmic and High-Frequency Trading; Cambridge University Press: Cambridge, UK, 2015. [Google Scholar]
- Menkveld, A.J. The economics of high-frequency trading: Taking stock. Annu. Rev. Financ. Econ. 2016, 8, 1–24. [Google Scholar] [CrossRef]
- Aldridge, I. High-Frequency Trading: A Practical Guide to Algorithmic Strategies and Trading Systems; John Wiley & Sons: Hoboken, NJ, USA, 2013. [Google Scholar]
- Goldstein, M.; Kwan, A.; Philip, R. High-frequency trading strategies. Manag. Sci. 2023, 69, 4413–4434. [Google Scholar] [CrossRef]
- Kauffman, R.J.; Liu, J.; Ma, D. Innovations in financial IS and technology ecosystems: High-frequency trading in the equity market. Technol. Forecast. Soc. Chang. 2015, 99, 339–354. [Google Scholar] [CrossRef]
- Ivanova, A.V. VR & AR technologies: Opportunities and application obstacles. Strateg. Decis. Risk Manag. 2018, 3, 88–107. [Google Scholar]
- Miljkovic, I.; Shlyakhetko, O.; Fedushko, S. Real estate app development based on AI/VR technologies. Electronics 2023, 12, 707. [Google Scholar] [CrossRef]
- Currie, W.L.; Seddon, J.J. Exploring technological instantiation of regulatory practices in entangled financial markets. J. Inf. Technol. 2022, 37, 31–50. [Google Scholar] [CrossRef]
- Williams, J.W. Regulatory technologies, risky subjects, and financial boundaries: Governing ‘fraud’in the financial markets. Account. Organ. Soc. 2013, 38, 544–558. [Google Scholar] [CrossRef]
- Baviera, R.; Baldi, T.S. Stop-loss and leverage in optimal statistical arbitrage with an application to energy market. Energy Econ. 2019, 79, 130–143. [Google Scholar] [CrossRef]
- Dongrey, S. Study of market indicators used for technical analysis. Int. J. Eng. Manag. Res. 2022, 12, 64–83. [Google Scholar]
- Pedersen, L.H. Efficiently Inefficient: How Smart Money Invests and Market Prices Are Determined; Princeton University Press: Princeton, NJ, USA, 2019. [Google Scholar]
- Paltrinieri, N.; Comfort, L.; Reniers, G. Learning about risk: Machine learning for risk assessment. Saf. Sci. 2019, 118, 475–486. [Google Scholar] [CrossRef]
- Zhou, K.; Fu, C.; Yang, S. Big data driven smart energy management: From big data to big insights. Renew. Sustain. Energy Rev. 2016, 56, 215–225. [Google Scholar] [CrossRef]
- Asif, M.; Muneer, T. Energy supply, its demand and security issues for developed and emerging economies. Renew. Sustain. Energy Rev. 2007, 11, 1388–1413. [Google Scholar] [CrossRef]
- McGookin, C.; Gallachóir B, Ó.; Byrne, E. An innovative approach for estimating energy demand and supply to inform local energy transitions. Energy 2021, 229, 120731. [Google Scholar] [CrossRef]
- Wu, M.H.; Ni, Y.S. The effects of oil prices on inflation, interest rates and money. Energy 2011, 36, 4158–4164. [Google Scholar] [CrossRef]
- Huang, P.; Ni, Y. Board structure and stock price informativeness in terms of moving average rules. Q. Rev. Econ. Financ. 2017, 63, 161–169. [Google Scholar] [CrossRef]
- Day, M.Y.; Wu, M.; Huang, P.; Ni, Y. Investing Strategies as a Sharp Movement in Exchange Rates Occurred: Evidence for the Constituent Stocks of SSE 50 and TW 50. J. Investig. 2018, 27, 58–68. [Google Scholar] [CrossRef]
- Wu, M.; Huang, P.; Ni, Y. Investing strategies as continuous rising (falling) share prices released. J. Econ. Financ. 2017, 41, 763–773. [Google Scholar] [CrossRef]
- Day, M.Y.; Huang, P.; Ni, Y.; Chen, Y. Do Intraday Large Price Changes Matter for Trading Index Futures? Evidence from China Futures Markets. J. Financ. Stud. 2018, 26, 139–174. [Google Scholar]
- Day, M.Y.; Huang, P.; Ni, Y.; Chen, Y. Do Implicit Phenomena Matter? Evidence from China Stock Index Futures. J. Altern. Investig. 2018, 21, 79–91. [Google Scholar] [CrossRef]

| Classifications | Description | Key Techniques/Indicators |
|---|---|---|
| Price Pattern Analysis | Focuses on identifying and interpreting visual patterns on price charts. | Head and shoulders, triangles, flags, pennants, candlestick patterns, etc. |
| Indicator Analysis | Utilizes various mathematical indicators to analyze market conditions. | Moving averages (MAs), Moving Average Convergence Divergence (MACD), relative strength index (RSI), stochastic oscillator indicator (SOI), etc. |
| Market Sentiment Analysis | Assesses the overall mood of the market to inform trading decisions. | Put/Call ratio, volatility index (VIX), etc. |
Disclaimer/Publisher’s Note: The statements, opinions and data contained in all publications are solely those of the individual author(s) and contributor(s) and not of MDPI and/or the editor(s). MDPI and/or the editor(s) disclaim responsibility for any injury to people or property resulting from any ideas, methods, instructions or products referred to in the content. |
© 2024 by the author. Licensee MDPI, Basel, Switzerland. This article is an open access article distributed under the terms and conditions of the Creative Commons Attribution (CC BY) license (https://creativecommons.org/licenses/by/4.0/).
Share and Cite
Ni, Y. Navigating Energy and Financial Markets: A Review of Technical Analysis Used and Further Investigation from Various Perspectives. Energies 2024, 17, 2942. https://doi.org/10.3390/en17122942
Ni Y. Navigating Energy and Financial Markets: A Review of Technical Analysis Used and Further Investigation from Various Perspectives. Energies. 2024; 17(12):2942. https://doi.org/10.3390/en17122942
Chicago/Turabian StyleNi, Yensen. 2024. "Navigating Energy and Financial Markets: A Review of Technical Analysis Used and Further Investigation from Various Perspectives" Energies 17, no. 12: 2942. https://doi.org/10.3390/en17122942
APA StyleNi, Y. (2024). Navigating Energy and Financial Markets: A Review of Technical Analysis Used and Further Investigation from Various Perspectives. Energies, 17(12), 2942. https://doi.org/10.3390/en17122942