Article

Numerical Research on Leakage Characteristics of Pure Hydrogen/Hydrogen-Blended Natural Gas in Medium- and Low-Pressure Buried Pipelines

College of New Energy, China University of Petroleum (East China), Qingdao 266580, China
*
Author to whom correspondence should be addressed.
Energies 2024, 17(12), 2951; https://doi.org/10.3390/en17122951
Submission received: 23 April 2024 / Revised: 12 June 2024 / Accepted: 12 June 2024 / Published: 15 June 2024
(This article belongs to the Section A5: Hydrogen Energy)

Abstract

:
To investigate the leakage characteristics of pure hydrogen and hydrogen-blended natural gas in medium- and low-pressure buried pipelines, this study establishes a three-dimensional leakage model based on Computational Fluid Dynamics (CFD). The leakage characteristics in terms of pressure, velocity, and concentration distribution are obtained, and the effects of operational parameters, ground hardening degree, and leakage parameters on hydrogen diffusion characteristics are analyzed. The results show that the first dangerous time (FDT) for hydrogen leakage is substantially shorter than for natural gas, emphasizing the need for timely leak detection and response. Increasing the hydrogen blending ratio accelerates the diffusion process and decreases the FDT, posing greater risks for pipeline safety. The influence of soil hardening on gas diffusion is also examined, revealing that harder soils can restrict gas dispersion, thereby increasing localized concentrations. Additionally, the relationship between gas leakage time and distance is determined, aiding in the optimal placement of gas sensors and prediction of leakage timing. To ensure the safe operation of hydrogen-blended natural gas pipelines, practical recommendations include optimizing pipeline operating conditions, improving leak detection systems, increasing pipeline burial depth, and selecting materials with higher resistance to hydrogen embrittlement. These measures can mitigate risks associated with hydrogen leakage and enhance the overall safety of the pipeline infrastructure.

1. Introduction

As a clean energy source, hydrogen energy holds immense potential in addressing global energy crises and issues such as climate change [1]. The utilization of hydrogen energy involves processes, like production, transportation, and storage, where hydrogen transportation plays a crucial role in ensuring the reliability, affordability, safety, and environmental impact of hydrogen supply. Common methods of hydrogen transportation include compressed gas cylinders, cryogenic liquid tankers, and pipelines [2]. Pipeline transport is the most common and economical method of hydrogen delivery, although the construction of dedicated hydrogen pipeline systems may incur significant costs. Given the extensive infrastructure of natural gas pipelines, blending hydrogen with natural gas and transporting it through existing natural gas pipelines could be the most viable approach to achieving large-scale hydrogen transportation [3,4].
In urban areas, hydrogen is primarily transported from hydrogen stations to end-users through underground pipelines [5]. However, these pipelines are susceptible to various forms of corrosion, including pitting corrosion, which can be particularly detrimental. Pitting corrosion occurs when localized anodic sites form on the metal surface, leading to small, deep pits that can penetrate the pipeline material. This type of corrosion is often initiated by the presence of chloride ions in the soil, which break down the passive oxide layer, protecting the metal. Moisture in the soil exacerbates this process by providing a medium for the electrochemical reactions. Additionally, soil microorganisms can influence pitting corrosion by producing metabolites that alter the local chemical environment, further promoting pit formation and growth. The combined effect of these factors can significantly weaken the structural integrity of buried steel pipelines over time [6,7,8,9,10]. The occurrence of corrosion can lead to perforation and rupture of the pipelines, resulting in hydrogen leaks. Due to hydrogen’s wider flammable range, faster flame propagation speed, and lower ignition energy, immediately igniting leaked hydrogen can produce jet flames [11,12]. If hydrogen leakage occurs in confined or semi-confined spaces, combustible hydrogen accumulation can easily happen. Delayed ignition can lead to hydrogen cloud explosions and even cause detonations and explosions [13].
The leakage issue of underground natural gas pipelines has attracted widespread attention. Bu et al. [14] numerically investigated the influence of ground conditions and soil properties on the diffusion of natural gas leakage. They analyzed two processes of natural gas leakage diffusion and established the calculation models of leakage rate and early warning boundary (EWB) based on the least squares method and multiple regression theory. The early warning boundary (EWB) refers to the diffusion distance along the ground surface, where the methane concentration reaches a volume fraction of 1%. Parvini et al. [15] conducted a risk assessment of gas migration in soil based on experimental data from Okamoto et al. [16]. They predicted the minimum leakage volume and time for fires or explosions to occur in indoor and outdoor scenarios. Liu et al. [17] combined experimental and numerical simulation methods to establish models for estimating the leakage rates of buried gas pipelines and predicting natural gas concentrations. They studied factors affecting the diffusion process of natural gas leakage, including pressure, leakage hole shape and diameter, pipeline burial depth, soil properties, and temperature. Bezaatpour et al. [18] studied the effects of factors, such as layered soil anisotropy, saturation, and hydraulic gradient, on the leakage rate of buried natural gas pipelines. The leakage of pipelines transporting hydrogen-blended natural gas has also been extensively explored. Zhu et al. [19] designed and built an experimental system for buried blended hydrogen natural gas pipeline leakage, conducting in-depth research on the influence of blending ratio, leakage pressure, and leakage direction on the diffusion behavior of blended hydrogen natural gas leakage. They established a quantitative relationship between blended hydrogen gas concentration and diffusion distance. Wang et al. [20] studied the leakage characteristics of hydrogen-blended natural gas after the cutoff valve was closed by improving the non-adiabatic pipeline leakage model. They analyzed the effects of the heat transfer coefficient, initial pressure, and blending ratio on the leakage flow characteristics. In summary, most research on hydrogen-blended natural gas pipeline leakage mainly focuses on the leakage and diffusion characteristics of hydrogen in the atmosphere, with insufficient attention paid to underground blended hydrogen natural gas pipelines [21,22,23]. In fact, in most cases, urban natural gas pipelines are directly buried underground and covered with cement or asphalt [24]. When leaked gas diffuses to the ground through the soil, cement or asphalt prevents the leaked gas from flowing from the soil to the air, resulting in the leakage characteristics distinct from those in the ambient environment. Unfortunately, research on the leakage and diffusion behavior of underground hydrogen-blended natural gas in the soil is scarce.
While previous studies have explored various aspects of gas leakage, there is a lack of comprehensive models that simultaneously consider multiple influential factors, such as fluid properties, ground hardening, and leakage characteristics, and little attention has been paid to the gas leakage and diffusion in underground hydrogen-blended natural gas pipelines. The present study employs Computational Fluid Dynamics (CFD) methods to construct a three-dimensional model for underground hydrogen transportation pipeline leaks, analyzing the distribution of pressure, velocity, gas concentration, and leakage rate of hydrogen after leakage occurs in the soil. Note that the natural gas composition is simplified and treated primarily as methane, which is the major component of natural gas. The effects of ground temperature variations are not considered in the current simulations. In addition, the internal flow within the pipeline is not included, and the leakage hole is modeled as a circular aperture positioned at the center of the pipeline. The impacts of fluid properties (pressure, hydrogen blending ratio), degree of ground hardening, and leakage characteristics (leakage aperture, pipeline burial depth) on the diffusion characteristics of hydrogen are explored. The main contributions of this study are as follows: (i) the development of a comprehensive numerical simulation model to analyze the transient diffusion characteristics of hydrogen leakage from underground pipelines; (ii) a detailed investigation into the impact of operating pressure, leakage hole diameter, and pipeline burial depth on the first dangerous time (FDT) and diffusion range; and (iii) practical recommendations for pipeline design and safety measures based on the simulation results. The research offers theoretical guidance for the rational design of pipeline areas, pipeline laying, and safe operation of underground gas pipelines.

2. Methods

2.1. Physical Model

A three-dimensional physical model of the buried pipeline is established, as shown in Figure 1. Based on the technical code for city gas (GB 50494-2009) [25], the pipe diameter is set to 0.1 m, buried underground at a depth of 1.5 m, with the leakage hole positioned at the center of the pipe and with a diameter of 0.02 m. For comparison, ISO 4437-5:2014 [26] specifies installation guidelines for buried plastic pipeline systems for natural gas, while EN 12007-2:2012 [27] outlines requirements for gas supply systems and pipeline engineering. These international standards provide similar guidelines but may have different specific parameters for pipe diameter and burial depth. The present work focuses on urban gas pipelines in China; thus, the GB 50494-2009 standard is selected. It is also noted that the dimensions of the pipeline in the present work are representative of typical pipeline configurations used in urban gas distribution systems, but the results obtained may vary with different pipe and leakage hole sizes. The soil is considered as a porous medium region, with dimensions of 4 m in length, 3 m in width, and 2 m in height. Since this study mainly focuses on the leakage and diffusion behavior of gas in the soil, internal flow within the pipe is neglected, and the pressure inside the pipe is maintained at 0.4 MPa during the leakage process. To evaluate the relevant physical quantities, 6 monitoring points and 2 monitoring lines are positioned above the leakage hole, as shown in Table 1.

2.2. Mathematical Models

2.2.1. Governing Equations

The soil is treated as isotropic homogeneous porous medium, and the heat transfer between soil and gas is ignored. The leakage and diffusion of the pure hydrogen or hydrogen-doped natural gas in the soil are governed by the mass, momentum, and species transport equations.
ε ρ t + ρ v i = 0
ε ρ v i t + ρ ε 2 v i v i = p + μ ε 2 v i + ε ρ g + S i
ε ρ J t + ρ v c J = ρ D J
where ε is the porosity of soil, ρ is the mixed gas density, v i is the mixed gas velocity with the subscript i = x , y , z , p is the gas pressure, μ is the dynamic viscosity, S i denotes the source term considering the viscous resistance and inertial resistance in homogeneous porous medium:
S i = μ α v i + C 2 1 2 | v | v i
where α and C 2 are the permeability and inertial resistance coefficient, respectively. J is the mass fraction of component, v c is the diffusion velocity of gas in soil, and D represents the diffusion coefficient. Under conditions where the temperature is not too low and the pressure is not too high, the gas can be regarded as the ideal gas with its equation of state: p v = R T [28,29]. The mixed gas density equation is then obtained:
ρ = p R T M H 2 + M C H 4 J M H 2 + 1 J M C H 4
where M H 2 and M C H 4 are the molecular mass of hydrogen and methane, respectively. Based on the work of Bu [14], the porosity and resistance coefficients of the soil are: ε = 0.43 , 1 / α = 1.7068 × 10 9 m−2, C 2 = 9.5955 × 10 6 m−1.
The Detached Eddy Simulation (DES) model, which combines the Reynolds-averaged Navier–Stokes (RANS) and the large Eddy Simulation (LES) methods, is employed to capture the turbulence during the leakage process [30]. The RANS is used to resolve the large turbulent structures in the near-wall region with the Spalart–Allmaras (SA) model [31,32], while the LES is employed to simulate the turbulence in the region away from the boundaries. By using this hybrid method in all the cases, we ensured consistent and robust simulation results across different scenarios, providing detailed insights into the transient behavior of hydrogen and gas diffusion in buried pipelines. The DES model defines a length scale to switch between RANS and LES:
d D E S = min d , C D E S Δ
where d is the distance to the nearest wall, C D E S is a constant with a default value of 0.65, Δ is the largest grid spacing. For d < C D E S Δ , the simulation is reduced to SA RANS mode:
μ t t + v μ t = 1 σ Re μ + μ t μ t + c b 2 μ t 2 + c b 1 S t μ t c w 1 f w Re μ t d D E S 2
where μ t is the eddy viscosity, Re is the Reynolds number, σ , c b 1 , c b 2 , c w 1 are model constants. For d C D E S Δ , the SA-DES shows LES behavior.

2.2.2. Initial and Boundary Conditions

At the initial state, the pores of the soil are filled with air, and the initial velocity and concentration of pure hydrogen and hydrogen-doped natural gas are zero. In the event of minor leaks occurring in buried pipelines, the negligible impact on pipeline pressure is assumed due to the small diameter of the leakage hole [33]. Consequently, the pipeline pressure remains constant, with the pressure at the leakage hole assumed to equal the pipeline pressure. Accordingly, the leakage hole is defined as a pressure inlet with a pressure value of 0.4 MPa, representing the pressure inside the pipeline at the point of leakage, and the hydrogen component at the inlet boundary condition is set to 1. The soil boundary is treated as a free boundary with unconstrained flow. A pressure outlet boundary condition is utilized, with pressure set equal to ambient pressure of 0.1 MPa. The boundary conditions are summarized in Table 2.

2.3. Simulation Scenarios

The control variable method is utilized to investigate the influence of 5 parameters, including leakage hole pressure (p), hydrogen concentration (φ), leakage hole diameter (d), pipeline burial depth (h), and ground hardening conditions, on the leakage and diffusion characteristics of the pure hydrogen/hydrogen-doped natural gas in the buried pipeline. A comparative analysis is conducted through simulating 12 cases, as outlined in Table 3. The working conditions for the 12 cases were designated based on a combination of industry standards, regulatory requirements, and practical considerations for pipeline operation and safety. The key factors influencing the selection of these conditions include operating pressure (varied between 0.2 MPa and 0.4 MPa), hydrogen blending ratio (adjusted to create different blending ratios: 0%, 5%, 10%, 15%, 20%), leakage hole diameter (ranging from 0.01 m to 0.03 m), and pipeline burial depth (varied between 1 m to 1.5 m). The leakage hole is modeled as a circular aperture positioned at the center of the pipeline, with internal flow within the pipeline not considered. A pressure outlet boundary condition is utilized for the non-hardened ground, with pressure set equal to 0.1 MPa, while a wall boundary condition is used for the hardened ground. These parameters were varied systematically to understand their impact on the diffusion characteristics of hydrogen and hydrogen-blended natural gas. Among them, case 1 is selected as the basic case to study the leakage process of the pure hydrogen and natural gas by adjusting the hydrogen concentration. All the simulations are conducted using the commercial software ANSYS Fluent (Release 19.2).

2.4. Mesh Independency and Model Validation

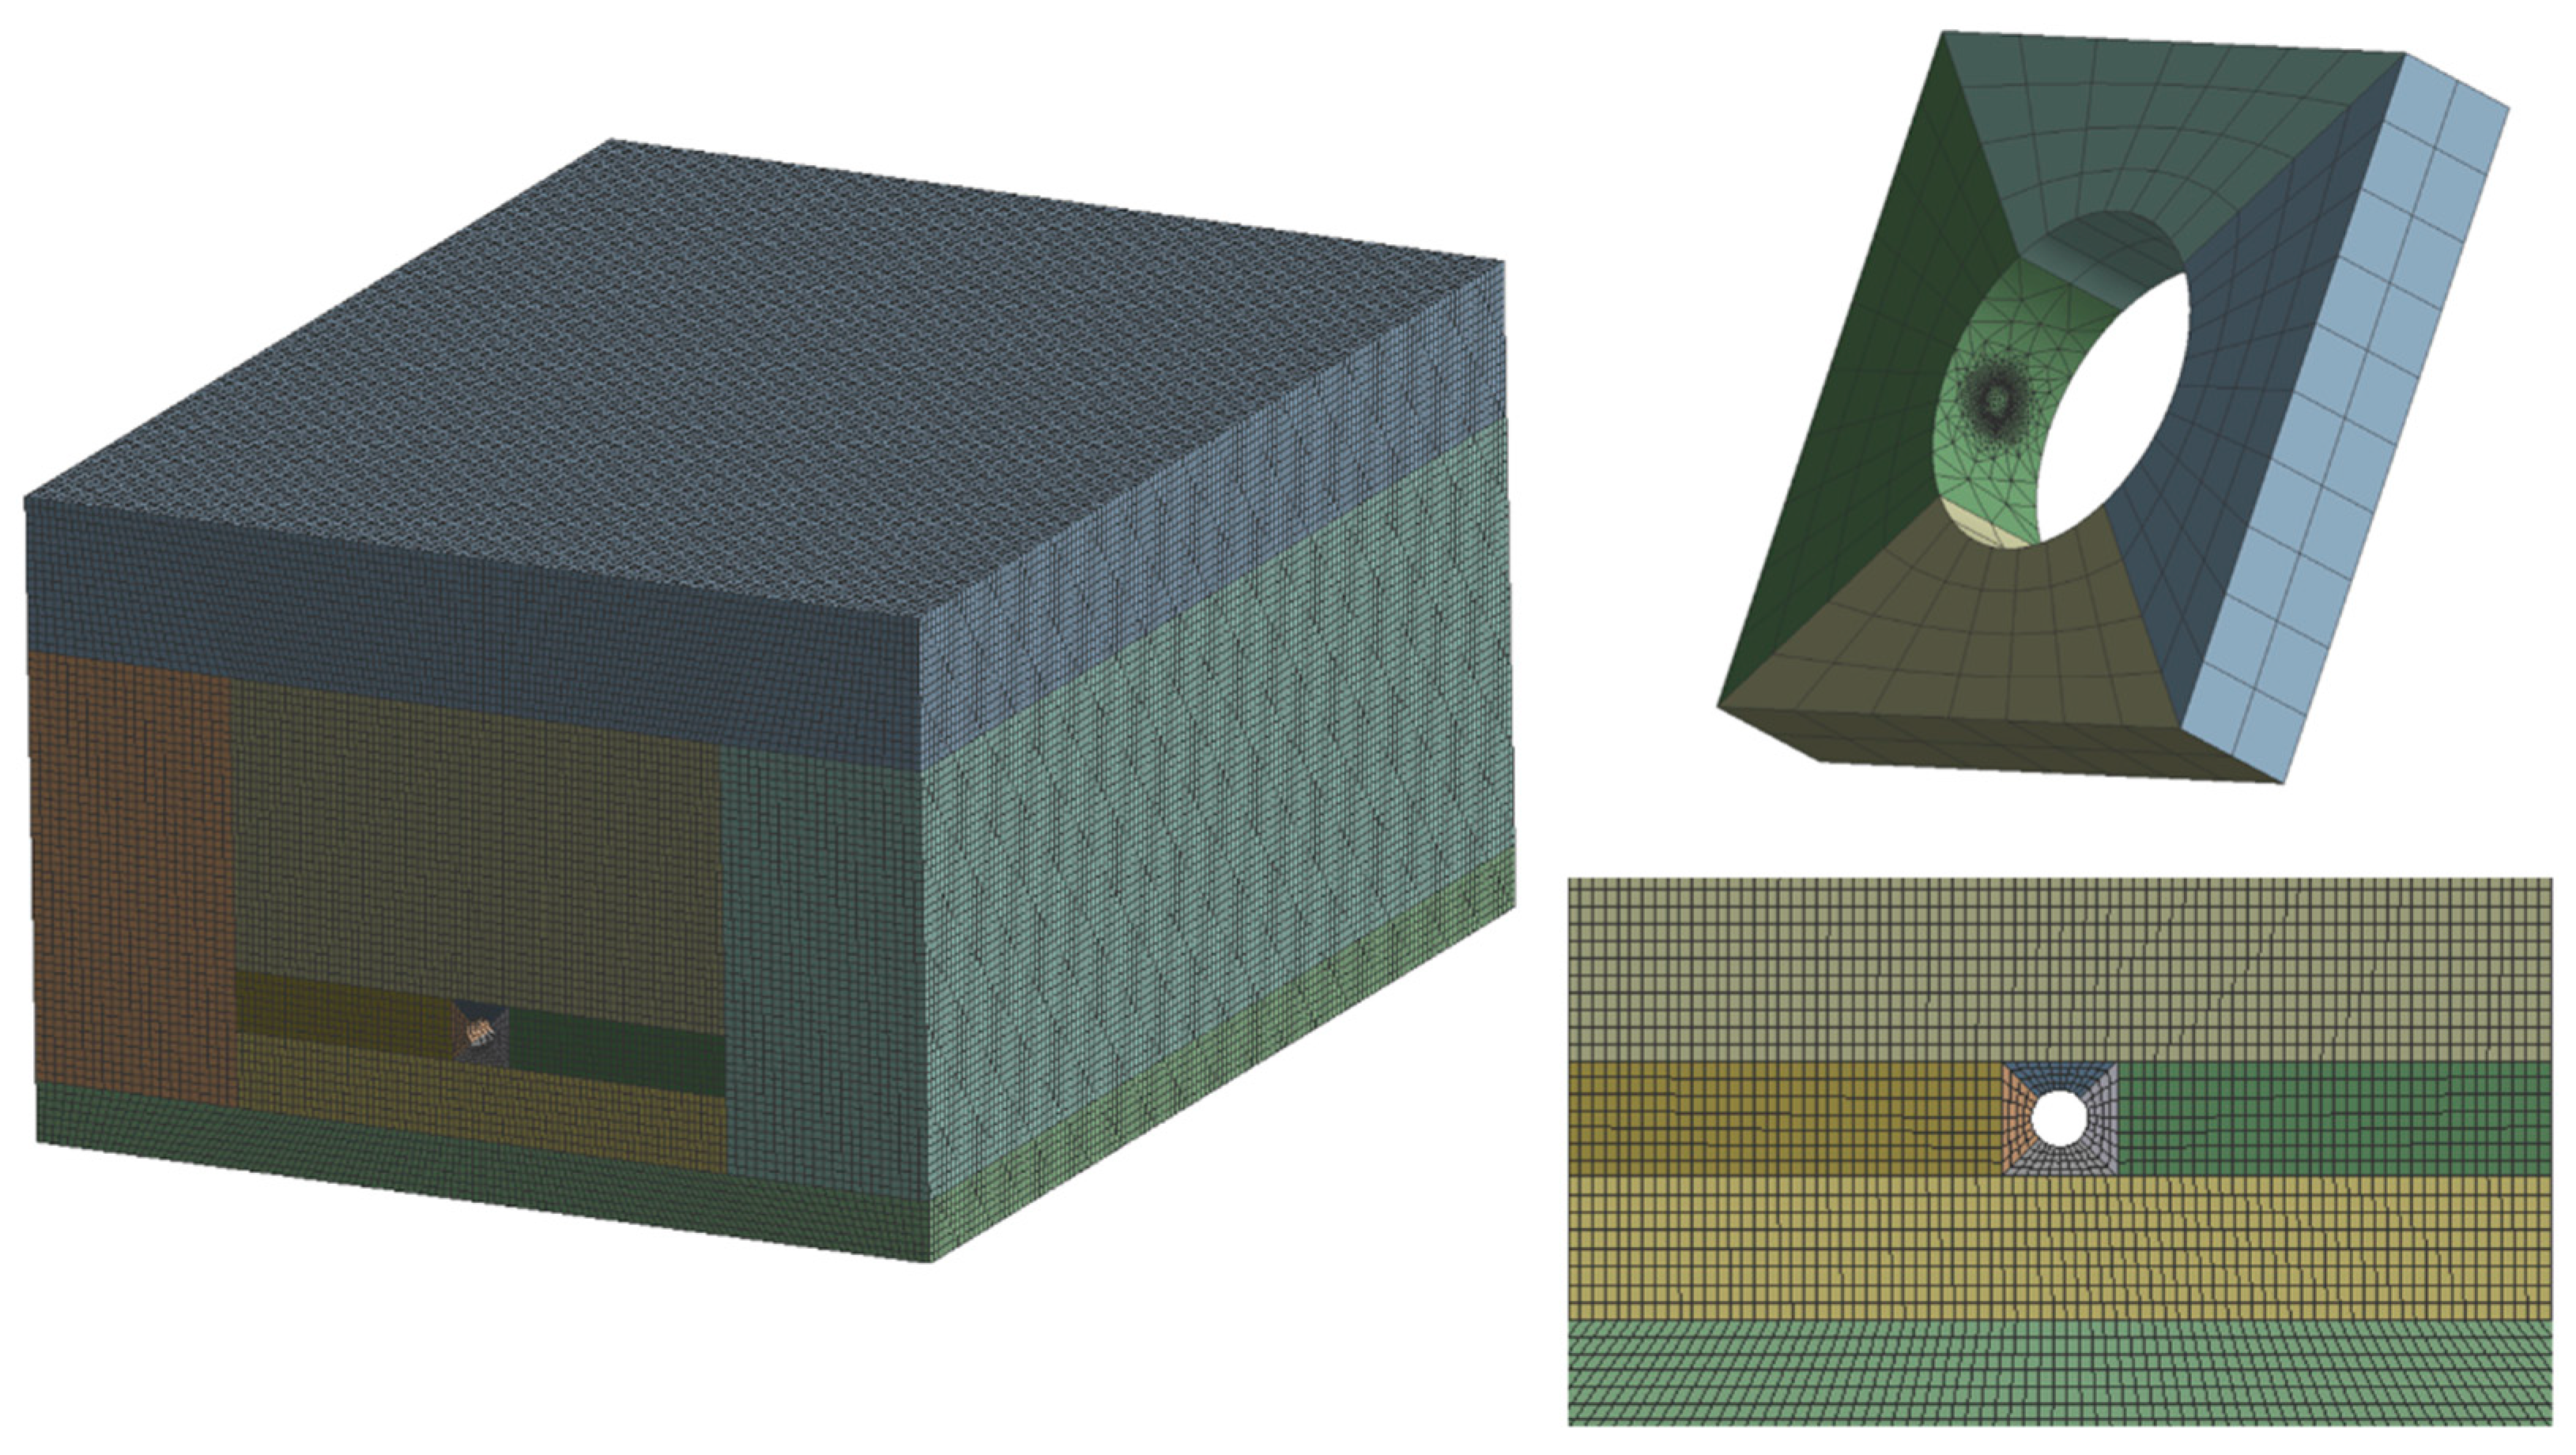
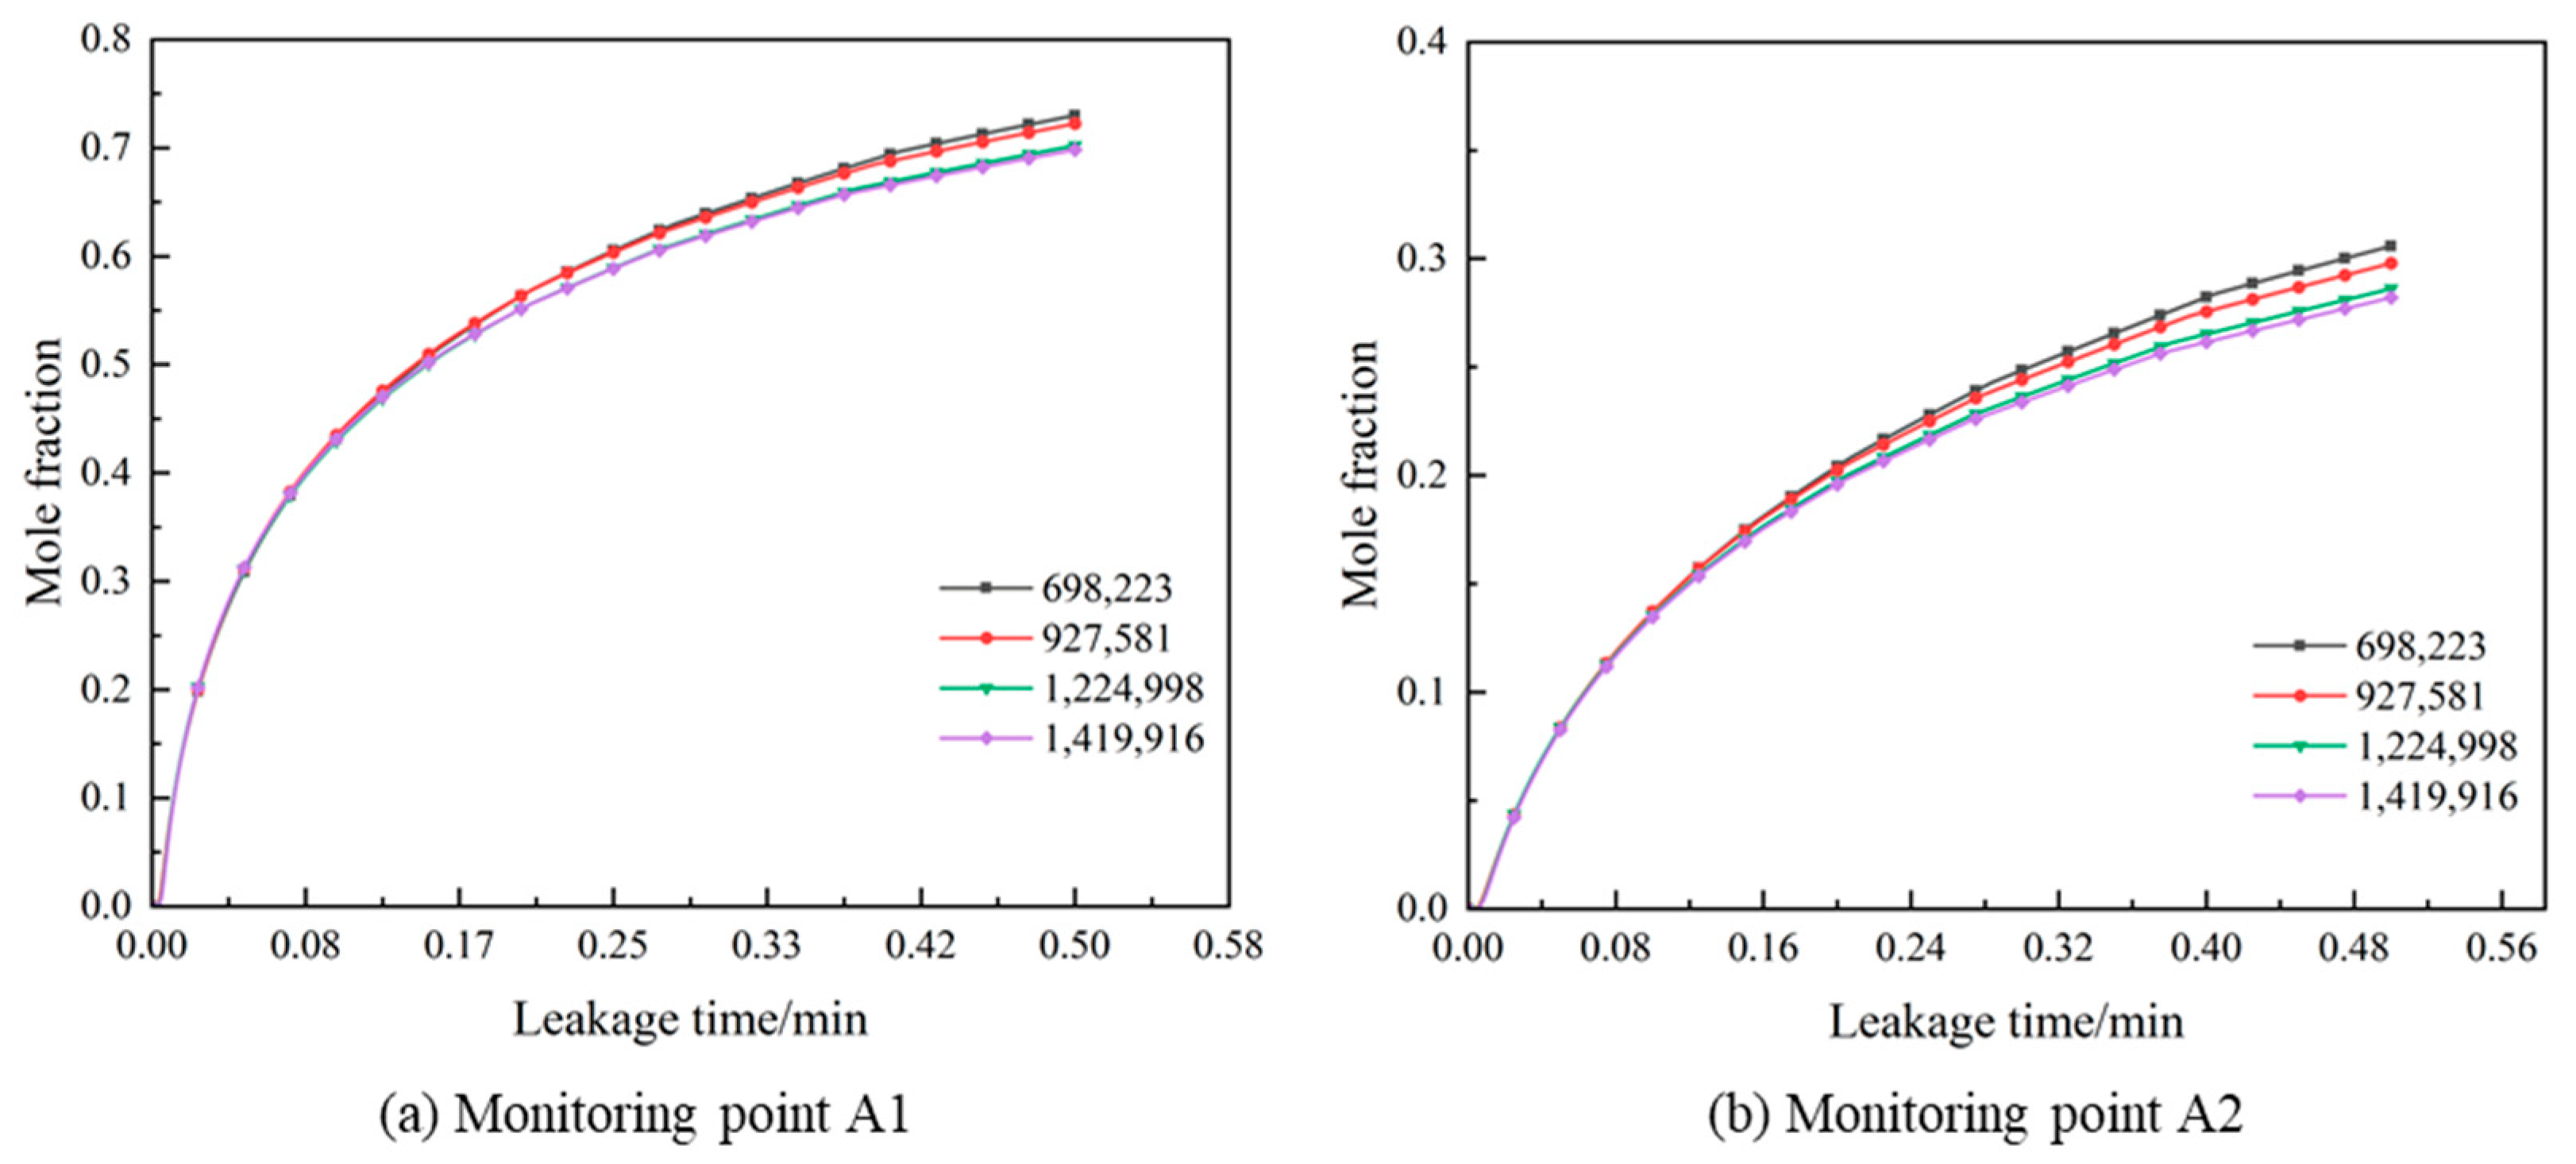
To ensure computational accuracy while reducing computation time, the overall grid partitioning is performed using hexahedral-structured grids. Considering the significant curvature at the leakage hole, local refinement is applied using unstructured grids (Figure 2). Four sets of grids are used for the mesh independence analysis, with total grid numbers of 698,223, 927,581, 1,224,998, and 1,419,916. Two monitoring points are set directly above the leakage hole at positions A1 (2, 0, 0.2) and A2 (2, 0, 0.3). The trends of gas volume fraction under four sets of grids are shown in Figure 3. It can be observed that when the number of grids increases from 1,224,998 to 1,419,916, there is no significant change in the gas concentration at the monitoring points. For the mesh configuration of 1,224,998, the minimum and average orthogonal quality is 0.13538 and 0.98047, respectively, and the maximum and average skewness is 0.86462 and 0.061906, respectively. Therefore, a total grid number of 1,224,998 is chosen for subsequent simulations.
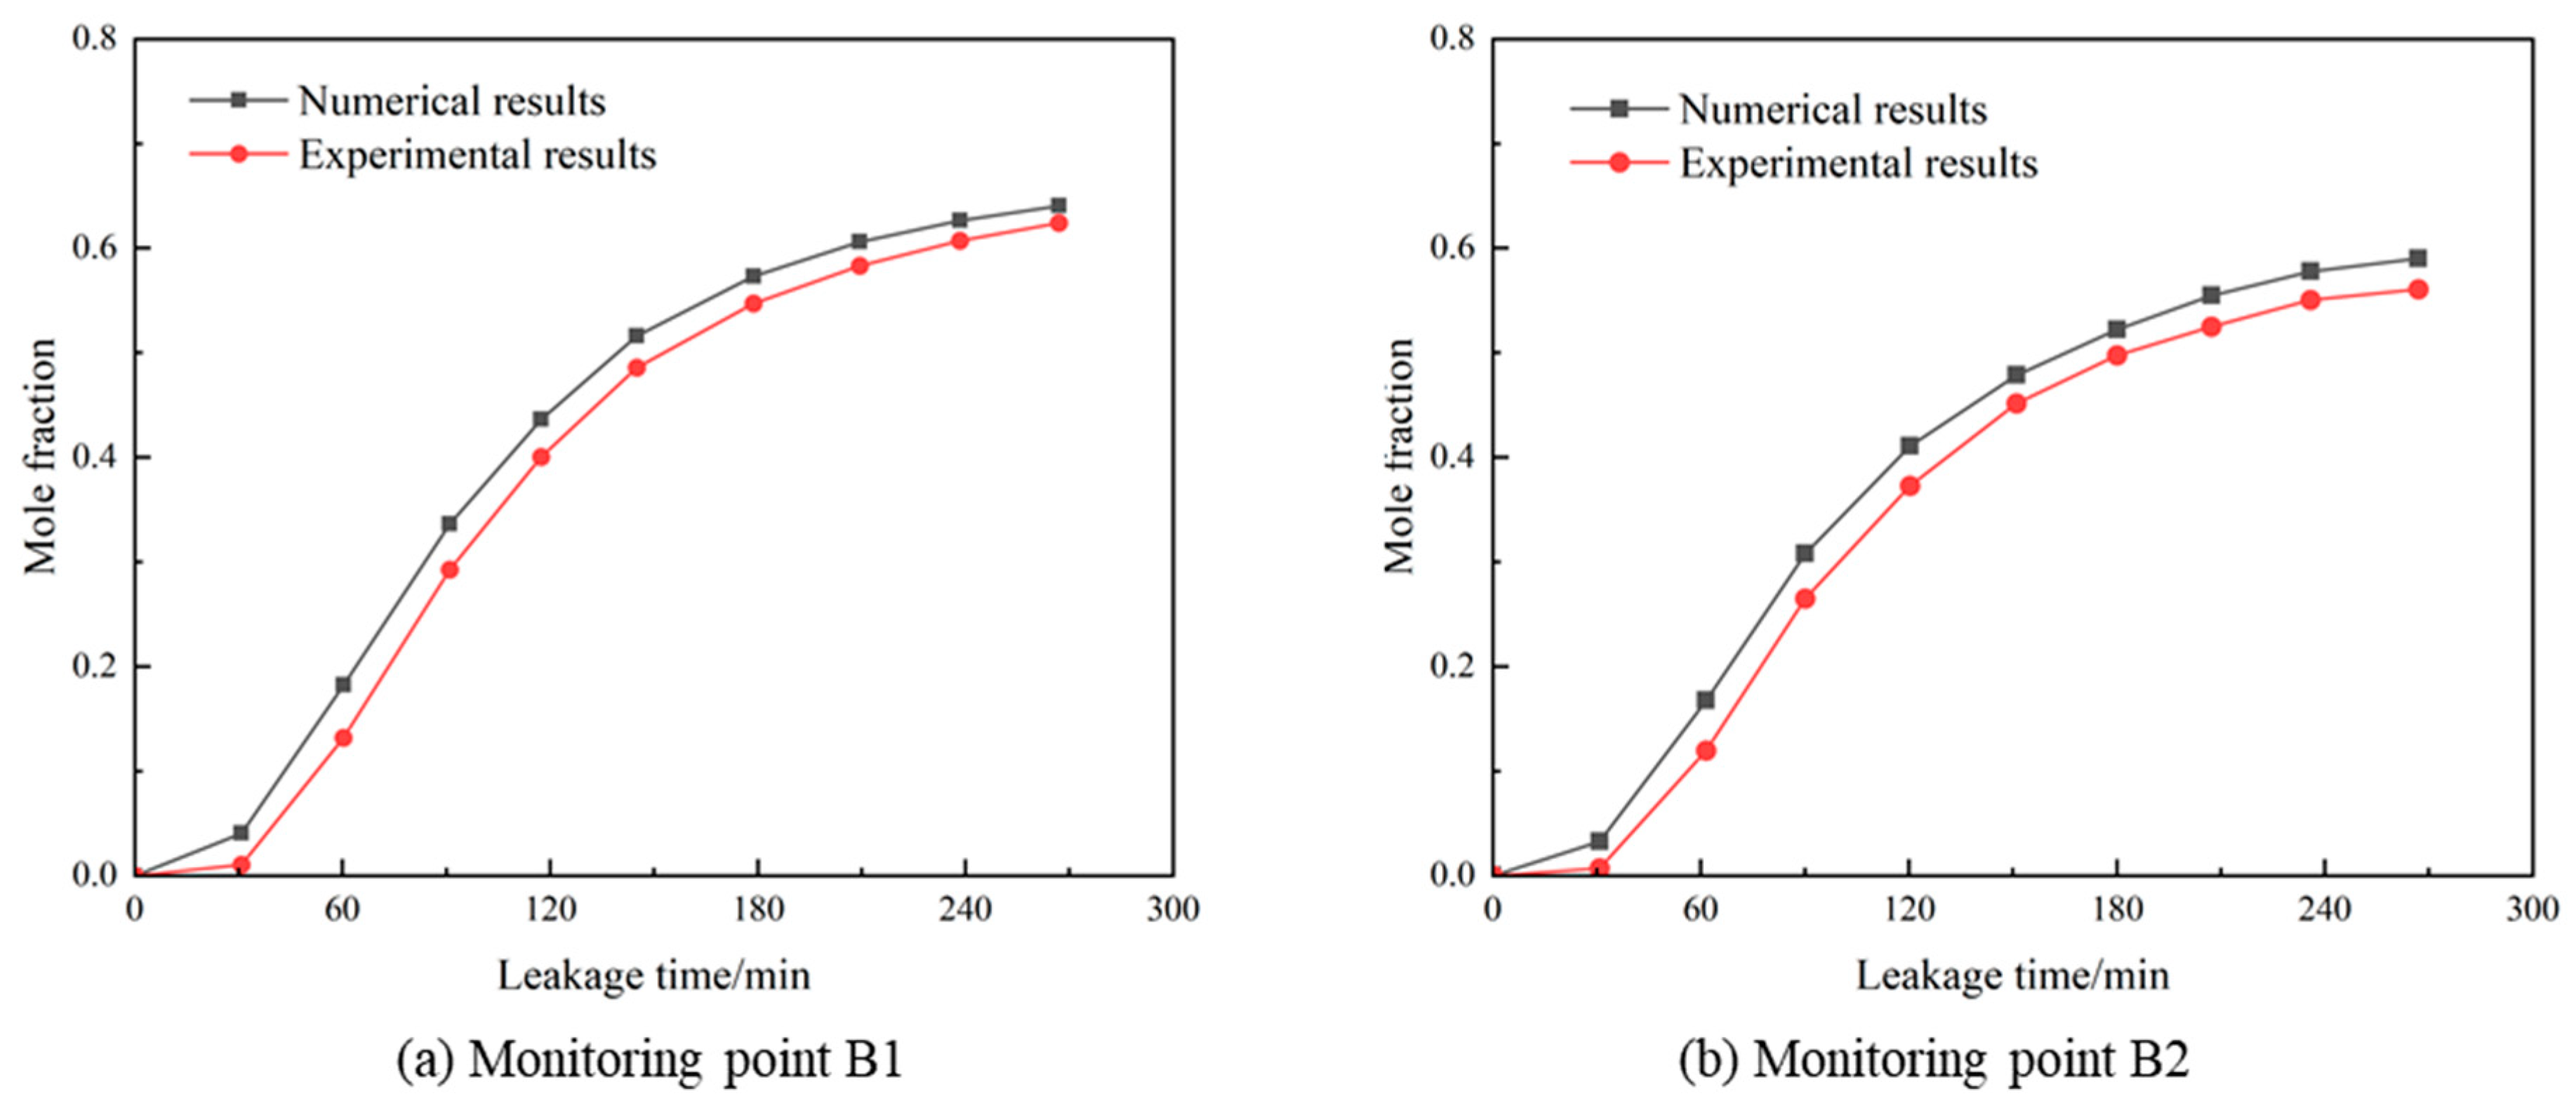
The numerical simulation is validated against the experimental results from Yan [34], where the leakage rate is 12 L/min and the soil porosity is 0.133. The physical model and initial/boundary conditions are kept identical to the experiment. The variation in the mole fraction of the natural gas at monitoring points B1 (0, −0.8, 0.3) and B2 (0.8, 0, 0.3) is shown in Figure 4. The simulated trend of natural gas concentration at the monitoring points follows that of the experiment, but the simulated values are slightly higher than the experimental ones. This is mainly because the numerical simulation does not account for the moisture saturation in the soil and the localized dense structures formed by soil particle impacts and compression, resulting in a slightly lower flow resistance. Overall, the maximum error between simulated and experimental results is less than 14%. Therefore, the model established in this study can be used to predict the leakage characteristics of pure hydrogen/hydrogen-doped natural gas in buried pipelines.

3. Results and Discussion

3.1. Leakage and Diffusion Characteristics

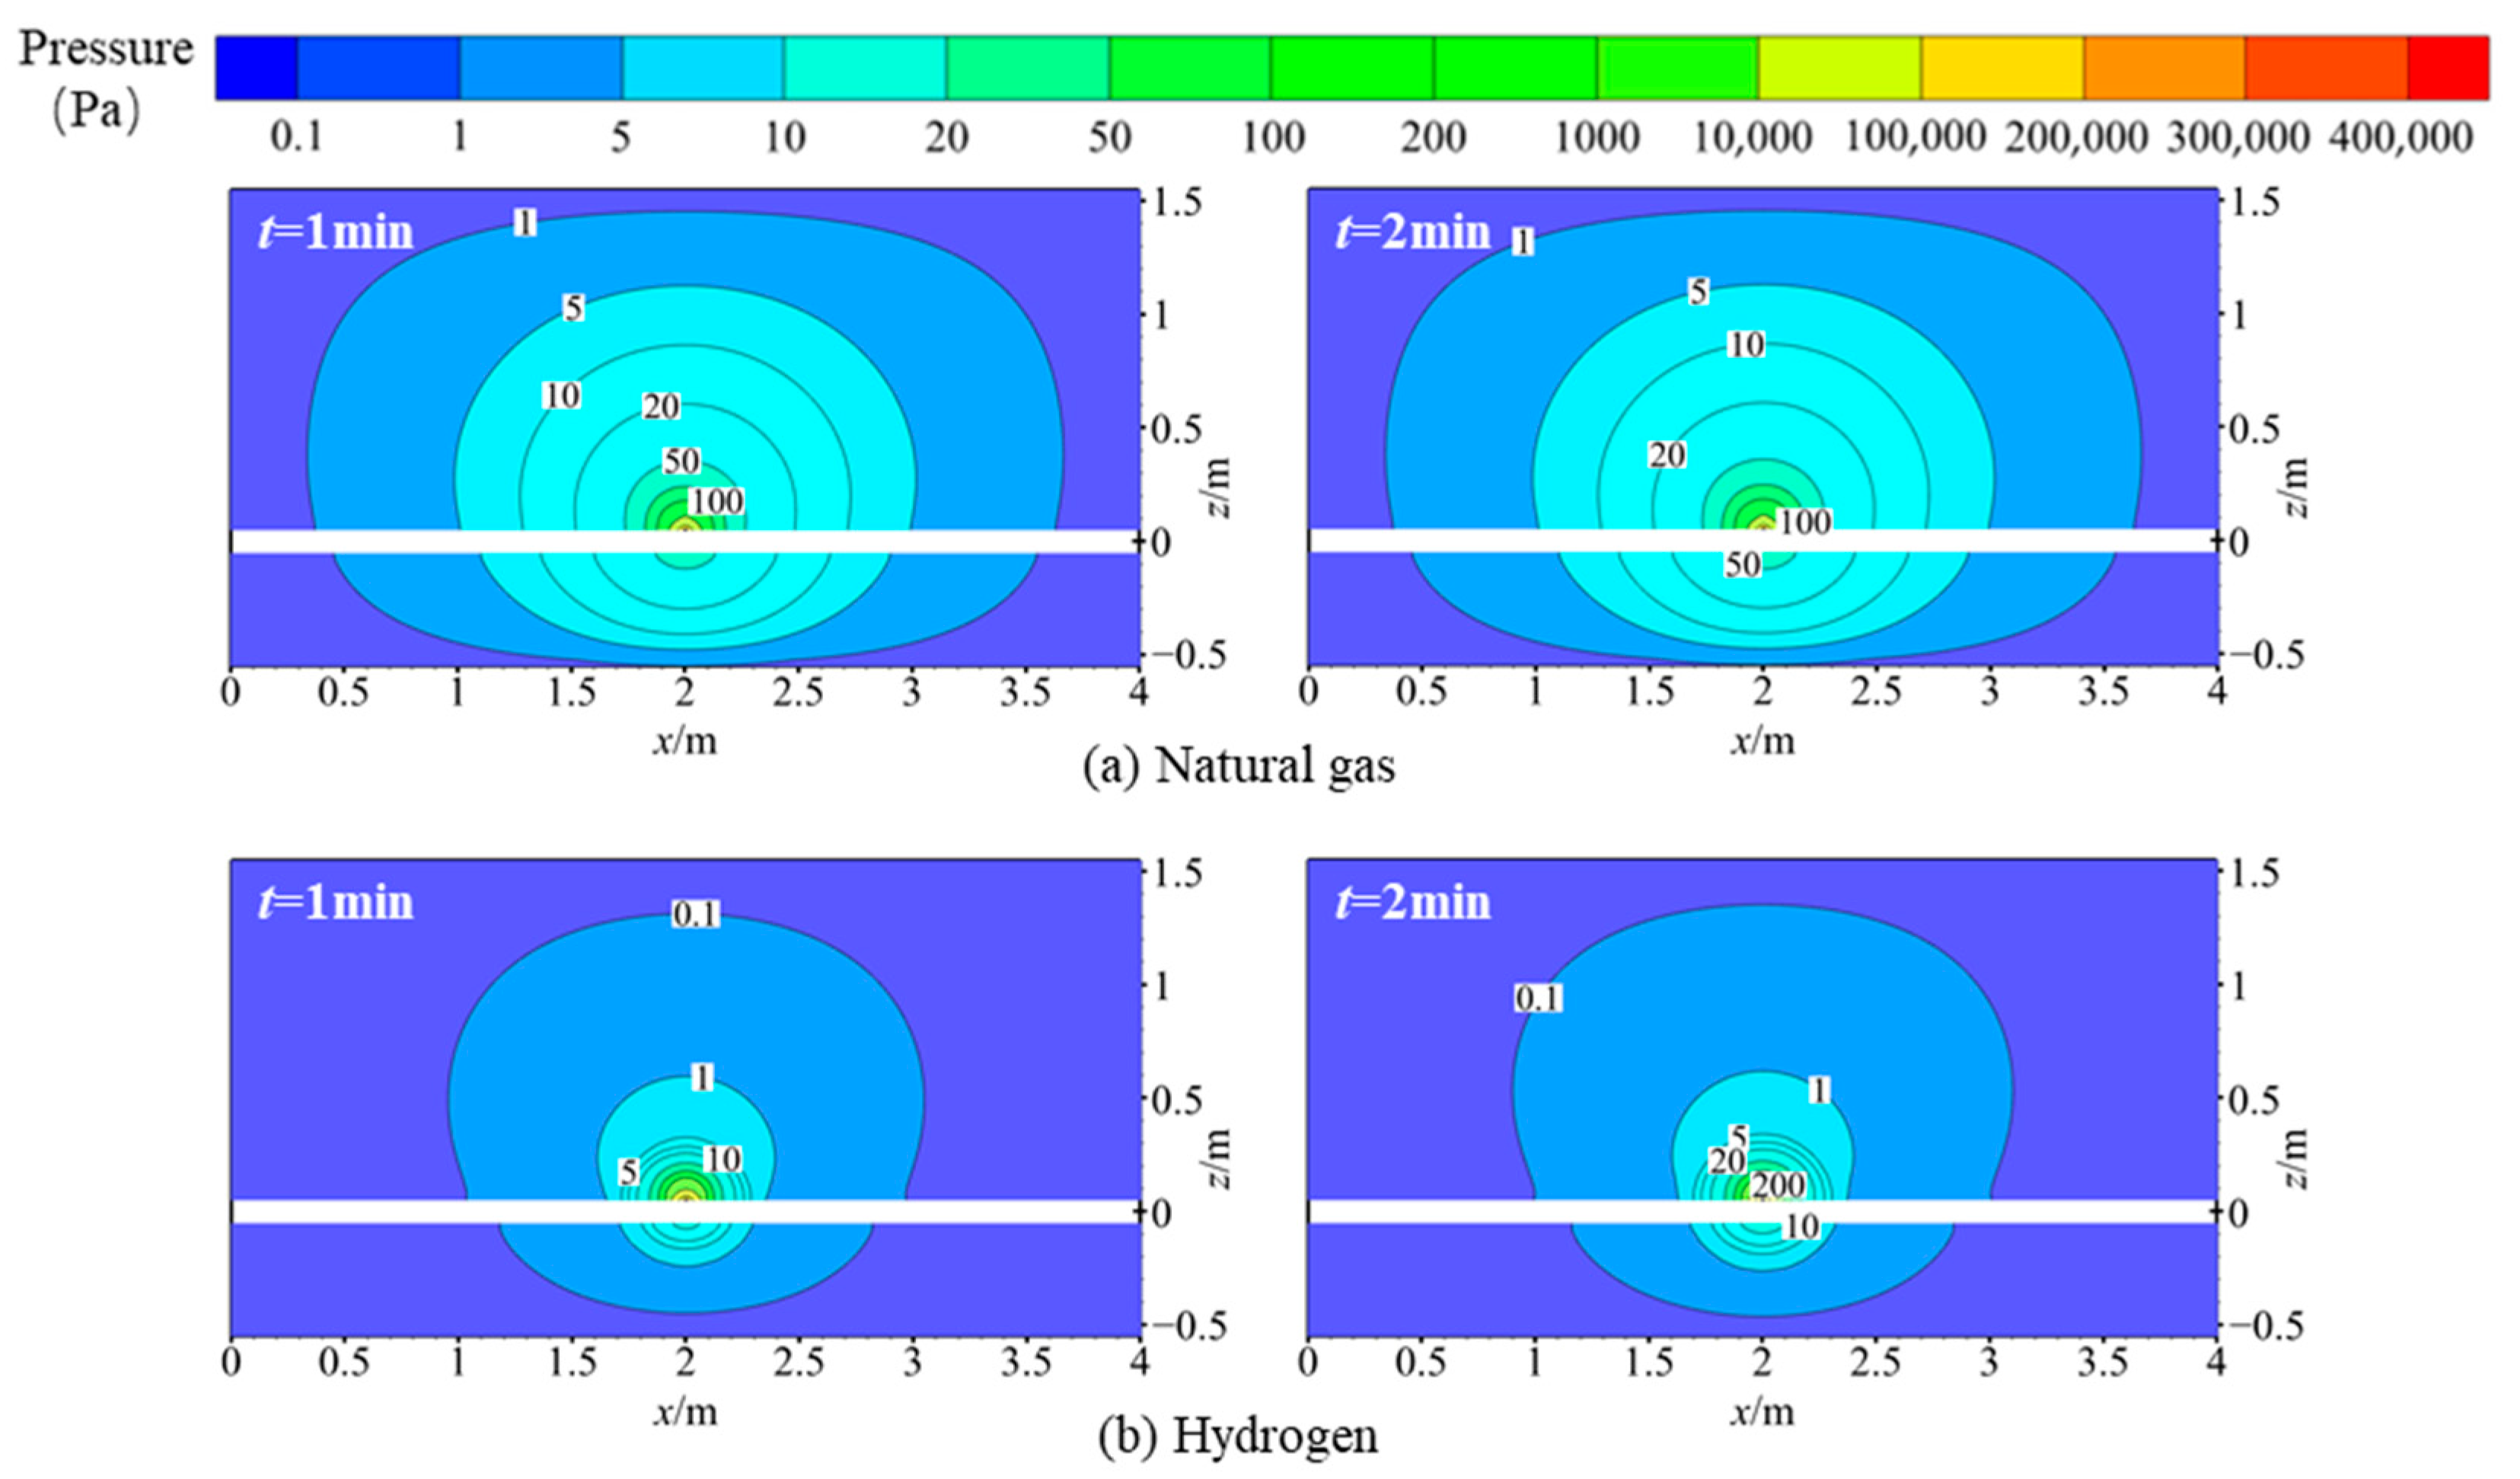
The leakage diffusion characteristics of natural gas and hydrogen in soil are simulated in case 1, with natural gas simplified to 100% methane content. The gas leaks and diffuses into the soil, with pressure rapidly declining (Figure 5). Both natural gas and hydrogen exhibit symmetric ring-shaped pressure distributions centered around the leak point. Before the leak, the pressure in the soil is atmospheric pressure. After the pipeline leaks, gas rapidly sprays out. Due to the resistance of the soil, it initially experiences back pressure. As the gas diffuses into the soil, the pressure gradually decreases and stabilizes. The pressure is highest near the leak hole in the soil, and it reaches a stable state first. As the gas spreads out into the soil, each section of the soil acts to reduce the pressure. The pressure of natural gas leaking at the ground surface is less than 1 Pa. Compared to natural gas, hydrogen experiences a faster pressure decay, with the pressure of leaking hydrogen at the ground surface being less than 0.1 Pa. The main difference between gas jetting in the atmosphere and gas seeping in the soil is that the pressure of gas permeating into the soil does not instantly drop to atmospheric pressure; instead, it decreases in the soil according to a certain pressure gradient.
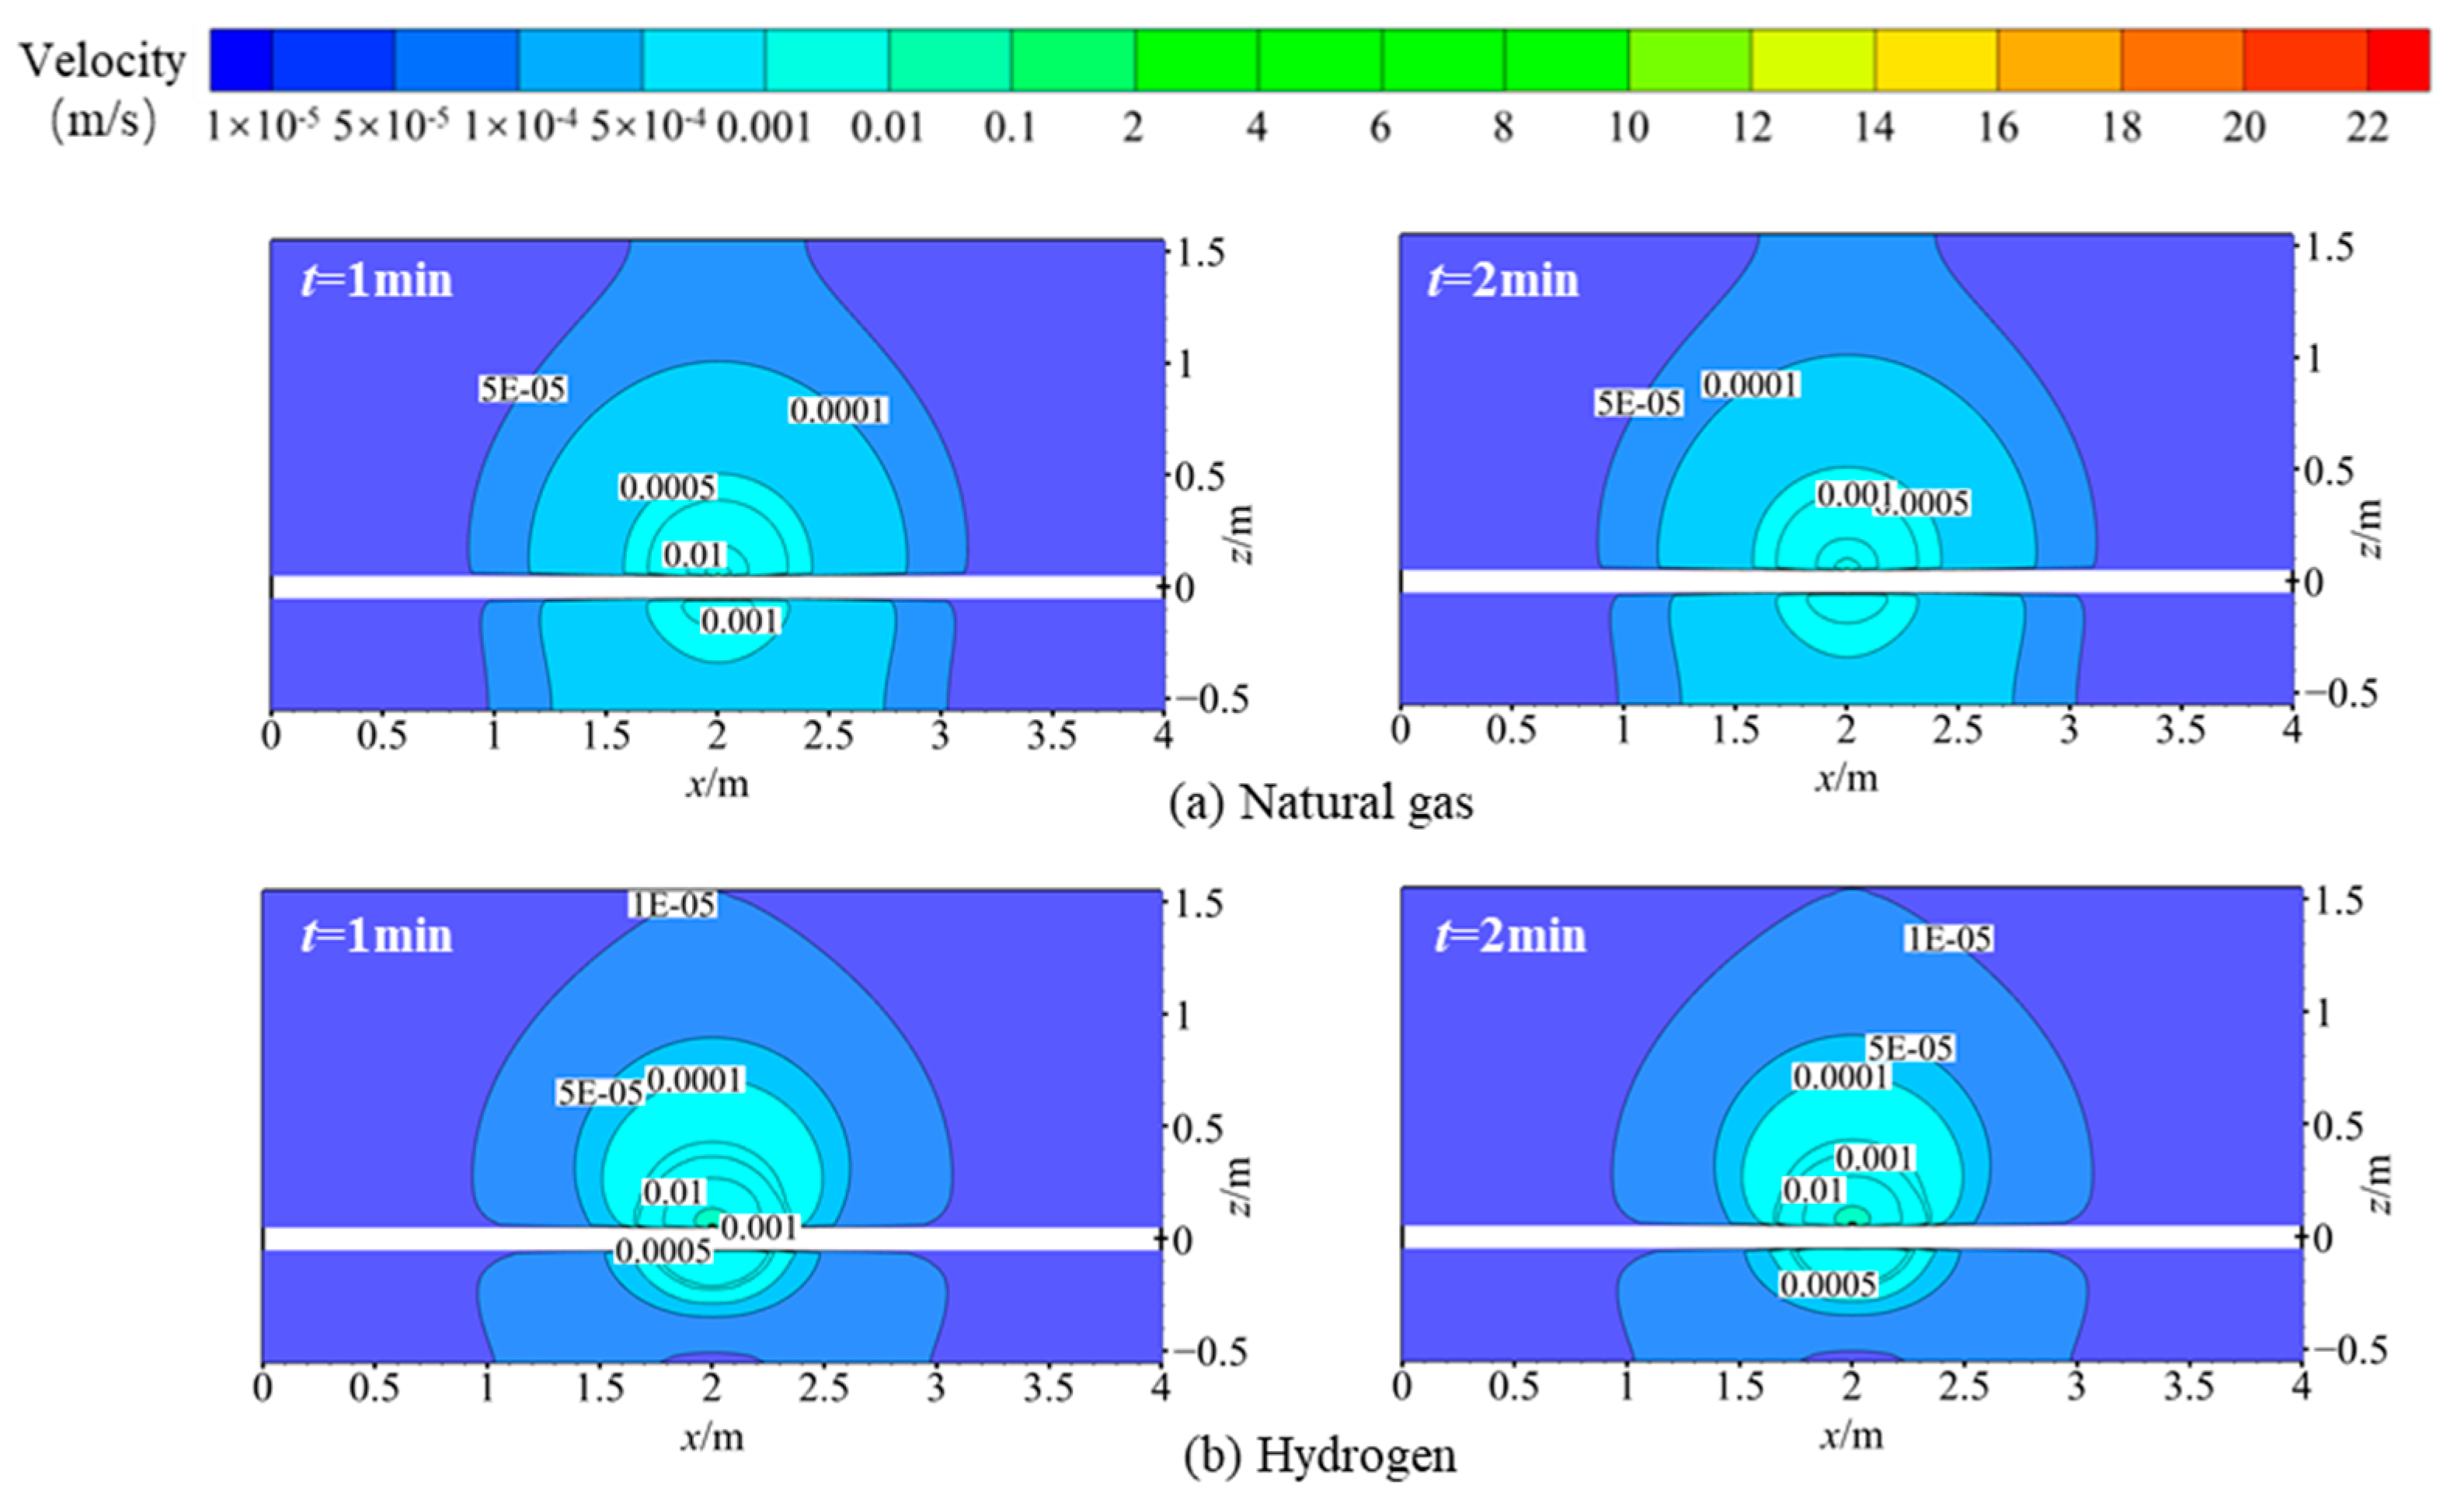
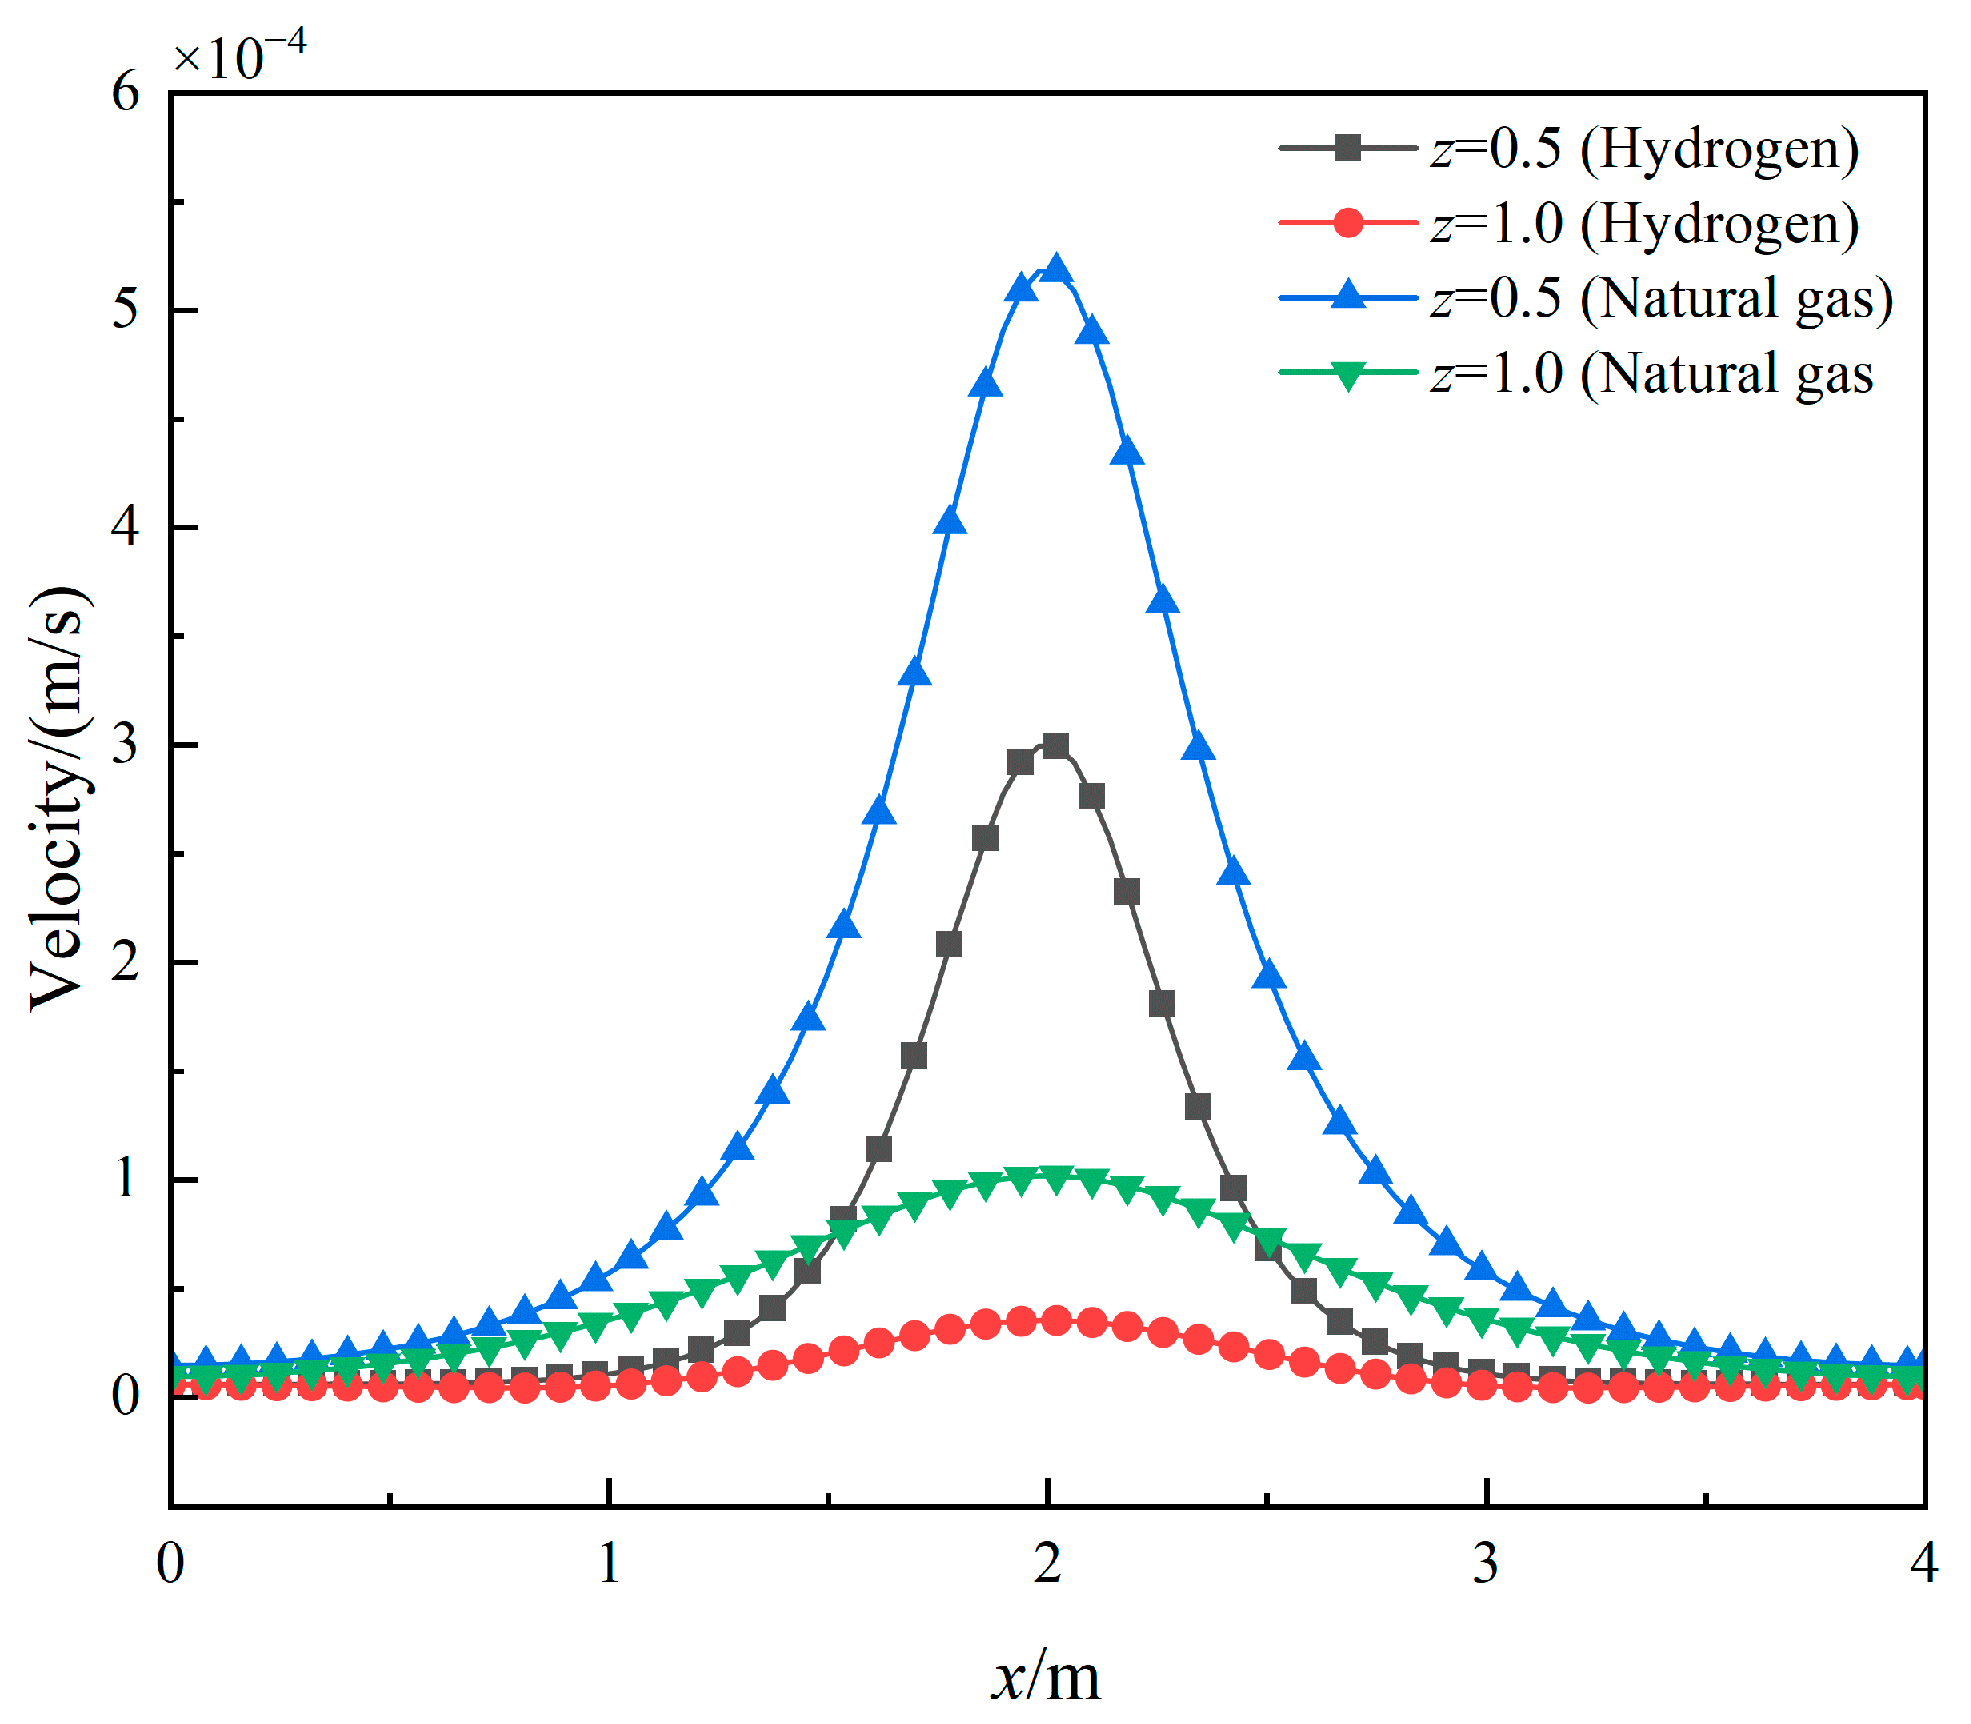
The change in velocity after gas leakage follows a similar pattern to the change in pressure (see Figure 6). After gas leakage, the velocity rapidly decreases, and the distribution of gas velocity in the soil is symmetric around the leakage hole. The velocity is highest near the hole, and as the gas spreads out into the soil, both pressure and flow velocity decrease rapidly. Compared to natural gas, hydrogen experiences a rapid decay in velocity as well. The flow velocity of hydrogen at the ground surface is less than 1 × 10⁻⁵ m/s. Two monitoring lines are set at (x, 0, 0.5) and (x, 0, 1.0), respectively, to observe the horizontal distribution of gas velocity at t = 1 min (Figure 7). It can be observed that the farther away from the leakage hole, the more uniform the velocity distribution becomes. The monitoring line (x, 0, 1.0) is further away from the leakage hole and is significantly affected by soil resistance, resulting in a noticeable decrease in velocity. This indicates that soil resistance has a significant impact on the distribution of hydrogen velocity in buried pipeline leakage.
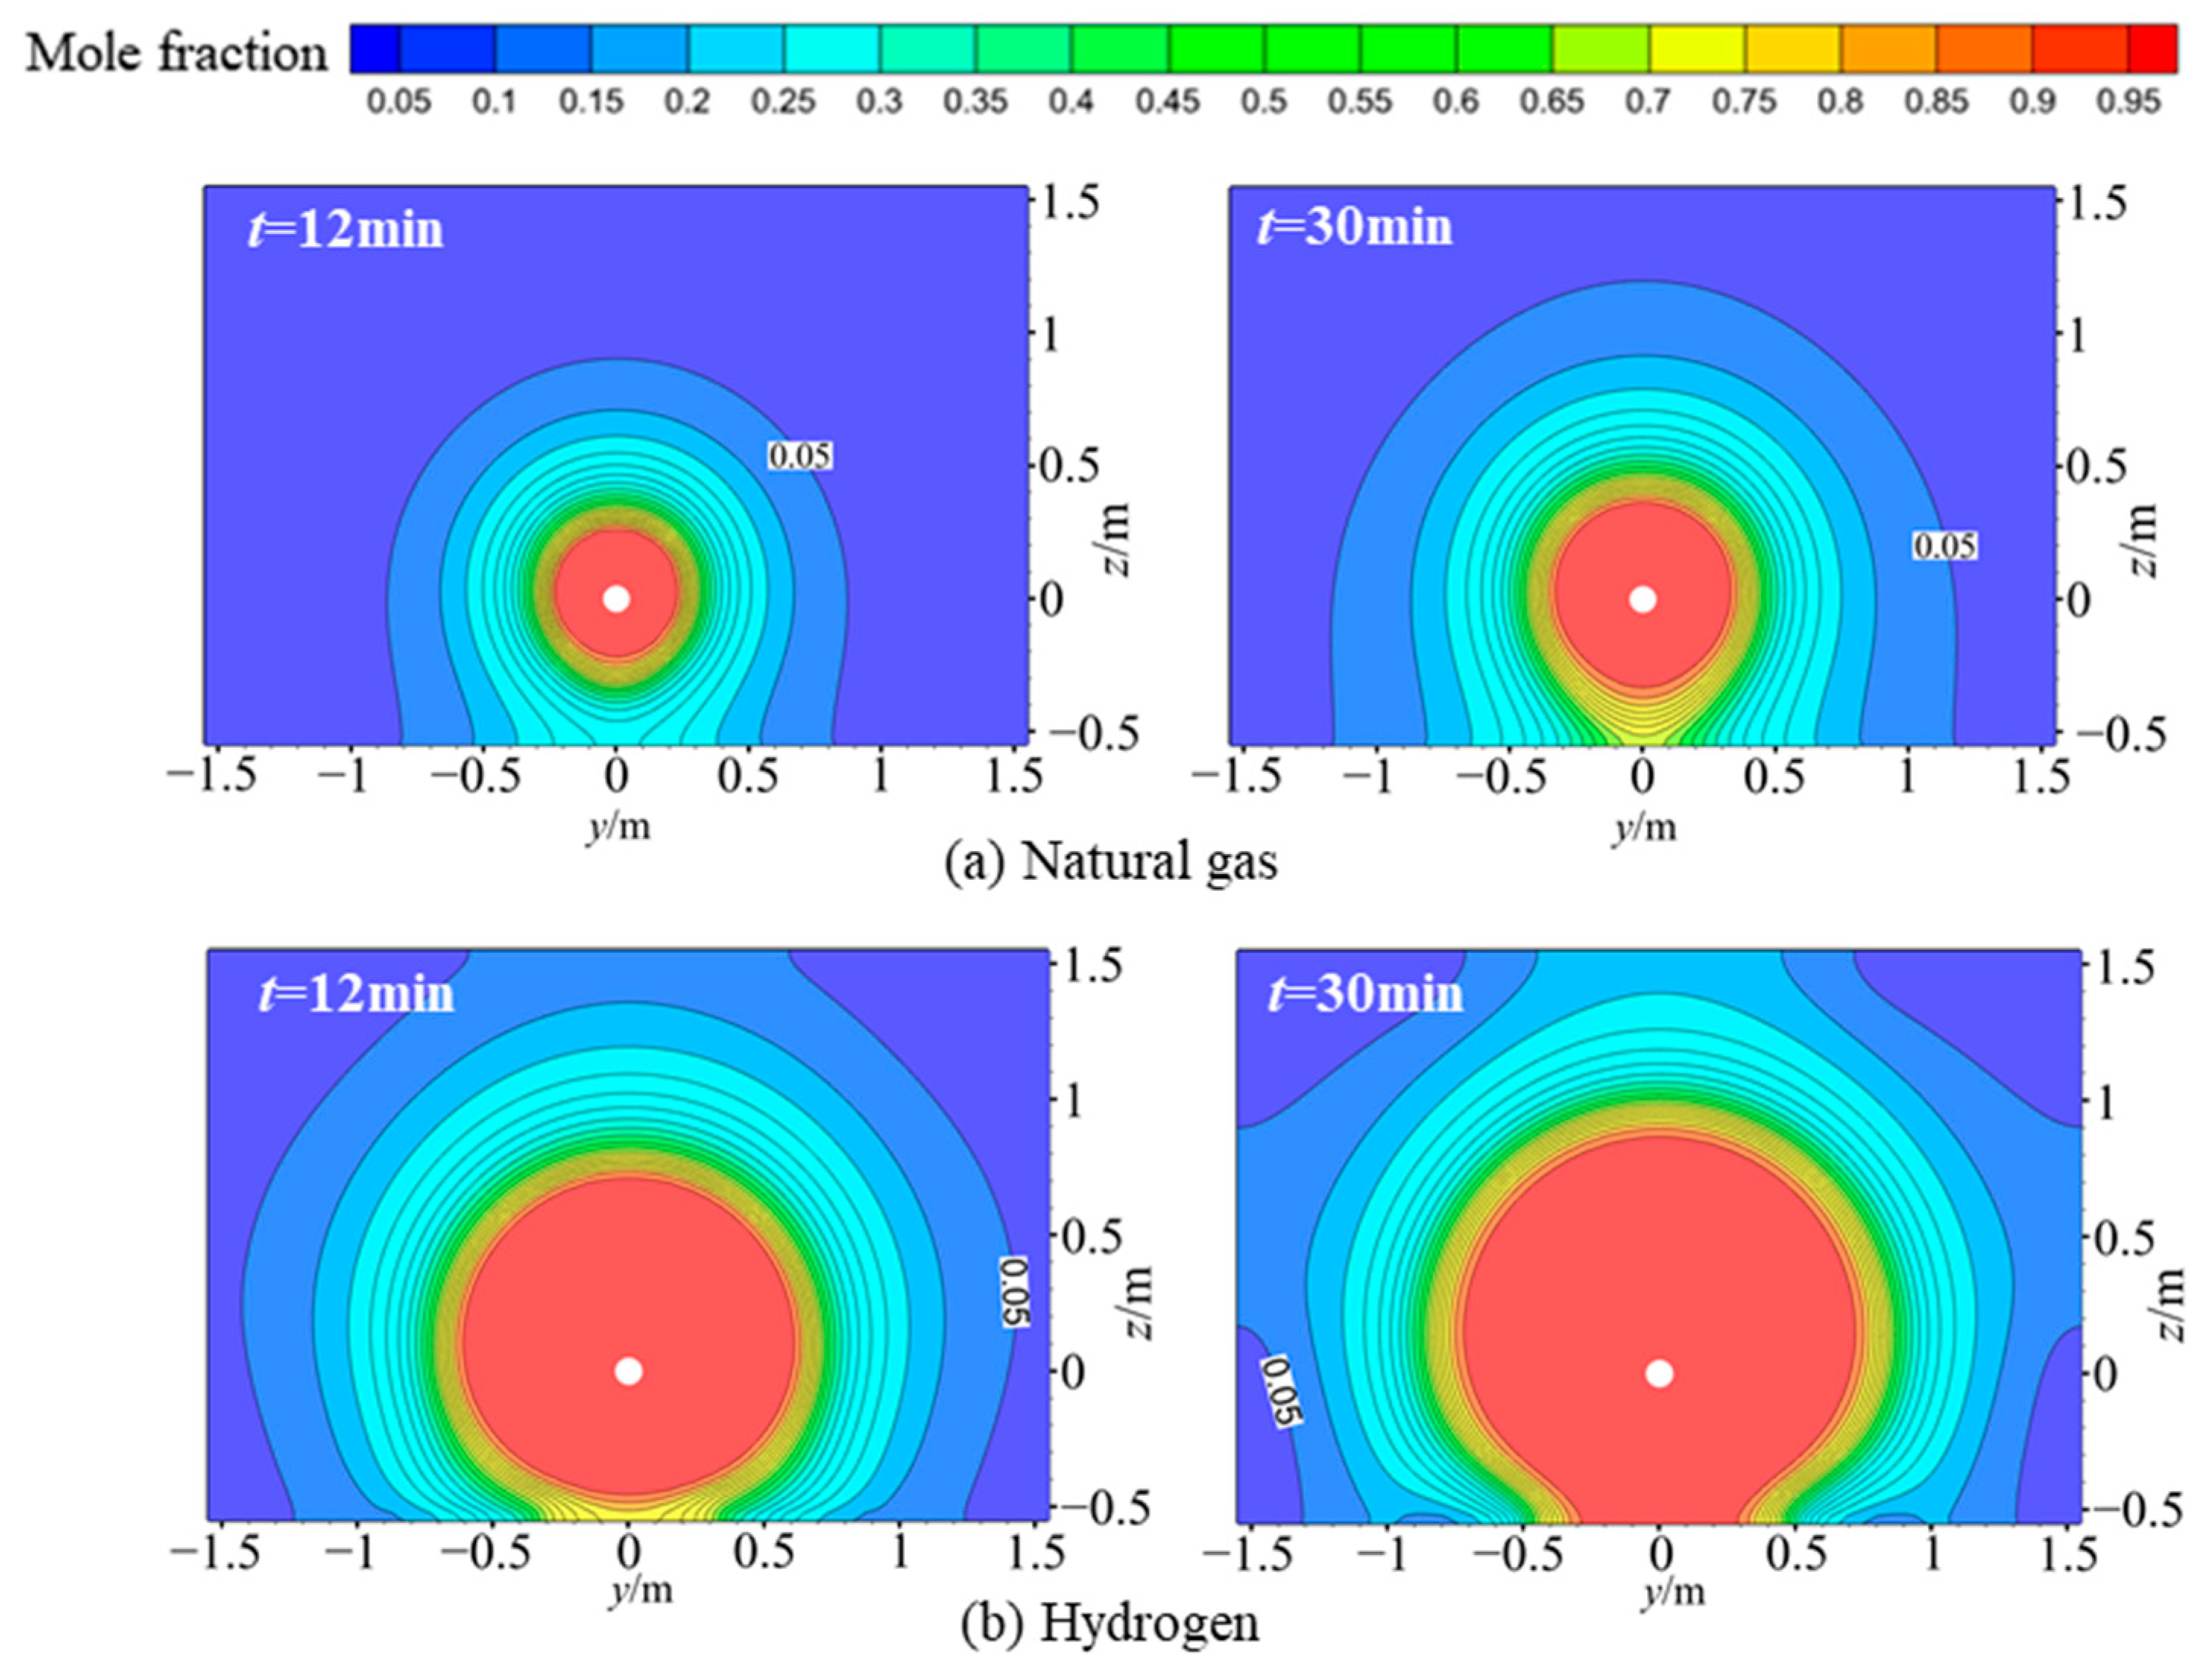
The evolution of the concentration of natural gas and hydrogen in the soil is depicted in Figure 8. Based on the assumption of isotropic soil, the concentration distribution of the gas in the soil is symmetrical. At the same time, the diffusion range of hydrogen is much larger than that of natural gas. This is because hydrogen has a smaller density than natural gas, approximately 1/8 of natural gas at standard temperature and pressure, and is more affected by buoyancy. Additionally, hydrogen has a smaller viscosity than natural gas, leading to stronger convective effects. Furthermore, the diffusion coefficient of hydrogen surpasses that of natural gas, with hydrogen’s coefficient being approximately 3.8-times higher than that of natural gas at 0 °C and 0.1 MPa. Therefore, hydrogen diffuses faster in the soil compared to natural gas.
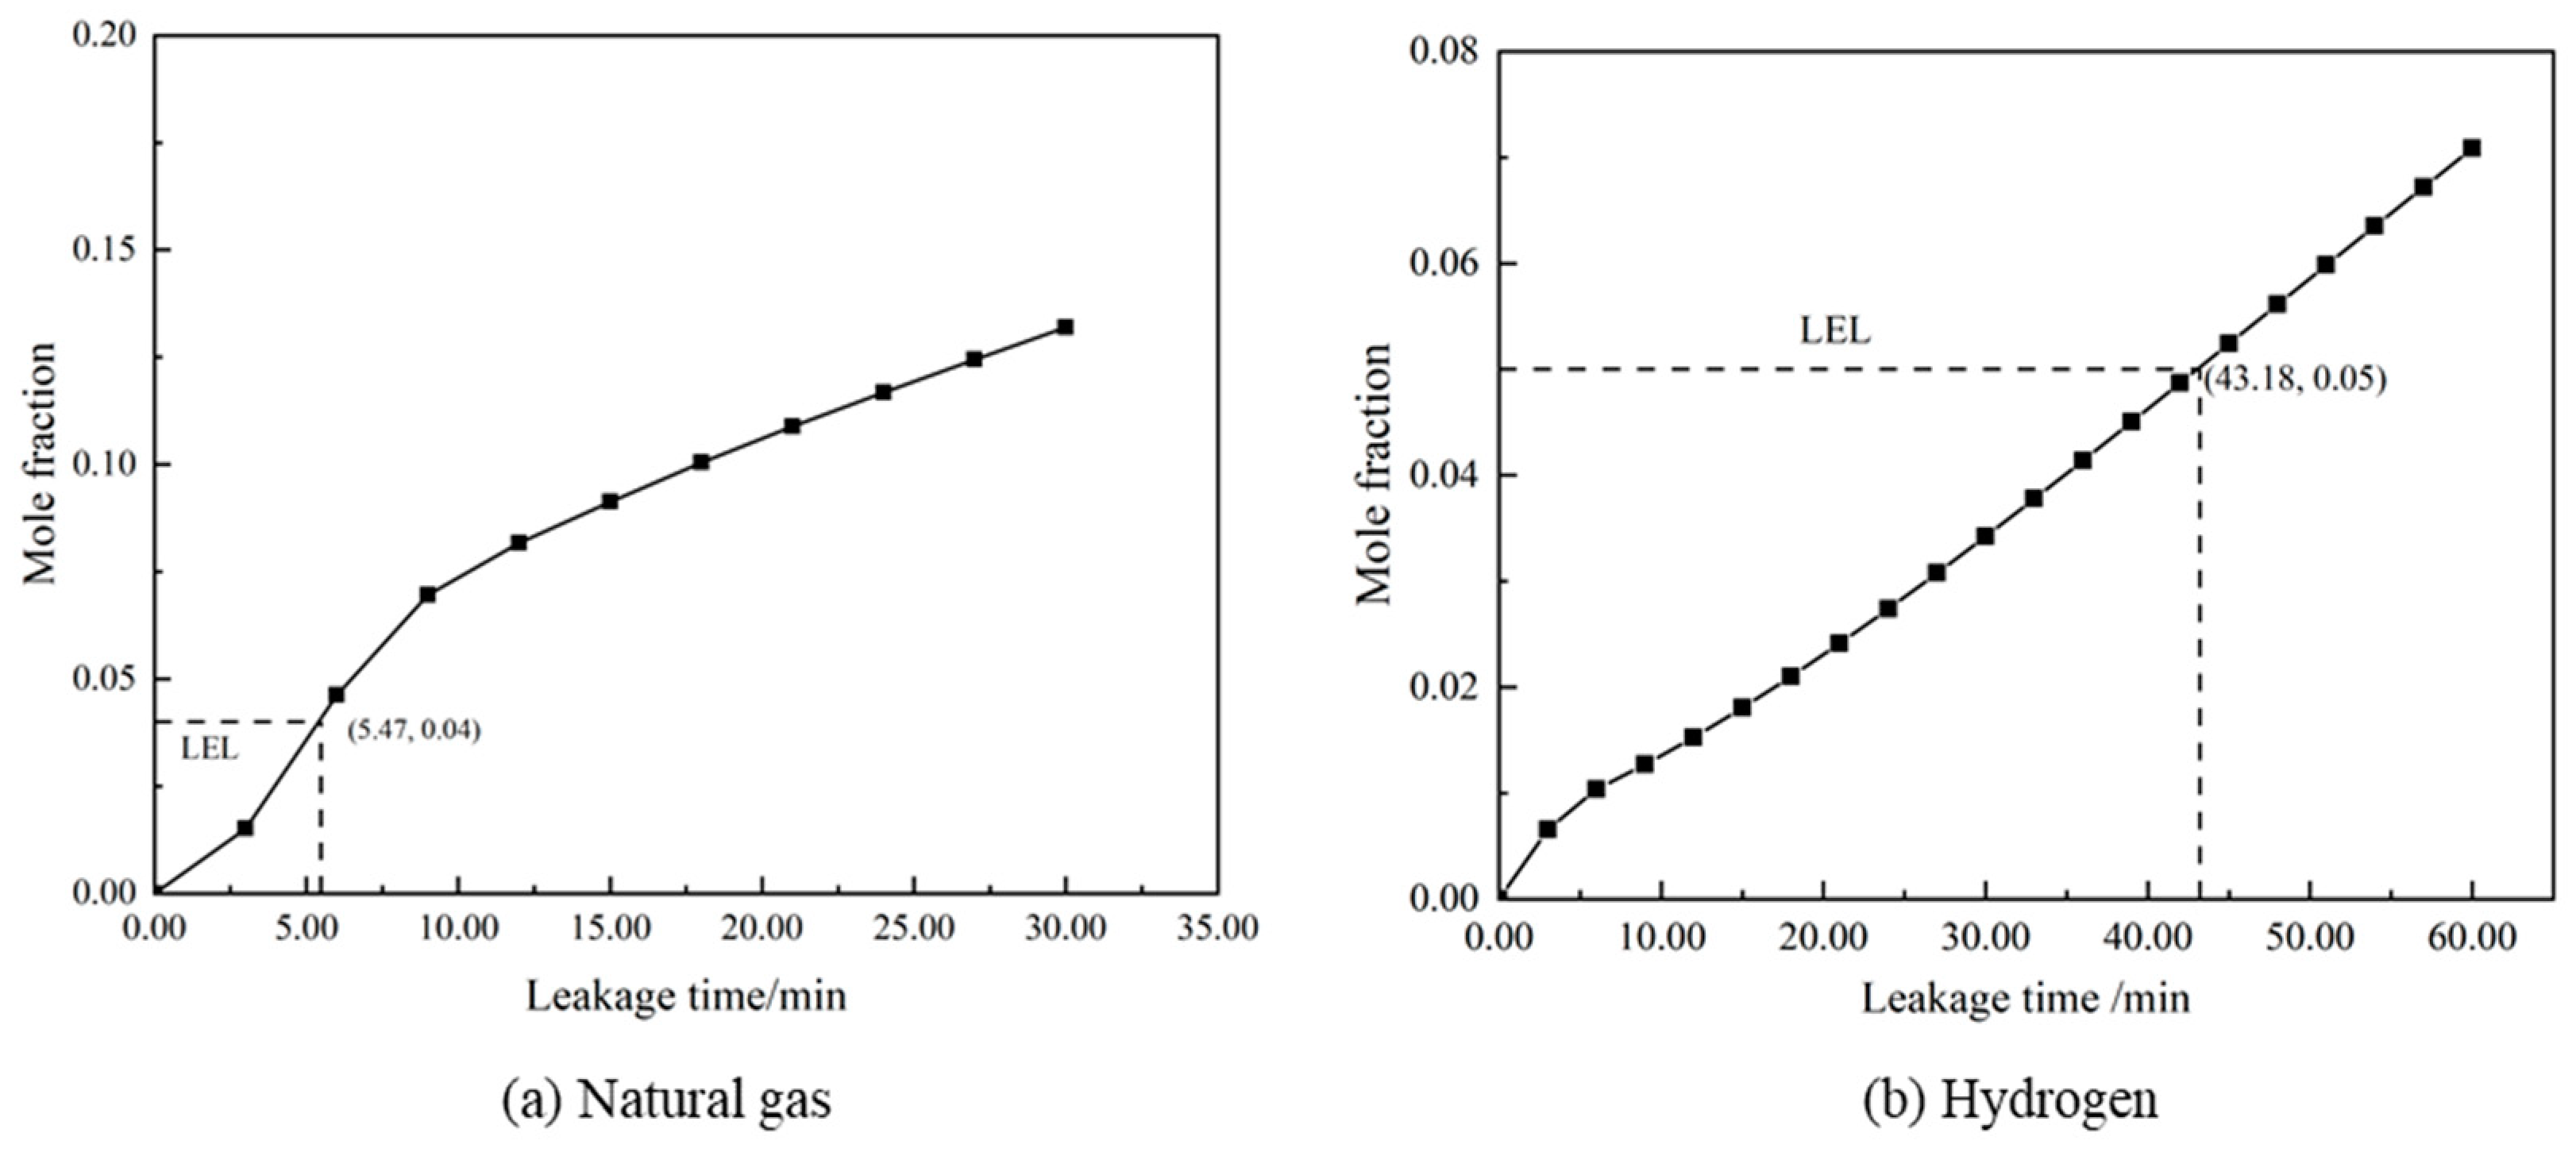
The concentration variations in natural gas and hydrogen at monitoring point P3 are depicted in Figure 9. The diffusion rate of both natural gas and hydrogen in the soil can be divided into three stages: rapid growth, slow growth, and stabilization. Compared to natural gas leakage, the growth stage of hydrogen lasts longer, with natural gas diffusion reaching stability around t = 6 min, while hydrogen reaches stability at approximately t = 9 min. Observing the concentration of gas over time at P3, hydrogen diffuses much faster in the soil compared to natural gas. The lower explosive limit (LEL) is introduced to evaluate the safety of gas concentrations and is defined as the lowest concentration of a gas or vapor that can ignite and produce a flame when an ignition source is present. The time for natural gas to reach the LEL at the ground surface is approximately 43.18 min, whereas at around 5.47 min, the hydrogen concentration at P3 has already reached its LEL. If there is an open flame or static electricity present at the ground surface at this time, hydrogen will rapidly explode. Therefore, leaks from hydrogen pipelines are more dangerous than those from natural gas pipelines. Additionally, due to the isotropy of the soil, the concentration distributions of natural gas and hydrogen along the horizontal direction observed through monitoring lines L1 and L2 (Figure 10) reveal that both hydrogen and natural gas exhibit symmetric concentration distributions as they diffuse in the soil. At the same time, the diffusion range of hydrogen is much larger than that of natural gas.

3.2. Impact Factor Analysis

According to the specialized code of GB/T50493-2019 in China [35], the alarm-setting standards for hydrogen gas detectors are defined as follows: (1) the first-level alarm value should be less than or equal to 25% of the LEL of hydrogen gas; (2) the second-level alarm value should be less than or equal to 50% of the LEL of hydrogen gas. Based on this standard, the following relevant risk indicators for hydrogen gas leaks are defined: (1) the first dangerous time (FDT) represents the time required for the gas concentration at the surface projection point of the leakage hole (monitoring point P3) to reach the LEL; (2) the alarm radius (AR) is the maximum distance from the leak source, where the horizontal hydrogen gas concentration reaches the isoline of the first-level alarm; (3) the danger radius (DR) is the maximum distance from the leak source, where the horizontal hydrogen gas concentration exceeds the LEL isoline. The analysis of factors influencing gas leakage and diffusion is conducted based on the above risk indicators.

3.2.1. Influence of Leakage Pressure

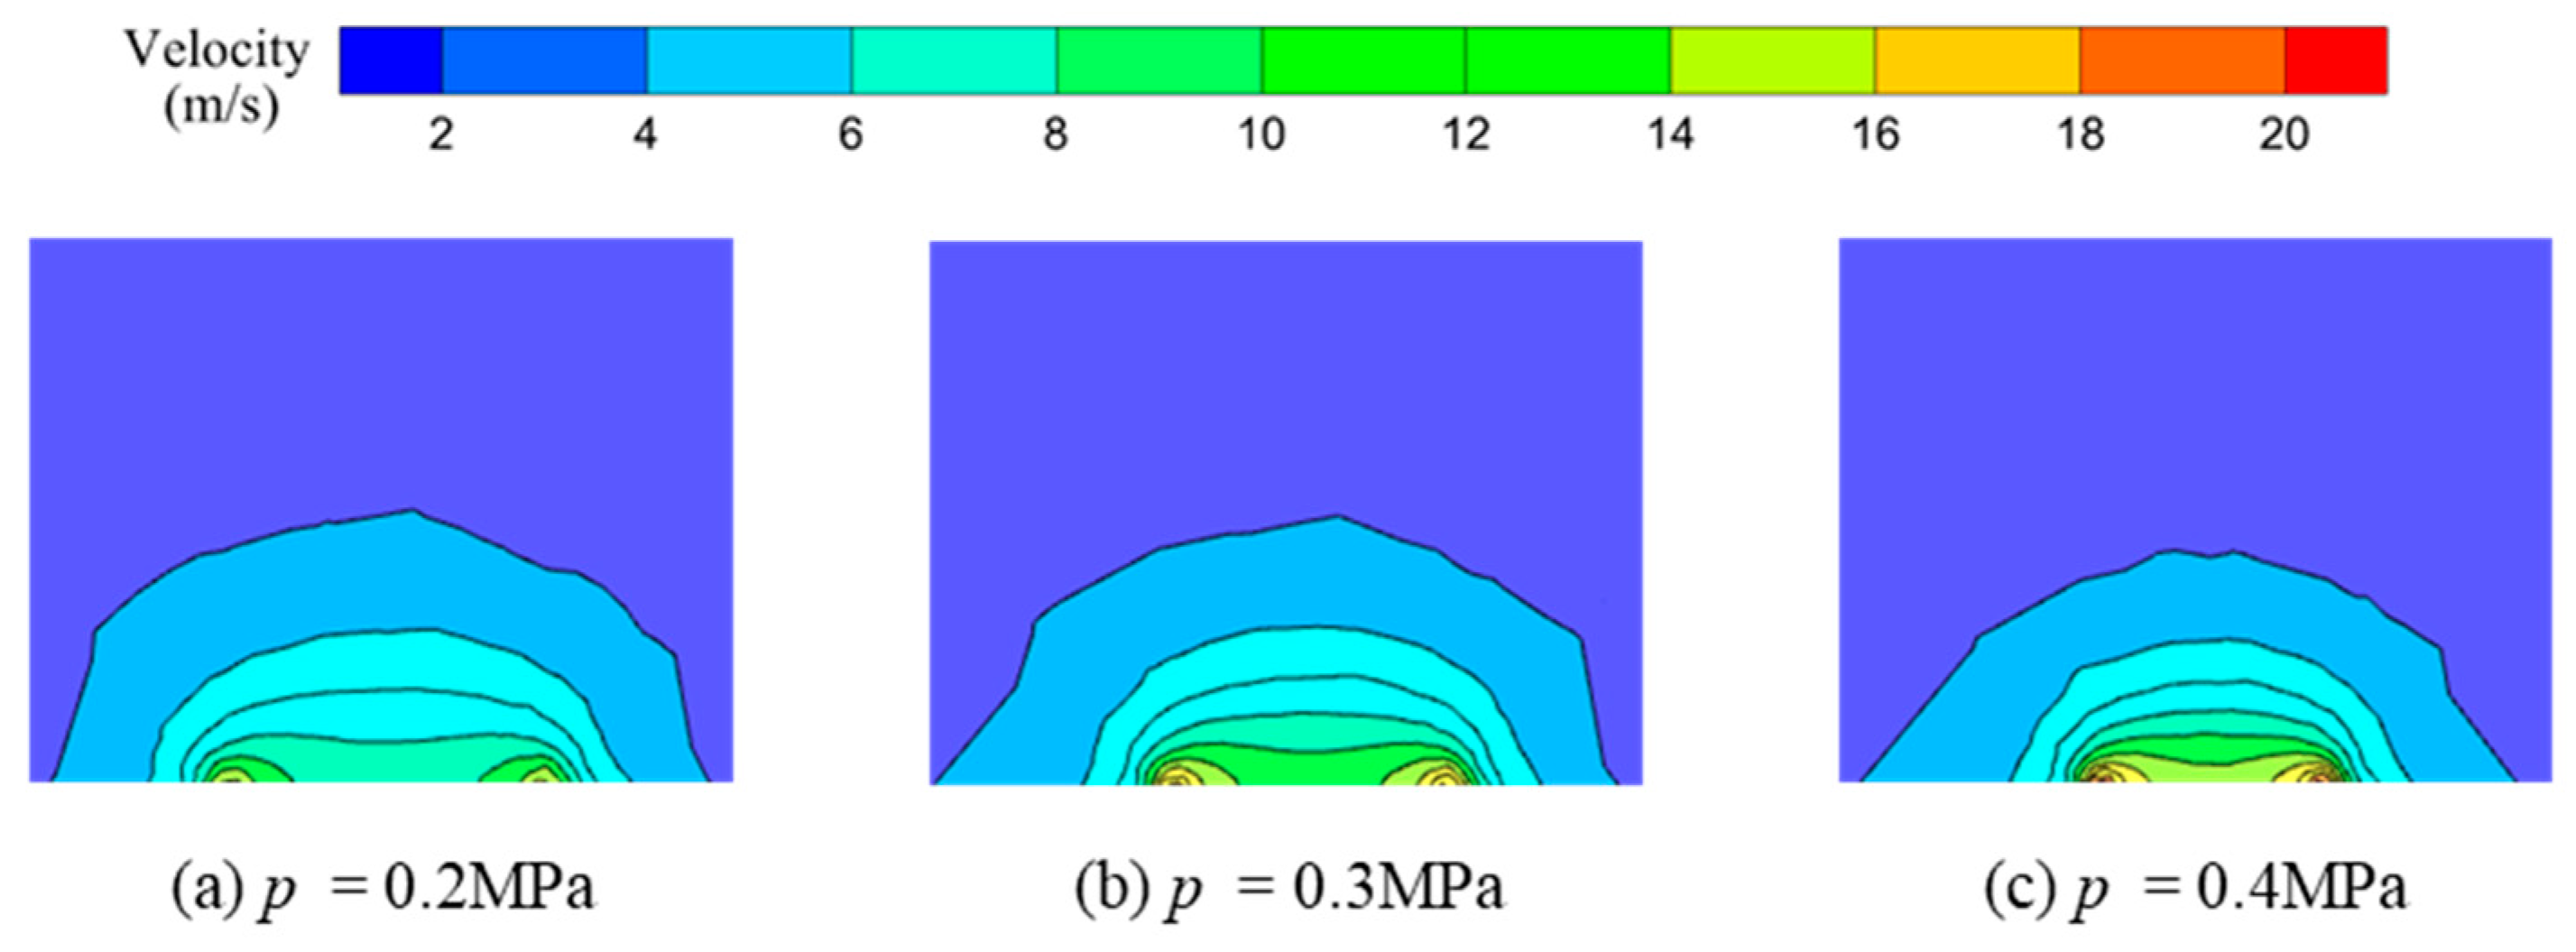
The influence of leakage pressure on hydrogen gas leakage is conducted by selecting cases 1, 2, and 3. As the leakage pressure increases, the velocity at the leak point gradually increases as well (Figure 11). At leakage pressures of 0.2 MPa, 0.3 MPa, and 0.4 MPa, the maximum velocities at the leakage hole are 15.37 m/s, 18.85 m/s, and 21.78 m/s, respectively. With increasing diffusion distance, the diffusion velocity of the gas mixture layer gradually decreases. Under constant parameters, a higher leakage pressure results in a wider diffusion range for hydrogen gas (Figure 12). This is because gas migration in porous media is primarily driven by convection and diffusion, with convection being the material transfer driven by pressure differentials. As the leakage pressure increases, the flow velocity at the leak point continues to increase, and the effect of the initial momentum becomes stronger, leading to more significant migration driven by convection.
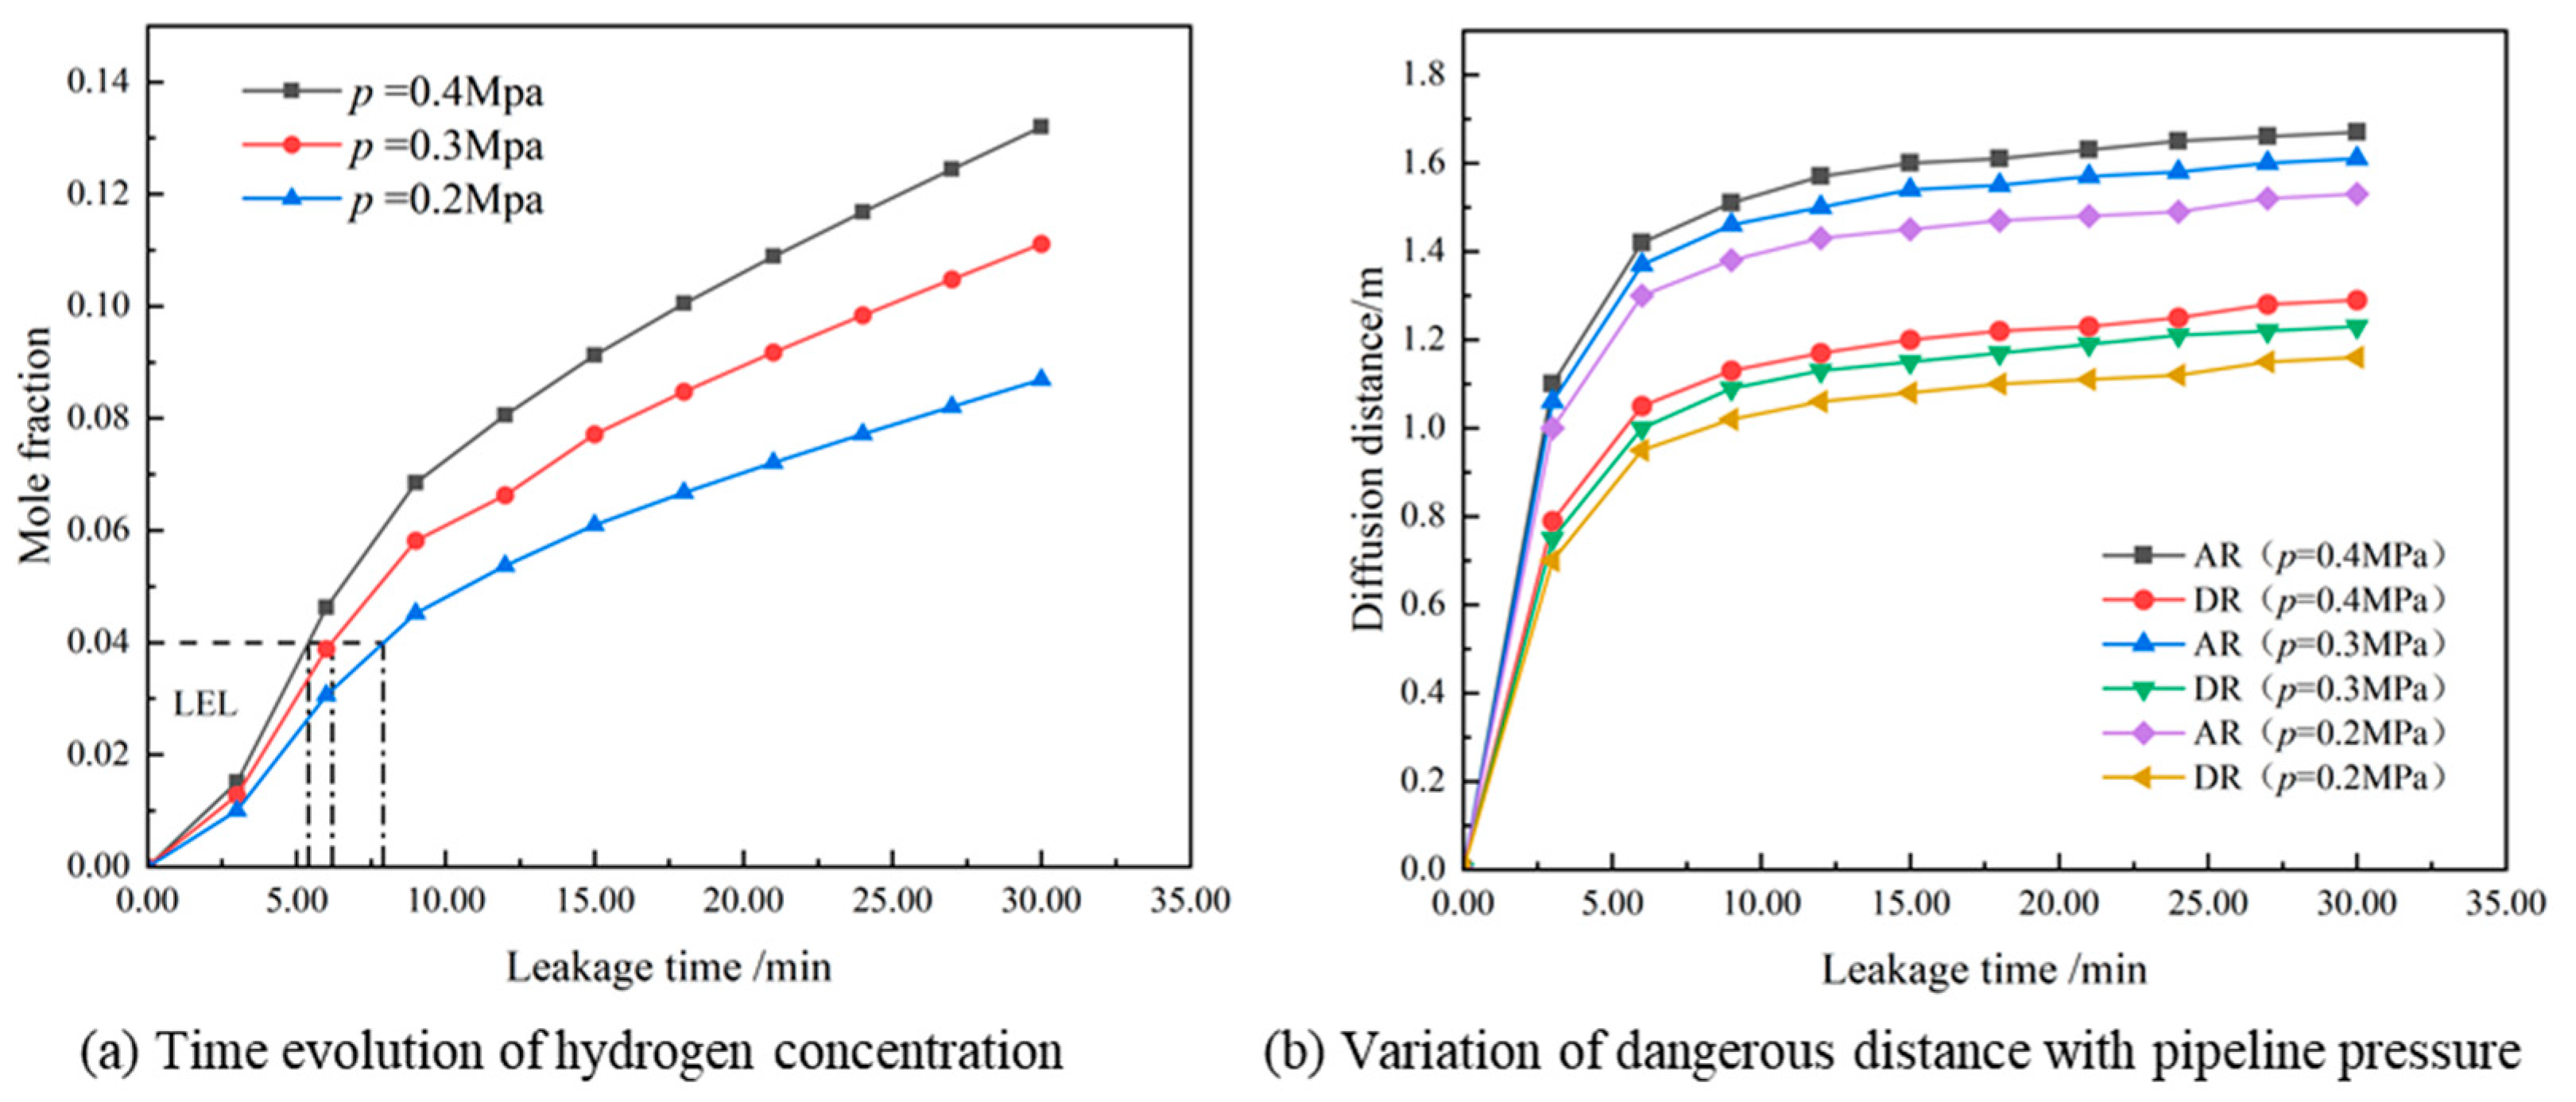
The variation in the hydrogen gas concentration over time at monitoring point P3 under different leakage pressures is shown in Figure 13a. At pressures of 0.4 MPa, 0.3 MPa, and 0.2 MPa, the FDTs for hydrogen gas are 5.4 min, 6.2 min, and 7.9 min, respectively. It can be observed that when the pressure decreases from 0.4 MPa to 0.3 MPa, the FDT is only delayed by 0.8 min, whereas when the pressure decreases from 0.3 MPa to 0.2 MPa, the FDT is delayed by 1.67 min. Monitoring the various danger distances under different leakage pressures (Figure 13b), it can be noted that in the initial stage of leakage, the danger distances (including AR and DR) increase rapidly, and as the leakage progresses, these distances stabilize. This is because, with the increase in diffusion distance, the pressure gradient and concentration gradient of the gas in the soil continuously decrease, while the gas encounters increasing soil resistance, leading to a greater loss of kinetic energy. With increasing pressure, both the AR and DR of hydrogen gas continuously increase.

3.2.2. Influence of Hydrogen Blending Ratio

Introducing hydrogen into natural gas at a certain volume ratio and transporting it through existing natural gas pipelines and distribution networks are currently considered the most viable potential method for safely, efficiently, and on a large-scale transporting hydrogen to end-users over long distances. There is an impact of hydrogen blending ratios on hydrogen leakage for cases 1, 4, 5, 6, and 7. For mixtures comprising two or more combustible gases, the explosion limits of the mixed combustible gas with air can be calculated using the Le Chatelier formula [36], and the results are given in Table 4.
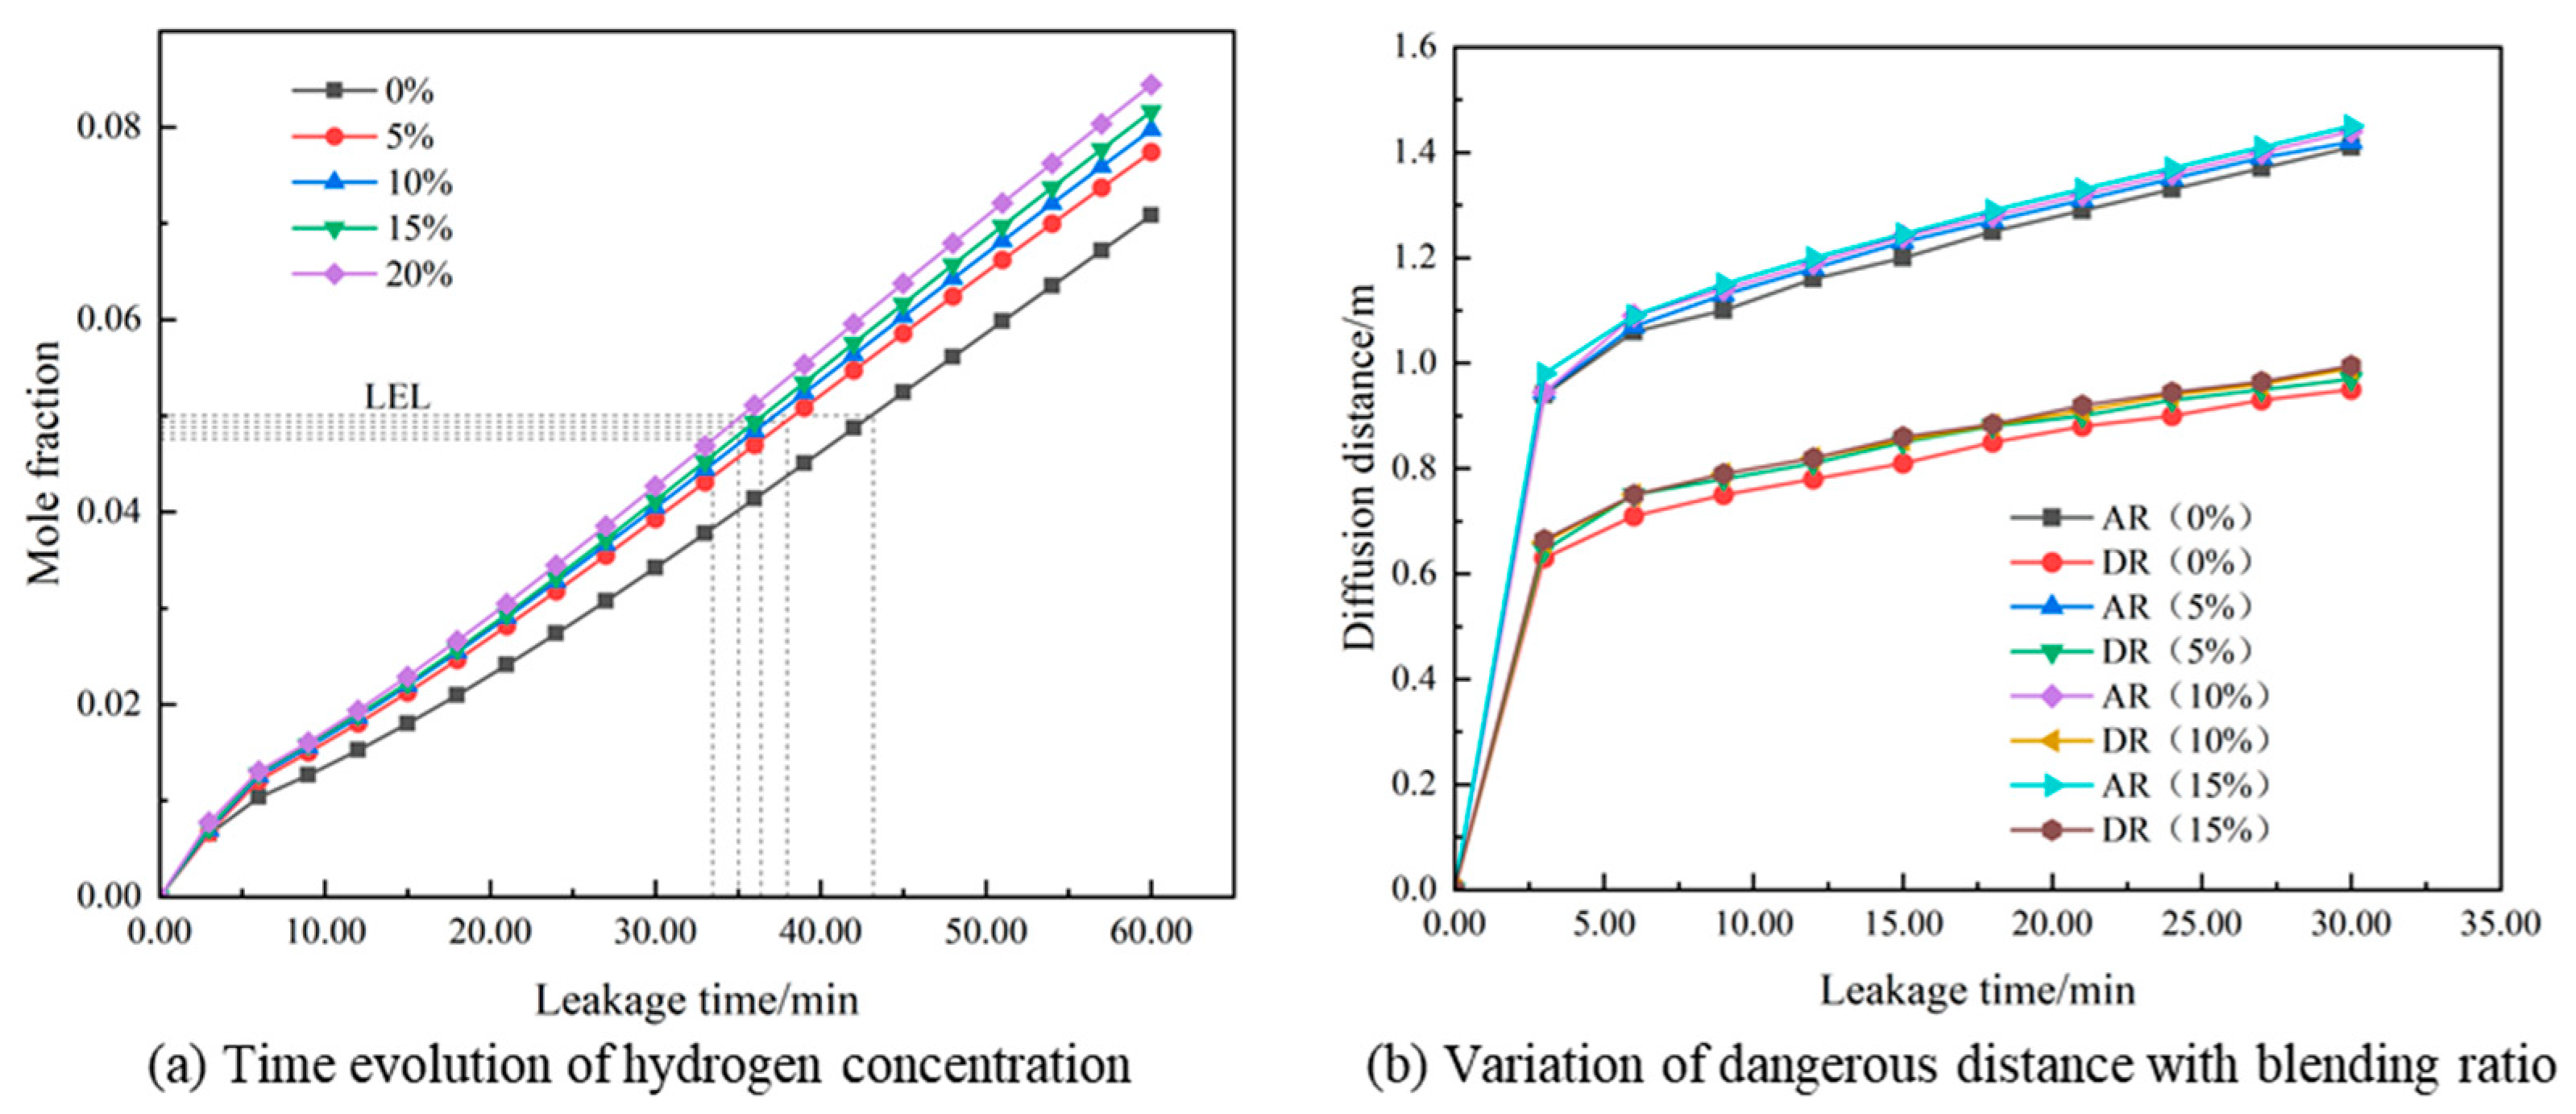
The FDTs for hydrogen concentrations of 0%, 5%, 10%, 15%, and 20% are 43.18 min, 37.95 min, 36.4 min, 35.03 min, and 33.47 min, respectively. It can be observed that the inclusion of hydrogen significantly advances the FDT of the gas (Figure 14a). As the hydrogen concentration increases from 0% to 5%, the FDT is shortened by 5.23 min. With the increase in the blending ratio, the FDT gradually decreases linearly. Specifically, the FDT is reduced by 1.55 min, 1.37 min, and 1.57 min, respectively, as the blending ratio increases from 5% to 10%, 15%, and 20%. Additionally, the inclusion of hydrogen slightly increases the hazard radius of natural gas (Figure 14b).

3.2.3. Influence of Ground Hardening Condition

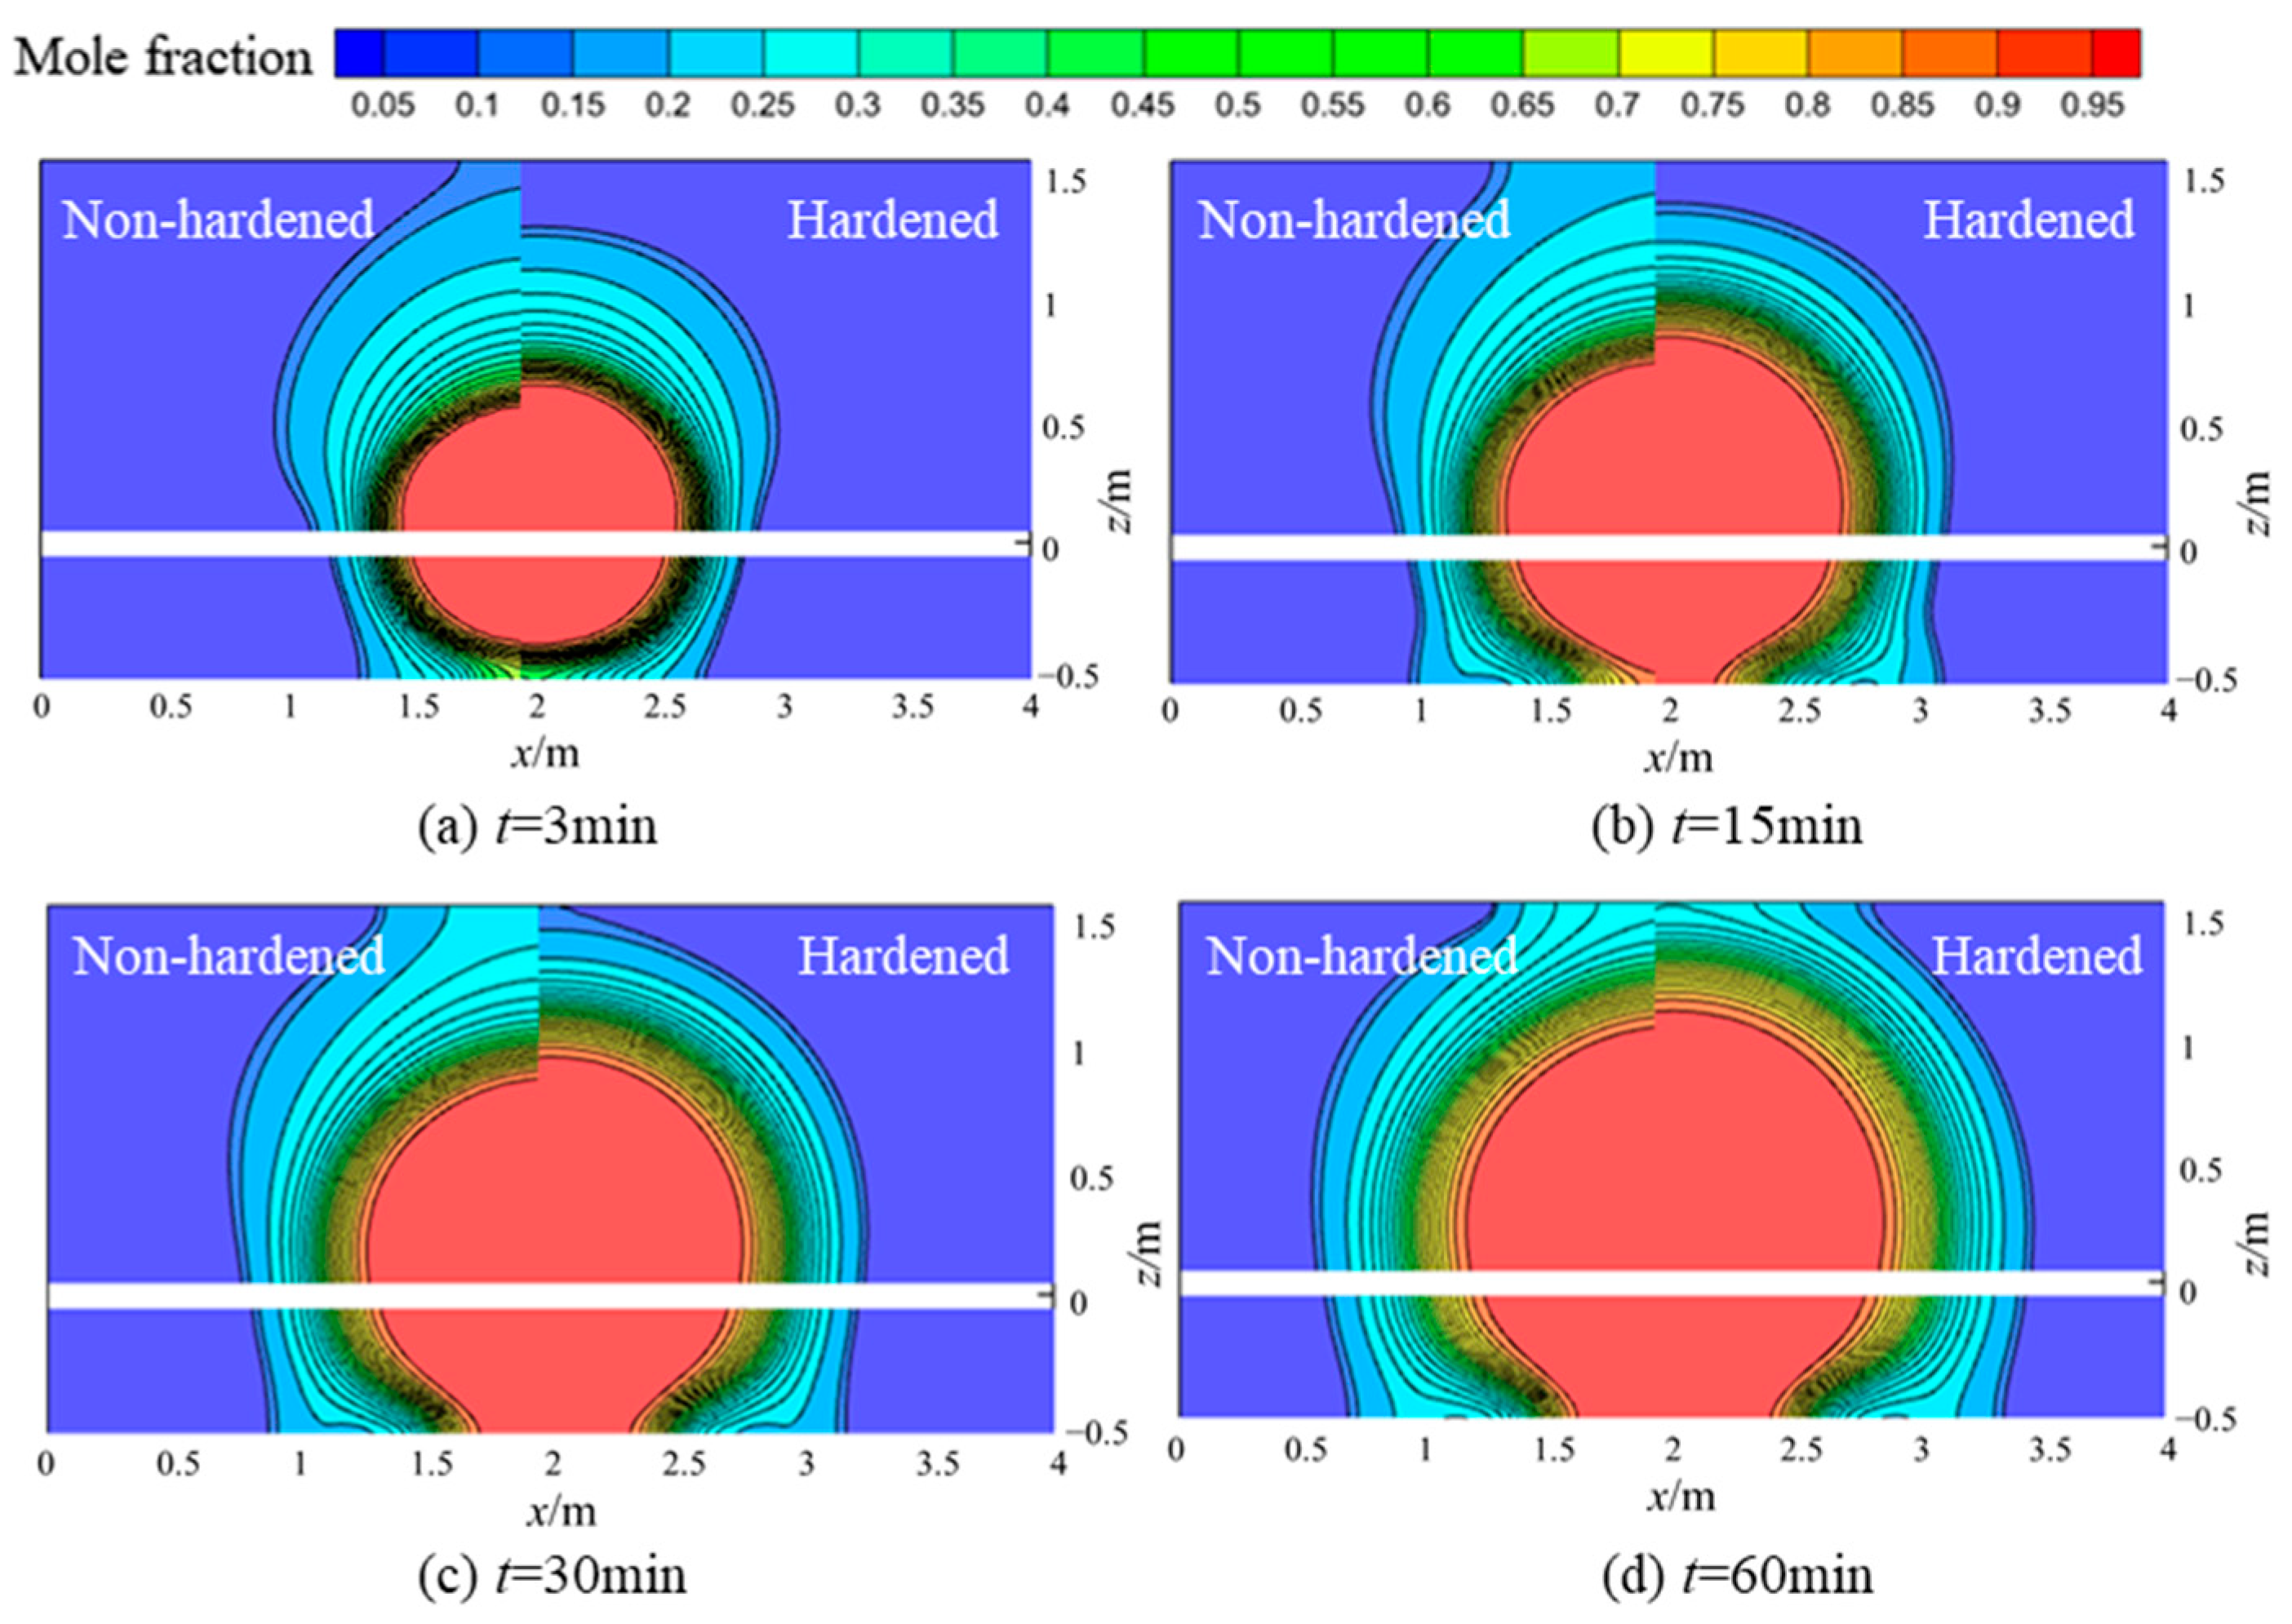
Town gas pipelines may be laid beneath cement road surfaces, and the hardening of the ground can affect the gas leakage process. Therefore, research is conducted on the hydrogen pipeline leakage issues under different ground conditions, focusing on cases 1 and 12. For hardened ground, the boundary condition at the ground level needs to be changed from pressure outlet to wall boundary. From the gas streamline diagram in Figure 15, it can be observed that hydrogen diffuses to the ground surface. Under non-hardened ground conditions, hydrogen will penetrate the ground and enter the atmosphere. However, hardened ground prevents hydrogen from diffusing into the atmosphere, causing more hydrogen to spread along the underground surface towards the surrounding soil and below. This increases the hydrogen content and distribution range in the soil. Due to the viscosity difference between hydrogen and air, hydrogen diffusion downwards under hardened ground conditions may induce surrounding air movement downwards due to shear effects.
Figure 16 compares the concentration distribution of hydrogen gas between unhardened ground and hardened ground. It can be observed that hardened ground prevents the diffusion of hydrogen gas into the atmosphere, leading to an increased accumulation of hydrogen gas in the soil beneath the ground surface. As a result, the high-concentration zones in the soil under hardened ground cover a larger area.

3.2.4. Influence of Leakage Hole Diameter

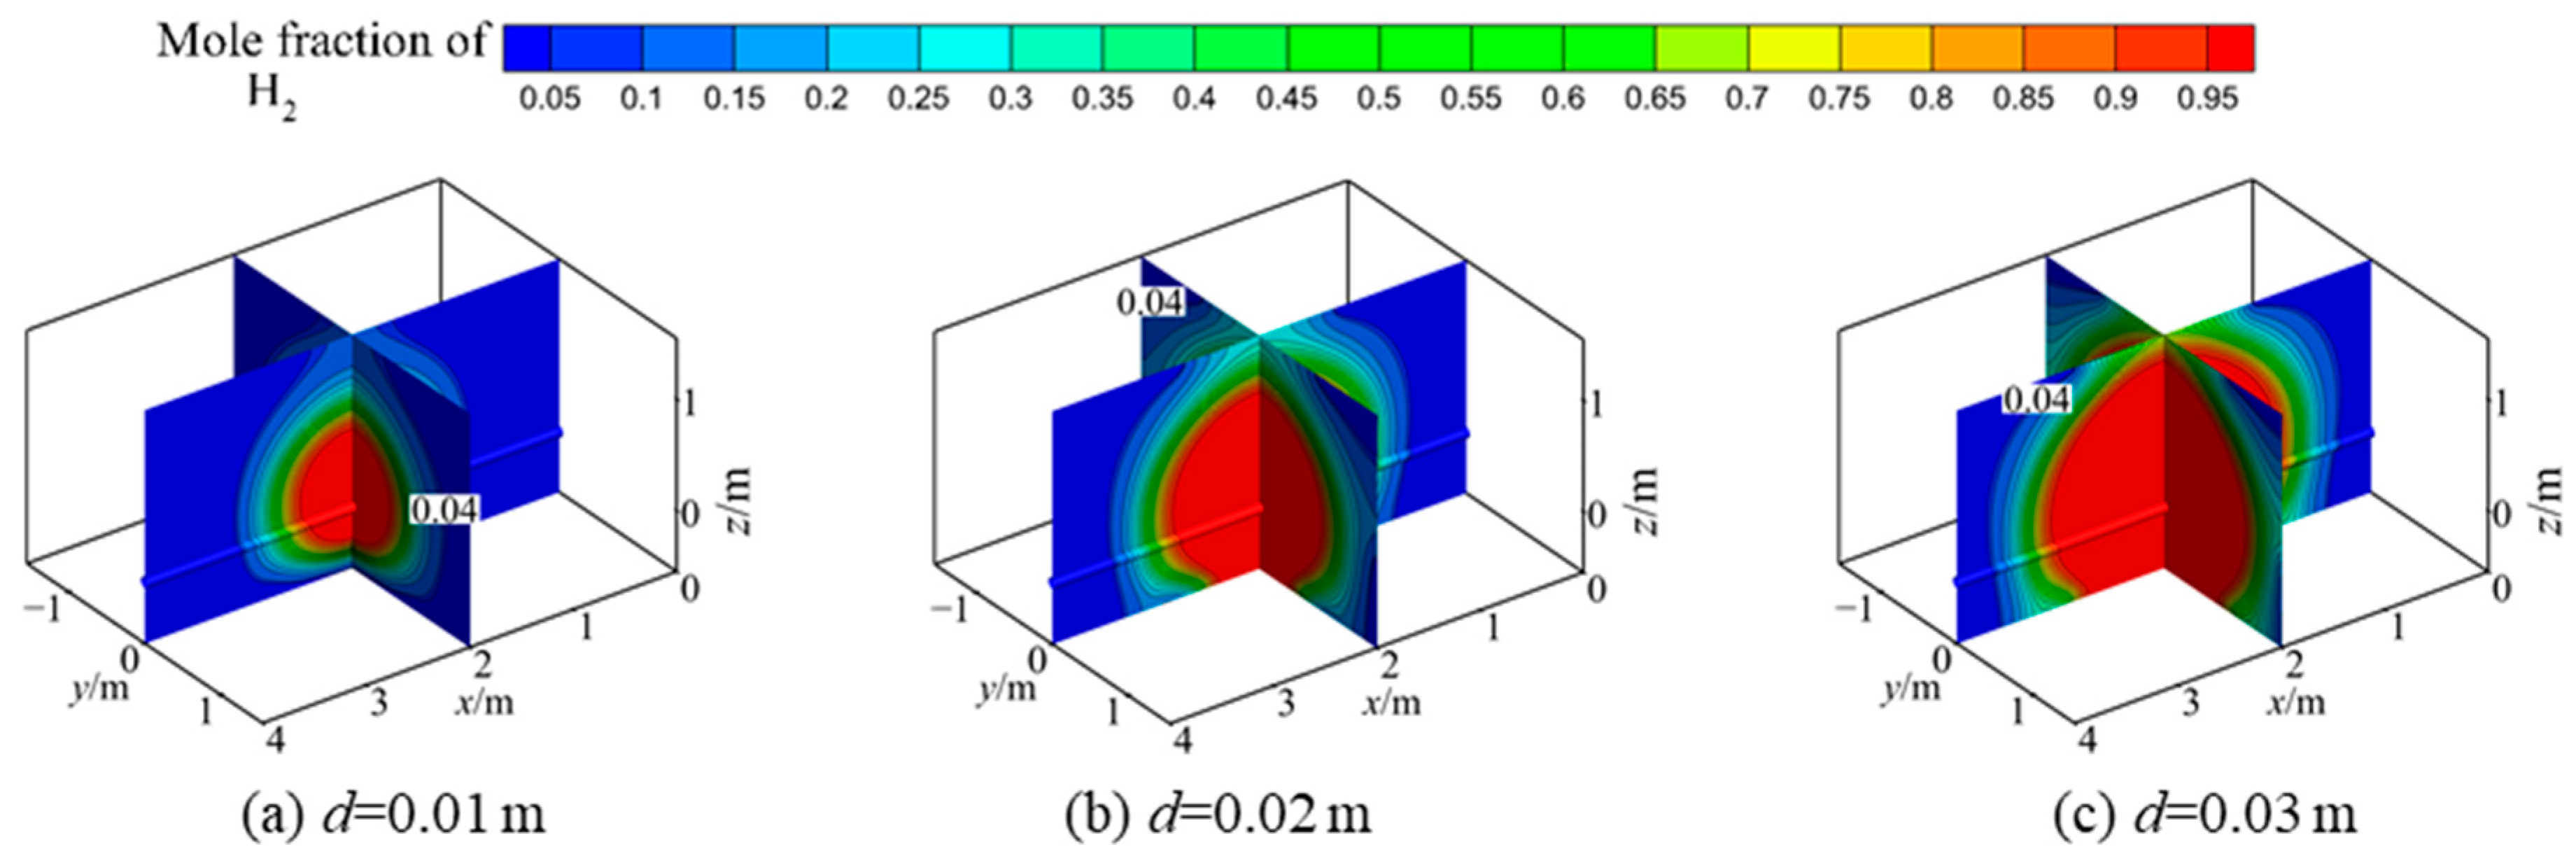
According to the European Gas Pipe Line Incident Data Group (EGIG) [37], situations where the leak hole diameter d ≤ 0.02 m are defined as small-hole leaks. In this study, cases 1, 8, and 9 are used to investigate the effect of different leakage hole diameters on hydrogen diffusion. Figure 17 illustrates the impact of pipeline leak hole diameter on the concentration distribution of hydrogen in the soil. As the leak hole diameter increases, the diffusion range of hydrogen significantly expands. This is mainly because as the leak hole diameter increases, the leakage rate of hydrogen also increases, leading to a greater initial momentum of convection.
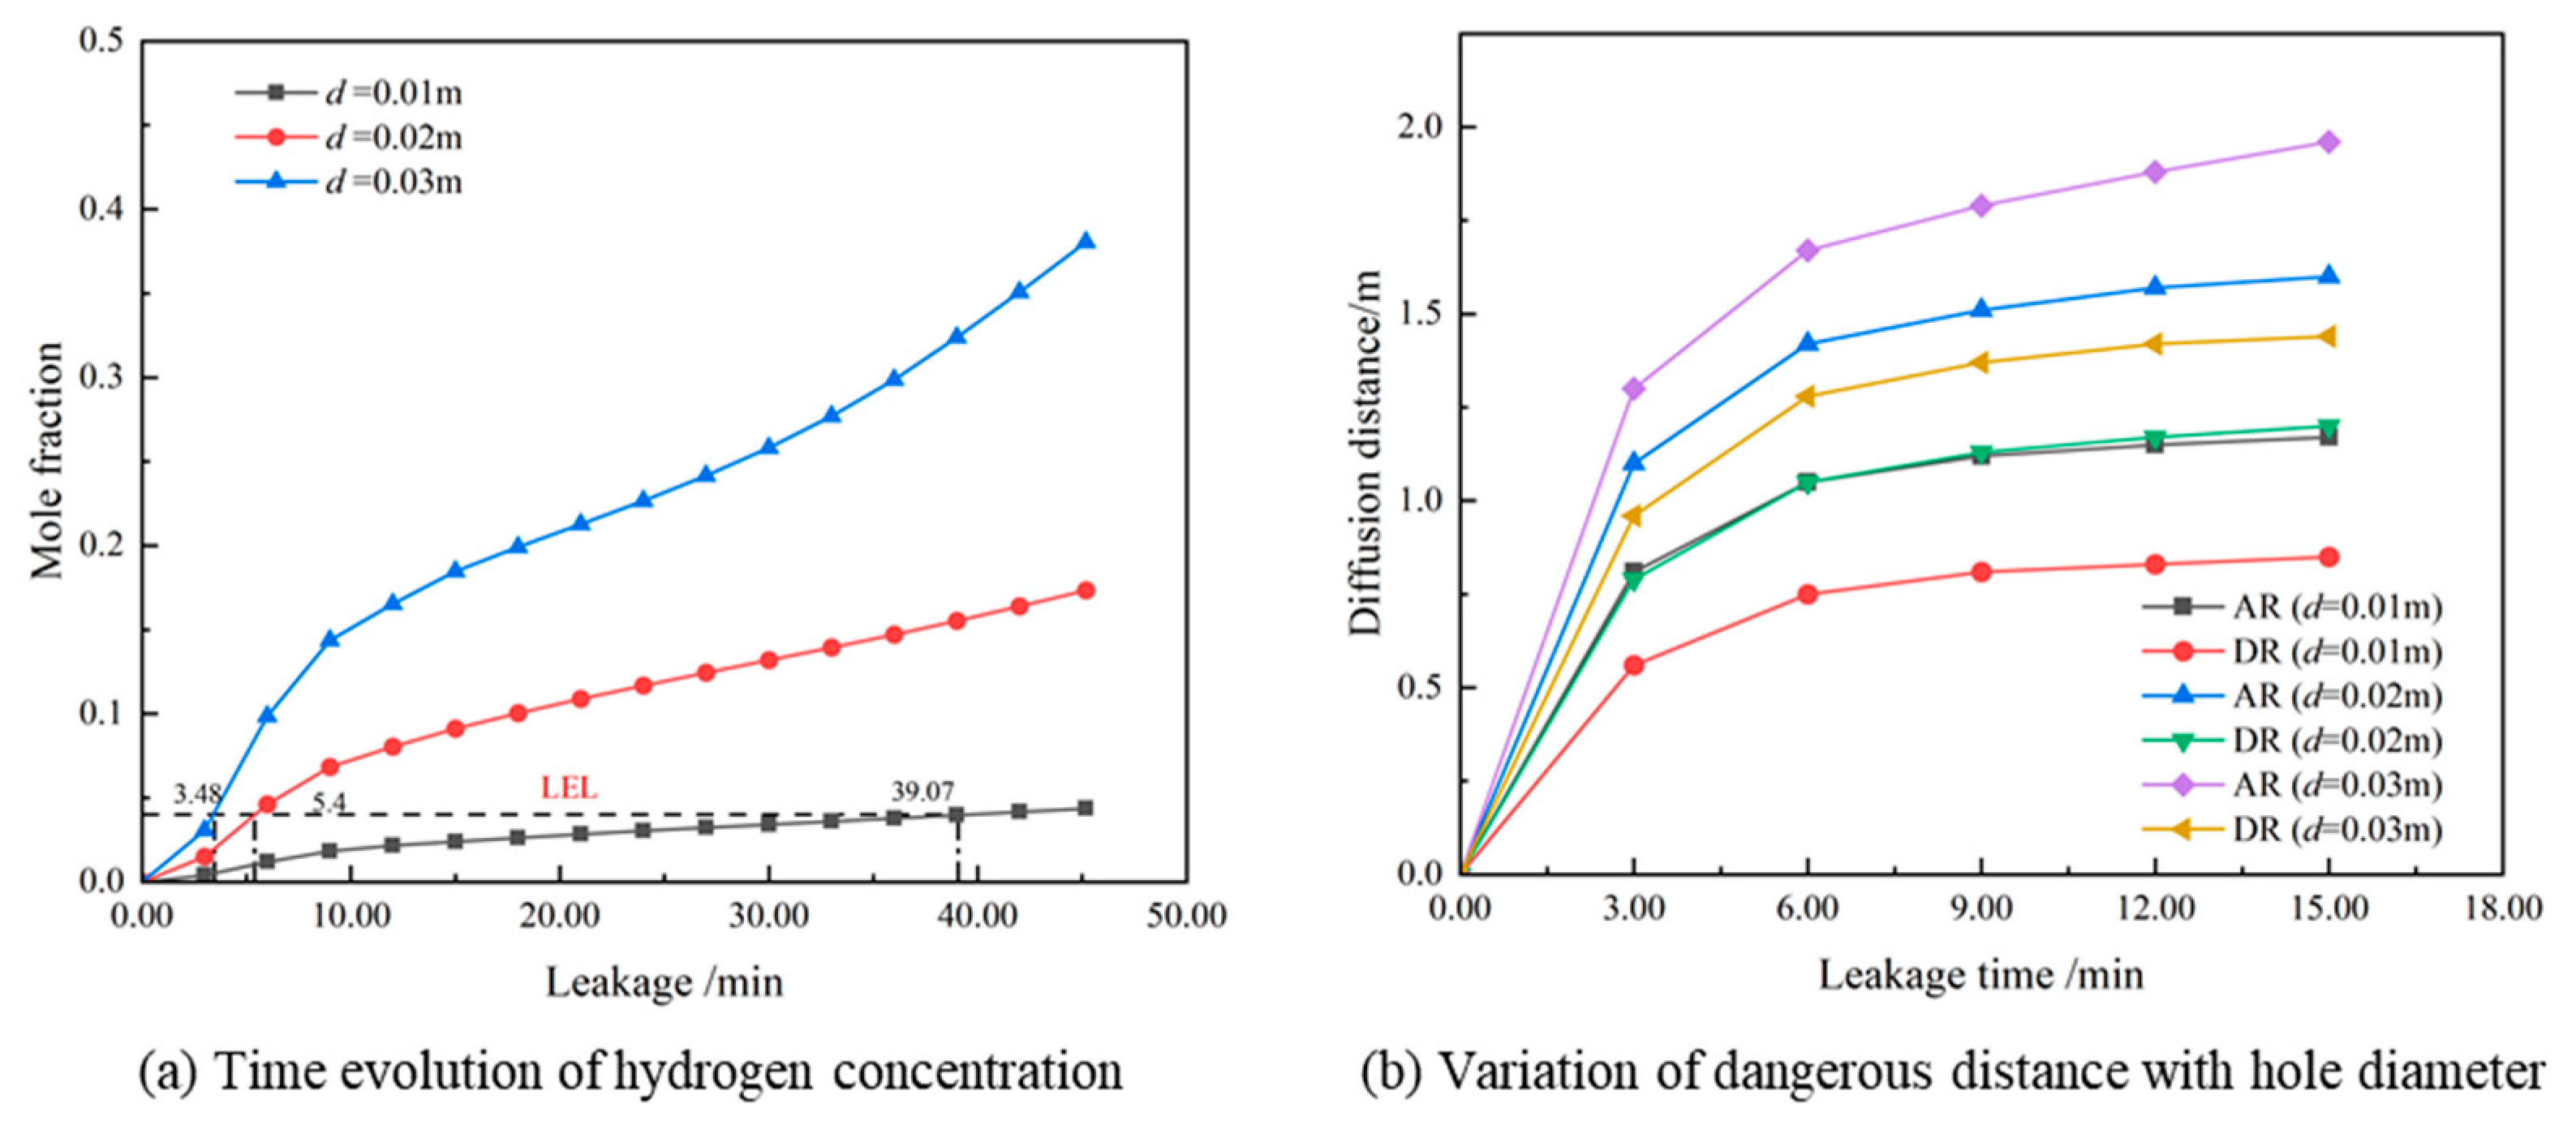
As the leak hole diameter increases, the FDT of hydrogen leakage gradually decreases, with a decelerating rate. When the leak hole diameter is 0.01 m, the FDT is 2344 s. Increasing the leak hole diameter from 0.01 m to 0.02 m advances the FDT by 33.67 min, whereas increasing it from 0.02 m to 0.03 m only advances it by 115 s (Figure 18a). The trends of each hazardous radius with the leak hole diameter are similar (Figure 18b). As the leak hole diameter increases from 0.01 m to 0.03 m, the AR increases by 0.43 m and 0.36 m successively, while the DR increases by 0.35 m and 0.24 m, respectively.

3.2.5. Influence of Pipeline Burial Depth

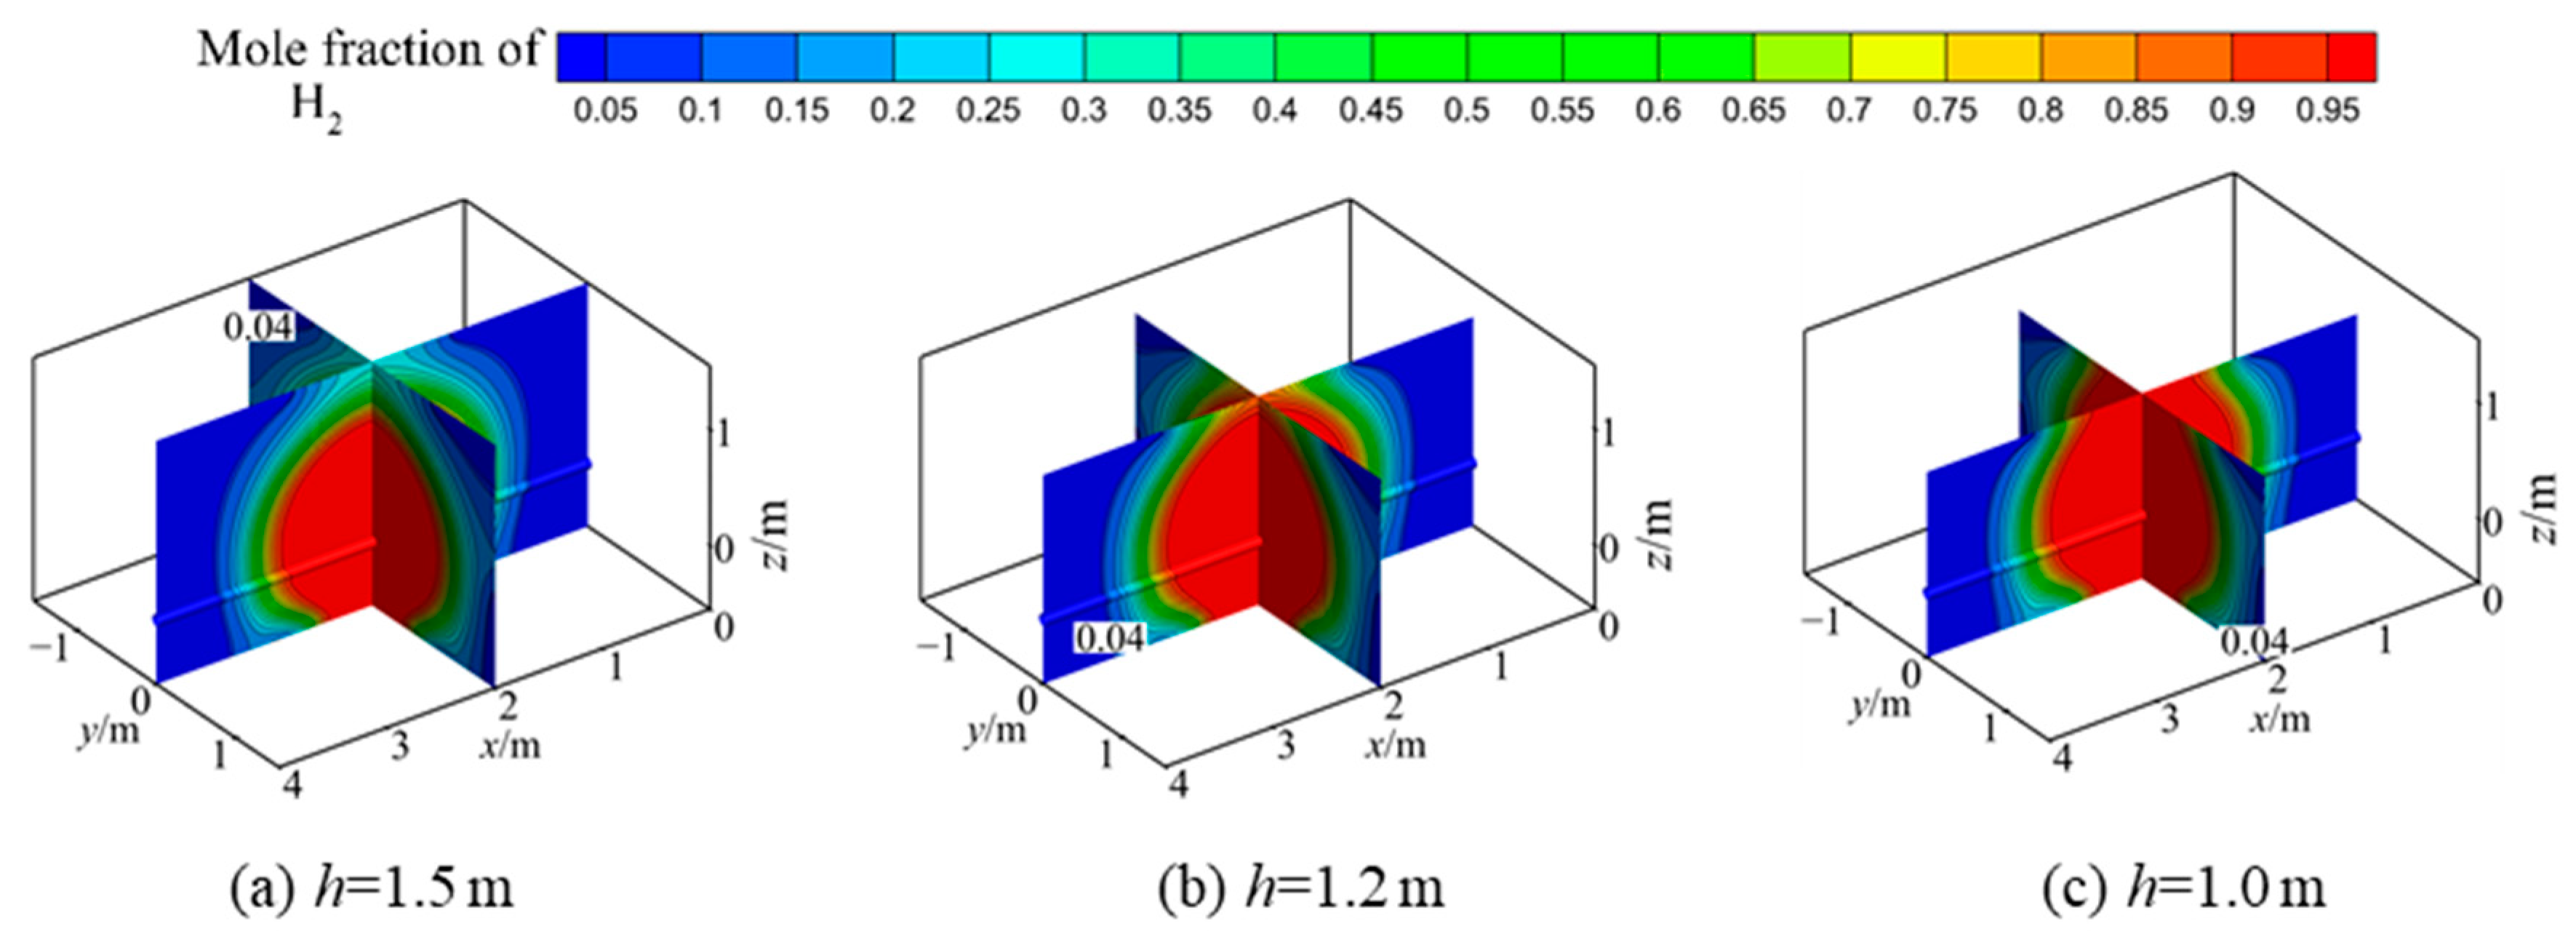
The depth of pipeline burial is influenced by factors, such as the ground load, maximum depth of permafrost, and stability requirements of the pipeline. Generally, the burial depth of pipelines ranges from 0.8 m to 1.2 m. Considering special sections with significant ground loads, this section selects cases 1, 10, and 11 to study the convective diffusion characteristics of hydrogen at soil depths of 1.0 m, 1.2 m, and 1.5 m. From the hydrogen concentration distribution at t = 60 min for different pipeline burial depths (Figure 19), it is evident that the burial depth of the pipeline significantly affects the distribution of hydrogen concentration. As the burial depth decreases, the diffusion range of hydrogen significantly increases.
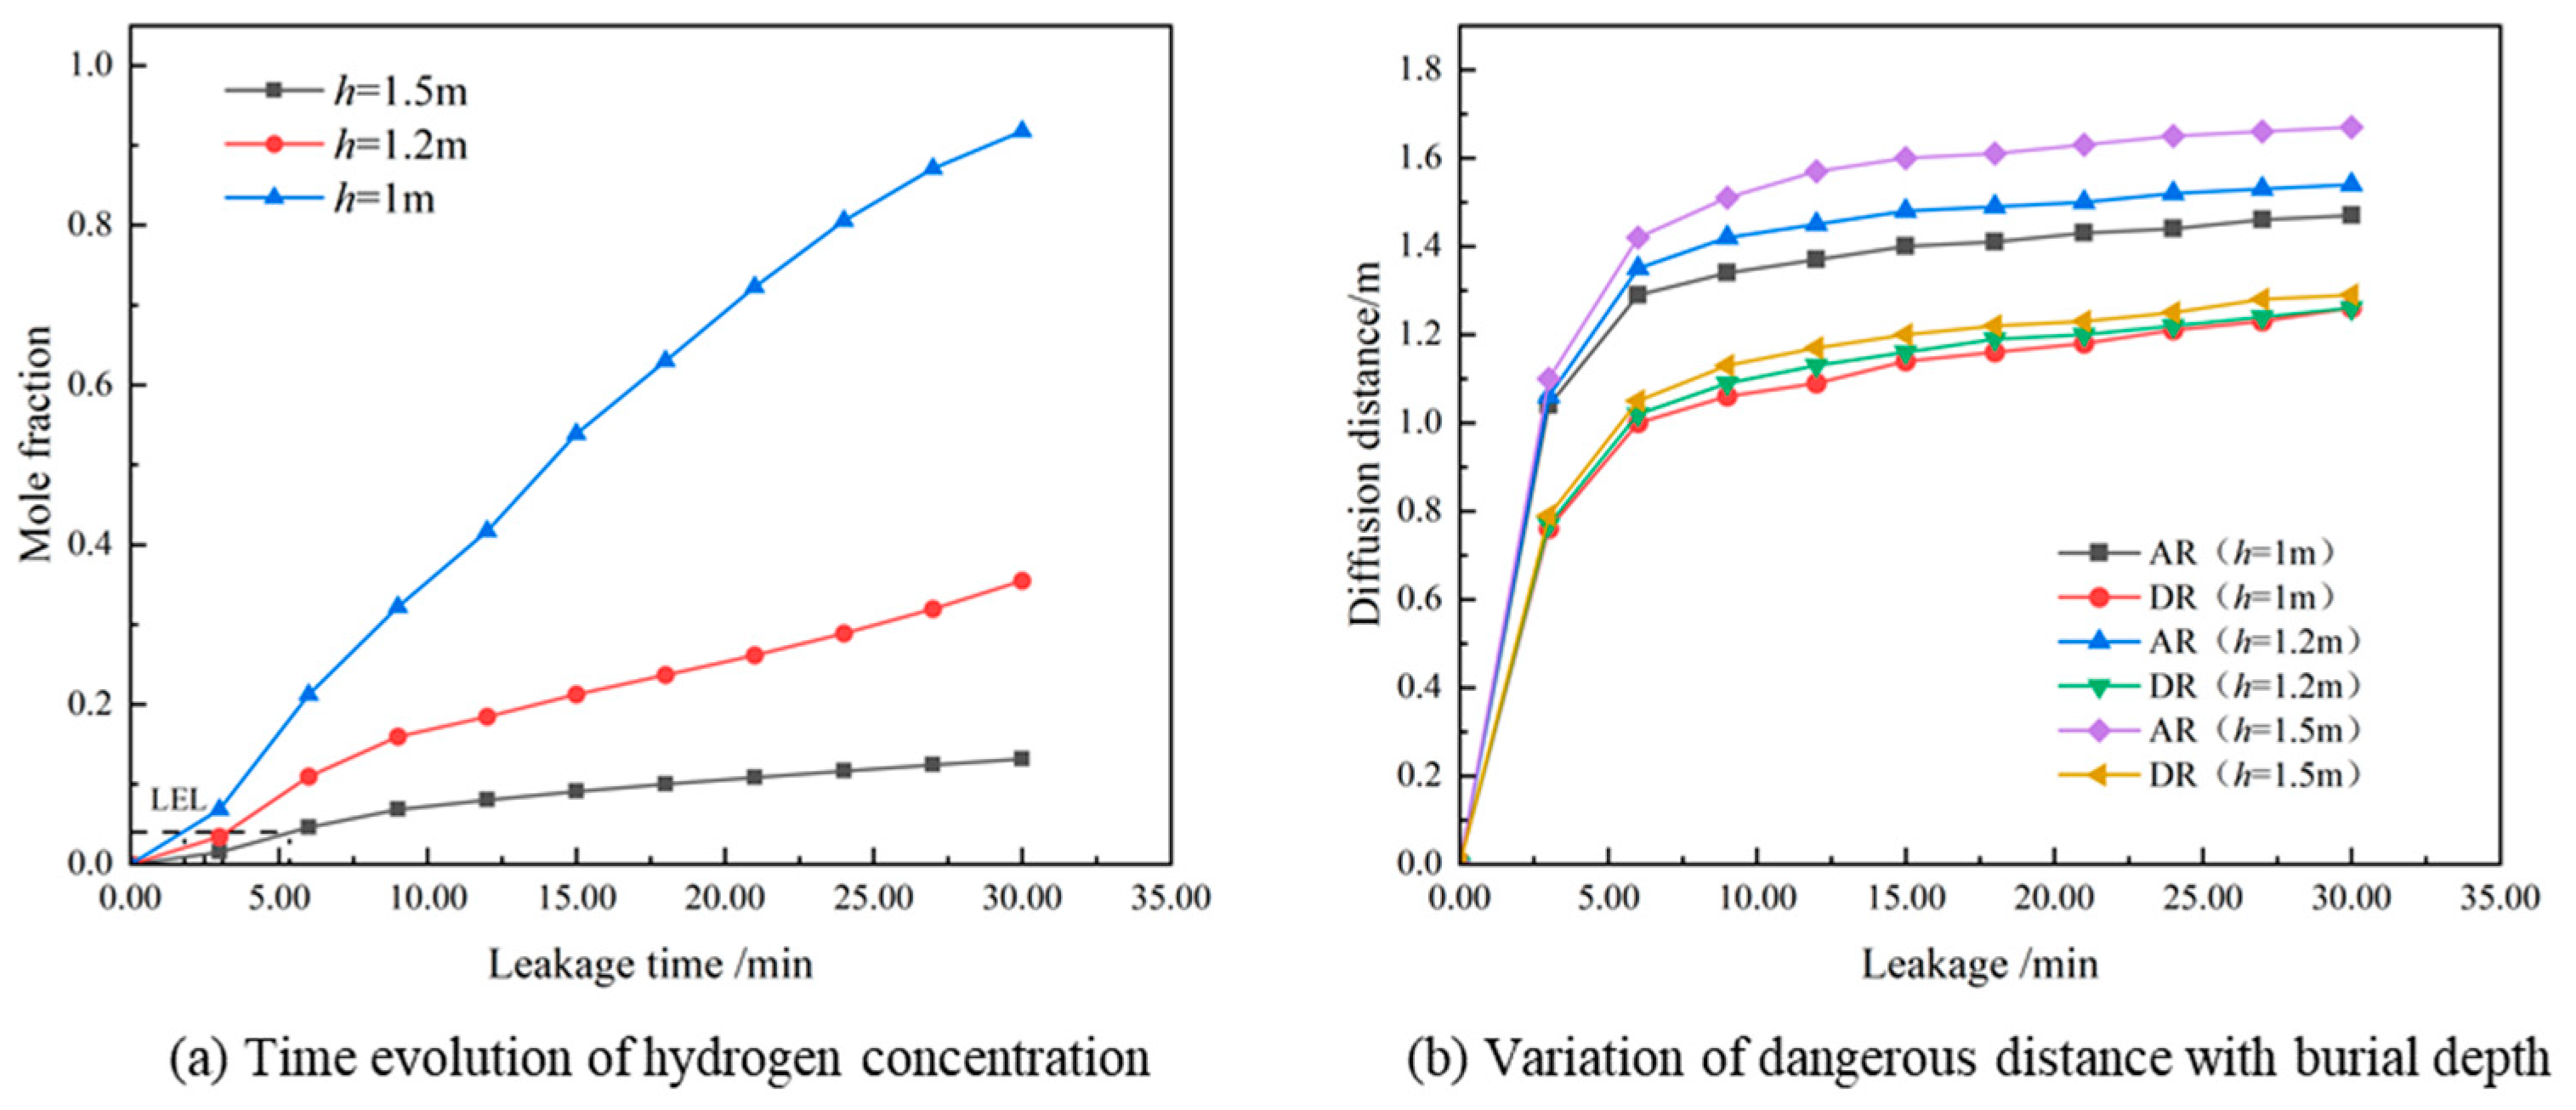
As the leakage burial depth decreases, the first danger time of hydrogen leakage gradually decreases (Figure 20a). When the pipeline burial depth is 1.5 m, 1.2 m, and 1 m, the first danger time is 5.4 min, 3.1 min, and 1.8 min, respectively. With the passage of time after the leakage, the impact of burial depth on gas diffusion becomes more significant. After half an hour of leakage, the hydrogen concentration at the soil surface monitoring point with a burial depth of 1 m reached 0.92, while the hydrogen concentration at the soil surface monitoring point with a burial depth of 1.5 m was only 0.13. This is because when the pipeline is buried underground, a large amount of gas initially diffuses into the soil. Influenced by the soil pore resistance and capillary pressure, the greater the burial depth, the greater the loss of gas turbulent energy. As the burial depth decreases, the danger distances continue to increase (Figure 20b). It indicates that with the increase in pipeline burial depth, the longitudinal diffusion distance of hydrogen in the soil increases gradually by the time it reaches the ground.

3.3. Leakage Diagnosis of Hydrogen-Blended Natural Gas

Hydrogen embrittlement is a significant issue for pipeline integrity, making the early diagnosis of hydrogen leakage crucial. By installing gas leak sensors in the soil, it is possible to effectively monitor the changes in gas concentration in the soil when a pipeline leak occurs. The cases with hydrogen blending ratios of 0% and 20% (i.e., cases 1 and 7) were selected to obtain the time it takes for the gas above the leakage hole to move to AR and DR, as shown in Figure 21. It can be observed that when using the AR as a measurement indicator, the natural gas with 20% hydrogen blending reaches the first-level alarm value at the same location in a shorter time. This is mainly because the first-level alarm value for 20% hydrogen-blended natural gas is lower than that for pure natural gas (see Table 4), and the diffusion speed of hydrogen-blended natural gas is higher than that of pure natural gas. Similarly, when using DR as a measurement indicator, hydrogen-blended natural gas reaches the same distance in less time. However, compared to using AR, when evaluating gas leakage with the DR, it takes more time to detect the leaking gas for both hydrogen-blended and pure natural gas. Therefore, in practical gas leakage monitoring, it is recommended to use AR as the evaluation indicator. Additionally, by fitting the leakage time and the two monitoring radii, the relationship between gas leakage time t and leakage distance rAR or rDR is obtained (see Figure 21), which can be used to predict the time of gas leakage when the gas concentration at the monitoring point reaches the first-level alarm value (using AR as an indicator) or the LEL (using DR as an indicator).

4. Conclusions

The present work establishes a numerical simulation model for hydrogen leakage from underground hydrogen pipelines. The transient diffusion characteristics of hydrogen leakage from underground hydrogen pipelines are investigated, and the evolution process of the diffusion pattern and hazard area range of hydrogen in the soil are thoroughly analyzed. The main conclusions are as follows:
  • Compared to natural gas, hydrogen exhibits faster pressure and velocity decay. At any given moment, the diffusion range of hydrogen is significantly larger than that of natural gas. Similar to natural gas, hydrogen diffusion in soil can be categorized into three stages: rapid growth, slow growth, and stabilization. The rapid growth stage of hydrogen lasts longer than that of natural gas. Hydrogen diffuses rapidly in soil, with the time for hydrogen reaching the explosive lower limit at the ground surface approximately eight-times faster than natural gas.
  • The addition of hydrogen significantly advances the first danger time of gas leakage. As the hydrogen blending ratio increases from 0% to 5%, 10%, 15%, and 20%, the first danger time advances by 5.23 min, 1.55 min, 1.37 min, and 1.57, respectively. Adding hydrogen not only reduces the explosive lower limit of natural gas but also decreases the density and viscosity of natural gas, facilitating gas diffusion. With an increase in the hydrogen blending ratio, the gas velocity gradually decreases.
  • The operating pressure, leakage hole diameter, and pipeline burial depth exert distinct levels of influence on the FDT and various danger distances, with the leakage hole diameter being the most influential factor on the FDT. When the leakage hole diameter decreases to a certain size, it effectively delays the arrival of hydrogen at its explosive lower limit at the ground surface.
  • To enhance the practical application of our findings, we performed a comprehensive risk assessment based on simulation data. Hydrogen-blended natural gas reaches the first-level alarm value more quickly than pure natural gas due to its lower alarm threshold and higher diffusion speed. Consequently, using the alarm radius as an evaluation indicator is recommended for practical gas leakage monitoring. Additionally, we established the relationship between gas leakage time and leakage distance, which can guide the installation of gas sensors and predict the time of gas leakage.
  • As temperature changes can significantly impact the diffusion behavior and hazard area of leaking gases, future work will incorporate the effect of ground temperature variations to provide a more comprehensive understanding of gas distribution in the soil. Additionally, future research will consider the mechanisms of how leakage holes are produced in the pipeline structure to enhance the understanding of pipeline integrity and safety.

Author Contributions

Methodology, B.X.; Software, B.X.; Validation, J.L.; Formal analysis, J.L.; Investigation, L.G.; Data curation, B.X.; Writing—original draft, B.X.; Writing—review & editing, J.L. and L.G.; Supervision, L.G. All authors have read and agreed to the published version of the manuscript.

Funding

The work described herein was supported by the National Key R&D Program of China (2021YFB4001603), the China Postdoctoral Science Foundation (No. 2023M733877), the Natural Science Foundation of Shandong Province (No. ZR2023QE034), the Qingdao Postdoctoral Application Research Project (No. QDBSH20230101006), and the Self-dependent Innovation Research Program of China University of Petroleum (East China) (No. 22CX06054A).

Data Availability Statement

The raw data supporting the conclusions of this article will be made available by the authors on request.

Conflicts of Interest

The authors declare no conflict of interest.

References

  1. Groll, M. Can Climate Change Be Avoided? Vision of a Hydrogen-Electricity Energy Economy. Energy 2023, 264, 126029. [Google Scholar] [CrossRef]
  2. Faye, O.; Szpunar, J.; Eduok, U. A Critical Review on the Current Technologies for the Generation, Storage, and Transportation of Hydrogen. Int. J. Hydrogen Energy 2022, 47, 13771–13802. [Google Scholar] [CrossRef]
  3. Li, H.; Cao, X.; Liu, Y.; Shao, Y.; Nan, Z.; Teng, L.; Peng, W.; Bian, J. Safety of Hydrogen Storage and Transportation: An Overview on Mechanisms, Techniques, and Challenges. Energy Rep. 2022, 8, 6258–6269. [Google Scholar] [CrossRef]
  4. Abbas, A.J.; Hassani, H.; Burby, M.; John, I.J. An Investigation into the Volumetric Flow Rate Requirement of Hydrogen Transportation in Existing Natural Gas Pipelines and Its Safety Implications. Gases 2021, 1, 156–179. [Google Scholar] [CrossRef]
  5. Penev, M.; Zuboy, J.; Hunter, C. Economic Analysis of a High-Pressure Urban Pipeline Concept (HyLine) for Delivering Hydrogen to Retail Fueling Stations. Transp. Res. Part D Transp. Environ. 2019, 77, 92–105. [Google Scholar] [CrossRef]
  6. Ohaeri, E.; Eduok, U.; Szpunar, J. Hydrogen Related Degradation in Pipeline Steel: A Review. Int. J. Hydrogen Energy 2018, 43, 14584–14617. [Google Scholar] [CrossRef]
  7. Zhang, H.; Zhao, J.; Li, J.; Yu, B.; Wang, J.; Lyu, R.; Xi, Q. Research Progress on Corrosion and Hydrogen Embrittlement in Hydrogen–Natural Gas Pipeline Transportation. Nat. Gas Ind. B 2023, 10, 570–582. [Google Scholar] [CrossRef]
  8. Zvirko, O.; Tsyrulnyk, O.; Lipiec, S.; Dzioba, I. Evaluation of Corrosion, Mechanical Properties and Hydrogen Embrittlement of Casing Pipe Steels with Different Microstructure. Materials 2021, 14, 7860. [Google Scholar] [CrossRef] [PubMed]
  9. Papavinasam, S.; Winston Revie, R.; I. Friesen, W.; Doiron, A.; Panneerselvan, T. Review of Models to Predict Internal Pitting Corrosion Of Oil and Gas Pipelines. Corros. Rev. 2006, 24, 173–230. [Google Scholar] [CrossRef]
  10. Chaves, I.A.; Melchers, R.E. Pitting corrosion in pipeline steel weld zones. Corros. Sci. 2011, 53, 4026–4032. [Google Scholar] [CrossRef]
  11. Tang, C.; Zhang, Y.; Huang, Z. Progress in Combustion Investigations of Hydrogen Enriched Hydrocarbons. Renew. Sustain. Energy Rev. 2014, 30, 195–216. [Google Scholar] [CrossRef]
  12. Xiao, H.; Duan, Q.; Sun, J. Premixed Flame Propagation in Hydrogen Explosions. Renew. Sustain. Energy Rev. 2018, 81, 1988–2001. [Google Scholar] [CrossRef]
  13. Cirrone, D.; Makarov, D.; Friedrich, A.; Grune, J.; Takeno, K.; Molkov, V. Blast Wave Generated by Delayed Ignition of Under-Expanded Hydrogen Free Jet at Ambient and Cryogenic Temperatures. Hydrogen 2022, 3, 433–449. [Google Scholar] [CrossRef]
  14. Bu, F.; Chen, S.; Liu, Y.; Guan, B.; Wang, X.; Shi, Z.; Hao, G. CFD Analysis and Calculation Models Establishment of Leakage of Natural Gas Pipeline Considering Real Buried Environment. Energy Rep. 2022, 8, 3789–3808. [Google Scholar] [CrossRef]
  15. Parvini, M.; Gharagouzlou, E. Gas Leakage Consequence Modeling for Buried Gas Pipelines. J. Loss Prev. Process Ind. 2015, 37, 110–118. [Google Scholar] [CrossRef]
  16. Okamoto, H.; Gomi, Y.; Akagi, H. Movement Characteristics of Hydrogen Gas within Compacted Soil and Its Detection. Doboku Gakkai Ronbunshuu F 2010, 66, 146–157. [Google Scholar] [CrossRef]
  17. Liu, C.; Liao, Y.; Liang, J.; Cui, Z.; Li, Y. Quantifying Methane Release and Dispersion Estimations for Buried Natural Gas Pipeline Leakages. Process Saf. Environ. Prot. 2021, 146, 552–563. [Google Scholar] [CrossRef]
  18. Bezaatpour, J.; Fatehifar, E.; Rasoulzadeh, A. CFD Investigation of Natural Gas Leakage and Propagation from Buried Pipeline for Anisotropic and Partially Saturated Multilayer Soil. J. Clean. Prod. 2020, 277, 123940. [Google Scholar] [CrossRef]
  19. Zhu, J.; Pan, J.; Zhang, Y.; Li, Y.; Li, H.; Feng, H.; Chen, D.; Kou, Y.; Yang, R. Leakage and Diffusion Behavior of a Buried Pipeline of Hydrogen-Blended Natural Gas. Int. J. Hydrogen Energy 2023, 48, 11592–11610. [Google Scholar] [CrossRef]
  20. Wang, L.; Chen, J.; Ma, T.; Ma, R.; Bao, Y.; Fan, Z. Numerical Study of Leakage Characteristics of Hydrogen-Blended Natural Gas in Buried Pipelines. Int. J. Hydrogen Energy 2024, 49, 1166–1179. [Google Scholar] [CrossRef]
  21. Zhang, Y.; Yang, Y.; Wu, F.; Li, Q.; Wang, J.; Liu, H.; Che, D.; Huang, Z. Numerical Investigation on Pinhole Leakage and Diffusion Characteristics of Medium-Pressure Buried Hydrogen Pipeline. Int. J. Hydrogen Energy 2024, 51, 807–817. [Google Scholar] [CrossRef]
  22. Li, Y.; Wang, Z.; Shang, Z. Analysis and Prediction of Hydrogen-Blended Natural Gas Diffusion from Various Pipeline Leakage Sources Based on CFD and ANN Approach. Int. J. Hydrogen Energy 2024, 53, 535–549. [Google Scholar] [CrossRef]
  23. Zhu, J.; Wang, S.; Pan, J.; Lv, H.; Zhang, Y.; Han, H.; Liu, C.; Duo, Z.; Li, Y. Experimental Study on Leakage Temperature Field of Hydrogen Blending into Natural Gas Buried Pipeline. Appl. Energy 2024, 359, 122656. [Google Scholar] [CrossRef]
  24. Li, Y.; Qian, X.; Zhang, S.; Sheng, J.; Hou, L.; Yuan, M. Assessment of Gas Explosion Risk in Underground Spaces Adjacent to a Gas Pipeline. Tunn. Undergr. Space Technol. 2023, 131, 104785. [Google Scholar] [CrossRef]
  25. GB50494-2009; Technical Code for City Gas. China Planning Press: Beijing, China, 2008.
  26. ISO 4437-5:2014; Plastics Piping Systems for the Supply of Gaseous Fuels—Polyethylene (PE)—Part 5: Fitness for Purpose of the System. ISO: Geneva, Switzerland, 2014. Available online: https://www.iso.org/standard/59131.html (accessed on 31 January 2014).
  27. EN 12007-2:2012; Gas Supply Systems—Pipelines for Maximum Operating Pressure up to and Including 16 bar—Part 2: Specific Functional Requirements for Polyethylene (PE) Pipelines. CEN: Brussels, Belgium, 2012. Available online: https://www.evs.ee/en/evs-en-12007-2-2012 (accessed on 1 December 2012).
  28. Luo, J.H.; Zheng, M.; Zhao, X.W.; Huo, C.Y.; Yang, L. Simplified Expression for Estimating Release Rate of Hazardous Gas from a Hole on High-Pressure Pipelines. J. Loss Prev. Process Ind. 2006, 19, 362–366. [Google Scholar] [CrossRef]
  29. Montiel, H.; Vilchez, J.; Casal, J.; Arnaldos, J. Mathematical Modelling of Accidental Gas Releases. J. Hazard. Mater. 1998, 59, 211–233. [Google Scholar] [CrossRef]
  30. Strelets, M. Detached Eddy Simulation of Massively Separated Flows. In Proceedings of the 39th Aerospace Sciences Meeting and Exhibit, Reston, VA, USA, 8 January 2001. [Google Scholar]
  31. Liu, Y.; Zheng, J. Numerical Simulation of the Diffusion of Natural Gas Due to Pipeline Failure. In Proceedings of the ASME 2007 Pressure Vessels and Piping Conference, San Antonio, TX, USA, 22–26 July 2007; Volume 7: Operations, Applications and Components, pp. 319–325. [Google Scholar]
  32. Wu, L.; Qiao, L.; Fan, J.; Wen, J.; Zhang, Y.; Jar, B. Investigation on Natural Gas Leakage and Diffusion Characteristics Based on CFD. Gas Sci. Eng. 2024, 123, 205238. [Google Scholar] [CrossRef]
  33. Lu, H.; Guo, B.; Chen, X.; Yao, J.; Liu, B. Numerical Investigation on Leakage and Diffusion Characteristics of Buried Hydrogen-Blended Natural Gas Pipelines. Int. J. Hydrogen Energy 2024, 59, 1491–1506. [Google Scholar] [CrossRef]
  34. Yan, Y.; Dong, X.; Li, J. Experimental Study of Methane Diffusion in Soil for an Underground Gas Pipe Leak. J. Nat. Gas Sci. Eng. 2015, 27, 82–89. [Google Scholar] [CrossRef]
  35. GB/T50493-2019; Standard for Design of Combustible Gas and Toxic Gas Detection and Alarm for Petrochemical Industry. China Planning Press: Beijing, China, 2019. Available online: https://www.codeofchina.com/standard/GBT50493-2019.html (accessed on 1 January 2020).
  36. Mashuga, C.V.; Crowl, D.A. Derivation of Le Chatelier’s Mixing Rule for Flammable Limits. Process Saf. Prog. 2000, 19, 112–117. [Google Scholar] [CrossRef]
  37. European Gas Pipeline Incident Data Group. 2011 Annual Report. 2011. Available online: https://www.annualreports.com/HostedData (accessed on 1 December 2014).
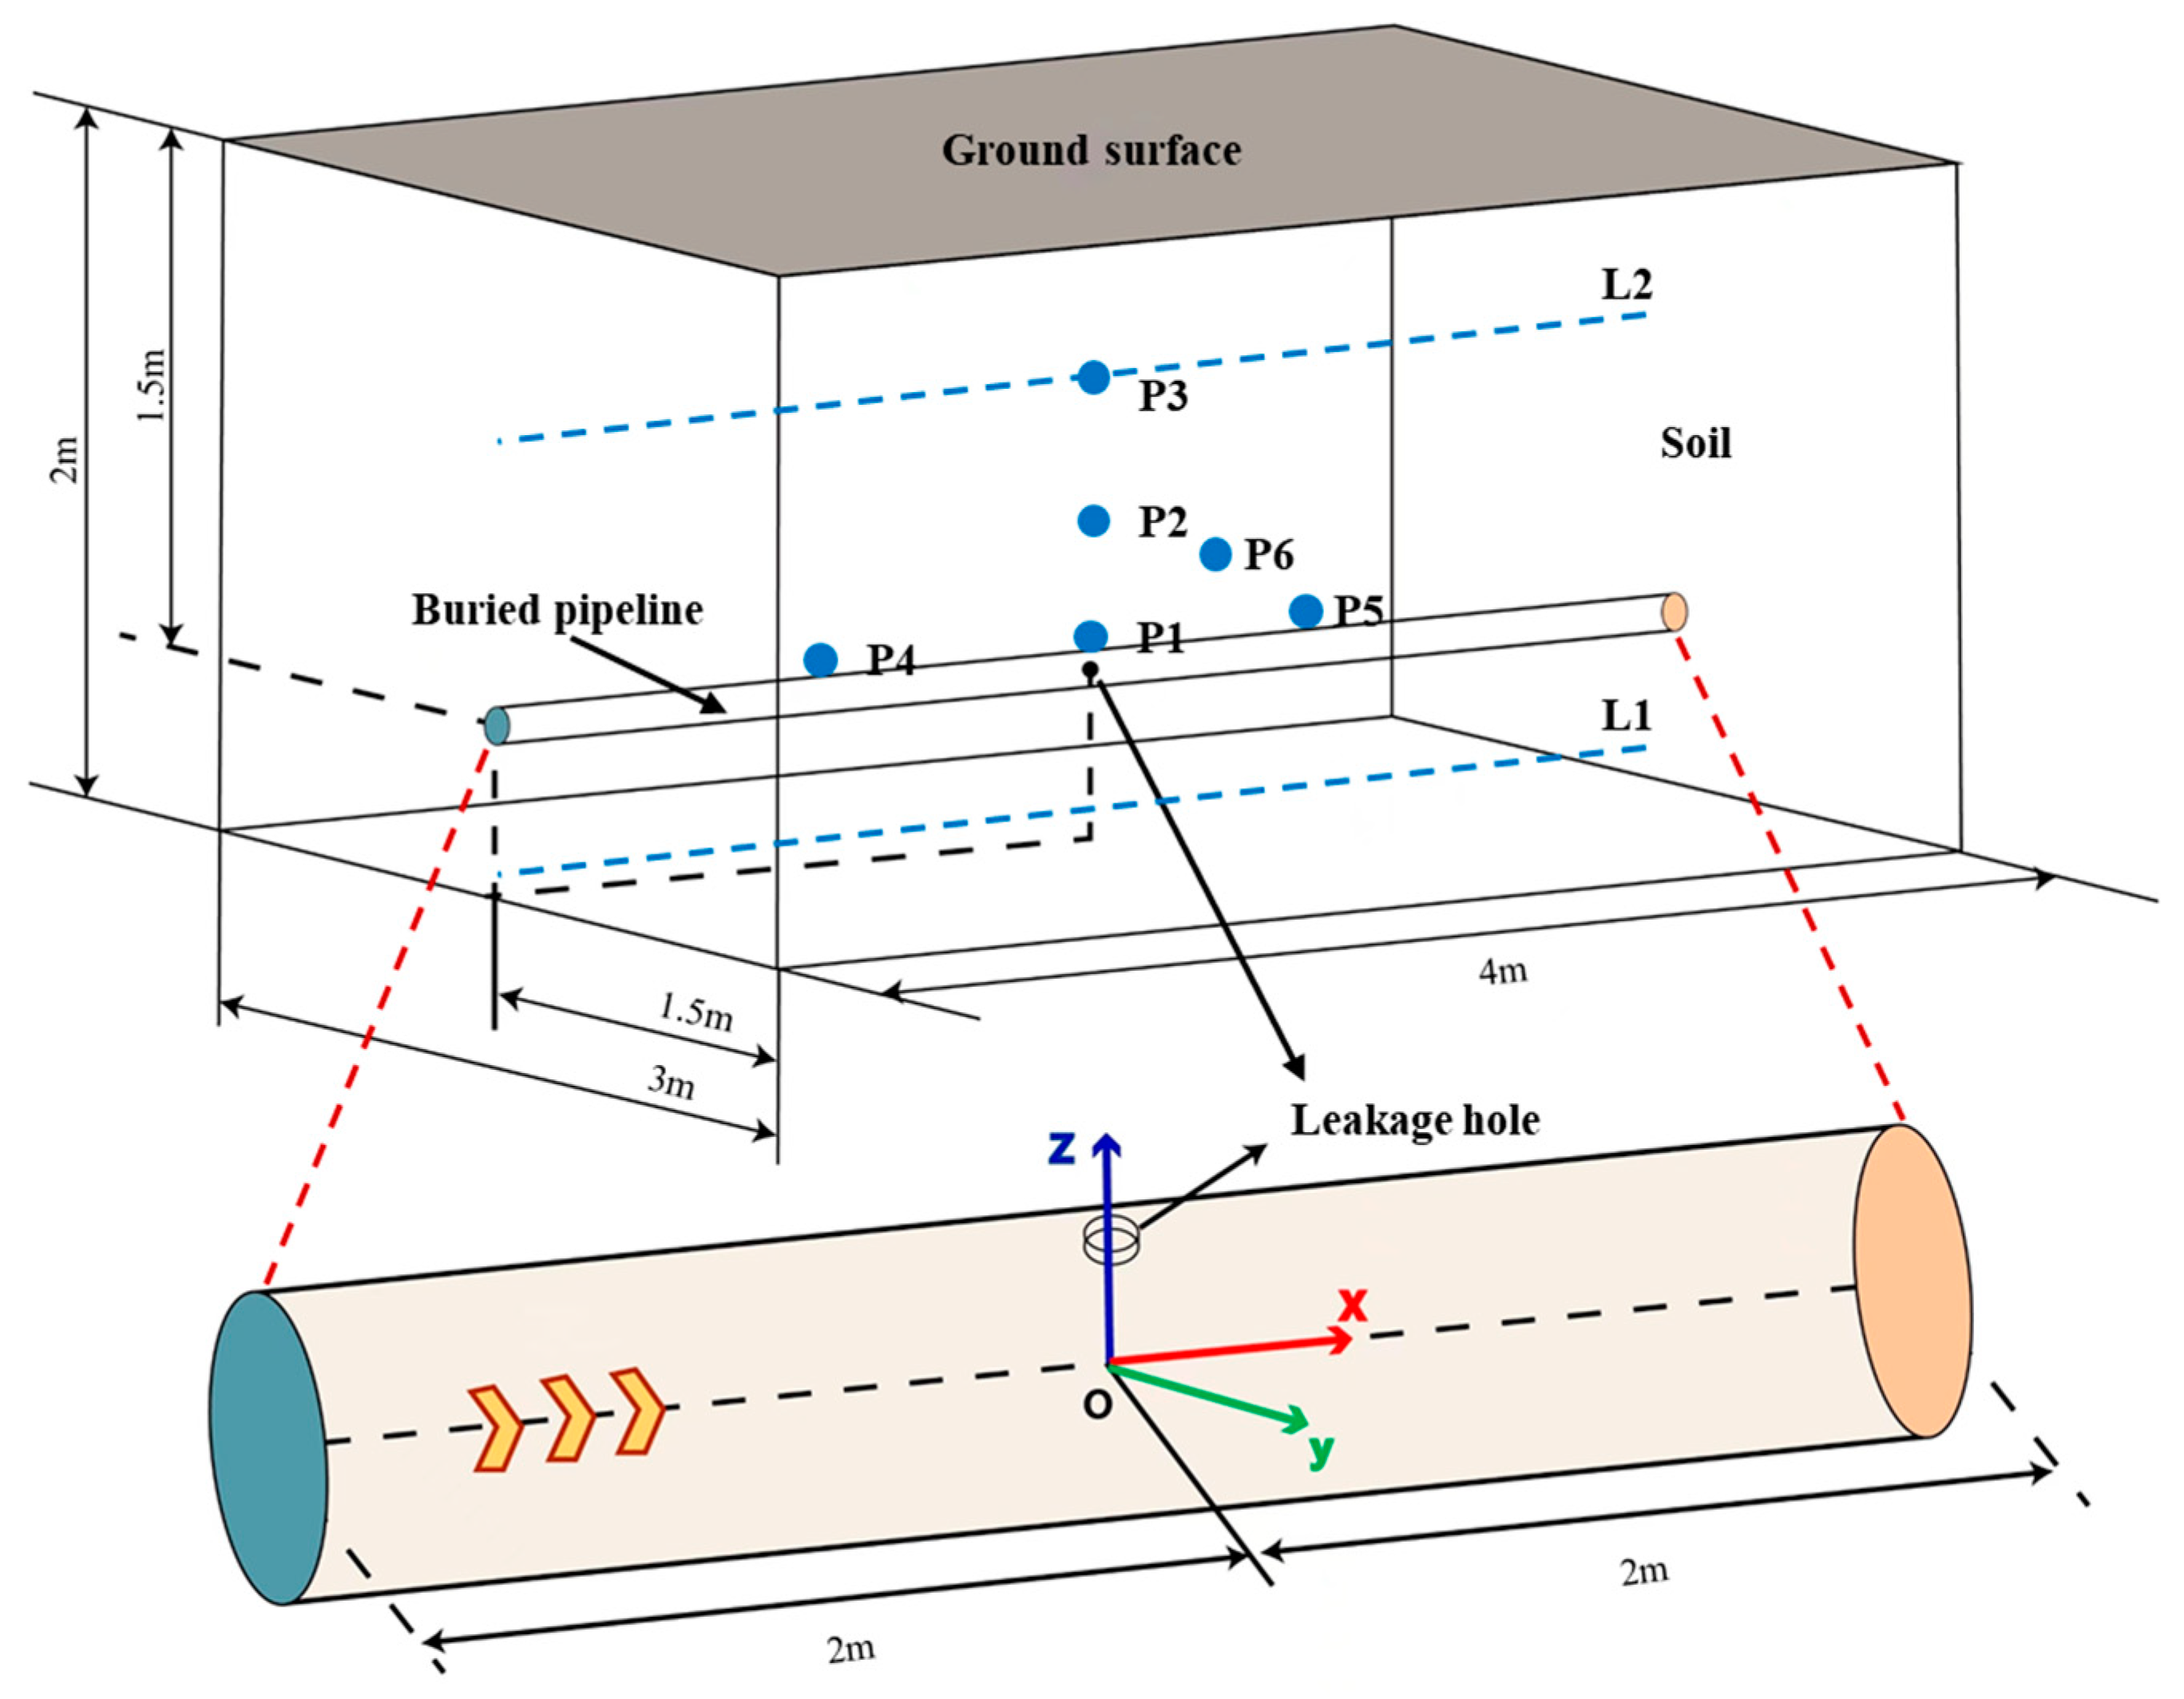
Figure 1. Schematic diagram of the physical model.
Energies 17 02951 g001
Figure 2. Schematic diagram of the mesh configuration.
Energies 17 02951 g002
Figure 3. Time evolution of mole fraction of natural gas.
Energies 17 02951 g003
Figure 4. Comparison between numerical and experimental results.
Energies 17 02951 g004
Figure 5. Pressure distribution at y = 0 plane.
Energies 17 02951 g005
Figure 6. Velocity distribution at y = 0 plane.
Energies 17 02951 g006
Figure 7. Mixed gas velocity along x direction.
Energies 17 02951 g007
Figure 8. Concentration distribution at x = 2 plane.
Energies 17 02951 g008
Figure 9. Time evolution of gas concentration at monitoring point P3.
Energies 17 02951 g009
Figure 10. Distribution of gas mole fraction along x direction.
Energies 17 02951 g010
Figure 11. Distribution of mixed gas velocity at t = 60 min.
Energies 17 02951 g011
Figure 12. Distribution of hydrogen concentration at t = 60 min.
Energies 17 02951 g012
Figure 13. Influence of leakage pressure on hydrogen leakage.
Energies 17 02951 g013
Figure 14. Influence of hydrogen blending ratio on hydrogen leakage.
Energies 17 02951 g014
Figure 15. Streamlined diagram under different ground conditions.
Energies 17 02951 g015
Figure 16. Distribution of hydrogen concentration under different ground conditions.
Energies 17 02951 g016
Figure 17. Distribution of hydrogen concentration at t = 60 min.
Energies 17 02951 g017
Figure 18. Influence of leakage hole diameter on hydrogen leakage.
Energies 17 02951 g018
Figure 19. Distribution of hydrogen concentration at t = 60 min.
Energies 17 02951 g019
Figure 20. Influence of pipeline burial depth on hydrogen leakage.
Energies 17 02951 g020
Figure 21. Prediction of leakage time.
Energies 17 02951 g021
Table 1. Location of monitoring points and lines.
Monitoring PointsLocationMonitoring LinesLocation
P1(2, 0, 0.5)L1(x, 0, 0.05)
P2(2, 0, 1)L2(x, 0, 1.55)
P3(2, 0, 1.55)-
P4(1.5, 0, 1)
P5(2.5, 0, 1)
P6(2, 0.5, 1)
Table 2. Types of boundary conditions.
BoundaryTypeValues
Leakage holePressure inlet0.4 MPa
Lateral surface of pipeWallNo slip
Lateral surface of soilPressure outlet0.1 MPa
Bottom surface of soilPressure outlet0.1 MPa
Ground surfacePressure outlet/Wall0.1 MPa/No slip
Table 3. Working conditions of the 12 cases.
Scenariop (MPa)φd (m)h (m)Ground Hardening
10.400.021.5No
20.300.021.5No
30.200.021.5No
40.45%0.021.5No
50.410%0.021.5No
60.415%0.021.5No
70.420%0.021.5No
80.400.011.5No
90.400.031.5No
100.400.021.2No
110.400.021.0No
120.400.021.5Yes
Table 4. Lower explosive limit for hydrogen-blended natural gas.
Hydrogen Blending RatioLEL
05%
5%4.9383%
10%4.878%
15%4.8193%
20%4.7619%
Disclaimer/Publisher’s Note: The statements, opinions and data contained in all publications are solely those of the individual author(s) and contributor(s) and not of MDPI and/or the editor(s). MDPI and/or the editor(s) disclaim responsibility for any injury to people or property resulting from any ideas, methods, instructions or products referred to in the content.