Abstract
This study examined the performance of reversed Brayton cycle heat pumps to supply heat above 300 °C. The aim was to overcome the current temperature limitations faced by heat pump technology in industrial heat supply sectors by examining the viability of the reversed Brayton cycle. In particular, the effects of the operating conditions on the cycle performance, such as the waste and return heat temperatures, were analyzed through thermal performance analysis. The reversed Brayton cycle heat pumps showed improved performance over conventional vapor compression cycle heat pumps when a heat supply above 215 °C was required. Furthermore, integrating additional heat exchangers into the cycle configuration was proposed in this study as a method to enhance waste heat utilization and recover unused heat from industrial processes. By incorporating preheating and recuperated cycles, these modifications broaden the operational range under the same operating conditions. They also improve the coefficient of performance (COP) of the reference cycle by up to 23% and 27.4%, respectively. This study explored the potential of reversed Brayton cycle heat pumps to supply heat above 300 °C and provided fundamental guidelines for the efficient design and operation of reversed Brayton cycle heat pumps. The results are expected to enhance our understanding of the performance characteristics of reversed Brayton cycle heat pump technology and expand its use as an alternative to fossil-fuel-based heat supply systems.
1. Introduction
In the industrial sector, heat meets various operational temperature requirements. Heat demand is divided into three categories: low-grade (below 150 °C), medium-grade (150 °C to 400 °C), and high-grade (above 400 °C), with low- and medium-grade temperatures accounting for 31% and 22% of the total demand, respectively [1]. The heat demand is continually rising, especially in developing countries with a large proportion of light industries, where an increase in the demand for low- and medium-grade temperature ranges is expected [2]. Figure 1 presents the typical process temperatures for industries such as textiles, food, and paper [3,4,5]. Currently, the industrial heat supply depends predominantly on fossil fuel boilers, a major source of CO2 emissions [2]. Although several technologies have been considered for CO2 reduction, achieving carbon neutrality will require a fundamental transition from fossil-fuel-based heat supply systems [6].
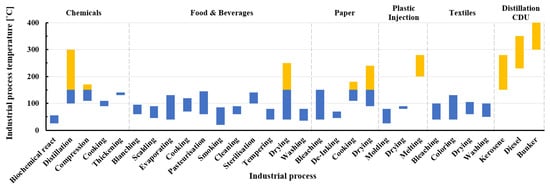
Figure 1.
Overview of industrial process temperature ranges [3,4,5].
Heat pumps, which convert low-grade waste heat and electrical input into high-grade useful thermal energy without combustion, are highlighted as potential alternatives to fossil fuel boilers. Heat pumps balance the supply and demand of electricity and thermal energy, significantly reducing the strain on power grids and improving the reliability and stability of energy distribution [7,8]. This function becomes increasingly crucial as the shift towards an electrified society with a higher reliance on renewable energy sources accelerates [9]. Moreover, heat pumps have outstanding energy efficiency, generating more heat than the electrical power they consume [10]. On the other hand, most industrial heat pumps currently in use are utilized primarily for low-grade temperature processes below 100 °C owing to the physical properties of refrigerants and technical limitations. Heat pumps designed for applications above 150 °C are still in the prototype phase [11]. Therefore, for heat pumps to replace fossil-fuel-boiler-based heat supply systems, it is crucial to increase the maximum temperature that the heat pumps can supply, and related research and development is actively being conducted.
Heat pumps are categorized into vapor compression cycle (VC) and reversed Brayton cycle (RB) pumps according to the working principle of the refrigerant within the cycle. The VC system, which achieves high cycle efficiency through a phase change in the refrigerant during heat exchange, is limited to the demand temperatures within the operational range of the refrigerant. Extending the heat supply beyond this range necessitates developing refrigerants with a broader operating temperature or including additional compressors in a mechanical vapor recompression (MVR) process [12]. On the other hand, RB systems are generally applied as refrigeration systems, and their commercialization as heat pumps has not been conducted. Their operation does not depend on a phase change in the refrigerant, allowing operation outside the conventional limits imposed by the refrigerant. This characteristic makes RB suitable for high-temperature heat pump applications, effectively managing the substantial temperature differential between low- and high-temperature sections and simplifying the system configuration by achieving the required output temperature within a cycle [13]. Zühlsdorf et al. [14] proposed MVR and RB systems, conducting an economic evaluation under operating conditions capable of delivering output temperatures above 280 °C, which verified the feasibility under given conditions. Huang et al. [15] constructed a two-stage CO2 RB system incorporating injection and an internal heat exchanger, performing simulation analysis according to the design parameters and an economic evaluation at an output temperature level of approximately 150 °C. Wang et al. [16] modeled various RB systems with different placements of a turbocharger and an additional compressor, analyzing the impact of the pressure ratios on performance and examining the feasibility of supplying heat at space heating levels. White [17] identified the factors affecting the irreversibility of a heat pump for heating purposes at 65 °C in a thermodynamic analysis, highlighting the need for the pressure losses and component efficiency to be at reversible cycle levels under low-temperature conditions. Oehler et al. [18] analyzed the efficiency during partial load operation of a heat pump system capable of supplying heat above 250 °C, proposing methods to optimize the energy conversion efficiency during the integration process with renewable energy sources.
RB systems experience significant temperature variations within the heat transfer sections, and their performance is strongly dependent on the changing operational conditions between the sink and the source. Furthermore, the diversity in the components of the cycle and the definitions of performance and operational conditions have made it challenging to compare and generalize findings from the existing research. Research on operating conditions above 200 °C has been conducted according to a limited scope, and the impact of system configuration changes on the performance and operational range of heat pump systems under these conditions has not been investigated thoroughly. Therefore, this study aimed to identify the conditions affecting the operation of the RB at industrial process temperatures. The objective is to define the conditions that influence the operation of RB heat pumps and to analyze how each variable affects performance. To achieve this, comprehensive thermal performance simulations were conducted, examining variables such as waste heat temperature, demand heat temperature, and recovery temperature and their effects on the performance and operating range of the cycle. Furthermore, based on the obtained insights, we proposed cycles with higher thermal performance and a wider operating range under the same operating conditions from a thermodynamic perspective and performed an analysis of these proposed cycles. Through a detailed thermal performance simulation analysis, this study examined the impact of various factors on performance, aiming to enhance our understanding and application of the RB in industrial settings.
2. Thermodynamics of a Reversed Brayton Cycle Heat Pump
2.1. The Reversed Brayton Process
The reversed Brayton cycle operates according to the reverse process of the Brayton cycle, transferring heat from a low-temperature source to a high-temperature sink. Figure 2 presents a schematic diagram of a closed reversed Brayton cycle heat pump and its T-s diagram. During the 1→2 process, the gas is heated and pressurized as it passes through the compressor. The peak temperature and pressure of the cycle occur at the compressor exit. In the 2→3 process, the gas passes through the high-pressure heat exchanger (HPHX), releasing heat into the high-temperature heat sink. During the 3→4 process, the gas expands through the turbine, compensating for a part of the consumed power, and at the turbine exit, the gas reaches the lowest temperature of the cycle. Through the 4→1 process, heat is supplied from the low-temperature heat source and transferred to the compressor inlet.
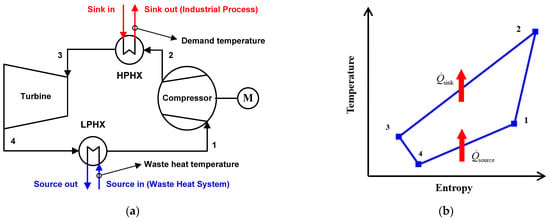
Figure 2.
Schematic and T-s diagram of a closed reversed Brayton cycle heat pump: (a) schematic diagram; (b) T-s diagram.
The low-temperature heat source used in heat pumps is supplied by a waste heat system. The amount and temperature of the waste heat provided by the waste heat system are critical for determining the potential and efficiency of waste heat recycling. Approximately 37% of the waste heat generated occurs above 140 °C, while half of the remaining 63% occurs between 40 °C and 60 °C. Relatively high-temperature waste heat can be used directly as an industrial heat source, whereas low-temperature waste heat requires upgrading to higher-temperature thermal energy through a separate system [8,19]. The energy supplied by a low-pressure heat exchanger (LPHX) from low-temperature waste heat was calculated from the enthalpy difference in the LPHX using Equation (1).
The gas heated in the compressor is then supplied to the industrial process through the high-pressure heat exchanger. At this point, the high-temperature heat supply must meet the temperature and heat quantity required by the industrial process. Unused heat from the process is recovered in the waste heat system if it is sufficiently low in temperature [20,21]. Ambient-temperature refrigerant is supplied at the sink inlet. The amount of heat transferred by the refrigerant is calculated from the enthalpy difference of the heat pump working fluid in the HPHX using Equation (2). The total power consumption of the system is calculated from the difference between the power consumed by the compressor and the work generated by the turbine using Equation (3). The coefficient of performance (COP) of the heat pump is defined as the ratio of heat transfer to the high-temperature sink to the net power consumed in the cycle according to Equation (4).
2.2. Performance of the Reversed Brayton Cycle Heat Pump
In the case of the reversed Brayton cycle heat pump, designing a higher operational pressure ratio under the same conditions of the heat source temperature enables higher-temperature heat generation. Figure 3a shows the relationship between the generation temperature and COP of an ideal reversed Brayton cycle, assuming no irreversible losses in each component and a sink inlet temperature equivalent to the ambient temperature at 25 °C.
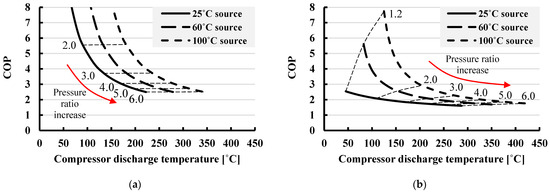
Figure 3.
Relationship between output temperature and COP of a reversed Brayton cycle: (a) reversible cycle; (b) irreversible cycle.
As the demand temperature increases under the same waste heat temperature, the required temperature for system achievement increases. Therefore, the cycle COP decreases according to Carnot’s principle. The ideal cycle COP is calculated as the Lorenz COP, which uses the log mean temperature of the working fluid in the heat exchange section as a representative value according to Equation (5) [13,22].
In an actual system, the COP of the heat pump decreases due to irreversible processes occurring in the components. Figure 3b presents the correlation between the generated temperature and COP, considering the efficiency of the compressors and turbines. The required power consumption increases as the inefficiency of the components increases, and the amount of waste heat recovery decreases, leading to a decrease in the COP. The Lorenz efficiency is introduced to represent the performance of the cycle, including irreversibility, compared to an ideal cycle, which is expressed as Equation (6). Most heat pumps have a lower COP, between 30% and 60% of the theoretical efficiency, due to the inefficiency of the components [13].
3. Modeling
3.1. Modeling of a Reversed Brayton Cycle Heat Pump
The reference specifications required for the reversed Brayton cycle heat pump model, designed for supplying heat above 300 °C, were based on the model under study for development [23]. The system shown in Figure 1 consists of a compressor, a high-pressure heat exchanger (HPHX), a turbine, and a low-pressure heat exchanger (LPHX) in sequence. Dry air, a natural refrigerant with a low GWP, good condensation properties at low temperatures, environmental friendliness, and availability, was chosen as the working fluid [24].
The plant process analysis program GateCycle v6.1.2 [25] was used to assess the performance of the reversed Brayton cycle heat pump. Table 1 lists the design conditions used for the simulation.

Table 1.
Design parameters of reversed Brayton cycle heat pump.
The power consumption of the compressor and the output of the turbine were calculated using Equation (7). is the power consumed by the system, considering the mechanical efficiency during power transmission from the shaft to the compressor, and the motor efficiency during the conversion of electrical into mechanical energy [26,27]. The cycle COP was calculated from the heat transfer amount in the HPHX and the cycle power consumption, as indicated in Equation (8).
For the performance analysis under different operating conditions, the following assumptions were considered. The performance of compressors and turbines changes with the operational conditions and is calculated based on the same polytropic efficiency as the reference model. The polytropic efficiency assumes an equivalent performance at different pressure ratio levels [28]. Heat exchangers are gas-to-gas-type fin-tube heat exchangers, and their performance is assumed as that of ideal counterflow heat exchangers using the NTU–effectiveness method, as shown in Equation (9) [29], with the lengths designed according to the operational conditions to maintain the same effectiveness as the reference model. The pressure drop in the heat exchangers was calculated using the single-phase pressure loss Equation (10) [29], assuming constant heat transfer and friction coefficients. The external working fluid of the system was set as dry air with the same mass flow rate as the system fluid, and the pressure loss of the external working fluid was not included when calculating the heat pump system performance.
The maximum temperature and pressure conditions in the cycle occur at the compressor exit. The pressure ratio of the compressor was designed to meet the process demand temperature. The operational pressure in the system affects the capacity and performance, so the compressor exit pressure at the maximum cycle pressure was set to the same value as in the standard conditions.
3.2. Modeling of a Vapor Compression Cycle Heat Pump
For the vapor compression cycle heat pump, the heat pump unit was modeled as a black box, including an additional compressor to generate higher-temperature heat beyond its operating limits [12]. Figure 4 presents a schematic diagram of the configured heat pump system. The heat pump unit consists of an electrically driven heat pump unit and a flash tank. Among the commercialized heat pump units, this study selected the SGH120 (Kobelco) model, which can supply heat up to 120 °C without additional devices. This model uses R245fa as a refrigerant, which has a critical temperature of 154 °C [30,31], and R245fa is a representative refrigerant used in commercial heat pumps designed to supply heat above 100 °C [6,32]. The heat generated by the heat pump is transferred to the R718 refrigerant circulating in the flash tank. The R718 refrigerant circulates according to a two-phase condition, which allows the high-temperature conditions of the VC unit to remain constant, operating at rated performance for each waste heat temperature. The rated performance of the heat pump unit under various operating conditions was determined using the data published by the manufacturer, as listed in Table 2 [33].
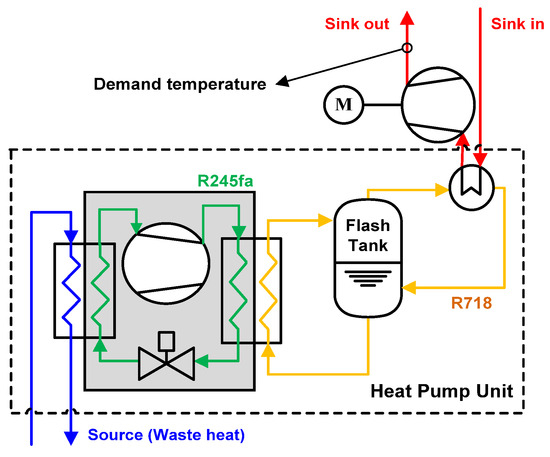
Figure 4.
Schematic diagram of a mechanical vapor recompression heat pump system.

Table 2.
Performance of SGH 120 (Kobelco) [33].
For comparison based on the target demand temperatures, the following assumptions were considered. The ambient-temperature dry air was heated by the R718 refrigerant from the flash tank. The heat transfer process from the R718 refrigerant to dry air involved a heat exchanger effectiveness of 0.9, and we assumed ideal heat exchange without heat and pressure losses. The demand temperature is achieved by consuming additional power in the compressor, assuming the same polytropic efficiency as in the RB heat pump, and the power consumption was calculated using Equation (11). The performance of the proposed system was calculated based on the combined power consumption of the heat pump and the additional compressor work. The overall COP was then calculated using Equation (12).
4. Results and Discussion
4.1. Comparision between RB and VC Systems
Table 3 and Table 4 list the thermal performance analysis results for each type of heat pump with a waste heat temperature of 65 °C and a target output temperature of 305 °C. Under these operating conditions, the COP for the RB system was calculated to be 1.364, while the COP for the VC system was 1.295.

Table 3.
Thermal performance of reversed Brayton cycle heat pump.

Table 4.
Thermal performance of mechanical vapor recompression heat pump.
Figure 5a compares the performance of the two heat pump types under various demand temperatures. The crossover temperature represents the demand temperature at which the COP of the VC and RB systems intersects for each source temperature. Configuring the system with the RB was advantageous in terms of its performance in supplying heat above 200 °C. This is because the decrease in the COP as the demand temperature increased was more gradual for the RB system than the VC system. The proposed VC system consumed additional power in the compressor to achieve higher demand temperatures. Due to operating within the refrigerant’s temperature limits, only the sub-compressor power increased. This led to a significant decrease in the COP. In contrast, the reversed Brayton cycle increased the operating pressure ratio to achieve higher demand temperatures. As a result, the increased turbine output due to the higher expansion ratio partially compensates for the power consumption of the compressor. Although the turbine outlet temperature decreases with a higher expansion ratio, if sufficient waste heat is supplied, the reduced temperature at the turbine exit can be restored to the waste heat temperature level at the compressor inlet. This does not impose any additional load on the compressor operation. Figure 5b shows the crossover temperatures at which the COP of the RB system surpasses that of the VC system for various waste heat temperatures. The crossover temperature varies depending on the operating conditions, but it is more advantageous in terms of performance to configure a single system rather than using additional compressor work to achieve high demand temperatures. Under the analyzed conditions, it was found that the RB system may be more favorable if the demand temperature exceeds 215 °C.
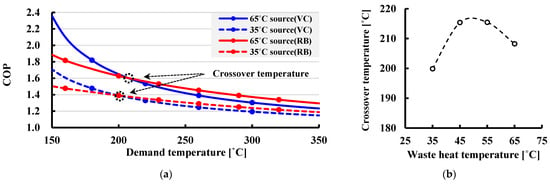
Figure 5.
Performance comparison of RB and VC systems: (a) COP comparison by demand temperature; (b) COP crossover temperature by waste heat temperature.
4.2. Analysis of RB Operation under Different Design Conditions
This section evaluates the performance and efficiency of the RB under different operating conditions for a heating supply of up to 300 °C. This effort aims to improve our understanding of the operational mechanism of the RB. The RB can be designed to supply heat according to the demand temperature under various operating conditions. Parametric analysis was conducted on the performance of the RB under varying waste and return heat temperatures.
4.2.1. Impact of the Waste Heat Temperature
The performance of the RB was analyzed for waste heat temperatures ranging from 35 °C to 150 °C [19]. The operating pressure ratio of the system was designed to meet the demand temperature, determining the operating conditions of the high-temperature section of the system. Under the same demand temperature conditions, an increase in temperature at the compressor inlet decreased the pressure ratio and the power consumption of the compressor. Figure 6 presents the heat production, power consumption, and waste heat recovery of the heat pump according to the waste heat temperature. Figure 7 shows the cycle COP according to the pressure ratio. The log mean temperature in the waste heat exchange section increased as the waste heat temperature increased, which reduced the temperature rise in the cycle, increasing the Lorenz COP. The analysis showed that the waste heat temperature does not significantly affect the Lorenz efficiency. This indicates that the increase in the COP due to the rise in the waste heat temperature is based on thermodynamic principles and that the waste heat temperature does not significantly affect the fundamental thermodynamic characteristics of the system. In other words, while the rise in waste heat temperature leads to an increase in the system COP, it does not improve the efficiency of the system.
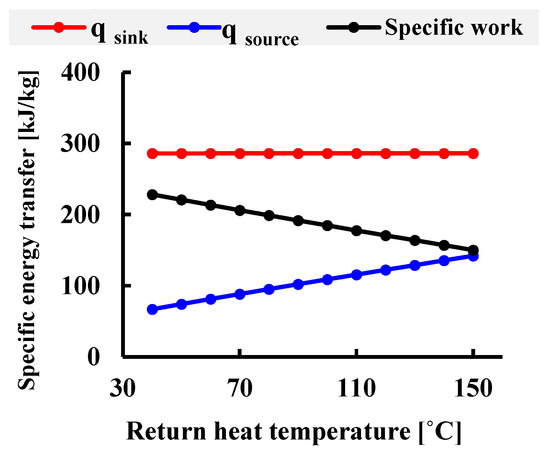
Figure 6.
Effect of waste heat temperature on specific energy transfer.
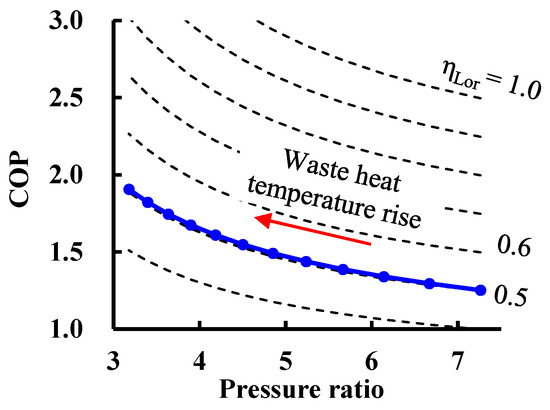
Figure 7.
Effect of waste heat temperature on pressure ratio and COP.
4.2.2. Impact of the Return Heat Temperature
Heat transfer occurs due to temperature differences. Hence, the temperature of the heat supplied by the heat pump must be above the minimum process temperature of the connected process. Therefore, if unused heat from the process is not recovered, only a part of the generated thermal energy from the heat pump system is utilized. A performance calculation based on the actual amount of used heat and power consumption revealed a significant decrease in the COP. Integrating the heat pump with processes of different temperature levels, which can be challenging, is necessary to use all the heat generated by the heat pump up to the ambient or waste heat temperature [21,34]. Instead of integrating other industrial processes, the system is configured to recover unused heat from the process without cooling. This increases the turbine inlet temperature and turbine work, partially recovering the effect of a decrease in the COP. The performance of the heat pump was assessed by analyzing the impact of the return heat temperature when unused heat is recovered by heat pump. The return heat temperatures ranged from 25 °C, which is the ideal temperature if all the generated heat is used, to the maximum return heat temperature condition that the cycle can accommodate, assuming the waste heat temperature is supplied at 100 °C.
Figure 8 shows the change in the heat production, power consumption, and waste heat recovery of the heat pump according to the return heat temperature. The increase in the recovery temperature means a decrease in the actual amount of heat transferred, thereby reducing . The work output from the turbine increases as the return heat temperature increases, but the recoverable thermal energy from waste heat decreases as the turbine outlet temperature (State 4) increases. Figure 9 shows the change in the log mean temperature of the heat exchanger and the temperatures at the inlet and outlet of the LPHX according to the return heat temperature. This hinders the efficient use of waste heat when generating heat, resulting in a decrease in the COP. The LPHX can no longer recover heat from the waste heat when the return heat temperature is above 175 °C. At this point, the turbine outlet temperature reaches a waste heat temperature of 100 °C, rendering the cycle inoperable under those conditions. Figure 10 presents the COP according to the return heat temperature. The average temperatures of the HPHX and LPHX increase as the return heat temperature increases, leading to an increase in the Lorenz COP. In the actual cycle, however, the efficient use of waste heat becomes problematic when the temperature difference from the waste heat decreases, leading to a significant decrease in the Lorenz efficiency. If the return heat is not recovered, the compensation from the increased work output of the turbine is also lost, resulting in an even more significant decrease in the COP.
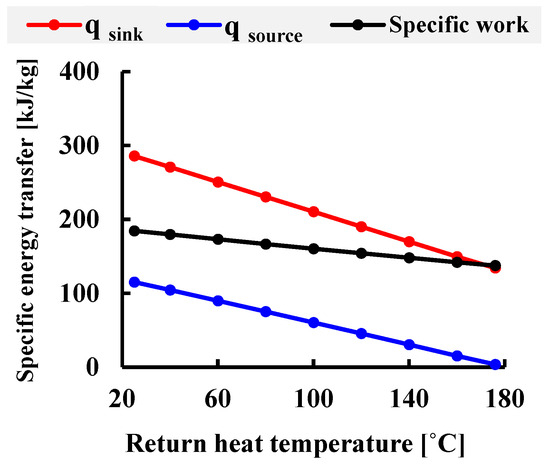
Figure 8.
Effect of return heat temperature on specific energy transfer.
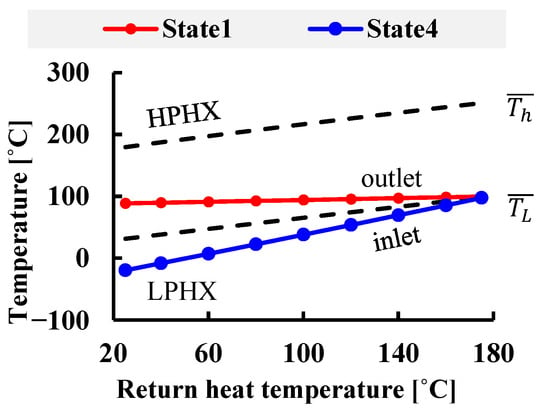
Figure 9.
Effect of return heat temperature on state condition.
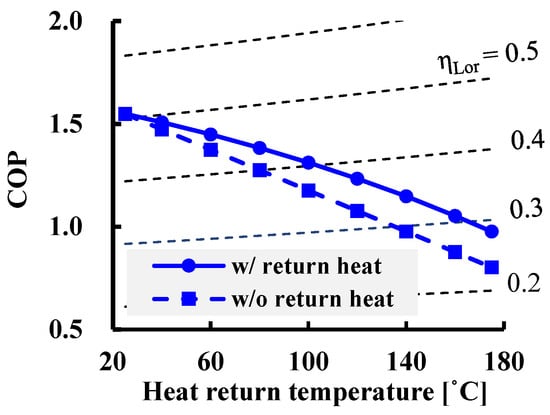
Figure 10.
Effect of return heat temperature on COP.
4.2.3. Impact of the System Configuration
The inability to configure a cycle under high return heat temperature conditions in the reference cycle was due primarily to the turbine outlet temperature reaching a specific upper limit (waste heat supply temperature), beyond which it was not possible to receive heat from the waste heat system. Modifying the system configuration allows this problem to be solved without increasing the waste heat temperature, thus utilizing unused heat more effectively. Cycles were designed to include a heat exchange process between the unused heat, which is hotter than the waste heat temperature, and the system, improving the overall system efficiency and operating range. Compared to the reference cycle, the modified cycles are shown in Figure 11 as a preheating cycle heat pump and in Figure 12 as a recuperated cycle heat pump. Additional heat exchangers were designed with an effectiveness of 0.9, considering the pressure loss in the tube as applied in the reference cycle modeling.
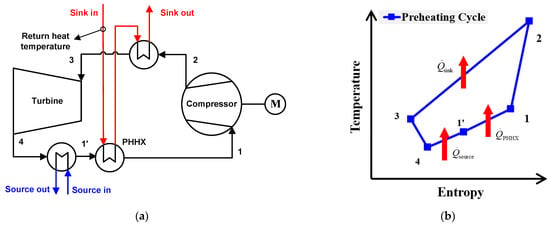
Figure 11.
Schematic and T-s diagram of a preheating cycle heat pump: (a) schematic diagram; (b) T-s diagram.
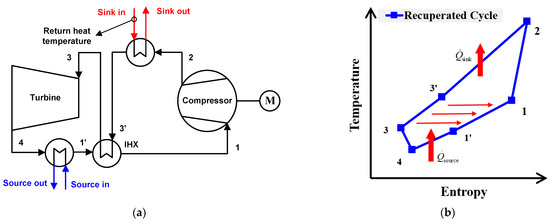
Figure 12.
Schematic and T-s diagram of a recuperated cycle heat pump: (a) schematic diagram; (b) T-s diagram.
Figure 11 shows a schematic diagram of a preheating heat pump system. In the preheating cycle, the recovered high-temperature heat is used primarily to increase the temperature at the compressor inlet, reducing the power consumption of the compressor. The recovered heat is discharged to the system through a preheating heat exchanger (PHHX) located between the LPHX and the compressor. The system receives heat from the HPHX, with the actual heat transfer expressed as Equation (13).
For effective heat transfer in the preheating heat exchanger, it is crucial to consider the relation to the waste heat temperature. After passing through the preheating heat exchanger, the recovered heat is then heated to the target temperature by the HPHX before being supplied to the process. The temperature at the entrance of the HPHX is lower than in the reference cycle, resulting in a decrease in the turbine inlet temperature and reducing the turbine work. The COP of the preheating cycle is expressed as Equation (14).
Figure 12 presents a schematic diagram of a recuperated heat pump system with an added internal heat exchanger (IHX). Recuperative heat exchange occurs between the high-temperature section after the industrial process heat supply and the low-temperature section after the heat exchange with waste heat in the LPHX. For recuperative heat exchange to occur, the relationship between the outlet temperature on the system side of the HPHX and the waste heat temperature should be considered carefully. Similar to the preheating cycle, the recuperated cycle sees a decrease in turbine work but benefits from reduced compressor power consumption due to the compressor preheating effect. The COP can be calculated using the same method as in the reference cycle because heat exchange with the external system occurs only in the LPHX and HPHX, as expressed in Equation (8).
The configuration limits of the system can be identified from the temperatures in the waste heat exchanger, which vary according to the return heat temperature. Figure 13 shows the change in the log mean temperature of the heat exchanger and the temperatures at the inlet and outlet of the LPHX according to the return heat temperature of the preheating cycle. The preheating cycle can be configured for return heat temperatures from 95 °C, where using a PHHX is possible, up to a maximum of 225 °C, where using an LPHX is possible. It was found that the upper temperature limit of the operating range is extended compared to the reference cycle. This is because the preheating cycle, with the additional heat exchanger, can achieve lower LPHX inlet temperatures at the same return temperature. Similarly, Figure 14 illustrates how the IHX in the recuperated cycle also increases waste heat recovery. The internal pressure loss is higher than in the preheating cycle because the recuperated cycle involves passing the high- and low-temperature sections through the IHX. On the other hand, direct heat exchange between the working fluids inside the cycle can achieve a lower turbine outlet temperature under the same operating conditions. The recuperated cycle can incorporate a recuperative heat exchanger starting from 70 °C and be configured up to a maximum of 242 °C.
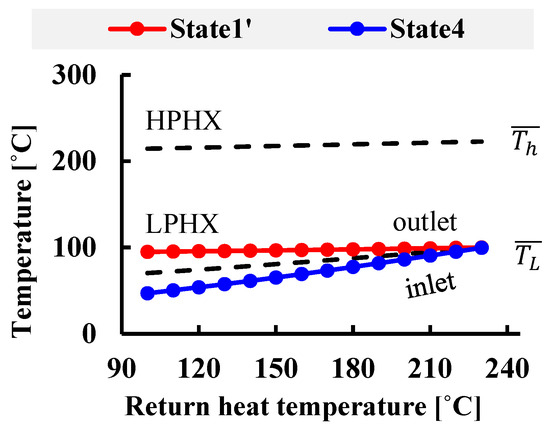
Figure 13.
Effect of return heat temperature on state conditions in the preheating cycle.
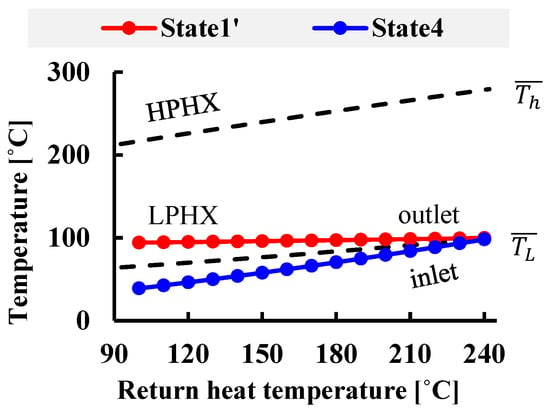
Figure 14.
Effect of return heat temperature on state conditions in the recuperated cycle.
Table 5 summarizes the performance of the reference, preheating, and recuperated cycles under waste heat and target demand temperatures of 100 °C and 305 °C, respectively. Note that additional heat exchangers involve pressure loss, which decreases the turbine output compared to the reference cycle. Hence, a decrease in turbine output and pressure loss lowers the system performance. On the other hand, the power consumption required for the compressor to achieve the demand temperature decreases because preheating occurs above the waste heat temperature at the compressor inlet. A decrease in compressor power consumption has a more significant impact on performance than a decrease caused by changes in the system configuration, resulting in higher performance under high return heat temperature conditions compared to the reference cycle. A comparison of the power consumption with the reference cycle showed that the preheating and recuperated cycles reduce power consumption by 8.1% and 12.8%, respectively, at a return heat temperature of 150 °C.

Table 5.
Performance comparison of reference, preheating, and recuperated cycle heat pumps.
Figure 15 shows the heat generation and power consumption according to the return heat temperature for three cycle configurations. When the target demand temperature is the same, the actual heat transfer amount delivered in the process was the same across all the configurations. But the power consumption varied according to the cycle configuration. Under high return heat temperature conditions, the preheating and recuperated cycles consumed less power than the reference cycle to meet the heat demand, with significantly lower power consumption observed under the 175 °C operating condition, where the cycle power is reduced by 23% and 27.4%, respectively. Figure 16 presents the COP according to the return heat temperature for each cycle configuration method. The preheating cycle had a higher COP than the reference cycle when the return temperature was above 120 °C, and the recuperated cycle had a higher COP than the reference cycle when the return temperature was above 105 °C. Configuring a recuperated cycle is most advantageous considering the return heat recovery process.
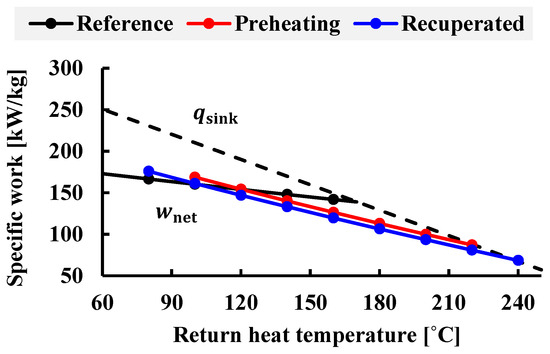
Figure 15.
Effect of return heat temperature on specific energy transfer in different configurations.
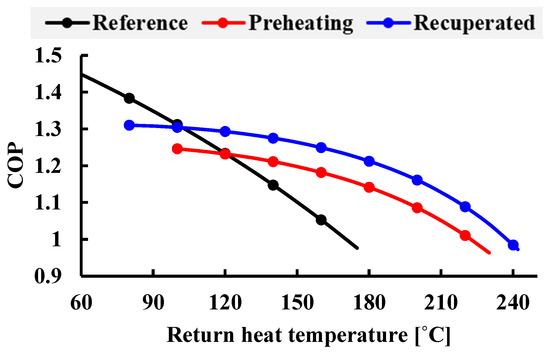
Figure 16.
Effect of return heat temperature on COP in different configurations.
5. Conclusions
This study examined the thermal performance of the RB for heat supplies above 300 °C. The research findings are summarized as follows.
First, the performance of VC, including mechanical vapor recompression, and RB systems was compared at various heat demand temperatures. Under operating conditions of waste heat from 65 °C to 305 °C, the VC system had a COP of 1.295, while the RB system had a COP of 1.364. The study identified that the crossover temperature, where the RB provides advantages over the VC by increasing the waste heat recovery, occurs above 215 °C. Subsequently, the impact of the source inlet temperature and the return heat temperature on the RB was evaluated, affecting the operation of the low- and high-pressure sections under a target demand temperature condition of around 300 °C.
Recovering unused heat from industrial processes in an RB system is advantageous for enhancing performance. Nevertheless, challenges arise in the cycle configuration because of the inability to recover waste heat as the return heat temperature increases. This study proposed preheating and recuperated heat pump cycles to recover unused heat in the system and improve the waste heat utilization by integrating additional heat exchangers into the cycle. Under 100 °C waste heat conditions, these configurations allowed for an extension of the return heat temperature conditions up to 50 °C and 65 °C beyond what the reference cycle could accommodate. At 175 °C, where the reference cycle faced operational constraints, the power consumption of each modified cycle decreased by 23% and 27.4%, respectively, showing that the modified cycles can operate more efficiently.
These results provide fundamental guidelines for the design and optimization of reversed Brayton cycle heat pump systems, contributing to a gradual understanding of their performance characteristics for industrial heat supply and expanding their application range. Although this research was limited by its focus on specific working fluids and cycle configurations, the findings suggest practical applications such as industrial waste heat recovery, high-temperature process applications, and integration with renewable energy sources. Future studies will be needed to overcome these limitations and further explore the potential of reversed Brayton cycle heat pump technology.
Author Contributions
Conceptualization, T.-S.K., J.-S.K., and C.-H.S.; methodology, J.-S.K.; software, J.-S.K. and I.-H.C.; validation, J.-S.K. and I.-H.C.; formal analysis, J.-S.K.; investigation, J.-S.K. and I.-H.C.; resources, T.-S.K. and C.-H.S.; data curation, J.-S.K. and I.-H.C.; writing—original draft preparation, J.-S.K.; writing—review and editing, J.-S.K., T.-S.K., and C.-H.S.; visualization, J.-S.K. and I.-H.C.; supervision, T.-S.K. and C.-H.S.; project administration, T.-S.K. and C.-H.S.; funding acquisition, T.-S.K. and C.-H.S. All authors have read and agreed to the published version of the manuscript.
Funding
This research was supported by a grant of the Basic Research Program funded by the Korea Institute of Machinery and Materials (grant number: NK249C) and also by the National Research Foundation of Korea(NRF) grant funded by the Korea government(MSIT) (No. RS-2023-00208318).
Data Availability Statement
The original contributions presented in the study are included in the article, further inquiries can be directed to the corresponding author/s.
Conflicts of Interest
The authors declare no conflicts of interest.
Nomenclature
| A | Area [m2] |
| Heat capacity rate [W/K] | |
| Heat capacity rate ratio | |
| d | Hydraulic diameter [m] |
| f | Fanning friction factor |
| G | Mass flux [kg/m2-s] |
| h | Specific enthalpy [kJ/kg] |
| L | Passage length [m] |
| Mass flow rate [kg/s] | |
| P | Pressure [kPa] |
| Heat transfer rate [kJ/s] | |
| q | Specific heat transfer rate [kJ/kg] |
| s | Entropy [kJ/kg-K] |
| T | Temperature [K] |
| Log mean temperature [K] | |
| U | Overall heat transfer coefficient [W/m2-K] |
| Power consumption, work [kW] | |
| w | Specific power consumption, specific work [kJ/kg] |
| Greek | |
| Effectiveness | |
| Density [kg/m3] | |
| Efficiency | |
| Subscripts | |
| comp | Compressor |
| ex | Exit |
| HP | Heat pump |
| in | Inlet |
| ideal | Ideal |
| Lor | Lorentz |
| loss | Loss |
| max | Maximum |
| mech | Mechanical |
| min | Minimum |
| motor | Motor |
| net | Net |
| poly | Polytropic process |
| sink | Heat sink |
| source | Heat source |
| subC | Sub-compressor for mechanical vapor recompression |
| turb | Turbine |
Abbreviations
| COP | Coefficient of performance |
| HPHX | High-pressure heat exchanger |
| HX | Heat exchanger |
| IHX | Internal heat exchanger for recuperated cycle |
| LPHX | Low-pressure heat exchanger |
| M | Motor |
| MVR | Mechanical vapor recompression cycle |
| NTU | Number of transfer units |
| PHHX | Preheating heat exchanger for preheating cycle |
| RB | Reversed Brayton cycle |
| VC | Vapor compression cycle |
References
- BloombergNEF. Hot Spots for Renewable Heat Decarbonizing Low-to Medium-Temperature Industrial Heat across the G-20; WBCSD: Amsterdam, The Netherlands, 13 September 2021. [Google Scholar]
- IEA. World Energy Outlook 2023. 2023. Available online: https://www.iea.org/reports/world-energy-outlook-2023 (accessed on 25 February 2024).
- Wolf, S.; Lambauer, J.; Fahl, U.; Blesl, M.; Voss, A. Industrial Heat Pumps in Germany—Potentials, Technological Development and Application Examples. In Proceedings of the ECEEE 2012 Summer Study—Energy Efficiency in Industry 2012, Arnhem, The Netherlands, 11–14 September 2012. [Google Scholar]
- Lauterbach, C.; Schmitt, B.; Jordan, U.; Vajen, K. The Potential of Solar Heat for Industrial Processes in Germany. Renew. Sustain. Energy Rev. 2012, 16, 5121–5130. [Google Scholar] [CrossRef]
- Jiang, J.; Hu, B.; Wang, R.Z.; Deng, N.; Cao, F.; Wang, C.C. A Review and Perspective on Industry High-Temperature Heat Pumps. Renew. Sustain. Energy Rev. 2022, 161, 112106. [Google Scholar] [CrossRef]
- Arpagaus, C.; Bless, F.; Uhlmann, M.; Schiffmann, J.; Bertsch, S.S. High Temperature Heat Pumps: Market Overview, State of the Art, Research Status. Refrig. Appl. Potentials Energy 2018, 152, 985–1010. [Google Scholar]
- Yu, Y.; Chen, H.; Chen, L.; Chen, C.; Wu, J. Optimal Operation of the Combined Heat and Power System Equipped with Power-to-Heat Devices for the Improvement of Wind Energy Utilization. Energy Sci. Eng. 2019, 7, 1605–1620. [Google Scholar] [CrossRef]
- Marina, A.; Spoelstra, S.; Zondag, H.A.; Wemmers, A.K. An Estimation of the European Industrial Heat Pump Market Potential. Renew. Sustain. Energy Rev. 2021, 139, 110545. [Google Scholar] [CrossRef]
- Kabeyi, M.J.B.; Olanrewaju, O.A. Sustainable Energy Transition for Renewable and Low Carbon Grid Electricity Generation and Supply. Front. Energy Res. 2022, 9, 743114. [Google Scholar] [CrossRef]
- Toleikyte, A.; Roca Reina, J.C.; Volt, J.; Carlsson, J.; Lyons, L.; Gasparella, A.; Koolen, D.; De Felice, M.; Tarvydas, D.; Czako, V.; et al. The Heat Pump Wave Opportunities and Challenges: Analysis of the Largescale Deployment of Heat Pumps by 2030 Following the REPowerEU Plan; Publications Office of the European Union: Luxembourg, 2023; ISBN 9789268048702. [Google Scholar]
- IEA. The Future of Heat Pumps; IEA: Paris, France, 2022; Available online: https://www.iea.org/reports/the-future-of-heat-pumps (accessed on 25 February 2024).
- Jakobs, R.M.; Stadtlander, C. Final Report Annex 48: Industrial Heat Pumps, Second Phase; IEA: Paris, France, 2020; ISBN 9789189167032. Available online: https://heatpumpingtechnologies.org/publications/hybrid-heat-pumps-final-report/ (accessed on 9 January 2024).
- Zühlsdorf, B. High-Temperature Heat Pumps Task 1-Technologies Task Report Operating Agent; IEA: Paris, France, 2023; ISBN 9789189821347. Available online: https://heatpumpingtechnologies.org/annex58/ (accessed on 9 January 2024).
- Zühlsdorf, B.; Bühler, F.; Bantle, M.; Elmegaard, B. Analysis of Technologies and Potentials for Heat Pump-Based Process Heat Supply above 150 °C. Energy Convers. Manag. X 2019, 2, 100011. [Google Scholar] [CrossRef]
- Huang, R.; Hu, B.; Wang, R.Z.; Eikevik, T.M.; Ge, T.S. Thermodynamic and Economic Analysis of Two-Stage CO2 Heat Pump with Reverse Brayton Cycle. Int. J. Refrig. 2022, 143, 157–165. [Google Scholar] [CrossRef]
- Wang, S.; Li, S.; Jiang, S.; Wu, X. Analysis of the Air-Reversed Brayton Heat Pump with Different Layouts of Turbochargers for Space Heating. Buildings 2022, 12, 870. [Google Scholar] [CrossRef]
- White, A.J. Thermodynamic Analysis of the Reverse Joule-Brayton Cycle Heat Pump for Domestic Heating. Appl. Energy 2009, 86, 2443–2450. [Google Scholar] [CrossRef]
- Oehler, J.; Gollasch, J.; Tran, A.P.; Nicke, E. Part Load Capability of a High Temperature Heat Pump with Reversed Brayton Cycle. In Proceedings of the 13th IEA Heat Pump Conference 2021 (HPC2020) Conference Proceedings, Jeju, South Korea, 26–29 April 2021. [Google Scholar]
- Forman, C.; Muritala, I.K.; Pardemann, R.; Meyer, B. Estimating the Global Waste Heat Potential. Renew. Sustain. Energy Rev. 2016, 57, 1568–1579. [Google Scholar] [CrossRef]
- Su, Z.; Zhang, M.; Xu, P.; Zhao, Z.; Wang, Z.; Huang, H.; Ouyang, T. Opportunities and Strategies for Multigrade Waste Heat Utilization in Various Industries: A Recent Review. Energy Convers. Manag. 2021, 229, 113769. [Google Scholar] [CrossRef]
- Inayat, A. Current Progress of Process Integration for Waste Heat Recovery in Steel and Iron Industries. Fuel 2023, 338, 127237. [Google Scholar] [CrossRef]
- Bejan, A.; Tsatsaronis, G.; Moran, M. Thermal Design and Optimization. Int. J. Refrig. 1996, 19, 482. [Google Scholar] [CrossRef]
- Chung, Y.; Kim, H.S.; Kim, D.H.; Lee, G.H.; Song, C.H. A study on the cycle performance analysis of a 300 °C high temperature heat pump system. In Proceedings of the SAREK 2022 Summer Annual Conference, Gangwon, South Korea, 21–23 June 2023; pp. 905–908. [Google Scholar]
- Shuailing, L.; Guoyuan, M.; Shuxue, X.; Yuexuan, G.; Xiaoya, J.; Guoqiang, W. A Review of Reverse Brayton Air Cycle Refrigerators. Int. J. Refrig. 2023, 150, 200–214. [Google Scholar] [CrossRef]
- GE Energy. GateCycle ver. 6.1.2.; General Electric: Boston, MA, USA, 2013. [Google Scholar]
- Kurz, R.; Brun, K. Assessment of Compressors in Gas Storage Applications. J. Eng. Gas Turbine Power 2010, 132, 062402. [Google Scholar] [CrossRef]
- Burt, C.M.; Piao, X.; Gaudi, F.; Busch, B.; Taufik, N.F. Electric Motor Efficiency under Variable Frequencies and Loads. J. Irrig. Drain. Eng. 2008, 134, 129–136. [Google Scholar] [CrossRef]
- Schobeiri, M.T. Efficiency of Multi-stage Turbomachines. In Turbomachinery Flow Physics and Dynamic Performance; Springer: Berlin/Heidelberg, Germany, 2012. [Google Scholar] [CrossRef]
- Thulukkanam, K. Heat Exchanger Design Handbook, 2nd ed.; CRC Press: Boca Raton, FL, USA, 2013. [Google Scholar]
- Zhou, D.; Meng, Z.; Liu, Y.; Dong, S.; Zhang, F.; Ding, C.; Huo, Z.; Wang, M. Theoretical Study of Low-GWP Refrigerants in High-Temperature Heat Pump Systems. Int. J. Low-Carbon Technol. 2023, 18, 881–886. [Google Scholar] [CrossRef]
- Watanabe, C.; Uchiyama, Y. Pioneering Industrial Heat Pump Technology in Japan; Chubu Electric Power Co., Inc.: Nagoya, Japan, 2014. [Google Scholar]
- Dumont, O. Investigation of a Heat Pump Reversible into an Organic Rankine Cycle and Its Application in the Building Sector. Ph.D. Thesis, Doctor of Applied Sciences. University of Liège, Liège, Belgium, 2017. [Google Scholar]
- IEA. Steam Grow Heat Pump/SGH120/KOBELCO Compressors Corporation, Annex 58 High-Temperature Heat Pumps. Available online: https://heatpumpingtechnologies.org/annex58/task1/ (accessed on 9 January 2024).
- Thekdi, A.; Nimbalkar, S.; Sundaramoorthy, S.; Armstrong, K.; Taylor, A.; Gritton, J.; Wenning, T.; Cresko, J. Technology Assessment on Low-Temperature Waste Heat Recovery in Industry; Oak Ridge National Laboratory (ORNL): Oak Ridge, TN, USA, 2021.
Disclaimer/Publisher’s Note: The statements, opinions and data contained in all publications are solely those of the individual author(s) and contributor(s) and not of MDPI and/or the editor(s). MDPI and/or the editor(s) disclaim responsibility for any injury to people or property resulting from any ideas, methods, instructions or products referred to in the content. |
© 2024 by the authors. Licensee MDPI, Basel, Switzerland. This article is an open access article distributed under the terms and conditions of the Creative Commons Attribution (CC BY) license (https://creativecommons.org/licenses/by/4.0/).