

Thermal Performance Design and Analysis of Reversed Brayton Cycle Heat Pumps for High-Temperature Heat Supply
Abstract
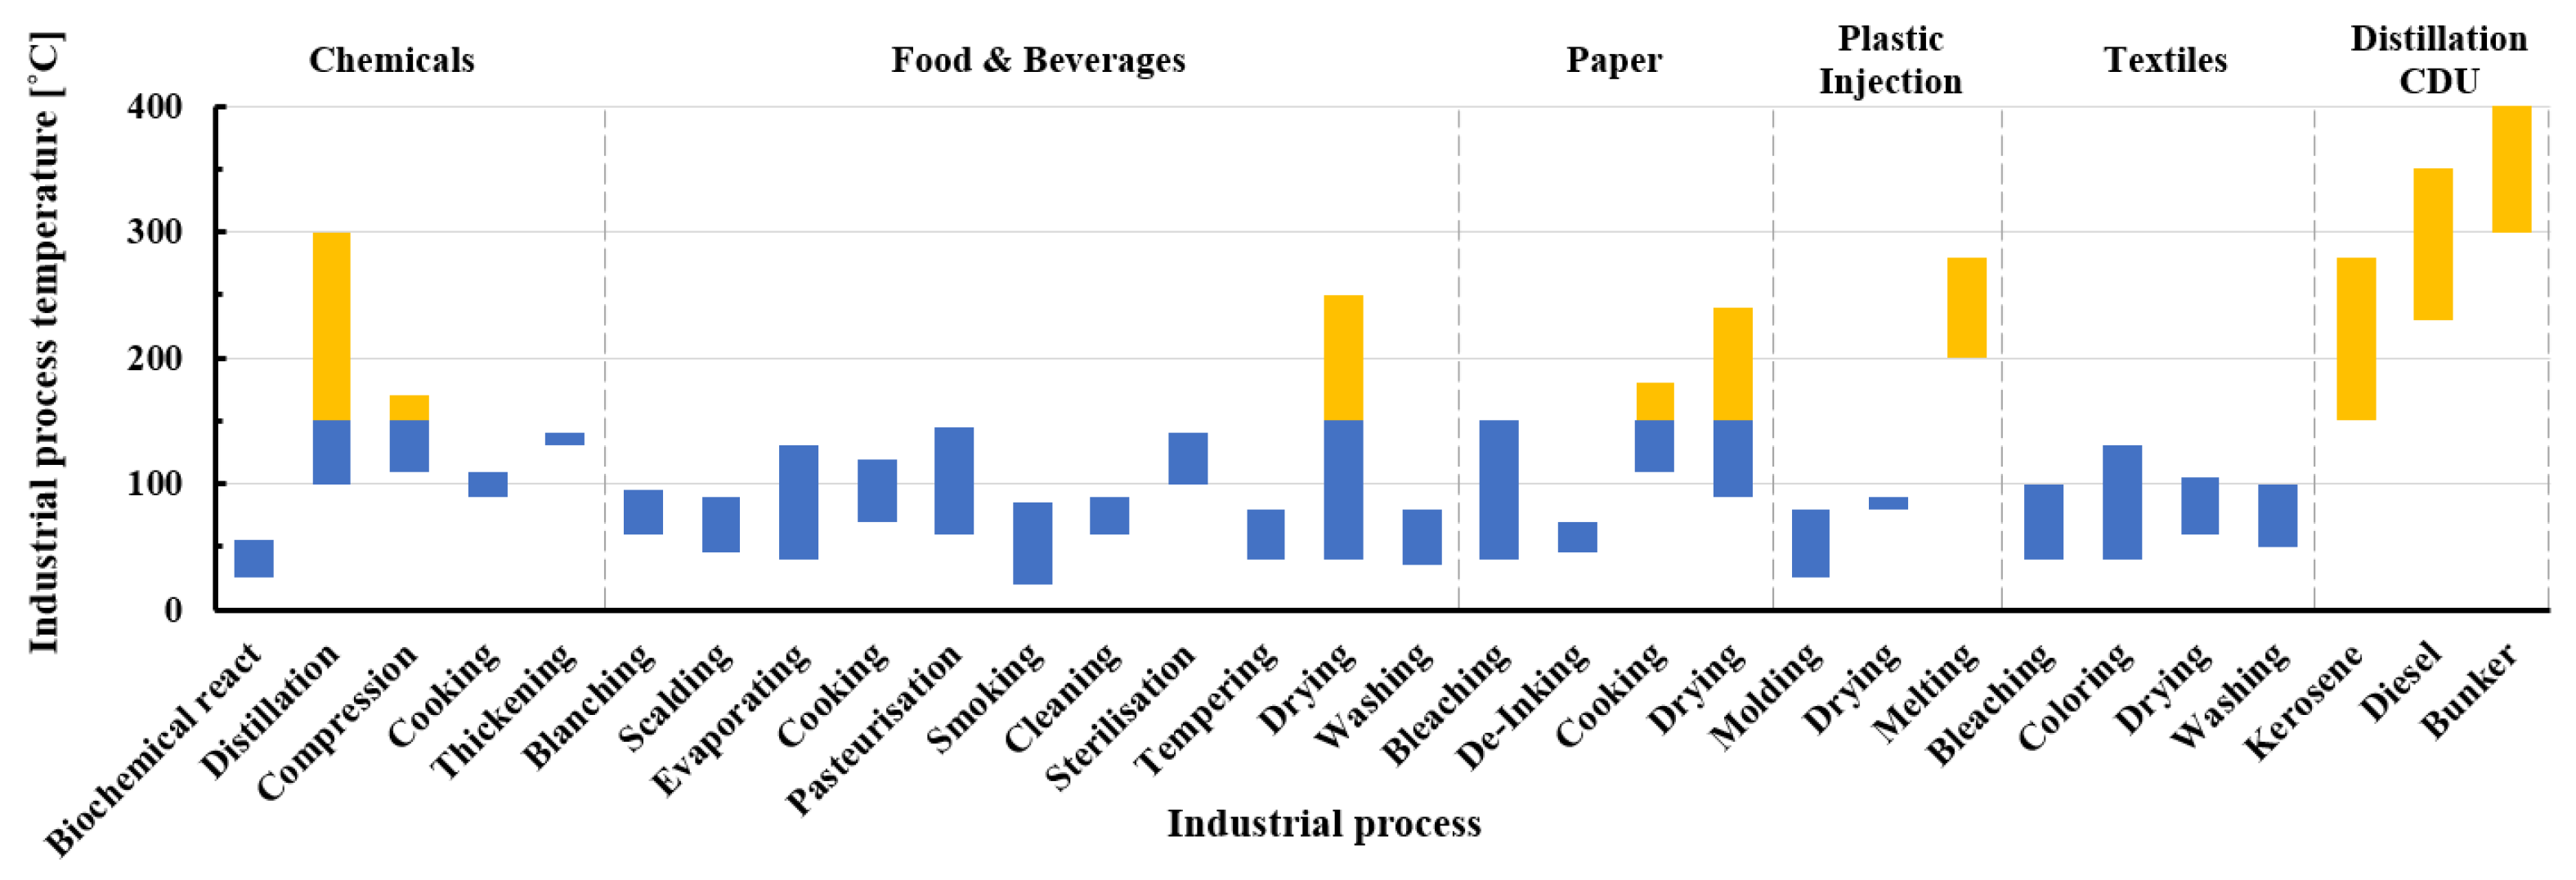
:1. Introduction
2. Thermodynamics of a Reversed Brayton Cycle Heat Pump
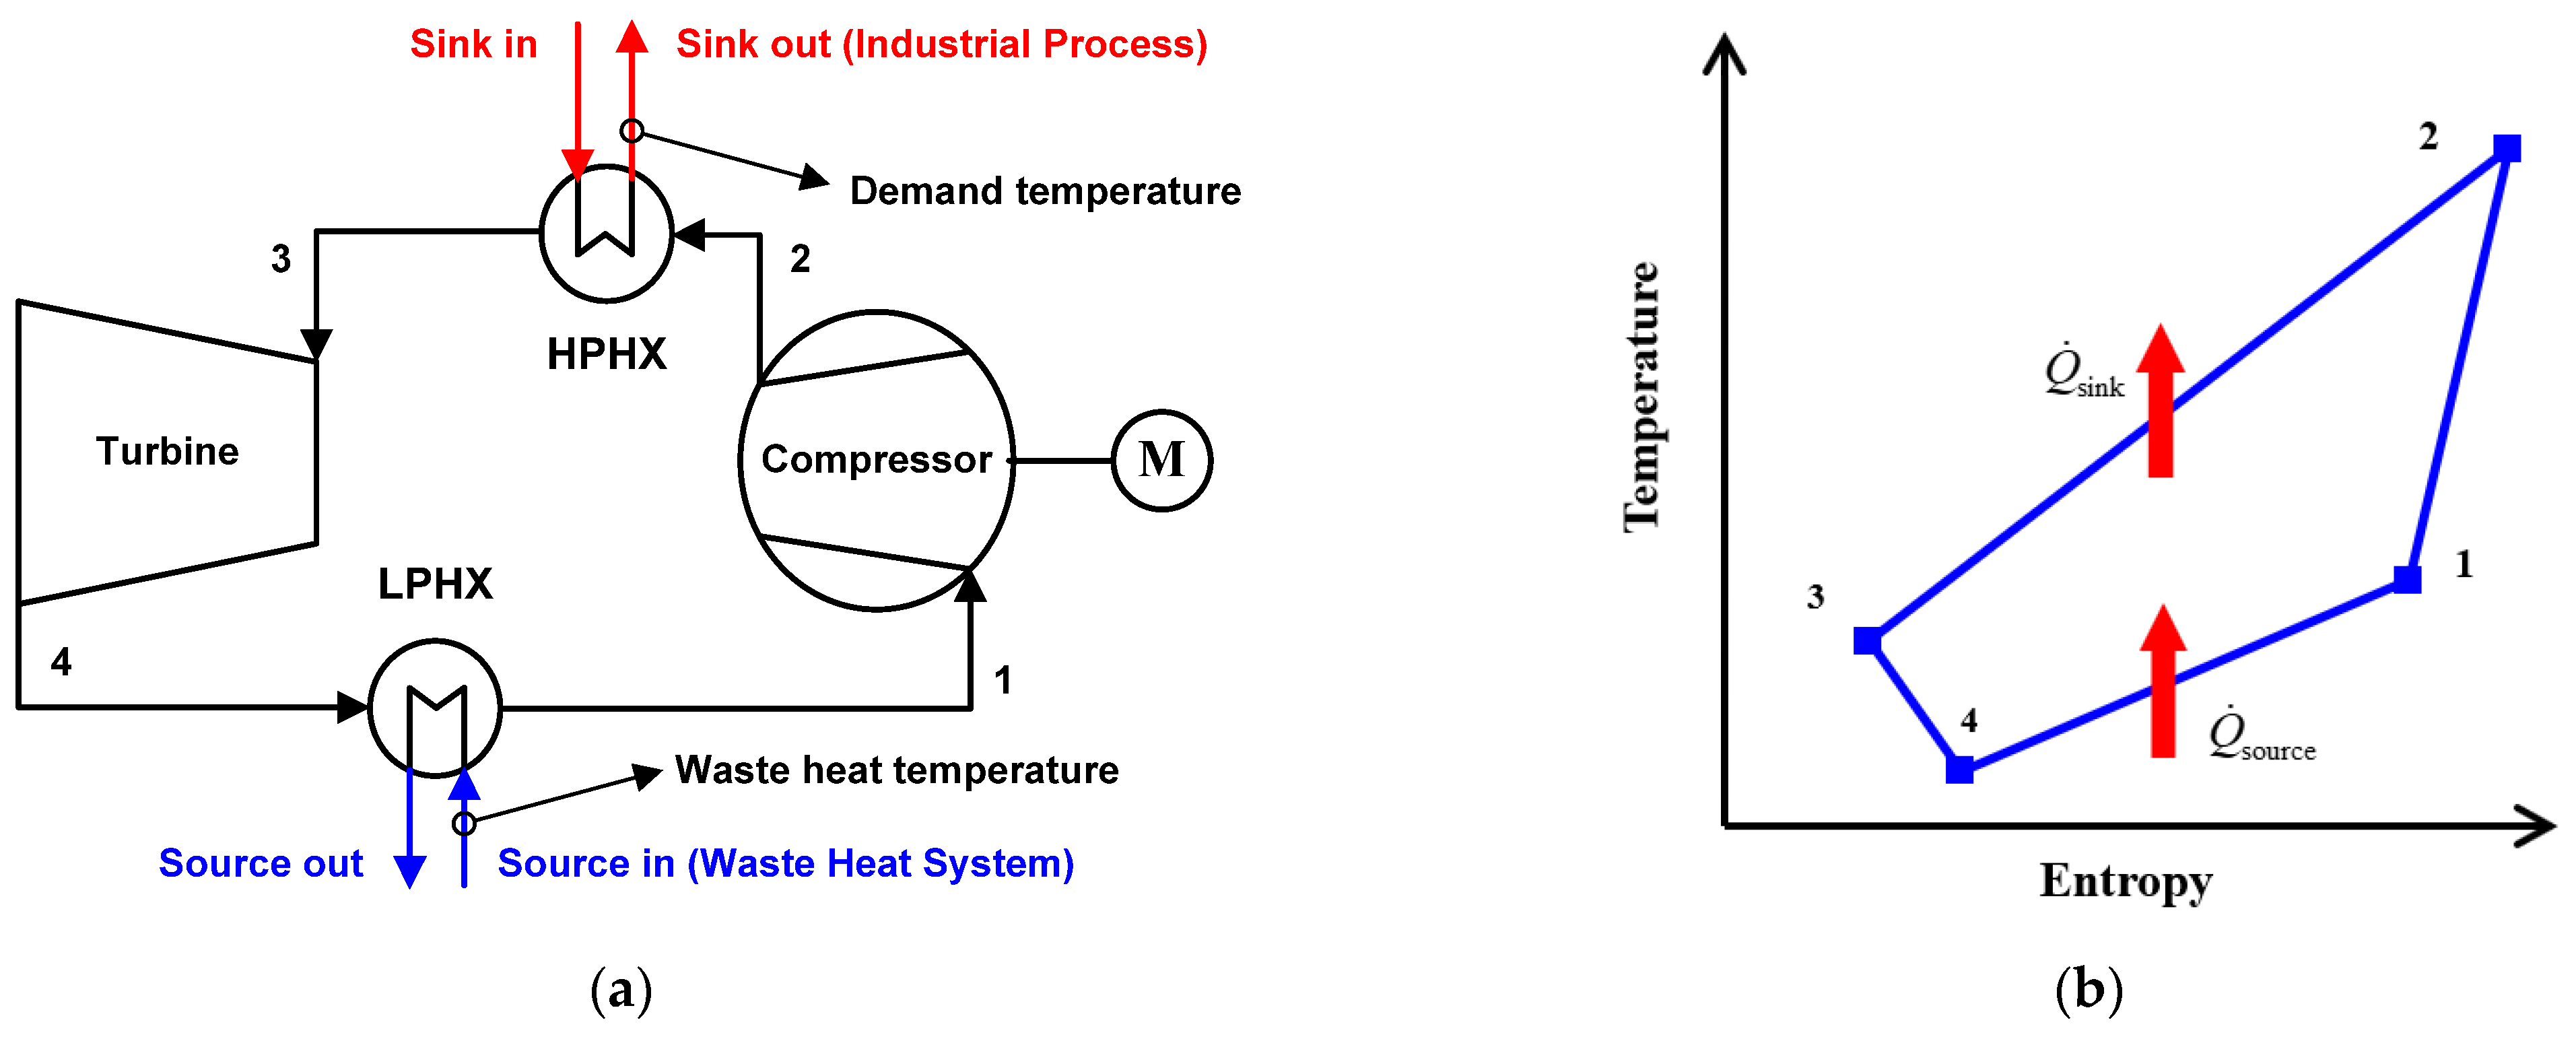
2.1. The Reversed Brayton Process
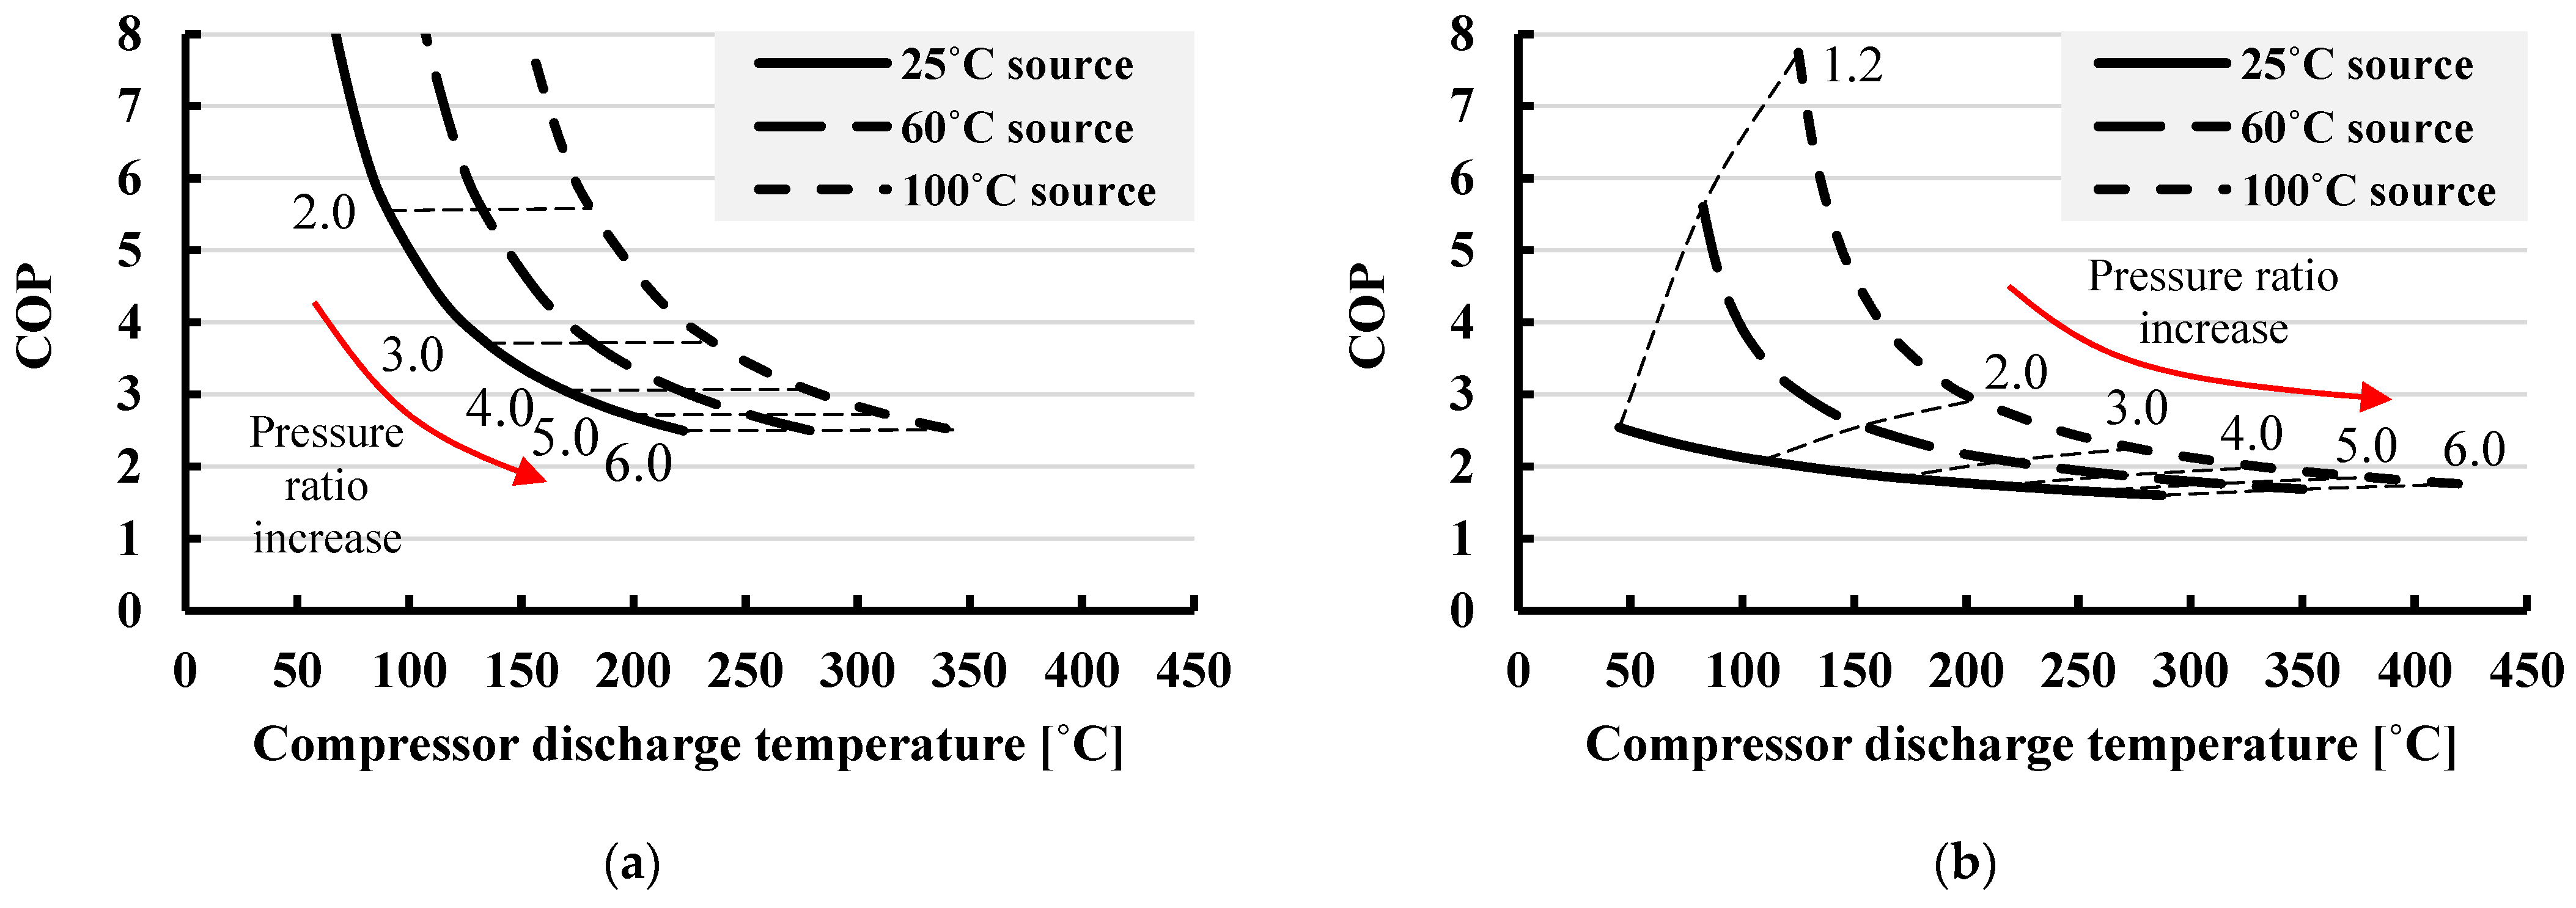
2.2. Performance of the Reversed Brayton Cycle Heat Pump
3. Modeling
3.1. Modeling of a Reversed Brayton Cycle Heat Pump
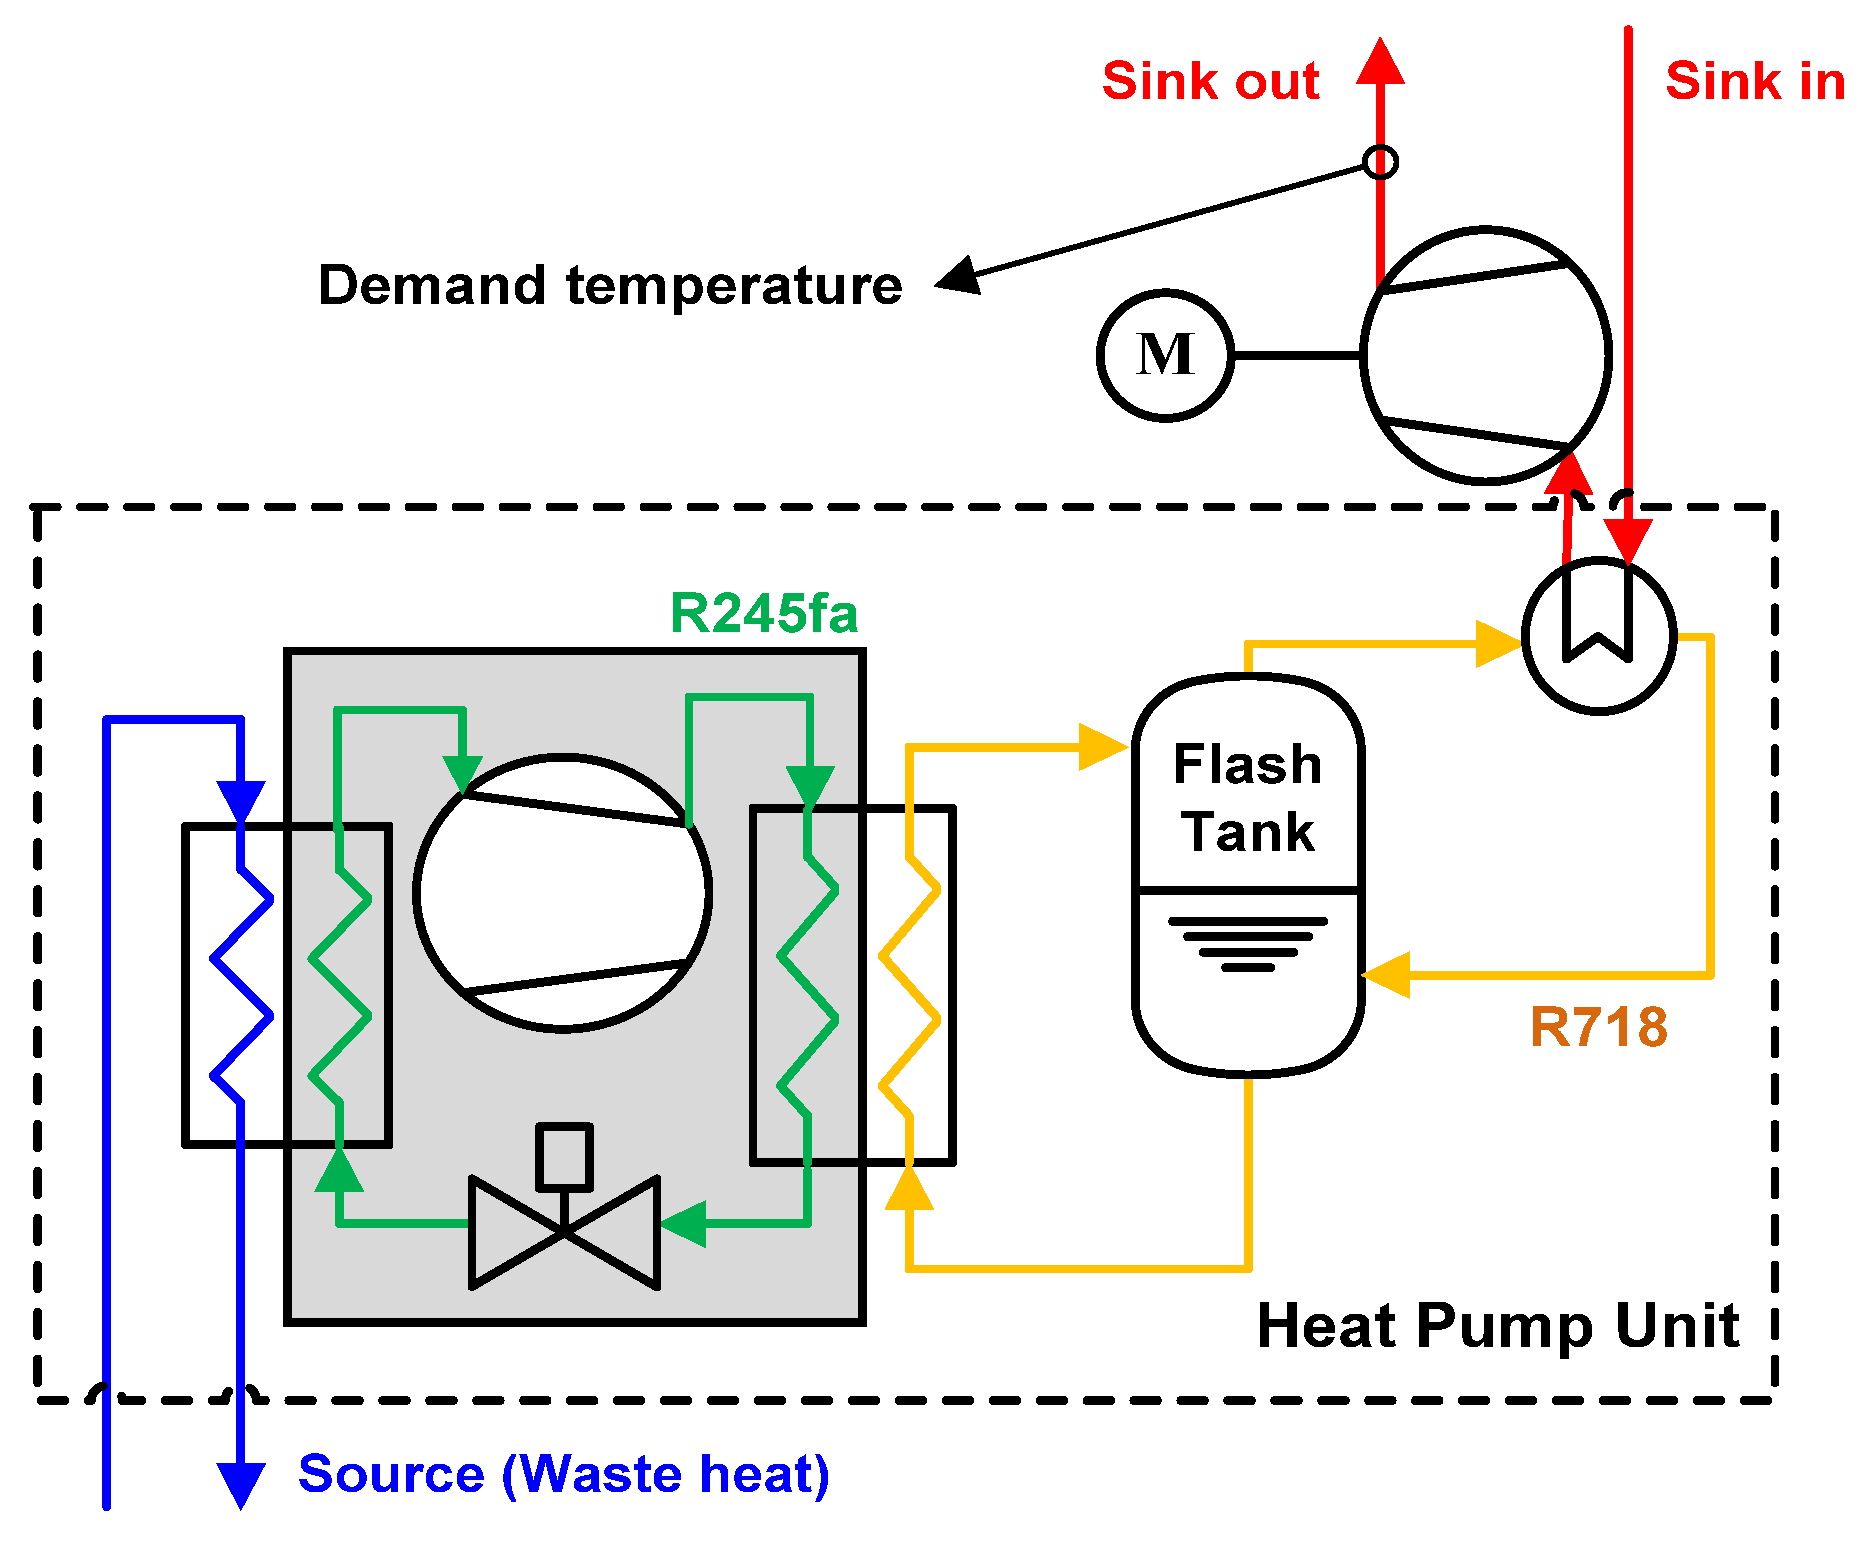
3.2. Modeling of a Vapor Compression Cycle Heat Pump
4. Results and Discussion
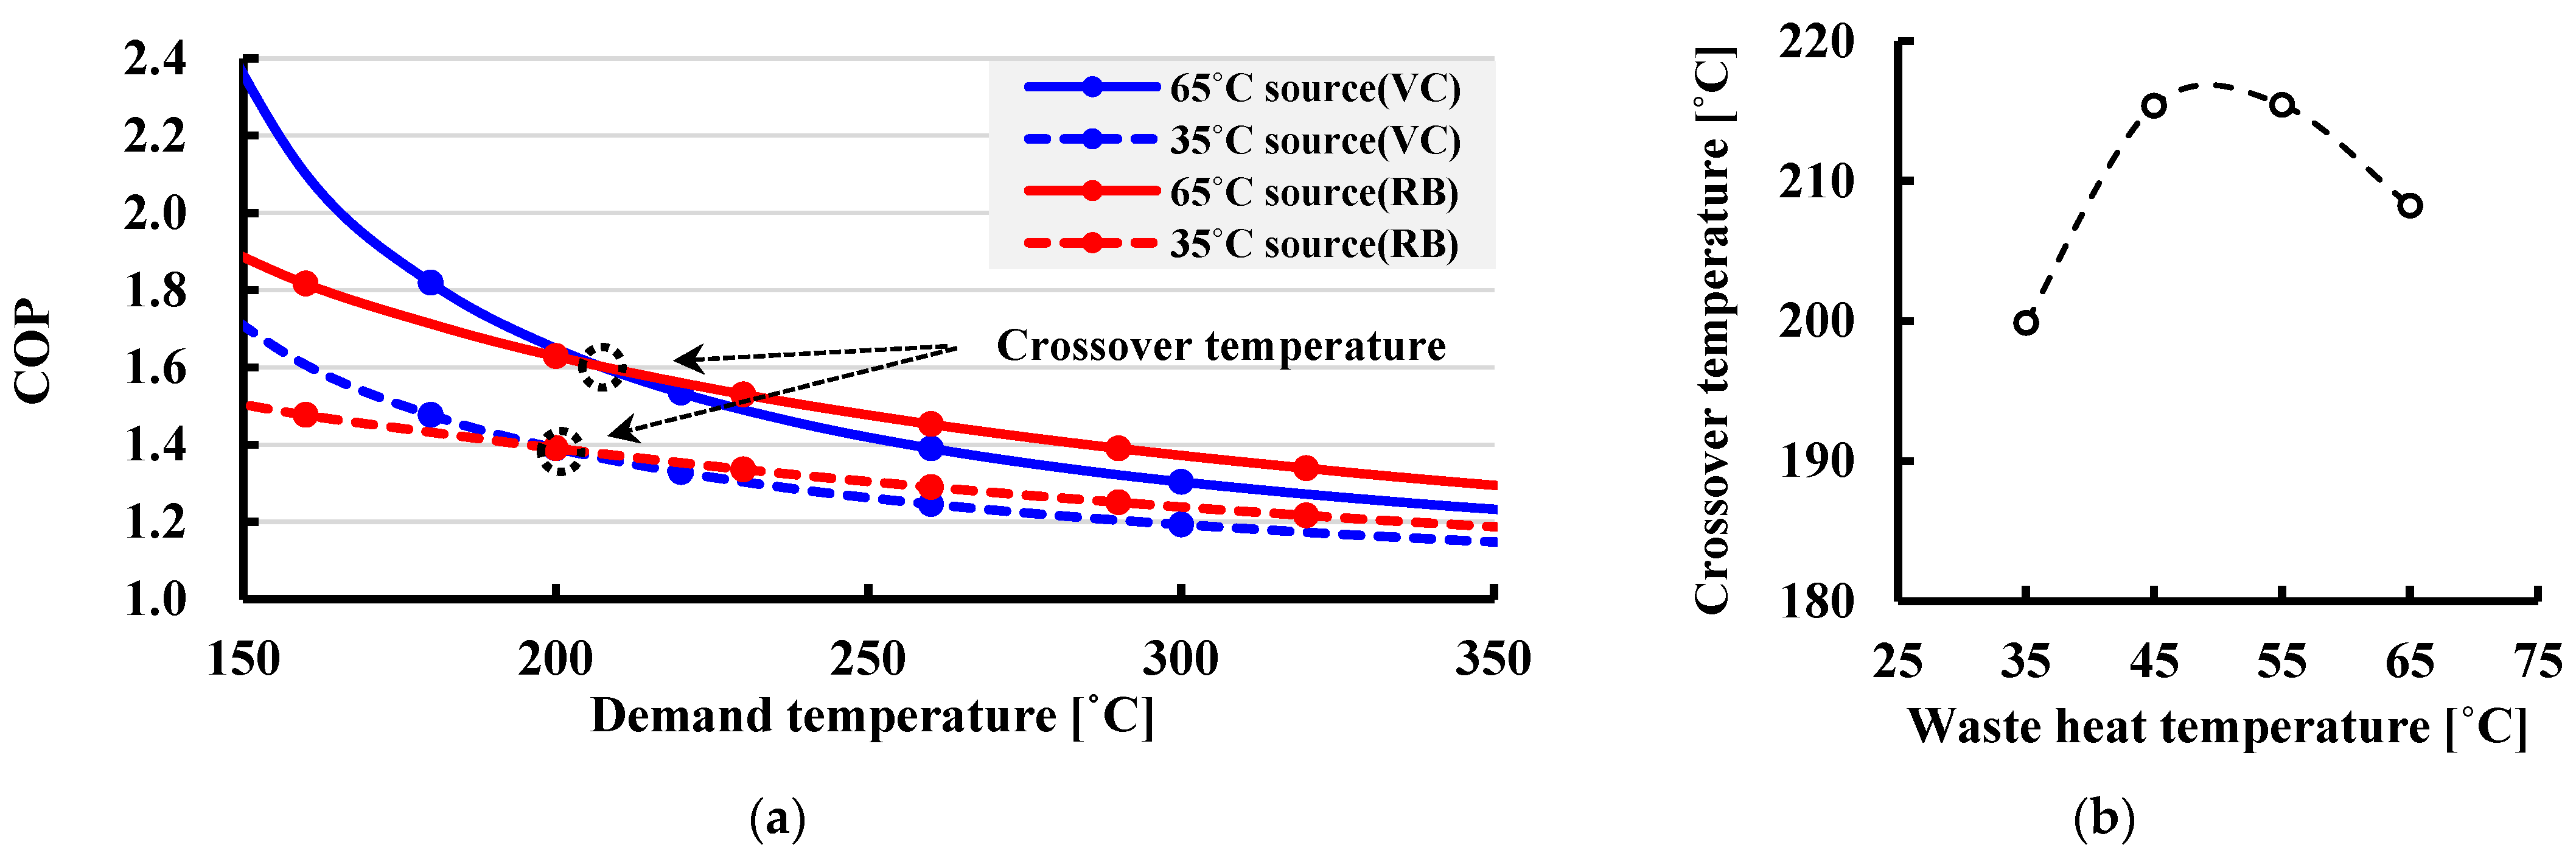
4.1. Comparision between RB and VC Systems
4.2. Analysis of RB Operation under Different Design Conditions
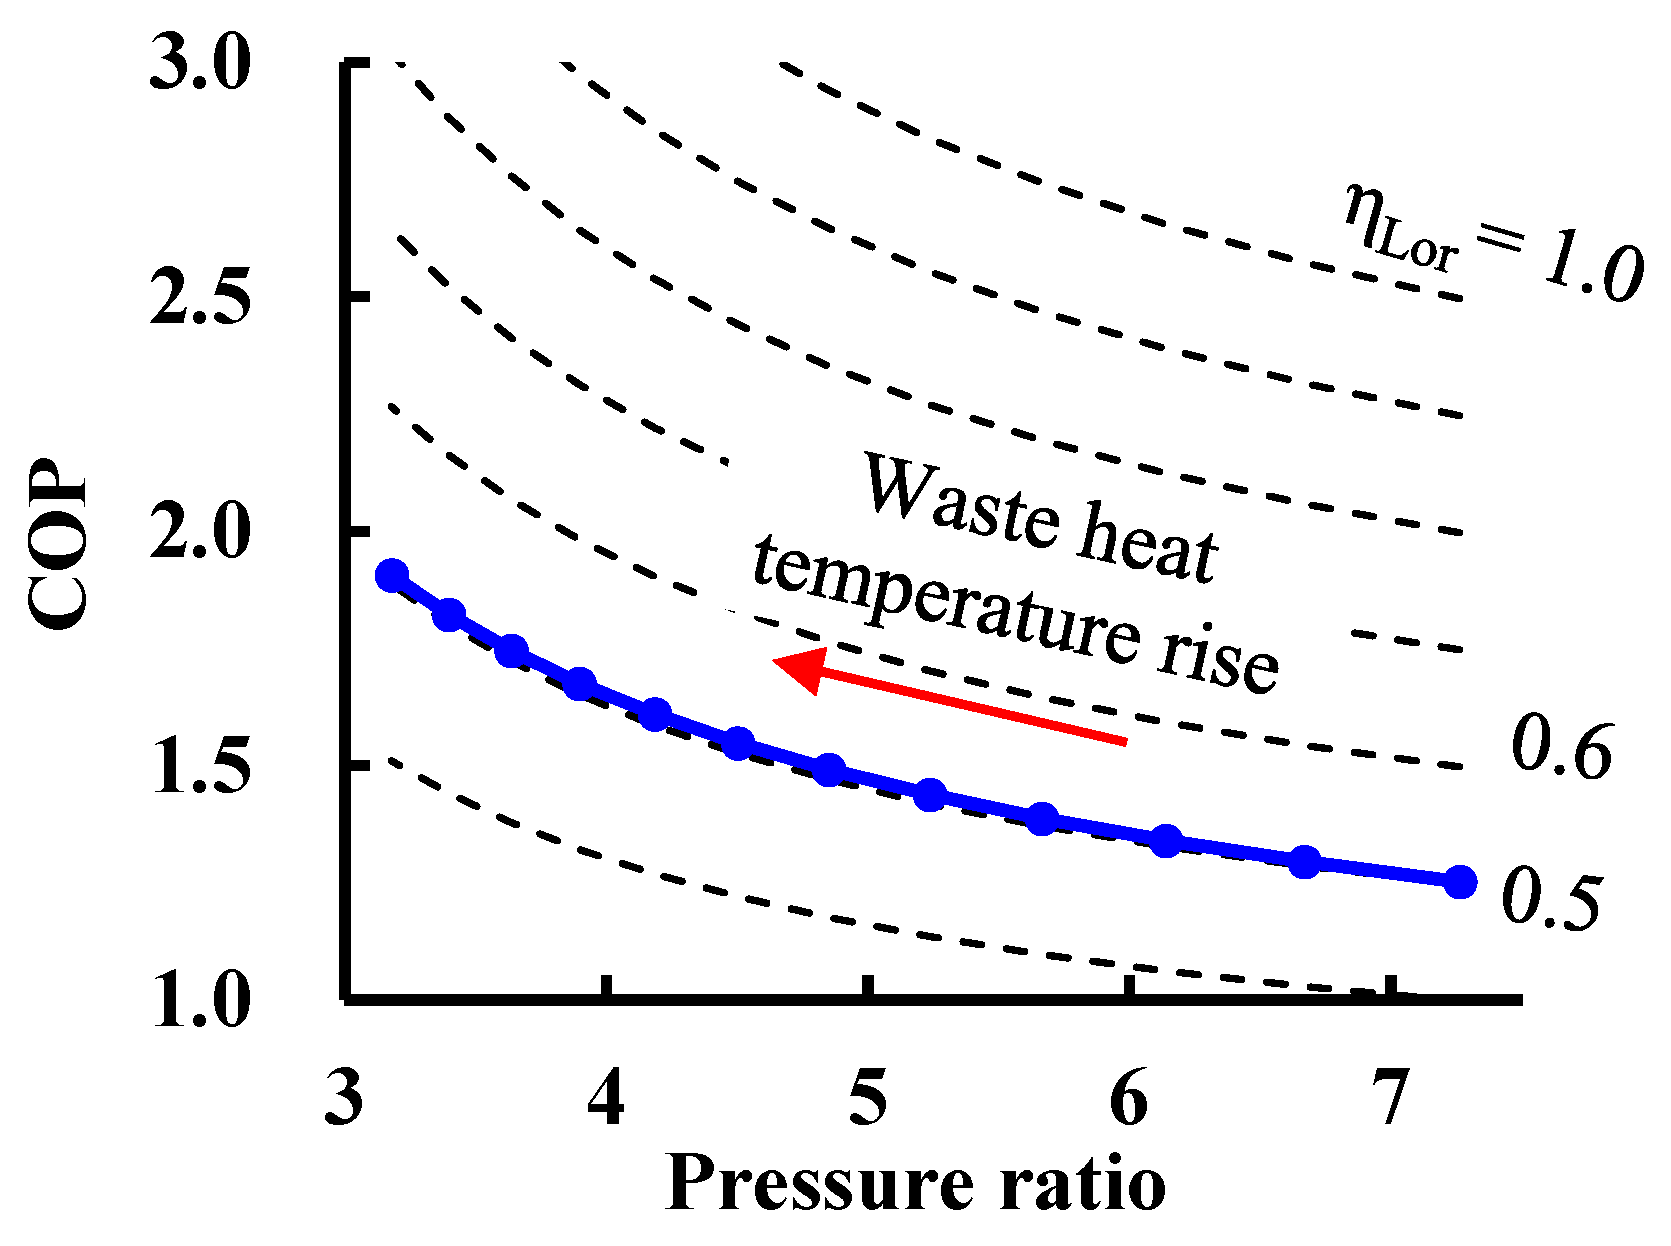
4.2.1. Impact of the Waste Heat Temperature
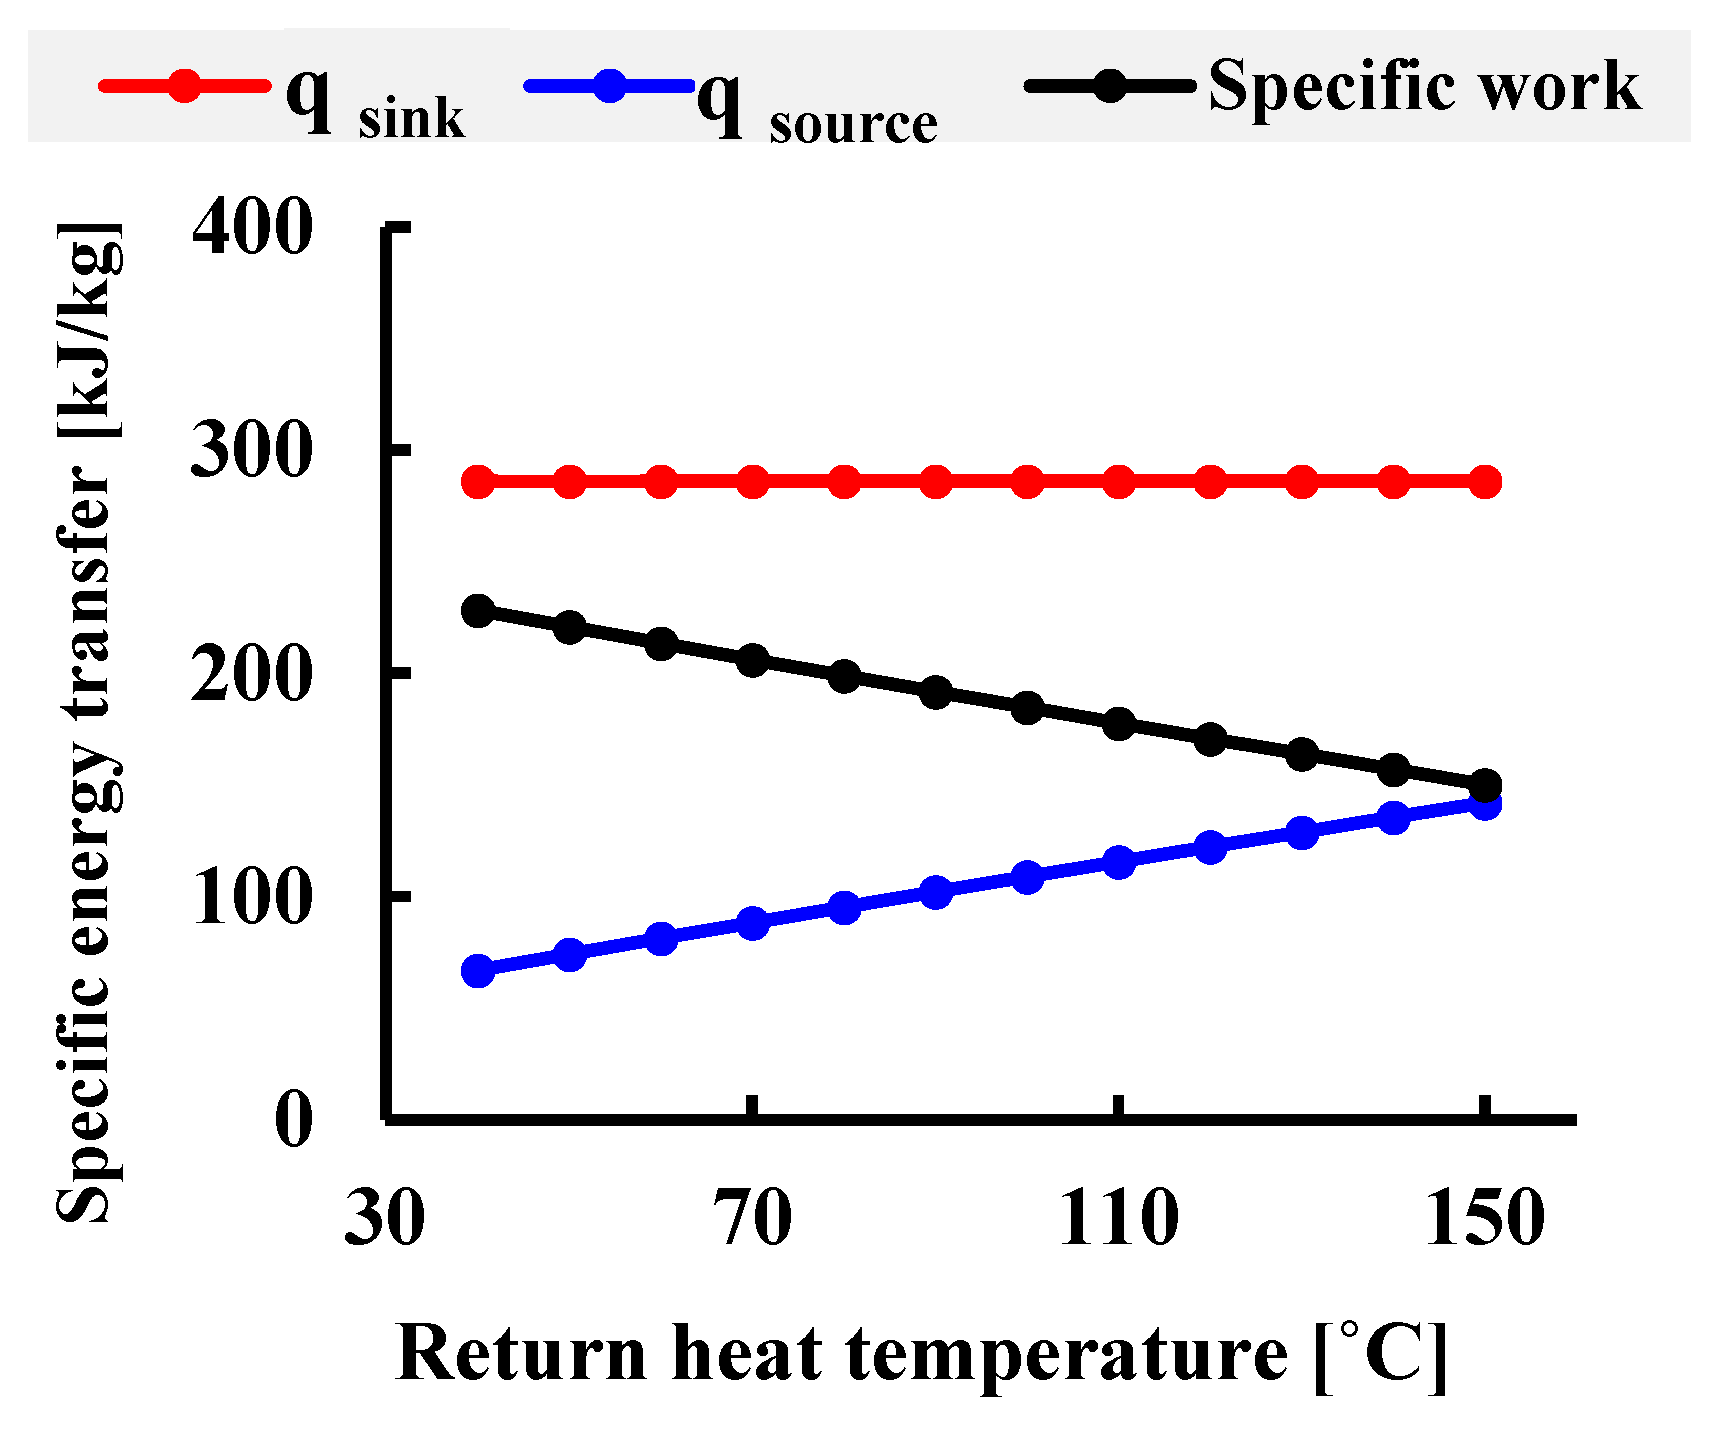
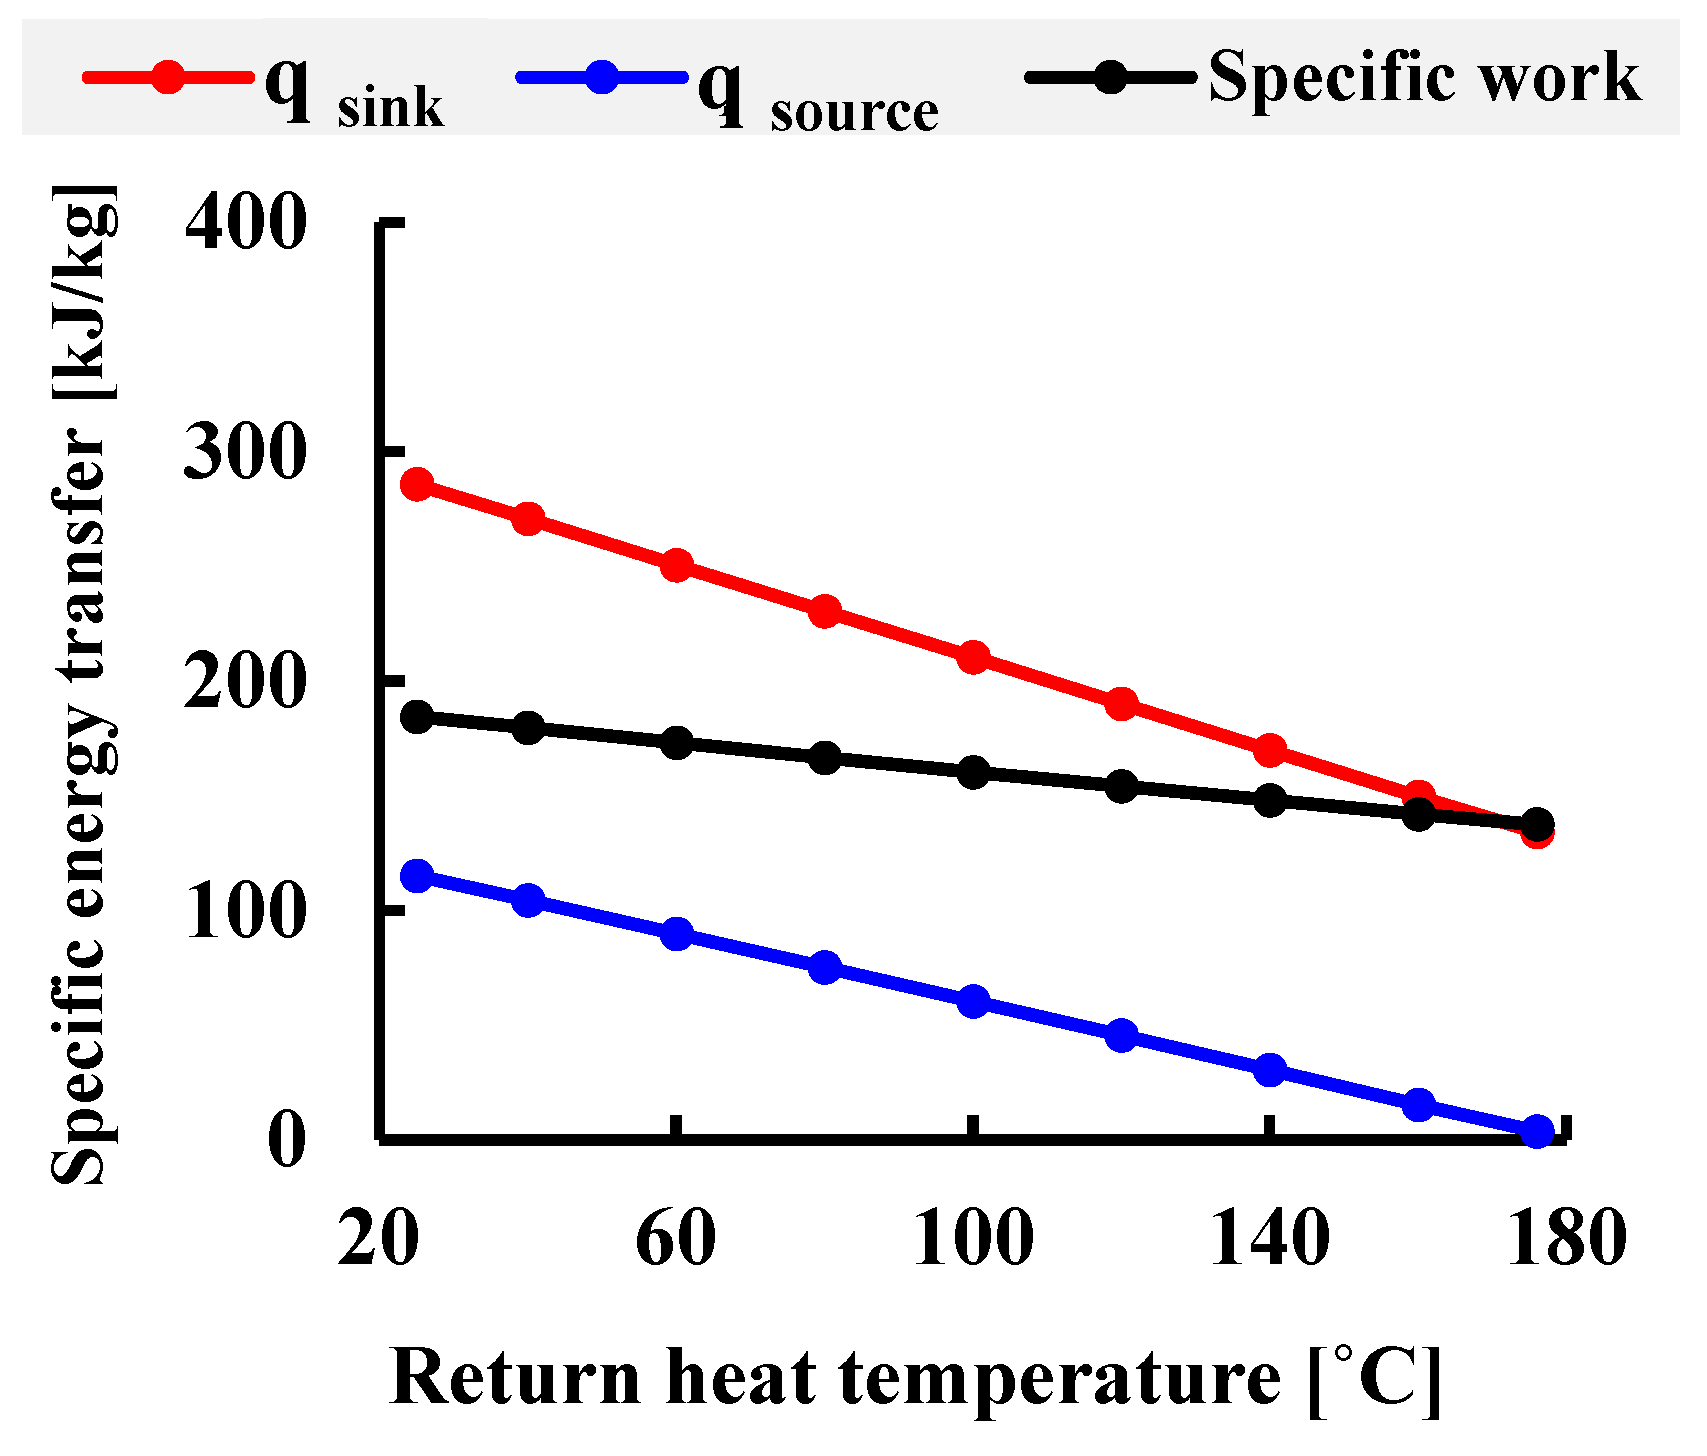
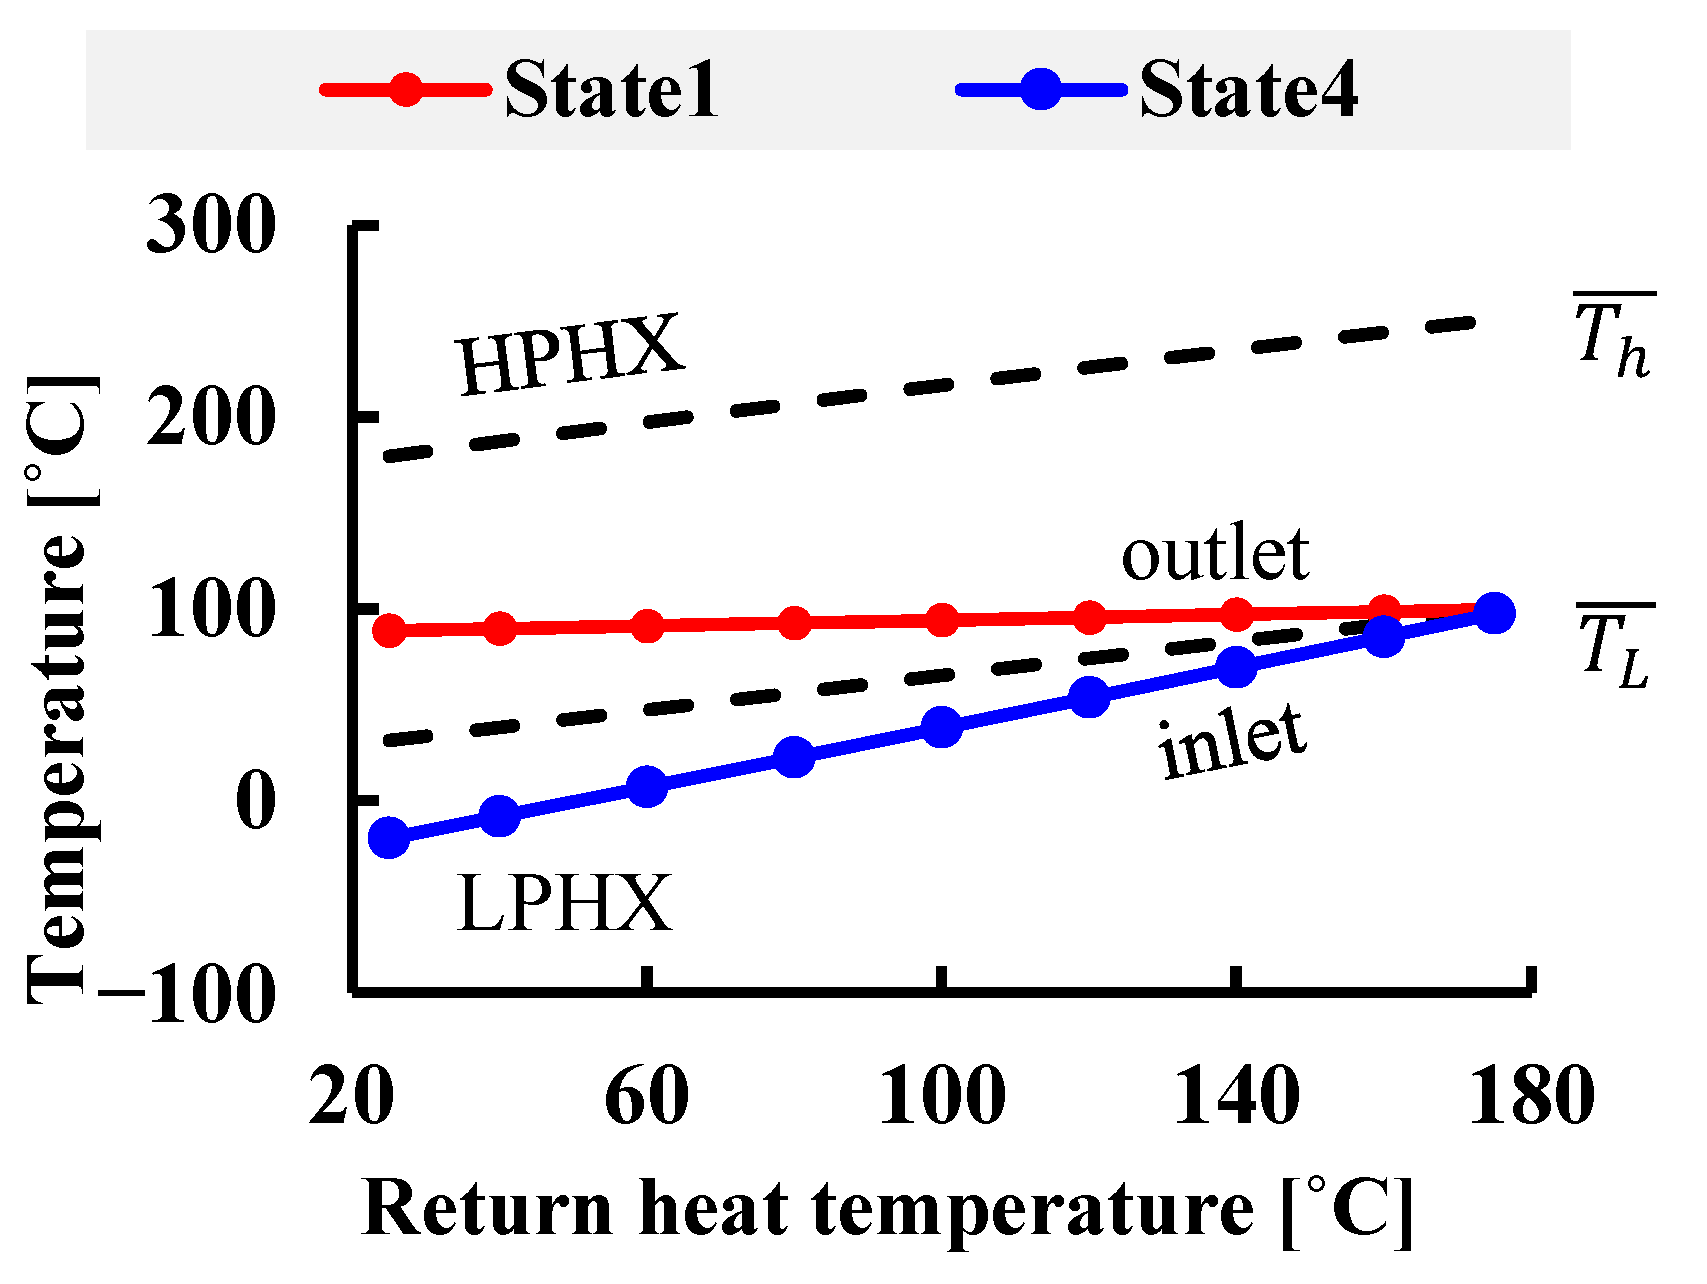
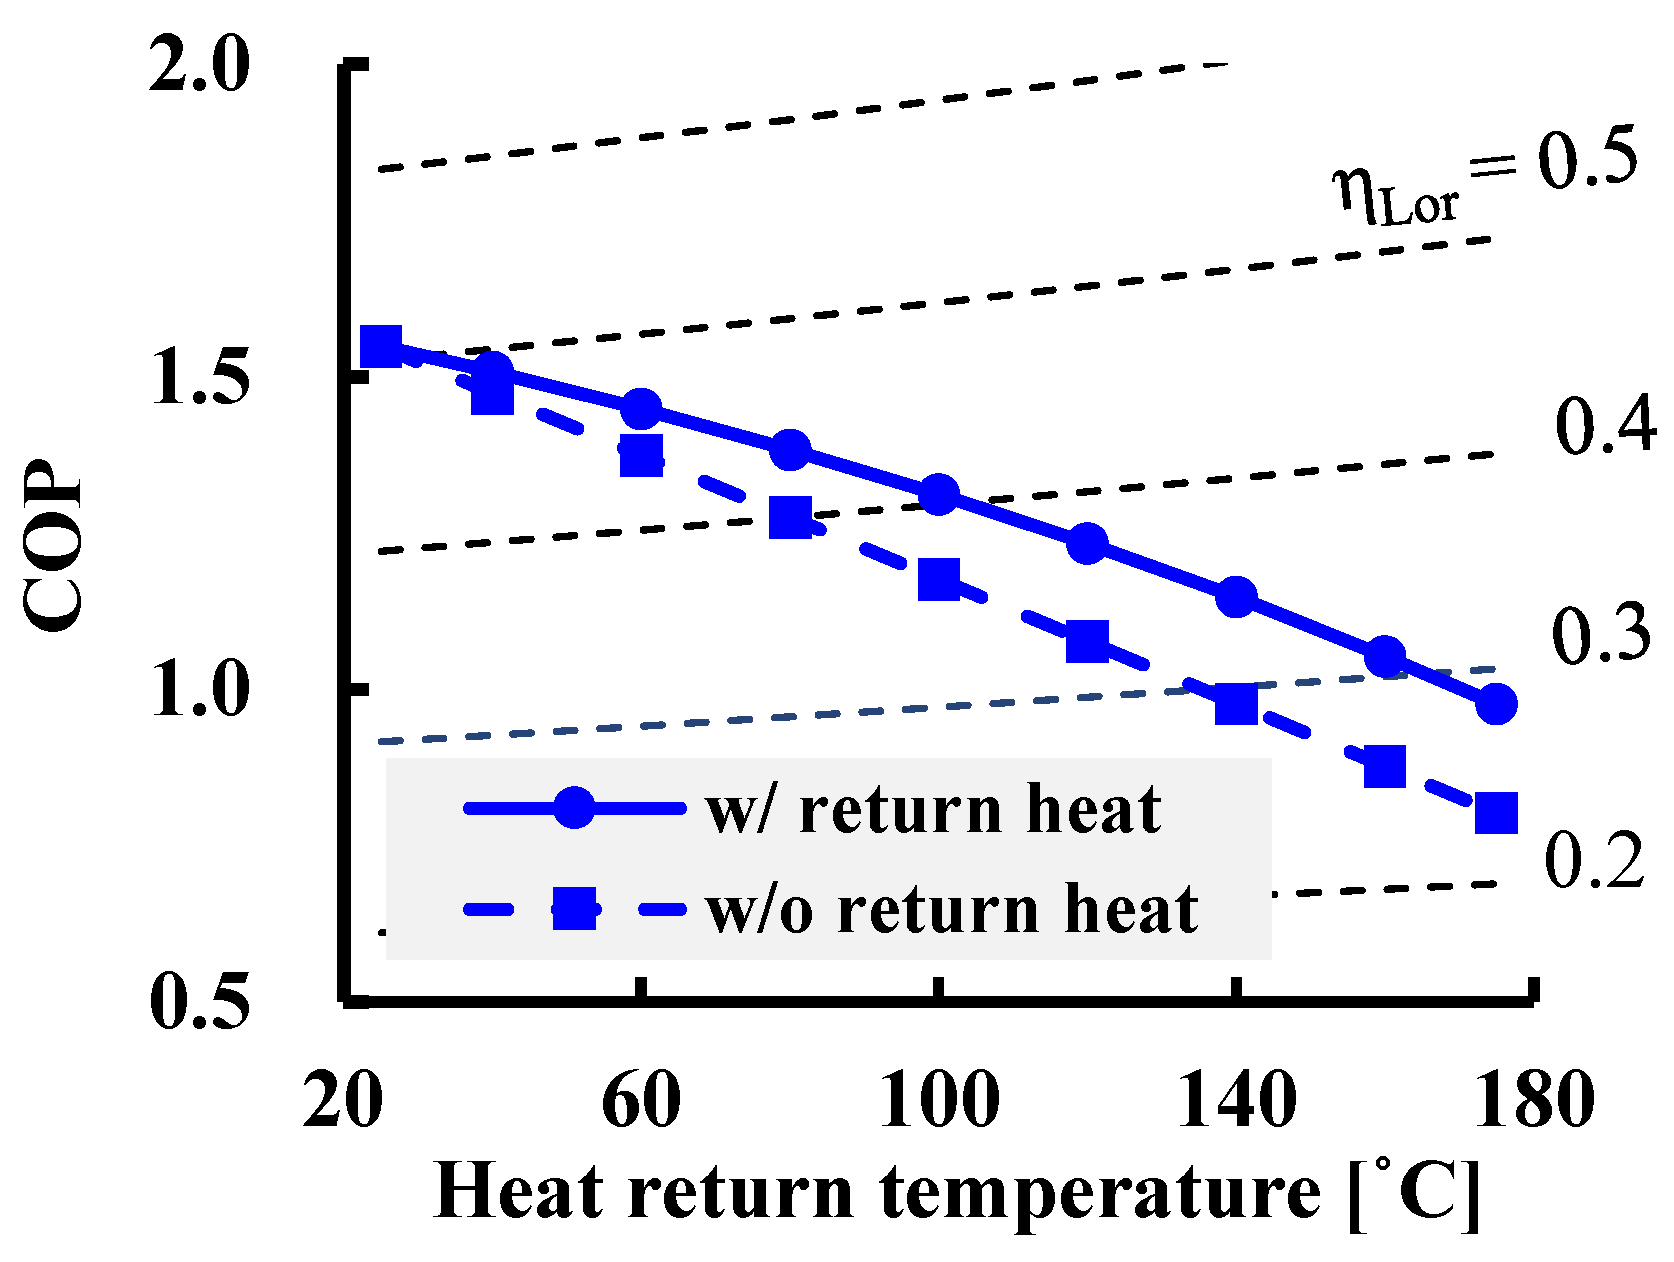
4.2.2. Impact of the Return Heat Temperature
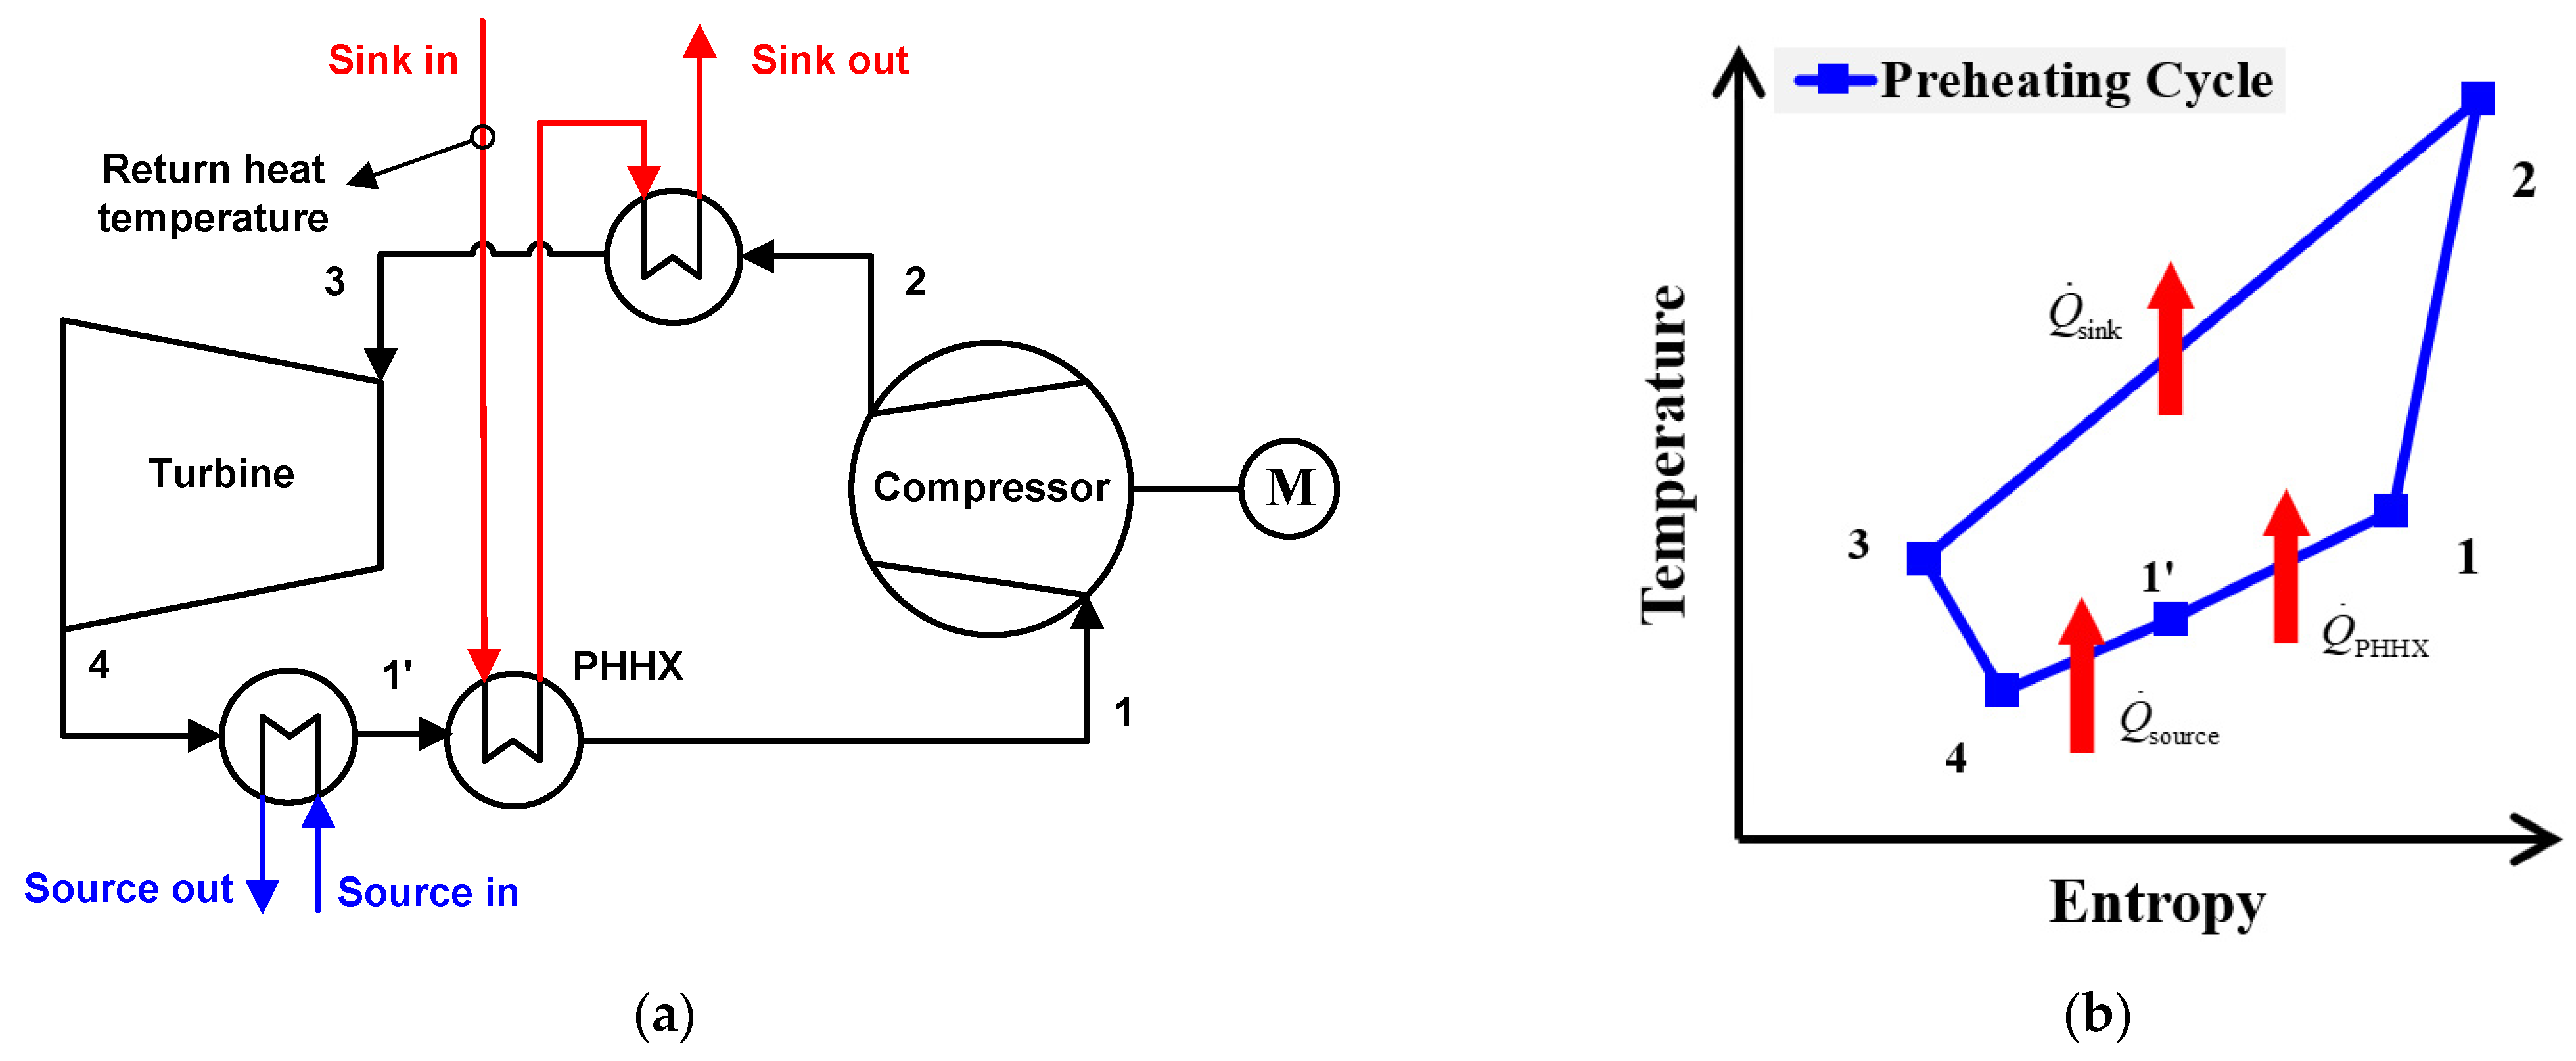
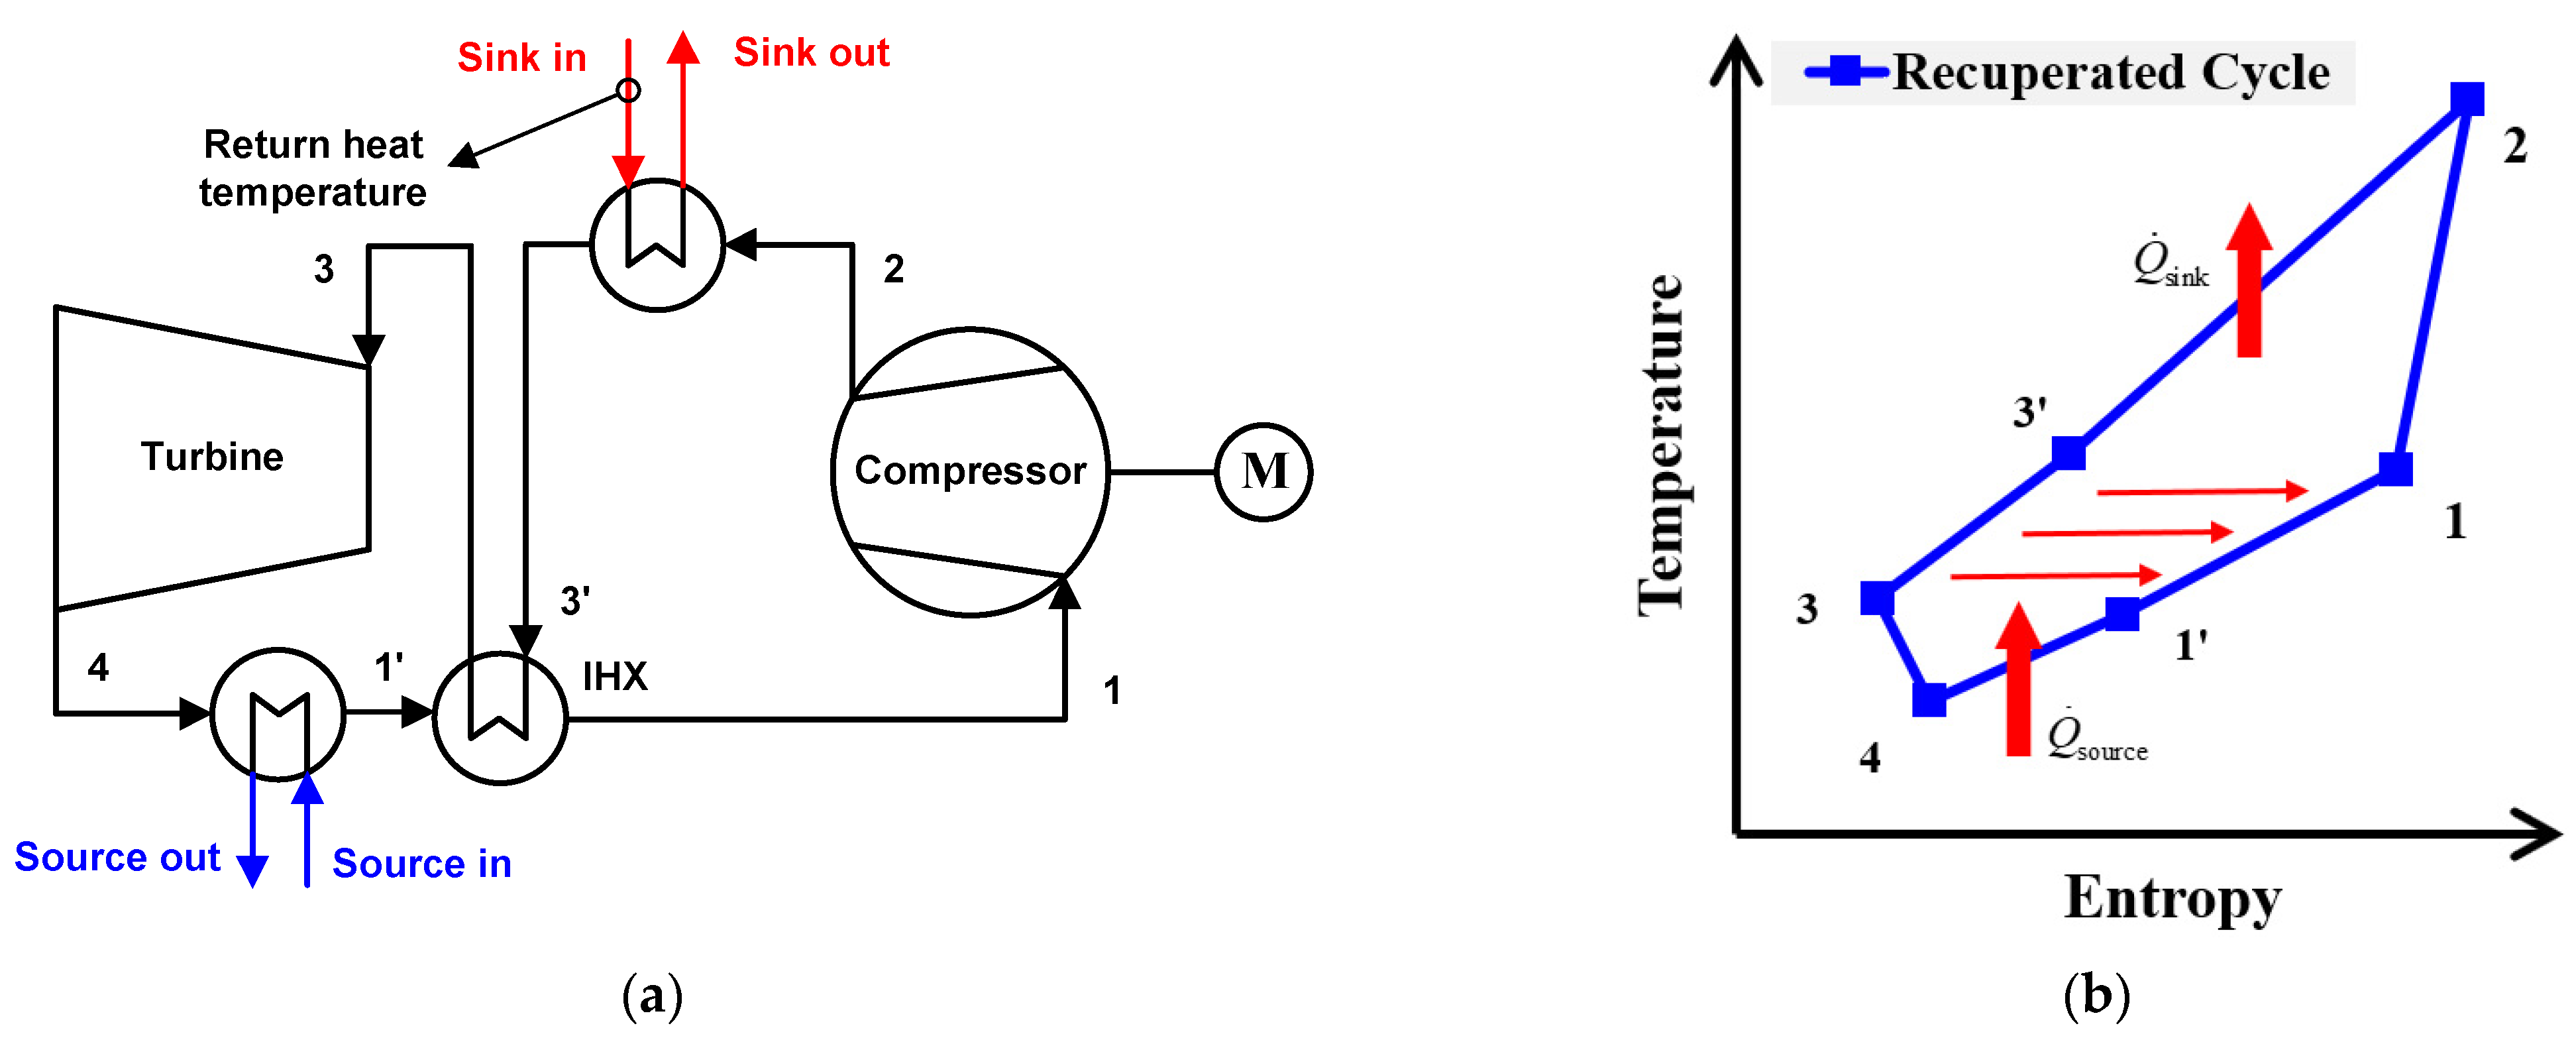
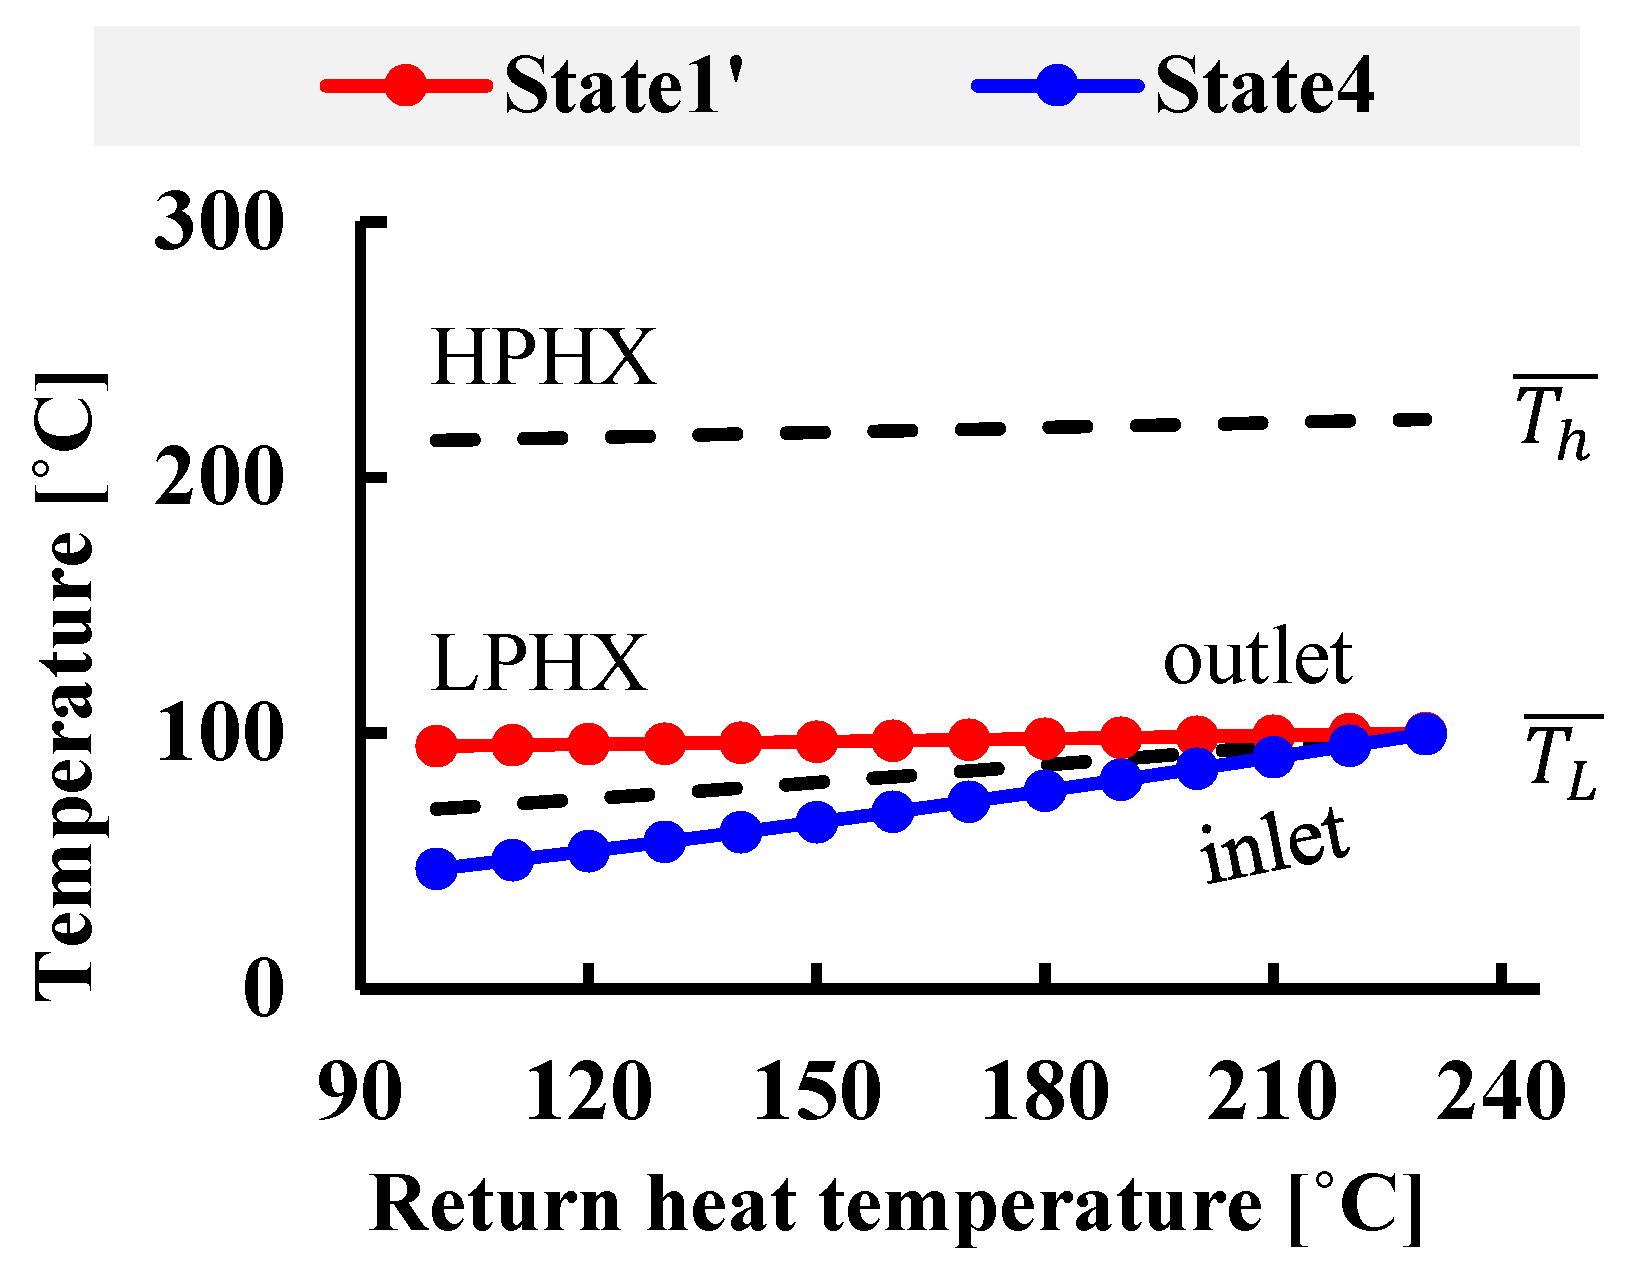
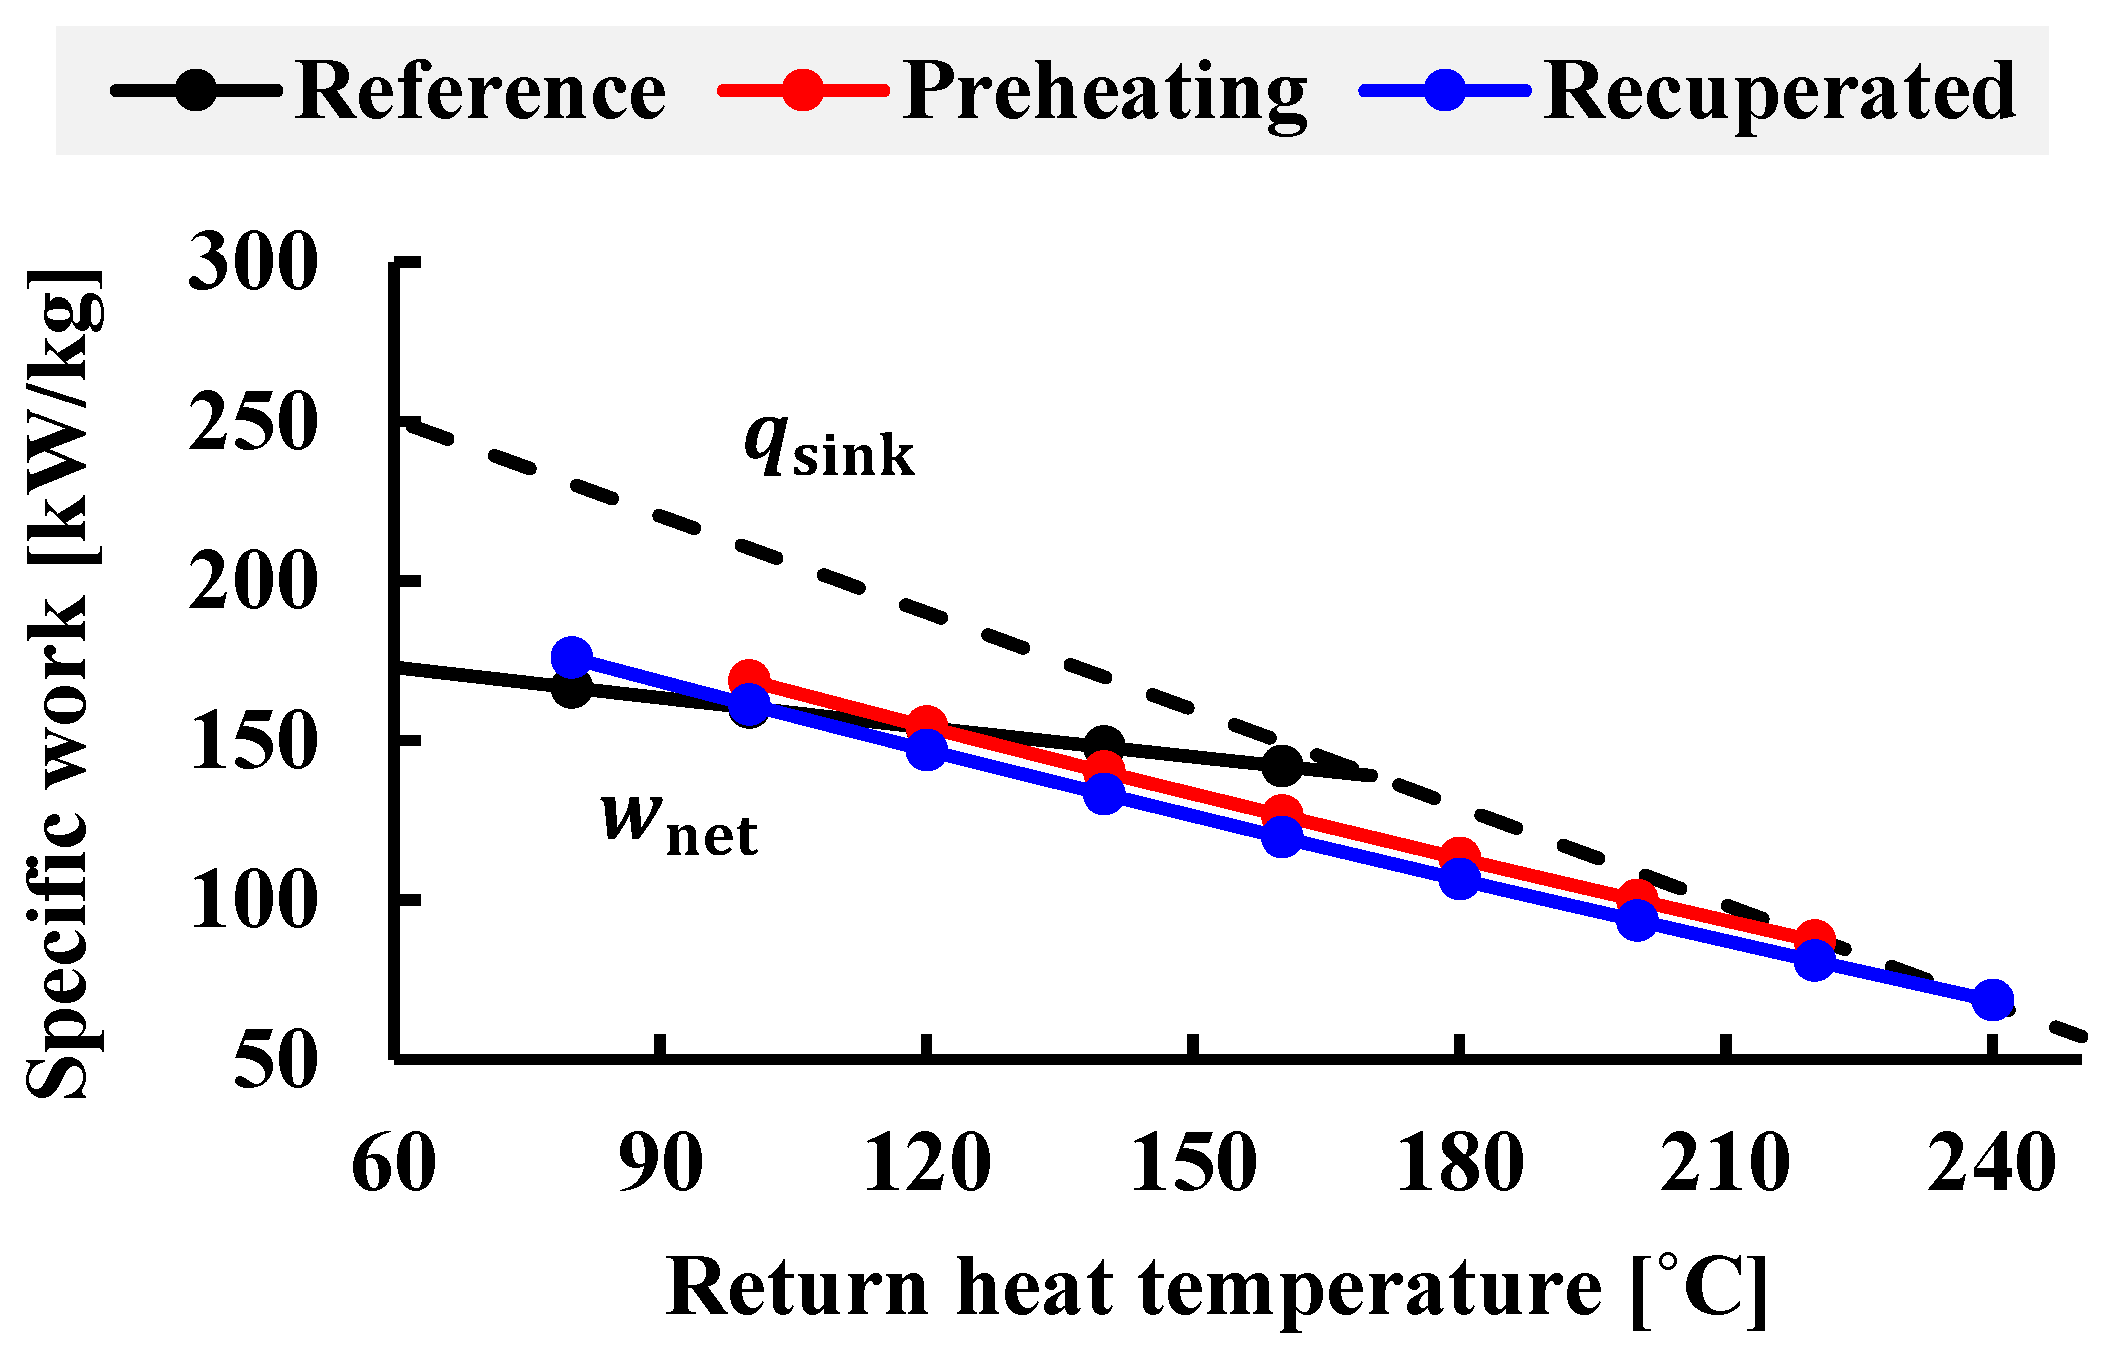
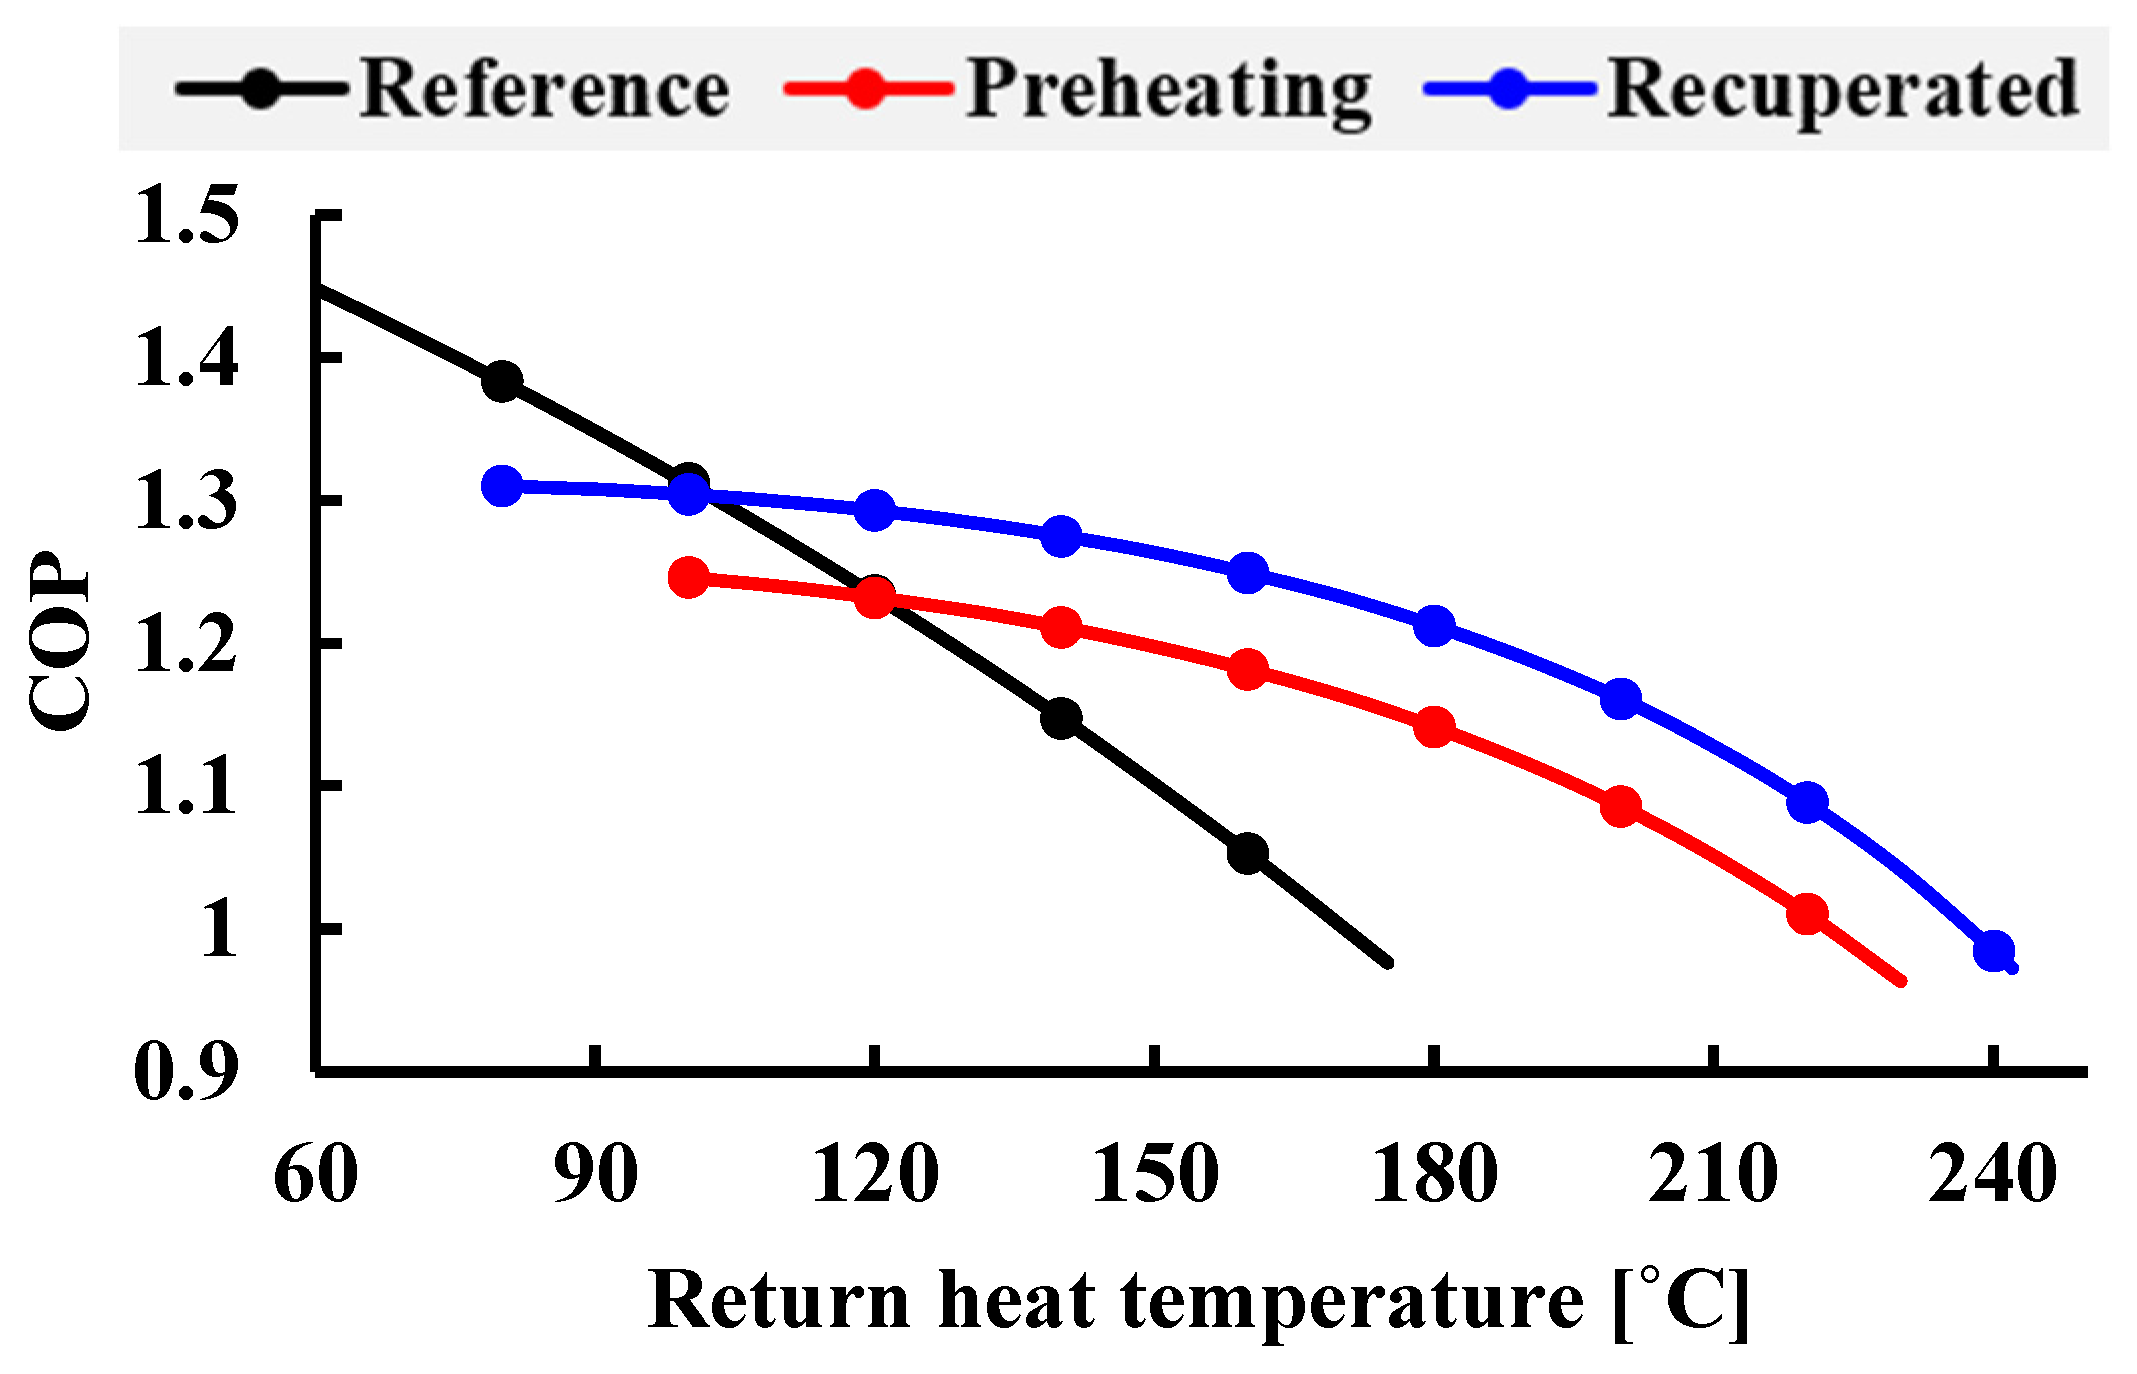
4.2.3. Impact of the System Configuration
5. Conclusions
Author Contributions
Funding
Data Availability Statement
Conflicts of Interest
Nomenclature
| A | Area [m2] |
| Heat capacity rate [W/K] | |
| Heat capacity rate ratio | |
| d | Hydraulic diameter [m] |
| f | Fanning friction factor |
| G | Mass flux [kg/m2-s] |
| h | Specific enthalpy [kJ/kg] |
| L | Passage length [m] |
| Mass flow rate [kg/s] | |
| P | Pressure [kPa] |
| Heat transfer rate [kJ/s] | |
| q | Specific heat transfer rate [kJ/kg] |
| s | Entropy [kJ/kg-K] |
| T | Temperature [K] |
| Log mean temperature [K] | |
| U | Overall heat transfer coefficient [W/m2-K] |
| Power consumption, work [kW] | |
| w | Specific power consumption, specific work [kJ/kg] |
| Greek | |
| Effectiveness | |
| Density [kg/m3] | |
| Efficiency | |
| Subscripts | |
| comp | Compressor |
| ex | Exit |
| HP | Heat pump |
| in | Inlet |
| ideal | Ideal |
| Lor | Lorentz |
| loss | Loss |
| max | Maximum |
| mech | Mechanical |
| min | Minimum |
| motor | Motor |
| net | Net |
| poly | Polytropic process |
| sink | Heat sink |
| source | Heat source |
| subC | Sub-compressor for mechanical vapor recompression |
| turb | Turbine |
Abbreviations
| COP | Coefficient of performance |
| HPHX | High-pressure heat exchanger |
| HX | Heat exchanger |
| IHX | Internal heat exchanger for recuperated cycle |
| LPHX | Low-pressure heat exchanger |
| M | Motor |
| MVR | Mechanical vapor recompression cycle |
| NTU | Number of transfer units |
| PHHX | Preheating heat exchanger for preheating cycle |
| RB | Reversed Brayton cycle |
| VC | Vapor compression cycle |
References
- BloombergNEF. Hot Spots for Renewable Heat Decarbonizing Low-to Medium-Temperature Industrial Heat across the G-20; WBCSD: Amsterdam, The Netherlands, 13 September 2021. [Google Scholar]
- IEA. World Energy Outlook 2023. 2023. Available online: https://www.iea.org/reports/world-energy-outlook-2023 (accessed on 25 February 2024).
- Wolf, S.; Lambauer, J.; Fahl, U.; Blesl, M.; Voss, A. Industrial Heat Pumps in Germany—Potentials, Technological Development and Application Examples. In Proceedings of the ECEEE 2012 Summer Study—Energy Efficiency in Industry 2012, Arnhem, The Netherlands, 11–14 September 2012. [Google Scholar]
- Lauterbach, C.; Schmitt, B.; Jordan, U.; Vajen, K. The Potential of Solar Heat for Industrial Processes in Germany. Renew. Sustain. Energy Rev. 2012, 16, 5121–5130. [Google Scholar] [CrossRef]
- Jiang, J.; Hu, B.; Wang, R.Z.; Deng, N.; Cao, F.; Wang, C.C. A Review and Perspective on Industry High-Temperature Heat Pumps. Renew. Sustain. Energy Rev. 2022, 161, 112106. [Google Scholar] [CrossRef]
- Arpagaus, C.; Bless, F.; Uhlmann, M.; Schiffmann, J.; Bertsch, S.S. High Temperature Heat Pumps: Market Overview, State of the Art, Research Status. Refrig. Appl. Potentials Energy 2018, 152, 985–1010. [Google Scholar]
- Yu, Y.; Chen, H.; Chen, L.; Chen, C.; Wu, J. Optimal Operation of the Combined Heat and Power System Equipped with Power-to-Heat Devices for the Improvement of Wind Energy Utilization. Energy Sci. Eng. 2019, 7, 1605–1620. [Google Scholar] [CrossRef]
- Marina, A.; Spoelstra, S.; Zondag, H.A.; Wemmers, A.K. An Estimation of the European Industrial Heat Pump Market Potential. Renew. Sustain. Energy Rev. 2021, 139, 110545. [Google Scholar] [CrossRef]
- Kabeyi, M.J.B.; Olanrewaju, O.A. Sustainable Energy Transition for Renewable and Low Carbon Grid Electricity Generation and Supply. Front. Energy Res. 2022, 9, 743114. [Google Scholar] [CrossRef]
- Toleikyte, A.; Roca Reina, J.C.; Volt, J.; Carlsson, J.; Lyons, L.; Gasparella, A.; Koolen, D.; De Felice, M.; Tarvydas, D.; Czako, V.; et al. The Heat Pump Wave Opportunities and Challenges: Analysis of the Largescale Deployment of Heat Pumps by 2030 Following the REPowerEU Plan; Publications Office of the European Union: Luxembourg, 2023; ISBN 9789268048702. [Google Scholar]
- IEA. The Future of Heat Pumps; IEA: Paris, France, 2022; Available online: https://www.iea.org/reports/the-future-of-heat-pumps (accessed on 25 February 2024).
- Jakobs, R.M.; Stadtlander, C. Final Report Annex 48: Industrial Heat Pumps, Second Phase; IEA: Paris, France, 2020; ISBN 9789189167032. Available online: https://heatpumpingtechnologies.org/publications/hybrid-heat-pumps-final-report/ (accessed on 9 January 2024).
- Zühlsdorf, B. High-Temperature Heat Pumps Task 1-Technologies Task Report Operating Agent; IEA: Paris, France, 2023; ISBN 9789189821347. Available online: https://heatpumpingtechnologies.org/annex58/ (accessed on 9 January 2024).
- Zühlsdorf, B.; Bühler, F.; Bantle, M.; Elmegaard, B. Analysis of Technologies and Potentials for Heat Pump-Based Process Heat Supply above 150 °C. Energy Convers. Manag. X 2019, 2, 100011. [Google Scholar] [CrossRef]
- Huang, R.; Hu, B.; Wang, R.Z.; Eikevik, T.M.; Ge, T.S. Thermodynamic and Economic Analysis of Two-Stage CO2 Heat Pump with Reverse Brayton Cycle. Int. J. Refrig. 2022, 143, 157–165. [Google Scholar] [CrossRef]
- Wang, S.; Li, S.; Jiang, S.; Wu, X. Analysis of the Air-Reversed Brayton Heat Pump with Different Layouts of Turbochargers for Space Heating. Buildings 2022, 12, 870. [Google Scholar] [CrossRef]
- White, A.J. Thermodynamic Analysis of the Reverse Joule-Brayton Cycle Heat Pump for Domestic Heating. Appl. Energy 2009, 86, 2443–2450. [Google Scholar] [CrossRef]
- Oehler, J.; Gollasch, J.; Tran, A.P.; Nicke, E. Part Load Capability of a High Temperature Heat Pump with Reversed Brayton Cycle. In Proceedings of the 13th IEA Heat Pump Conference 2021 (HPC2020) Conference Proceedings, Jeju, South Korea, 26–29 April 2021. [Google Scholar]
- Forman, C.; Muritala, I.K.; Pardemann, R.; Meyer, B. Estimating the Global Waste Heat Potential. Renew. Sustain. Energy Rev. 2016, 57, 1568–1579. [Google Scholar] [CrossRef]
- Su, Z.; Zhang, M.; Xu, P.; Zhao, Z.; Wang, Z.; Huang, H.; Ouyang, T. Opportunities and Strategies for Multigrade Waste Heat Utilization in Various Industries: A Recent Review. Energy Convers. Manag. 2021, 229, 113769. [Google Scholar] [CrossRef]
- Inayat, A. Current Progress of Process Integration for Waste Heat Recovery in Steel and Iron Industries. Fuel 2023, 338, 127237. [Google Scholar] [CrossRef]
- Bejan, A.; Tsatsaronis, G.; Moran, M. Thermal Design and Optimization. Int. J. Refrig. 1996, 19, 482. [Google Scholar] [CrossRef]
- Chung, Y.; Kim, H.S.; Kim, D.H.; Lee, G.H.; Song, C.H. A study on the cycle performance analysis of a 300 °C high temperature heat pump system. In Proceedings of the SAREK 2022 Summer Annual Conference, Gangwon, South Korea, 21–23 June 2023; pp. 905–908. [Google Scholar]
- Shuailing, L.; Guoyuan, M.; Shuxue, X.; Yuexuan, G.; Xiaoya, J.; Guoqiang, W. A Review of Reverse Brayton Air Cycle Refrigerators. Int. J. Refrig. 2023, 150, 200–214. [Google Scholar] [CrossRef]
- GE Energy. GateCycle ver. 6.1.2.; General Electric: Boston, MA, USA, 2013. [Google Scholar]
- Kurz, R.; Brun, K. Assessment of Compressors in Gas Storage Applications. J. Eng. Gas Turbine Power 2010, 132, 062402. [Google Scholar] [CrossRef]
- Burt, C.M.; Piao, X.; Gaudi, F.; Busch, B.; Taufik, N.F. Electric Motor Efficiency under Variable Frequencies and Loads. J. Irrig. Drain. Eng. 2008, 134, 129–136. [Google Scholar] [CrossRef]
- Schobeiri, M.T. Efficiency of Multi-stage Turbomachines. In Turbomachinery Flow Physics and Dynamic Performance; Springer: Berlin/Heidelberg, Germany, 2012. [Google Scholar] [CrossRef]
- Thulukkanam, K. Heat Exchanger Design Handbook, 2nd ed.; CRC Press: Boca Raton, FL, USA, 2013. [Google Scholar]
- Zhou, D.; Meng, Z.; Liu, Y.; Dong, S.; Zhang, F.; Ding, C.; Huo, Z.; Wang, M. Theoretical Study of Low-GWP Refrigerants in High-Temperature Heat Pump Systems. Int. J. Low-Carbon Technol. 2023, 18, 881–886. [Google Scholar] [CrossRef]
- Watanabe, C.; Uchiyama, Y. Pioneering Industrial Heat Pump Technology in Japan; Chubu Electric Power Co., Inc.: Nagoya, Japan, 2014. [Google Scholar]
- Dumont, O. Investigation of a Heat Pump Reversible into an Organic Rankine Cycle and Its Application in the Building Sector. Ph.D. Thesis, Doctor of Applied Sciences. University of Liège, Liège, Belgium, 2017. [Google Scholar]
- IEA. Steam Grow Heat Pump/SGH120/KOBELCO Compressors Corporation, Annex 58 High-Temperature Heat Pumps. Available online: https://heatpumpingtechnologies.org/annex58/task1/ (accessed on 9 January 2024).
- Thekdi, A.; Nimbalkar, S.; Sundaramoorthy, S.; Armstrong, K.; Taylor, A.; Gritton, J.; Wenning, T.; Cresko, J. Technology Assessment on Low-Temperature Waste Heat Recovery in Industry; Oak Ridge National Laboratory (ORNL): Oak Ridge, TN, USA, 2021.


| Parameters | Value |
|---|---|
| Heat sink outlet temperature [°C] | 305 |
| Heat sink inlet temperature [°C] | 25 |
| Heat source temperature [°C] | 65 |
| Compressor polytropic efficiency, % | 81 [23] |
| Turbine polytropic efficiency, % | 74 [23] |
| Heat exchanger effectiveness | 0.9 [23] |
| Compressor exit pressure [kPa] | 990 [23] |
| Mechanical efficiency, % | 99 [26] |
| Motor efficiency, % | 95 [27] |
| Tsource,in [°C] | Tsink,in [°C] | COPheating |
|---|---|---|
| 65 | 120 | 3.5 |
| 55 | 120 | 3.1 |
| 45 | 120 | 2.7 |
| 35 | 120 | 2.4 |
| Parameters | Value |
|---|---|
| Specific heat transfer rate [kJ/kg] | 286.12 |
| Net specific work [kJ/kg] | 209.86 |
| COP | 1.364 |
| Pressure ratio | 5.89 |
| HPPX pressure drop [kPa] | 49.64 |
| LPPX pressure drop [kPa] | 60.85 |
| Compressor inlet temperature, T1 [°C] | 56.16 |
| Compressor exit temperature, T2 [°C] | 333.51 |
| Turbine inlet temperature, T3 [°C] | 54.52 |
| Turbine exit temperature, T4 [°C] | −28.22 |
| Component Type | Parameters | Value |
|---|---|---|
| Heat pump system | Specific heat transfer rate [kJ/kg] | 285.91 |
| Net specific work [kJ/kg] | 220.74 | |
| COP | 1.295 | |
| Vapor compression heat pump unit | Specific heat transfer rate [kJ/kg] | 45.92 |
| Heat pump specific work [kJ/kg] | 13.12 * | |
| Mechanical vapor recompression unit | Sub-compressor specific work [kJ/kg] | 207.62 |
| Sub-compressor pressure ratio | 3.795 | |
| Sub-compressor inlet temperature [°C] | 110.50 | |
| Sub-compressor exit temperature [°C] | 333.51 |
| Parameters | Reference | Preheating | Recuperated |
|---|---|---|---|
| Specific heat transfer rate [kJ/kg] | 159.62 | ||
| Demand heat temperature [°C] | 305 | ||
| Waste heat temperature [°C] | 100 | ||
| Return heat temperature [°C] | 150 | ||
| Net specific work [kJ/kg] | 145.01 | 133.33 | 126.38 |
| COP | 1.101 | 1.197 | 1.263 |
| Pressure ratio | 3.932 | 3.047 | 2.533 |
| HPPX pressure drop [kPa] | 59.99 | 56.19 | 59.98 |
| LPPX pressure drop [kPa] | 66.23 | 44.33 | 39.73 |
| PHHX pressure drop [kPa] | - | 50.002 | - |
| IHX pressure drop (Hot side) [kPa] | - | - | 50.71 |
| IHX pressure drop (Cold side) [kPa] | - | - | 49.78 |
| Compressor inlet temperature, T1 [°C] | 97.87 | 144.68 | 159.28 |
| Compressor exit temperature, T2 [°C] | 320.82 | 325.47 | 320.84 |
| Turbine inlet temperature, T3 [°C] | 166.28 | 124.61 | 103.06 |
| Turbine exit temperature, T4 [°C] | 77.49 | 69.21 | 57.87 |
| LPHX exit temperature, T1 [°C] | - | 97.08 | 96.01 |
| HPHX exit temperature, T3 [°C] | - | - | 166.28 |
Disclaimer/Publisher’s Note: The statements, opinions and data contained in all publications are solely those of the individual author(s) and contributor(s) and not of MDPI and/or the editor(s). MDPI and/or the editor(s) disclaim responsibility for any injury to people or property resulting from any ideas, methods, instructions or products referred to in the content. |
© 2024 by the authors. Licensee MDPI, Basel, Switzerland. This article is an open access article distributed under the terms and conditions of the Creative Commons Attribution (CC BY) license (https://creativecommons.org/licenses/by/4.0/).
Share and Cite
Kim, J.-S.; Chung, I.-H.; Kim, T.-S.; Song, C.-H. Thermal Performance Design and Analysis of Reversed Brayton Cycle Heat Pumps for High-Temperature Heat Supply. Energies 2024, 17, 2953. https://doi.org/10.3390/en17122953
Kim J-S, Chung I-H, Kim T-S, Song C-H. Thermal Performance Design and Analysis of Reversed Brayton Cycle Heat Pumps for High-Temperature Heat Supply. Energies. 2024; 17(12):2953. https://doi.org/10.3390/en17122953
Chicago/Turabian StyleKim, Jin-Seo, In-Ho Chung, Tong-Seop Kim, and Chan-Ho Song. 2024. "Thermal Performance Design and Analysis of Reversed Brayton Cycle Heat Pumps for High-Temperature Heat Supply" Energies 17, no. 12: 2953. https://doi.org/10.3390/en17122953