Abstract
Deploying renewable generation to replace conventional fossil-fuel-based energy supplies provides an important pathway for the decarbonization of steelmaking plants. Meanwhile, it is also crucial to improve the flexibility of blast-furnace-gas-fired combined-cycle power plants (BFGCCs) to ease the accommodation of uncertain renewable generation. To this end, this paper proposes the deployment of a molten salt heat storage (MSHS) system in BFGCCs to store the heat of gas turbine flue gas so that the power–heat coupling of these BFGCCs can be unlocked to enhance the flexibility of the energy supply. A stochastic capacity optimization of an integrated BFGCC–MSHS–wind–solar (BMWS) energy system is presented to determine the optimal installed capacities of a BFG holder, MSHS, wind turbine, and PV panel, aiming to achieve an economic and safe energy supply for the entire system. Multiple scenarios considering uncertain fluctuations in load demands and renewable generation are generated with the Monte Carlo method based on a typical scenario. These scenarios are then reduced to representative scenarios using the synchronous substitution and reduction method for stochastic capacity optimization to enhance the reliability of the results. The case study results demonstrate that configuring MSHS reduces the total annualized cost of the BMWS system by 2.28%. Furthermore, considering the uncertainties of the power/heating load and wind/PV generation can reduce the expected annualized total cost of the BMWS system and the corresponding standard deviation by 5.66% and 81.45%, respectively. The BMWS system can achieve 730.68 tons of equivalent CO2 reduction in 24 h due to the successful utilization of renewable energy. This paper provides an effective approach for the decarbonization of energy generation systems in steelmaking plants.
1. Introduction
Steel is the most critical material for engineering and construction, playing a key role in global economic development. In 2022, global crude steel production reached a record high of 1.878 billion tons [1], and the steel demand is expected to increase by over 33% by 2050 [2].
A total of around 70% of steel is produced via the blast furnace–basic oxygen furnace (BF-BOF) route [3], where iron ores are reduced to iron in the BF first and then converted into steel in the BOF [4]. Because a huge amount of coal is used as the reduced agent and heat source in BFs, the steelmaking industry is energy-intensive and ranks as the industrial sector with the highest CO2 emissions. According to the statistics published by the International Energy Agency (IEA), the steel industry produces approximately 2.6 billion tons of CO2 annually, accounting for 6.7% of global direct CO2 emissions [5]. The decarbonization of the steelmaking industry is, thus, vital to support and maintain the sustainable development of the future society [6].
Two main technical pathways have been applied to reduce the CO2 emissions of the steelmaking industry. The first involves the efficient utilization of waste resources [7]. For BF–BOF-based steelmaking, blast furnace gas (BFG) is the main waste gas that arises as a byproduct, and it is mainly composed of nitrogen, carbon monoxide, and small amounts of carbon dioxide and hydrogen [8]. Proper utilization of BFG can significantly improve the efficiency of a whole steelmaking plant and, thus, reduce CO2 emissions. At present, steel plants are usually equipped with BFG-fired power plants, which can alleviate BFG dissipation and generate energy to compensate for the energy consumption in them [9]. However, conventional BFG-fired boiler–turbine units are low in efficiency. Therefore, blast-furnace-gas-fired combined-cycle power plant (BFGCC) technology has been promoted in recent years for heat and power generation [10]. BFGCCs can achieve a high thermal efficiency of 40–45% through the cascaded utilization of energy, nearly doubling the efficiency of conventional BFG-fired boilers [11].
Many studies have been conducted to improve the operating performance of BFGCCs. Campos et al. [12] compared the operating performance of a BFGCC and the Rankine cycle. The results showed that the combined-cycle plant exhibited higher efficiency, rated power, and flexibility but with a higher cost and operational complexity. Yao et al. [13] carried out an economic analysis of a BFGCC with a dual-pressure waste-reheating boiler. The design parameters, such as the pressure ratio, isentropic efficiency, and temperature of the combustion chamber, were optimized to reduce the operating cost. Kirin and Gubarev [14] optimized the design of a compressor and combustion chamber to enhance the BFG combustion efficiency. A software product that calculates the cycle efficiency of BFGCCs was developed. Zhang et al. [15] developed a dynamic matrix control to regulate the total power generation and flue gas temperature in the gas turbine of a BFGCC. The calorific value of BFG is used as a feedforward in the system so that the impact of its fluctuation can be quickly rejected. Wu et al. [11] proposed a coordinated control strategy for an integrated BFGCC–carbon capture process. The re-boiler steam flow rate was flexibly adjusted to enhance the power-load-tracking ability of the plant.
The other pathway to reduce CO2 emissions is the deployment of renewable energy sources, such as wind turbines and solar panels, to replace conventional fossil-fuel-based power generation. This trend is particularly evident in steelmaking plants that utilize the electric arc furnace (EAF) route for steel production or are considering adopting H2 direct reduced iron (H2-DRI) technology. This is because a significant amount of additional electricity is required to melt recycled steel or produce hydrogen [16].
However, wind and solar sources exhibit intermittent and uncertain characteristics, which have strong impacts on the stable operation of steelmaking plants. The coordination between renewable energy and other adjustable sources is the key to solving this issue. Zhao et al. [17] proposed installing rooftop photovoltaic (PV) power generation systems in steelmaking plants, evaluating both the capital costs and operating revenue. The results showed that a rooftop PV system can provide 5–10% of the total power consumption in a steelmaking plant, with an investment payback period of 7 years. Xi et al. [18] developed an intelligent scheduling approach for an energy supply system in a steelmaking plant, which included conventional gas-fired power generation, renewable generation, energy storage, and carbon capture and utilization (CCUS) technologies. Wu et al. [19] proposed decarbonizing a steelmaking plant by deploying multiple low-carbon technologies. A two-stage low-carbon robust planning approach was proposed to find the appropriate development time and installed capacities of renewable energy, energy storage, hydrogen energy, and CCUS technologies. The results of these studies also pointed out that in the presence of renewable energy, BFGCCs have to change load frequently over a wide range to ease the accommodation of renewable energy or compensate for their insufficiency. Although the relevant control studies indicated that BFGCCs have satisfactory flexibility in load following [15], the transformation from a base-load energy source to a flexible energy source upgrades their operating challenges [20], especially in cases where both heat and power demands are required to be met simultaneously.
The uncertainties of renewable generation and load demands should also be considered in the capacity optimization of energy systems. Aliari et al. [21] proposed a stochastic optimization model with a combination of resource-and-chance-constrained approaches to determine the capacities of several devices, including wind turbines. Li et al. [22] established a hybrid energy system that included wind turbines, concentrated solar plants, and electric heaters. Two-stage stochastic capacity optimization was carried out to minimize the life cycle cost and the loss of power supply probability of the integrated system. The case study results demonstrated the reliability of the stochastic optimization method. Compared to robust optimization methods that focus on the worst-case condition and may lead to more conservative results, stochastic programming is relatively balanced in most operating conditions and is commonly used in the configuration of the capacity of energy systems.
In recent years, the idea of integrating molten salt heat storage (MSHS) into large-scale combined heat and power (CHP) plants has received much attention. Molten salts have the advantages of strong heat storage capacity, low viscosity, strong fluidity, and stable chemical properties [23]. By storing a portion of the generated heat in MSHS during valley hours and releasing this heat during peak hours for heat supply or power generation, a CHP plant can effectively achieve heat–power decoupling and, thus, enhance the flexibility of operating performance [24]. Luo [25] proposed a molten salt heat storage system for coal-fired cogeneration power plants and analyzed the performance of the system based on the first and second laws of thermodynamics. The results show that the temperature difference between two molten salt tanks has a significant effect on the system design. Li [26] proposed the extraction of flue gas from a CHP plant for heat storage to improve the load-peaking performance when renewable energy is connected to the grid. The results showed that the coordination between molten salt heat storage and the original boiler–turbine unit upgraded the peak-shaving capabilities of the thermal power unit and improved the response speed during load tracking. Fu et al. [27] optimized the integration of molten salt energy storage in coal-fired power generation units. Multi-stage heat exchangers and buffer tanks were applied to improve the storage efficiency and reduce the minimum operating load of the plant.
Although the integration schemes and optimization of the operation of MSHS in CHP plants have been extensively studied, the literature has mostly focused on the optimization of the systems themselves. There is still limited research on how to determine the optimal capacity of MSHS and the way it cooperates with renewable sources and other equipment to effectively maximize its value. A comprehensive consideration of external renewable generation and load disturbances, internal operation constraints, and MSHS investment and operation costs is required to carry out a system-level optimization study [28].
In addition, there have been no studies conducted on the integration of MSHS in BFGCCs. Unlike the steam heat storage used in conventional coal-fired power plants, in a combined-cycle plant, it is easier to apply a direct high-temperature flue gas heat storage system, which is more efficient [29] than a steam heat storage system. Moreover, BFG holders and MSHS can be jointly deployed to better enhance system flexibility and to reduce BFG dissipation and renewable curtailments [30].
To this end, this paper proposes the deployment of MSHS in a BFGCC to store heat in the flue gas of a gas turbine so that the coupling between the power and heat supply can be unlocked to enhance the flexibility of the BFGCC. On this basis, a capacity configuration optimization approach is proposed to determine the best installed capacities for a BFG holder, MSHS, wind turbines, and PV panels. The capacity optimization approach aims to minimize an overall objective function that includes the investment cost, operation and maintenance cost, energy purchase cost, and penalty cost for fluctuation in the BFG holder’s position. The power and heat balance constraints, the constraints of the steam turbine’s power–heat characteristics, the operating constraints of other equipment, and initial–final state constraints are fully considered. Moreover, uncertainties in load demand and renewable generation are taken into account to improve the reliability of the capacity configuration optimization.
The innovations of this article are as follows:
- (1)
- The integration of a molten salt heat storage system is proposed to improve the flexibility of BFGCCs.
- (2)
- Capacity configuration optimization is performed for an integrated BFGCC–MSHS–wind–solar energy system for the decarbonization of steelmaking plants.
- (3)
- Uncertainties in renewable generation and load demand are considered to enhance the reliability of the results.
2. System Introduction and Problem Description
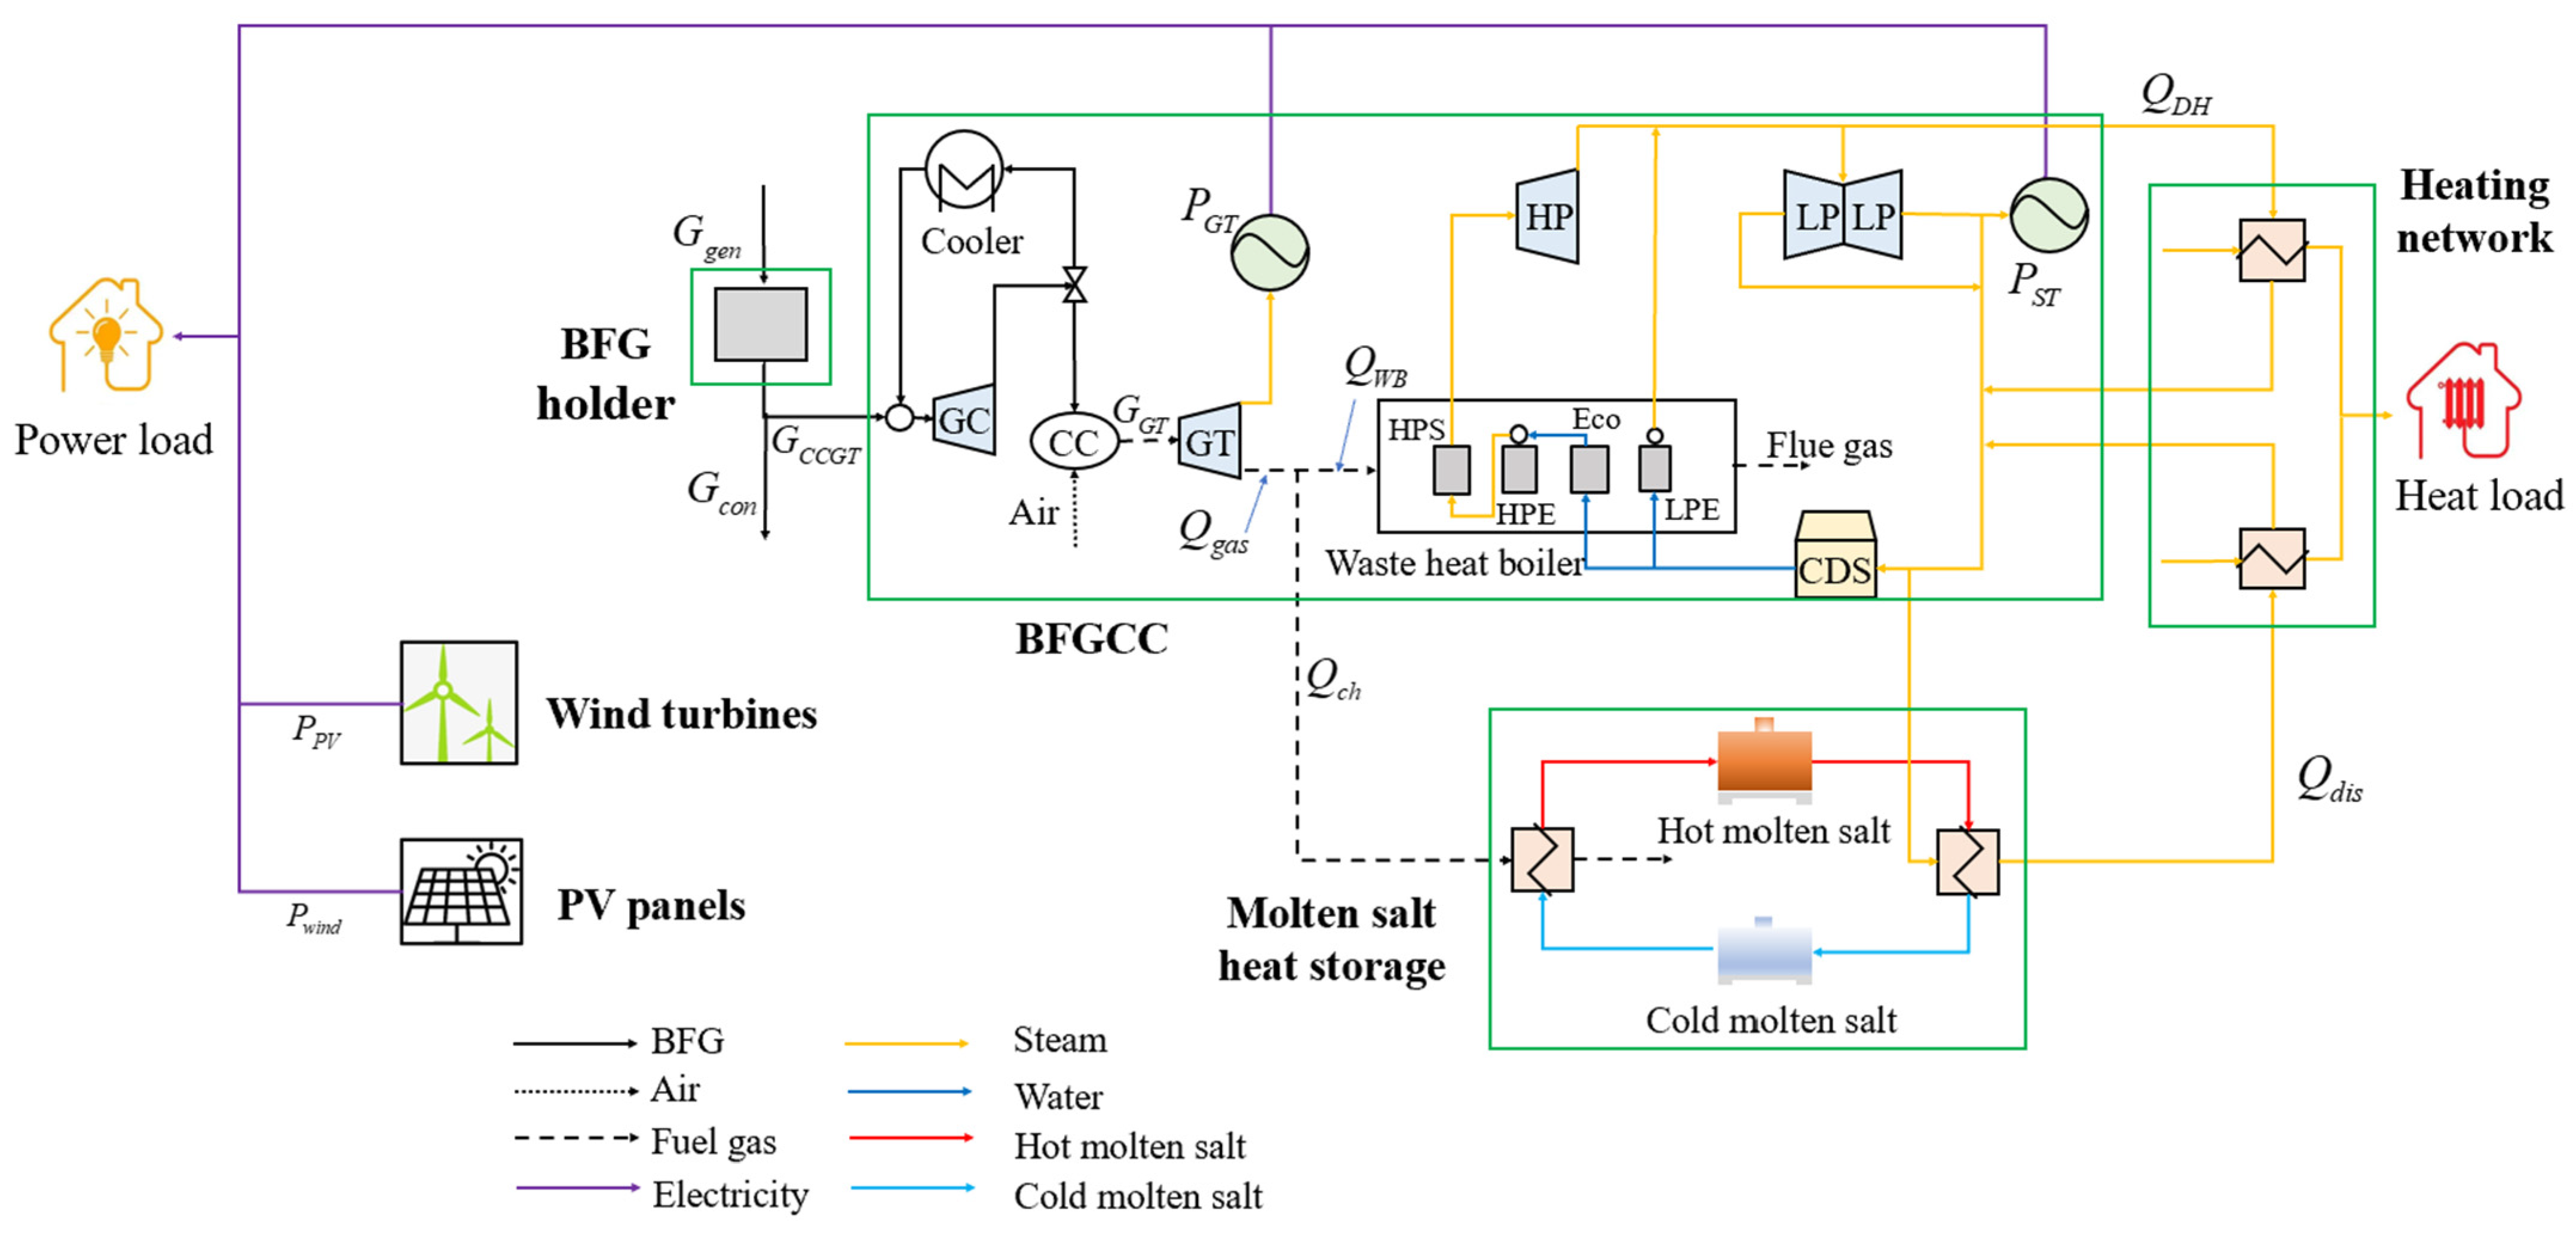
A schematic diagram of a BFGCC is illustrated in Figure 1; it mainly consists of a Mitsubishi M251S single-shaft heavy-duty gas turbine, a natural-circulation dual-pressure waste heat boiler, and a sliding-pressure-operated condensing steam turbine. The BFG generated in the blast furnace is first stored in the BFG holder and then supplied to different production sectors in steelmaking plants, including the BFGCCs. In a BFGCC, the BFG and air are compressed separately and mixed in a combustion chamber for combustion. The high-temperature flue gas that is generated expands in the gas turbine, spinning the turbine blades and generating electricity. The exhaust gas is subsequently used in the waste heat boiler for the generation of steam, which is then sent to a steam turbine to produce additional electricity. Part of the steam is extracted from the outlet of a high-pressure cylinder for heat supply. A detailed plant-wide dynamic model of this BFGCC was developed and validated by Ren et al. [31]. The key operating parameters under the rated operating conditions are listed in Table 1.
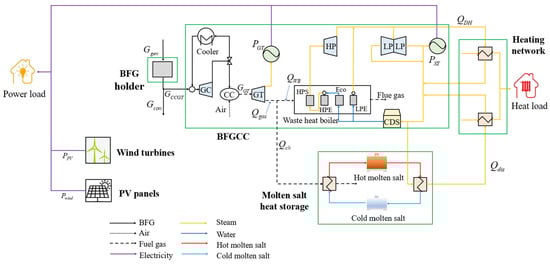
Figure 1.
Schematic diagram of the BMWS energy system (GC—gas compressor; CC—combustion chamber; GT—gas turbine; HPS—high-pressure superheater; HPE—high-pressure evaporator; Eco—economizer; LPE—low-pressure evaporator; CDS—condenser).

Table 1.
Main parameters of the BFGCC under typical operating conditions.
To meet the increasing energy demand while reducing the CO2 emissions caused by fossil-fuel-based energy supply, wind turbines and PV panels are deployed near the steelmaking plant. Moreover, an MSHS system and additional BFG holder are integrated into the BFGCC to improve its flexibility, allowing for the better utilization of intermittent and uncertain renewable power. Ternary salt (53% KNO3, 40% NaNO2, 7% NaNO3) is considered the heat storage medium in the MSHS system, and it has the advantages of stable chemical properties, low cost, and high safety. Its melting point temperature is 142 °C, with an upper temperature limit of 535 °C. The specific heat capacity at constant pressure and the density parameters are shown in Equation (1) [32]:
When the energy generation is in excess, part of the flue gas emitted from the gas turbine flows through the heat exchanger of the heat storage to transfer the heat to the molten salt; in the case of insufficient energy supply, the high-temperature molten salt is used to heat the exhaust steam of the low-pressure cylinder to the inlet temperature, enabling it to be used for heat supply.
The resulting integrated BFGCC–MSHS–wind–solar (BMWS) energy system includes many types of devices with different behaviors. Moreover, the deployment of renewable energy introduces significant uncertainty on the sides of both the source and the load. Therefore, it is essential to determine the optimal capacity configuration of the wind turbine, PV panel, MSHS, and BFG holder according to the weather and load conditions of the plant. This lays a foundation for a stable and economic energy supply.
3. Configuration Optimization of the Integrated BMWP System
3.1. Equipment Models for the Configuration Optimization
3.1.1. BFGCC Model
The BFGCC mechanism model established by Ren et al. [31] encompasses too many variables and nonlinear equations, which will make the configuration optimization computationally intractable. Therefore, based on data generated from the mechanism model, a simplified substitute model is developed in this section to represent the relationships between key variables that are strongly related to the configuration optimization.
- (1)
- Gas holder model
A gas holder can be modeled as a gas storage tank:
where mGH(t) is the mass of BFG stored in the gas holder in time period t (kg); Ggen(t) is the BFG production rate of the blast furnace in time period t (kg/s); GCCGT(t) is the BFG consumption rate of the BFGCCGT in time period t (kg/s); Gcon(t) is the BFG consumption rate of other equipment, such as a coke oven in a steelmaking plant, in time period t (kg/s).
- (2)
- Gas turbine model
The power generation and exhaust heat of the gas turbine are both related to the BFG consumption [33]:
where f1 and f2 are functions identified through data generated from the BFGCC mechanism model; PGT(t) is the gas turbine power generation in time period t (MW); Qgas(t) is the gas turbine exhaust heat in time period t (MW).
Part of the exhaust gas generated by the gas turbine enters the MSHS system, while the rest enters the waste heat boiler.
where Qch(t) is the gas turbine exhaust heat entering the MSHS system in time period t (MW); QWB(t) is the gas turbine exhaust heat entering the waste heat boiler in time period t (MW).
- (3)
- Waste heat boiler–steam turbine system
In the waste heat boiler, feedwater is converted into steam by absorbing the heat of exhaust gas. The steam is then expanded in the steam turbine for power generation. To provide heat for users, part of the steam is extracted from the outlet of the high-pressure cylinder of the steam turbine. The power generation of the steam turbine is related to the heat of exhaust gas entering the waste heat boiler and the heat extracted from the steam turbine:
where PST(t) is the power generation of the steam turbine in time period t (MW); QDH(t) is the steam for direct heat supply in time period t (kg/s); f3 is a function identified through data generated from the BFGCC mechanism model.
- (4)
- BFGCC model identification
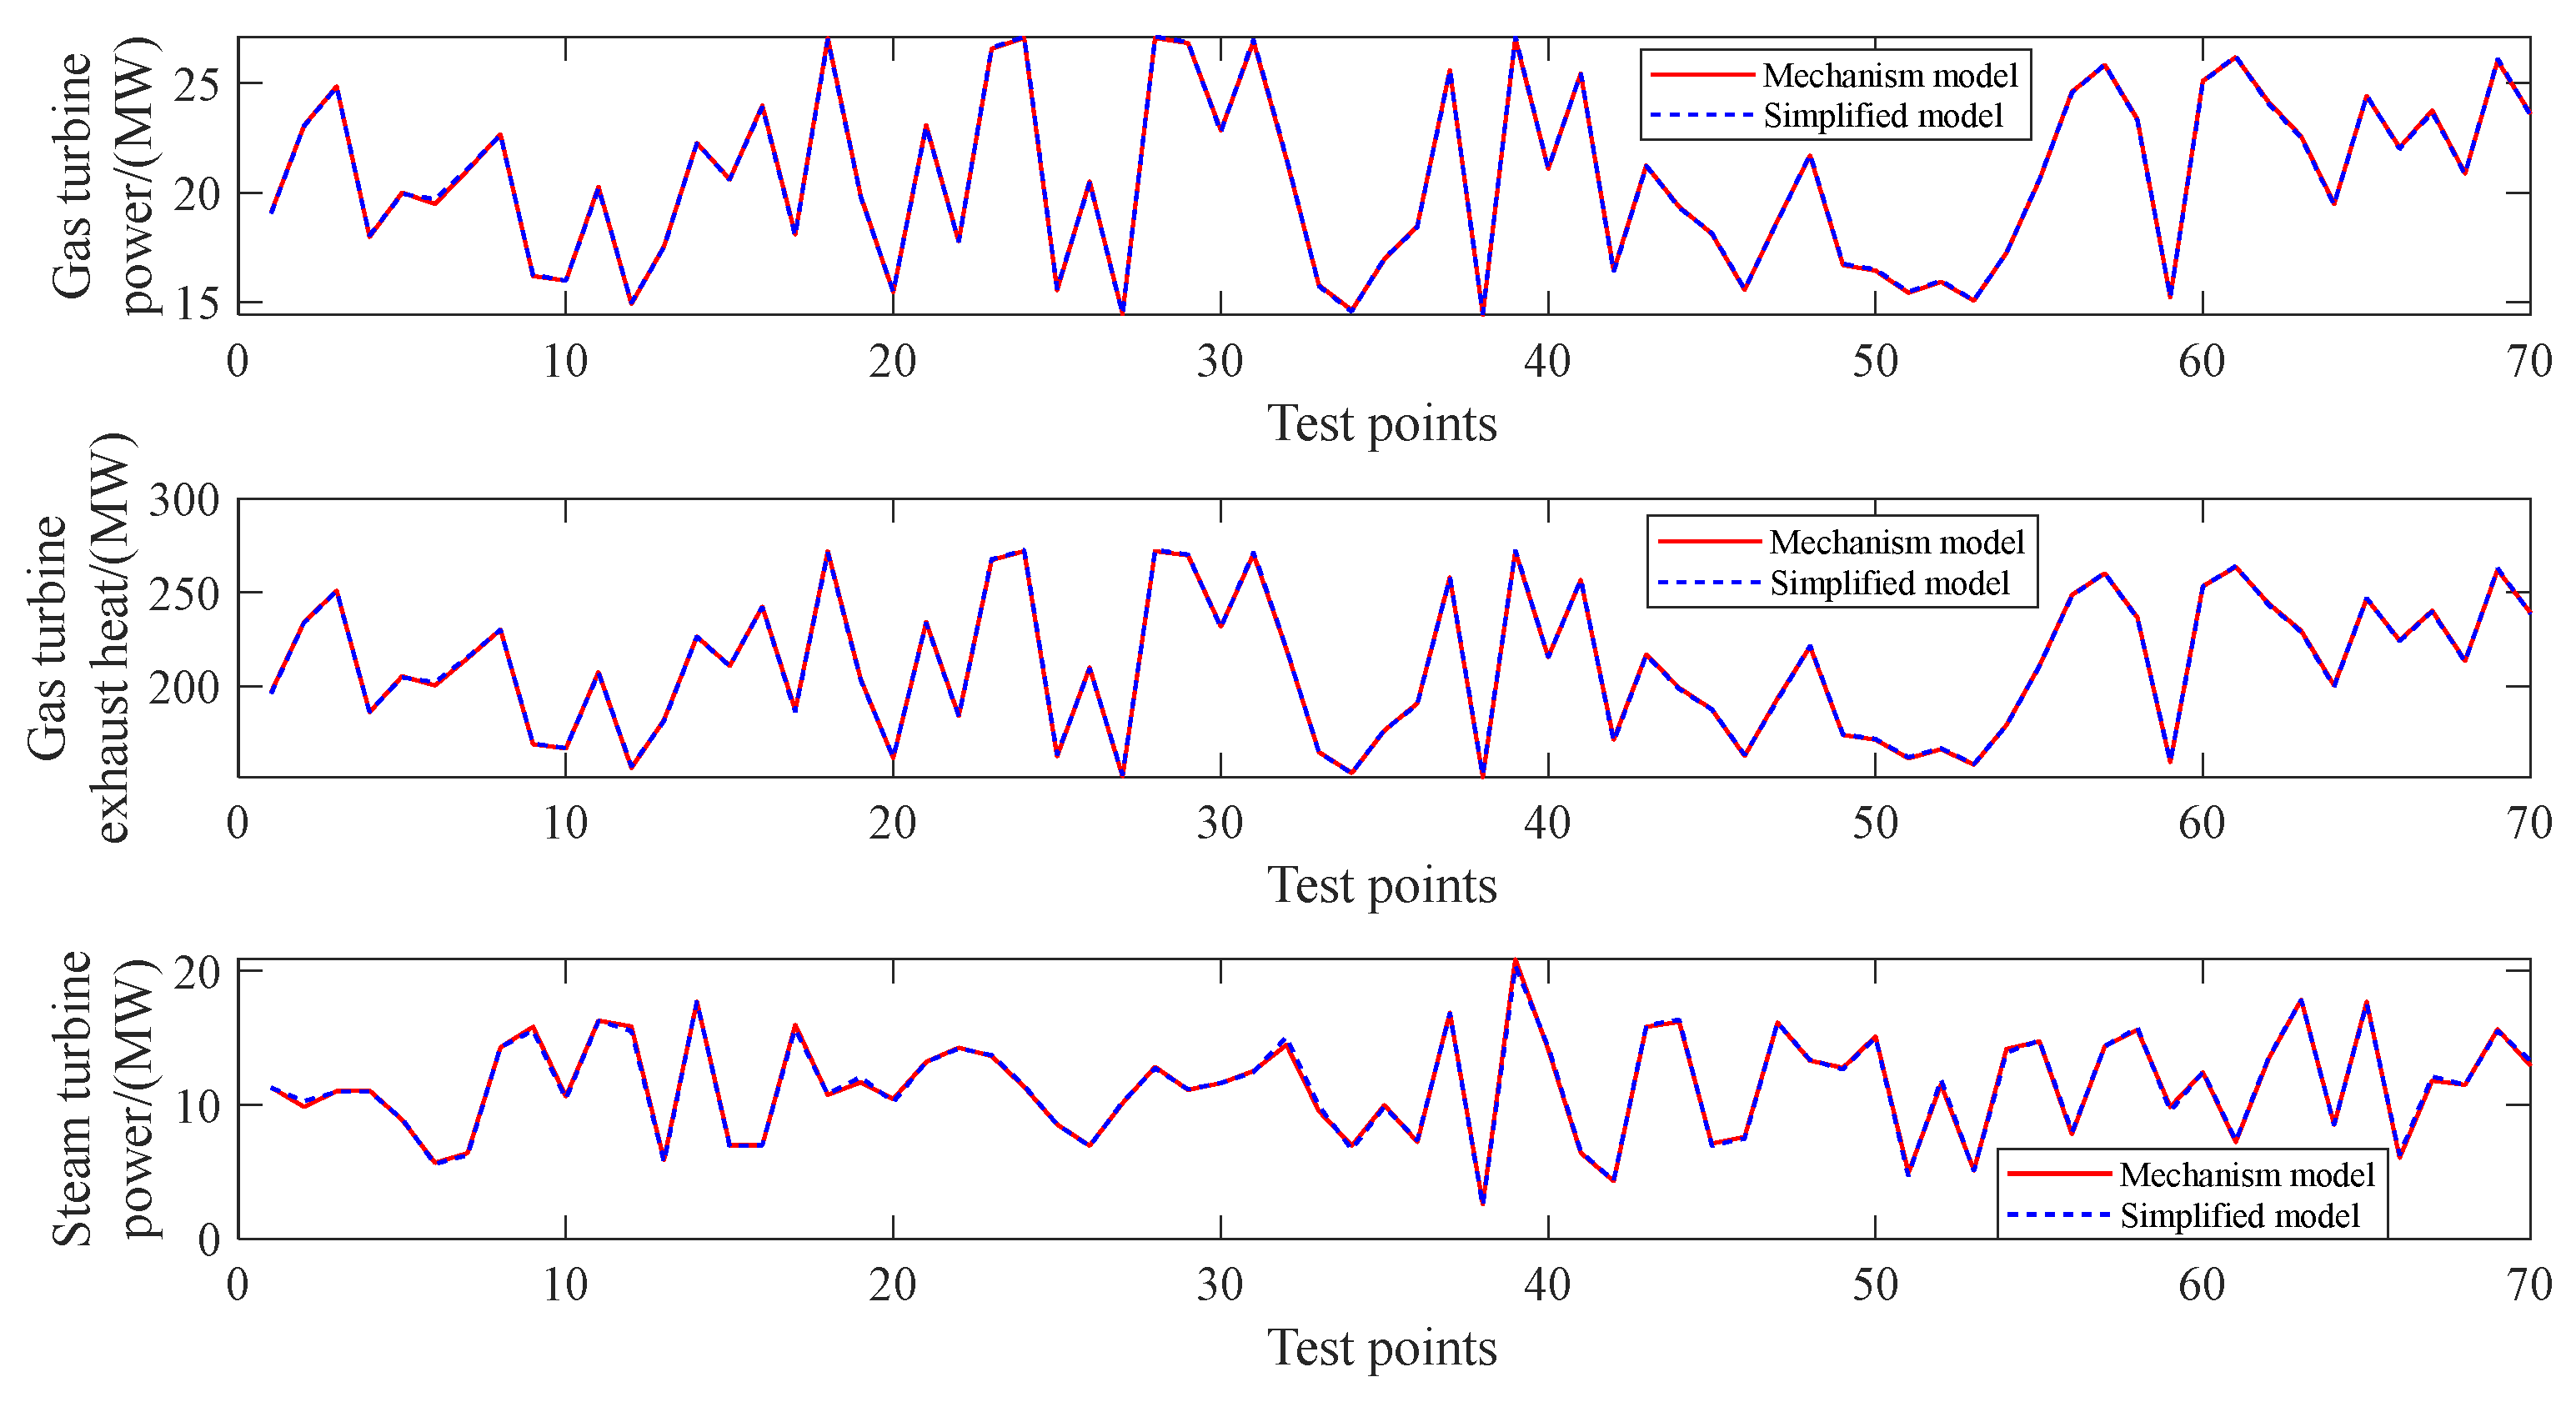
The BFG gas turbine is required to operate between 50 and 100% of the loading condition. Within this operating range, the functions f1, f2, and f3 in (3) and (5) show weakly nonlinear properties [31]; thus, they can be approximated using linear functions.
A total of 250 sets of steady-state operating data were archived by running the BFGCC mechanism model within 50–100% of the loading range. A total of 180 sets of data were then used for model identification, and the remaining 70 sets of data were used for validation. The validation results are shown in Figure 2.
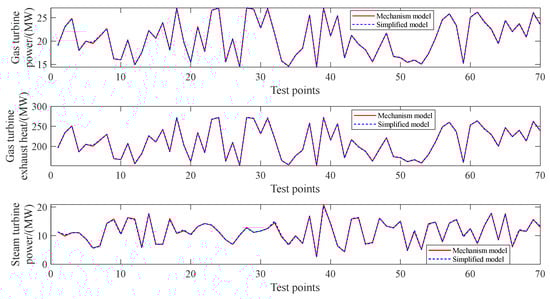
Figure 2.
Verification results for the simplified BFGCC model used for configuration optimization.
The determination coefficient index (R2) is applied to evaluate the performance of the simplified BFCCC model. R2 represents the fitting degree between the predictions of the simplified and mechanism models. A larger value of R2 indicates a better regression performance of the simplified model.
where yi and are the predictions of the simplified and mechanism models of sample i; is the average value of the predictions of the simplified model; n is the number of samples. The results show that the R2 values of PGT and Qgas are both 0.999, while the R2 value of PST is 0.998. The results indicate that the predicted values of the simplified model are highly consistent with those of the mechanism model under the considered operating conditions. The simplified model can be used for the study of system configuration optimization.
3.1.2. Wind Power Generation Model
Wind turbines convert wind energy into electricity. The maximum power generation of a wind turbine can be calculated as follows [34]:
where Pwind,max is the maximum wind power generation at the current speed (MW); v is the current wind speed (m/s); vr is the cut-in wind speed (m/s); vd is the rated wind speed (m/s); vc is the cut-out wind speed (m/s); Pd is the rated power of the wind turbines (MW).
3.1.3. PV Power Generation Model
PV power generation utilizes the photovoltaic effect on the surface of semiconductors to convert light energy into electrical energy [35]. The maximum PV power generation can be calculated as follows:
where PPV,max is the maximum PV power generation under the current irradiation conditions (MW); YPV is the rated capacity of the PV panels (MW); fPV is the PV derating factor; GT is the current solar irradiation intensity (MW/m2); GT,STC is the solar irradiation intensity under standard test conditions, and it is usually taken as 1 (MW/m2); αP is the power temperature coefficient of the PV panels (%/K); TC is the current PV cell temperature (K); Tc,STC is the PV cell temperature under the standard test conditions (K).
3.1.4. MSHS Model
The heat storage capacity of the MSHS system in time period t is calculated based on the heat storage capacity in time period t − 1 and the charging/discharging heat in time period t:
where EMSHS(t) and EMSHS(t − 1) are the capacities of the heat storage tank in time period t and t − 1, respectively (MWh); Qdis(t) is the heat discharged for heat supply in time period t (MW); ηch and ηdis are the charging and discharging efficiency of the MSHS system (%); uch(t) and udis(t) are 0/1 logical variables representing the charging and discharging states of the MSHS system in time period t; SOC(t) is the state of charge in time period t (%); CapacityMSHS is the installed capacity of the heat storage tank (MWh).
3.2. Objective Function for the Configuration Optimization of the BMWP Energy System
The aim of configuration optimization is to find the best installed capacities for the wind turbine, PV panel, MSHS, and BFG holder, as well as the optimal scheduling result for the BMWP on a typical operating day. The following objective function, which includes the investment cost, operation and maintenance (O&M) cost, electricity purchase cost, heat purchase cost, and penalty cost for fluctuations in the gas holder’s position, is considered in the optimization:
where Obj is the total annualized cost of the BMWP system (USD); Minvestment is the annualized investment cost (USD); Mom is the annualized O&M cost (USD); MP,buy and MH,buy are the annualized electricity and heat purchase costs, respectively (USD); Mpen,GH is the penalty cost for the fluctuation in the gas holder’s position (USD).
The annualized investment cost is calculated as follows:
where Minv,MSHS, Minv,GH, Minv,wind, and Minv,PV are the investment costs of the MSHS system, BFG holder, wind turbine, and PV panel, respectively (USD); cMSHS is the unit investment cost of MSHS (USD/MWh); cGH is the unit investment cost of the BFG holder (USD/kg); cwind and cPV are the unit investment costs of the wind turbine and PV panel, respectively (USD/MW); CapacityGH is the capacity of the BFG holder (kg); R and nyear are the return on investment and design life of the equipment; i is the bank interest rate (%).
The annualized O&M cost is calculated as follows:
where Mom,BFGCC is the annualized O&M cost of the BFGCC unit:
in which com,BFGCC,P and com,BFGCC,Q are the unit O&M costs of the BFGCC for the power and heat supply, respectively (USD/MW); dwork is the annual number of operating days of the equipment; T is the duration of the calculation cycle, which is set to 24 in this study considering the hourly scheduling on a typical day.
The O&M cost of MSHS is calculated as follows:
where com,MSHS is the unit O&M cost of the MSHS system (USD/MW).
The O&M cost of wind power generation system is calculated by:
where com,wind is the unit O&M cost of the wind power generation system (USD/MW); Pwind(t) is the wind power generation in time period t (MW).
The O&M cost of the PV power generation system is calculated as follows:
where com,PV is the O&M cost coefficient of the PV power generation system (USD/MW); PPV(t) is the PV power generation in time period t (MW).
The annualized costs for purchasing electricity and heat are calculated as follows:
where cP,buy and cH,buy are the electricity and heat prices, respectively (USD/MW); Pbuy(t) and Qbuy(t) are the electricity and heat being purchased at time period t, respectively (MW).
The annualized penalty cost for fluctuation in the BFG holder’s position is calculated as follows:
where cpen,GH is the unit penalty cost for fluctuation in the BFG holder’s position (USD/(kg)); mGH,H and mGH,L are the upper and lower limits of the safe range of positions of the BFG holder (kg); uGH,H and uGH,L are binary variables representing the penalty states; if mGH(t) − mGH,H > 0, then uGH,H = 1; otherwise, uGH,H = 0; if mGH,L − mGH(t) > 0, then uGH,L = 1; otherwise, uGH,L = 0.
3.3. Constraints for the Configuration Optimization of the BMWP Energy System
The following constraints should be satisfied in the optimization configuration.
- (1)
- Power and heat balance constraints:
- (2)
- Power–heat characteristic constraint of the steam turbine:
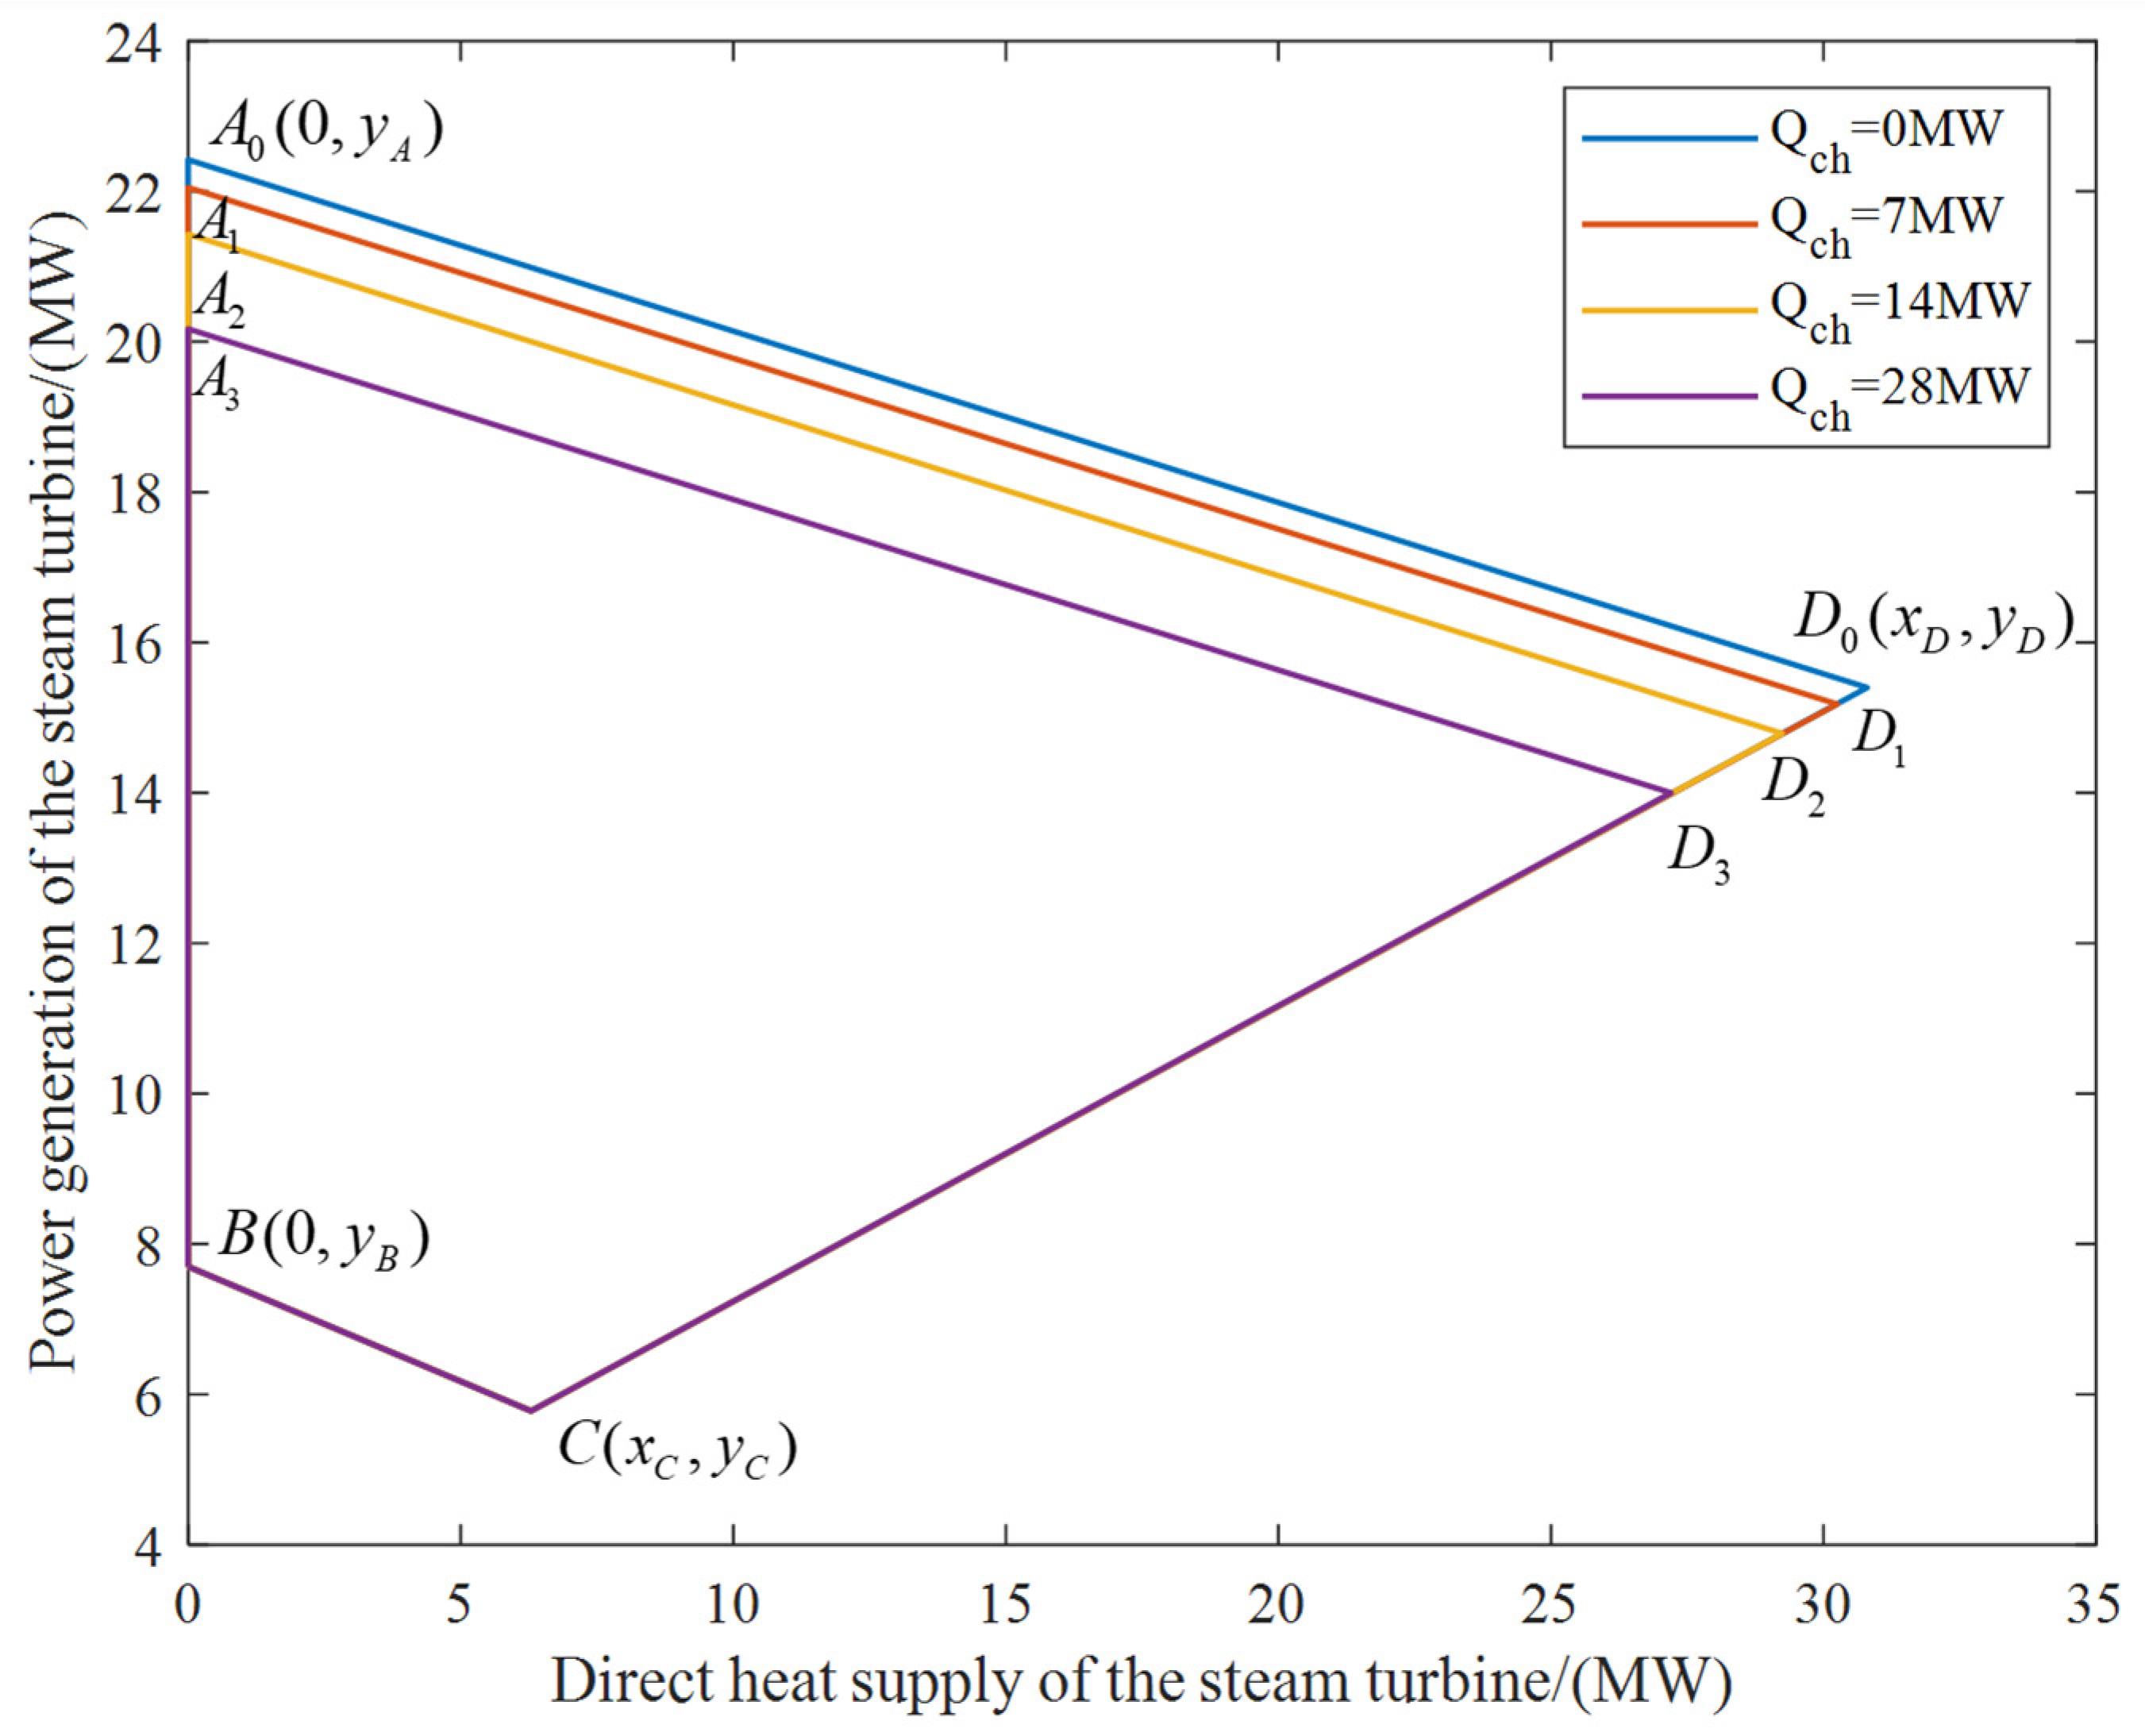
The feasible range of the steam turbine for power generation and heating supply is shown in Figure 3. Points A (0, ya) and B (0, yb) represent the power generation with 100% turbine heating acceptance (THA) and 30% THA conditions without a direct heat supply. Points C (xc, yc) and D (xd, yd) represent the power generation at 30% THA and 100% THA with the maximum direct heat supply. As the heat stored by the MSHS (Qch) increases, the steam generated by the waste heat boiler decreases. Consequently, the maximum power and heat supply of the steam turbine is reduced. Therefore, line AD shifts downwards as Qch increases [36].
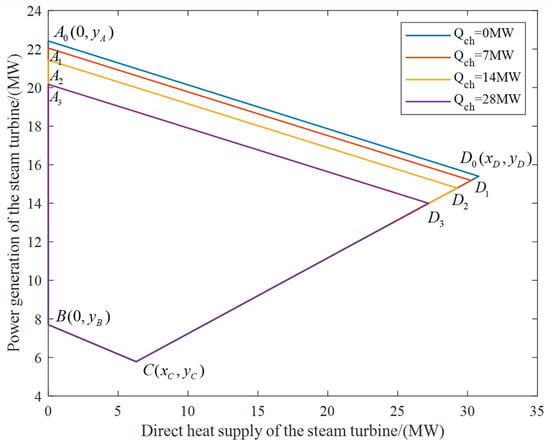
Figure 3.
Power–heat characteristics of the steam turbine under different MSHS charging conditions.
The power–heat characteristics of the steam turbine should satisfy the following constraints:
- (3)
- Operating constraints of other equipment:
The BFG consumption, wind power generation, and PV power generation should satisfy the following constraints:
where Pcur is the curtailment of renewable generation.
The charging and discharging power of the MSHS should satisfy the following constraints:
which means that at the maximum charging and discharging power, it takes 4 h to fill or empty the heat storage tank.
The SOC(t) value of the MSHS system in time period t is required to be within the following safe range:
The mass of BFG stored in the gas holder should satisfy the following constraints:
- (4)
- Initial- and final-state constraints:
It is required that the SOC value of MSHS and the mass of BFG stored in the gas holder at the initial and final hours of the scheduling cycle should be the same to ensure the repeatability of scheduling results:
3.4. Consideration of Uncertainties in Load and Renewable Generation
To ensure the reliability of the capacity optimization, uncertainties in the load demand and renewable generation are considered in this study. The deviations between the real values and predicted values are assumed to follow a normal distribution [37].
3.5. Solution Procedure for the Capacity Configuration Optimization
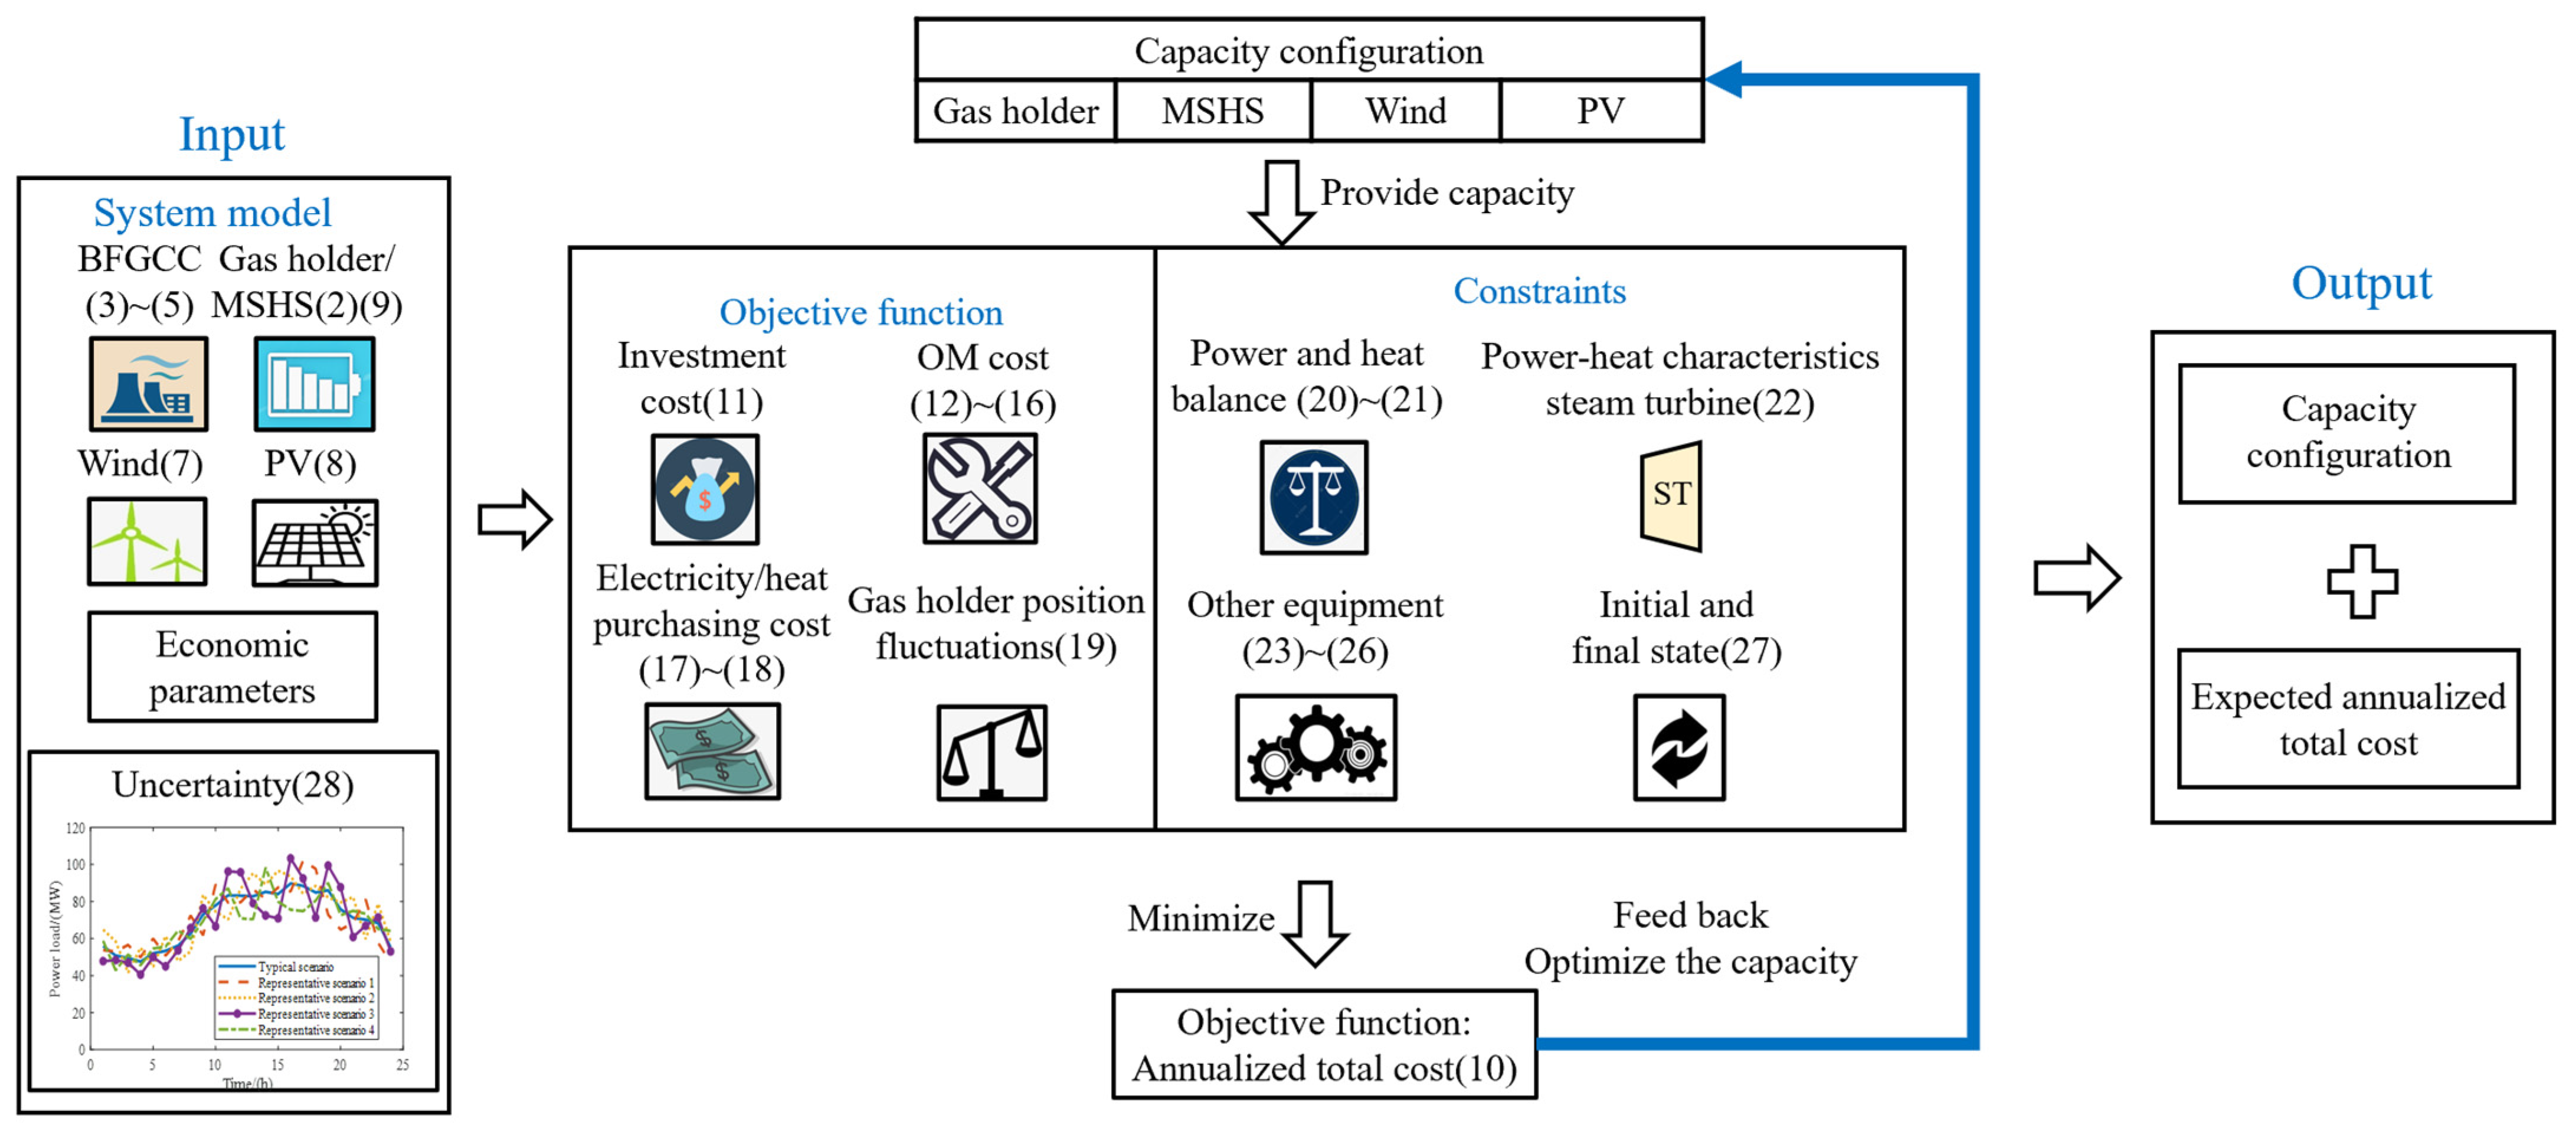
The solution procedure for the capacity configuration optimization problem is shown in Figure 4. The specific steps of the solution process are the following:
- Step 1: Obtaining the system’s economic parameters;
- Step 2: Identifying the simplified model of the BFGCC system ((3) and (5)) by employing a multi-linear regression method based on the simulation data of the BFGCC model;
- Step 3: Generating multiple sets of load and renewable generation scenarios with the Monte Carlo method according to the deviation distribution (28). The scenarios are reduced to 4 sets of representative scenarios using the synchronous substitution and reduction method, and the probability of each representative scenario is obtained;
- Step 4: Initializing/updating the gas holder capacity, MSHS capacity, and rated power of the wind/solar units;
- Step 5: Minimizing the probability-weighted objective function (10) in the representative scenarios based on the BMWS model in (2)–(5) and (7)–(9), subject to constraints (20)–(25);
- Step 6: Steps 4–5 are repeated until a given number of iterations or convergence condition is reached.
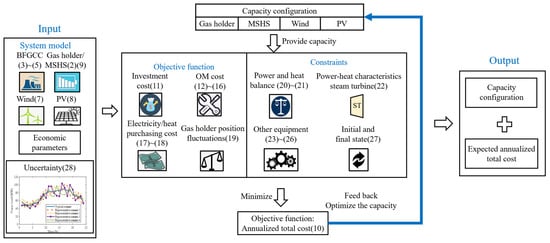
Figure 4.
Schematic diagram of the capacity optimization for the integrated BMWS system.
Figure 4.
Schematic diagram of the capacity optimization for the integrated BMWS system.
4. Case Study
This section verifies the efficacy of the proposed capacity optimization approach for an integrated BMWP system using historical load and weather data from a steelmaking plant in Nanjing, China. The economic parameters and operating constraints for the capacity optimization were taken from [38,39,40] and are shown in Table 2 [38,39,40].
Table 2.
Economic parameters and operating constraints for the capacity optimization.
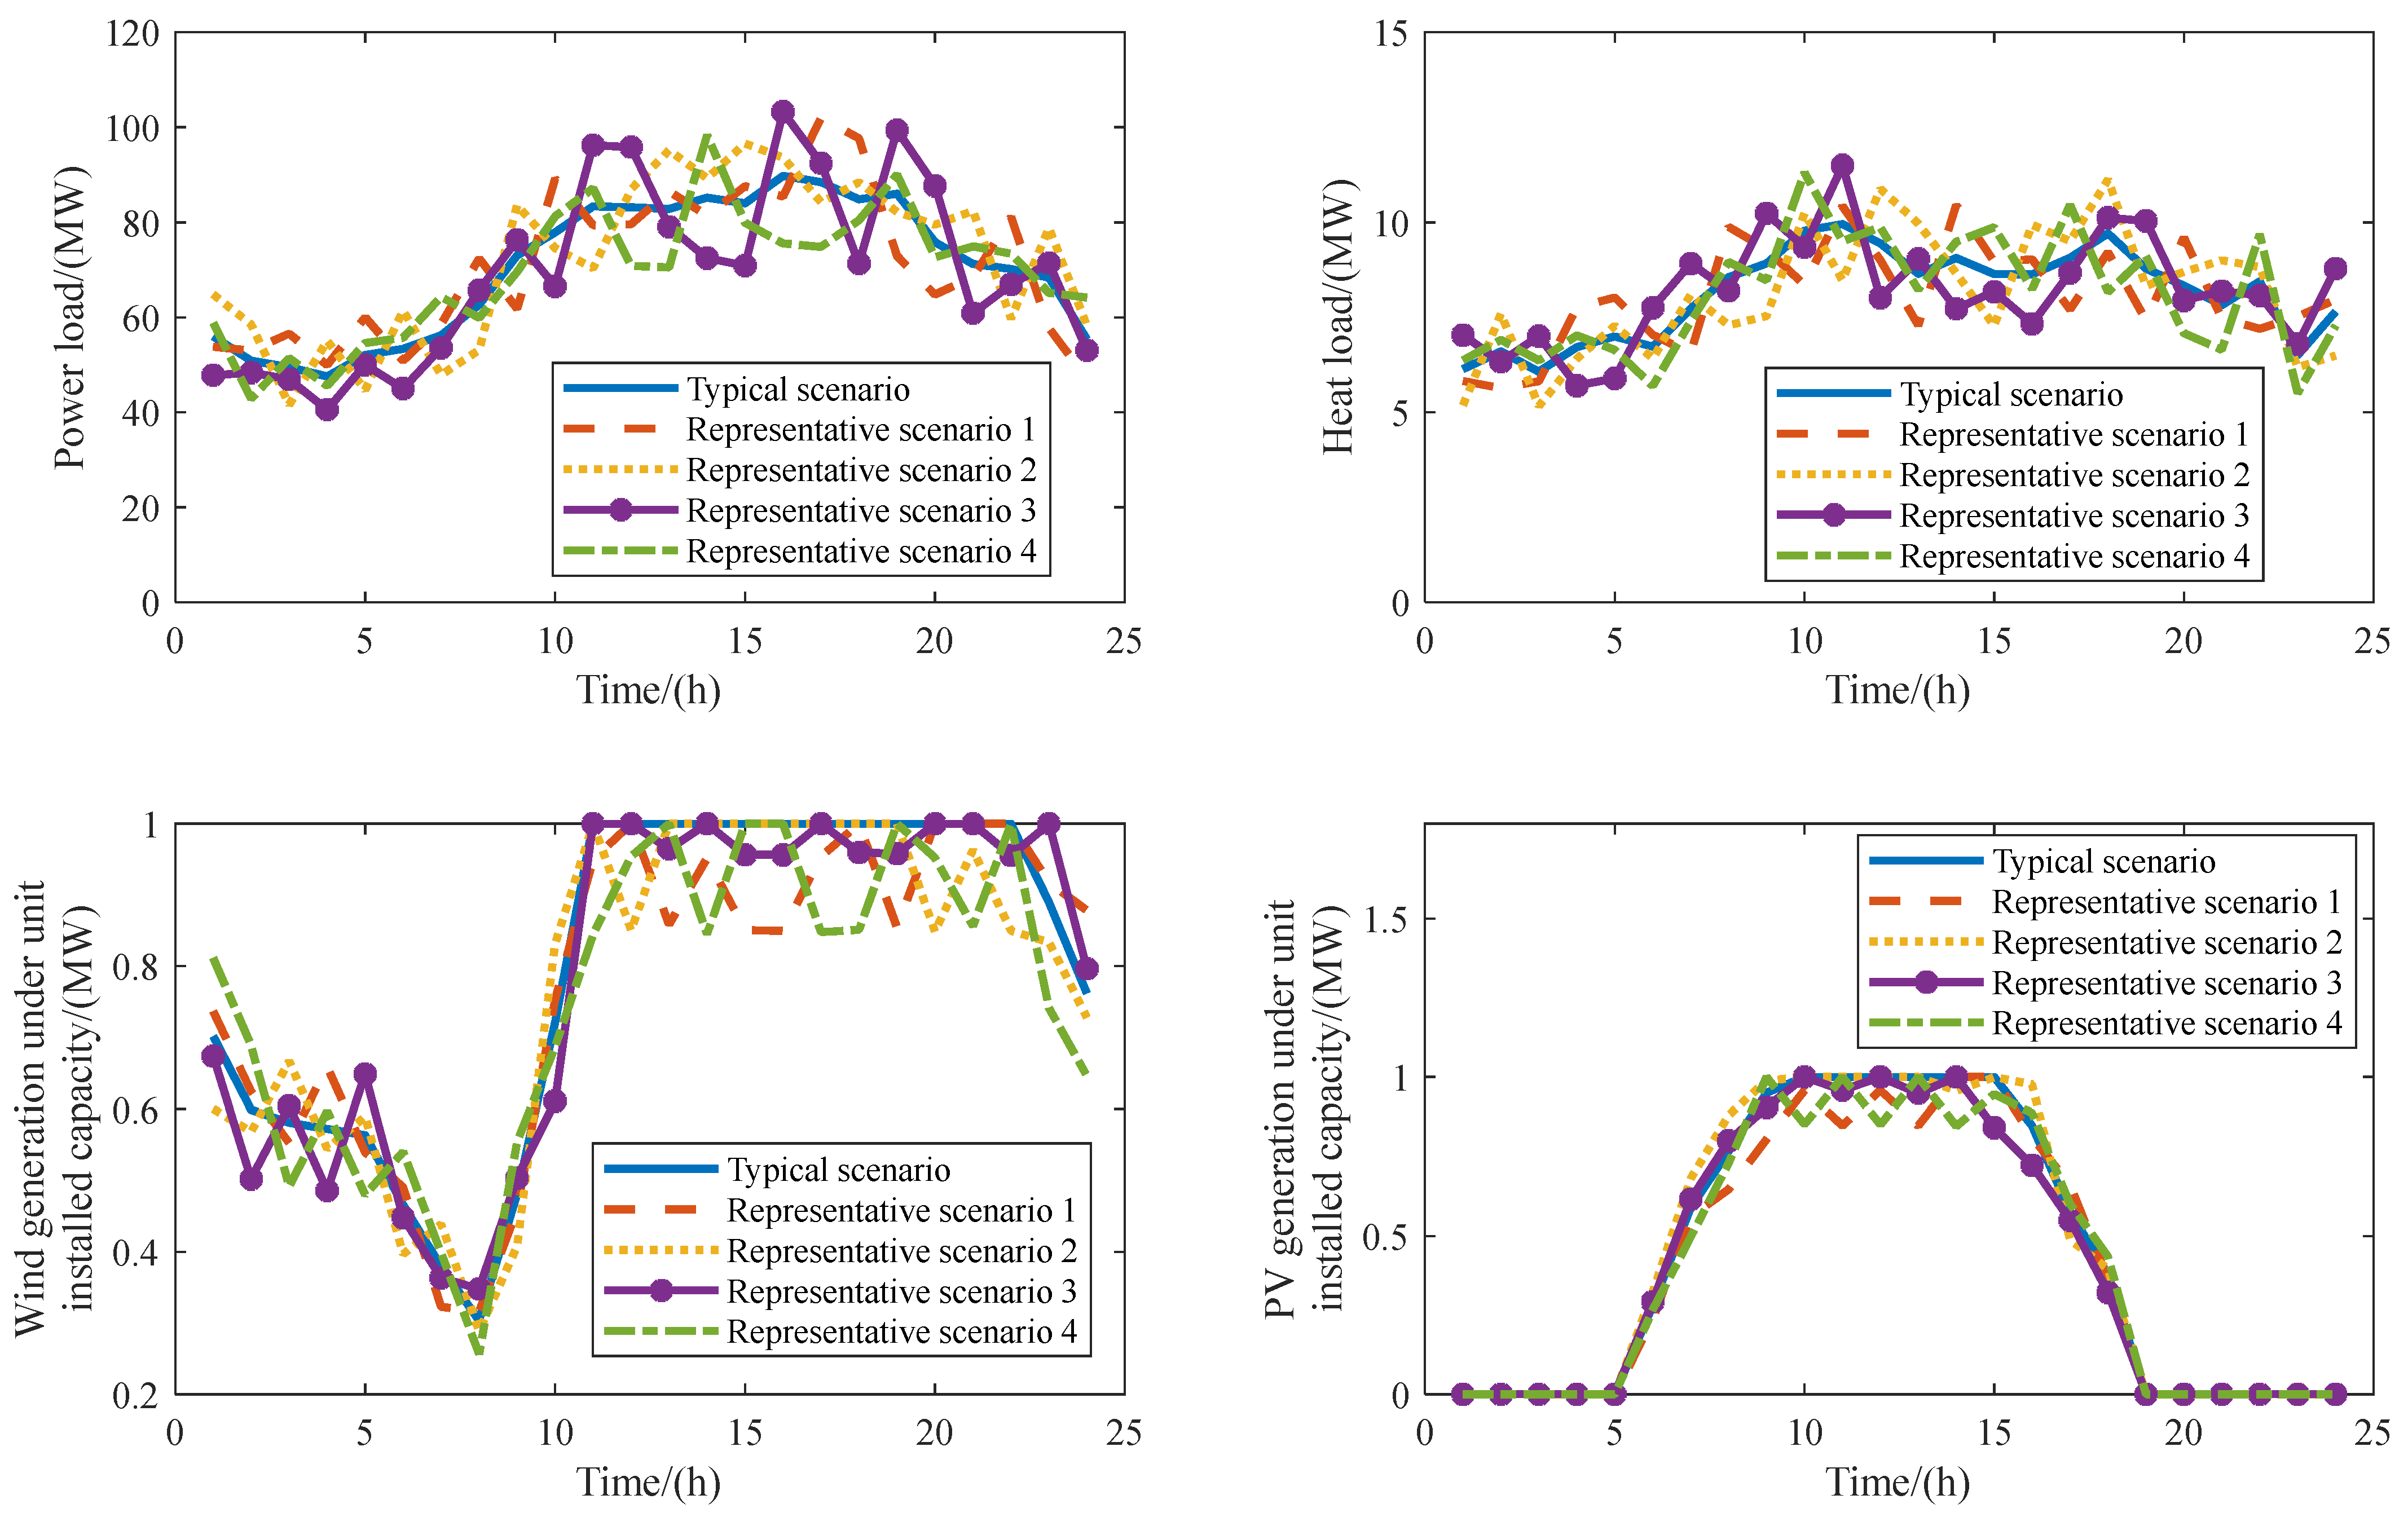
It is assumed that the predictive deviations in the load demands and renewable generation all follow the normal distribution with 0 mean and 10% variance [41]. Five thousand random scenarios were then generated using the Monte Carlo sampling method based on the historical data of a typical operating day. These scenarios were then reduced to four representative scenarios, as shown in Figure 5, through the synchronous substitution and reduction method [42]. The probability of the representative scenarios is shown in Table 3. The BFG generation and consumption of the steelmaking plant were fixed at 60.05 kg/s and 17.6 kg/s, respectively, during the typical operating day to maintain efficient and continuous steel production.
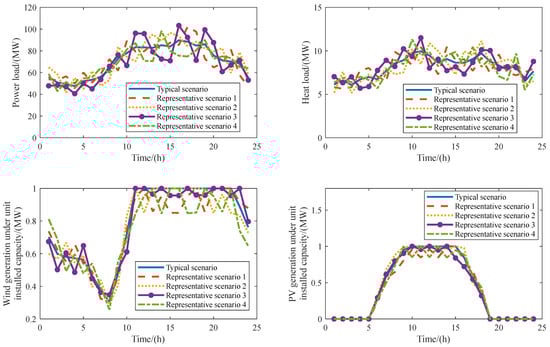
Figure 5.
Power and heat load and wind and PV generation with the units of installed capacity in typical and representative scenarios.
Table 3.
Probability of the four representative scenarios.
4.1. The Superiority of Deploying the MSHS System
To verify the superiority of deploying MSHS in the integrated BMWS system, the optimization results of the following two cases are compared.
Case 1: Proposed capacity optimization approach considering the deployment of MSHS.
Case 2: Capacity optimization without the deployment of MSHS.
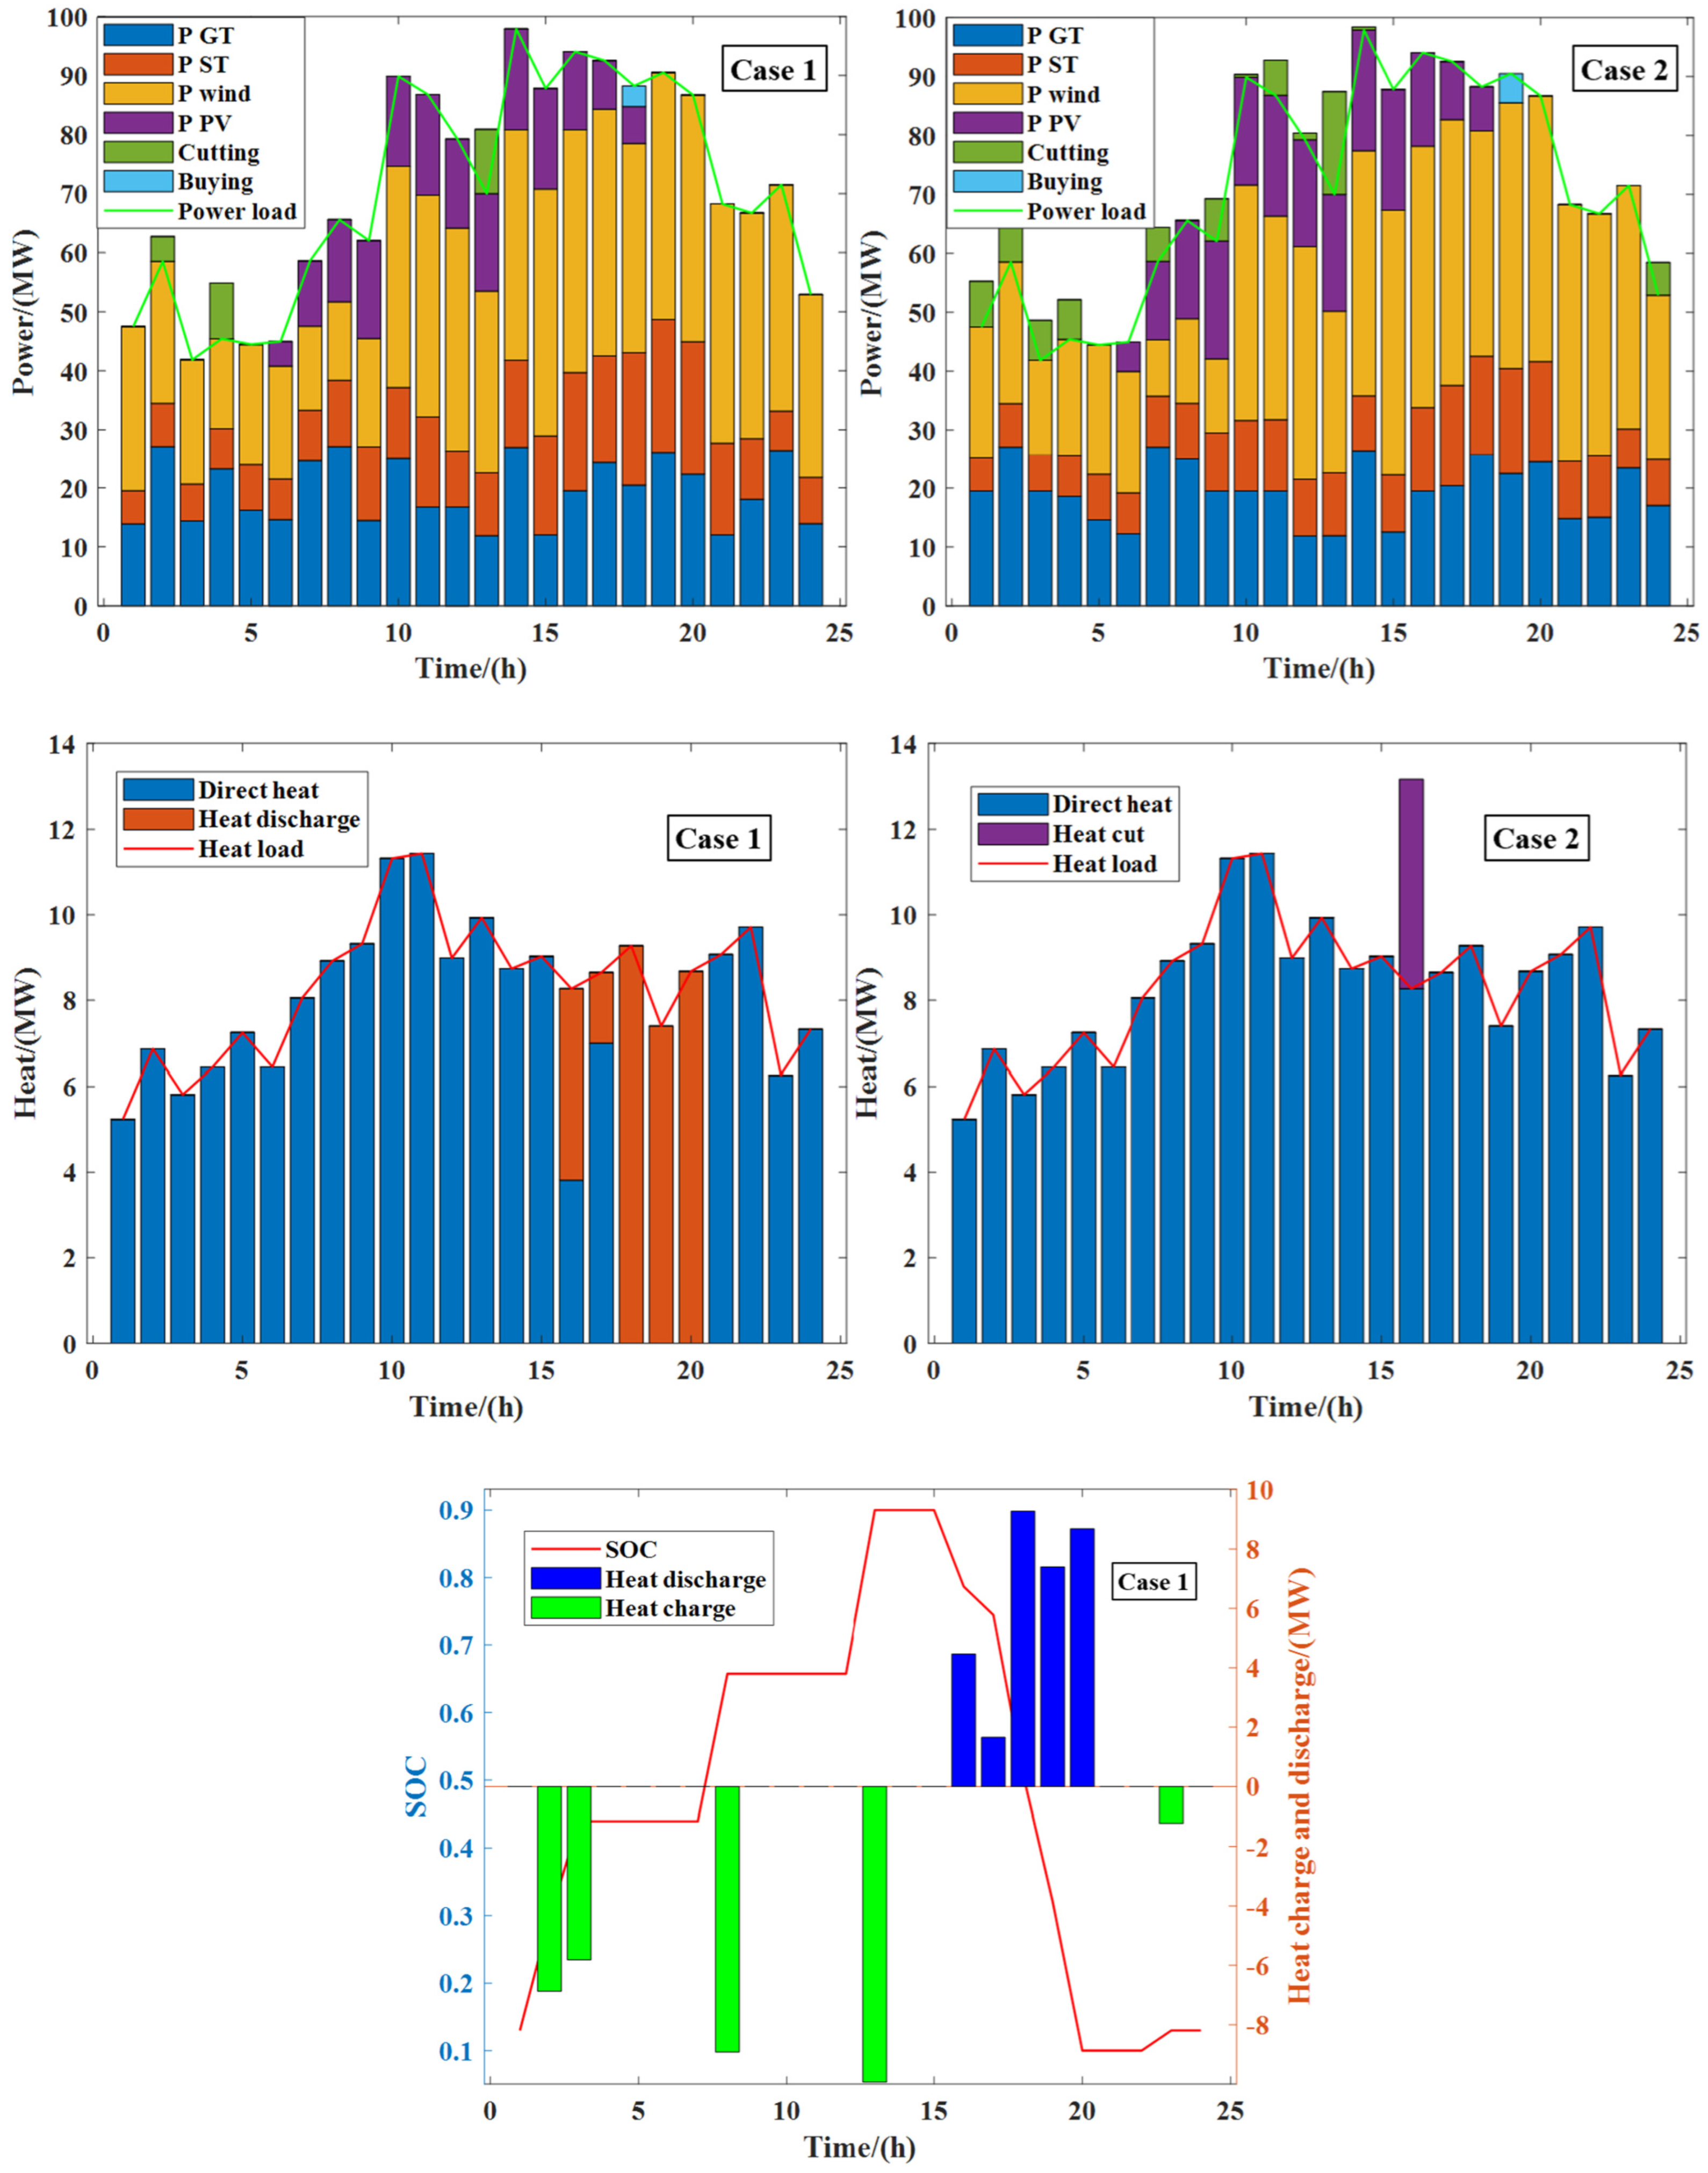
The capacity configuration results of the two cases are compared in Table 4. Four randomly generated testing scenarios are then applied to show the performance of the BMWS system. The scheduling results in testing scenario 1 are shown in Figure 6, while the expected economic performance of the BMWS system in these randomly generated testing scenarios is compared in Table 5.
Table 4.
Capacity configuration results of the integrated BMWS system in Cases 1 and 2.

Figure 6.
Scheduling results of the integrated BMWS in testing scenario 1.
Table 5.
Economic performance of the integrated BMWS system in Cases 1 and 2.
It can be observed that without the deployment of MSHS, the installed capacities of wind turbines and PV panels are larger in Case 2 to meet the load demand and reduce the energy purchase cost. However, this also brings about a significant curtailment of wind and PV power of 75.85 MWh for Case 2, as shown in testing scenario 1 (shown in Figure 6), leading to a low renewable utilization rate of only 92.78%. In addition, an electricity purchase of 4.31 MWh is still needed, but 4.9 MWh of heat is wasted at 16 h to meet the repeatability constraint of the BFG holder. The results indicate that relying solely on the flexibility of the BFGCC is insufficient to fully accommodate the fluctuating renewable energy while meeting the changing load demands.
In contrast, with the deployment of MSHS, the flexibility of the integrated BMWS is improved. Although the installed capacity of the BFG holder remains unchanged, the power and heat supply of the BMWS system can better match the load demand. The results show that the installed capacities of the wind turbine and PV panel are only 41.82 MW and 17.07 MW, respectively, in Case 1, but the total renewable curtailment is only 25.73 MWh with no waste heat in testing scenario 1. The renewable energy utilization rate is 97.23%, and only 3.03 MWh of electricity is required to be purchased. Figure 6 also shows that the MSHS charges in periods with low load demands or excess renewable generation, while it discharges in the period from 16 to 20 h when the electricity demand is high but renewable generation is relatively lower, so more heat can be used in the steam turbine of the BFGCC for electricity generation.
It can be observed in Table 5 that, with the deployment of MSHS, the investment cost of the BMWS system decreases by 8.97%, and the expected electricity purchase cost decreases by 29.72%. Although the expected O&M cost slightly increases due to the operation of MSHS, the expected total annualized cost still decreases by 2.28% compared with that in Case 2. The results illustrate the significant role of MSHS for power–heat decoupling in the BFGCC, which enhances the flexibility of the integrated system and eases the accommodation of renewable generation. Due to the use of wind and solar energy, the equivalent CO2 reduction of the BMWS system reaches 730.68 tons.
4.2. Performance Comparison of When/When Not Considering Uncertainty
To verify the superiority of considering uncertainties in capacity optimization, the following deterministic optimization approach is compared with the proposed approach (Case 1):
Case 3: Deterministic capacity optimization of the integrated BMWS in the typical scenario.
The capacity configuration results are shown in Table 6 and Table 7. It can be observed that the installed capacities of the wind turbine, PV panel, and BFG holder are smaller in Case 3, while the installed capacity of MSHS is larger; the reason is that the power and heat loads in the typical scenario considered in Case 3 are relatively smaller, but the fluctuations are stronger. Therefore, thermoelectric decoupling technology such as MSHS is required to improve the power load regulation ability of the BFGCC while meeting the heat demand. Although the investment cost and O&M cost are reduced in the testing scenarios for Case 3, a large amount of electricity needs to be purchased to meet the load demand. As a result, it is shown in Table 7 that the expected annualized total cost of the BMWS system is decreased by 5.66% in Case 1; moreover, the standard deviation significantly decreases by 81.45%. The results indicate that considering uncertainties in load demand and renewable generation effectively improves the economy and reliability of the capacity configuration results.
Table 6.
Capacity configuration results of the integrated BMWS system in Cases 1 and 3.
Table 7.
Economic performance of the integrated BMWS system in Cases 1 and 3.
5. Conclusions
This paper proposes the deployment of MSHS in a BFGCC to unlock the power–heat coupling in it and enhance the flexibility of its energy supply. A stochastic capacity optimization of an integrated BFGCC–MSHS–wind–solar energy system is presented for the economic, safe, and reliable operation thereof. The results showed the following: (1) the BMWS system can provide a reduction of 730.68 tons of equivalent CO2 emissions in 24 h due to the successful utilization of renewable energy; (2) the deployment of MSHS can reduce the expected annualized total cost of the BMWS system by 2.28% due to the reductions in the investment cost and electricity purchase cost; (3) considering uncertainties in power/heat load and wind/PV generation can reduce the expected annualized total cost of the BMWS system and the corresponding standard deviation by 5.66% and 81.45%, respectively, effectively improving the economy and reliability of the capacity configuration optimization.
This paper applies steady-state process models in the capacity configuration of the BMWS system, which ignores the transient performance during changes in operating conditions. However, many processes in BFGCCs and MSHS systems have strong inertia and time-delay characteristics. Considering the dynamics of these processes to further improve the feasibility and optimality of the configuration results will be our future research direction.
Author Contributions
Conceptualization, C.G. and Z.S. (Zhuoyue Shi); methodology, X.C.; software, Z.S. (Ziwen Sun); validation, X.C., T.S. and X.W.; formal analysis, X.C.; investigation, C.G. and Y.J.; resources, C.G.; data curation, C.G. and Z.S.(Zhuoyue Shi); writing—original draft preparation, C.G. and Z.S.(Zhuoyue Shi).; writing—review and editing, X.W.; visualization, X.W.; supervision, X.W.; project administration, C.G. and X.W.; funding acquisition, C.G. All authors have read and agreed to the published version of the manuscript.
Funding
This research was funded by the National Natural Science Foundation of China (NSFC) under Grant 52376002, the EU H2020 RISE project OPTIMAL under Grant Agreement 101007963, the Science and Technology Project of Jiangsu Frontier Electric Technology Co., Ltd. under Grant Agreement KJ202202, and the Fundamental Research Funds for the Central Universities.
Data Availability Statement
The original contributions presented in the study are included in the article, further inquiries can be directed to the corresponding author.
Conflicts of Interest
Authors Chamin Geng, Ziwen Sun, Yawei Jin and Tian Shi were employed by the company Jiangsu Frontier Electric Technology Co., Ltd. The remaining authors declare that the research was conducted in the absence of any commercial or financial relationships that could be construed as a potential conflict of interest.
Nomenclature
| Abbreviation | |
| BFGCC | Blast-furnace-gas-fired combined-cycle power plant |
| MSHS | Molten salt heat storage |
| BMWS | BFGCC–MSHS–wind–solar |
| PV | Photovoltaic |
| CCUS | Energy storage and carbon capture and utilization |
| CHP | Combined heat and power |
| O&M | Operation and maintenance |
| Symbol | |
| ρ | Density |
| m | Mass |
| G | Flow rate |
| t | Time |
| Q | Heat |
| P | Power |
| v | Speed |
| η | Efficiency |
| E | Capacity |
| SOC | State of charge |
| M | Costs |
| c | Cost coefficients |
| Obj | Objective function |
| Subscript | |
| CCGT | The index of the combined-cycle gas turbine system |
| GH | The index of the gas holder |
| GT | The index of the gas turbine |
| WB | The index of the waste heat boiler |
| ST | The index of the steam turbine |
| DH | The index of direct heating supply |
| ch | The index of the charging state |
| dis | The index of the discharging state |
| wind | The index of wind power |
| investment | The index of investment costs |
| om | The index of operation and maintenance costs |
| buy | The index of purchase costs |
| pen | The index of the penalty costs |
| cur | The index of the curtailment |
| max | The upper limitation |
| min | The lower limitation |
References
- Meng, F.; Rong, G.; Zhao, R.; Chen, B.; Xu, X.; Qiu, H.; Cao, X.; Zhao, L. Incorporating biochar into fuels system of iron and steel industry: Carbon emission reduction potential and economic analysis. Appl. Energy 2024, 356, 122377. [Google Scholar] [CrossRef]
- World Steel Association. Steel Statistical Yearbook 2020 Concise Version [EB/OL]; World Steel Association: Brussels, Belgium, 2020. [Google Scholar]
- Zhang, X.; Jiao, K.; Zhang, J.; Guo, Z. A review on low carbon emissions projects of steel industry in the World. J. Clean. Prod. 2021, 306, 127259. [Google Scholar] [CrossRef]
- Kuang, S.; Li, Z.; Yu, A. Review on modeling and simulation of blast furnace. Steel Res. Int. 2018, 89, 1700071. [Google Scholar] [CrossRef]
- International Energy Agency (IEA). Iron and Steel Technology Roadmap [EB/OL]; International Energy Agency: Paris, France, 2020. [Google Scholar]
- Kim, J.; Sovacool, B.K.; Bazilian, M.; Griffiths, S.; Lee, J.; Yang, M.; Lee, J. Decarbonizing the iron and steel industry: A systematic review of sociotechnical systems, technological innovations, and policy options. Energy Res. Soc. Sci. 2022, 89, 102565. [Google Scholar] [CrossRef]
- Perpiñán, J.; Peña, B.; Bailera, M.; Eveloy, V.; Kannan, P.; Raj, A.; Lisbona, P.; Romeo, L.M. Integration of carbon capture technologies in blast furnace based steel making: A comprehensive and systematic review. Fuel 2023, 336, 127074. [Google Scholar] [CrossRef]
- Wang, Y.; Ding, L.; Long, H.; Xiao, J.; Qian, L.; Wang, H.; Xu, C. Carbonyl sulfur removal from blast furnace gas: Recent progress, application status and future development. Chemosphere 2022, 307 Pt 4, 136090. [Google Scholar] [CrossRef] [PubMed]
- Hou, S.; Chen, C.; Chang, C.; Wu, C.; Ou, J.; Lin, T. Firing blast furnace gas without support fuel in steel mill boilers. Energy Convers. Manag. 2011, 52, 2758–2767. [Google Scholar] [CrossRef]
- Fallah Ardashir, A.; Ranjbar, F.; Yari, M. Utilizing Blast Furnace gas to run a supercritical CO2 cycle to meet part of the internal consumption of the iron plant and to produce fresh water through a multi-effect desalination unit. Energy Equip. Syst. 2023, 11, 339–351. [Google Scholar]
- Wu, X.; Xi, H.; Ren, Y.; Lee, K.Y. Power-carbon coordinated control of BFG-fired CCGT power plant integrated with solvent-based post-combustion CO2 capture. Energy 2021, 226, 120435. [Google Scholar] [CrossRef]
- de Campos, G.B.; Bringhenti, C.; Cavalca, D.F.; Tomita, J.T.; Riederer, W.; Pinto, R.L. Parallel Between Rankine and Combined-Cycle Power Plants Configurations Burning Blast Furnace Gas. In Proceedings of the Turbo Expo: Power for Land, Sea, and Air, Charlotte, NC, USA, 26–30 June 2017; American Society of Mechanical Engineers: New York, NY, USA, 2017. [Google Scholar]
- Yao, H.; Sheng, D.; Chen, J.; Li, W.; Wan, A.; Chen, H. Exergoeconomic analysis of a combined cycle system utilizing associated gases from steel production process based on structural theory of thermoeconomics. Appl. Therm. Eng. 2013, 51, 476–489. [Google Scholar] [CrossRef]
- Kirin, A.; Gubarev, V. Modernization of the Scheme and Creation of a Program for the Analysis of the Cycle of a Combined Cycle Gas Turbine on Blast-Furnace Gas. In Proceedings of the 2019 1st International Conference on Control Systems, Mathematical Modelling, Automation and Energy Efficiency (SUMMA), Lipetsk, Russia, 20–22 November 2019; IEEE: New York, NY, USA, 2019. [Google Scholar]
- Zhang, X.; Tang, Z.; Wu, X. Dynamic Matrix Control with Gas Calorific Value Feed-Forward Design for Blast Furnace Gas-Fired Combined-Cycle Gas Turbine. In Proceedings of the 2022 4th International Conference on Electrical Engineering and Control Technologies (CEECT), Shanghai, China, 16–18 December 2022; IEEE: New York, NY, USA, 2022. [Google Scholar]
- Teo, P.T.; Zakaria, S.K.; Salleh, S.Z.; Taib, M.A.A.; Mohd Sharif, N.; Abu Seman, A.; Mohamed, J.J.; Yusoff, M.; Yusoff, A.H.; Mohamad, M.; et al. Assessment of Electric Arc Furnace (EAF) Steel Slag Waste’s Recycling Options into Value Added Green Products: A Review. Metals 2020, 10, 1347. [Google Scholar] [CrossRef]
- Zhao, X.; Yuan, H.; Han, Y.; Zhang, Z.; Bai, H. Discussion on the Application of Rooftop Photovoltaic Power Plant in the Steel Enterprise. In Proceedings of the Energy Technology 2020: Recycling, Carbon Dioxide Management, and Other Technologies, San Diego, CA, USA, 16 January 2020; Springer: Berlin/Heidelberg, Germany, 2020. [Google Scholar]
- Xi, H.; Wu, X.; Chen, X.; Sha, P. Artificial intelligent based energy scheduling of steel mill gas utilization system towards carbon neutrality. Appl. Energy 2021, 295, 117069. [Google Scholar] [CrossRef]
- Wu, X.; Xi, H.; Qiu, R.; Lee, K. Low carbon optimal planning of the steel mill gas utilization system. Appl. Energy 2023, 343, 121154. [Google Scholar] [CrossRef]
- Otto, A.; Robinius, M.; Grube, T.; Schiebahn, S.; Praktiknjo, A.; Stolten, D. Power-to-steel: Reducing CO2 through the integration of renewable energy and hydrogen into the German steel industry. Energies 2017, 10, 451. [Google Scholar] [CrossRef]
- Aliari, Y.; Haghani, A. Planning for integration of wind power capacity in power generation using stochastic optimization. Renew. Sustain. Energy Rev. 2016, 59, 907–919. [Google Scholar] [CrossRef]
- Li, R.; Yang, Y. Multi-objective capacity optimization of a hybrid energy system in two-stage stochastic programming framework. Energy Rep. 2021, 7, 1837–1846. [Google Scholar] [CrossRef]
- Ahmed, N.A.; Miyatake, M.; Al-Othman, A. Power fluctuations suppression of stand-alone hybrid generation combining solar photovoltaic/wind turbine and fuel cell systems. Energy Convers. Manag. Manag. 2008, 49, 2711–2719. [Google Scholar] [CrossRef]
- Garmabdari, R.; Moghimi, M.; Yang, F.; Lu, J. Multi-objective optimisation and planning of grid-connected cogeneration systems in presence of grid power fluctuations and energy storage dynamics. Energy 2020, 212, 118589. [Google Scholar] [CrossRef]
- Luo, H.; Shen, Q.; Chen, Y.; Sun, S.; Lin, J.; Zhang, H. Thermodynamic Performance of Molten Salt Heat Storage System Used for Regulating Load and Supplying High Temperature Steam in Coal-Fired Cogeneration Power Plants. E3S Web Conf. 2020, 194, 01034. [Google Scholar] [CrossRef]
- Li, L.; Li, W.; Ma, J. Research on Coordinated Control Strategy of Power Response Rate of Thermal Power Plant with High Temperature Molten Salt Heat Storage. Int. J. Heat Technol. 2023, 41, 55–62. [Google Scholar] [CrossRef]
- Fu, Y.; Ning, Z.; Ge, W.; Fan, Q.; Zhou, G.; Ma, T. Using molten-salt energy storage to decrease the minimum operation load of the coal-fired power plant. Therm. Sci. 2020, 24, 2757–2771. [Google Scholar] [CrossRef]
- Gu, W.; Tang, Y.; Peng, S.; Wang, D.; Sheng, W.; Liu, K. Optimal configuration and analysis of combined cooling, heating, and power microgrid with thermal storage tank under uncertainty. J. Renew. Sustain. Energy 2015, 7, 013104. [Google Scholar] [CrossRef]
- Bartnik, R.; Buryn, Z. Conversion of Coal-Fired Power Plants to Cogeneration and Combined-Cycle: Thermal and Economic Effectiveness; Springer Science & Business Media: Berlin/Heidelberg, Germany, 2011. [Google Scholar]
- Xue, X.; Liu, X.; Zhu, Y.; Yuan, L.; Zhu, Y.; Jin, K.; Zhang, L.; Zhou, H. Numerical modeling and parametric study of the heat storage process of the 1.05 MW molten salt furnace. Energy 2023, 282, 128740. [Google Scholar] [CrossRef]
- Ren, Y.; Shen, J.; Zhang, J. Modeling and dynamic simulation of blast furnace gas steam combined cycle system. J. Chin. Soc. Power Eng. 2020, 40, 965–974. [Google Scholar]
- Wei, X.; Peng, Q.; Ding, J.; Yang, X.; Yang, J.; Long, B. Theoretical study on thermal stability of molten salt for solar thermal power. Appl. Therm. Eng. 2013, 54, 140–144. [Google Scholar] [CrossRef]
- Gao, J.; Shi, J.; Kang, H.; Zhang, Z. Simulation analysis of the influence of exhaust gas parameters of the gas turbine on the operational performance of the once-through waste heat boiler. Electr. Power Sci. Eng. 2022, 38, 58–64. [Google Scholar]
- Wang, Y.; Zou, R.; Liu, F.; Zhang, L.; Liu, Q. A review of wind speed and wind power forecasting with deep neural networks. Appl. Energy 2021, 304, 117766. [Google Scholar] [CrossRef]
- El Chaar, L.; El Zein, N. Review of photovoltaic technologies. Renew. Sustain. Energy Rev. 2011, 15, 2165–2175. [Google Scholar] [CrossRef]
- Zhao, Y.; Wang, C.; Liu, M.; Chong, D.; Yan, J. Improving operational flexibility by regulating extraction steam of high-pressure heaters on a 660 MW supercritical coal-fired power plant: A dynamic simulation. Appl. Energy 2018, 212, 1295–1309. [Google Scholar] [CrossRef]
- Luo, Y.; Yang, D.; Yin, Z.; Zhou, B.; Sun, Q. Optimal configuration of hybrid-energy microgrid considering the correlation and randomness of the wind power and photovoltaic power. IET Renew. Power Gener. 2020, 14, 616–627. [Google Scholar] [CrossRef]
- Zhang, L.; Chen, L.; Zhu, W.; Lyu, L.; Cai, G.; Hai, K.L. Research on the optimal allocation method of source and storage capacity of integrated energy system considering integrated demand response. Energy Rep. 2022, 8, 10434–10448. [Google Scholar] [CrossRef]
- Li, J.; Xu, W.; Cui, P.; Qiao, B.; Feng, X.; Xue, H.; Wang, X.; Xiao, L. Optimization configuration of regional integrated energy system based on standard module. Energy 2020, 229, 110485. [Google Scholar] [CrossRef]
- Qiao, Y.; Hu, F.; Xiong, W.; Guo, Z.; Zhou, X.; Li, Y. Multi-objective optimization of integrated energy system considering installation configuration. Energy 2023, 263, 125785. [Google Scholar] [CrossRef]
- Ramadhani, U.H.; Shepero, M.; Munkhammar, J.; Widén, J.; Etherden, N. Review of probabilistic load flow approaches for power distribution systems with photovoltaic generation and electric vehicle charging. Int. J. Electr. Power Energy Syst. 2020, 120, 106003. [Google Scholar] [CrossRef]
- Yu, C.; Yang, L.; Qi, P.; Wan, J.; Zhu, Y.; Zhang, Q. Research on dynamic energy optimization strategy of park smart energy system with complementary multi-energy. In Proceedings of the Journal of Physics: Conference Series, 2022 4th International Conference on Energy, Power and Grid (ICEPG 2022), Guangzhou, China, 23–25 September 2022; IOP Publishing: Bristol, UK, 2022. [Google Scholar]
Disclaimer/Publisher’s Note: The statements, opinions and data contained in all publications are solely those of the individual author(s) and contributor(s) and not of MDPI and/or the editor(s). MDPI and/or the editor(s) disclaim responsibility for any injury to people or property resulting from any ideas, methods, instructions or products referred to in the content. |
© 2024 by the authors. Licensee MDPI, Basel, Switzerland. This article is an open access article distributed under the terms and conditions of the Creative Commons Attribution (CC BY) license (https://creativecommons.org/licenses/by/4.0/).