
E-Heater Performance for Aftertreatment Warm-Up in a 48V Mild-Hybrid Heavy-Duty Truck over Real Driving Cycles


Abstract
1. Introduction
- First, analyze the ATS warm-up time’s impact using a ‘Low-NOx’ HD engine, compared to an EPA 2010-certified HD diesel truck as a baseline (Base).
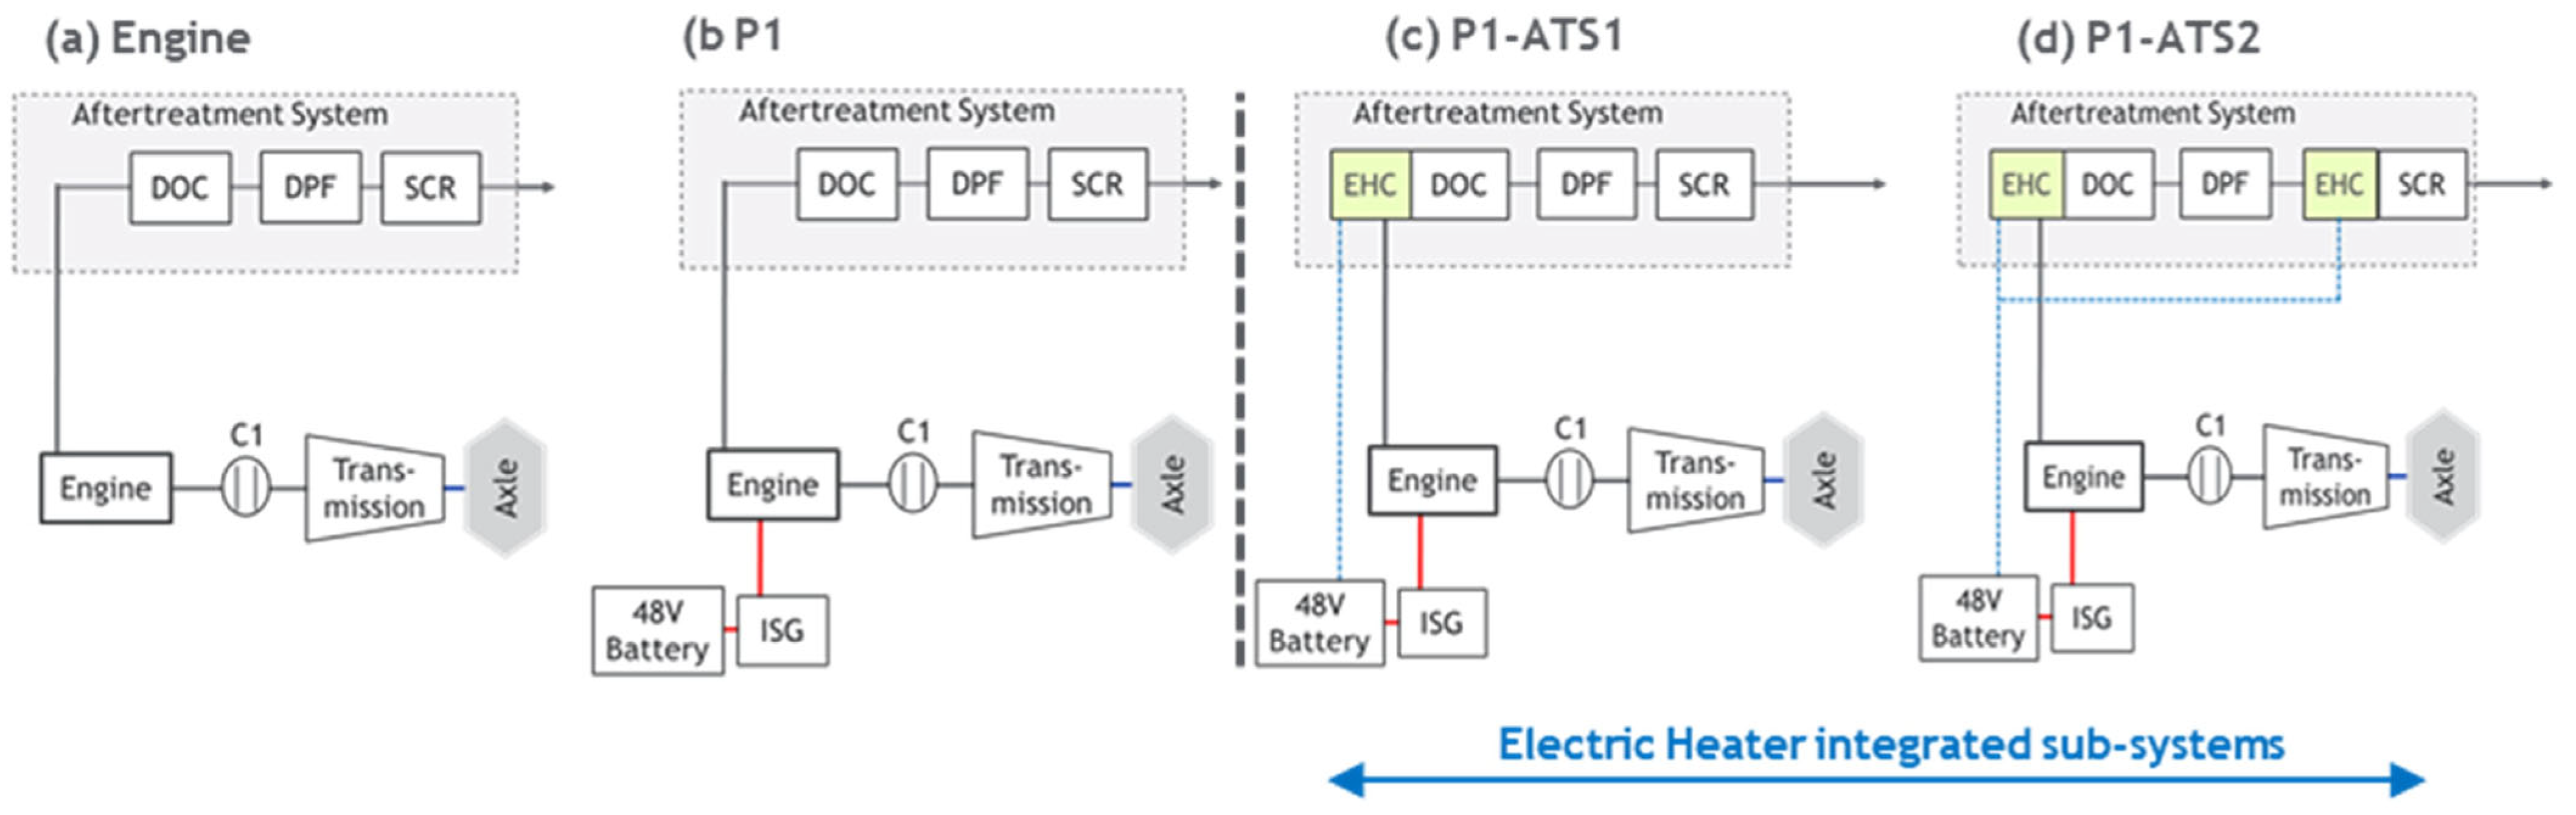
- Evaluate different EHC-integrated ATS configurations using a P1 hybrid powertrain for the ATS warm-up time reduction, EHC power penalty, and regenerative energy.
- Identify the best HD hybrid powertrain configuration in terms of the lowest ATS warm-up time and net fuel consumption for each region.
2. 1-D Vehicle Simulation Methodology
2.1. Vehicle Modeling
2.2. Engine and ATS Modeling
2.3. Electric Heater Compoenent (EHC) Modeling
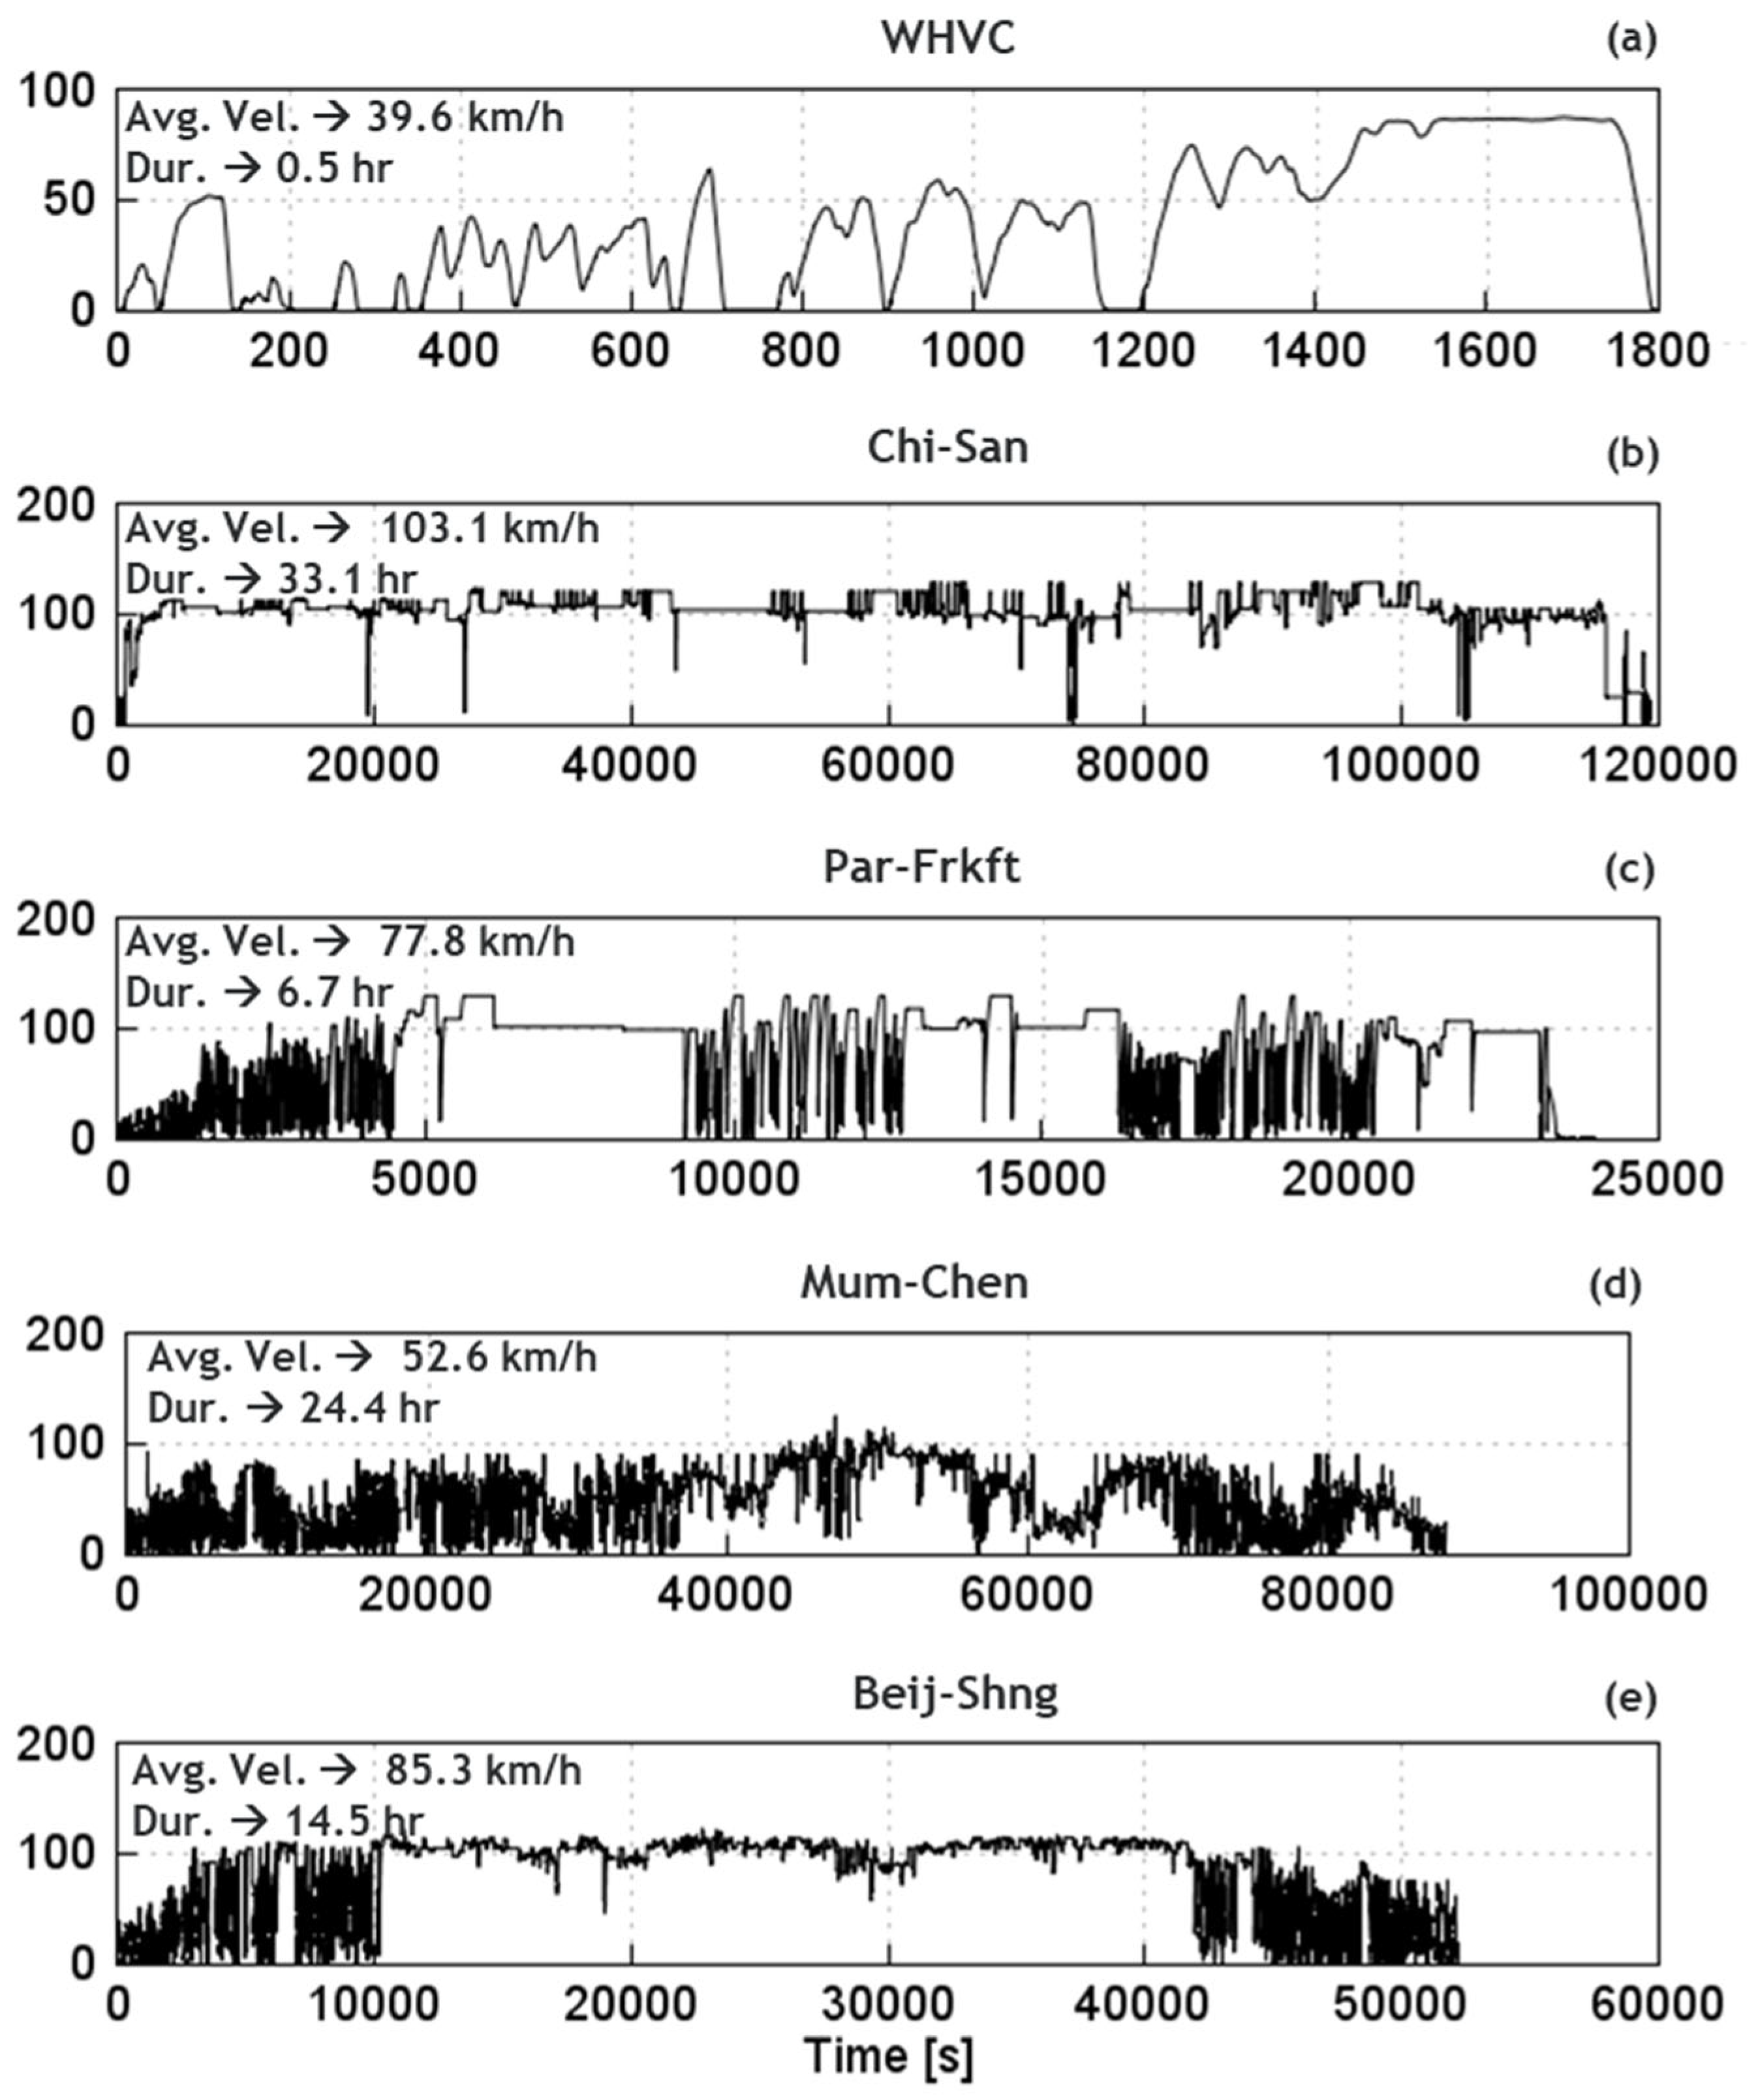
2.4. Real-World Driving Cycles
- World Harmonized Vehicle Cycle (WHVC):
- Duration of 1800 s, with an average speed of less than 40 km/h.
- A mix of idle, transient (urban driving), and highway cruising.
- Represents a certification cycle applicable globally but may not fully reflect real-world conditions.
- Chicago–San Francisco (Chi–San) Route:
- Duration of 36 h, with an average speed over 100 km/h.
- Dominated by highway cruising.
- Reflects real-world long-haul driving in the US.
- Paris–Frankfurt (Par–Frkft) Route:
- A mix of urban and highway cruising.
- An average speed maintained over 75 km/h.
- Represents European driving conditions.
- Mumbai–Chennai (Mum–Chen) Route:
- Dominated by transient behavior throughout the cycle.
- A moderate average speed of nearly 50 km/h.
- Reflects real-world driving patterns in India.
- Beijing–Shanghai (Beij–Shng) Route:
- Aggressive transients at both ends, indicating near port region driving.
- The middle region maintains highway cruising above 100 km/h.
- Represents real-world driving conditions in China.
3. Objectives
4. Results
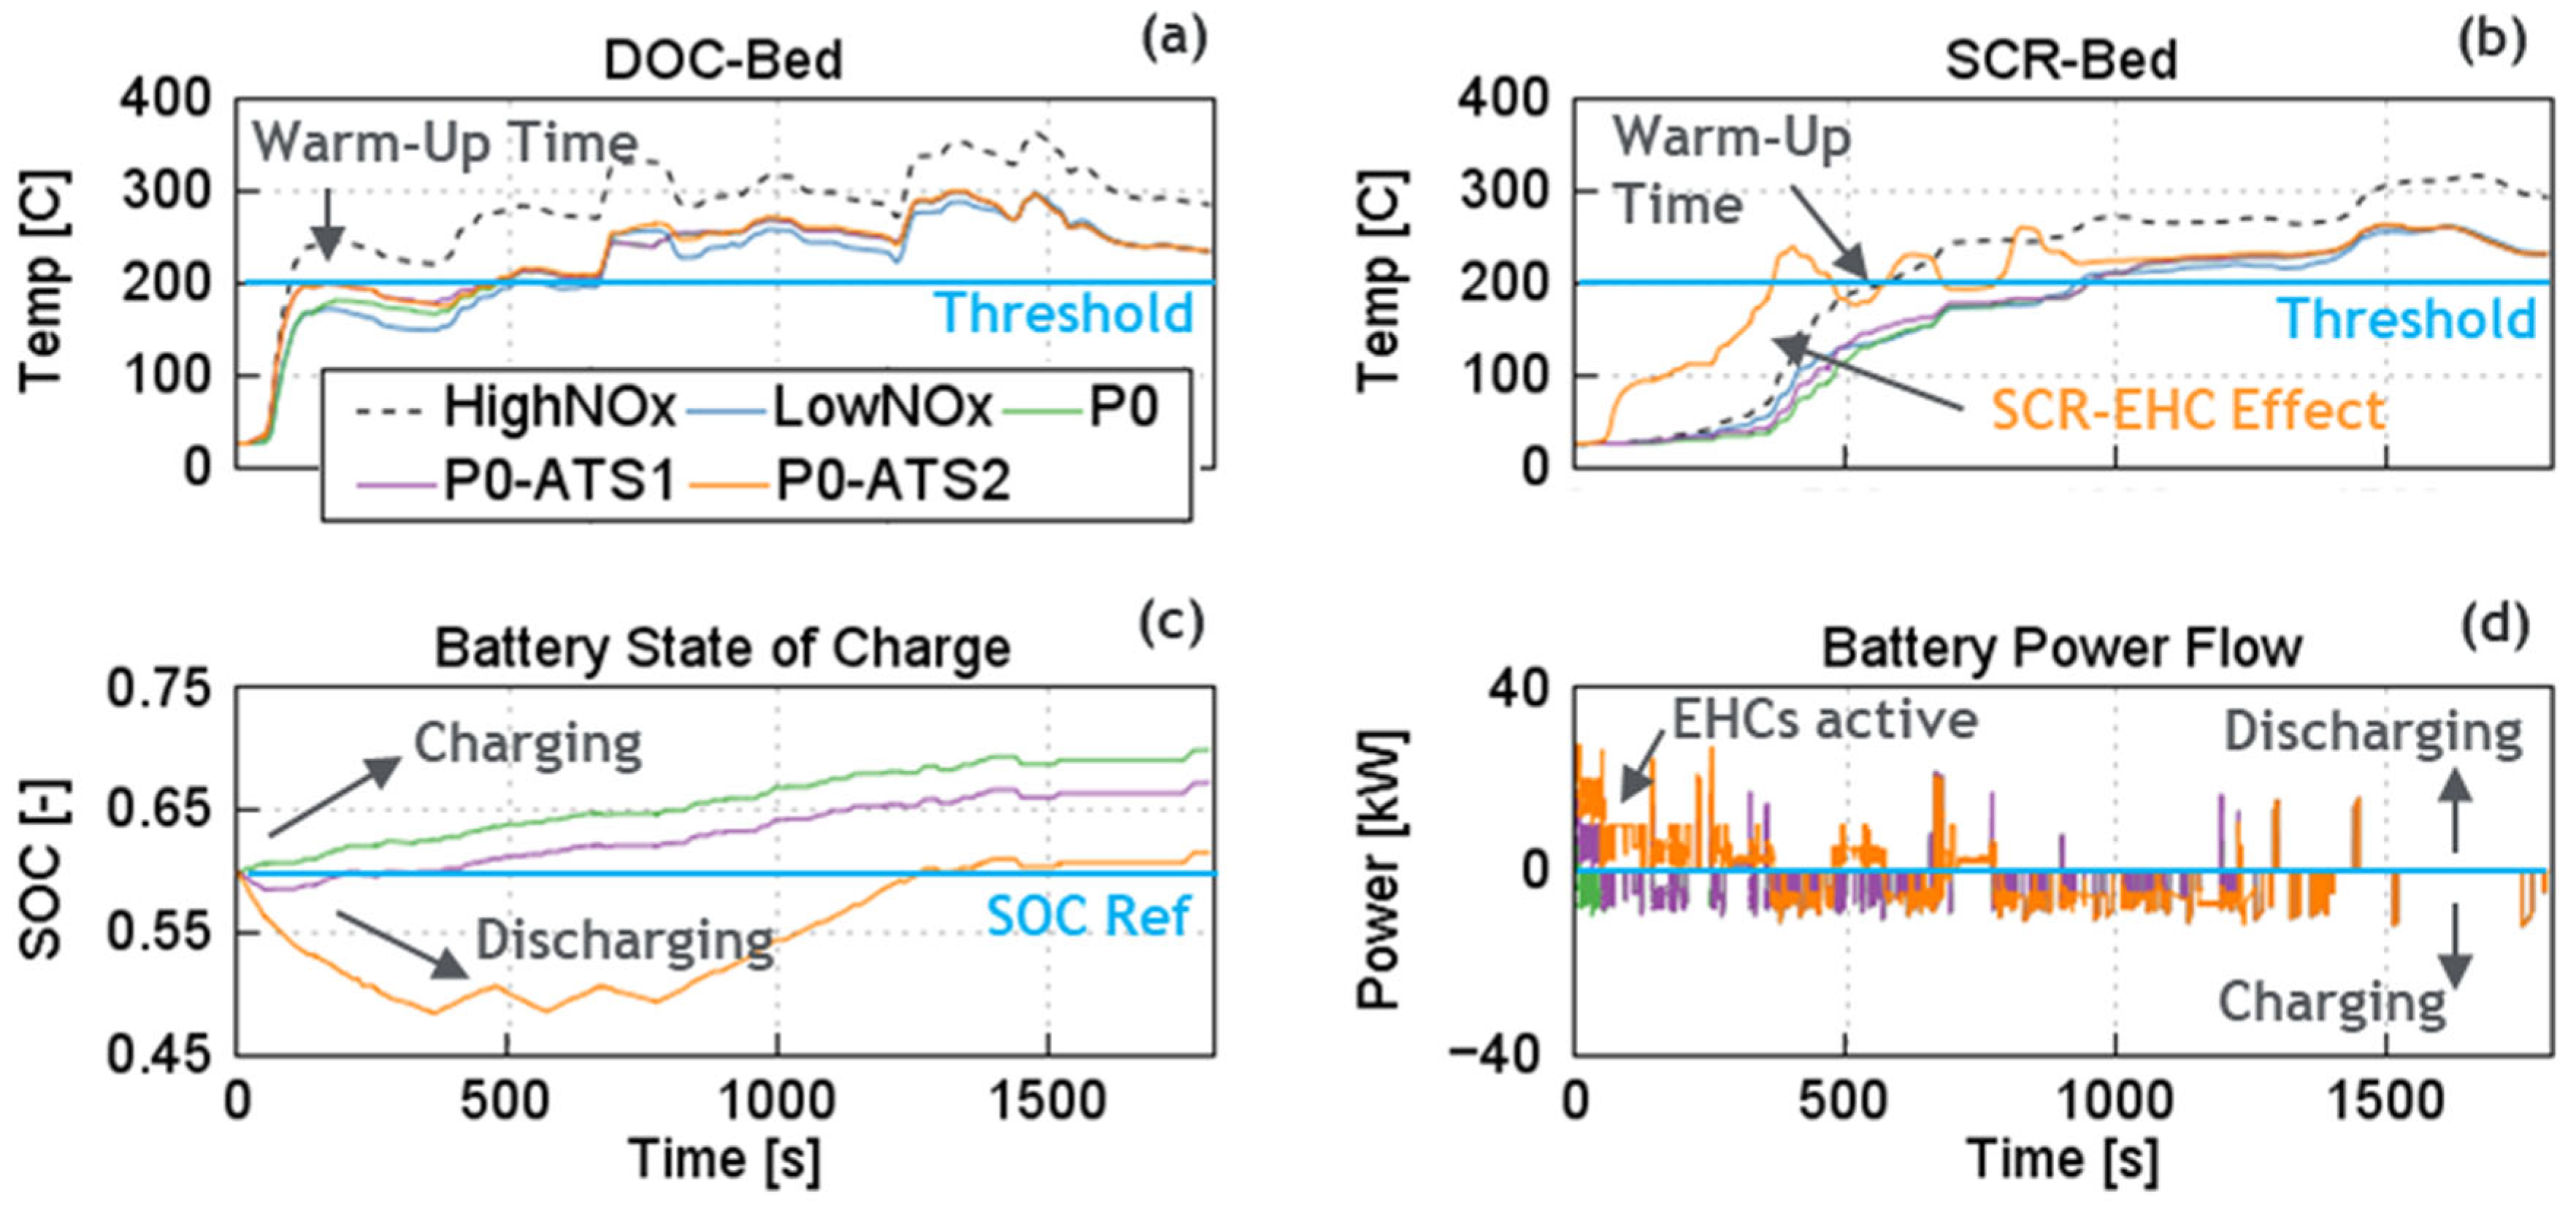
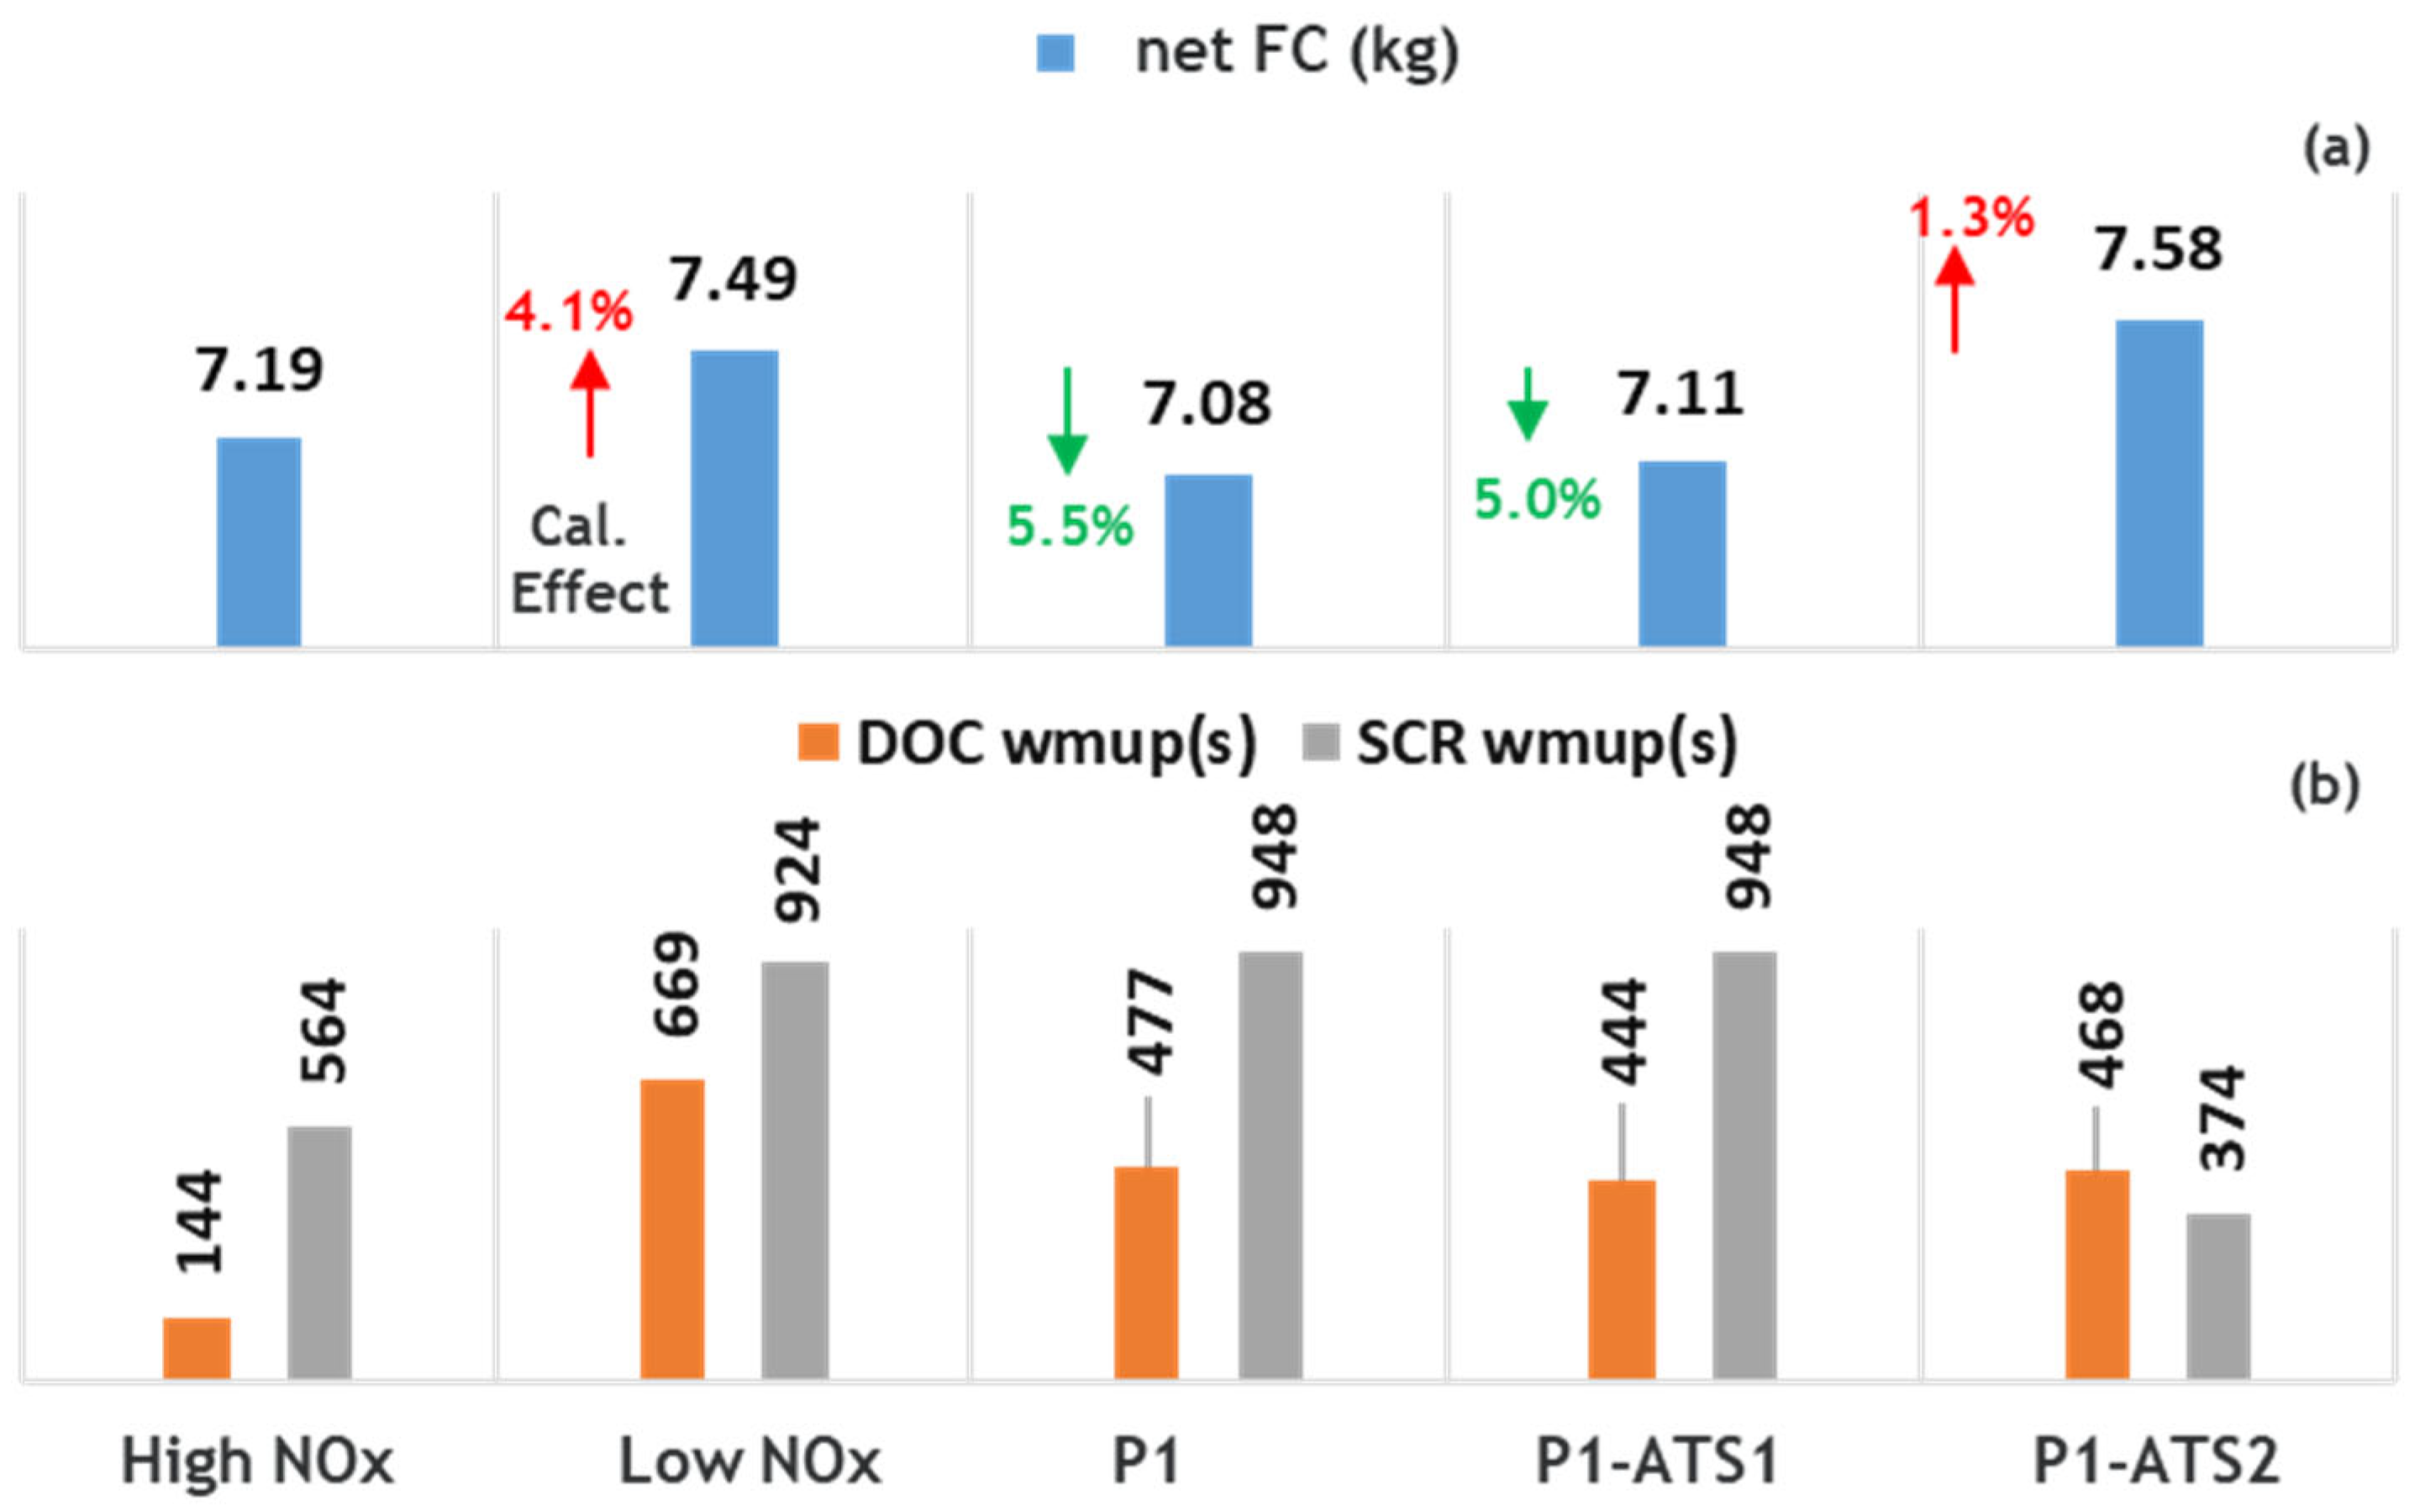
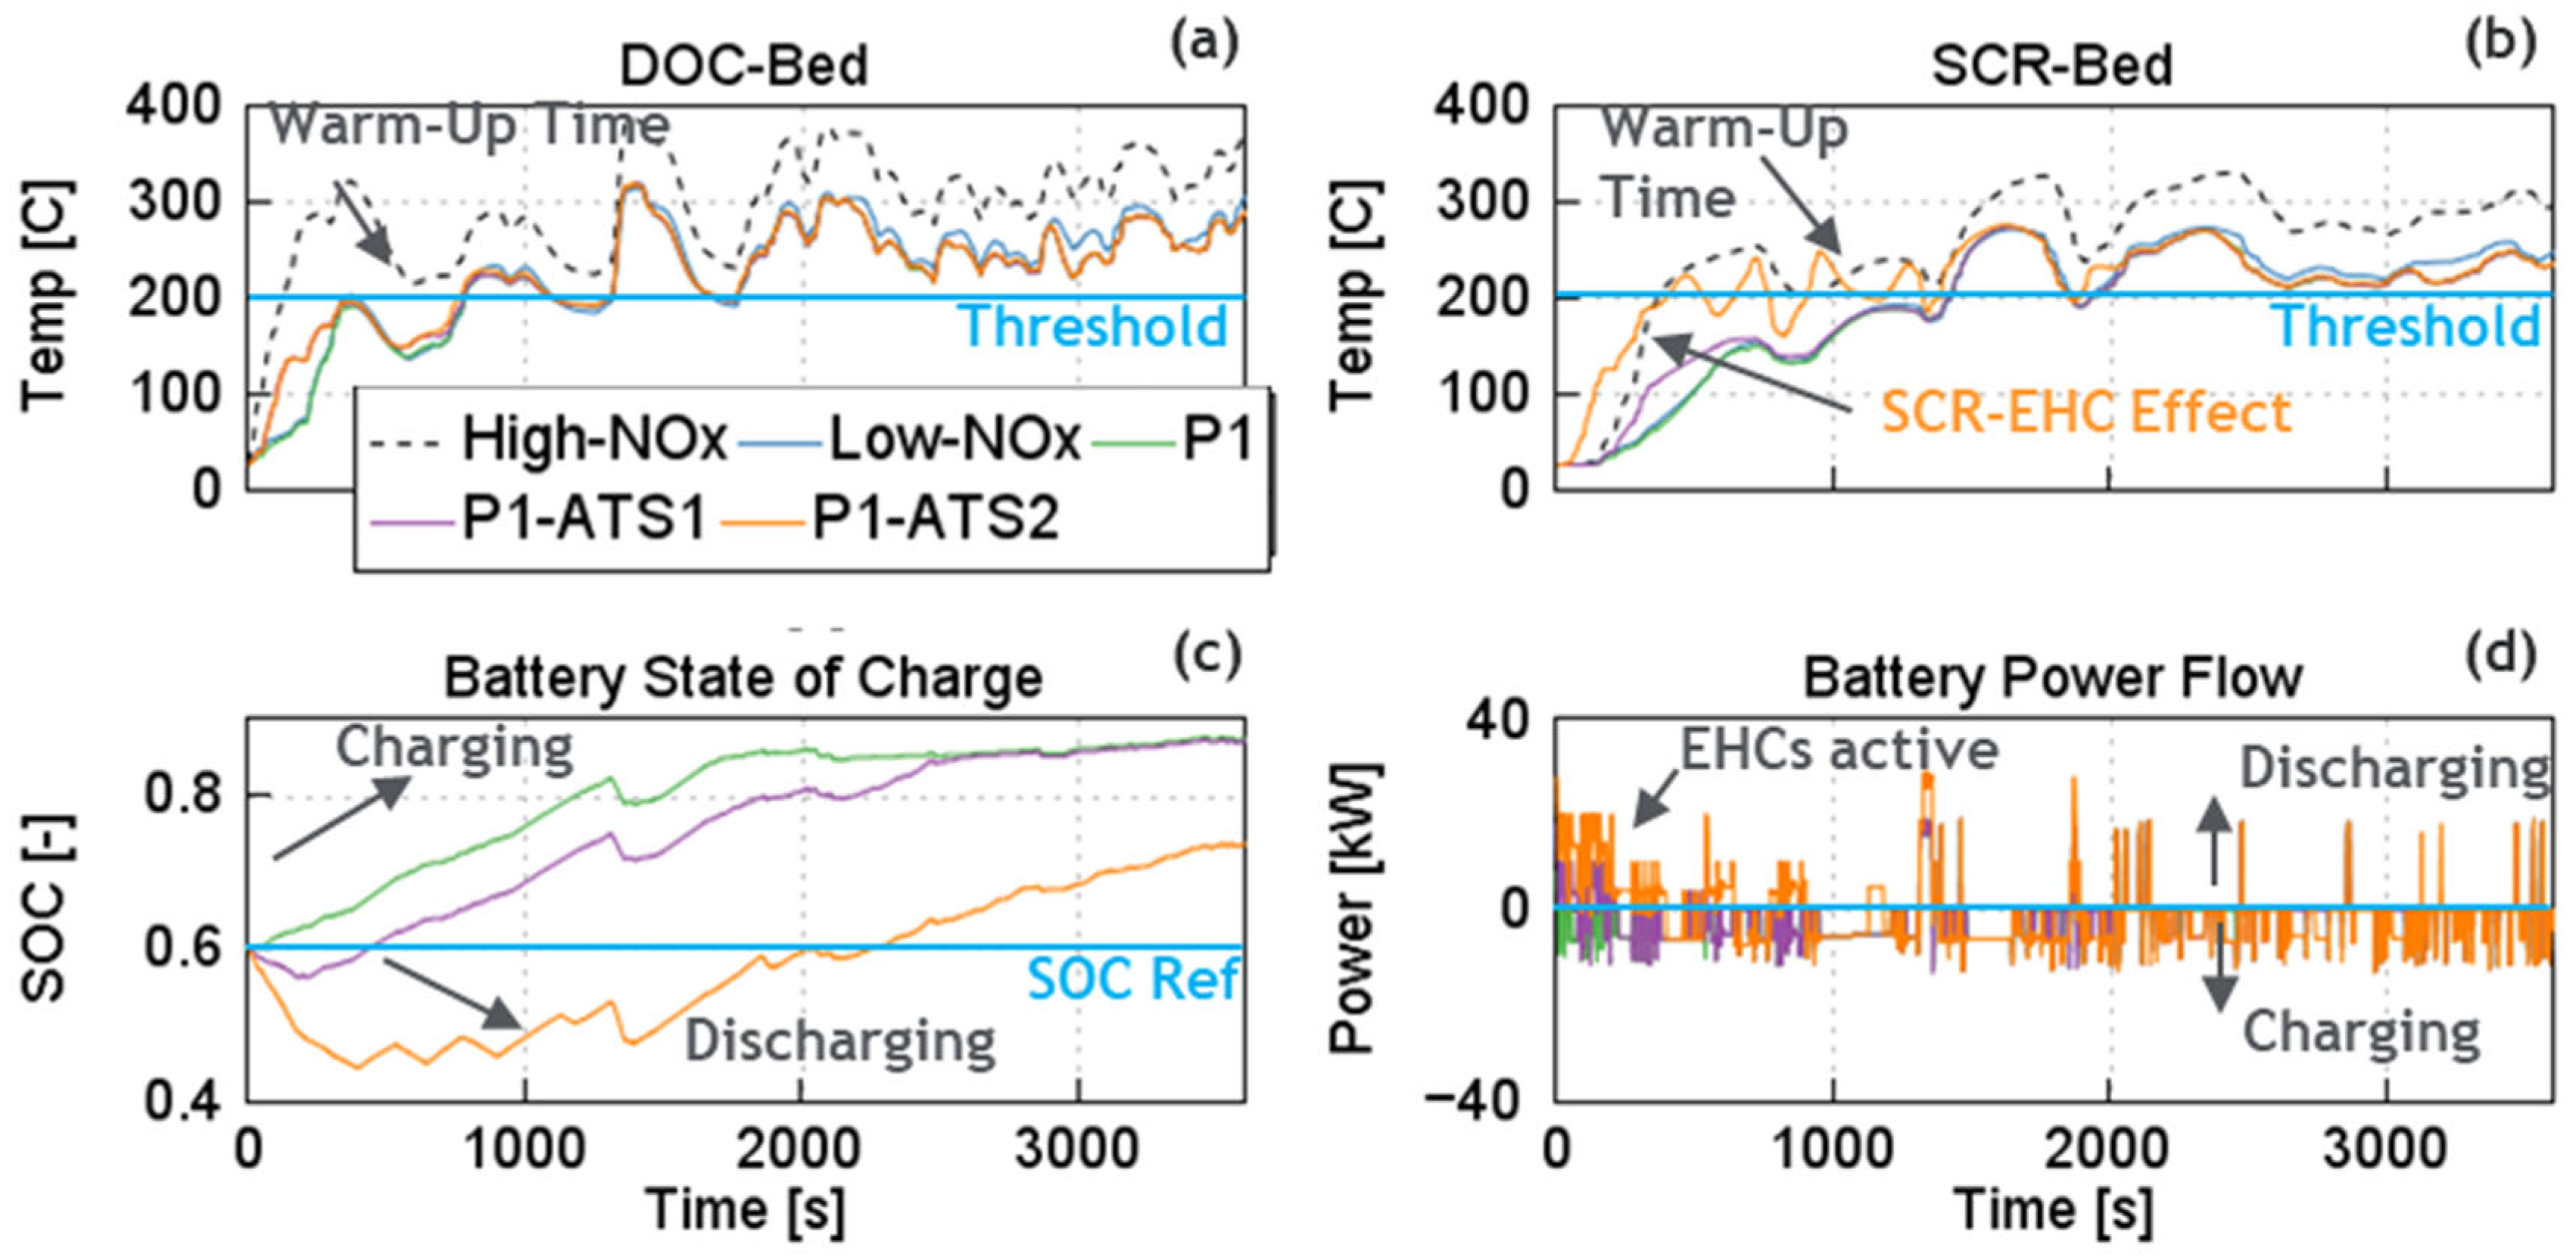
4.1. World Harmonized Vehicle Cycle (WHVC)
4.2. Chicago–SanFrancisco (Chi–San)
4.3. Paris–Frankfurt (Par–Frkft)
4.4. Mumbai–Chennai (Mum–Chen)
4.5. Beijing–Shanghai (Beij–Shng)
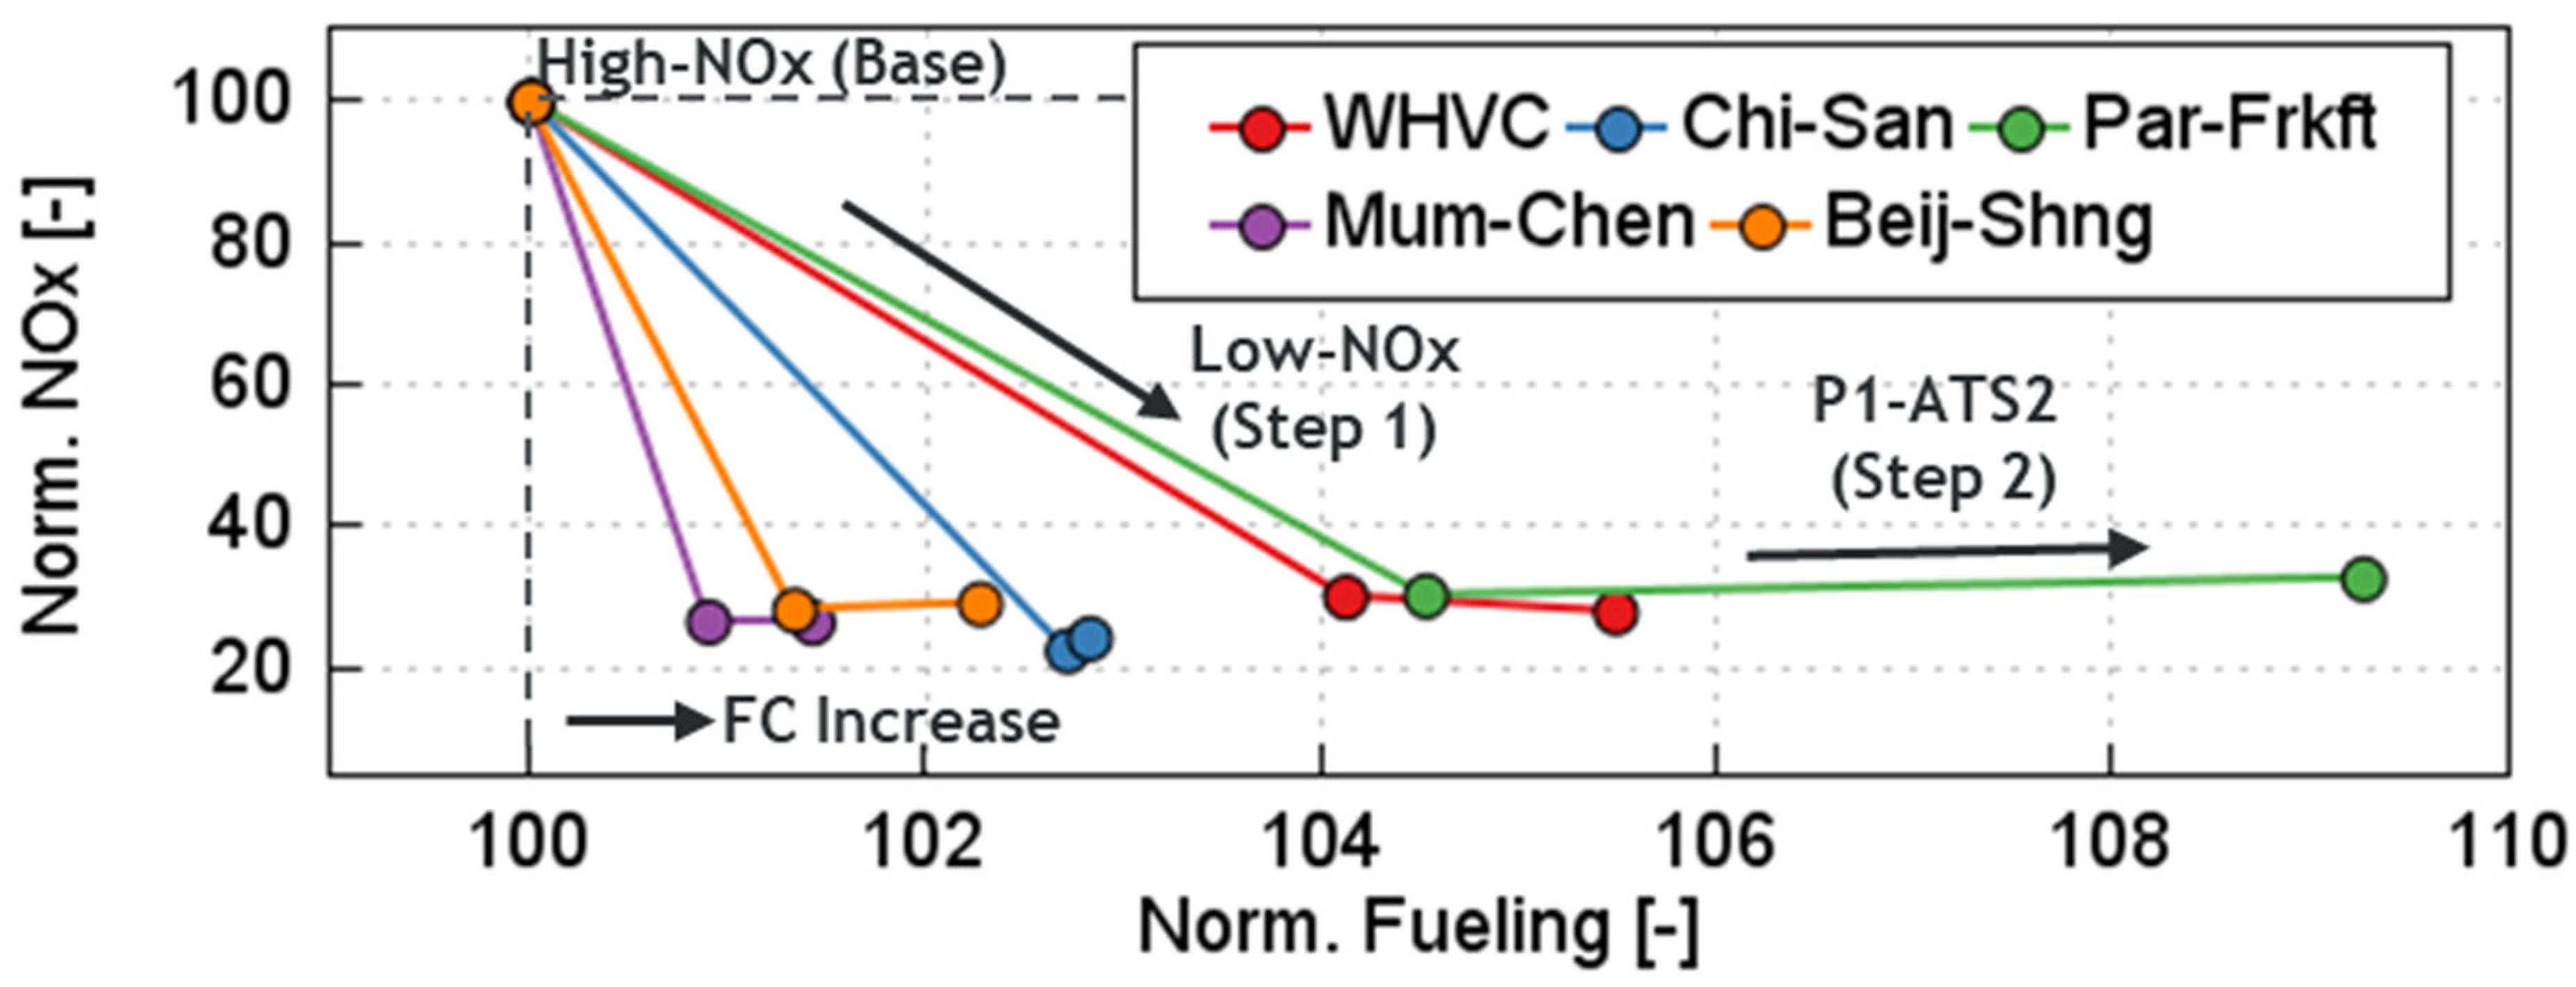
4.6. NOx and FC Trade-Offs
5. Conclusions
Author Contributions
Funding
Data Availability Statement
Acknowledgments
Conflicts of Interest
Nomenclature
| ARB | Air Resources Board |
| ACT | Advanced Clean Trucks |
| BEV | Battery Electric Vehicle |
| BSFC | Brake Specific Fuel Consumption |
| CA50 | Crank Angle for 50% Heat Release |
| CAD | Crank Angle Degrees |
| DC | Direct Current |
| DoE | Design of Experiments |
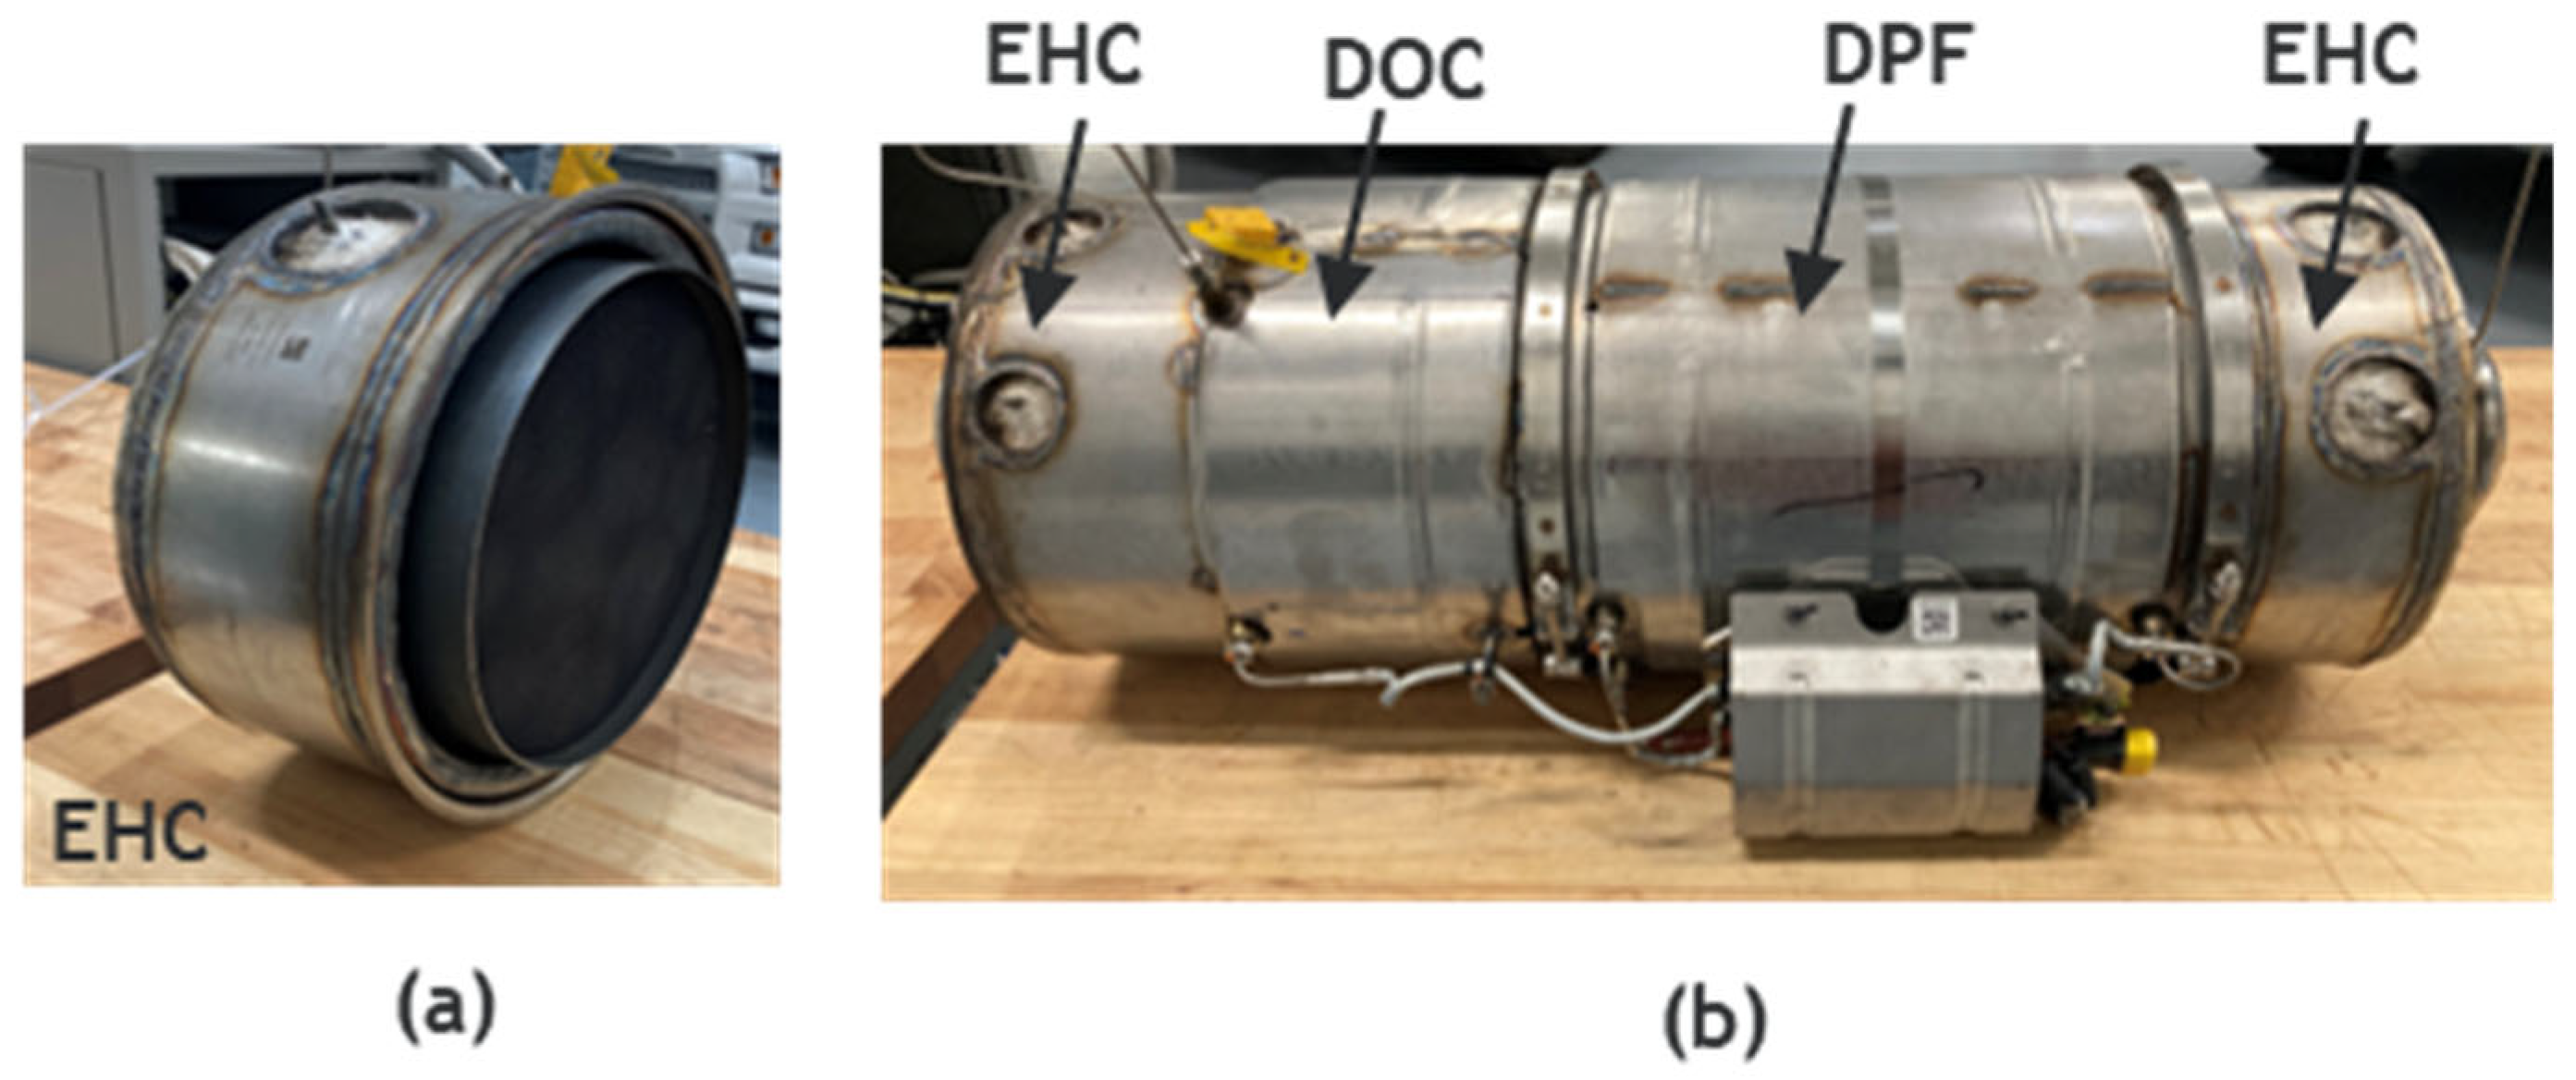
| DOC | Diesel Oxidation Catalyst |
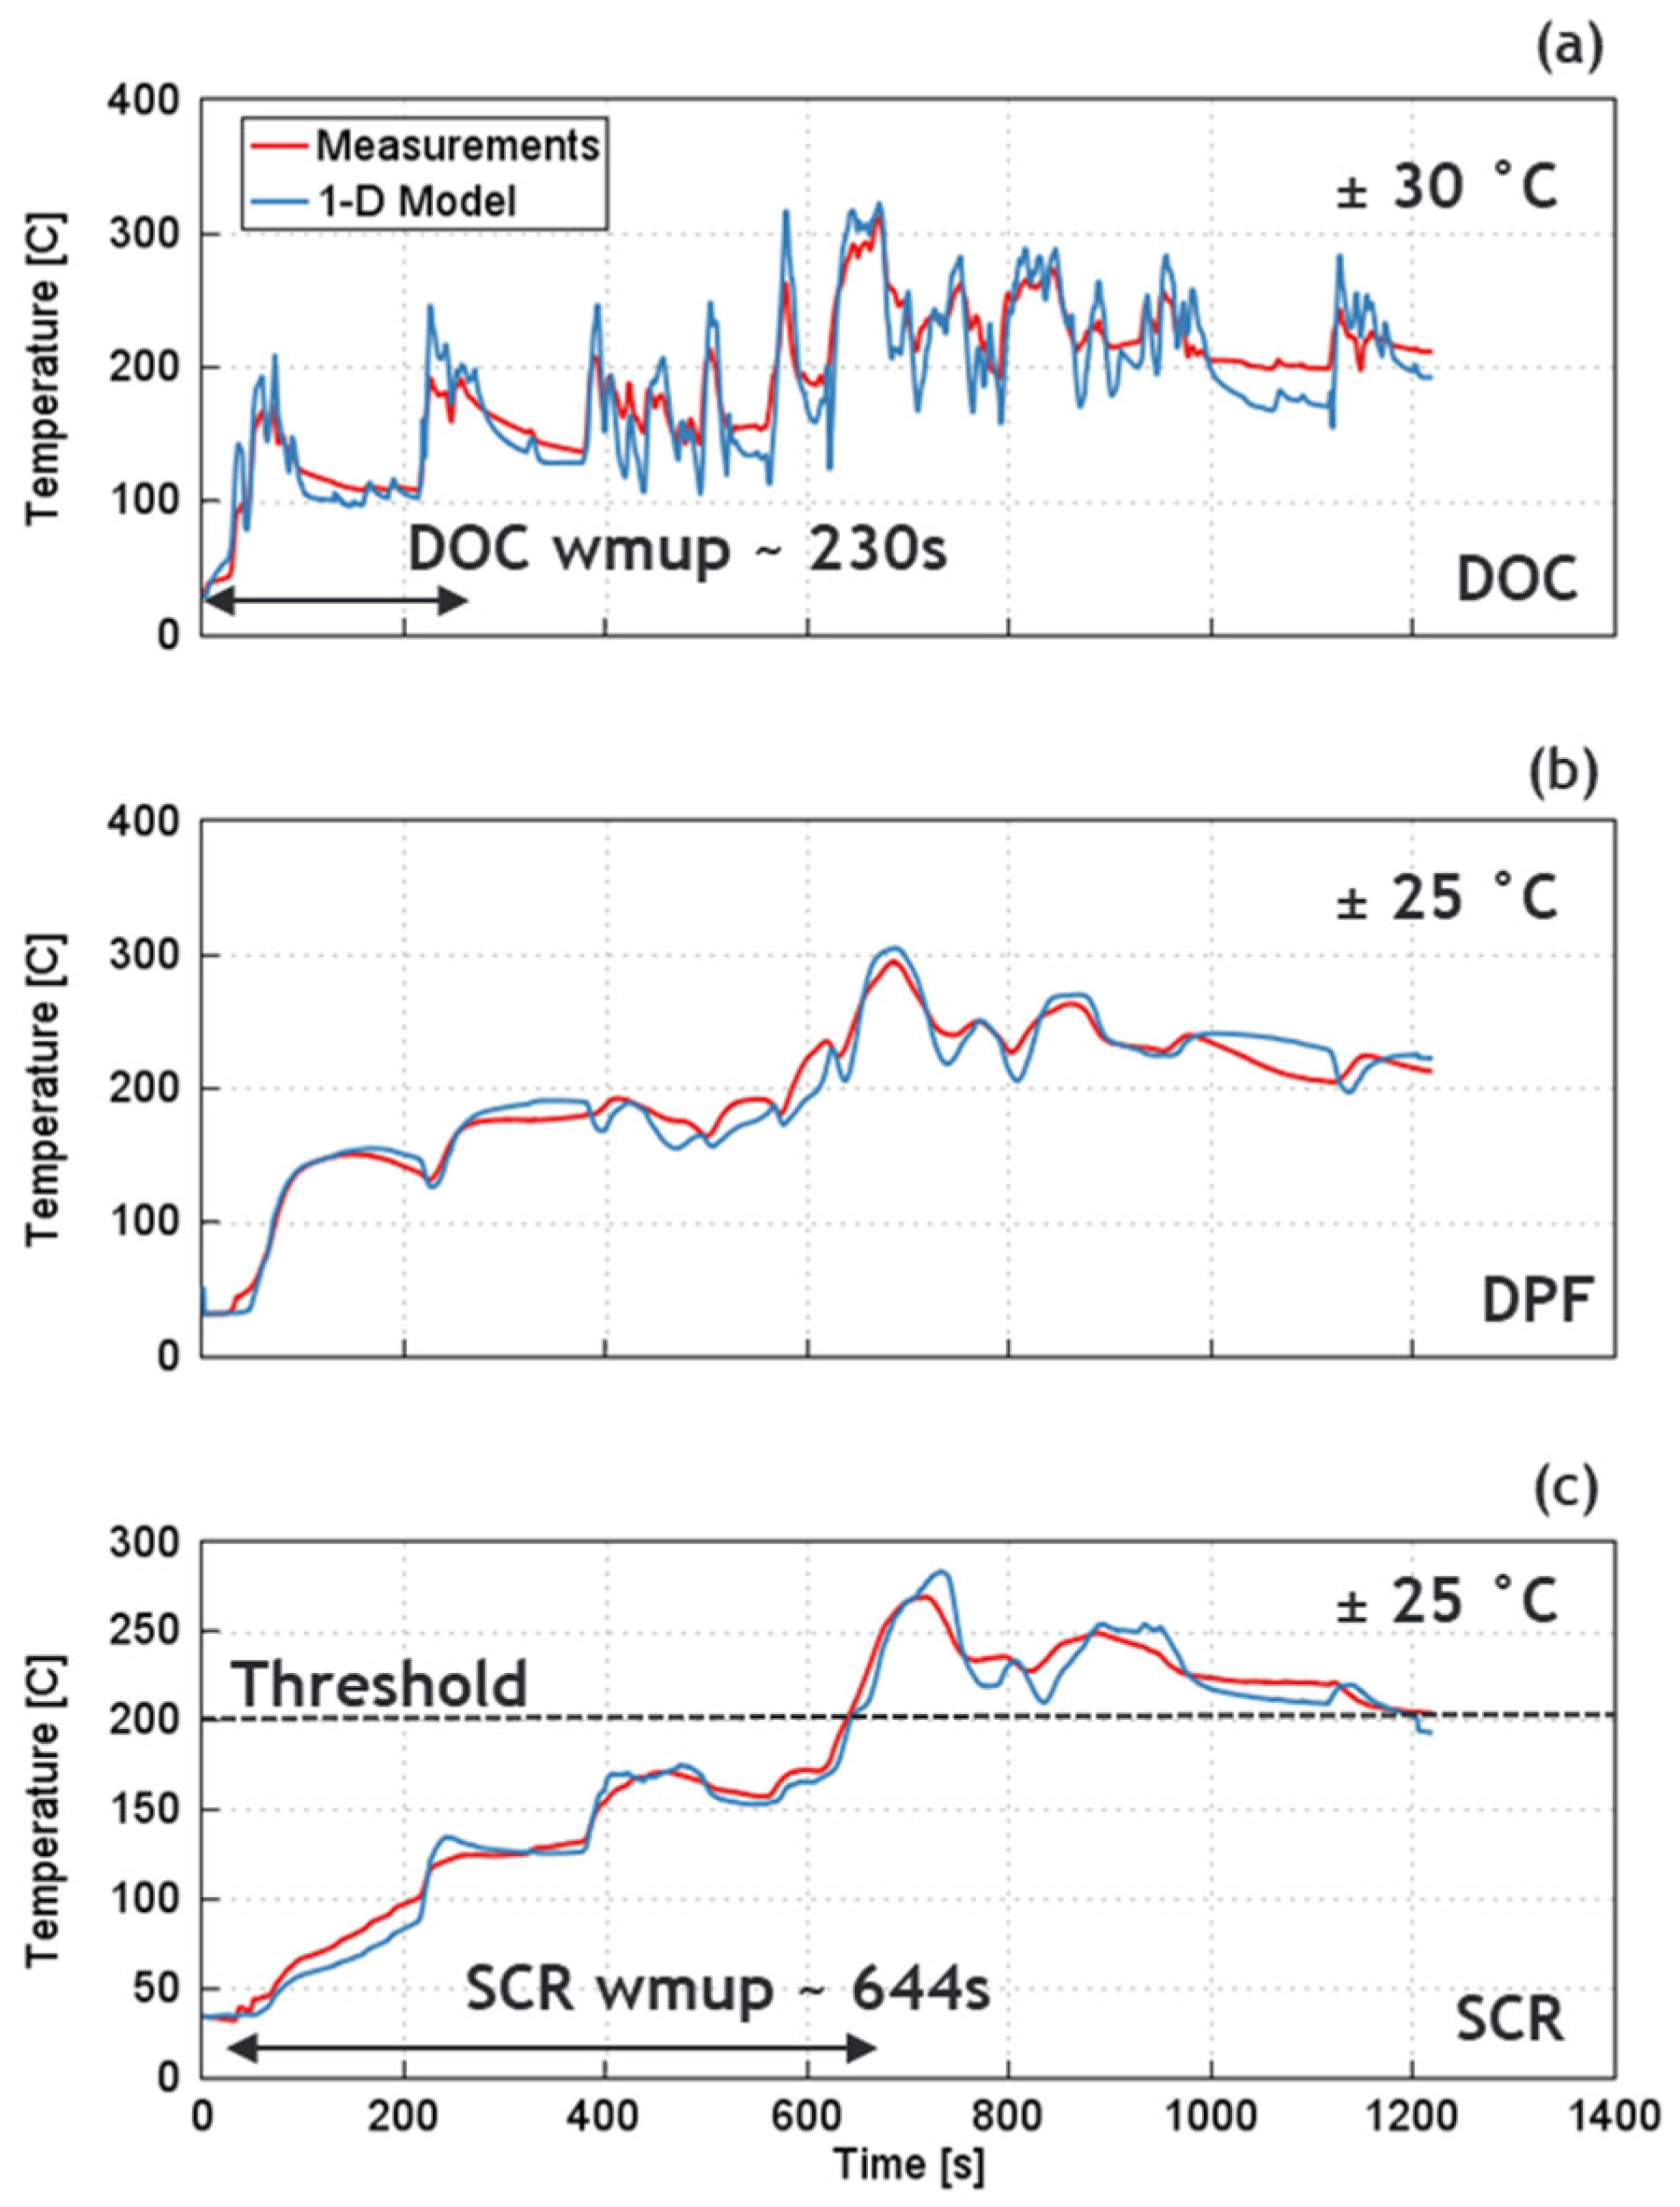
| DOCwmup | DOC Warm-up time |
| DPF | Diesel Particulate Filter |
| EGR | Exhaust Gas Recirculation |
| EHC | Electric Heater Component |
| EPA | Environmental Protection Agency |
| EV | Exhaust Valve |
| FC | Fuel Consumption |
| GHG | Greenhouse Gas |
| GR | Gear Ratio |
| GT | Gamma Technologies |
| GVWR | Gross Vehicle Weight Rating |
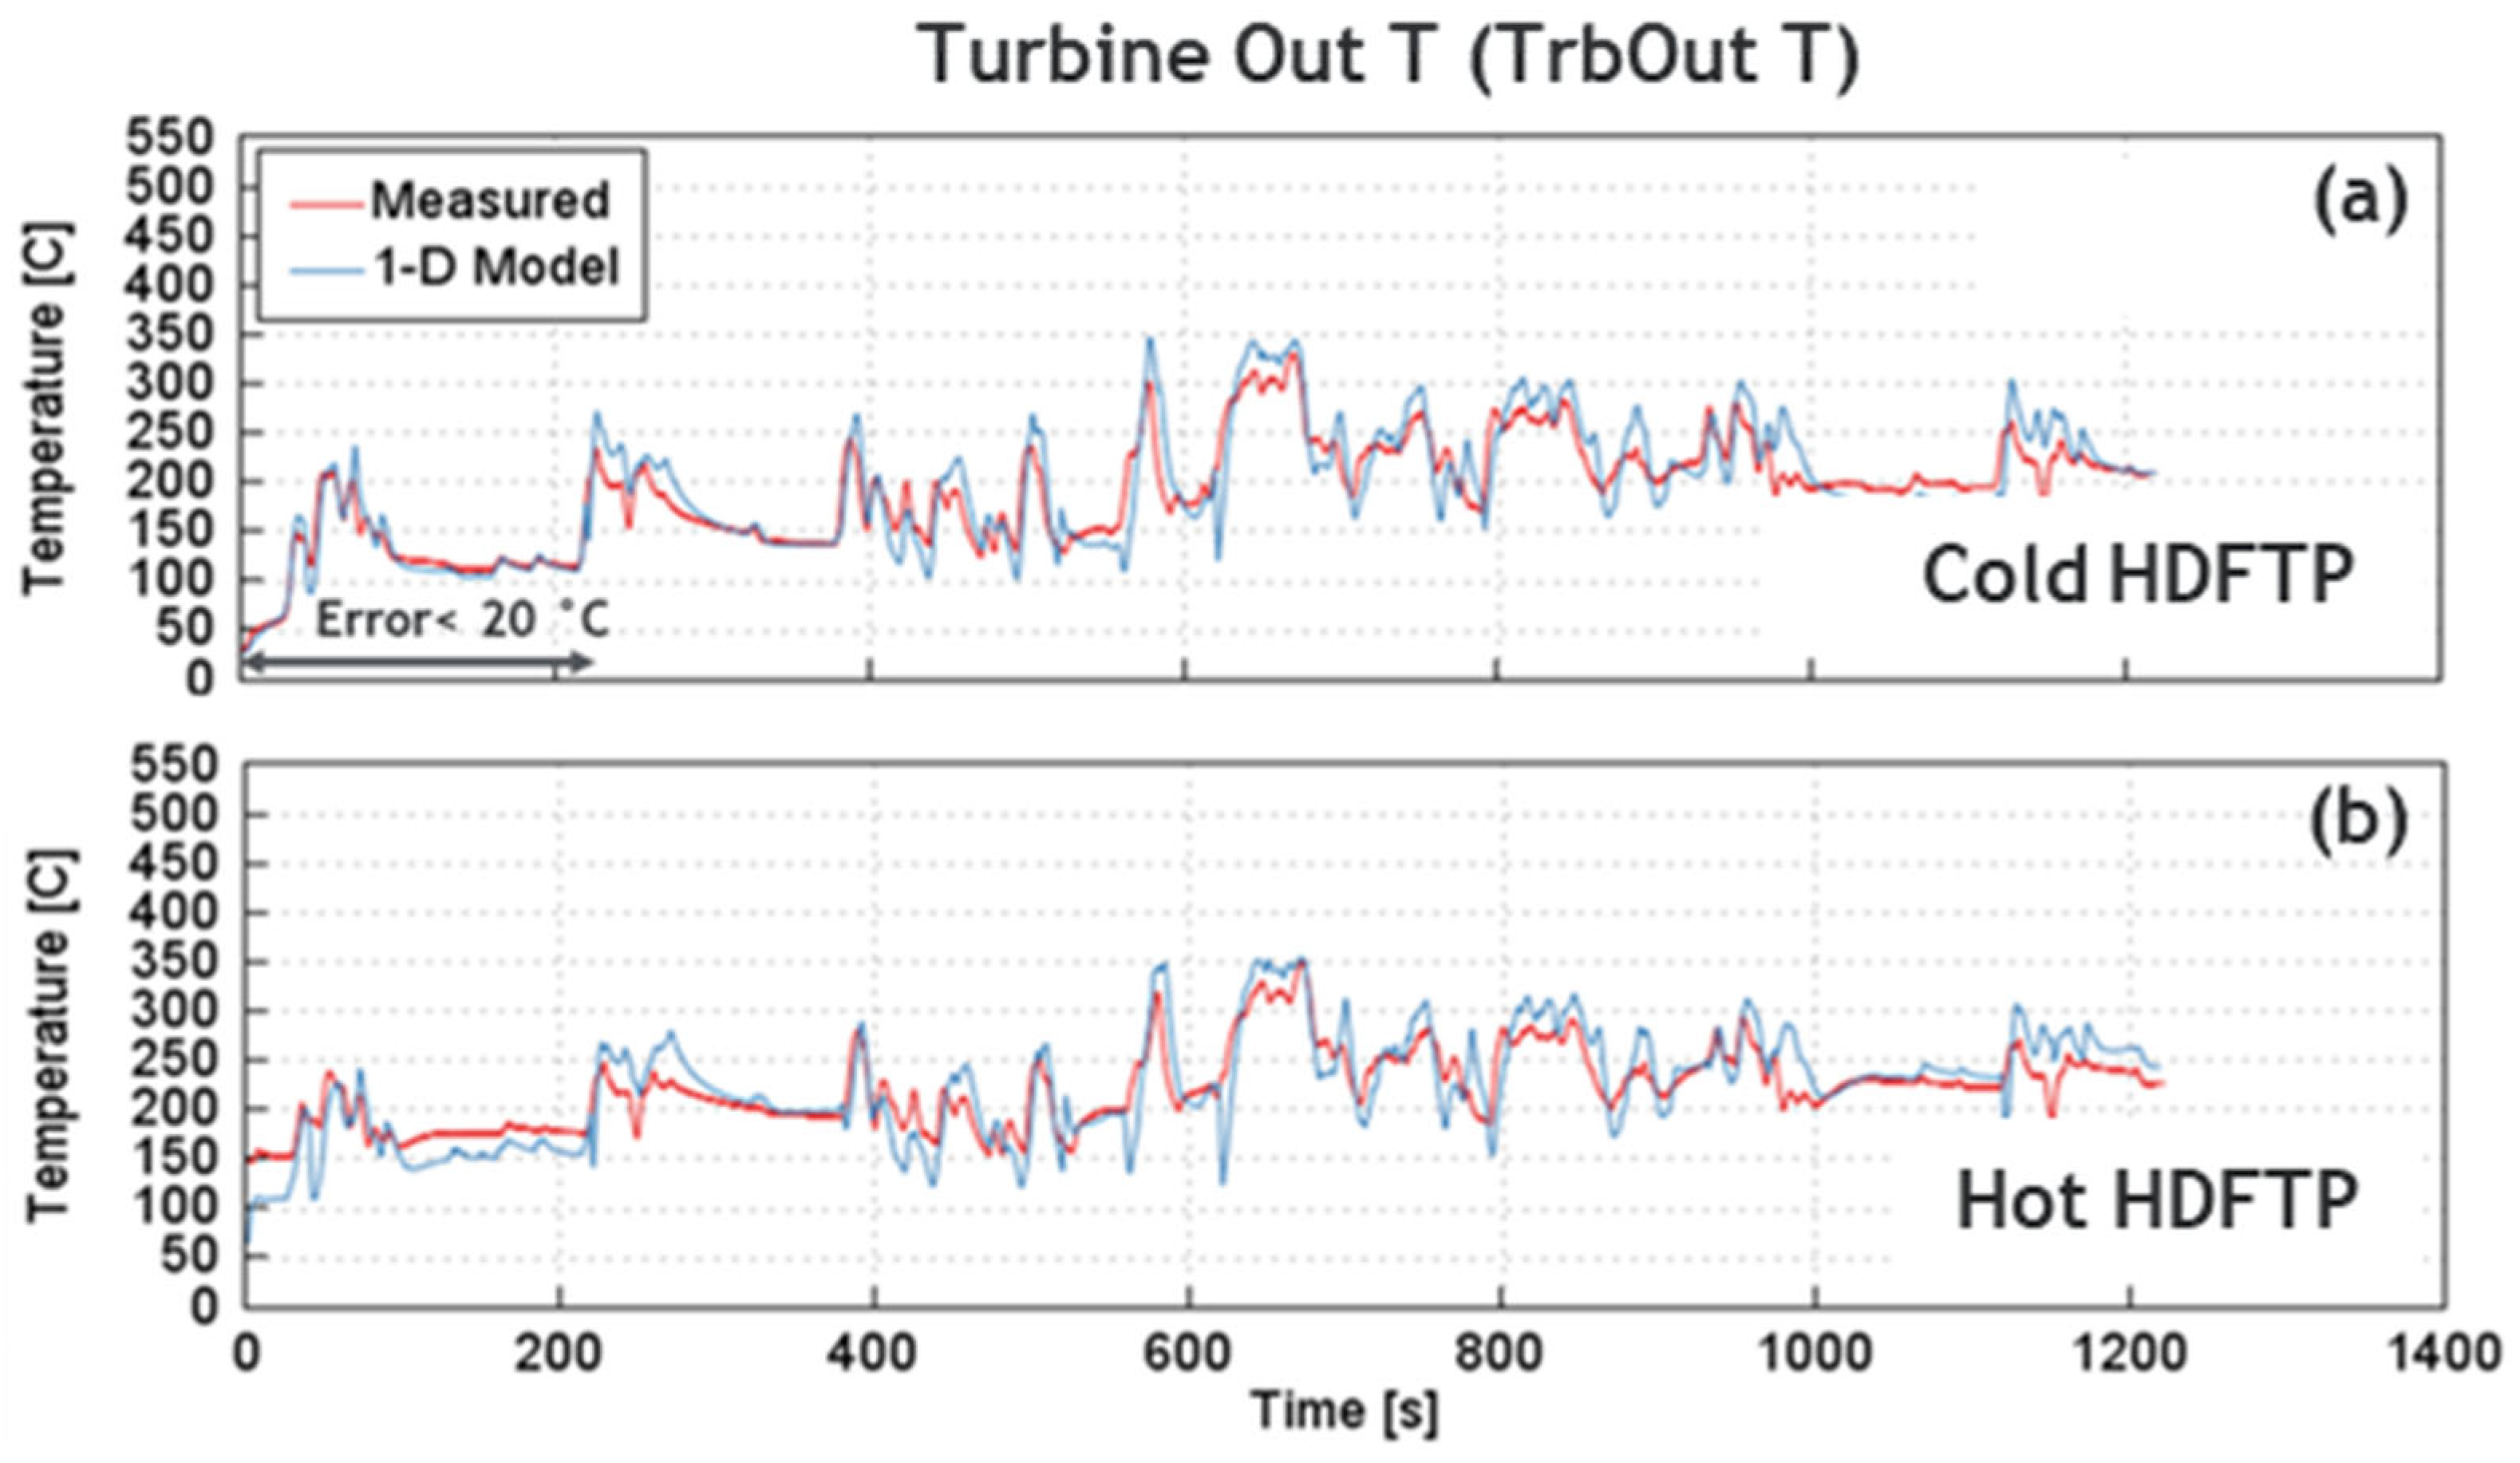
| HDFTP | Heavy Duty Federal Test Procedure |
| ICE | Internal Combustion Engine |
| IMEPg | Gross Indicated Mean Effective Pressure |
| IMEPn | Net Indicated Mean Effective Pressure |
| ISG | Integrated Starter Generator |
| IV | Intake valve |
| MG | Motor Generator Unit |
| MHEV | Mild Hybrid Electric Vehicle |
| NM | Nickel Manganese Cobalt Oxide Li-Ion Battery |
| OCV | Open Circuit Voltage |
| PMEP | Pumping Mean Effective Pressure |
| SCR | Selective Catalytic Reaction |
| SCRwmup | SCR Warm-up Time |
| SOC | State of Charge |
| Battery State of Charge at the end of the drive cycle | |
| State of Charge at the beginning of the drive cycle | |
| SOI | Start of Injection |
| VNT | Variable Nozzle Turbine |
| ZEV | Zero Emission Vehicle |
Appendix A
References
- IEA. Tracking Clean Energy Progress 2023; IEA: Paris, France, 2023; Available online: https://www.iea.org/reports/tracking-clean-energy-progress-2023 (accessed on 5 June 2024).
- Mulholland, E.; Teter, J.; Cazzola, P.; McDonald, Z.; Gallachóir, B.P.Ó. The long haul towards decarbonizing road freight–A global assessment to 2050. Appl. Energy 2018, 216, 678–693. [Google Scholar] [CrossRef]
- EPA. Control of Air Pollution from New Motor Vehicles: Heavy-Duty Engine and Vehicle Standards; Final Rule, Federal Register; US Environmental Protection Agency: Washington, DC, USA, 2023; Volume 88, pp. 4296–4718. Available online: https://www.govinfo.gov/content/pkg/FR-2023-01-24/pdf/2022-27957.pdf (accessed on 5 June 2024).
- The European Commission. REGULATIONS. Commission regulations (EU) 2019/318 of February 2019 amending Regulation (EU) 2017/2400 and Directive 2007/46/EC of the European Parliament and of the Council as regards the determination of the CO2 emission and fuel consumption of heavy-duty. Off. J. Eur. Union 2019, 2001, 20–30. [Google Scholar]
- China’s Stage VI Emission Standard for Heavy-Duty Vehicles, ICCT. 2018. Available online: https://www.transportpolicy.net/standard/china-heavy-duty-emissions/ (accessed on 5 June 2024).
- India’s Bharat Stage (BS) VI Standards (Based on Euro VI) Standards, Transport Policy.Net. 2020. Available online: https://www.transportpolicy.net/standard/india-heavy-duty-emissions/ (accessed on 5 June 2024).
- Smith, D.; Ozpineci, B.; Graves, R.L.; Jones, P.T.; Lustbader, J.; Kelly, K.; Walkowicz, K.; Birky, A.; Payne, G.; Sigler, C.; et al. Medium-and Heavy-Duty Vehicle Electrification: An Assessment of Technology and Knowledge Gaps; Oak Ridge National Lab. (ORNL): Oak Ridge, TN, USA, 2019; p. 85. [Google Scholar]
- Joshi, S.; Dahodwala, M.; Koehler, E.W.; Franke, M.; Tomazic, D.; Naber, J. Trade-Off Analysis and Systematic Optimization of a Heavy-Duty Diesel Hybrid Powertrain; SAE Technical Paper 2020-01-0847; SAE: Warrendale, PA, USA, 2020. [CrossRef]
- Greenhouse Gas Emissions and Fuel Efficiency Standards for Medium- and Heavy-Duty Engines and Vehicles—Phase 2. Regulatory Impact Analysis, EPA, NHTSA, EPA-420-R-16-900, August 2016. Available online: https://www.nhtsa.gov/sites/nhtsa.gov/files/phase-2-hd-fuel-efficiency-ghg-final-ria.pdf (accessed on 5 June 2024).
- California Air Resources Board. Greenhouse Gas Standards for Medium and Heavy-Duty Engines and Vehicles. 2019. Available online: https://ww2.arb.ca.gov/rulemaking/2019/advancedcleantrucks (accessed on 5 June 2024).
- Joo, S.M.; Alger, T.; Chadwell, C.; De Ojeda, W.; Zuehl, J.; Gukelberger, R. A High Efficiency, Dilute Gasoline Engine for the Heavy-Duty Market. SAE Int. J. Engines 2012, 5, 1768–1789. [Google Scholar] [CrossRef]
- Zhang, Y.; Sommers, S.; Pei, Y.; Kumar, P.; Voice, A.; Traver, M.; Cleary, D. Mixing-Controlled Combustion of Conventional and Higher Reactivity Gasolines in a Multi-Cylinder Heavy-Duty Compression Ignition Engine; SAE Technical Paper 2017-01-0696; SAE: Warrendale, PA, USA, 2017. [Google Scholar] [CrossRef]
- Zhang, Y.; Kumar, P.; Pei, Y.; Traver, M.; Cleary, D. An Experimental and Computational Investigation of Gasoline Compression Ignition Using Conventional and Higher Reactivity Gasolines in a Multi-Cylinder Heavy-Duty Diesel Engine; SAE Technical Paper 2018-01-0226; SAE: Warrendale, PA, USA, 2018. [Google Scholar] [CrossRef]
- Kumar, P.; Pei, Y.; Traver, M.; Watson, J. System Level 1-D Analysis of an Air-System for a Heavy-Duty Gasoline Compression Ignition Engine; SAE Technical Paper 2019-01-0240; SAE: Warrendale, PA, USA, 2019. [Google Scholar] [CrossRef]
- García, A.; Monsalve-Serrano, J.; Sari, R.L. Patrick Gaillard Assessment of a complete truck operating under dual-mode dual-fuel combustion in real life applications: Performance and emissions analysis. Appl. Energy 2020, 279, 115729. [Google Scholar] [CrossRef]
- Joshi, S.; Dahodwala, M.; Ahuja, N.; Dhanraj, F.N.U.; Koehler, E.; Franke, M.; Tomazic, D. Evaluation of Hybrid, Electric and Fuel Cell Powertrain Solutions for Class 6–7 Medium Heavy-Duty Vehicles. SAE Int. J. Adv. Curr. Prac. Mobil. 2021, 3, 2955–2971. [Google Scholar] [CrossRef]
- García, A.; Monsalve-Serrano, J.; Martinez-Boggio, S.; Gaillard, P.; Poussin, O.; Amer, A.A. Dual fuel combustion and hybrid electric powertrains as potential solution to achieve 2025 emissions targets in medium duty trucks sector. Energy Convers. Manag. 2020, 224, 113320. [Google Scholar] [CrossRef]
- Silberhorn, G.; Eichinger, T.; Biskupek, M.; Pitzl, R. The new MAN marine hybrid system. In Heavy-Duty-, On- und Off-Highway-Motoren 2020; Liebl, J., Ed.; Proceedings; Springer: Wiesbaden, Germany, 2021. [Google Scholar] [CrossRef]
- Fiquet, F.; King, A.; Skipton-Carter, A.; Bulut, Ö. Future heavy truck propulsion system solutions including their impact on total cost of ownership. In Heavy-Duty-, On- und Off-Highway-Motoren 2020; Liebl, J., Ed.; Proceedings; Springer: Wiesbaden, Germany, 2021. [Google Scholar] [CrossRef]
- Kumar, P.; Zhang, Y. Variable Valve Strategy Evaluation for Low-Load Operation in a Heavy-Duty Gasoline Compression Ignition Engine. Energies 2022, 15, 2017. [Google Scholar] [CrossRef]
- Kumar, P.; Sellnau, M.; Shah, A.; Whitney, C.; Sari, R. Development of Two-Step Exhaust Rebreathing for a Low-NOx Light-Duty Gasoline Compression Ignition Engine. Energies 2022, 15, 6565. [Google Scholar] [CrossRef]
- Milovanovic, N.; Hamalian, S.; Lewander, M.; Larson, K. The Novel SCR and PNA Exhaust Gas after Treatment Systems for Diesel Passenger Cars; Springer: Berlin/Heidelberg, Germany, 2016. [Google Scholar] [CrossRef]
- Berndt, C. An Experimental Study of a Passive NOx Adsorber (pna) for the Reduction of Cold Start Diesel Emissions. Master’s Thesis, Michigan Technological University, Houghton, MI, USA, 2019. [Google Scholar]
- Yang, L.; Sukumar, B.; Naseri, M.; Markatou, P.; Chatterjee, S. After-Treatment Systems to Meet China NS VI, India BS VI Regulation Limits; No. 2017-01-0941, SAE Technical Paper; SAE: Warrendale, PA, USA, 2017. [Google Scholar]
- Sharp, C.; Webb, C.C.; Yoon, S.; Carter, M.; Henry, C. Achieving ultra low NOx emissions levels with a 2017 heavy-duty on-highway TC diesel engine-comparison of advanced technology approaches. SAE Int. J. Engines 2017, 10, 1722–1735. [Google Scholar] [CrossRef]
- García, A.; Monsalve-Serrano, J.; Sari, R.L.; Martinez-Boggio, S. Energy assessment of an electrically heated catalyst in a hybrid RCCI truck. Energy 2022, 238, 121681. [Google Scholar] [CrossRef]
- Harris, T.; McCarthy, J.; Sharp, C.; Zavala, B.; Matheaus, A. Meeting future NOx emissions limits with improved total fuel efficiency. In Proceedings of the Heavy-Duty, On- and Off-Highway Engines, Rostock, Germany, 1–2 December 2021. [Google Scholar]
- McCarthy, J., Jr.; Matheaus, A.; Zavala, B.; Sharp, C.; Harris, T. Meeting Future NOX Emissions Over Various Cycles Using a Fuel Burner and Conventional Aftertreatment System. SAE Int. J. Adv. Curr. Prac. Mobil. 2022, 4, 2220–2234. [Google Scholar] [CrossRef]
- Srinivasan, V.; Wolk, B.; Cai, X.; Henrichsen, L.; Lee, J.; Patil, D. Application of Dynamic Skip Fire for NOx and CO2 Emissions Reduction of Diesel Powertrains. SAE Int. J. Adv. Curr. Prac. Mobil. 2022, 4, 225–235. [Google Scholar] [CrossRef]
- Lindemann, B.; Schrewe, K.; Steigert, S. Electric Heater for Rapid Heating of the Exhaust Gas Aftertreatment System. ATZ Heavy Duty Worldw 2022, 15, 38–43. [Google Scholar] [CrossRef]
- Meruva, P.; Matheaus, A.; Sharp, C.A.; McCarthy, J.E., Jr.; Collins, T.A.; Joshi, A. Meeting future NOX emissions using an electric heater in an advanced aftertreatment system. Front. Mech. Eng. 2022, 8, 979771. [Google Scholar] [CrossRef]
- Kasab, J.J.; Hadl, K.; Raser, B.; Sacher, T.; Graf, G. Close-coupled SCR—An approach to meet ultra-low NOx requirements for heavy-duty diesel engines. In Proceedings of the CLEERS Virtual Workshop, Ann Arbor, MI, USA, 13–17 September 2021. [Google Scholar]
- Webb, C.; Stephenson, P.; Meijer, M.; Coumans, A. Future regulatory technology options to reduce risk in application for heavy-duty diesel engines. In Proceedings of the 30th Aachen Colloquium Sustainable Mobility, Aachen, Germany, 4–6 October 2021. [Google Scholar]
- Brin, J.; Keim, J.; Christensen, E.; Holman, R. Applying a driven turbocharger with turbine bypass to improve aftertreatment warm-up and diesel nitrous oxides conversion. SAE Int. J. Commer. Veh. 2021, 14, 391–407. [Google Scholar] [CrossRef]
- Matheaus, A.; Neely, G.; Sharp, C.; Hopkins, J.; McCarthy, J., Jr. Fast Diesel Aftertreatment Heat-up Using CDA and an Electrical Heater; SAE Technical Paper 2021-01-0211; SAE: Warrendale, PA, USA, 2021. [Google Scholar] [CrossRef]
- Zavala, B.; McCarthy, J.E., Jr.; Matheaus, A.; Sharp, C. Fast diesel aftertreatment heat-up using CDA and an electrical heater between 1.2 and 5.0 kW. Front. Mech. Eng. 2022, 8, 918003. [Google Scholar] [CrossRef]
- Gamma Technologies, GT-SUITE, v2023. Available online: https://www.gtisoft.com/gamma_news/gt-suite-v2023-released/ (accessed on 5 June 2024).
- Bao, R.; Avila, V.; Baxter, J. Effect of 48V Mild-Hybrid System Layout on Powertrain System Efficiency and Its Potential of Fuel Economy Improvement; SAE Technical Paper 2017-01-1175; SAE: Warrendale, PA, USA, 2017. [Google Scholar] [CrossRef]
- van der Put, D.; Heuser, P.; Aubeck, F.; Lindemann, B.; Müther, M.; Schönen, M.; Ehrly, M.; Schaub, J.; Walters, M.; Virnich, L.; et al. Efficient commercial powertrains—How to achieve a 30% GHG reduction in 2030. In Heavy-Duty-, On- und Off-Highway-Motoren 2020; Liebl, J., Ed.; Proceedings; Springer: Wiesbaden, Germany, 2021. [Google Scholar] [CrossRef]
- Gamma Technologies, GT-RealDrive, v2022. Available online: https://www.gtisoft.com/gt-realdrive/ (accessed on 5 June 2024).


| Vehicle Specifications | |
|---|---|
| Engine | 15 L Diesel |
| Vehicle weight [kg] | 8730 |
| Drag coefficient [-] | 0.62 |
| Vehicle frontal area [m2] | 6.5 |
| Gross vehicle weight rating [kg] | 36,250 |
| Vehicle wheelbase [m] | 5.5 |
| Rolling friction [-] | 0.007 |
| Tires specification | 295/80R/22.5 |
| Gearbox models | ATO2612F |
| Differential drive ratio | 2.28 |
| 48V P1 MHEV Specifications | |
|---|---|
| ISG max. motor [kW] | 20 (88% Peak Eff) |
| Initial battery [kWh] | 6.8 |
| Final gear ratio [-] | 2.25 |
| Max. crate 5 s [-] | 20 |
| Max. crate t > 10 s [-] | 7 |
| Reg. braking | yes |
| e-drive | no |
| e-assist | yes |
| Control States | |||||
|---|---|---|---|---|---|
| S1 (Veh. Stop) | S2 (Eng Start) | S3-S4-S5 (Idling) | S6 (Cruising) | S7-S8-S9 (Coasting) | |
| VehSpd Speed (V) EngSpd (RPM) | V = 0 RPM = 0 | V = 0 RPM > 0 | V = 0 RPM > Idle | V > 0 RPM > Idle | V = 0 RPM = 0 |
| Engine On/Off | 0 | 0 | 1 | 1 | 0 |
| Engine Load | 0 | 0 | Idle Load | Driver Req. | 0 |
| ISG | 0 | Load (crank) | Load (Battery Charge) | 0 | Load (Crank) |
| EHC | 0 | 0 | 0 or 1 | 0 | 0 or 1 |
| Pedal Pos. | 100 | 100 | 100 | Driver | 100 |
| ‘Base’ Engine Specifications | |
|---|---|
| Stroke [mm] | 169 |
| Bore [mm] | 137 |
| Number of cylinders [-] | 6 |
| Displaced volume [L] | 14.9 |
| Air-handling system | Single-stage VGT turbo and cooled ext. EGR |
| ATS system | DOC, DPF, and SCR |
| Rated power | 336 kW @ 1800 rpm |
| 2375 Nm @ 1000 rpm | |
| VehicleConfigs. → | High-NOx (‘Base’) | Low-NOx | P1 | P1-ATS1 | P1-ATS2 |
|---|---|---|---|---|---|
| Propulsion | Engine-Only | “ | Hybrid | “ | “ |
| Calibration | High-NOx | Low-NOx | “ | “ | “ |
| ATS | Stock | Stock | Stock | DOC-EHC(ATS1) | DOC-EHC and SCR-EHC(ATS2) |
Disclaimer/Publisher’s Note: The statements, opinions and data contained in all publications are solely those of the individual author(s) and contributor(s) and not of MDPI and/or the editor(s). MDPI and/or the editor(s) disclaim responsibility for any injury to people or property resulting from any ideas, methods, instructions or products referred to in the content. |
© 2024 by the authors. Licensee MDPI, Basel, Switzerland. This article is an open access article distributed under the terms and conditions of the Creative Commons Attribution (CC BY) license (https://creativecommons.org/licenses/by/4.0/).
Share and Cite
Kumar, P.; Lago Sari, R.; Shah, A.; Merritt, B. E-Heater Performance for Aftertreatment Warm-Up in a 48V Mild-Hybrid Heavy-Duty Truck over Real Driving Cycles. Energies 2024, 17, 3001. https://doi.org/10.3390/en17123001
Kumar P, Lago Sari R, Shah A, Merritt B. E-Heater Performance for Aftertreatment Warm-Up in a 48V Mild-Hybrid Heavy-Duty Truck over Real Driving Cycles. Energies. 2024; 17(12):3001. https://doi.org/10.3390/en17123001
Chicago/Turabian StyleKumar, Praveen, Rafael Lago Sari, Ashish Shah, and Brock Merritt. 2024. "E-Heater Performance for Aftertreatment Warm-Up in a 48V Mild-Hybrid Heavy-Duty Truck over Real Driving Cycles" Energies 17, no. 12: 3001. https://doi.org/10.3390/en17123001
APA StyleKumar, P., Lago Sari, R., Shah, A., & Merritt, B. (2024). E-Heater Performance for Aftertreatment Warm-Up in a 48V Mild-Hybrid Heavy-Duty Truck over Real Driving Cycles. Energies, 17(12), 3001. https://doi.org/10.3390/en17123001