Article

An Experimental Performance Assessment of a Passively Controlled Wind Turbine Blade Concept: Part A—Isotropic Materials

by
Nikolaos Papadakis
* and
Constantinos Condaxakis
Power Plant Synthesis Laboratory, Department of Mechanical Engineering, Hellenic Mediterranean University, 71410 Heraklion, Greece
*
Author to whom correspondence should be addressed.
Energies 2024, 17(12), 3049; https://doi.org/10.3390/en17123049
Submission received: 21 April 2024 / Revised: 25 May 2024 / Accepted: 17 June 2024 / Published: 20 June 2024
(This article belongs to the Special Issue Optimal Control of Wind and Wave Energy Converters)

Abstract

:
This paper is the first part of a two-part series, which presents preliminary findings on a novel flexible curved wind turbine blade designed for passive control, comparing its aerodynamic performance and behavior against a conventional straight blade. Characterized by its ability to twist around its longitudinal axis under bending loads, the flexible curved blade is engineered to self-regulate in response to varying wind speeds, optimizing power output and enhancing operational safety. This design utilizes inherent elasticity and specific geometric configurations to develop torsional loads, resulting in continuous adjustment of the blade’s pitch angle via twist–bend deformation. The study focuses on a comparative analysis conducted in a wind tunnel, testing both a small-scale model of the conventional blade and the flexible curved blade of equivalent diameter. Results indicate that the flexible curved blade concept successfully moderates its rotational speed and power output at higher wind speeds and demonstrates the capability to start generating power at lower wind speeds and stabilize power effectively, aligning with sustainability goals by potentially reducing reliance on active control systems. Despite promising outcomes, passive control mechanisms did not activate at the designed wind speeds, revealing a misalignment between expected and actual performance and underscoring the need for further refinements in blade design and control settings. Additionally, the power coefficient (Cp) versus tip speed ratio (TSR) comparison showed that flexible curved blades operate within a lower TSR range and exhibit controlled capping of power under high wind conditions, marked by a distinctive ‘hook-like’ feature in Cp behavior. This study confirms the feasibility of designing and manufacturing passively controlled wind turbine blades tailored to specific performance criteria and underscores the potential of such technology. Future work, to be detailed in a subsequent paper, will explore further optimizations and the use of Glass Fiber-Reinforced Polymer (GFPR) composite materials to enhance blade flexibility and performance.

1. Introduction

1.1. Context and Importance of Renewable Energy

Over the past five years, global energy dynamics have undergone significant turbulence, emphasizing the vital role of renewable energy sources. The energy market has exhibited remarkable volatility, with major events reshaping both economic and environmental landscapes. For instance, during the COVID-19 pandemic, oil prices dramatically plummeted into negative territory, exposing the fragility of conventional energy markets to global disruptions [1]. Similarly, the recent conflict in Ukraine has led to a sharp increase in gas prices, intensifying strains on the global energy supply chain and underscoring the geopolitical risks tied to fossil fuel dependence.
In contrast to these fluctuations, renewable energy technologies such as wind and photovoltaic systems have demonstrated resilience and cost-effectiveness, attributable to technological advances and economies of scale. The levelized cost of electricity (LCOE) from these sources has consistently decreased over the past decade, increasingly aligning their competitiveness with that of traditional energy sources [2]. Wind energy, in particular, has achieved significant maturity, characterized by improved turbine efficiencies, larger capacity installations, and an increase in offshore projects. The rapid expansion of wind energy projects worldwide signifies a collective movement towards a sustainable and reliable energy supply.
The escalating impacts of climate change further necessitate the shift towards renewable energy, necessitating a reduction in carbon emissions and a pivot to cleaner energy alternatives. The progress in wind and photovoltaic technology not only presents an economic opportunity but is also critical for achieving energy security, environmental sustainability, and global collaboration in addressing climate volatility.
Significantly, global electricity generation is increasingly reliant on renewable sources. The International Energy Agency (IEA) highlighted that, as of 2013, the European Union was projected to raise its renewable electricity share from 6.9% in 2011 to 23.1% by 2035 [3]. However, these figures were quickly surpassed, with updates in 2022 showing that by 2015, the share had already reached 22.8%, and by 2027, it is anticipated to increase to 38.1% [4]. These estimates are corroborated by Eurostat data indicating that by 2020, renewable energy’s contribution to electricity generation in the EU had already escalated to 39.0% [5]. In the United States, as of October 2023, approximately 10.3% and 3.4% of electricity production were attributed to wind and solar energy, respectively [6]. The growing reliance on renewable sources, particularly wind energy, underscores a pivotal shift in energy strategies globally, setting the stage for a detailed discussion on the advancements and context of wind energy in the following section.

1.2. Small Wind Energy Converter Systems

The broad adoption of wind energy necessitates a significant reduction in energy production costs. This reduction is largely contingent on optimizing the performance of wind energy converter systems (WECS). A crucial element in making wind energy more attractive and competitive is minimizing both initial investment and ongoing maintenance costs.
Figure 1 presents the levelized cost of energy (LCOE) for offshore wind turbines, including substantial contributions from both the turbine itself and its maintenance. These costs are roughly equivalent, largely due to the logistical challenges and accelerated wear from the marine environment [7]. This parity is largely due to the logistical challenges of servicing offshore wind turbines, the monitoring systems costs and the accelerated wear caused by the salty marine environment.
Ponta [8] asserts that the evolution of wind power relies on overcoming the limitations of current blade technology. He proposes the adoption of smart, self-controlling blades that utilize mode coupling to bypass active control systems. This innovation leads to lighter, simpler turbines that are responsive to changing conditions and could significantly lower both construction and operational costs.
The philosophy of passive control in wind energy systems is predicated on the turbine’s ability to respond to excitation loads and the blade’s capacity to function as a feedback mechanism, adapting to operational conditions to meet design criteria. The primary design objectives include maximizing power yield, minimizing operational loads, and optimizing control within the WECS. Implementing a passive pitch control philosophy can drastically reduce blade aerodynamic loads and overall structural stress. Turbines equipped with passive pitch-controlled blades could potentially eliminate the need for complex, moving parts found in actively controlled variable pitch blades. Instead, these passive pitch-controlled blades could adjust their geometry in response to aerodynamic loads, combining the benefits of variable pitch blades—such as responsiveness, maximization of energy yield, and eventually reduced energy cost—with the simplicity of manufacturing akin to fixed pitch blades. An additional advantage of passive pitch control blades is their quicker response time, presenting a viable solution for enhancing the feasibility of small WECS in particular.

1.3. Literature Review

1.3.1. Passive Control Concepts

Liebst [9], in 1986, studied the minimization of loads due to wind gusts on a curved wind turbine blade rotor. They observed that when a gust occurs, the curved wind blade changes its geometry, significantly reducing the pitch angle and therefore reducing aerodynamic loads on the blade.
In 1990, Christakis [10] proposed a WECS with sails instead of blades. The sails were controlled passively with the aid of elastic fibers. He also proposed a 9 m blade designed for twist–bending coupling.
Serra and Van Schoor [11], in 1995, presented an investigation of a self-regulating pitch control blade mechanism. The blade pitch results from the equilibrium between the bending moment of the aerodynamic load and the inverse torque generated by a spring. The spring was selected so that the blade operates in a range near maximum efficiency. The self-regulating pitch control blade mechanism exhibited improvements of up to 40% compared to a reference fixed blade. Serra and Van Schoor validated their mathematical model via experiments in a wind tunnel.
Eggers et al. [12], in 1996, demonstrated load reductions by linking a pitch control system to flapwise blade loads using simple integral control. The results indicated the potential to reduce the root-mean-square (rms) blade bending response to turbulent winds by about half.
Finally, although a departure from other work presented here for passive control of wind turbines, Tran, in 2010 [13], presented a methodology that obtained the optimal main characteristics (geometric and energetic features) of the Permanent Magnet Synchronous Generator (PMSG) for passive wind turbines, which allowed the design of a system without active electronic parts (power and control).

1.3.2. Passive Twist Coupled Control Concepts

Infield and Feuchtwang [14] in 1995 and [15] 1999 showed how small turbines can have improved speed regulation with extension twist coupling. They proposed and tested a “bend–twist-coupled” blade developed to control the rotor in a runaway scenario. Their composite blade was fabricated using a helical layup with layers of glass and carbon fibers. Measured twist coupling agreed well with predictions, and measured runaway speeds were actually less than predicted.
Lobitz and Veers [16], in 1996, studied the effects of twist–bend coupling on the annual energy production of a nominally 26 m diameter stall regulated HAWT. Using the generic utility-sized rotor as a test case, two blade twist configurations in conjunction with three twisting schedules were investigated to determine the benefits of blades that twist towards stall with applied loading. In all cases, the annual energy was increased by 10-15% for a maximum blade twist of two degrees and 5–7% for a one-degree maximum twist. In 1998, Lobitz and Veers [17] studied the stability effects of coupled rotors and addressed two of the most common stability constraints, namely classical flutter and divergence.
Eisler and Veers [18], in 1998, examined the performance gains of adaptive blades that twist under the action of centrifugal loads installed on a 26 m diameter variable speed rotor. The ability of bending–twist-coupled blades to attenuate (or exacerbate) cyclic loading was investigated by Lobitz and Laino [19], in 1999, and Lobitz, Veers, and Laino [20], in 2000, for a 33 m diameter rotor employing three different control strategies: constant speed stall-controlled, variable speed stall-controlled, and variable speed pitch-controlled. Results for the constant speed stall-controlled case indicate that twist coupling towards the stall produces significant increases in fatigue damage, and for a range of wind speeds in the stall regime, apparent stall flutter behavior is observed.
Christakis and Condaxakis [21,22], in 1998 and 1999, presented a passive pitch regulation flexible blade that constantly changed its geometry under bending. The initial wind turbine blade tests exhibited good performance in low-turbulence wind.
In 2002, Zuteck [23] conducted a study on a 30 m curved planform wind turbine blade constructed from a combination of glass and carbon fibers. He introduced the concept of bend–twist coupling for blades that allowed for passive control of the rotor. This design enabled the blades to self-adjust their geometry in response to aerodynamic loads. Zuteck found that decreasing the torsional stiffness was essential for achieving sufficient twisting of the blade. Furthermore, he suggested that the reduced aerodynamic load could allow for an increase in rotor diameter, thereby reducing the energy cost.
Continuing this line of research, Larwood and Zuteck [24] in 2006 explored a swept-blade concept, which was found to enhance energy capture without increasing turbine loads. Their study compared a 28 m backward-swept radius blade (STAR6) with a conventional 25 m straight–rigid blade rotor. The results indicated that the swept blade rotor achieved a 5–10% increase in energy capture while maintaining the same load envelope.
Building on these findings, researchers at Sandia National Laboratories [25] investigated the sweep–twist adaptive rotor (STAR) technology. This innovation aimed to reduce operating loads, thereby facilitating the development of larger, more efficient rotors. The design incorporated passive blade twisting at the outer sections to limit maximum rotor thrust. Experimental data showed that a 54 m backward-swept prototype blade, termed the STAR blade, increased average energy capture by 10–12% compared to a 48 m straight–rigid–bladed rotor without any increase in blade root bending moments.
M. Masoudi and K. Pope [26] investigated two swept blades with different bend depths for power enhancement potential of NREL Phase VI rotor via a curved planform geometry. Fluid–structure interaction analysis was performed at different wind speeds, and the CFD results were verified using experimental data. The induced elastic twist of the blade at different sections was reported, and a maximum elastic twist of 0.67° was predicted from a bend depth of 1.5 m for a wind speed of 15 m/s. A blade with a box spar was developed to investigate the effects of a closed-section spar on the elastic twist. The study predicts that a blade with a box spar experiences 18% less elastic twists compared to a blade with an L spar. A 1.89% improvement is estimated due to elastic twist at 10 m/s wind speed.
Marcus Wiens et al. [27] investigated the effect of bend–twist coupling in the design of large wind turbine rotors for passive load reduction. Starting from a straight rotor blade of the IWT 7.5MW-164, designed without sweep, he proposed a swept rotor blade and a new control method that exploits bend–twist coupling to mitigate gust effects. The feedforward of the blade tip twist rate establishes fast gust detection, and the pitch angle can be adjusted accordingly. The simulations demonstrated that this novel control strategy can lead to a reduction in maximum loads during gust events. In addition to regular closed-loop pitch control, the twist rate is used to adjust the collective pitch angle using feedforward control. Extreme loads for flapwise bending moment can be reduced on average by up to 6%, and tower acceleration is reduced by 15%.
Jorge Mario Tamayo-Avendaño et al. [28] explored the effects of bend–twist coupling on the performance of a small wind turbine rotor. He proposes the development of a small wind turbine blade using appropriate composite material layering to achieve passive control of the rotor. A comparative numerical analysis with a reference counterpart is performed using a fluid–structure interaction commercial software, which resulted in a 3% increase in the annual energy yield due to the bend–twist coupling, used as a passive pitch mechanism and an increment of 0.2% and 0.3% for the blade root flapwise moment and the rotor thrust force, respectively, when considering parked conditions.
R. Riva et al. [29] investigated the stability implications of a bend–twist coupling design for a wind turbine rotor. They perform a comparative stability analysis of a very large wind turbine, firstly on an isolated blade and then on the complete rotor, where the bend–twist coupling at the new non-conventional blade is obtained by rotating the fibers of the spar caps inside the blade. The analysis results show that the bend–twist coupling has a minor effect on the response of the isolated blade in the case it is dominated by stall-induced vibrations, and for the complete rotor, the edgewise whirling modes and the tower side–side mode characteristics are not affected by the bend–twist coupling.

1.3.3. Passive Control Numerical Codes and Algorithms Studies

In 1999 Voutsinas, Belesis and Rados [30], proposed a nonlinear, completely aero elastic 3D computer code for wind turbines, which is a useful tool for passive pitch control wind turbine blade studies. Capuzzi in 2015 [31] proposed an aero-elastically tailored blade, analyzed by using finite element models with structural stability and strength constraints imposed under realistic load cases.
MacPhee in 2011 [32] presented a methodology for developing a flexible turbine blade for passive blade pitch control in wind turbines, using a robust and accurate fluid–structure interaction routine, and introduced two morphing scenarios: one where rigid and flexible blades are identical when unloaded, and one where they are identical at the stall angle.
Larwood’s paper [33] in 2014 described a parametric study of swept blade design parameters for a 750 kW machine. The amount of tip sweep had the largest effect on the energy production and blade loads; other parameters had less impact. The authors then conducted a design study to implement a swept design on 1.5 MW, 3 MW, and 5 MW turbines. An aeroelastic code, described in the paper, was developed to model the behavior and determine the loads of the swept blade. The design’s goal was to increase annual energy production by 5% over the straight–rigid blade without increasing blade loads.
Xin Shen in 2015 [34] described a multi-objective optimization method for the design of horizontal axis wind turbines using the lifting surface method as the performance prediction model. The purpose of the optimization method is to achieve the best trade-off of the following objectives: maximum annual energy production and minimum blade loads, including thrust and blade rood flapwise moment. The result shows that the optimization models can provide more efficient designs.
M.G. Khalafallah [35] presented a CFD simulation methodology of a swept blade HAWT for a 0.9 m diameter wind turbine model. Four different scenarios were simulated: a backward sweep, a forward sweep, an upstream sweep, and a downstream sweep blade compared to a straight–rigid blade. The results show that the downstream swept blades are able to generate more output power than the straight–rigid blades but with a relatively higher axial thrust force. So, the blade deflection and tower clearance should be considered during the design phase of swept blade rotors.
Chen et al. [36,37], in 2014 and 2016, presented a passive pitch control mechanism for small horizontal axis wind turbines (HAWT), addressing the challenges of startup at low wind speeds and safe operation at high wind speeds. They developed a centrifugal force-based system to adjust the blade’s pitch angle automatically as the wind speed varies, enhancing turbine performance across different wind conditions. The design, patented by their laboratory, was validated via wind tunnel experiments, demonstrating its effectiveness in both high and low wind speed scenarios.
In 2017, Jeh Chu [38] developed a biomimetic horizontal axis wind turbine (HAWT) blade modeled after the Dryobalanops aromatica seed, utilizing OpenFOAM® for computational fluid dynamics (CFD) analysis. Results indicate that the biomimetic turbine generates higher torque and demonstrates better self-start capabilities, with a power coefficient (CP) of 0.386 at a tip speed ratio (TSR) of 1.5. they reported that it outperforms conventional blades [39] in low wind conditions and mitigates blade root bending stress via centrifugal forces.

1.4. Scope

This article aims to present preliminary results from a study on a novel flexible blade concept aimed to be part of a passively controlled wind turbine rotor system. It emphasizes the aerodynamic performance and behavior of a flexible wind turbine blade in comparison with a conventional straight blade. The primary focus is on a flexible blade designed to self-regulate its performance via intrinsic mechanical responses to varying wind speeds. This blade is characterized by its ability to twist around its longitudinal axis under bending loads, an attribute facilitated by its unique elasticity and geometric properties. These properties allow the blade to adjust its pitch angle dynamically in response to aerodynamic loads, thus optimizing power output and enhancing operational safety.
The scope of this research includes a detailed comparison of the aerodynamic performance of two small-scale model blades—one conventional straight (and relatively rigid) and one flexible curved—under controlled conditions in a wind tunnel. The performance metrics compared include rotational velocity, power output, and efficiency across various wind speeds and braking conditions. This comparison helps to illuminate the distinct advantages and potential drawbacks of the flexible blade design, particularly its ability to start generating power at lower wind speeds and to maintain controlled power output at higher speeds, akin to systems with active control mechanisms.
Furthermore, the study also reports on the alignment—or lack thereof—between the designed performance characteristics and the actual operational outcomes of the flexible curved blades. The findings indicate a misalignment in the activation of passive control mechanisms at designated wind speeds, pointing to areas requiring further design refinement.
The article also sets the stage for subsequent investigations as part of a series, with future work aiming to build on these findings by exploring advanced material composites and further optimizing blade design to fully realize the potential of passively controlled wind turbine blades. This ongoing research is intended to contribute significantly to the development of more efficient, safer, and economically viable wind energy solutions.

2. Methodology

2.1. Overview

As stated previously, the objective of this study is to present preliminary results from an innovative passively controlled wind blade concept, highlighting its distinctions from a traditional rigid system. To achieve this, the paper compares two directly comparable wind blades: one rigid straight and one flexible curved, both fabricated from isotropic materials using CNC machining stations. In some instances, the terms ‘rigid’ and ‘straight’, as well as ‘flexible’ and ‘curved’, may be used interchangeably in the text for the sake of clarity and conciseness. The comparisons will focus on the results from power versus wind speed tests, and from the coefficient of power (Cp) versus wind tip ratio (λ), with the goal of underscoring the differences between the two designs.
The methodology section of this paper will cover the following areas:
  • A brief overview of the key points of the Blade Geometry Algorithm, which will not be detailed extensively in this paper as it is the subject of another study. This will include an introduction to the concept and the fundamental steps involved.
  • A detailed presentation of the test campaign conducted for all three blades, highlighting experimental setups and findings.
  • An explanation of the measurement apparatus and the configuration of the wind tunnel used during the tests.

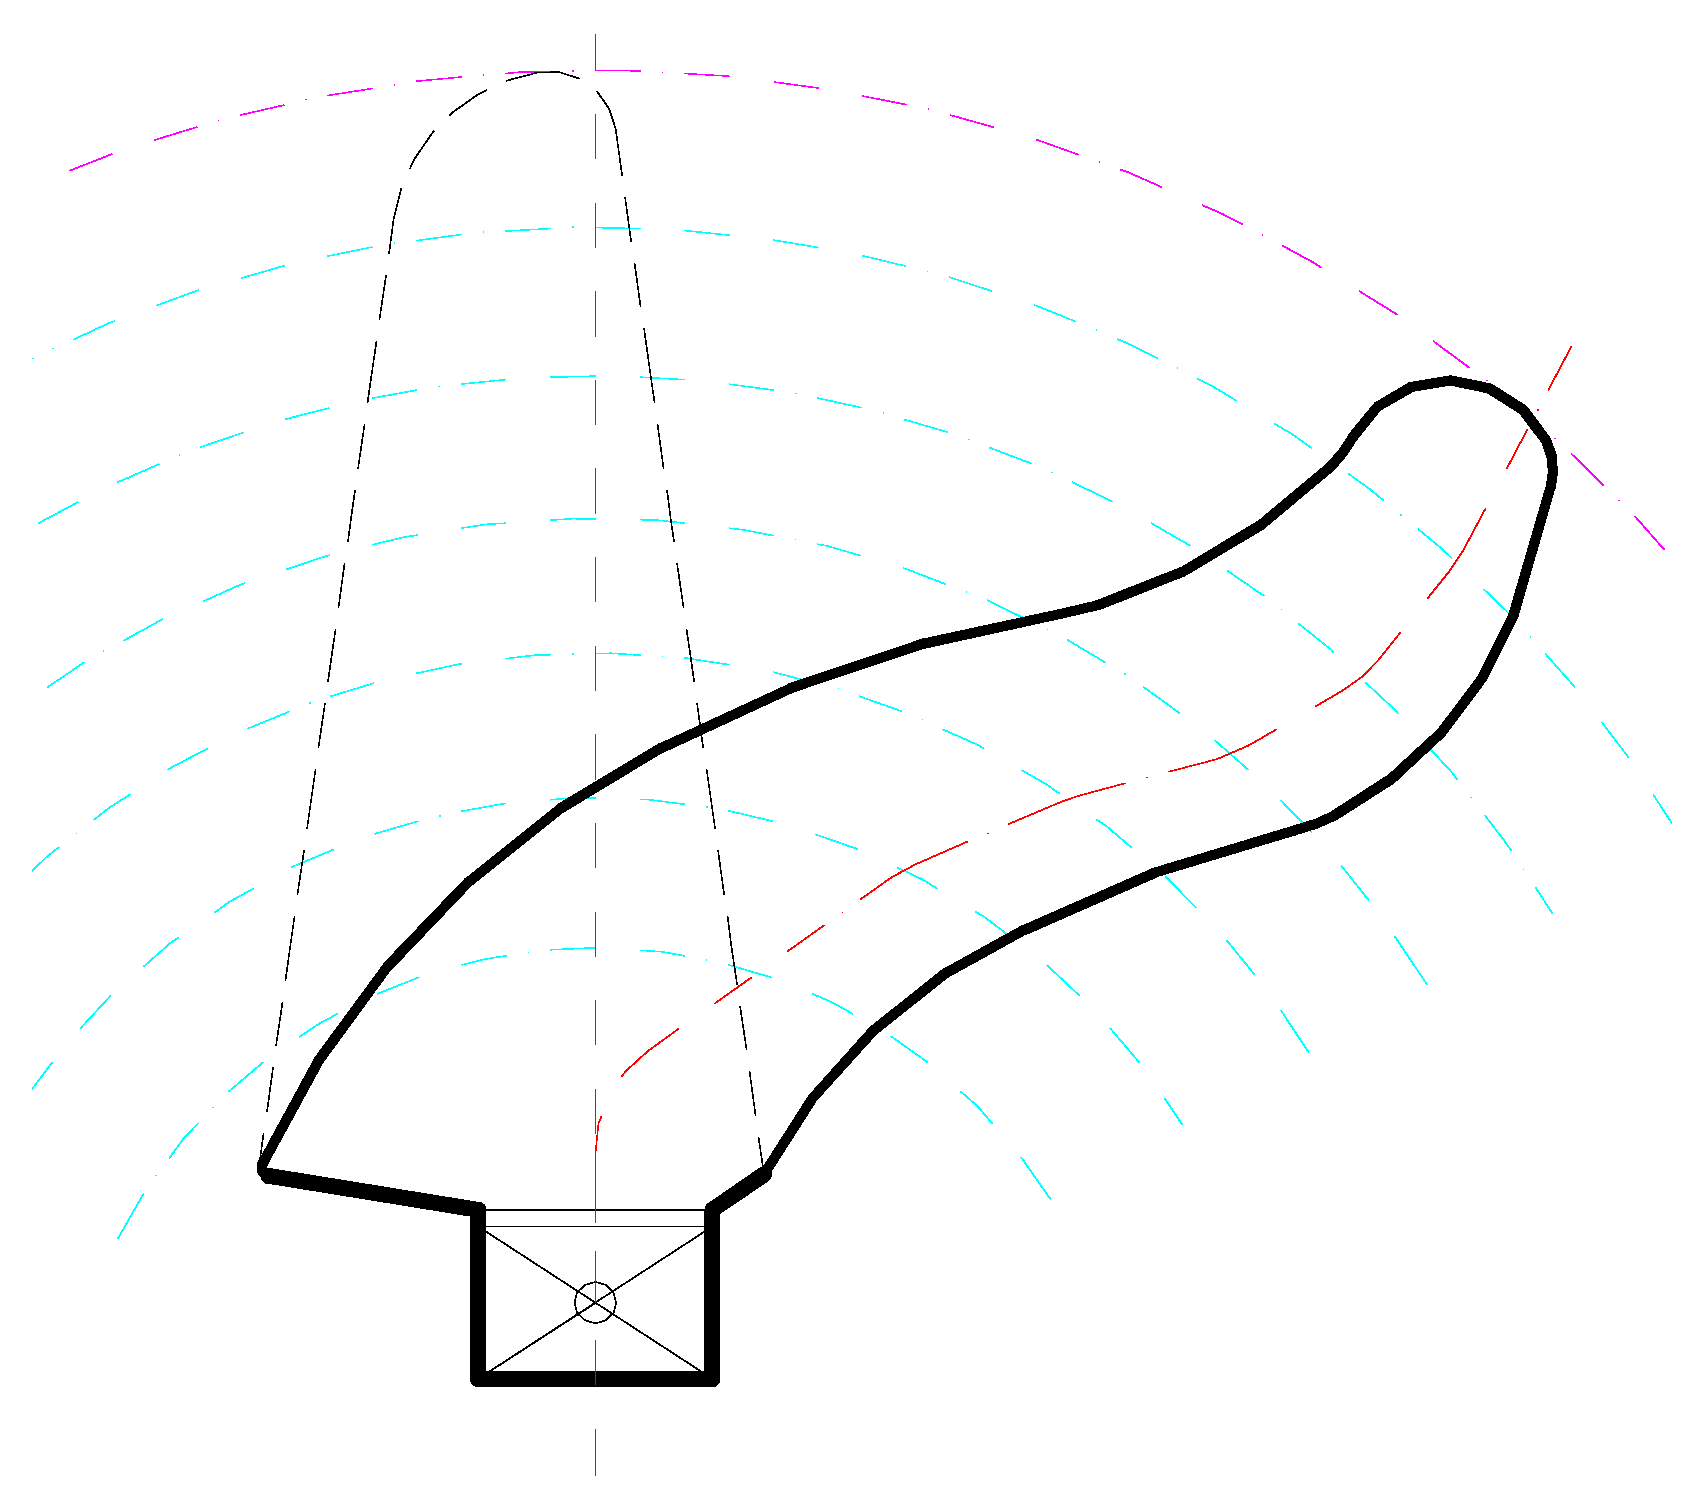
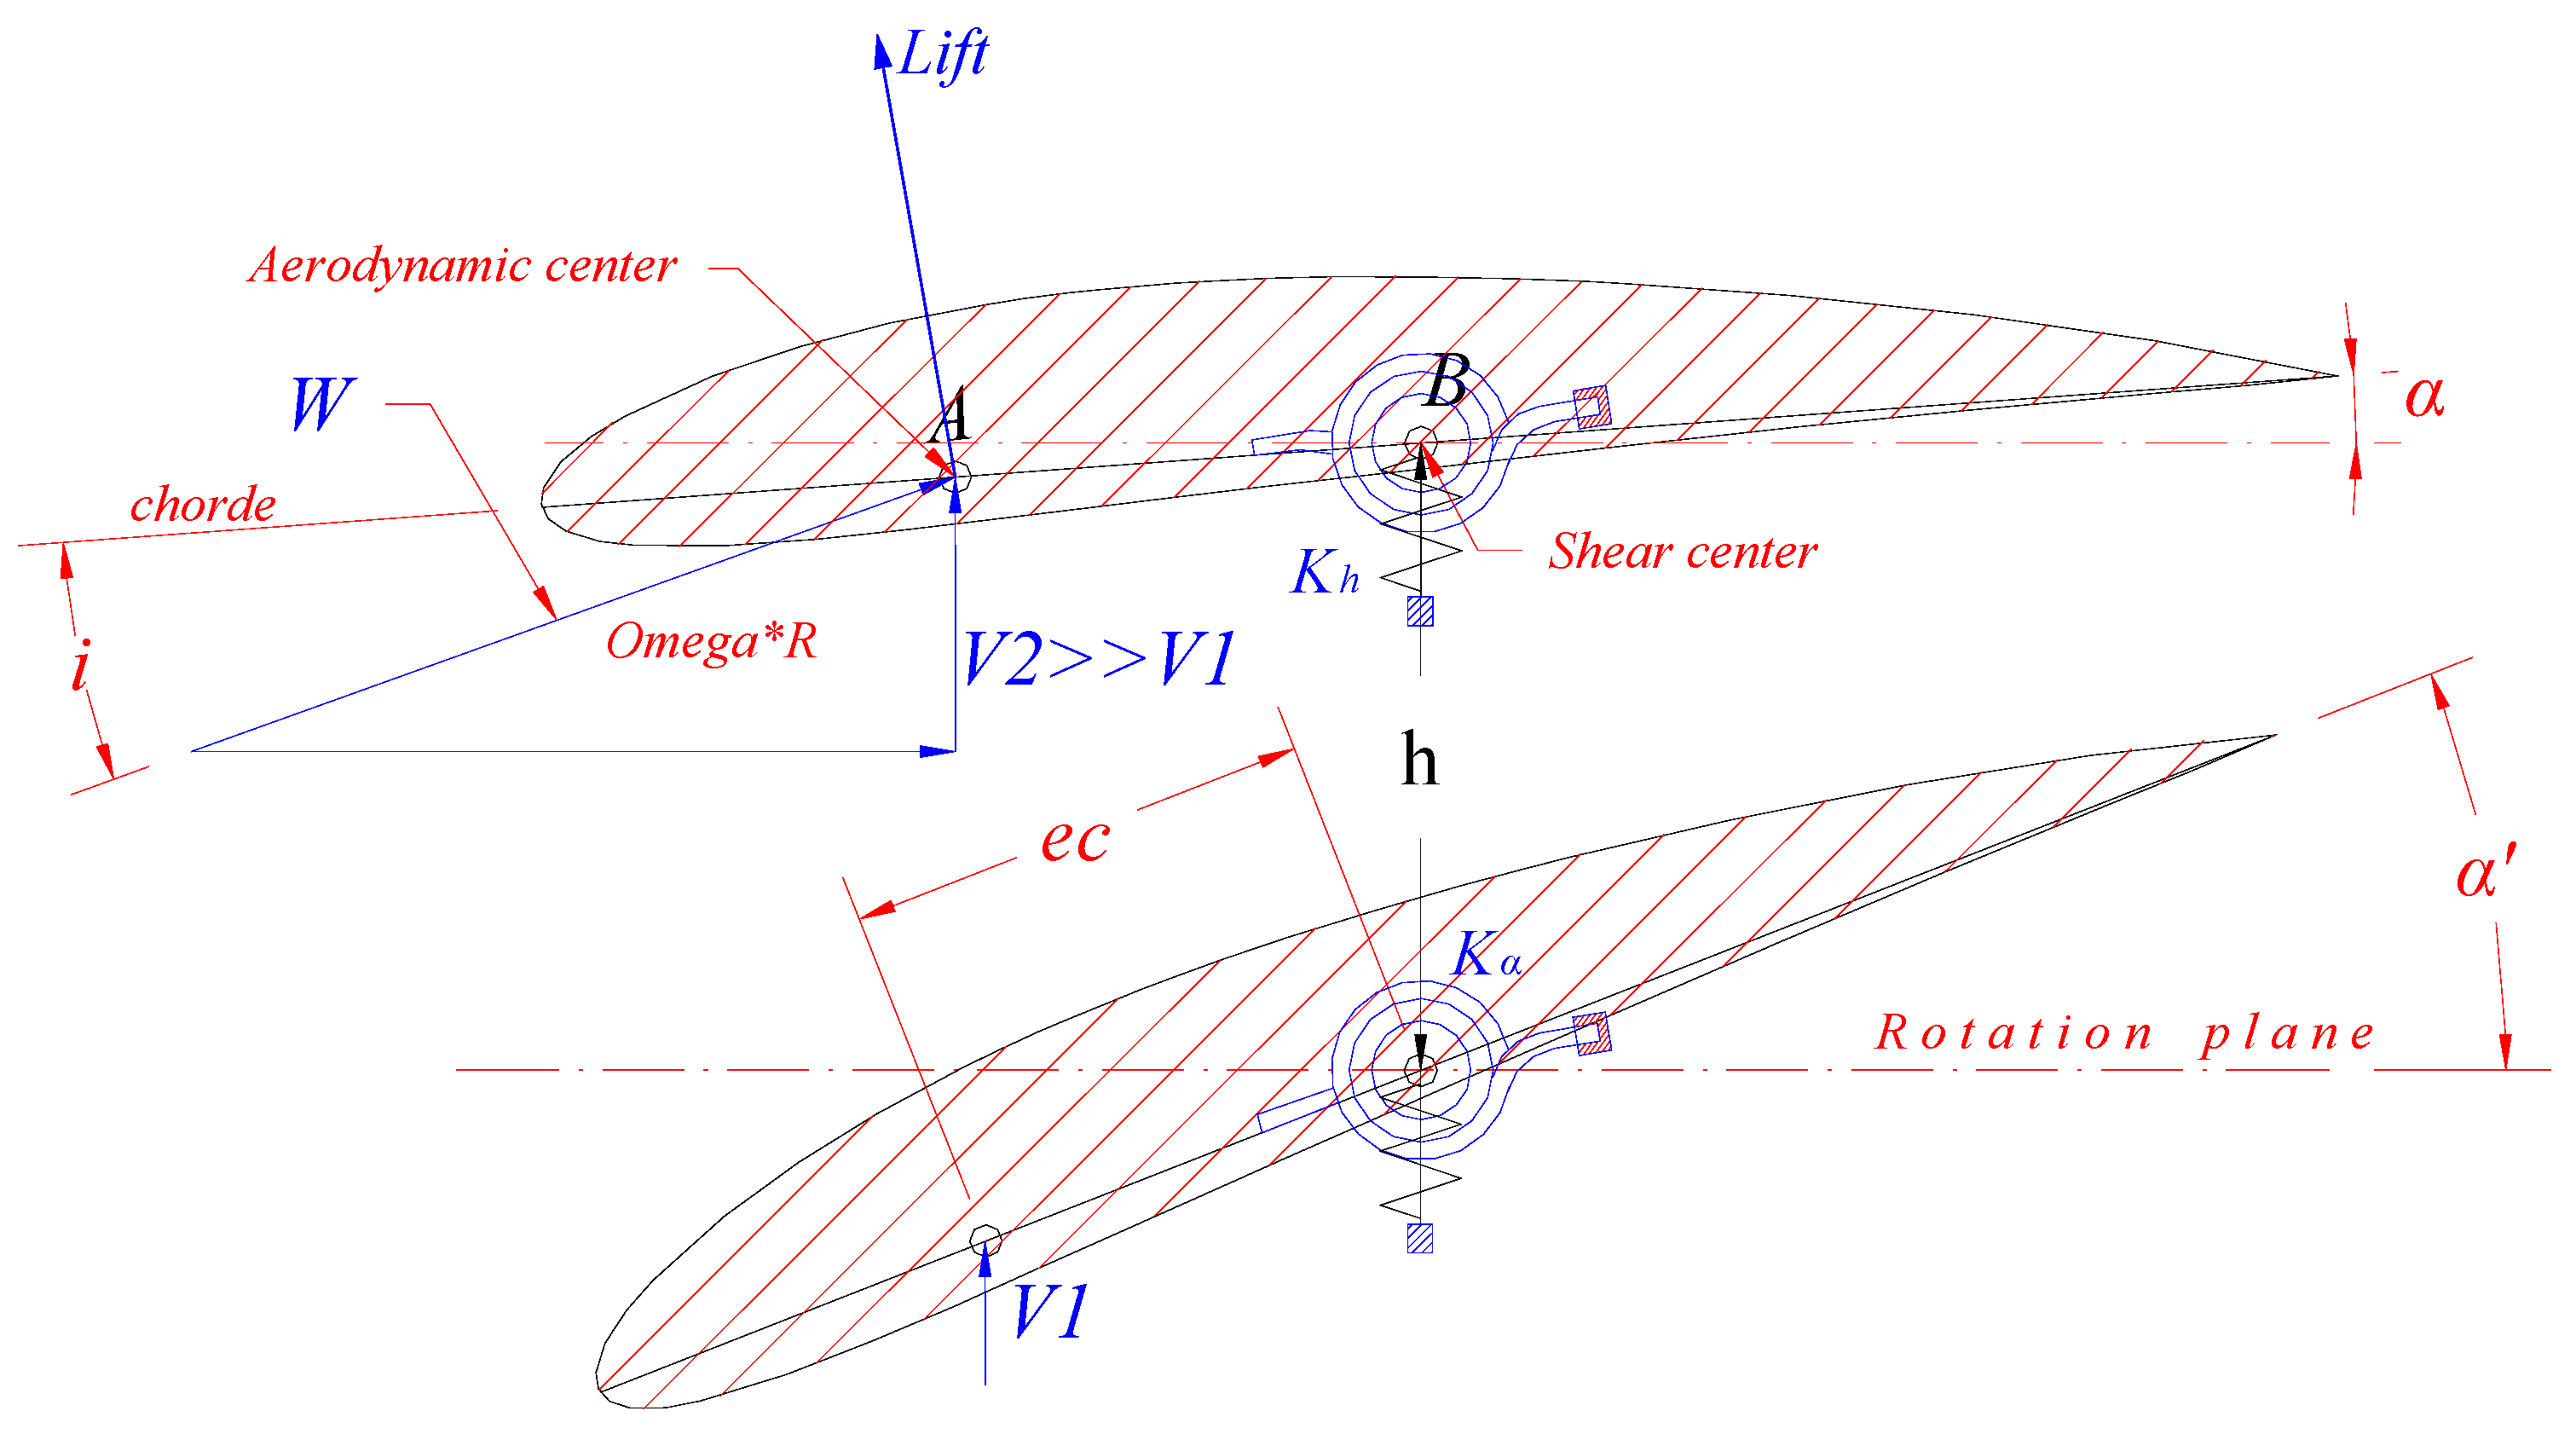
2.2. Blade Geometry Algorithm

Figure 2 provides a comparative illustration of the straight and curved blades to introduce the reader to the flexible curved blade concept. The flexible curved blade can be conceptually divided into three distinct sections. The first section, mounted on the hub, constitutes about a quarter of the total blade length and is engineered for high rigidity to ensure stability at the blade’s root. The second section, making up approximately half of the blade’s length, is known as the control section. This part is designed and manufactured to possess the necessary elasticity to facilitate the desired aerodynamic control. The final quarter of the blade is further optimized for enhanced elasticity, enabling it to respond swiftly and effectively to rapid changes in wind velocity. This segmentation ensures that each part of the blade performs optimally under varying operational conditions.
The design of the flexible curved blade utilizes the same aerodynamic cross-sectional profiles as the straight blade, applied at corresponding radii. However, for each radius, the profile is offset by specific angles at different radii to introduce significant torsional deformation without altering the chord length or other basic geometric characteristics. As a result, despite the curved blade cross-sectional profiles exhibiting eccentricity compared to the straight blade (which maintains zero eccentricity), they remain tangent to the same radius. This configuration maintains fundamental aerodynamic properties consistent across both blade types, while the adjusted eccentricity offset induces a bend–twist coupling when aerodynamic bending loads are applied to the blade, which affects the torsional response of the flexible curved blade.
Figure 3 offers a cross-sectional view of the blade perpendicular to the plane of rotation, enhancing our understanding via two distinct operational scenarios: one at low wind speed with no rotation (bottom) and another at high wind speed (V2) with rotation (top). In both depictions, the wind (V1 for low speed and V2 for high speed) is assumed to originate from the bottom of the image, perpendicular to the plane of rotation, with the velocity of the cross-sectional profile (ω⋅R) shown horizontally.
In the lower section of the figure, the blade remains undeformed under low wind conditions (V1), resulting in no loading. Conversely, the upper image captures the blade under higher wind speeds (V2), where the offset between the aerodynamic center and the shear center induces bend–twist coupling. This coupling modifies the pitch angle of the blade, illustrating the dynamic response of the blade structure under varying wind forces.
It is crucial to note that the profile of the cross-section is a standard NACA4415. This profile was chosen because it is well-researched, with documented coefficients of lift (CL) and drag (CD), although it can be altered to meet specific user requirements. In this context, what we refer to as a “blade segment” in the paper is essentially a tangential cross-section of the blade at a specified radius from the center of rotation and follows a specific aerodynamic profile (e.g., NACA).
As depicted in Figure 3, the resultant wind speed ( W = V + ω × R ) forms an angle of attack (i) with the chord, which is greater in the high-speed scenario (V2). The pitch angle difference (α’-α) shown in the upper sketch also varies, leading to both bending (h) and twisting deformations of the blade. At high wind speeds, the increase in the angle of attack (i) causes the blade to enter the aerodynamic stall region, highlighting the critical interplay between blade geometry and operational wind conditions. A challenging aspect of this design is accurately validating and calculating the eccentricities to ensure that they meet the design criteria. The design criteria defined for this project are as follows:
-
Quick start-up of the blade to ensure rapid response to wind conditions.
-
Achievement of nominal velocity at nominal wind speeds (8–10 m/s).
-
Maintenance of a stable power yield plateau from nominal speed up to the cutoff speed.
-
Initiation of stalling in the wind blade when wind speeds exceed the cutoff threshold.
This approach ensures that the blade’s performance is optimized across a range of operational conditions, highlighting the sophisticated interplay between blade geometry and dynamic wind forces.
Figure 4 provides a comprehensive overview of the curved blade geometry derivation algorithm and the various steps involved. Initially, a straight–rigid blade is designed using geometry derived from an aerodynamic code. This code incorporates the Larsen, Frandsen, Soeresen, and Courtney [40] theoretical framework for aerodynamic behavior modeling. Additionally, it utilizes enhancements based on Glauert’s theory for airfoils and airscrews as described in Désiré Le Gouriérès’s “Les Éoliennes” [41], and incorporates aspects of the Hansen Blade Element Momentum method [42]. The code is not within the scope of this article and is planned to be presented extensively in another article upon maturity.
The parameters required for the aerodynamic code include the nominal power output, nominal wind speed, radial distribution of the chord length, and radial distribution of the pitch angle (with radial distribution referring to variations at different radii). Another parameter is the number of segments along the radius, typically set at 10 but adjustable to enhance algorithm precision. For a straight–rigid blade, aerodynamic loads are primarily aligned near the blade’s elastic axis across all spanwise sections. The output from this phase includes the chord length and pitch angle at various radial segments.
The flexible curved blade geometry builds on the straight–rigid blade’s parameters (chord length and pitch angle) with the additional parameter of eccentricity (usually expressed in degrees). This eccentricity, which shifts the elastic shear center of the profile, increases the torsional load due to aerodynamic lift and drag components, leading to more pronounced torsional rotation. The process begins with an initial eccentricity assumption, which modifies the profile segments. This adjustment and the corresponding aerodynamic loads are then input into a finite element code to calculate the bending–torsional deformation along the blade. This deformation, influenced by the blade’s curve and spanwise loading distribution, alters the pitch angle. The blade is designed to self-adjust and bend and twist under aerodynamic forces, thereby keeping the pitch angle within an optimal range for maximum lift across various aerodynamic load conditions, ensuring optimal energy production over a broad range of wind speeds.
The flexible curved blade geometry has been designed in the Dassault Solidworks CAD system and optimized the deformation using its Simulation package for structural analysis. A static analysis was used where aerodynamic loads were imposed on the structure, and the deformation was measured. In terms of degrees of freedom (dof) in the simulation, the blade edge attached to the hub is fixed in all dof, while the opposite edge remains entirely free without any rotational or translational constraints. The load modeling reflects the dynamic pressure of the wind, adopting an inverse triangular thrust distribution. This load distribution assumes zero pressure load at the blade root and maximum pressure load at the tip, which is representative of the typical operational thrust distribution near rated power.

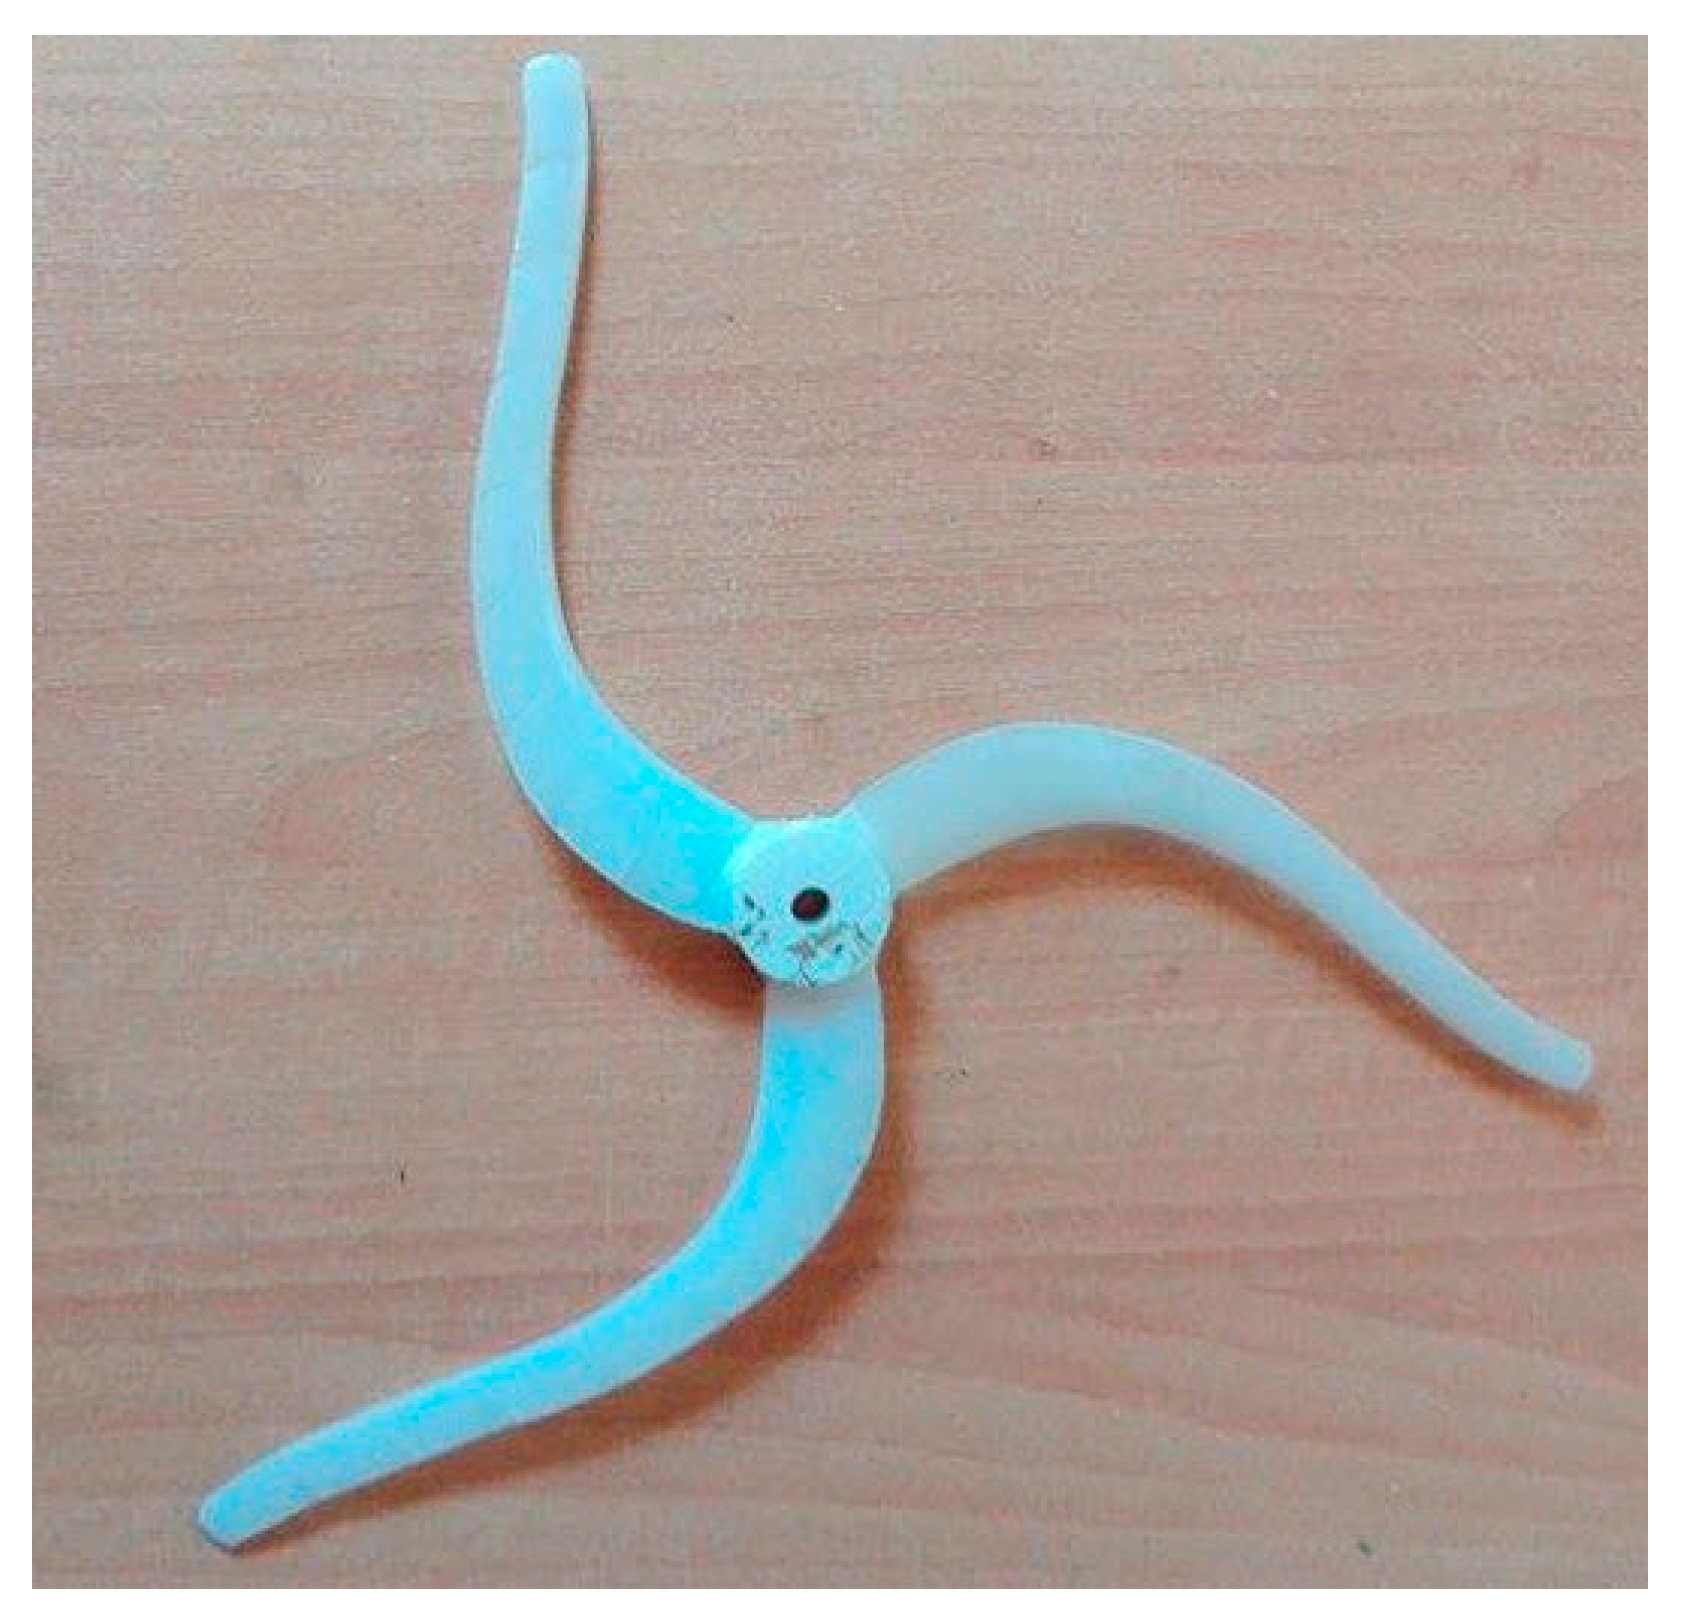
2.3. Blade Materials and Construction

2.3.1. Blade Material

A very important parameter for the blades is the construction material. High-Density Polyethylene (HDPE) material was selected because of its mechanical properties (800 N/mm2 of elastic modulus and 30 N/mm2 of tensile strength). For the construction of the blades, a two-axis CNC machine was used in order to obtain a solid blade structure with the required tolerances. After the construction of the blades, a hub was designed and constructed in a 3D printer using ABS material, and afterwards, the rotor was assembled.

2.3.2. Post-Construction Procedure

Upon completion of the rotor construction, several critical post-construction procedures were undertaken to ensure the structural integrity and functionality of the blades. Initially, the blade surfaces were meticulously sanded to enhance their aerodynamic smoothness, preparing them for further testing.
The blades then underwent static testing where weights, simulating aerodynamic loads, were applied. This testing was crucial for two primary purposes: measuring the displacements and angles along the blade to ensure that the empirical data aligned with the values predicted by our simulation models and confirming the structural strength of the blades under simulated operational stresses.
The results from these tests confirmed that the behavior of both the straight and curved blades was consistent with the expectations based on their design specifications. Furthermore, the method of static control in bending and torsion with distributed loads was carefully executed to validate the correlation with the simulation models, ensuring that the physical prototypes behaved under load as anticipated by theoretical analyses.
Finally, after assembly to the hub, the blades were subjected to balance testing on a horizontal shaft that was free to rotate. This test was essential to detect any preferential tilting or imbalance in the setup that could potentially affect performance and safety. These comprehensive post-construction tests are vital to guarantee that the rotor operates safely and efficiently, bridging the gap between theoretical design and practical application.

2.4. Measurement Campaign

2.4.1. Types of Measurements

Two distinct types of measurements were employed during the testing phase, categorized based on the wind velocity conditions: constant velocity (internally denoted as “RR”) and increasing velocity (“VV”).
Constant Wind Velocity Test (RR): In the constant wind velocity test, the wind blade is exposed to a steady wind until the revolutions per minute (rpm) of the blade stabilize at an equilibrium. Following this stabilization, an external load is gradually applied to the wind blade shaft, either mechanically (or electrically if the rotor is connected to a generator). This test format is commonly used to characterize wind energy blade performance, particularly for calculating the power coefficient (Cp) versus tip speed ratio (TSR or λ). It is important to note that the magnitude of the load significantly influences the power coefficient. Specifically, an excessively high load can stall the blade, while an insufficiently light load may prevent the blade from slowing sufficiently to observe the desired effects. During these tests, the braking load is gradually increased to a point where the blade decelerates enough to eventually stop.
Varying/Increasing Velocity Test (VV): Contrastingly, the increasing velocity test is designed to characterize the performance of the wind blade across a broader range of wind speeds and may include the application of braking loads. Although not as typical for standard characterization, these tests are crucial in this context as they highlight the benefits of the passively controlled wind energy converter system. This approach allows for an assessment of the blade’s adaptability and performance under varying operational conditions.

2.4.2. Measurement Sets and Designation

The measurement campaign for isotropic blades involved testing blades with the same radius, curved and straight. Table 1 presents the constant velocity measurements for the isotropic blades. For the flexible curved blade, measurements were systematically recorded from wind speeds of 5 to 19 m/s at 1 m/s intervals, as per readings from the Pitot–Prandtl tube. In contrast, the rigid blade was tested within a narrower range of 6 to 14 m/s, with intervals of 2 m/s. A critical consideration for not testing the straight blade at higher wind speeds is related to the methodology of the constant velocity tests, which necessitates allowing the blade to stabilize at an equilibrium rpm before applying a brake. Without a control system, the rigid blade can reach dangerously high rpms, posing a risk of damaging the testing setup—indeed, such damage has occurred during testing. Consequently, it was decided to limit the wind speed to safer, lower rpms for the rigid blade. Notably, the flexible curved blade did not exhibit this problem, underscoring one of the key advantages of its design highlighted in this study.
A final note regarding Table 1 is that because of the high number of constant velocity measurements, in order to avoid duplication, it was thought better to use the dataset name and suffix the velocity, e.g., for measurement at 5 m/s of the isotropic curved blade to use the designation “ISO.Curved.RR.05.y” (where y denotes the repletion, if any).
Table 2 presents the parameters for the measurement datasets for the increasing wind tunnel velocity test. The main parameter that changed in this is the braking load (the setting is a value between 0 and 50, with 0 being no brake and 50 the maximum braking). In this table, the parameters of the test are presented (blade type, radius, type of measurement and load) and also the wind speed range velocity and the max rpm during testing. It can be easily observed that the wind speed maximum measurement speed for the straight blade remained at 16 m/s while the wind velocity for the flexible curved blade was set to 19 m/s. The reason, as explained earlier, is the characteristic of the flexible curved blade to act like it has an embedded control system that regulates the power yield and rpm. Another interesting feature is that the flexible curved blade’s rpm remained below 3000 rpm despite being exposed to higher wind speeds. Out of the 15 VV measurements, 4 are related to the flexible curved blade, and the remaining 11 are for the straight blade.

2.5. Experimental Apparatus

The rotor tests were conducted in the Wind Energy Lab’s 600 × 600 mm Wind Tunnel at the Hellenic Mediterranean University. The testing apparatus was equipped to measure various parameters such as wind speed, rotor thrust (T), rotor torque (Q), and rotor speed (N), as illustrated in Figure 5. Table 3 presents the measurement devices, the model names and the manufacturing companies.
Wind speed at the tunnel outlet was recorded using a Pitot–Prandtl tube coupled with a Delta Ohm HD408T differential pressure transducer (Senseca, Italy). To ensure accuracy, the Pitot–Prandtl system was calibrated against an externally calibrated hotwire anemometer.
The rotor’s axis was connected to a SCAIME DR2112L Rotating Torquemeter (France), which provided measurements for torque and revolutions per minute (rpm). Thrust (or drag) was measured using an HBM SP4MC6MR load cell (Germany) interfaced with an ADAM 3016 (Advantech Taiwan) isolated strain gauge input module.
Additionally, a small mechanical brake, activated by a spring-loaded actuator driven by a multiturn servo rotor connected to a screw, was employed to control the braking of the rotor. While the rotor rotates the screw, the spring is loaded. Thus, a relatively constant force is applied to the mechanical brake. One of the shortcomings of this configuration—which is presented in Figure 5—is that the numerical value of the brake setting does not correspond linearly to a braking force.
Data acquisition was handled by a National Instruments NI-USB-6353 card, utilizing the LabVIEW 2014 Development System for setup. A custom LabVIEW application was developed to capture all relevant signals at a sampling rate of 1000 Hz for each channel. These channels included measurements for two wind speeds: drag, torque, and rpm. Data from each channel was segmented into 0.1-s intervals, with recorded values representing the average across each interval.
To ensure accuracy, each measurement device underwent annual calibration. The calibration procedures involved the following:
-
An externally calibrated hotwire anemometer for wind speeds (already mentioned before).
-
Known weights for calibrating the load cell used for measuring drag.
-
Standard weights for torque calibration.
-
A tachometer to verify the rpm measurements.

3. Results for Isotropic Blades

3.1. Geometry for Isotropic Blades

Table 4 presents the geometrical characteristics of the straight isotropic blade and the curved isotropic blade. As mentioned before, the difference lies only in the eccentricity angle, which offsets the elastic axis. Another comment is that for this particular setup, the first two segments correspond to radii, which are technically part of the rotor hub (not part of the actual aerodynamic blade).
The curved blade geometry is presented in Figure 6, and it is expected to develop a twist of 8 degrees at the tip under a wind speed of 12 m/s.

3.2. Straight Blade Isotropic Material

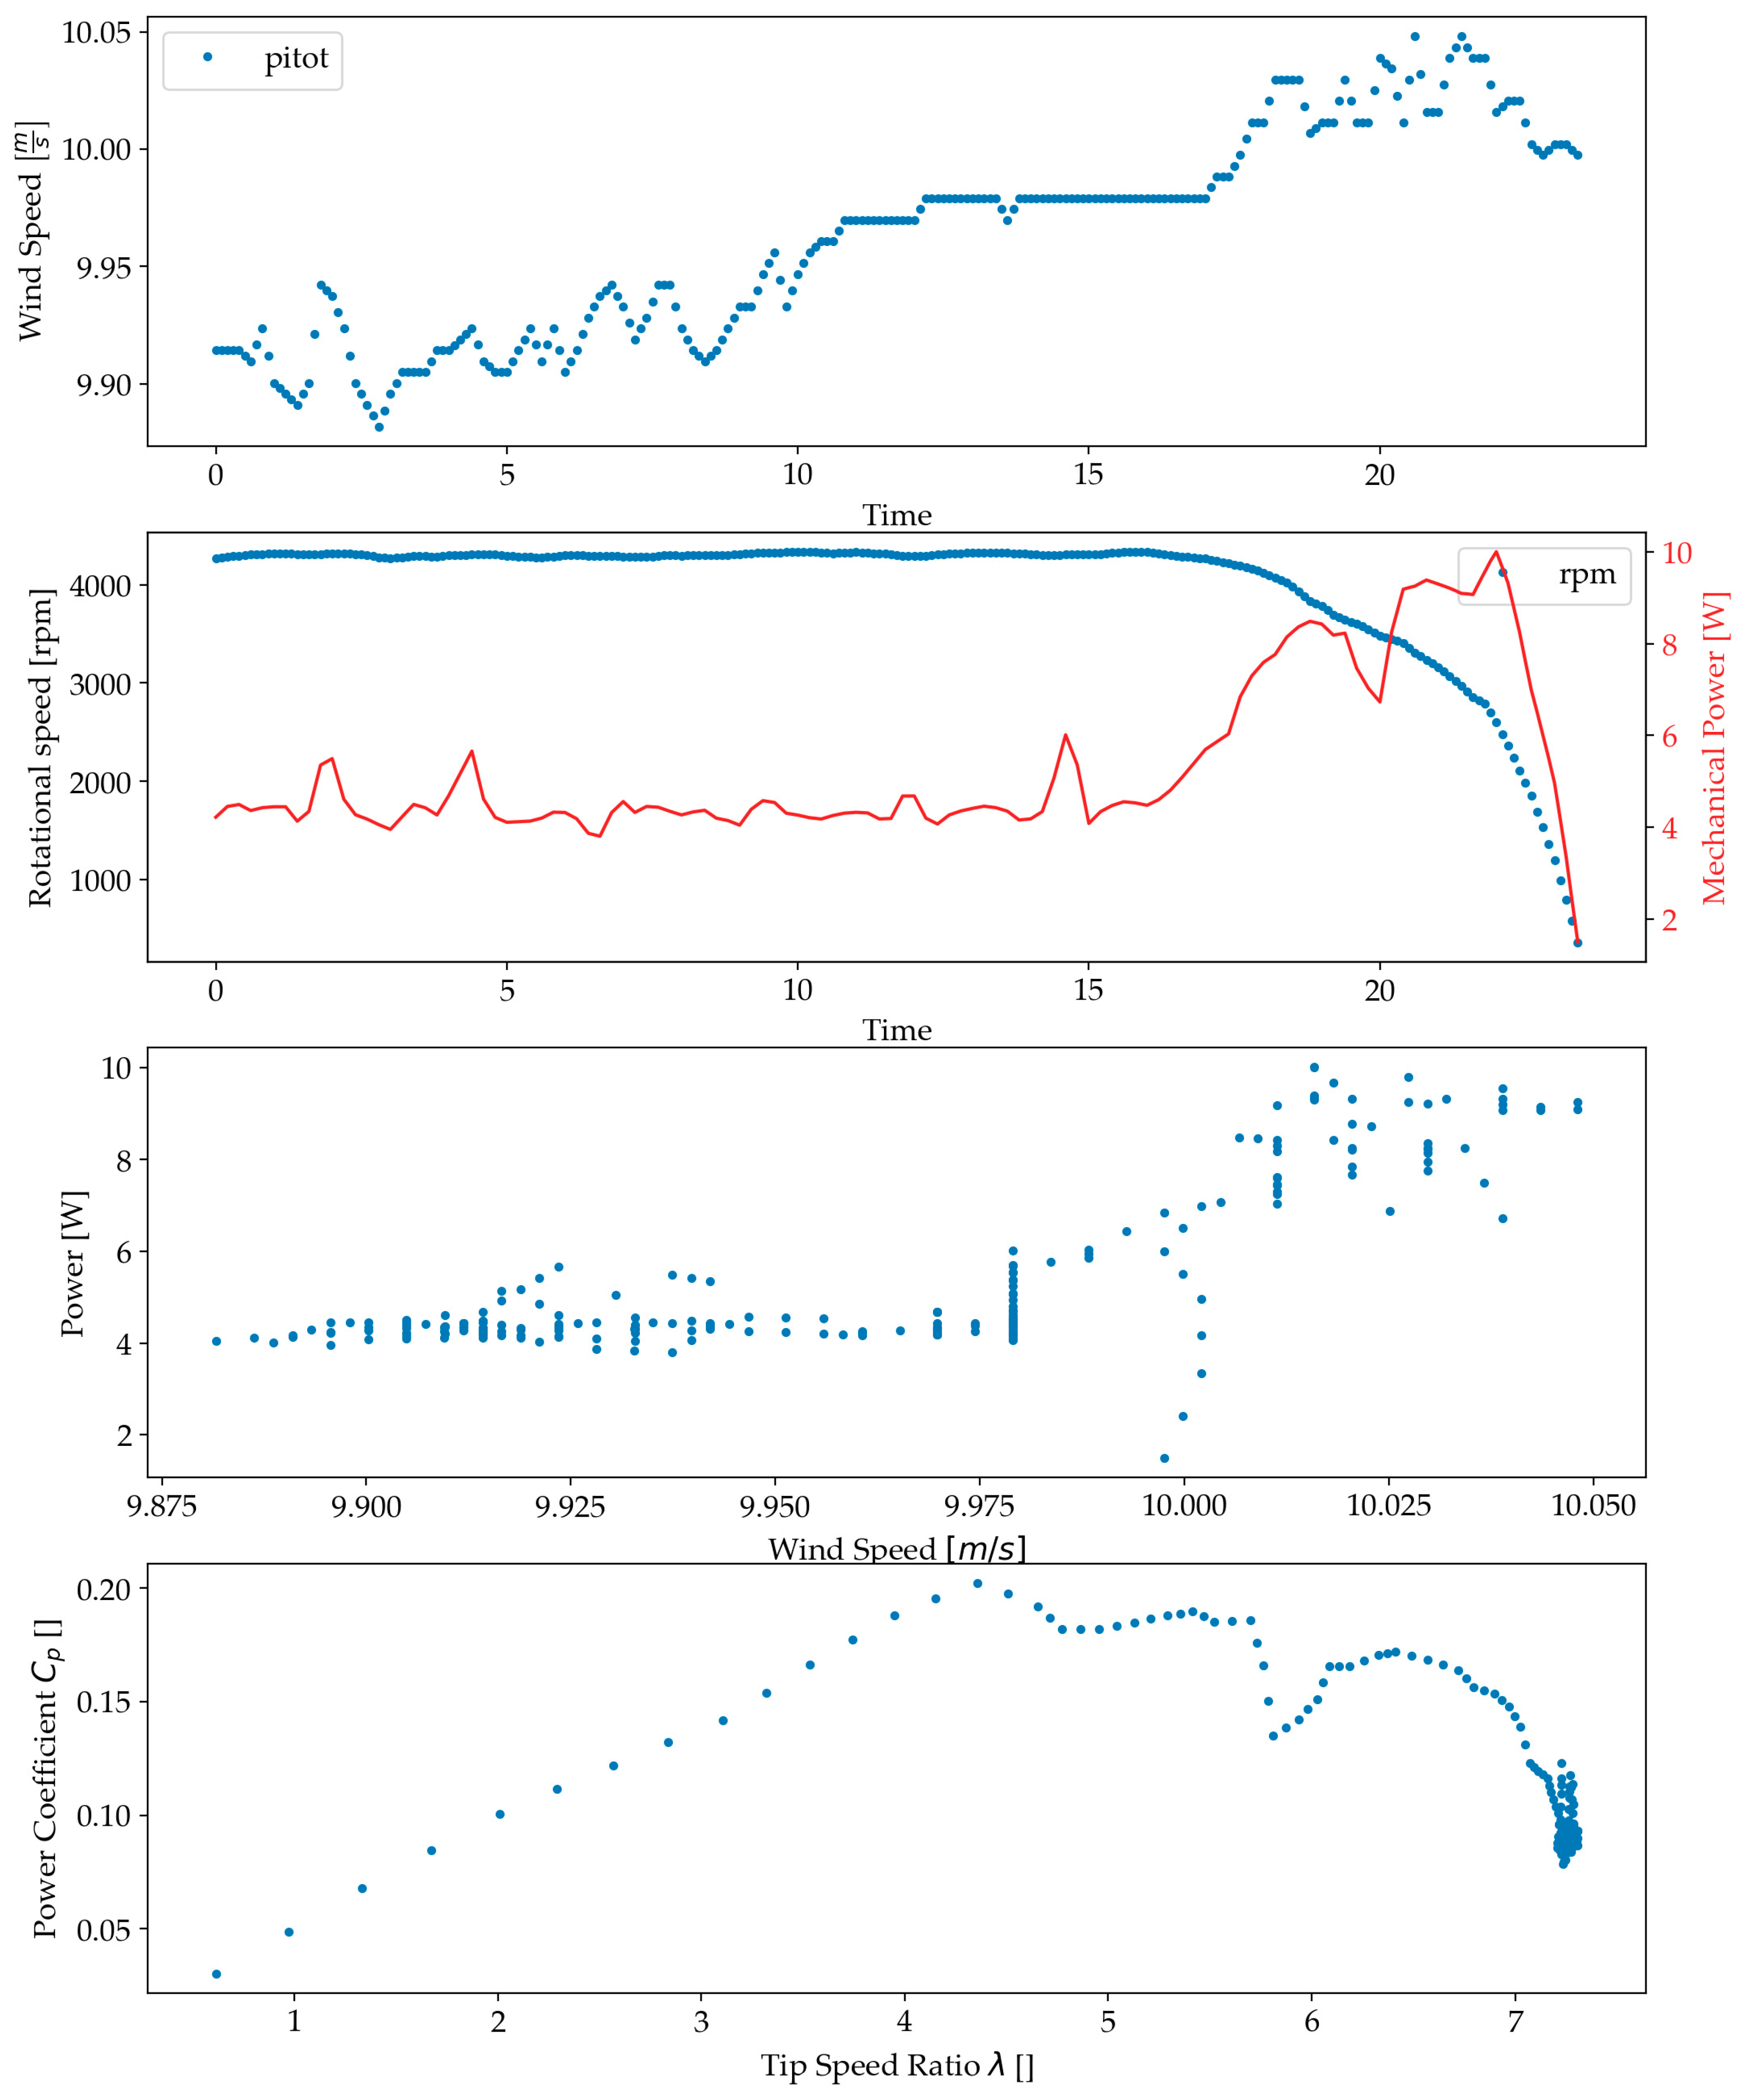
3.2.1. Straight Blade Measurements with Increasing Velocity

Figure 7 features an automated plot summary from a measurement session with increasing velocity utilized for preliminary data validation. The first plot at the top displays wind tunnel velocity, as measured by the Pitot–Prandtl Tube, which ranged from 6 to 15 m/s throughout this particular test. The second graph illustrates two variables over time: revolutions per minute (rpm), shown in blue on the primary axis, and mechanical power in red on the secondary axis. In this test, rpm starts to increase once a specific velocity threshold is reached, with mechanical power consistently rising for the straight blade. The third graph offers a detailed view by plotting each power data point against the corresponding wind speeds measured by the Pitot–Prandtl tube, providing insights into the blade’s mechanical performance. The final graph in the sequence presents the power coefficient (Cp) against the calculated tip speed ratio (TSR) derived from the Pitot–Prandtl measurements. The maximum TSR observed is between 7 and 8, which is consistent with established practices in wind blade performance.
Figure 8 presents mechanical power measurement against the wind speed velocity from all increasing velocity tests of the straight blade, with data points color-coded by brake setting and distinct shapes representing different experiment IDs. The plot demonstrates good repeatability among tests with identical brake settings, underscoring the consistency of the experimental setup. Notably, experiments with higher brake settings commence at elevated wind speeds; for instance, a brake setting of 30 corresponds to starting velocities above 12 m/s. This pattern suggests that the blade requires some time to initiate rotation under higher load conditions. Additionally, as anticipated, the straight blade’s performance increases monotonically with the wind speed, reflecting its predictable operational characteristics under varying aerodynamic loads.
Figure 9 illustrates the power coefficient (Cp) versus tip speed ratio (TSR) for all increasing velocity tests of the straight blade. Data points are color-coded by brake setting, with distinct shapes representing different experiment UIDs. The plot demonstrates good repeatability among tests with identical brake settings, highlighting the consistency of the experimental setup. Notably, experiments with higher brake settings tend to exhibit higher maximum power coefficients. This observation underscores the impact of mechanical loading on the turbine’s output, suggesting the presence of an optimal loading for each condition, analogous to Maximum Power Point Tracking (MPPT) used in solar energy systems. This concept is similar to impedance matching in electrical engineering, where optimal power transfer is achieved by matching the ‘impedance’—in this case, the aerodynamic load on the turbine blades—to the mechanical resistance provided by the generator and braking systems. Such matching ensures that the turbine operates efficiently under varying wind conditions and load settings. It is important to note that the authors acknowledge that the measurements are not at the optimal brake setting to ensure optimal power coefficient (CP) (it was beyond the scope of this study).

3.2.2. Straight Blade Measurements with Constant Velocity

Figure 10 showcases an automated plot summary from a constant velocity test on a straight blade, complemented by the application of a load, primarily serving for preliminary data validation and offering insights into test parameters. The first plot at the top records the wind tunnel velocity as measured by the Pitot–Prandtl Tube, maintaining a narrow range between 9.875 and 10.050 m/s throughout this test. The second graph displays revolutions per minute (rpm) in blue on the primary axis and mechanical power in red on the secondary axis. Initially, both rpm and power remain constant until approximately 15 s into the test, when the mechanical brake engages, increasing the torque on the rotor shaft, thereby elevating the power. Subsequently, as the rotational velocity begins to decline, it causes a corresponding decrease in power.
The third graph, plotting each power data point against the corresponding wind speeds measured by the Pitot–Prandtl tube, turns out to be less informative for this particular test due to the minor, stochastic variations in wind speed, rendering this data visualization not very useful. This is common with all constant velocity (RR) tests in this work.
The final graph in the sequence illustrates the power coefficient (Cp) against the calculated tip speed ratio (TSR) based on the Pitot–Prandtl measurements. The maximum TSR observed falls between 7 and 8, aligning with established norms for wind blade performance.
Figure 11 illustrates the power coefficient (Cp) versus tip speed ratio (TSR) for all constant velocity tests of the straight blade. Data points are color-coded by nominal velocity. Notably, experiments with higher nominal velocities tend to exhibit higher maximum power coefficients suggesting that the blade is operating better at those velocities.

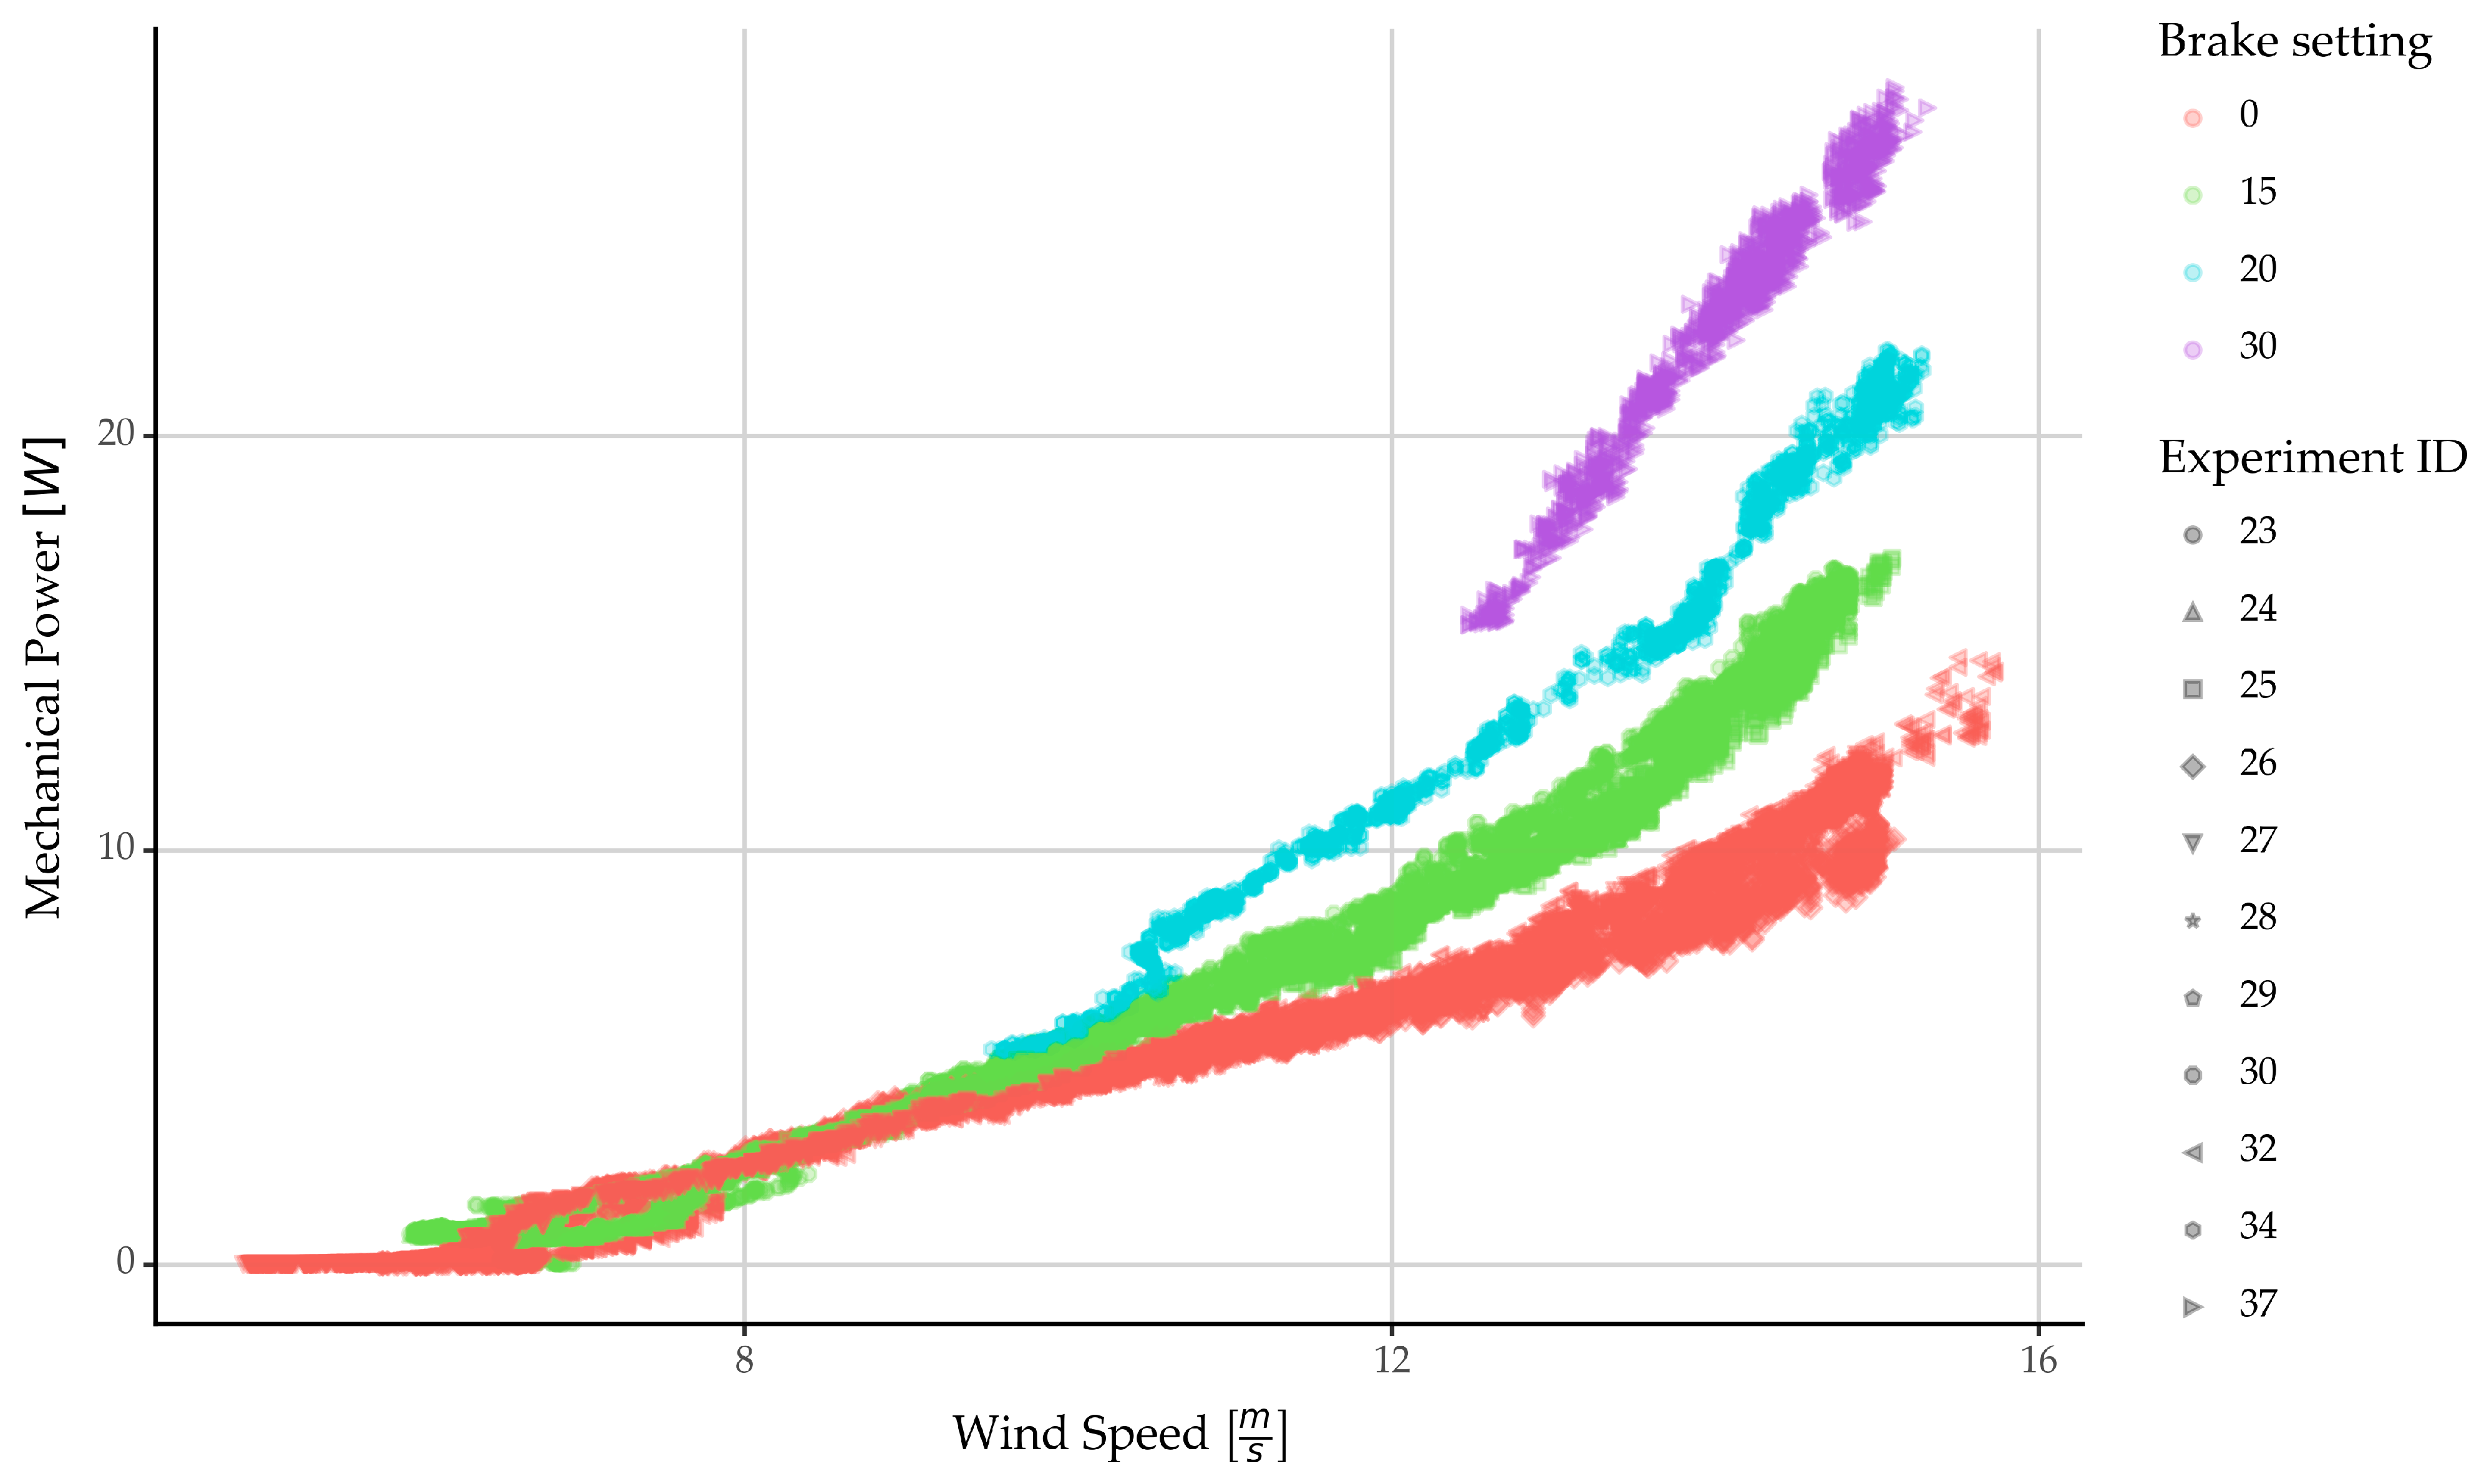
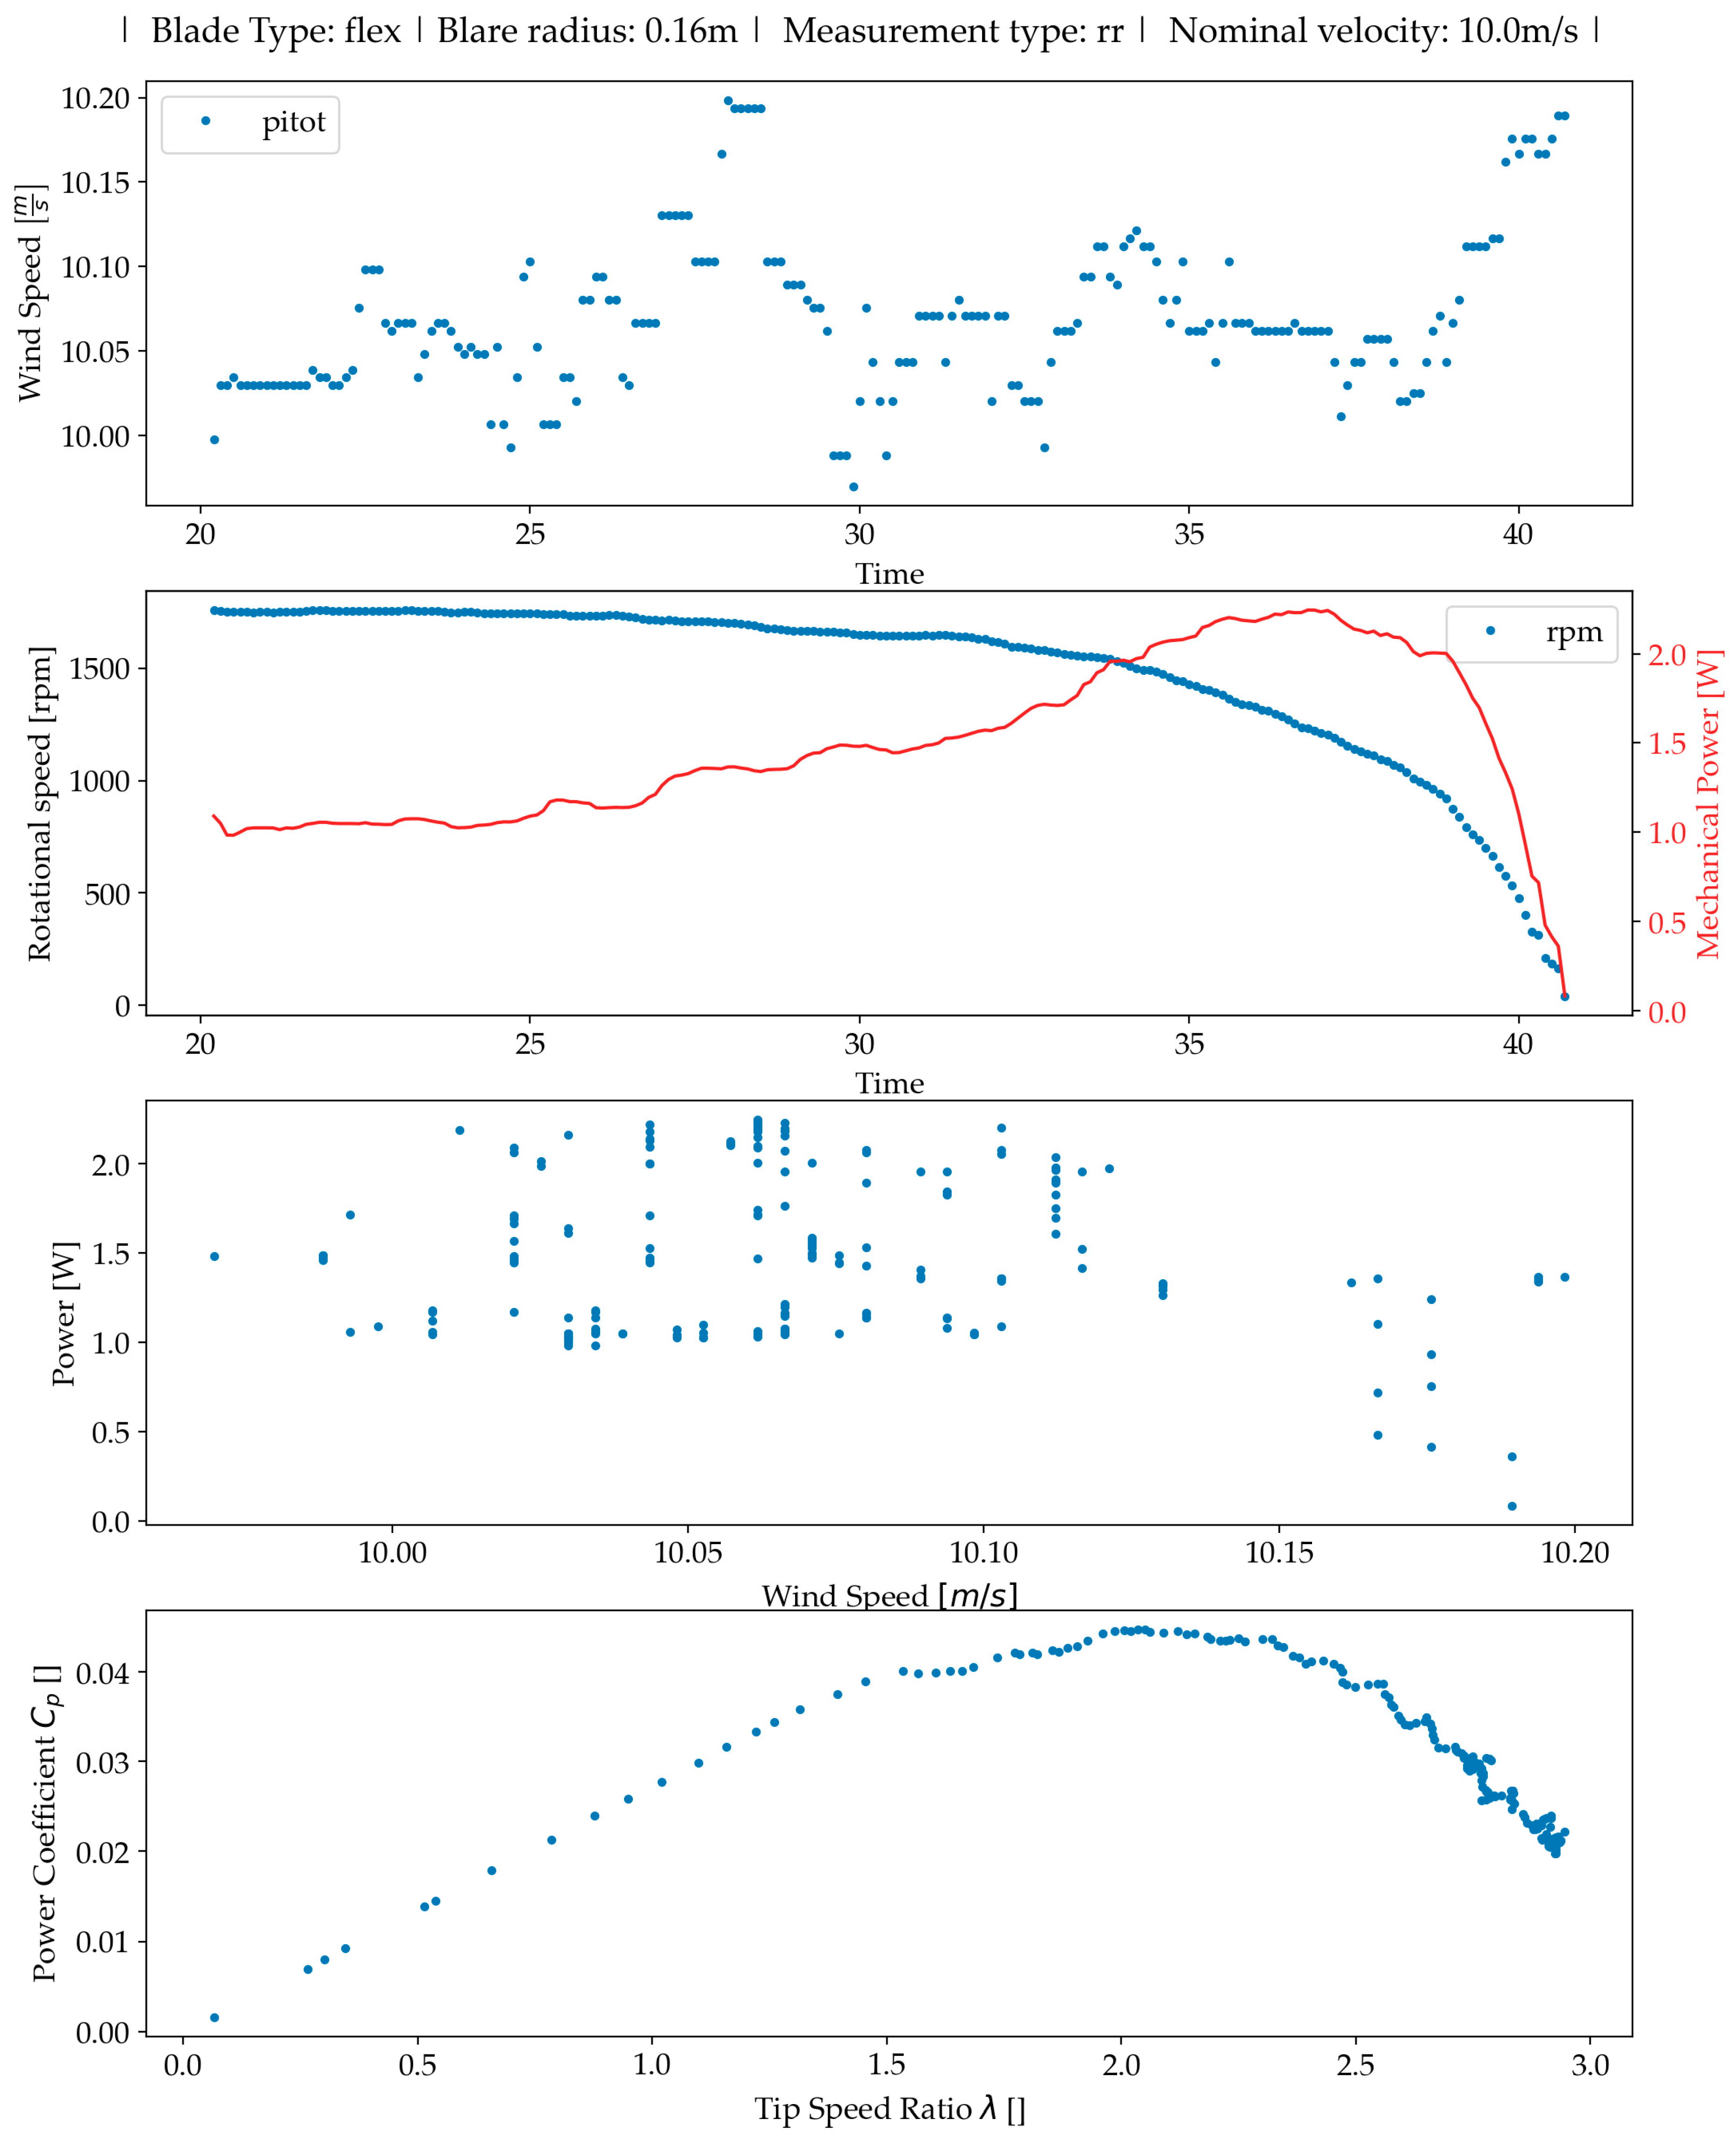
3.3. Flexible Curved Blade: Isotropic Material

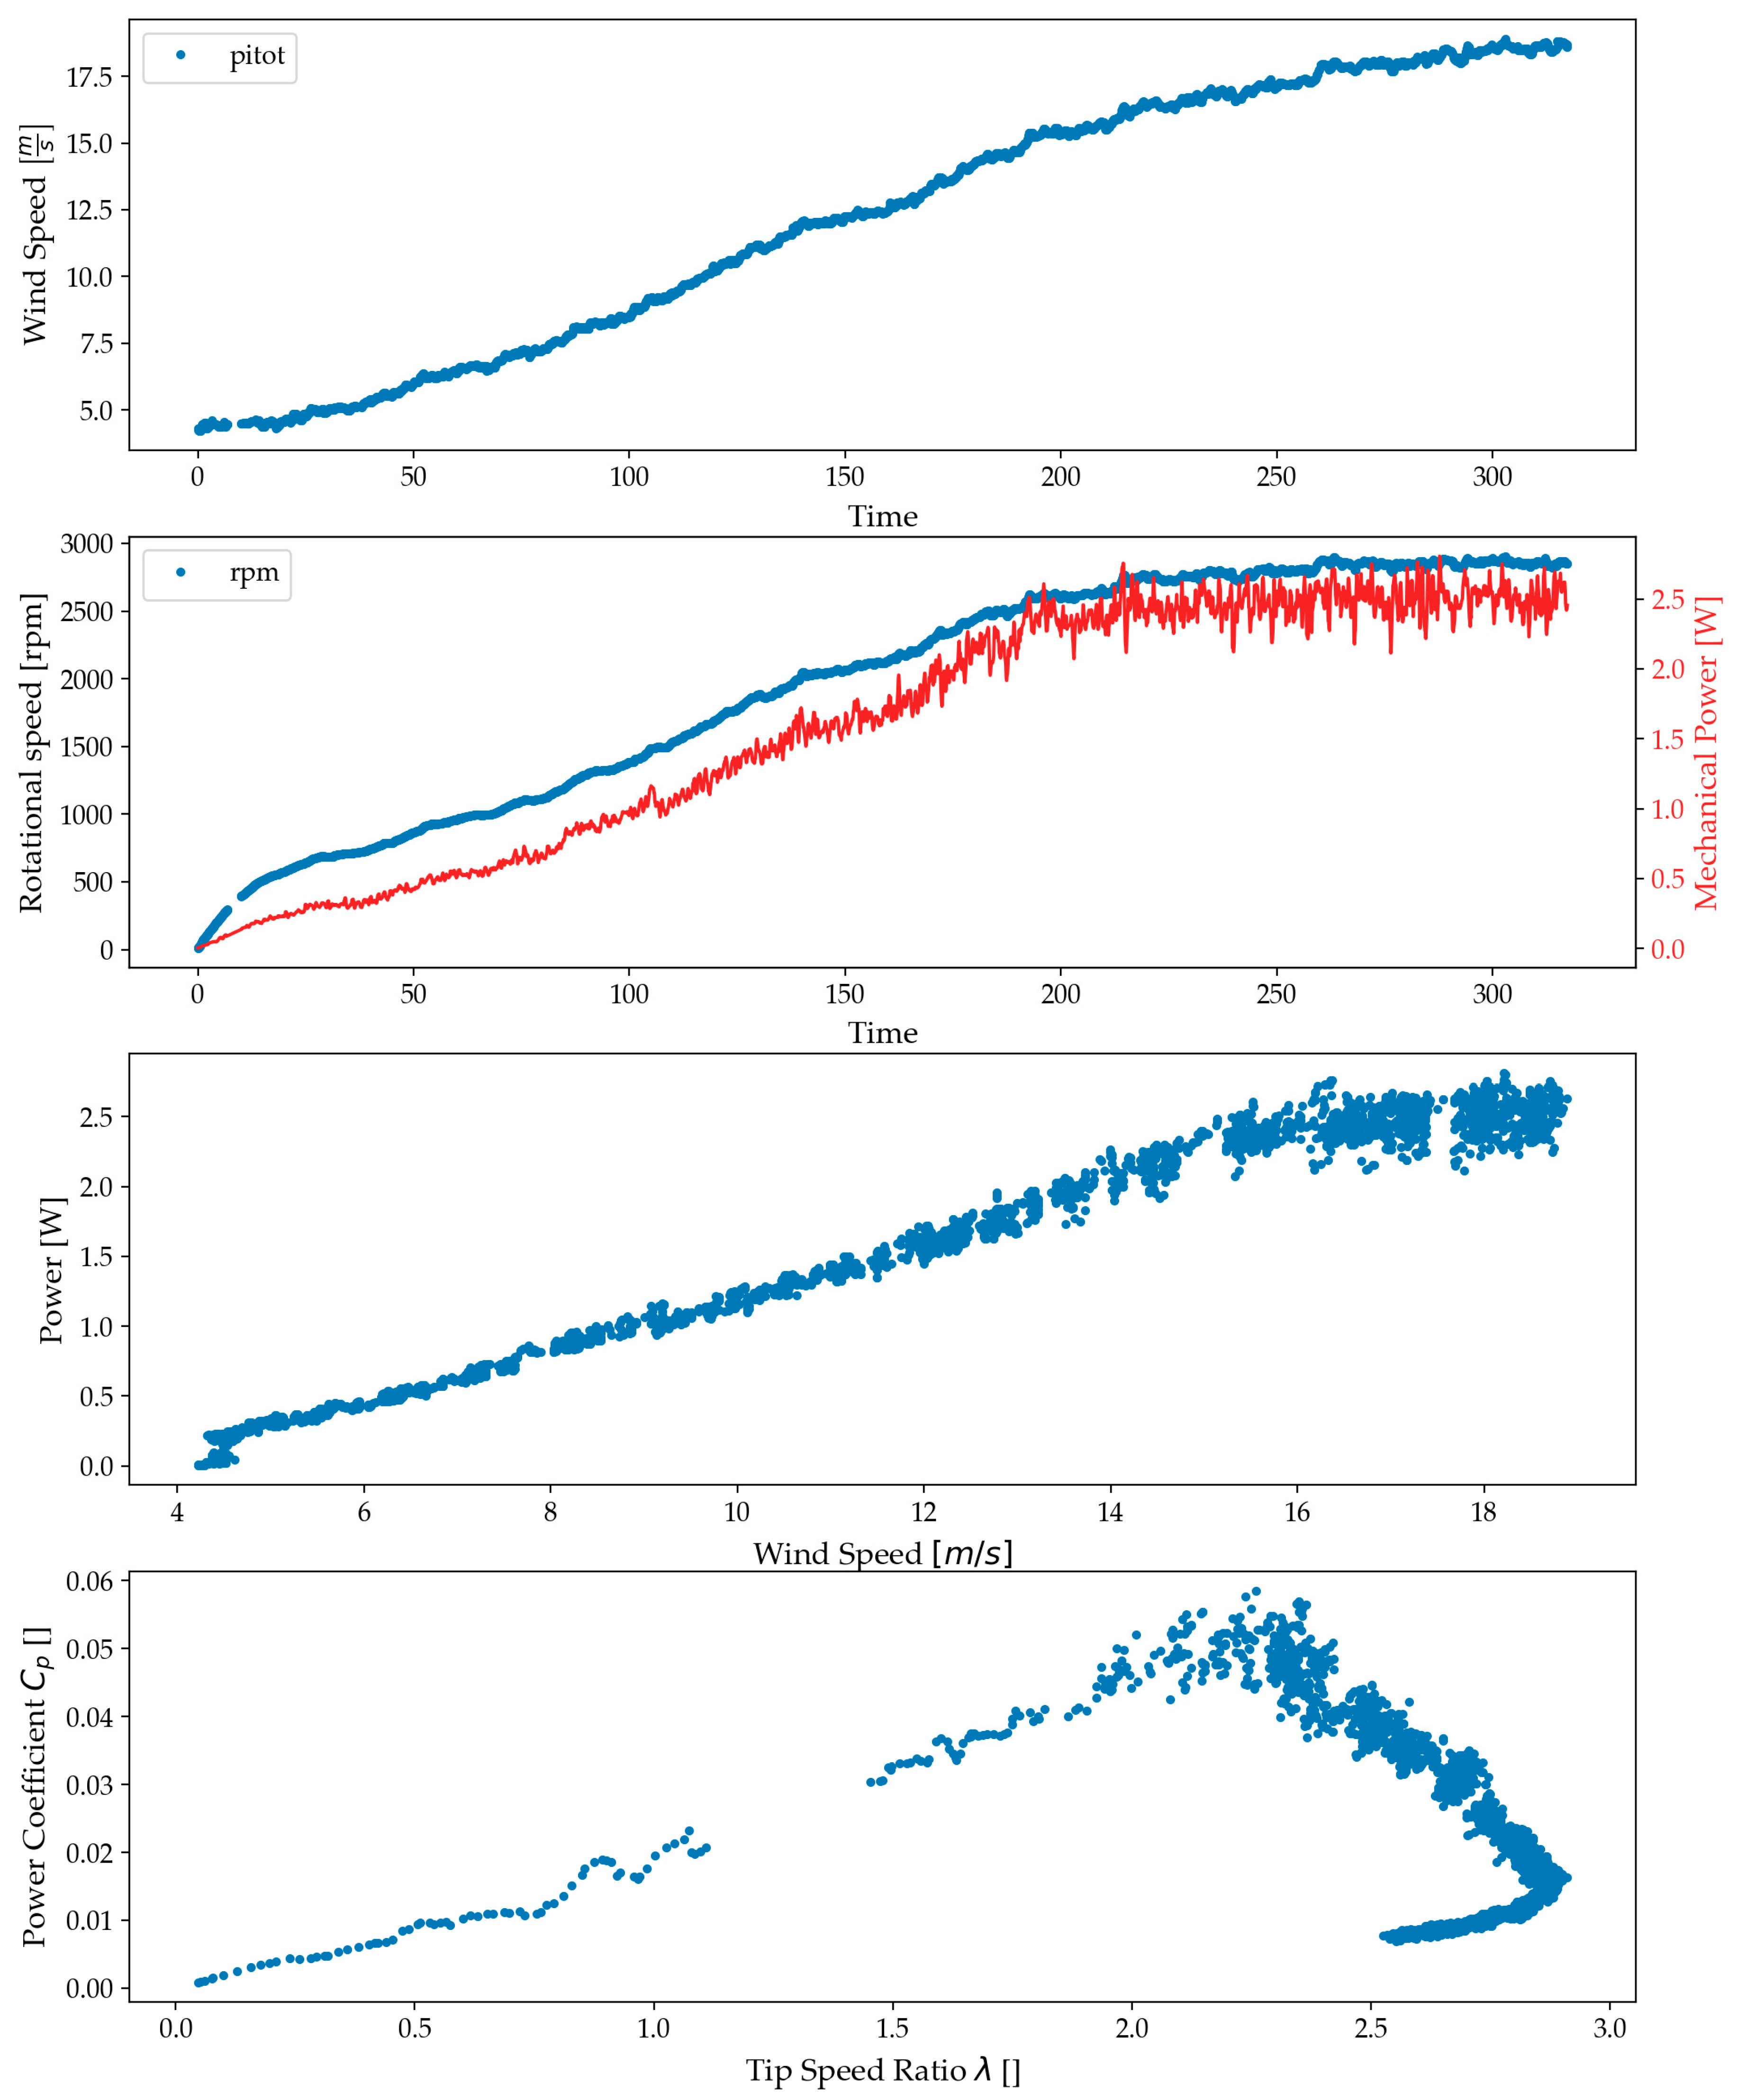
3.3.1. Flexible Curved Blade Measurements with Increasing Velocity

Figure 12 presents an automated plot summary from a flexible curved blade measurement with increasing velocity, serving as a tool for preliminary data validation. The first graph at the top displays wind tunnel velocity, measured by the Pitot–Prandtl Tube, which varied from 5 to 18 m/s during this test. The second graph tracks two variables over time: revolutions per minute (rpm), shown in blue on the primary axis, and mechanical power, depicted in red on the secondary axis. The rpm begins to increase at 5 m/s and continues rising until 15 m/s. Correspondingly, the mechanical power, calculated as the product of mechanical torque and angular velocity, also increases in tandem with the rpm. The constancy of the mechanical power suggests that the torque remains stable as both rpm and power plateau.
The third graph provides a detailed analysis by plotting each power data point against the corresponding wind speeds measured by the Pitot–Prandtl tube, offering insights into the blade’s mechanical performance. Notably, beyond 15 m/s, the mechanical power appears to plateau, indicating activation of the passive control features of the flexible curved blade concept.
The final graph illustrates the power coefficient (Cp) against the calculated tip speed ratio (TSR) based on Pitot–Prandtl measurements. This graph reveals several key aspects: the TSR remains below 3, significantly lower than the optimal TSR. The shape of the Cp curve initially increases with TSR, reaching a peak, and then decreases, reminiscent of the straight blade’s performance profile. However, it uniquely features a ‘hook-like’ tail beyond 15 m/s, marking the onset of control mechanisms that moderate the blade’s response to higher wind speeds.
Figure 13 presents mechanical power measurement against the wind speed velocity from all increasing velocity tests of the flexible curved blade, with data points color-coded by brake setting and distinct shapes representing different experiment IDs. In a similar manner to the straight blade, in experiments with higher brake settings, the rotation of the blade commenced at elevated wind speeds; for instance, a brake setting of 30 corresponds to starting velocities above 16 m/s. This pattern suggests that the blade requires some time to initiate rotation under higher load conditions. Finally, although for no braking, the blade shows that there is a power plateau at high speeds, the settings with higher brake settings do not exhibit this behavior.
Figure 14 presents the rotational velocity (measured in rpm) of the flexible curved blade vs. the wind speed. This plot is presented to discuss a finding in Figure 13, which showed that for higher brake settings, the power increased monotonically. This plot shows that the rpm of the flexible curved blade at different settings seems to converge to 3000 rpm. This shows that the wind blade does not increase the rpm uncontrollably but is able to obtain higher Torque values. In the discussion stage, this will be contrasted more widely.
Figure 15 illustrates the power coefficient (Cp) versus tip speed ratio (TSR) for all increasing velocity tests of the flexible curved blade. Data points are color-coded by brake setting and marked with distinct shapes to represent different experiment UIDs. Notably, experiments with higher brake settings generally exhibit lower maximum power coefficients, although these maximum values appear to converge quickly. This behavior starkly contrasts with that observed in straight blade measurements. Additionally, a hook-like feature is consistently present across all flexible curved data measurements. The lower Cp values are attributed to the control features of the wind turbine blade. Despite higher wind speeds providing potentially more energy, the blade’s design and control mechanisms result in it harnessing less energy than possible, leading to lower observed Cp values.

3.3.2. Flexible Curved Blade Measurements with Constant Velocity

Figure 16 presents an automated plot summary from a measurement used for preliminary data validation, featuring four plots. The first plot displays the wind tunnel velocity from the Pitot–Prandtl Tube, consistently around 10 m/s, a benchmark value for this test. The second graph shows the rpm on the primary axis and the mechanical power on the secondary axis. As the brake increasingly engages, rpm begins to drop, while mechanical power rises until reaching a critical point where both power and rpm start to decline. The third graph, plotting each data point against different wind speeds, is similar to the straight blade’s tests and provides limited informative value due to the small range of wind speeds. The final graph depicts the power coefficient (Cp) against the calculated tip speed ratio (TSR), showing a TSR range from 0 to 3. This range is significantly different from that of the rigid blade and will be discussed further in subsequent sections.
Figure 17 illustrates the power coefficient (Cp) versus tip speed ratio (TSR) for all constant velocity tests of the flexible curved blade, with data points color-coded by nominal velocity. Contrary to the behavior observed in straight blades, experiments with higher nominal velocities, in this case, tend to show lower maximum power coefficients. This suggests that the flexible curved blade extracts less energy from the wind at these higher speeds. However, this reduced energy extraction can be attributed to the passive control features inherent in the flexible curved blade’s design, which adjusts the blade’s response dynamically to maintain structural integrity and operational efficiency under varying wind conditions.
It is important to note that a rigid blade in a wind turbine would also show a similar reduction in performance. This can be easily observed in the power curve of any commercial wind turbine: power output increases up to the nominal power at the nominal wind speed, beyond which the power remains flat and constant and then drops off at the cutoff speed. Therefore, although the flexible curved blade may extract less energy when tested in isolation, as part of a functional wind energy conversion system (WECS), it would result in comparable overall production levels to the rigid blade.”

4. Discussion

4.1. Self-Regulation of Wind Turbine Blade

In this part of the article, the performance of the flexible curved wind turbine blade is discussed, and more specifically the passive control traits. A conventional straight blade made from a similar material with the same diameter and cross-sectional profiles, is used as a reference for the comparison.

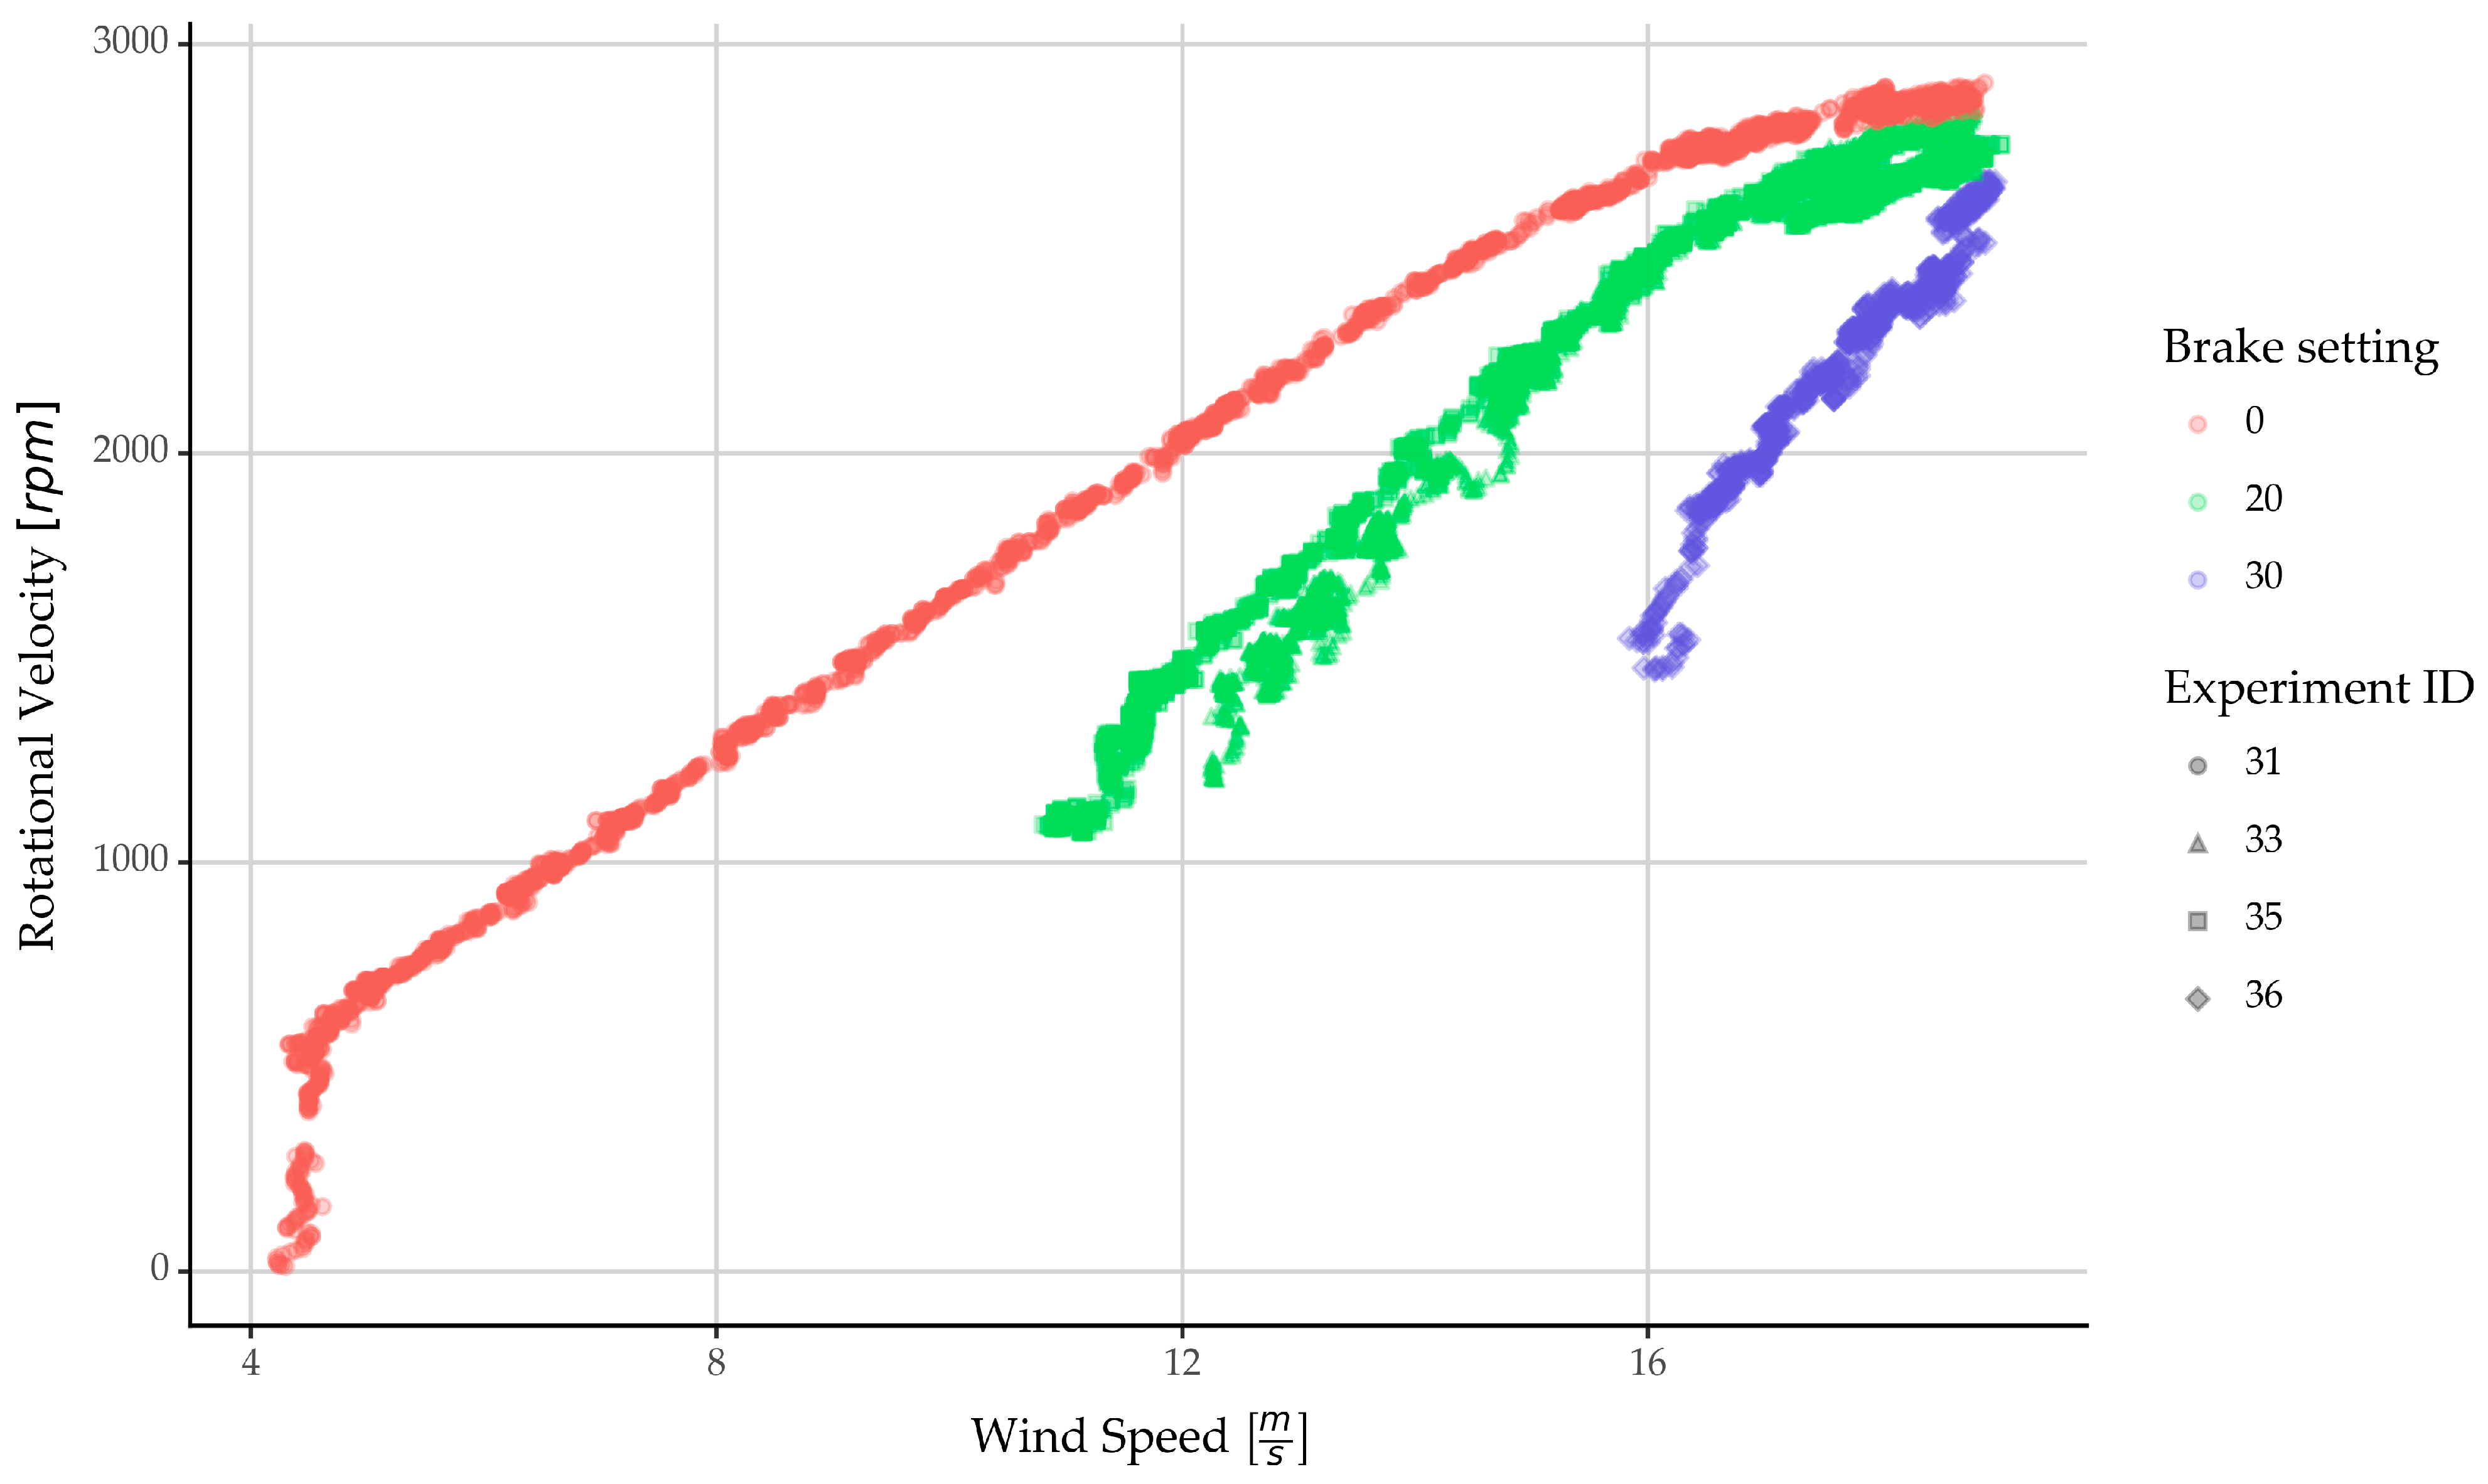
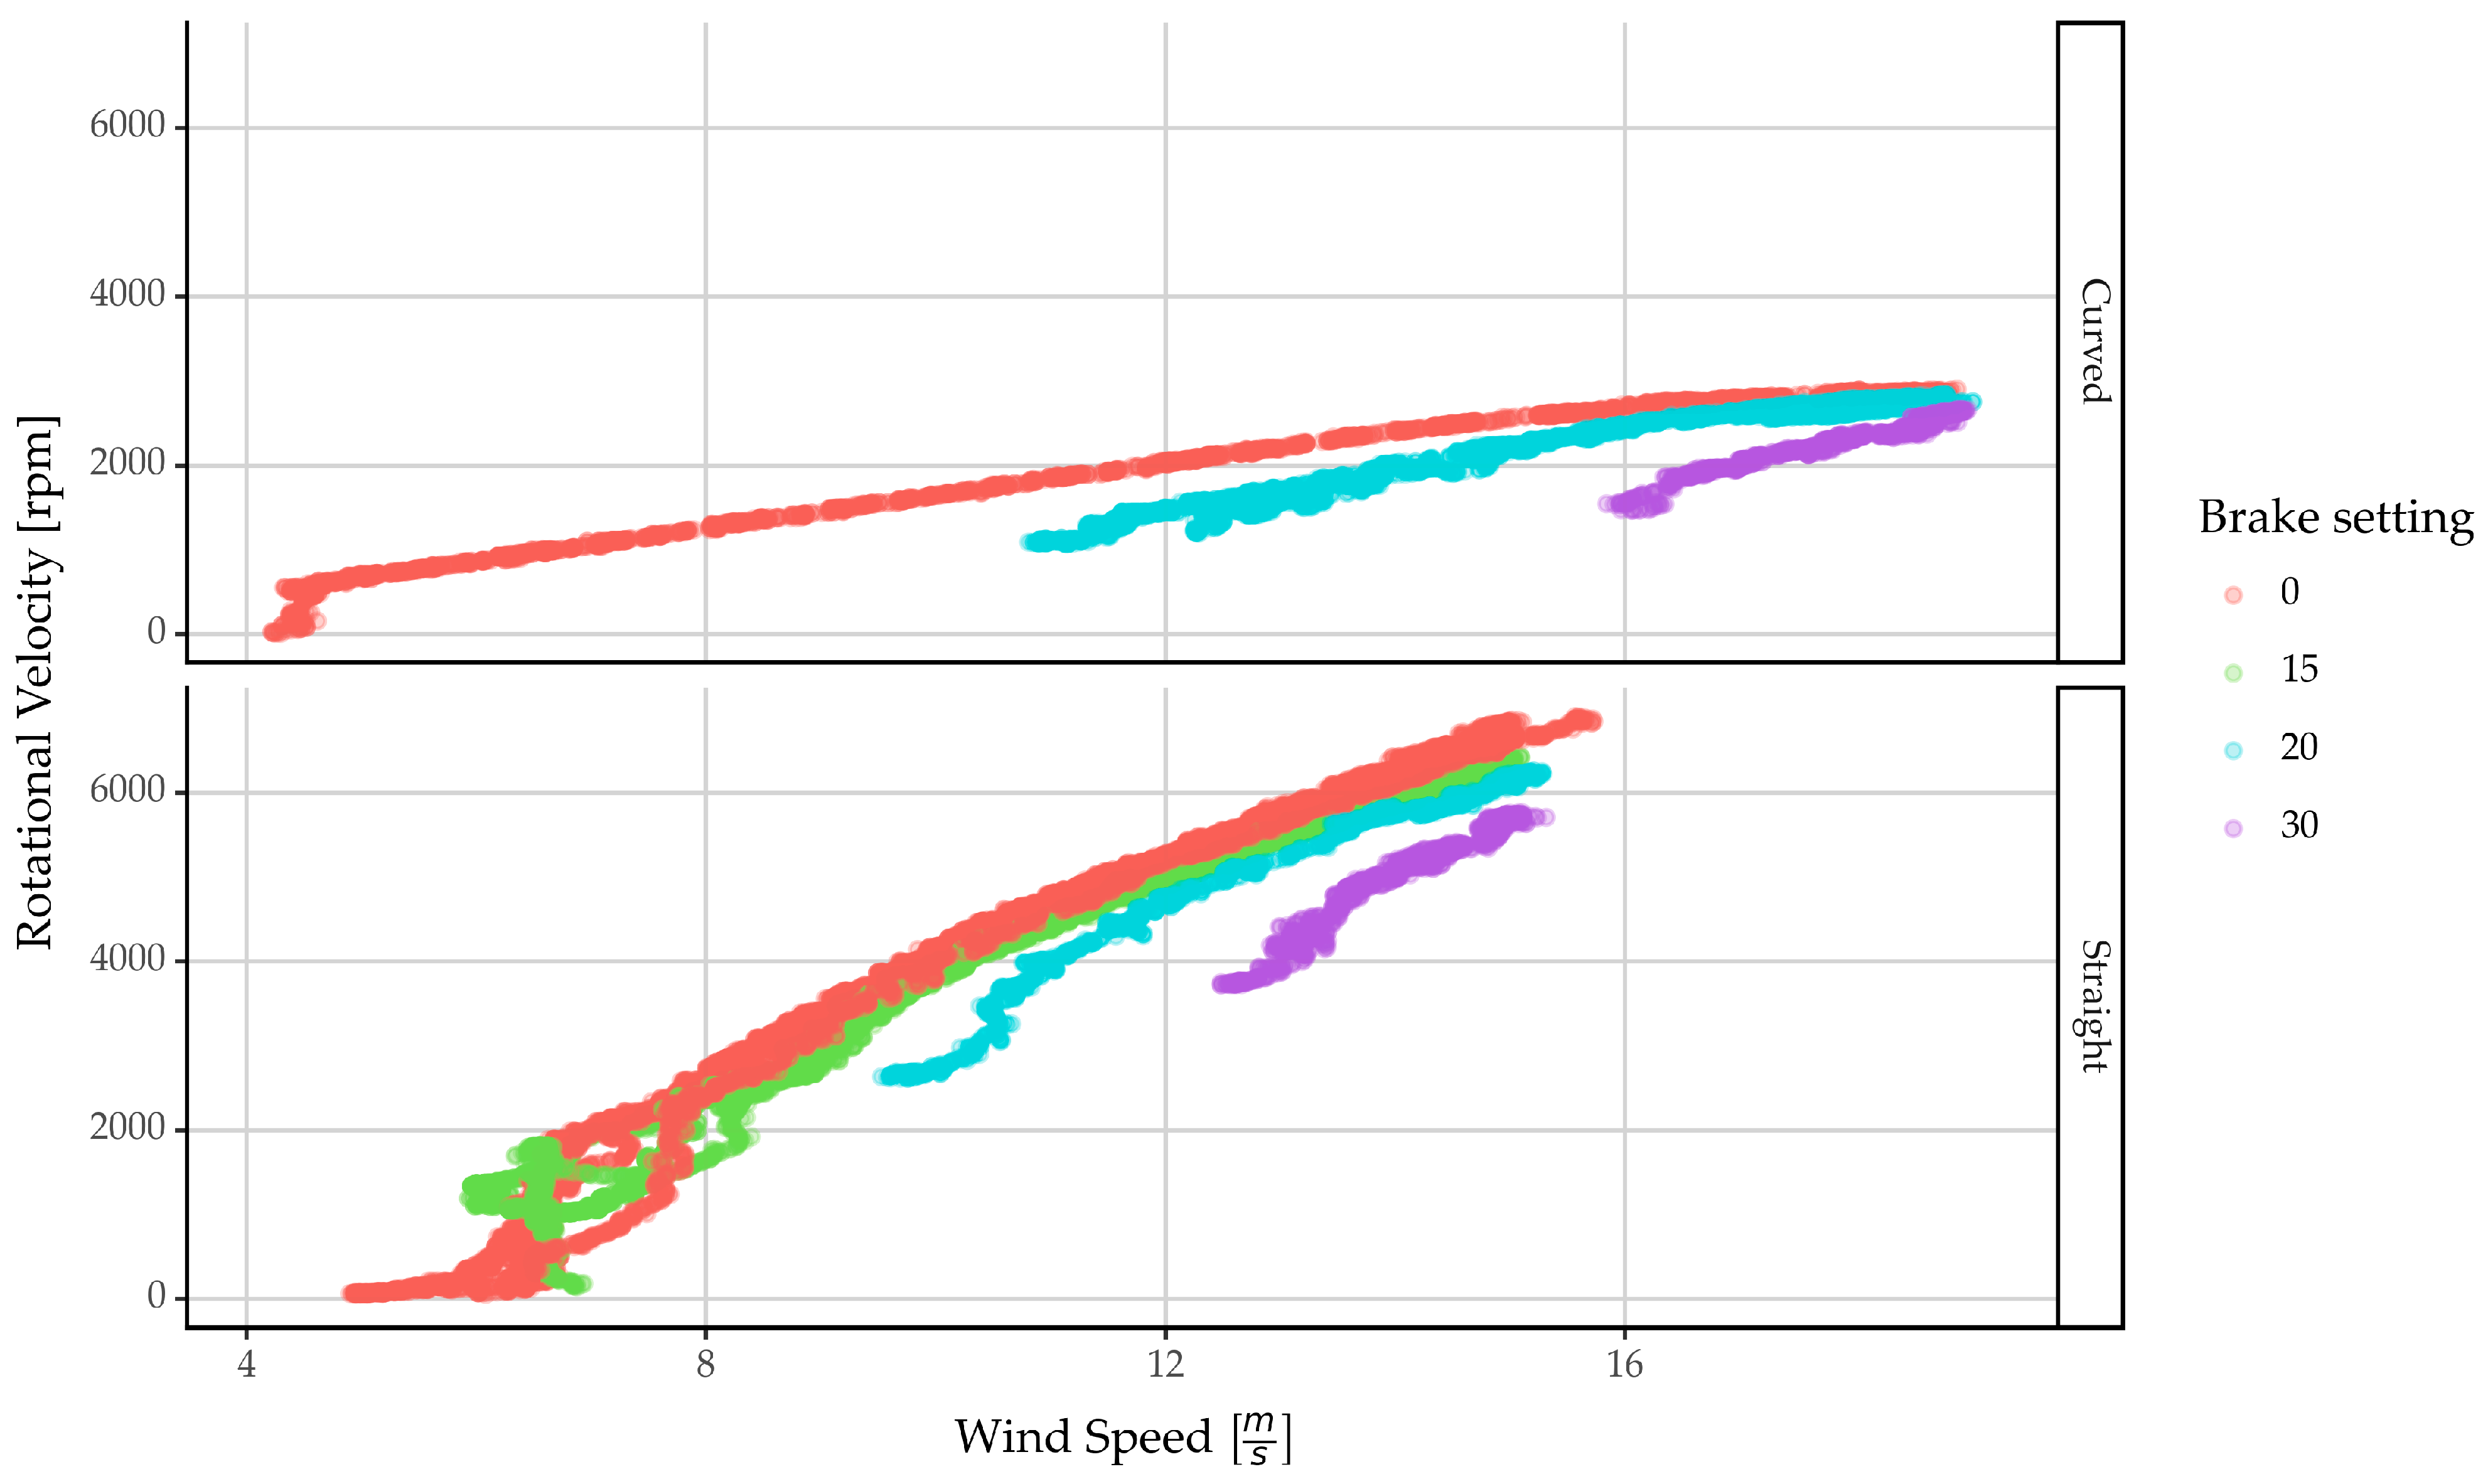
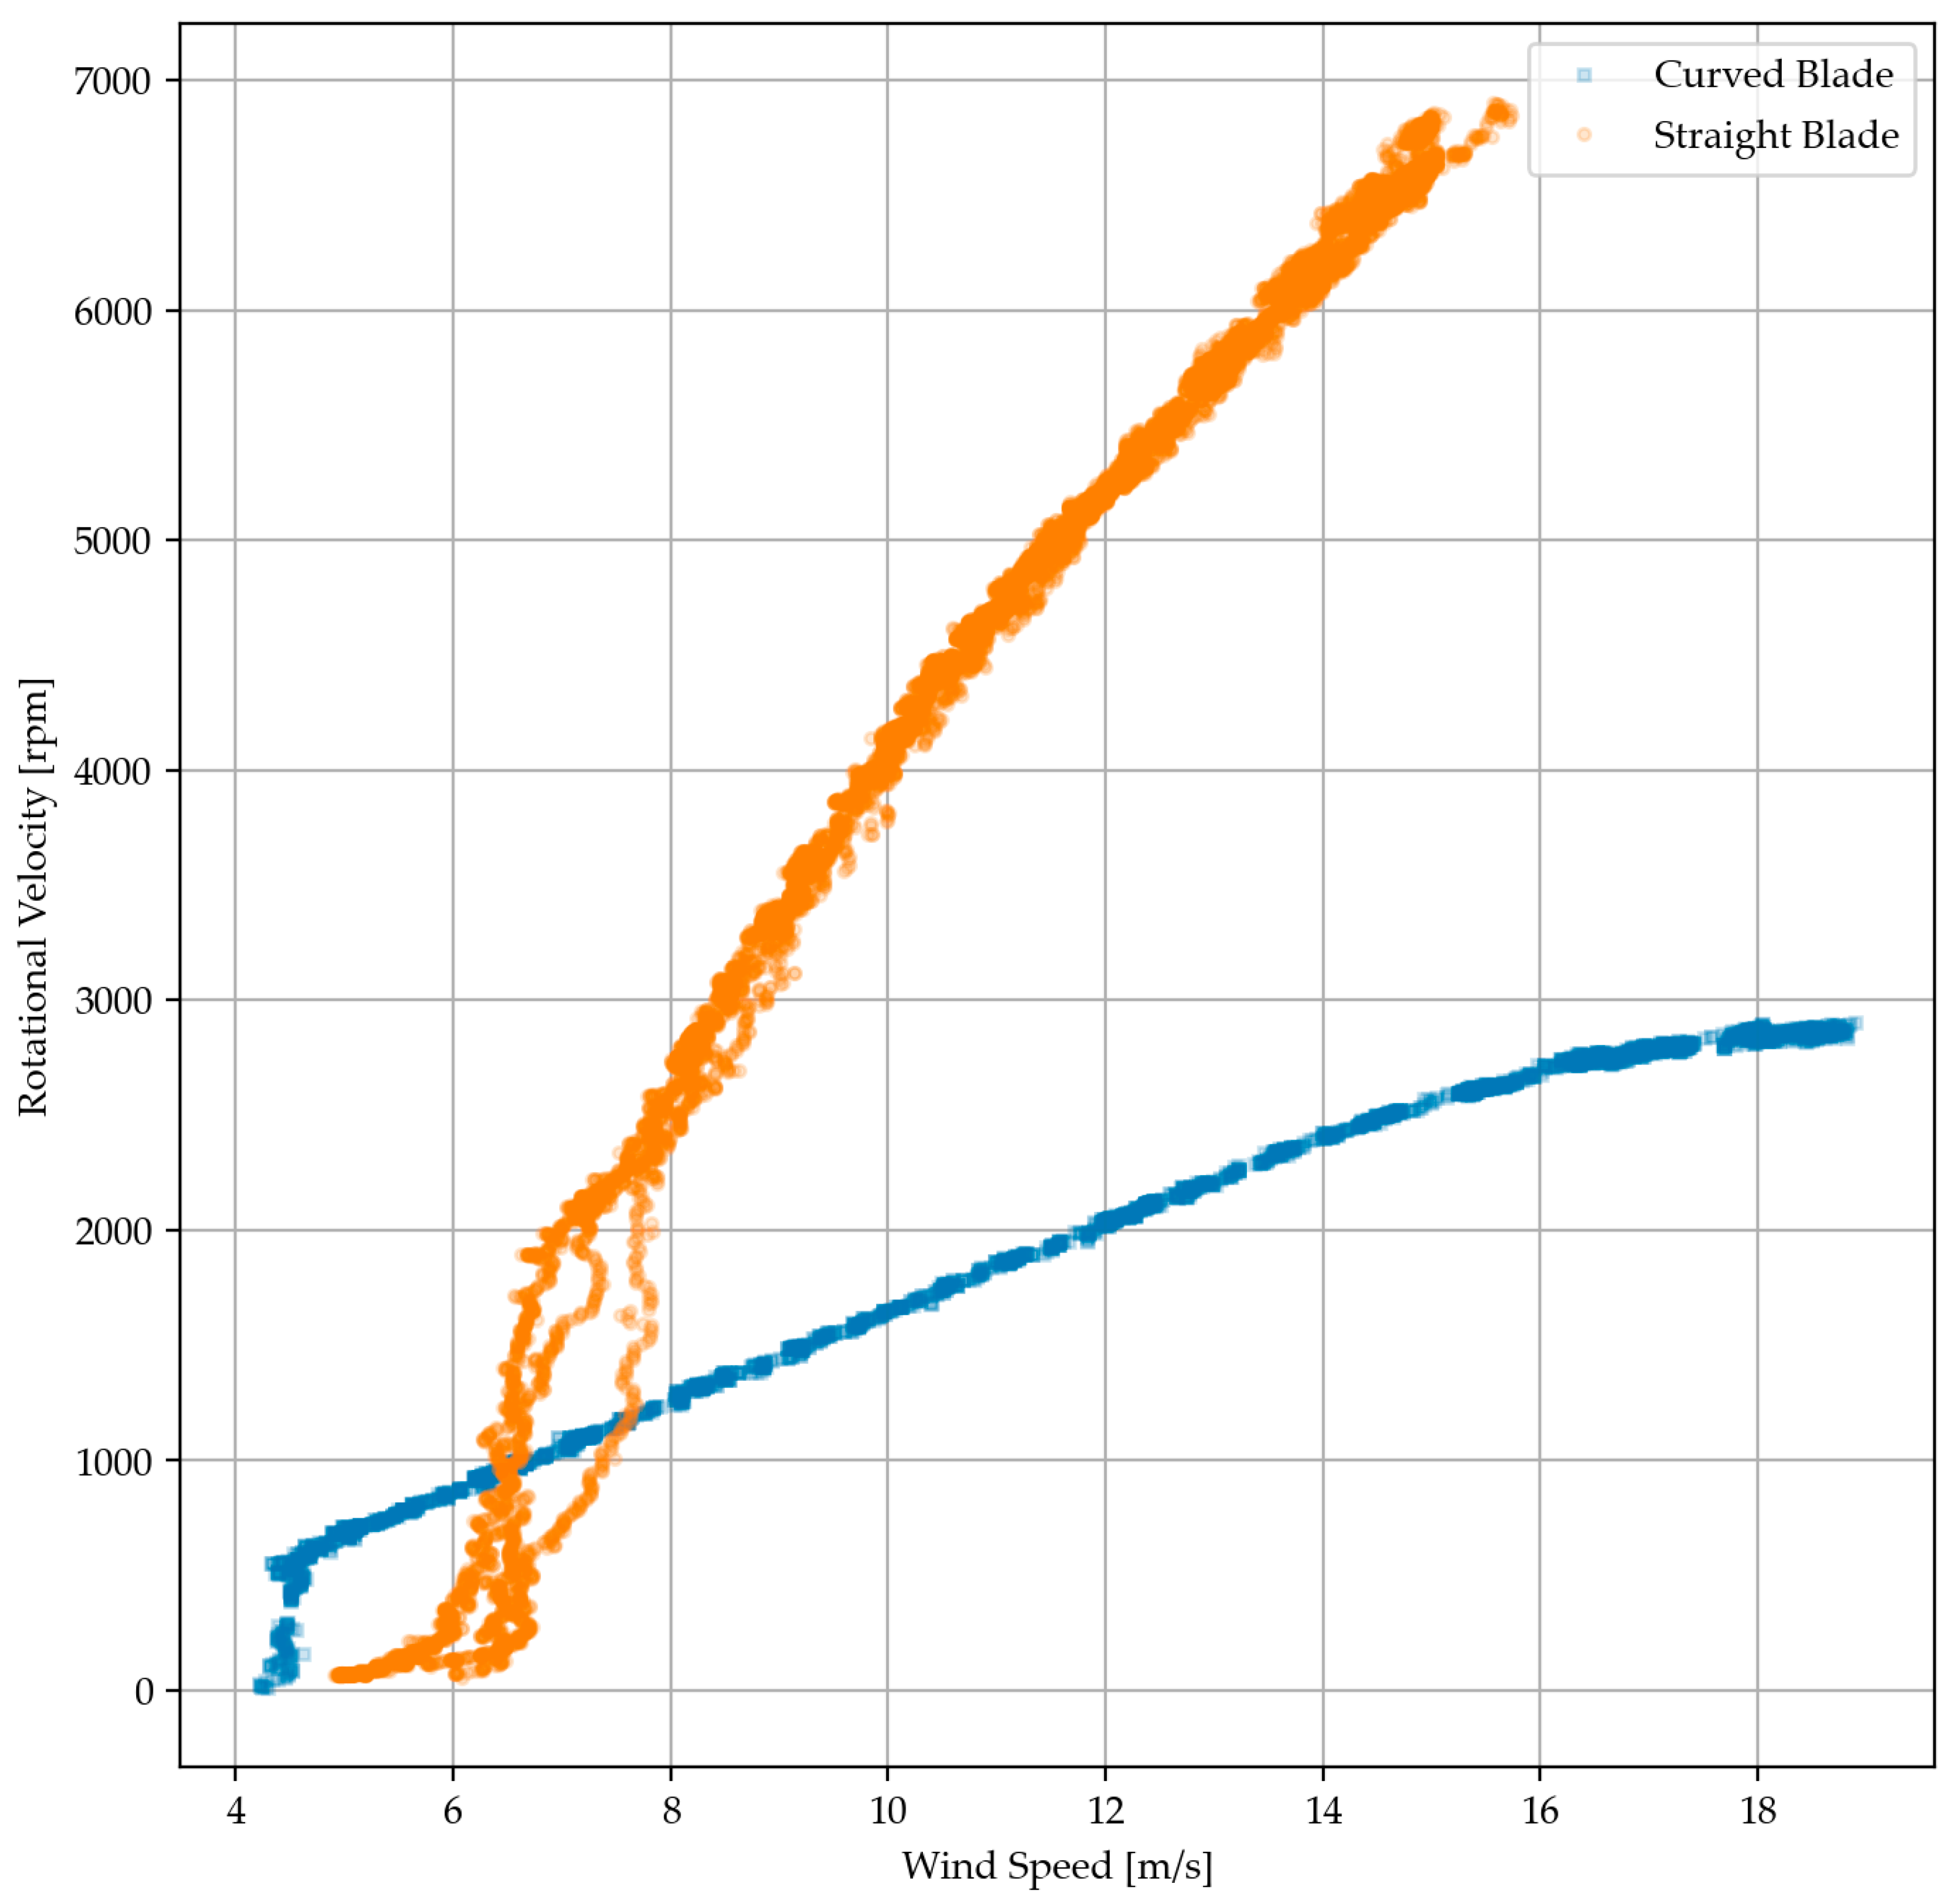
4.1.1. Rotational Velocity

Figure 18 provides a comparative illustration of the rotational velocity against wind speed for straight and curved blades in different subgraphs, with the data points color-coded by brake settings. To facilitate direct comparison, the axes of the subgraphs are uniformly scaled. A notable observation is that the flexible curved blade exhibits a consistent maximum rotational velocity of 3000 rpm across all brake settings when wind speeds exceed 18 m/s, significantly lower than the straight blade, which accelerates more rapidly, reaching and often surpassing 5000 rpm at just 15 m/s.
The relationship between wind speed and rotational velocity reveals notable differences between blade types. For the straight blade, this relationship is almost linear, indicating a steady increase in rpm with wind speed. In contrast, the flexible curved blade demonstrates a marked non-linearity, displaying an asymptotic behavior where the rpm approaches 3000 rpm irrespective of the brake setting. This suggests that the flexible curved blade design effectively achieves self-regulation, maintaining a controlled rotational velocity despite increasing wind speeds.
Figure 19 zooms in on this phenomenon by presenting a direct comparison of the ‘no brake’ settings, with an adjusted aspect ratio favoring the y-axis to highlight the behavior of the flexible curved blade more clearly. This figure substantiates the previous observations by illustrating that up to 15 m/s, the rpm increases linearly. Beyond this point, the passive control mechanisms activate, asymptotically stabilizing the rpm at 3000, effectively modulating the rotational acceleration as wind speed continues to increase.
An additional yet significant observation from Figure 19 is that the passive control of the flexible curved blade activates at higher wind speeds than initially designed. This delayed activation suggests that while the blade does achieve self-regulation, the onset of passive control mechanisms does not align perfectly with the intended design parameters, indicating that the design objectives were not fully met.

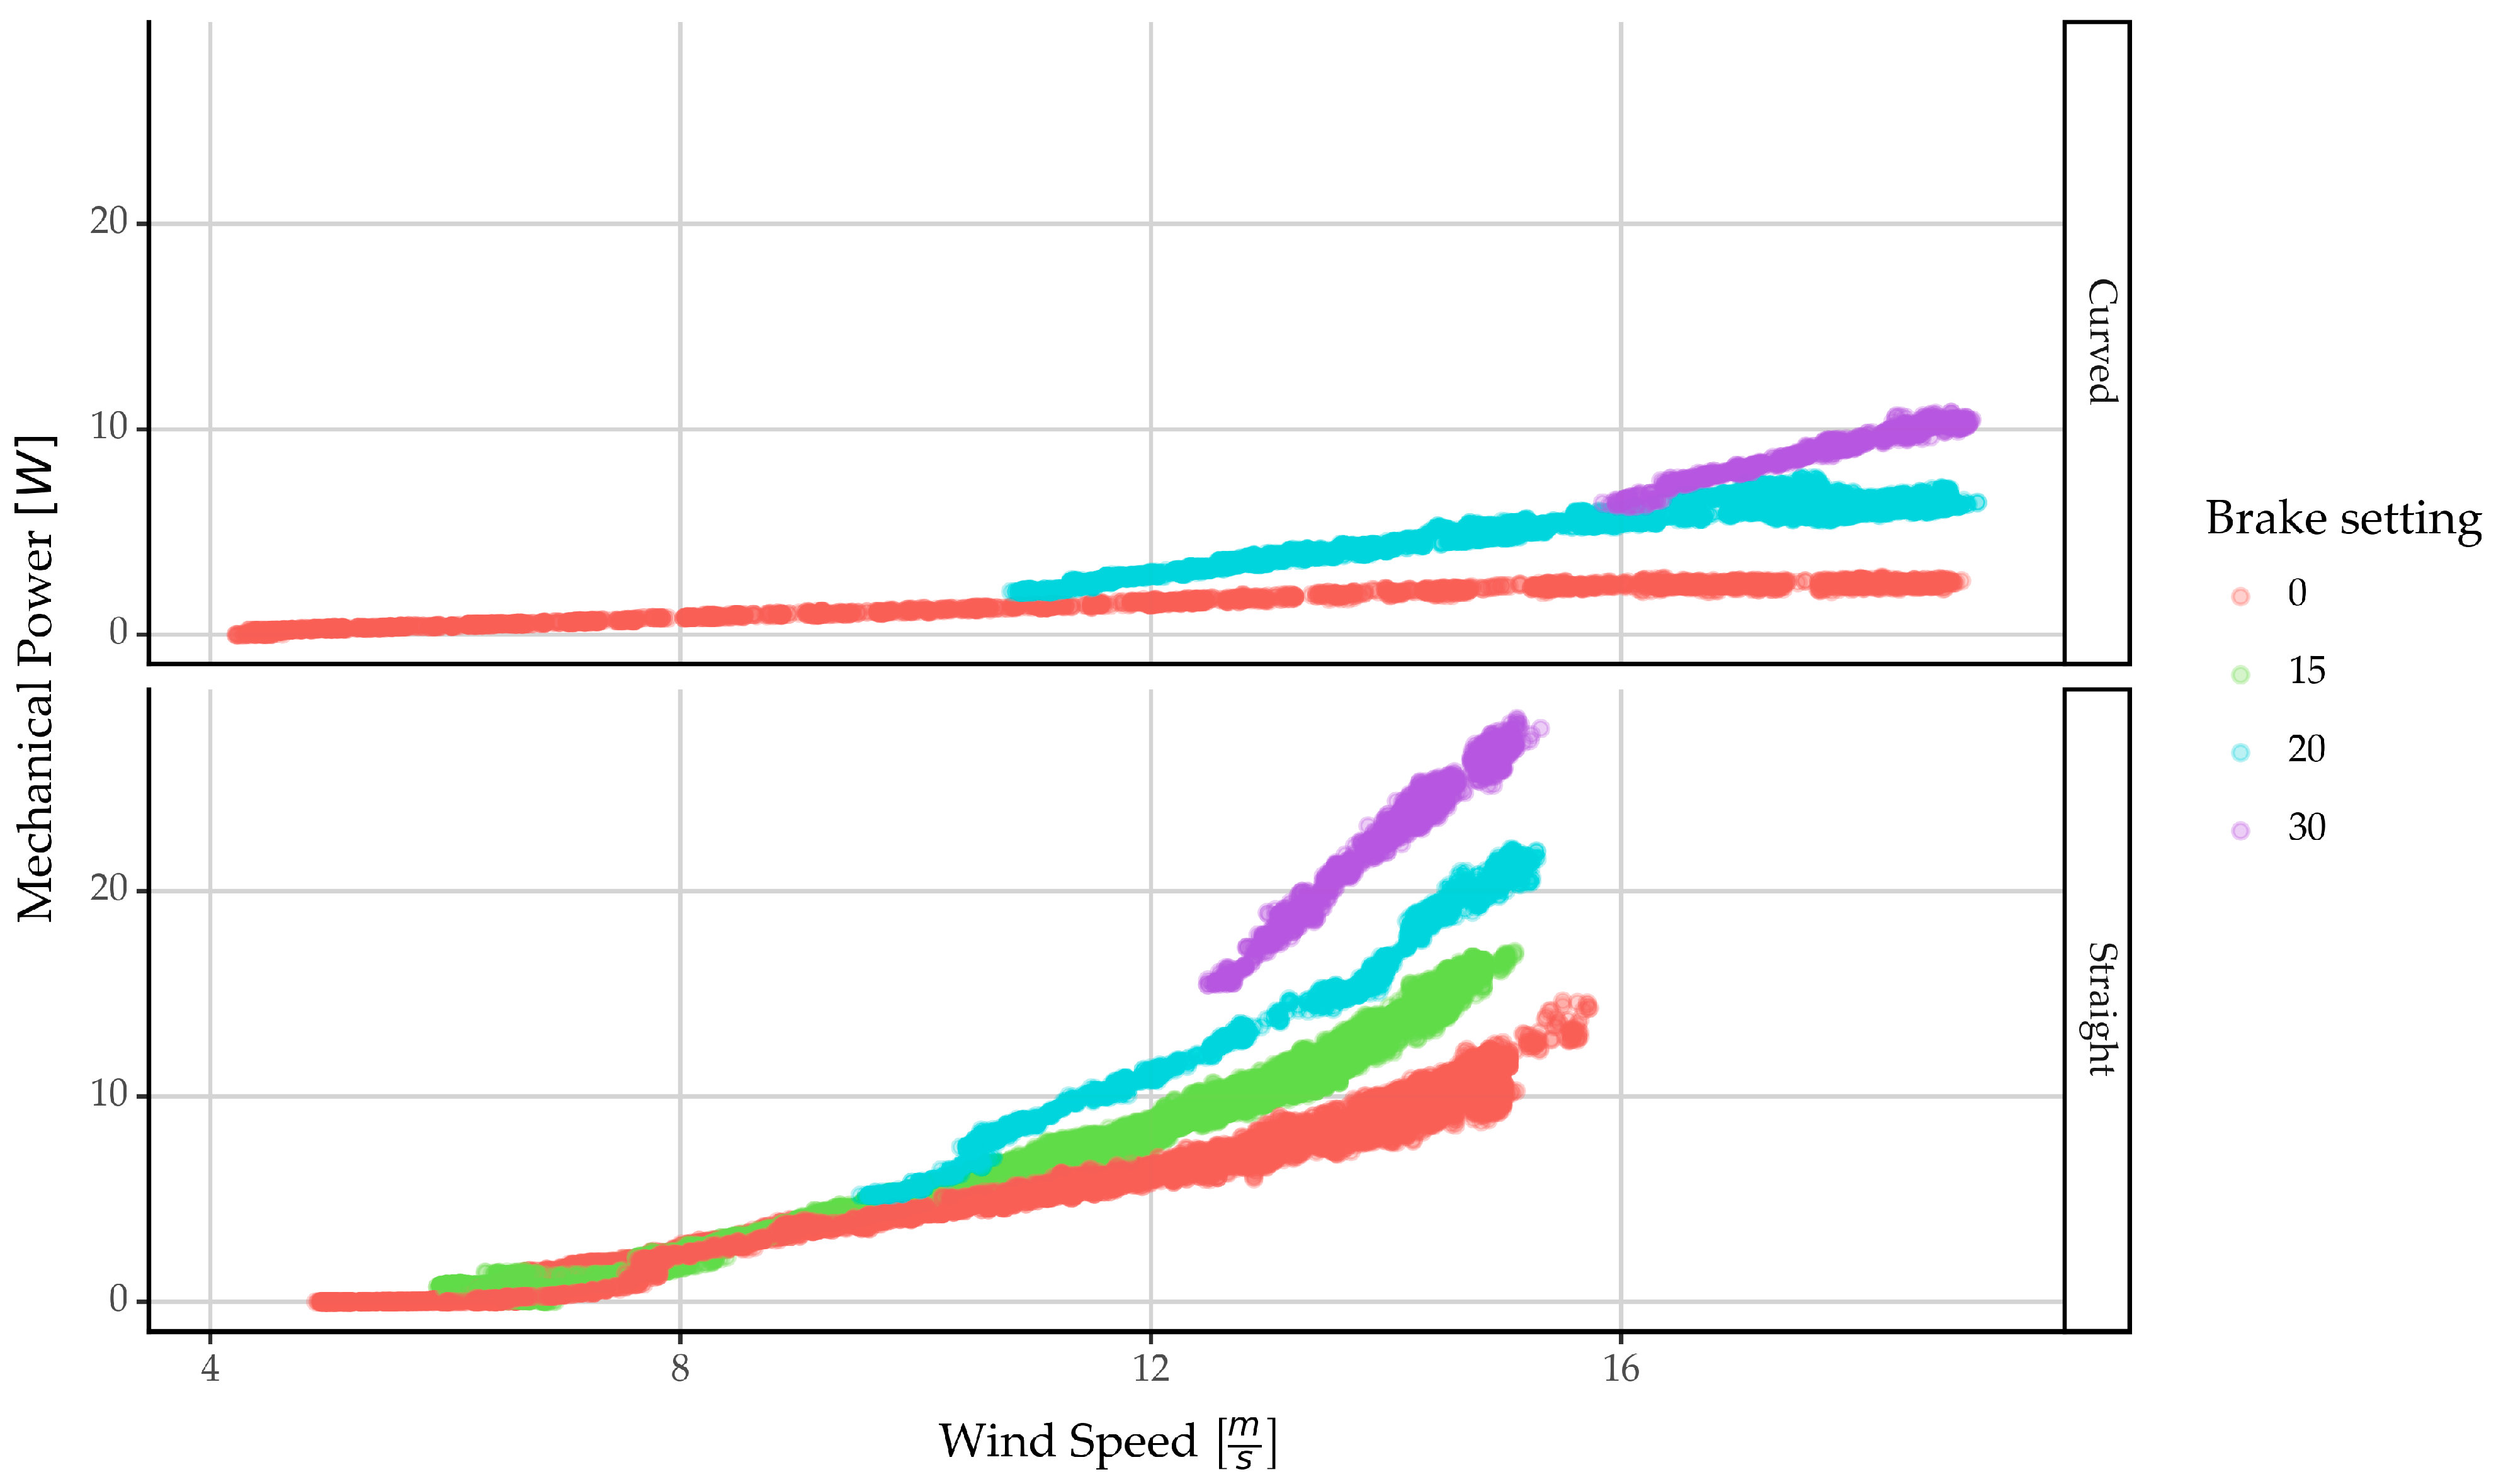
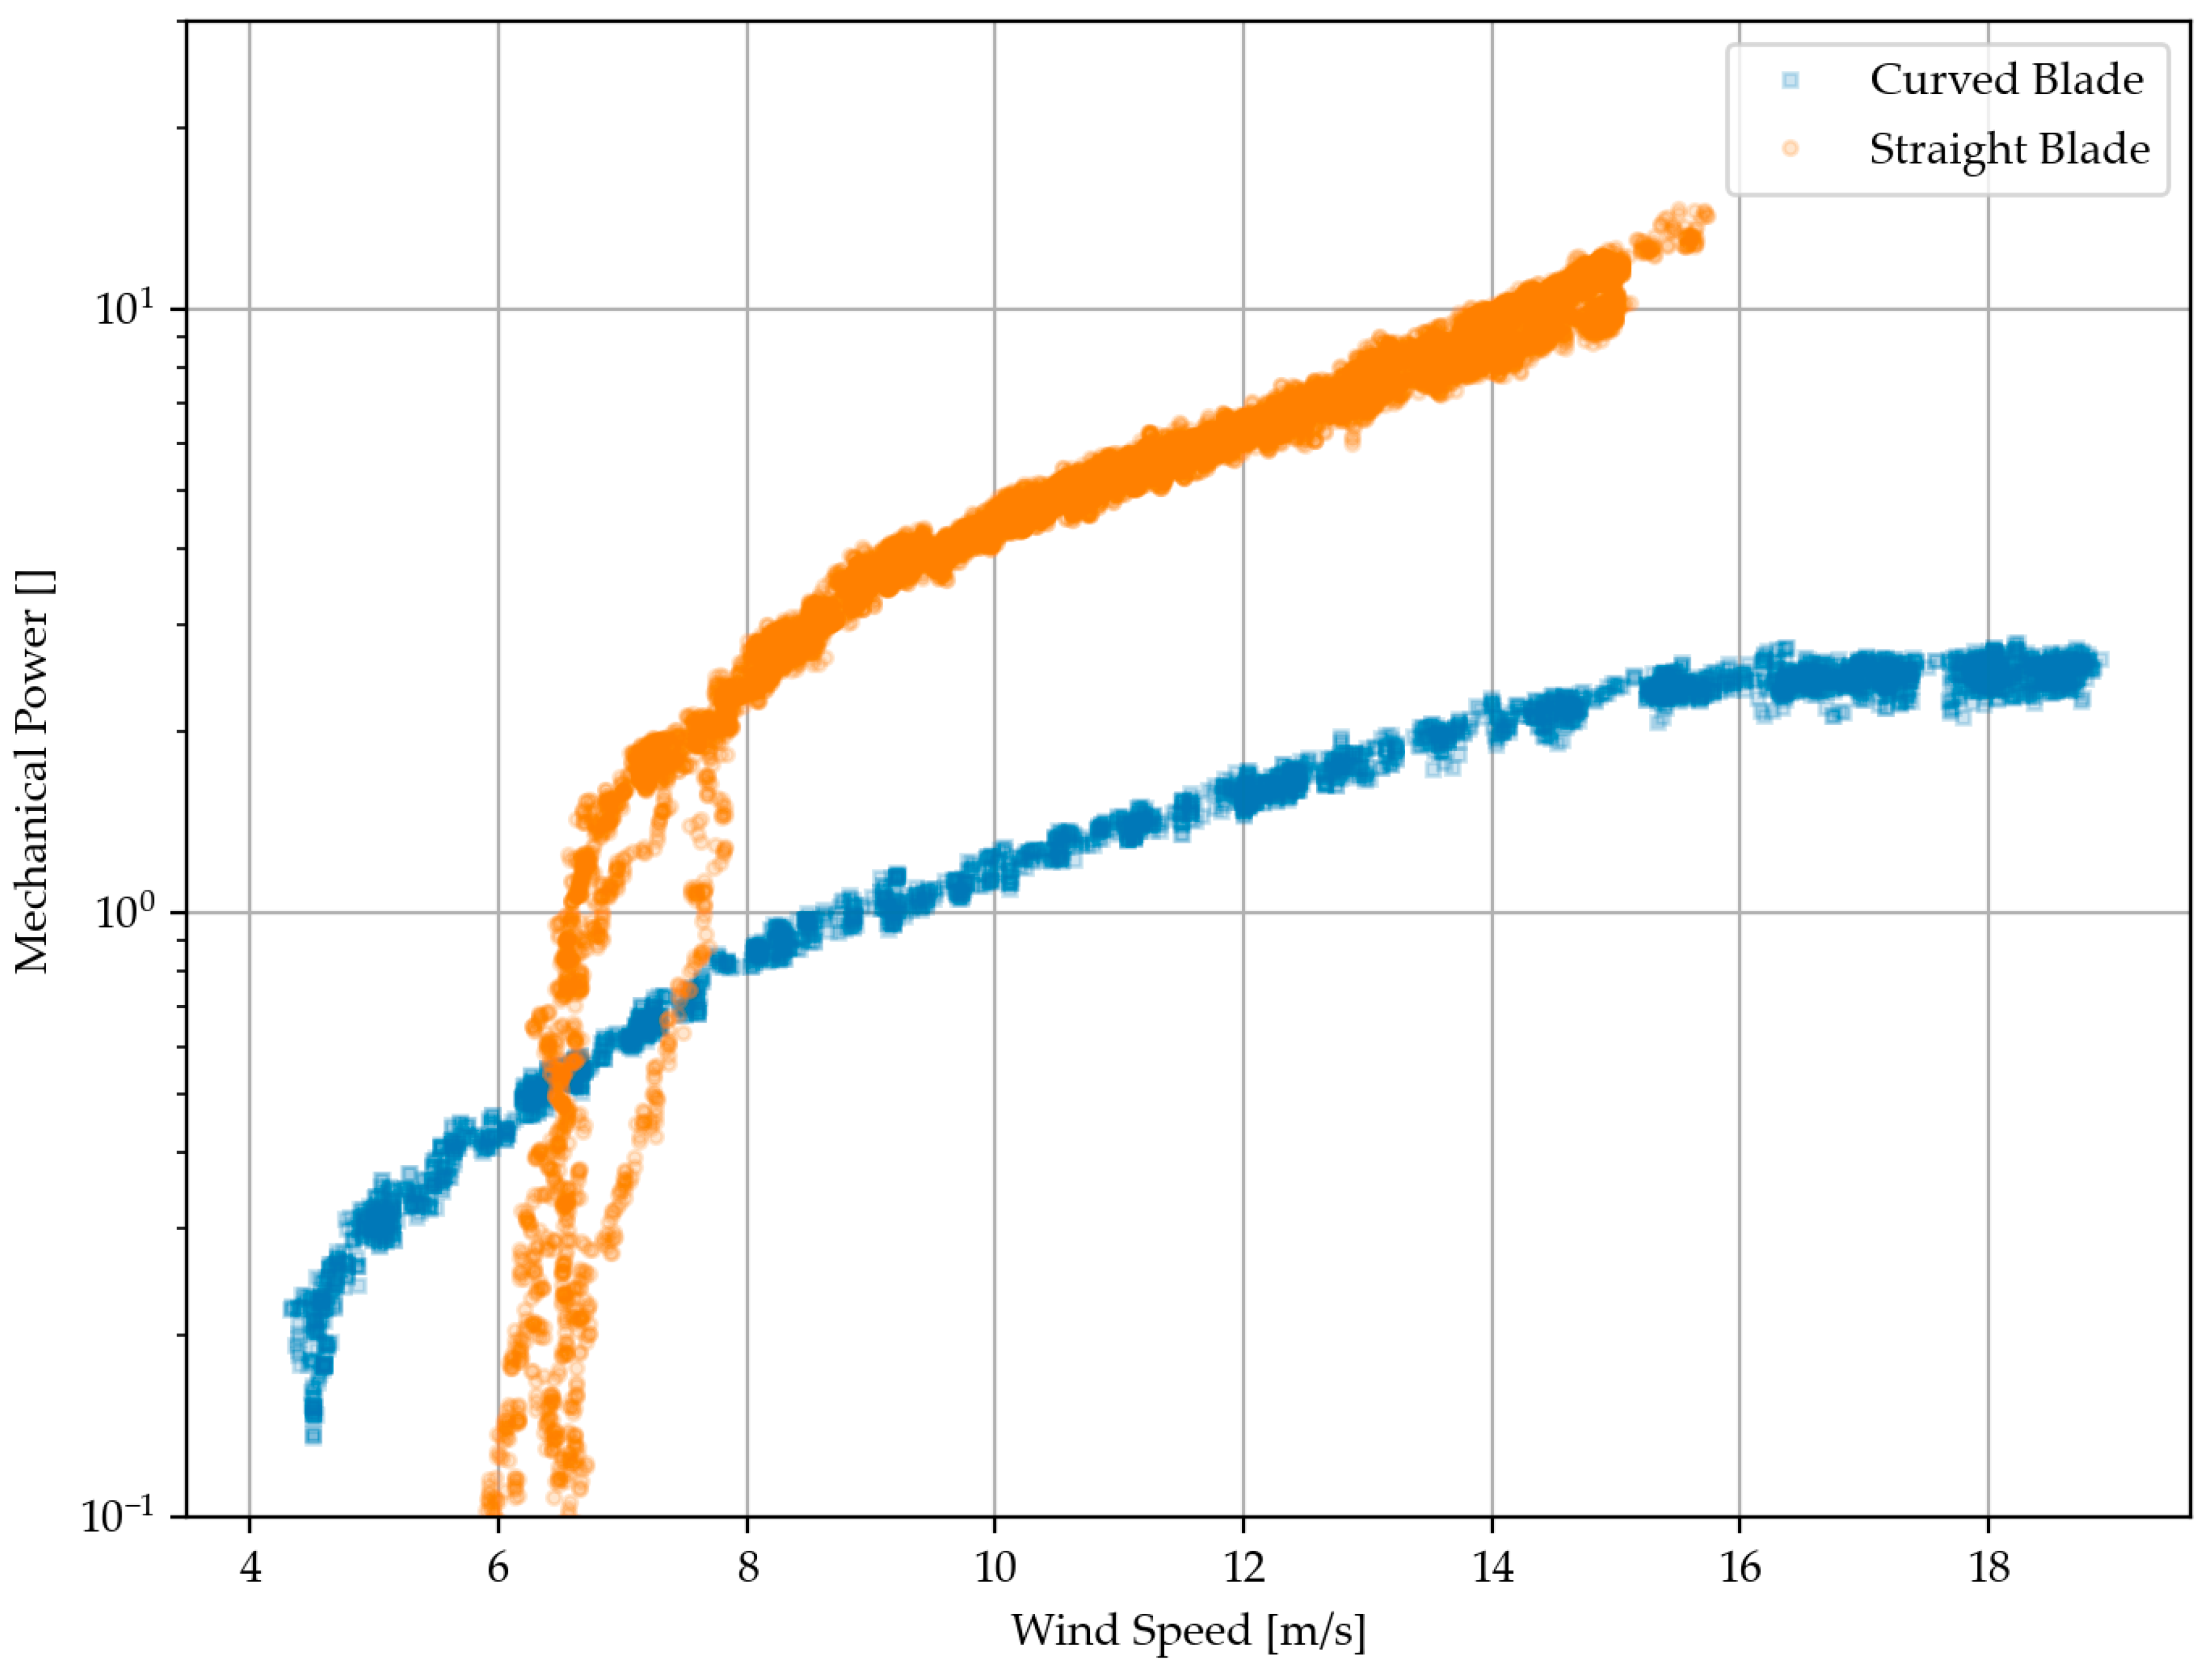
4.1.2. Power vs. Wind Speed

Similar effects are observed in the case of power versus wind speed. Figure 20 provides a comparative illustration of the mechanical power (obtained by torque multiplied by angular velocity) against wind speed for straight and flexible curved blades in different subgraphs, with the data points color-coded by brake settings. To facilitate direct comparison, the axes of the subgraphs are uniformly scaled. The data in the figure are from the tests with gradually increasing velocity.
A notable observation is that the flexible curved blade exhibits significantly lower mechanical power values compared to the straight blade. Additionally, the rate at which the power climbs with increasing wind speed is significantly greater.
Figure 21 provides a detailed examination of the ‘no brake’ settings by employing a log10 scale on the y-axis, which represents the logarithm of mechanical power, to accentuate the pronounced differences in behavior between the straight and flexible curved blades. An initial observation is that the flexible curved blade commences power production at a lower wind speed of 4.5 m/s, compared to 6 m/s for the straight blade, thus demonstrating an enhanced capability to generate energy at lower wind velocities.
During the initial phase, both blades demonstrate an increase in power output with rising wind speeds. However, on the log scale, the straight blade exhibits a linear relationship between 8 m/s and 15 m/s, suggesting that its power output is proportional to the power of velocity. In contrast, the flexible curved blade shows an initial increase in power between 6 m/s and 16 m/s, but the rate of increase diminishes with higher wind speeds, as observed in the log scale. This behavior indicates an early onset of self-regulation in power harvesting. At higher speeds above 16 m/s, the power output of the flexible curved blade stabilizes, remaining constant and effectively demonstrating the passive control capabilities of this blade design.
Additionally, a critical observation from Figure 21 (and is consistent with the findings for the rotational velocity from Figure 19) is that the maximum power yield does not occur at the intended velocities of between 8 and 10 m/s but at significantly higher velocities. This indicates that while passive control is present and operational to a degree in the flexible curved blade, it may not be optimally effective, as the power regulation does not align with the designed target velocities.

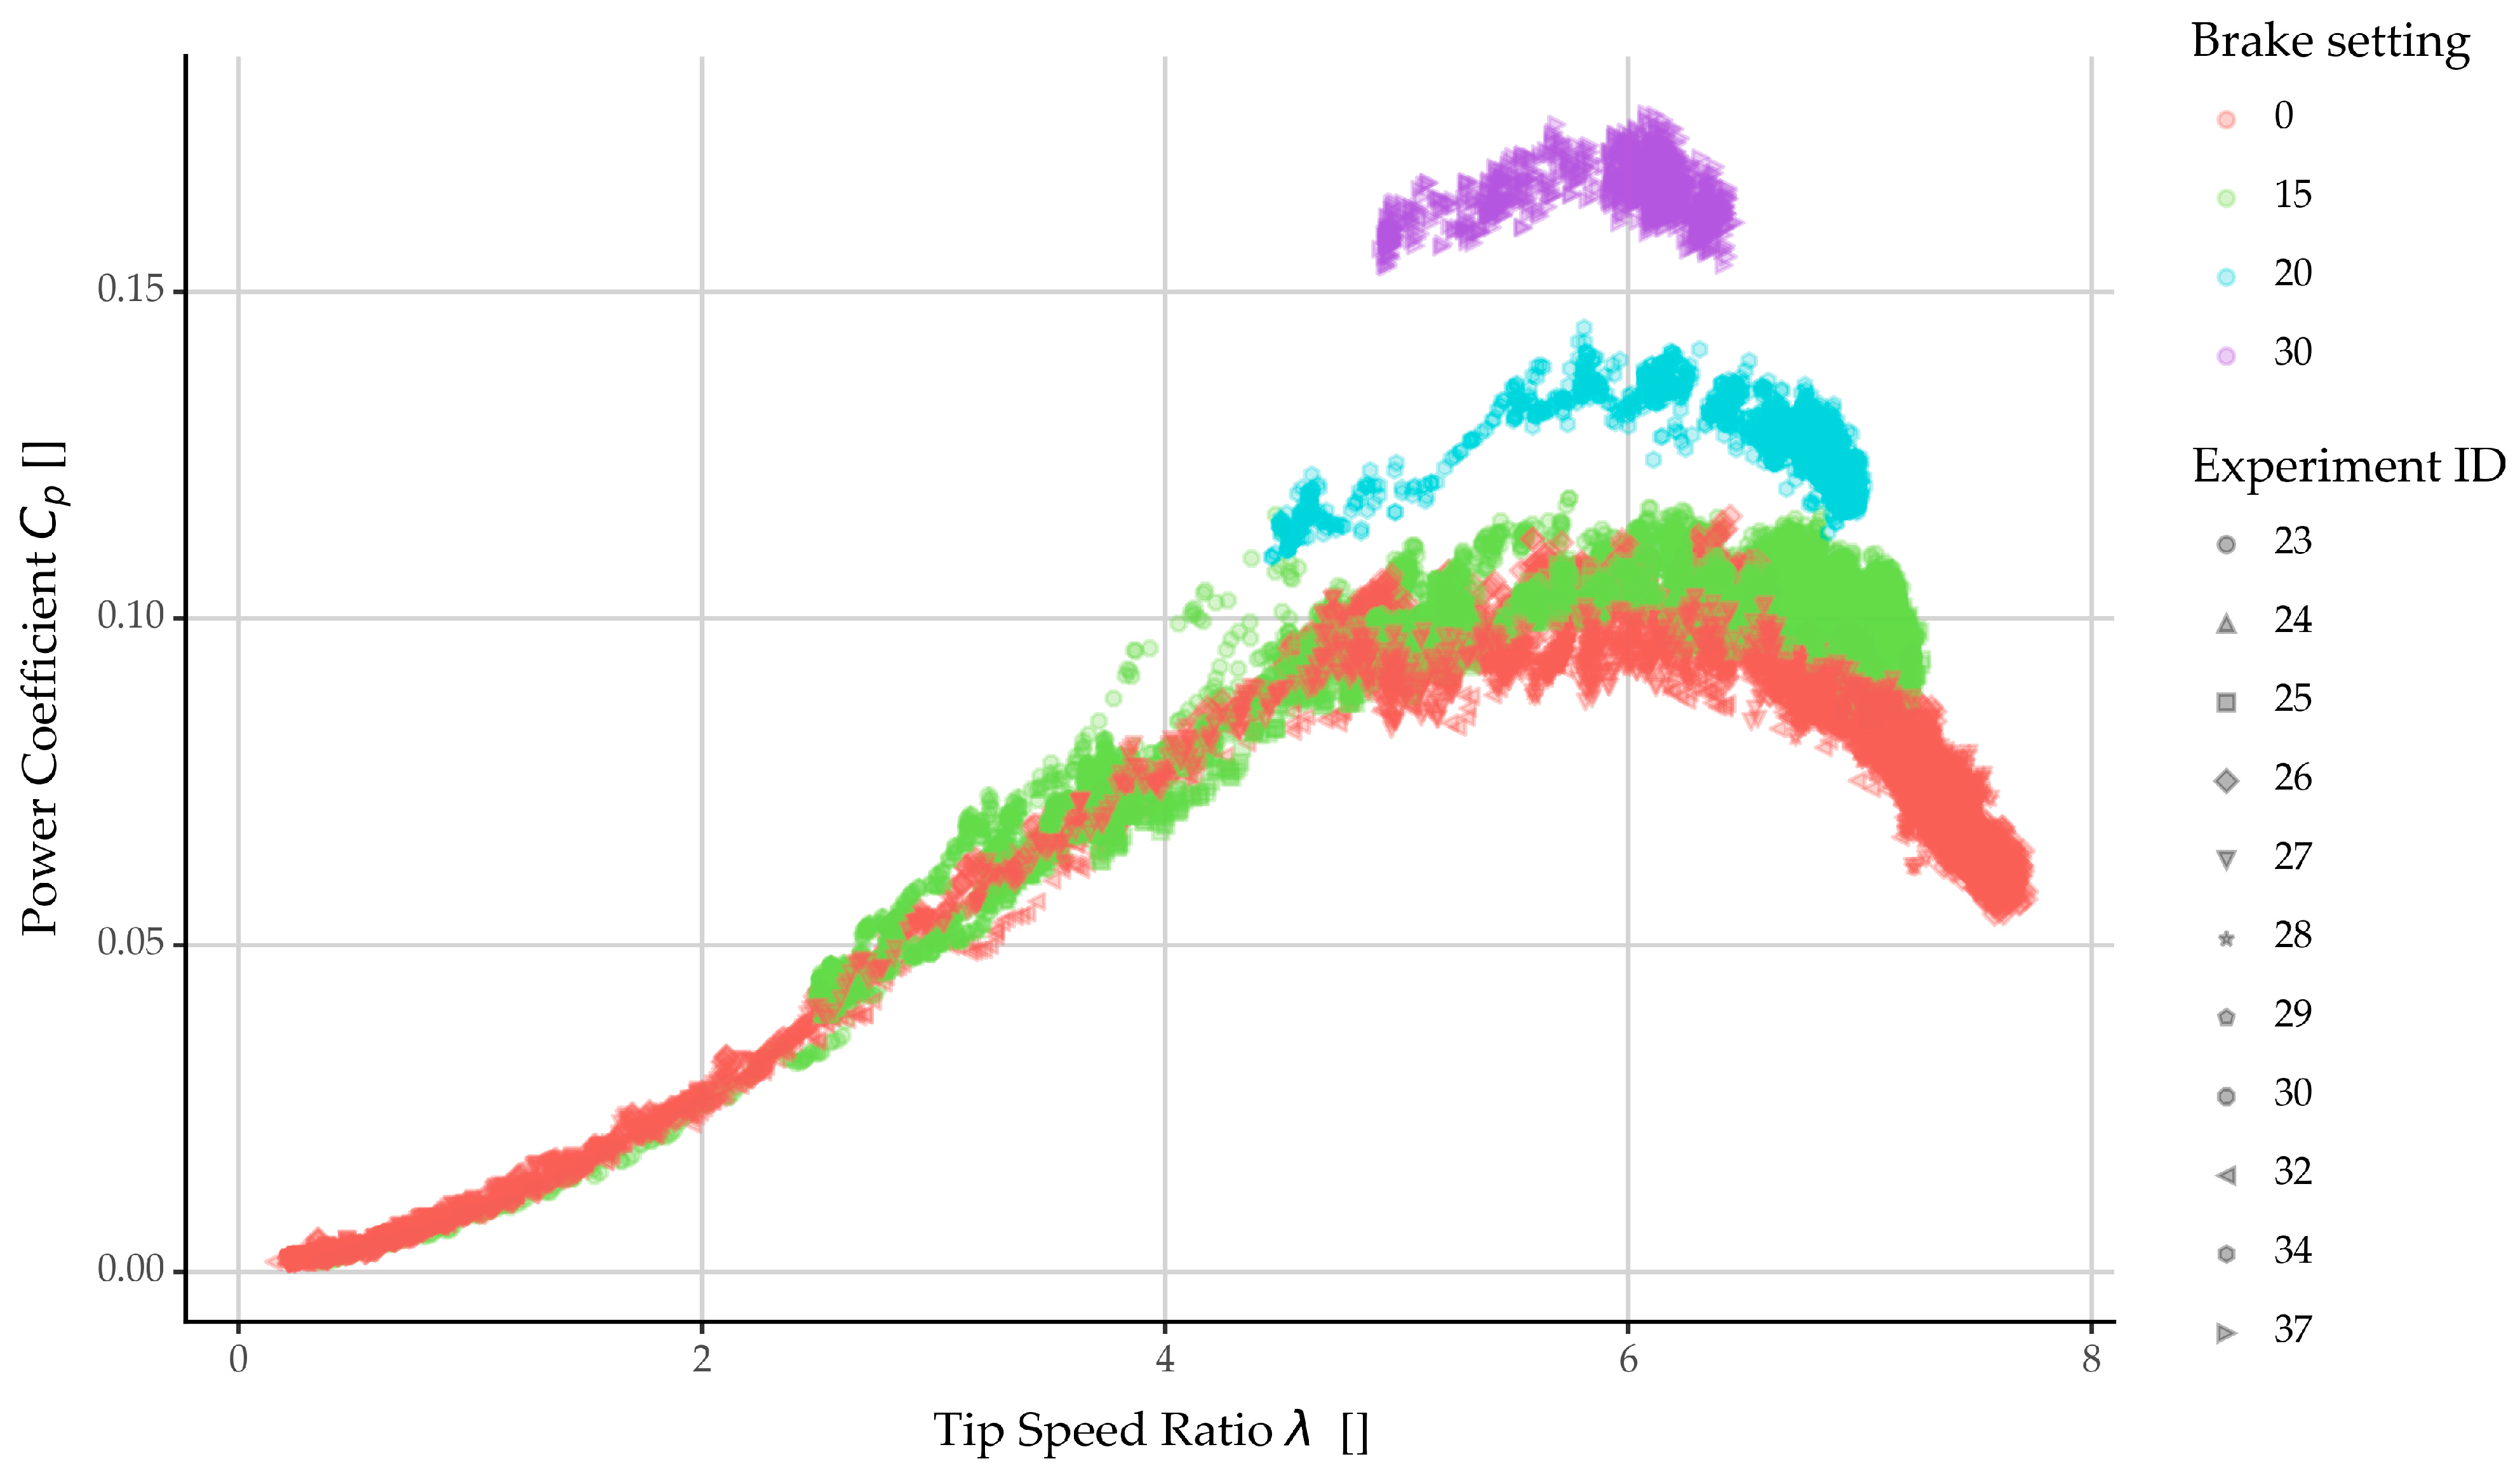
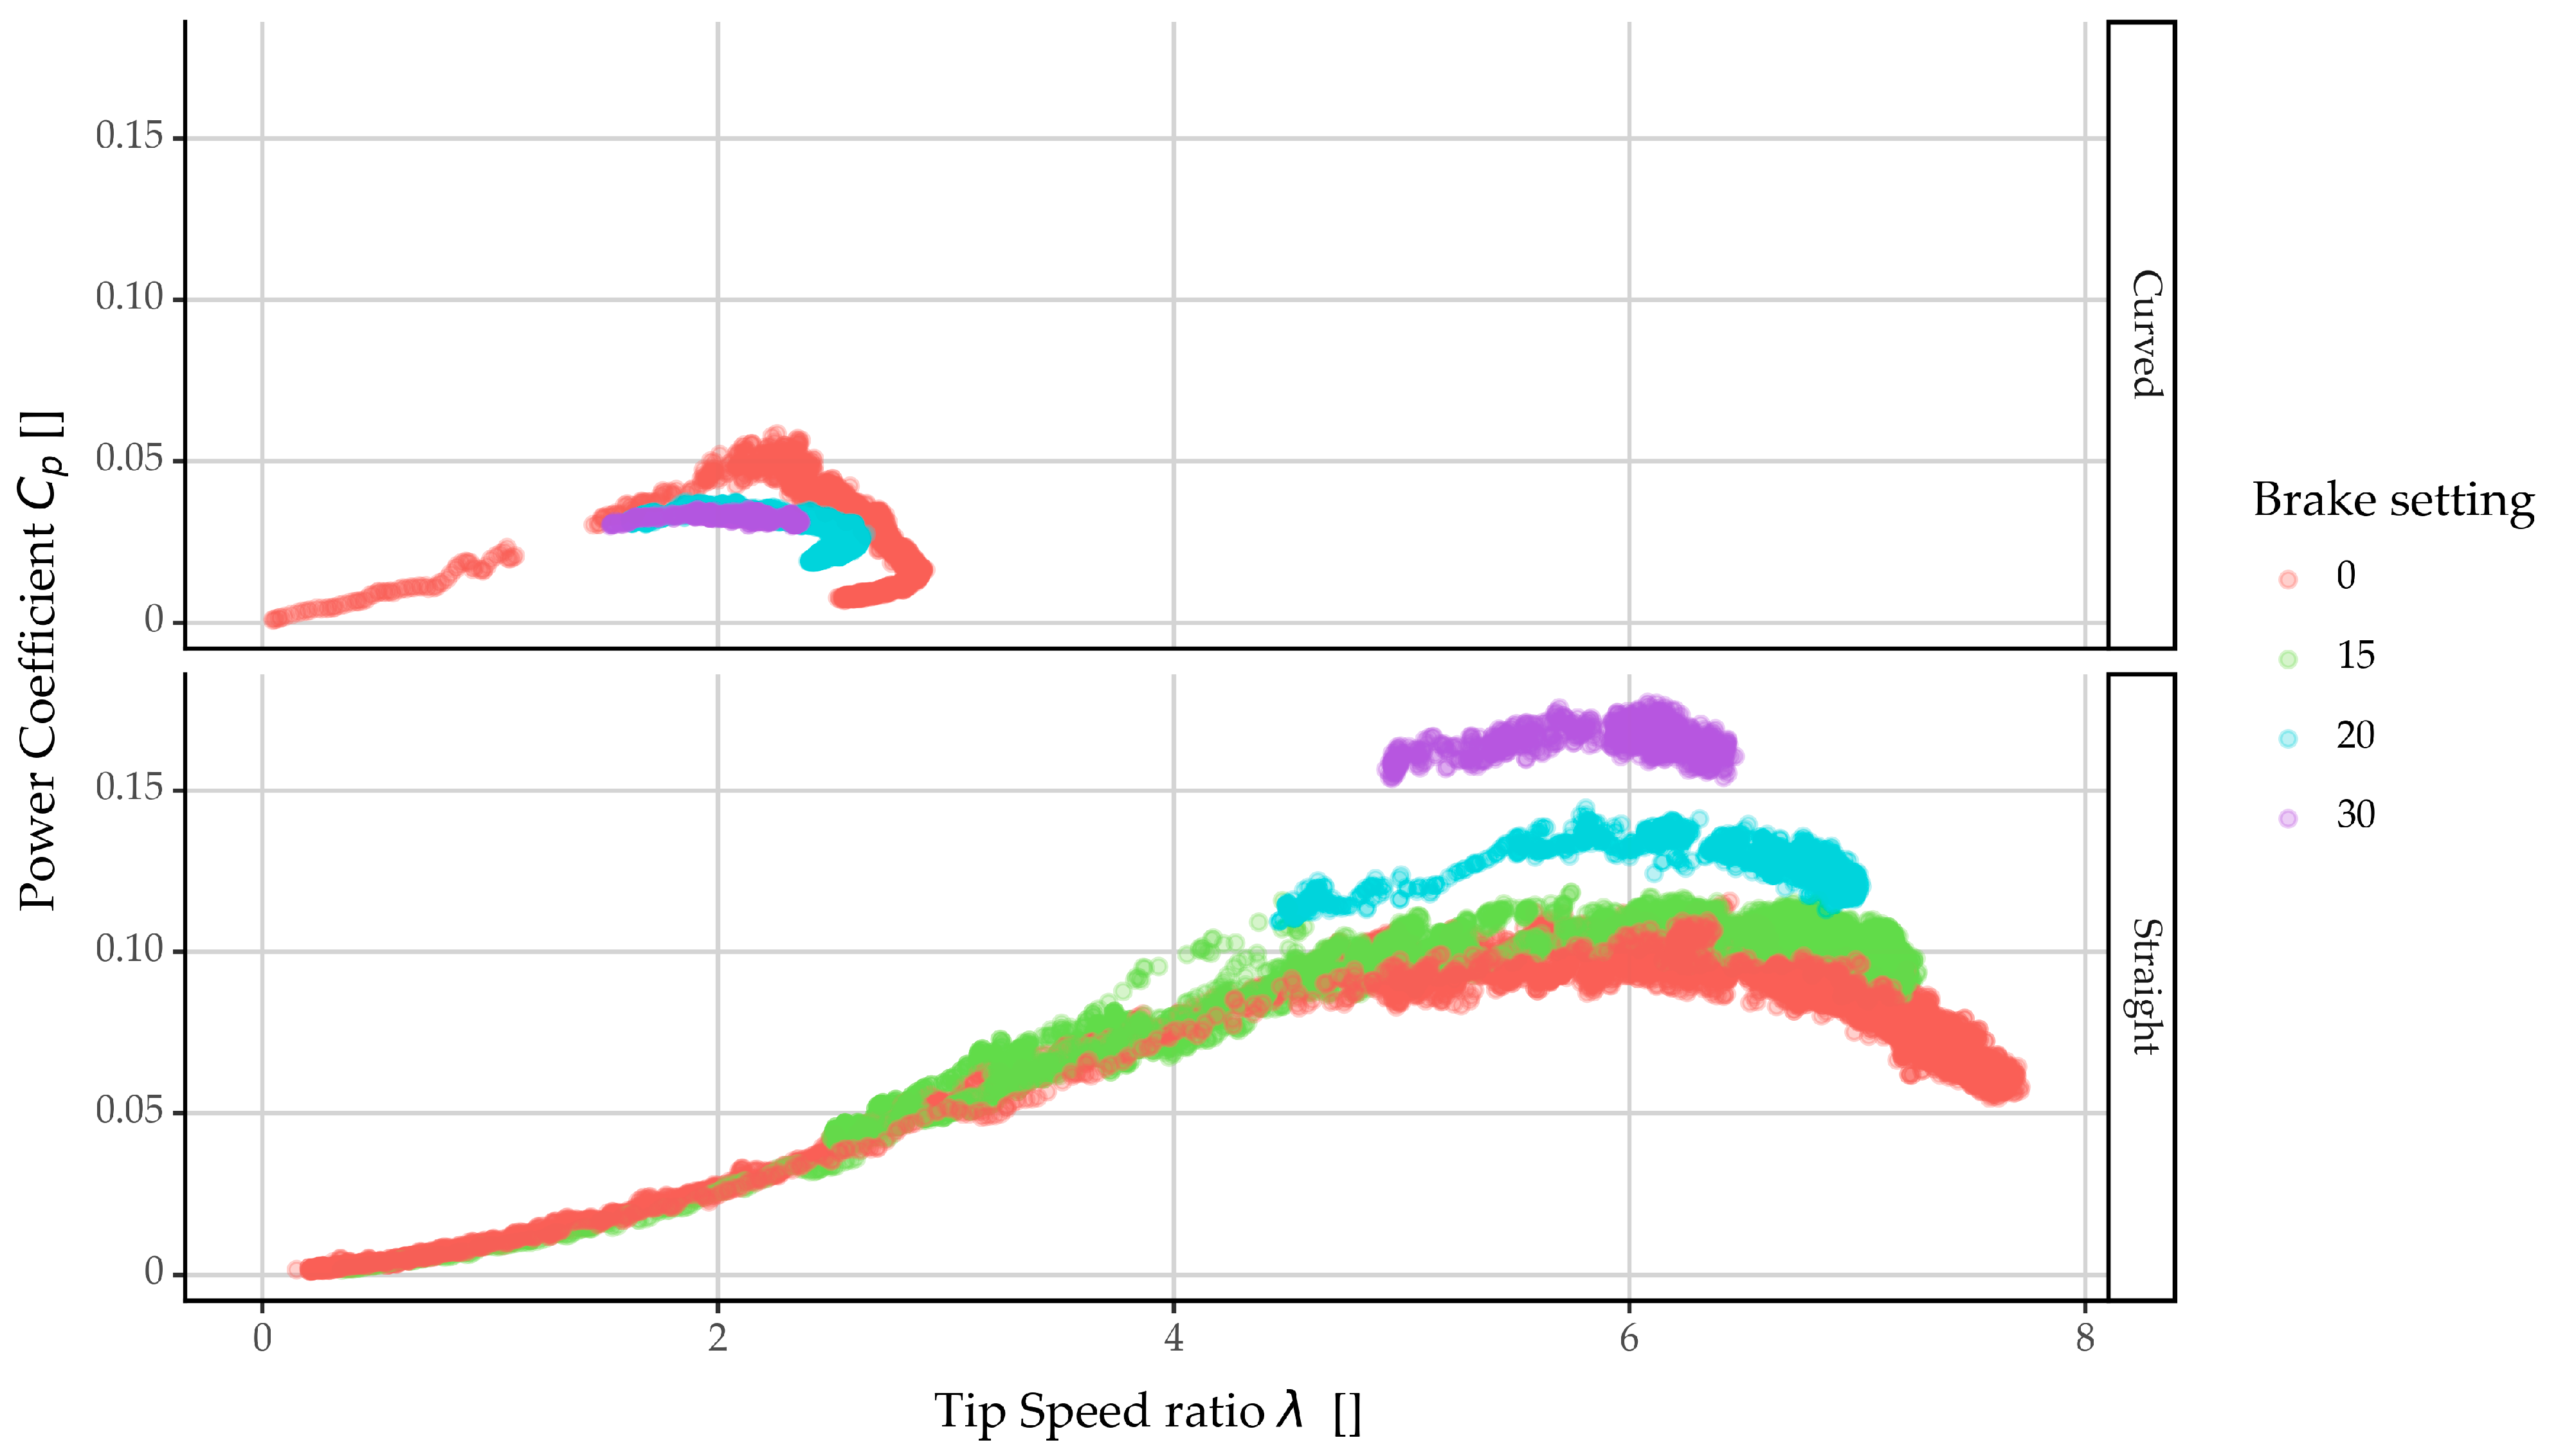
4.2. Power Coefficient vs. Tip Speed Ratio

Figure 22 provides a detailed comparison of the power coefficient (Cp) versus tip speed ratio (TSR) for both straight and curved blades, with each subgraph’s data points color-coded according to brake settings. This comparison highlights significant performance and behavioral differences attributable to the curved blade design.
A notable distinction is observed in the range of TSR. The flexible curved blade operates within a TSR range from 0 to approximately 3, substantially lower than the straight blade, which ranges up to almost 7—closer to the optimal TSR value. Interestingly, greater braking settings correlate with narrower TSR ranges for both blade types, as the mechanical brake impedes startup and restricts the increased rate of rotational speed, affecting the maximum TSR achievable.
Another key observation concerns the maximum power coefficient values. For cases without braking, the maximum Cp is nearly double compared to those with braking. Intriguingly, increasing the brake setting decreases the Cp for the flexible curved blade, while the opposite trend is observed for the straight blade, where higher braking values enhance the Cp. This divergence highlights the passive control mechanism inherent to the flexible curved blade, which, unlike the straight blade that maximizes power output with increased wind force, regulates itself to harvest only the nominal power at higher velocities—similar to an actively pitch-controlled wind turbine.
Regarding the influence of braking on CP, it is critical to recognize that load settings can significantly affect CP measurements, potentially leading to misleading conclusions if not properly considered. This is particularly relevant in comparative analyses of blades with different design goals: a straight blade aimed at maximizing power and a flexible curved blade designed for safe and controlled power production. Ideally, measurements would be made using an MPPT inverter [43,44], as a load to align more closely with operational conditions. However, given the limitations of the current measurement configuration setup in the Power Synthesis Laboratory, which lacks such a system, the measurement results should be interpreted qualitatively.
Lastly, a consistent feature in flexible curved blade measurements is a hook-like pattern observed in Figure 15. This downward-facing hook pattern demonstrates lower CP values at the same TSR at higher velocities, attributed to the passive control mechanisms of the flexible curved blade. As wind velocity increases, the rotational velocity remains capped at 3000 rpm, thus reducing the TSR. Concurrently, the CP decreases because while the available energy (the denominator) increases, the power output (the numerator) remains capped by the blade’s control features.
The findings from the analysis of Figure 22 provide insights into the operational dynamics of straight versus curved blades under various braking conditions. These observations not only reinforce the claim of passive control in the flexible curved blade concept but also underscore the necessity for appropriate load settings in power coefficient measurements. The ongoing development of tailored testing systems, including an MPPT inverter for more accurate load simulation, is crucial for advancing our understanding of blade performance across different scales. This endeavor will enhance the measurement capability at the Power Synthesis Laboratory to design blades that optimally balance power production with dynamic control.

5. Conclusions

This work aimed to present preliminary results on the aerodynamic performance and behavior of a novel flexible curved wind turbine blade concept in comparison with a conventional straight blade. The flexible curved blade concept was designed to enhance operational safety and energy efficiency by incorporating sufficient elasticity to allow for bend–twist deformation around its longitudinal axis under bending loads. This passive control mechanism is intended to self-regulate the blade’s response to varying wind speeds, thereby tailoring its power profile.
The study rigorously examined the performance characteristics of the preliminary results for these flexible curved blades, utilizing a series of tests to highlight differences in rotational velocity, power output, and efficiency under varying wind speeds and braking conditions. Key findings revealed that the flexible curved blades, due to their innovative design, managed to demonstrate a capping on the maximum rotational speed and mechanical power output at high speeds compared to the straight blades, which generally displayed higher operational metrics under similar conditions. Additionally, the flexible curved blades were able to start generating power at lower wind speeds (flexible curved 4 m/s, while straight started at 6 m/s) and exhibited a degree of power stabilization (beyond 16 m/s)—traits indicative of the effective passive control integrated into their design.
Despite these advantages, the passive control mechanisms did not activate at the designed wind speeds (8 to 10 m/s), indicating a misalignment between performance expectations and actual outcomes. This misalignment suggests areas for further refinement in the blade’s design and control settings. Moreover, while the flexible curved blades maintained a stable power output at higher wind speeds, similar to actively controlled systems, this capability marks a significant advancement in blade technology, aligning with sustainability goals by potentially reducing active control systems costs and possibly mitigating potential turbine damage.
Additionally, the comparison of the Power coefficient (Cp) versus tip speed ratio (TSR) demonstrated that flexible curved blades operate within a significantly lower TSR range. Under no braking conditions, their performance at lower TSR was superior, challenging conventional expectations about blade dynamics under passive control. Additionally, the flexible curved blade demonstrated a ‘hook-like’ feature in Cp behavior under high wind conditions (over 16 m/s), which indicated that the flexible curved blades effectively cap power in a controlled manner.
In conclusion, this study has provided valuable insights into the capabilities and limitations of flexible curved wind turbine blades and test configurations, affirming the feasibility of designing and manufacturing passively controlled wind turbine blades tailored for specific performance goal criteria. The flexible curved blade concept, which allows for self-regulation without the need for electrical or hydraulic control systems, shows promise. However, further adjustments and optimizations are required to fully realize their potential and ensure alignment with design specifications. Some of these optimizations will be explored in more detail in the next article of this series.

Future Work

Building on the insights provided in this study, future research will focus on enhancing the design, efficiency, and operational reliability of flexible curved wind turbine blades. Key areas for development include refining design parameters and simulation codes to align more closely with real-world performance, and materials for improved adaptability and resilience. Additionally, field testing should be extended to validate the long-term behavior of these blades under diverse environmental conditions.
Additionally, future studies will explore the scalability and economic viability of these designs, from small-scale models to potential applications (which is probably a very niche market), ensuring their commercial feasibility.
A particular emphasis for the Power Synthesis Laboratory will be placed on developing and adapting testing equipment, such as MPPT inverters or similar, to improve the accuracy of load simulations and power measurements. These efforts aim to advance our understanding of wind turbine technology and contribute to the broader field of renewable energy, supporting the transition towards more sustainable energy systems globally.

Author Contributions

Conceptualization, C.C. and N.P.; methodology, N.P. and C.C.; software, N.P.; validation, N.P.; investigation, N.P. and C.C.; resources; data curation, N.P.; writing—original draft preparation, N.P.; writing—review and editing, N.P.; visualization, N.P.; supervision, N.P.; project administration, C.C.; funding acquisition, No funding. All authors have read and agreed to the published version of the manuscript.

Funding

This research received no external funding.

Data Availability Statement

The original contributions presented in the study are included in the article, further inquiries can be directed to the corresponding authors.

Conflicts of Interest

The authors declare no conflict of interest.

Abbreviations:

CpPower Coefficient
MPPTMaximum Power Point Tracking
TSRTip Speed Ratio
WECSWind Energy Converter Systems

References

  1. Doukas, H. Energy Citizenship—A New Dimension in Energy Policy Making. Available online: https://www.e-mc2.gr/news/energy-citizenship-new-dimension-energy-policy-making (accessed on 6 February 2024).
  2. Roesch, R.; Taylor, M.; Al-Zoghoul, S.; Ralon, P.; Sorokina, O. IRENA Report—Renewable Power Generation Costs in 2022; International Renewable Energy Agency: Abu Dhabi, United Arab Emirates, 2022; ISBN 978-92-9260-544-5. [Google Scholar]
  3. IEA. World Energy Outlook 2013; IEA: Paris, France, 2013. [Google Scholar]
  4. International Energy Agency (IEA). Global Electricity Generation by Technology, 2015, 2021 and 2027; IEA: Paris, France, 2022. [Google Scholar]
  5. European Union Electricity and Heat Statistics. Available online: https://ec.europa.eu/eurostat/statistics-explained/index.php?title=Electricity_and_heat_statistics (accessed on 3 May 2023).
  6. Frequently Asked Questions (FAQs)—U.S. Energy Information Administration (EIA). Available online: https://www.eia.gov/tools/faqs/faq.php (accessed on 9 February 2024).
  7. Hutchinson, M.; Zhao, F. Global Wind Report 2022; Global Wind Energy Council: Brussels, Belgium, 2022. [Google Scholar]
  8. Ponta, F.L.; Otero, A.D.; Rajan, A.; Lago, L.I. The Adaptive-Blade Concept in Wind-Power Applications. Energy Sustain. Dev. 2014, 22, 3–12. [Google Scholar] [CrossRef]
  9. Liebst, B.S. Wind Turbine Gust Load Alleviation Utilizing Curved Blades. J. Propuls. Power 1986, 2, 371–377. [Google Scholar] [CrossRef]
  10. Christakis, D. The Development of Wind Energy Systems in Crete. In Proceedings of the Seminar for the New Trends on Wind Energy, Chanea, Greece; 1991. [Google Scholar]
  11. Serra, M.F.G.; van Schoor, M.C. Aeroelastic Tailoring of a Horizontal Axis Wind Turbine. Wind Eng. 1995, 19, 193–207. [Google Scholar]
  12. Eggers, A.J., Jr.; Ashley, H.; Rock, S.M.; Chaney, K.; Digumarthi, R. Effects of Blade Bending on Aerodynamic Control of Fluctuating Loads on Teetered HAWT Rotors. J. Sol. Energy Eng. 1996, 118, 239–245. [Google Scholar] [CrossRef]
  13. Tran, D.-H.; Sareni, B.; Roboam, X.; Espanet, C. Integrated Optimal Design of a Passive Wind Turbine System: An Experimental Validation. IEEE Trans. Sustain. Energy 2010, 1, 48–56. [Google Scholar] [CrossRef]
  14. Infield, D.G.; Feuchtwang, J.B. Design Criteria for Passive Pitch Control of Wind Turbines Using Self-Twisting Blades. Int. J. Ambient. Energy 1995, 16, 139–146. [Google Scholar] [CrossRef]
  15. Infield, D.G.; Feuchtwang, J.B.; Fitches, P. Development and Testing of a Novel Self-Twisting Wind Turbine Rotor. In 1999 European Wind Energy Conference; Routledge: London, UK, 1999; ISBN 978-1-315-07433-7. [Google Scholar]
  16. Lobitz, D.W.; Veers, P.S.; Migliore, P.G. Enhanced Performance of HAWTs Using Adaptive Blades. In Proceedings of the Wind 1996 ASME Wind Energy Symposium, Houston, TX, USA, January 29–2 February 1996; Report Number: CONF-960154. American Society of Mechanical Engineers: New York, NY, USA; Sandia National Laboratories (SNL): Albuquerque, NM, USA; Livermore, CA, USA, 1996. [Google Scholar]
  17. Lobitz, D.; Veers, P. Aeroelastic Behavior of Twist-Coupled HAWT Blades. In 1998 ASME Wind Energy Symposium; Aerospace Sciences Meetings; American Institute of Aeronautics and Astronautics: Reston, VA, USA, 1998. [Google Scholar]
  18. Eisler, G.R.; Veers, P.S. Parameter Optimization Applied to Use of Adaptive Blades on a Variable Speed Wind Turbine; Sandia National Laboratories: Albuquerque, NM, USA, 1998. [Google Scholar]
  19. Lobitz, D.; Laino, D. Load Mitigation with Twist-Coupled HAWT Blades. In 37th Aerospace Sciences Meeting and Exhibit; Aerospace Sciences Meetings; American Institute of Aeronautics and Astronautics: Reston, VA, USA, 1999. [Google Scholar]
  20. Lobitz, D.; Veers, P.; Laino, D. Performance of Twist-Coupled Blades on Variable Speed Rotors. In 2000 ASME Wind Energy Symposium; American Institute of Aeronautics and Astronautics: Reston, VA, USA, 2000. [Google Scholar]
  21. Condaxakis, C.G.; Christakis, D.G.; Frandsen, S.T.; Eboueya, M. Passive Controlled Wind Turbine Blades. In Proceedings of the 1999 European Wind Energy Conference, Nice, France, 1 March 1999; James & James Ltd.: Nice, France, 1999. [Google Scholar]
  22. Christakis, D.G.; Condaxakis, C.G.; Eboueya, M.; Granier, P. A Contribution to the Passive Controlled Optimised Wind Motor Design. In Proceedings of the Computational Engineering in Systems Applications CESA, Nabeul-Hamamet, Tunisia, 1 April 1998; IEEE: Nabeul-Hamamet, Tunisia, 1998. [Google Scholar]
  23. Zuteck, M. Adaptive Blade Concept Assessment: Curved Platform Induced Twist Investigation; Sandia National Lab. (SNL-NM): Albuquerque, NM, USA; Livermore, CA, USA, 2002. [Google Scholar]
  24. Larwood, S.; Zutek, M. Swept Wind Turbine Blade Aeroelastic Modeling for Loads and Dynamic Behavior. In Proceedings of the WINDPOWER 2006, Pittsburgh, PA, USA, 4–7 June 2006. [Google Scholar]
  25. Ashwill, T.D. Sweep-Twist Adaptive Rotor Blade: Final Project Report; Sandia National Laboratories (SNL): Albuquerque, NM, USA; Livermore, CA, USA, 2010. [Google Scholar]
  26. Masoudi, M.; Pope, K. Numerical Predictions on Fluid-Structure Bend-Twist Coupling of Wind Turbine Blades. Int. J. Mech. Eng. Robot. Res. 2019, 8, 506–510. [Google Scholar] [CrossRef]
  27. Wiens, M.; Meyer, T.; Wenske, J. Exploiting Bend-Twist Coupling in Wind Turbine Control for Load Reduction⁎. IFAC-Pap. 2020, 53, 12139–12144. [Google Scholar] [CrossRef]
  28. Tamayo-Avendaño, J.M.; Patiño-Arcila, I.D.; Nieto-Londoño, C.; Sierra-Pérez, J. Fluid–Structure Interaction Analysis of a Wind Turbine Blade with Passive Control by Bend–Twist Coupling. Energies 2023, 16, 6619. [Google Scholar] [CrossRef]
  29. Riva, R.; Spinelli, M.; Sartori, L.; Cacciola, S.; Croce, A. Stability Analysis of Wind Turbines with Bend-Twist Coupled Blades. J. Phys. Conf. Ser. 2018, 1037, 062014. [Google Scholar] [CrossRef]
  30. Voutsinas, S.G.; Belessis, M.A.; Rados, K.G. Investigation of the Yawed Operation of Wind Turbines by Means of a Vortex Particle Method. In Proceedings of the AGARD Conference Proceedings AGARD CP; Advisory Group for Aerospace Research and Development (AGARD): Neuilly sur Seine, France, 1995. [Google Scholar]
  31. Capuzzi, M.; Pirrera, A.; Weaver, P.M. Structural Design of a Novel Aeroelastically Tailored Wind Turbine Blade. Thin-Walled Struct. 2015, 95, 7–15. [Google Scholar] [CrossRef]
  32. MacPhee, D.; Beyene, A. A Flexible Turbine Blade for Passive Blade Pitch Control in Wind Turbines. In Proceedings of the 2011 IEEE Power Engineering and Automation Conference, Wuhan, China, 8–9 September 2011; Volume 1, pp. 196–199. [Google Scholar]
  33. Larwood, S.; van Dam, C.P.; Schow, D. Design Studies of Swept Wind Turbine Blades. Renew. Energy 2014, 71, 563–571. [Google Scholar] [CrossRef]
  34. Shen, X.; Chen, J.-G.; Zhu, X.-C.; Liu, P.-Y.; Du, Z.-H. Multi-Objective Optimization of Wind Turbine Blades Using Lifting Surface Method. Energy 2015, 90, 1111–1121. [Google Scholar] [CrossRef]
  35. Khalafallah, M.G.; Ahmed, A.M.; Emam, M.K. CFD Study of Some Factors Affecting Performance of HAWT with Swept Blades. Int. J. Sustain. Energy 2017, 36, 489–501. [Google Scholar] [CrossRef]
  36. Chen, Y.-J.; Tsai, Y.-F.; Huang, C.-C.; Li, M.-H.; Hsiao, F.-B. The Design and Analysis of Passive Pitch Control for Horizontal Axis Wind Turbine. Energy Procedia 2014, 61, 683–686. [Google Scholar] [CrossRef]
  37. Chen, Y.-J.; Shiah, Y.C. Experiments on the Performance of Small Horizontal Axis Wind Turbine with Passive Pitch Control by Disk Pulley. Energies 2016, 9, 353. [Google Scholar] [CrossRef]
  38. Chu, Y.-J.; Chong, W.-T. A Biomimetic Wind Turbine Inspired by Dryobalanops Aromatica Seed: Numerical Prediction of Rigid Rotor Blade Performance with OpenFOAM®. Comput. Fluids 2017, 159, 295–315. [Google Scholar] [CrossRef]
  39. Krogstad, P.-Å.; Lund, J.A. An Experimental and Numerical Study of the Performance of a Model Turbine. Wind Energy 2012, 15, 443–457. [Google Scholar] [CrossRef]
  40. Larsen, G.C.; Frandsen, S.T.; Sørensen, P.E.; Courtney, M. Design Basis for Horizontal-Axis Wind Turbines. Theoretical Background; Risoe National Lab.: Roskilde, Denmark, 1990. [Google Scholar]
  41. Le Gouriérès Désiré; Le Gouriérès, D. Energie Éolienne: Théorie, Conception et Calcul Pratique Des Installations/Par Désiré Le Gourières, …; Eyrolles: Paris, France, 1980. [Google Scholar]
  42. Hansen, M. The Classical Blade Element Momentum Method. In Aerodynamics of Wind Turbines, 2nd ed.; Routledge: London, UK, 2007; ISBN 978-1-84977-040-8. [Google Scholar]
  43. Zhang, X.; Jia, J.; Zheng, L.; Yi, W.; Zhang, Z. Maximum Power Point Tracking Algorithms for Wind Power Generation System: Review, Comparison and Analysis. Energy Sci. Eng. 2023, 11, 430–444. [Google Scholar] [CrossRef]
  44. Kesraoui, M.; Korichi, N.; Belkadi, A. Maximum Power Point Tracker of Wind Energy Conversion System. Renew. Energy 2011, 36, 2655–2662. [Google Scholar] [CrossRef]
Figure 1. Sankey diagram depicting LCOE cost share for offshore wind turbines in 2021 (Data source: [7]).
Energies 17 03049 g001
Figure 2. Comparison of straight and curved blade concept.
Energies 17 03049 g002
Figure 3. A: axis of aerodynamic centers, B: elastic axis, α: pitch angle, α-α’: pitch angle increase due to elastic deformation, w: bending deformation, ec: elastic–aerodynamic eccentricity.
Energies 17 03049 g003
Figure 4. Flexible curved blade algorithm overview.
Energies 17 03049 g004
Figure 5. Test configuration with the flexible curved blade.
Energies 17 03049 g005
Figure 6. Eccentricity at each section of a flexible curved blade.
Energies 17 03049 g006
Figure 7. Example of automated plot summary for exp_id 26 (straight blade—isotropic material—VV type—brake setting: 15).
Energies 17 03049 g007
Figure 8. Mechanical power of straight blade vs. the wind speed (with and without brake) for tests with increasing wind speed.
Energies 17 03049 g008
Figure 9. Coefficient of power with respect to tip speed ratio for straight blade measurements.
Energies 17 03049 g009
Figure 10. Example of automated plot summary for exp_id 20 (straight blade—isotropic material—RR type—10 m/s).
Energies 17 03049 g010
Figure 11. Power coefficient vs. tip speed ratio for different velocities of the straight blade.
Energies 17 03049 g011
Figure 12. Example of automated plot summary for experiment id 31 (flexible curved blade—isotropic material—VV type—brake setting: 0).
Energies 17 03049 g012
Figure 13. Mechanical power of curved blade vs. the wind speed (with and without brake) with increasing speed.
Energies 17 03049 g013
Figure 14. Flexible blade’s rotational velocity of blade vs. the wind speed during the test (with and without brake).
Energies 17 03049 g014
Figure 15. Coefficient of power with respect to tip speed ratio for flexible curved blade measurements.
Energies 17 03049 g015
Figure 16. Example of automated plot summary for exp_id 7 (flexible curved blade—isotropic material -RR type—10 m/s).
Energies 17 03049 g016
Figure 17. Power coefficient vs. tip speed ratio for different velocities of the flexible curved blade.
Energies 17 03049 g017
Figure 18. Comparison of Rpm vs. wind speed for different blade types and brake settings.
Energies 17 03049 g018
Figure 19. Comparison of Rpm vs. wind speed for different blade types for the case of no brake.
Energies 17 03049 g019
Figure 20. Power vs. wind speed for a passive controlled rotor.
Energies 17 03049 g020
Figure 21. Log scale of power vs. wind speed comparison between a curved and straight blade, with no brake.
Energies 17 03049 g021
Figure 22. Power coefficient with respect to tip speed ratio for different blade types using the increasing velocity speed data.
Energies 17 03049 g022
Table 1. Test parameters for isotropic wind blade RR measurements.
Dataset NameBlade Type Radius [m]Wind Speed VelocityLoad
ISO.Curved.RR.<xx>.<y>Isotropic curved0.1605, 6, 7, 8, 9, 10, 11, 12, 13, 14, 15, 16, 17, 18, 19Ramp
ISO.Straight.RR.<xx>.<y>Isotropic straight0.1606, 8, 10, 12, 14Ramp
Table 2. Test parameters for isotropic wind blade VV measurements.
Dataset NameExp.
UID
Blade Type Radius [m]Type of Meas.LoadWind Speed
Velocity Range
Max rpm
during Test
VV. 0907.2323straight0.16VV156–156300
VV. 0907.2424straight0.16VV156–156300
VV. 0908.2525straight0.16VV156–156400
VV. 0908.2626straight0.16VV06–156900
VV. 0908.2727straight0.16VV05–156700
VV. 0908.2828straight0.16VV07–156700
VV. 0908.2929straight0.16VV156–156300
VV. 0908.3030straight0.16VV156–156200
VV. 0908.3131curved0.16VV04–192900
VV. 0908.3232straight0.16VV06–156900
VV. 0908.3333curved0.16VV2012–192800
VV. 0908.3434straight0.16VV209–156300
VV. 0908.3535curved0.16VV2010–192800
VV. 0908.3636curved0.16VV3015–192700
VV. 0908.3737straight0.16VV3012–155800
Table 3. Measurement devices.
MeasurementDeviceModel NameCompany, Country
Wind speed Pitotdifferential pressure transducerHD408TDelta Ohm (now Senseca), Italy
TorqueRotating TorquemeterNo DR2112LSCAIME, France
Rotational VelocityRotating TorquemeterNo DR2112LSCAIME, France
DragLoad Cell model No SP4MC6MRHBM (now HBK), Germany
DAQMultifunction Data Acquisition cardNI-USB-6353National Instruments, USA
Table 4. Geometric characteristics of a straight blade and the eccentricity of the curved isotropic blade.
Seg. NoRadius
[m]
Chord
[m]
Pitch Angle
[deg]
Eccentricity
[deg]
10.0160.023827.0950.00
20.0320.024219.5990.00
30.0480.022714.0572.51
40.0640.020210.4368.71
50.0800.01778.00917.22
60.0960.01566.31025.11
70.1120.01385.07332.37
80.1280.01234.14137.44
90.1440.01113.41840.73
100.1600.01012.84642.18
Disclaimer/Publisher’s Note: The statements, opinions and data contained in all publications are solely those of the individual author(s) and contributor(s) and not of MDPI and/or the editor(s). MDPI and/or the editor(s) disclaim responsibility for any injury to people or property resulting from any ideas, methods, instructions or products referred to in the content.

