Abstract
In the context of the German Energiewende, the current government intends to install six million heat pumps by 2030. Replacing gas heating by power has significant implications on the infrastructure. One of the biggest advantages of using gas is the existing storage portfolio. It has not been clarified yet how power demand should be structured on an annual level—especially since power storage is already a problem and solar power is widely promoted to fuel heat pumps, despite having an inverse profile. In this article, three different solutions, namely, hydrogen, batteries, and carbon capture and storage, are discussed with respect to resources, energy, and financial demand. It shows that relying solely on batteries or hydrogen is not solving the structuring problem. A combination of all existing technologies (including fossil fuels) is required to structure the newly generated electricity demand.
1. Introduction
Global climate change manifests itself in Germany in various forms, such as excessive heat, draughts, and extreme weather phenomena, such as hailstorms, for example. Past governments have been aware of Germany’s contribution to this process and both designed and implemented various strategies to bring Germany on a road toward carbon-neutrality. One major pillar is the German hydrogen (H2) strategy 2030 [1] that aims to reduce carbon emissions, mainly in the fields of industry and transport. Von [2] showed that this strategy would imply a significant carbon bow wave, as well as bow waves in financial and resource demand terms. Based on an economic model, the authors derived the necessity to include turquoise hydrogen, i.e., hydrogen based on natural gas, as well. However, one of their fundamental assumptions is that the supply of natural gas to Germany is ample and gas is cheap. The beginning of the conflict in Ukraine in February 2022, as well as the explosion of the North Stream 1 pipeline, altered this assumption. Not only did the price of natural gas change but also—due to increased liquefied natural gas transport—the carbon emission levels rose. Moreover, in order to reduce the German dependence on natural gas, the German government launched a campaign for a considerable transformation of the German heating sector away from the predominant gas heating toward heat pumps in 2023. From a financial point of view and considering only the heat pump installation, this looks like a daring move, imposing substantial investment costs either on the individual households, real estate investors, or community (in case of subsidies). Switching from gas to electricity naturally increases the demand for the latter, which has to be of renewable form. The consequence has to be a net increase in renewable power sources (wind or solar), in addition to the already existing Energiewende efforts. The shift from gas heating to electricity-based heat pumps also implies the requirement of structuring supply, e.g., via inter-seasonal storage [3]. Gas and oil can be easily stored. Thus, continuous production is possible, and supply can be structured according to demand via the storage and distribution infrastructure (pipelines also contribute a small amount of flexibility). Currently, there is no solution for large seasonal storage of electricity. However, in contrast to gas and oil, in which production is almost flat or even increased in the winter, renewable power is anticyclical, meaning that most is produced during summer (solar power) and the shoulder months, i.e., especially from September to November and March to May (wind power). Hence, structuring issues increase considerably, and an inter-seasonal storage possibility is needed. Batteries are for short-term and intraday structuring (solar power vs. charging cars and supplying household baseload during the nighttime). Technologies such as thermal energy storage and flow batteries offer a longer time horizon of several days up to a couple of weeks. However, most of these concepts are still in the development stage and not scalable within the next five years [4,5]. The potentials of water storage, such as pumped hydro storage, are also limited considering environmental effects and would require substantial planning. In addition, Refs. [4,6] argue that this kind of storage is not suitable for bridging the inter-seasonal gap. The predominately discussed solution is hydrogen generation [2] and storage [5]. For storing hydrogen, there are two approaches, i.e., using the existing gas grid or investing in a separate infrastructure. The first one faces several technical hurdles; the second alternative requires large investments and considerable time.
In this article, we estimate the costs of a nationwide introduction of heat pumps and calculate the residual energy demand, including the required installed power capacity and storage demand. We also estimate the implications for the hydrogen and battery demand. Carbon capture and storage (CCS) as an alternative solution to realize carbon-neutral electricity is discussed. In this context, it is shown that solar power is not an adequate source of heat pump electricity due to its anticyclical annual period, although this is exactly what is considerably subsidized on a micro level. An increase in installed heat pumps substitutes natural gas, including the corresponding storage capacity; hence, we boost the already existing problem of structuring the power supply inter-seasonally. Ceteris paribus, this either increases the need for additional fossil power capacity in winter times or causes massive renewable overcapacity to meet the demand (at least statistically). Neither the use of household batteries nor hydrogen is able to close this gap economically. Based on historical data, we conclude that an intelligent mix of hydrogen and fossil power that is decarbonized by CCS is the most promising path (within a reasonable time frame) in order to provide a cost-efficient possibility for seasonal structuring.
The article is structured as follows: In Section 2, we describe the data sources and explain our calculation steps. In Section 3, relevant technical fundamentals are given. In Section 4, the results of our calculations are given, which are discussed in more detail in Section 5. Section 6 concludes the article.
2. Data Sources and Core Assumptions
Our heating and power demand data for the heat pumps is based [7] which also provides historical temperature data. This information allows us to derive a history of heating years (2007–2014). We are aware of the age of the dataset. Nevertheless, transformation in the housing sector is slow due to high costs. Hence, the dataset is sufficient to estimate the effects of various strategies, as tested in Section 4. For wind power, we use the numbers and assumptions from [2], and for solar power, the numbers from [8]. Let us assume 900 full load hours (flh) for solar power at a lifetime of 20 years. Currently, about one-third of German solar power is field-based (consuming steel and concrete) and two-thirds are mounted on roofs [9]. Given a certain installed capacity, we can also simulate historic solar power and wind production based on the aforementioned sources. Combining the data, we can project the past into the future to simulate demand and supply and structure needs for the future. For future renewable energy installation, we allocate the technology based on assumptions made by the German Federal Ministry of Economic Affairs and Climate Action [10]. Here, 32% is assumed to be onshore wind, 9% offshore wind, and 59% installed solar power panels. Regarding energy demand, we use data from the German energy market database [11] between July 2021 and July 2023 and assume it will be more or less constant in the future. For the gas demand and storage injection, we rely on Bundesnetzagentur data. All further required data, such as German onshore/offshore wind and solar power load factors, are taken from the open-source platform Open Power System Data [12]. As a simplified assumption for industrial demand, we use data from 2022/23 [11] and use it as a projection, as well. Given our assumptions on renewables and certain technologies like battery storage or H2, we calculate the hourly residual demand. This is the demand to be met by waterpower, waste burning, and fossil power generation, which provide most of the remaining power. Since we see a limited growth potential of water and waste power, we assume them to be constant and project all changes in the residual demand to be met by the fossil share. To compare the effect, we aggregate the data on an annual basis.
3. Heat Pumps and Renewable Resource Demand
3.1. Heat Pumps
Heat pumps are used in private households for heating and warm water supply. Their efficiency therefore depends on both the type of heat pump and the type of heating itself (radiator or floor heating). A detailed yet brief overview of the respective energy demand is given by [7]. Here, they discriminate between air-source heat pumps (ASHP), ground-source heat pumps (GSHP), and groundwater-source heat pumps. In most cases, an ASHP is used for retrofitting household heating systems, which therefore will be the considered type in this study. The main trick of heat pumps is to profit from the temperature difference between ambient (or ground) temperature and the cooling liquid within the pump. The smaller this difference, the higher the electricity demand, especially for ASHPs, which is unfortunate as this means that heat pump demand is anticyclical to the annual temperature movement. A measure of heat pump efficiency is the coefficient of performance (COP), which quantifies the relation between the energy output of the heat pump and its energy demand. Ref. [13] compute the electricity demand of heat pumps for England and find a linear relationship between air temperature and the COP of both GSHP and ASHP [7], again, compute the COP based on outside temperature using historical data. In Figure 1, we show their results for the hourly COP (averaged for Germany) in 2014 for ASHPs. Based on these COP values and the actual heat demand, we are able to calculate the corresponding electricity demand. Results are shown in Figure 2. Both in Figure 1 and Figure 2, a predominant annual seasonality is visible, which implies the demand for flexible energy production, as well as annual structuring capacity. In this article, we ceteris paribus focus on heat pumps for households, as this is the prime target of current political measures (especially subsidies). Thereby, we acknowledge that large-scale heat pumps would be an efficient alternative for various heat-intensive industries. However, estimating the potential industry-driven demand would imply a number of additional assumptions. Hence, we restrict this analysis to households, noting that industrial demand would only augment the conclusions drawn in this article.
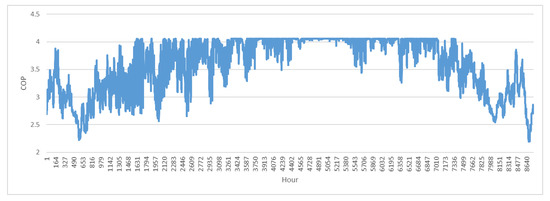
Figure 1.
Hourly coefficient of performance (COP) for air-supplied heat pumps in Germany in 2014.
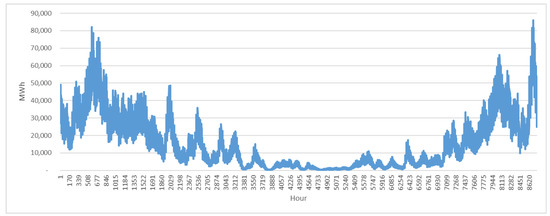
Figure 2.
Hourly electricity demand in megawatt hours (MWh) for air-supplied heat pumps (household sector) in Germany in 2014, assuming that the total heat demand is satisfied by this technology.
3.2. Solar and Wind Power Resource Demand
Here, we summarize the carbon footprint, resource demand, and costs of installing and using solar power panels. For specific numbers of wind power plants, we refer to [2]. Ref. [8] estimate the carbon footprint of solar panels to be around 13–30 g (g) per produced kilowatt hour (kWh), depending on the module’s location in Germany and where it has been produced, i.e., basically China or the European Union (EU). Due to the missing production capacity in the EU and the fact that we assume an installed capacity all across Germany, we work with an average of 22 g/kWh full life cycle emissions. Thus, solar power production and installation cause about twice the emissions of wind turbines, assuming a lifetime of 20 years [2].
Regarding leverage costs, we see a range of 0.025 to 0.04 EUR/kWh for ground-based and 0.04 to 0.08 EUR/kWh for rooftop solar power panels [14]. As mentioned, in Germany, one-third of all solar power plants are ground-based, i.e., mounted on open fields, and two-thirds are mounted on roofs. Hence, we work with 0.04 EUR/kWh, considering the cheapest rooftop level, which equals the worst case for ground-based panels. Regarding resources, we focus on the major ones, as follows: next to steel and concrete, whose production is CO2-intensive, we have aluminum, copper, silicon, silver, germanium, and gallium. The specific numbers are summarized in Table 1, which is based on [15]. Note that the volumes of concrete and steel, especially, refer to ground-based solar power plants; hence, we scale these numbers by one-third.

Table 1.
Resources demand per MW for installed solar power panels.
4. Consequences of a Nationwide Change in Heating Technology in Numbers
We are discussing four different scenarios in four sections, which are listed in Table 2. All are based on the assumption that six million heat pumps are installed. For further core assumptions, see Section 2.
Table 2.
The considered scenarios, including the underlying assumptions.
4.1. The Current Energy Mix in 2030 Plus Renewables for Heat Pump Demand
If we average the COP values from Figure 1 (although being not perfect and a rather positive estimate), we yield an annual average COP of 3.5. For the sake of simplicity, we assume that this COP holds for all 6 million heat pumps. According to the Federal Statistical Office of Germany (Destatis), an average household consumes 17,644 kWh of energy, 85% of which is for air/floor heating and warm water [16]. This means we have a heat pump-related energy demand of 15 MWh × 6,000,000/3.5 = 25.714 TWh. Extending Figure 2 to the period from 2008 to 2014, we compare the heat pump demand to the hourly production of renewable energy. We see, not unexpectedly, that the power demand is highly seasonal, with a peak between November and February, the usual heating months. In Figure 3 (right side), we show the simulated heat pump demand profile vs. the renewable energy production if we assume that the additional demand is installed in a way that demand can be supplied by renewables—on an annual level—even in the worst year of our historic data. To compare the profiles, we show the renewable production as negative numbers in the sense that supply is negative demand. The requirement of structuring is obvious. We also show the residual demand in Figure 3 (left side), which shows that there is a significant overproduction in summer due to the solar power share.
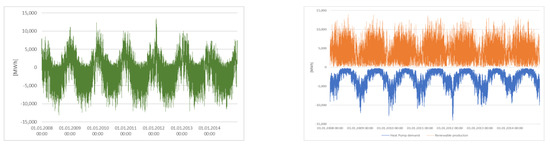
Figure 3.
(Left side): Heat pump demand minus renewable supply; (Right side): Heat pump demand vs. renewable supply.
Note that as explained in Section 2, we work with the German government’s target for a renewable energy split of 59% solar power, 32% onshore wind, and 9% onshore wind. Historical data [7] show a calculated energy demand of 21,318 MW. This equals 12,450 MW of solar panel power, 6897 MW of onshore wind power, and 1881 MW of offshore wind power. Numbers for individual years are given in Table 3. The first question is whether it is statistically possible to generate the required power via renewables at any point in time. Under ceteris paribus conditions, this also means that sufficient battery capacity for intraday balancing has to be installed since, due to the nature of solar energy, huge overcapacity in wind would be required if we want to meet that condition on an hourly basis. Batteries are discussed in detail in Section 4.2; here, we ignore this issue and only consider the daily aggregated demand.
Table 3.
Simulated demand and supply.
Based on our backtest dataset, we compute how much surplus capacity is needed to guarantee that on 95% of all days, the demand is met by renewable sources. Following standard risk management logic, we ignore the remaining 5% and assume that fossil production capacity is available for this case. Given the data, we calculate a factor of 3.792, i.e., we have to install almost four times the amount of renewable capacity involving an increased demand for money and rare metals by a factor of four, compared to the flat scenario (25 TWh are produced on a yearly basis).
If we aim for 100% supply security—and note that this still does not guarantee supply, but 100% supply based on our historical data—we need 10.93 times the capacity, so almost factor 11. This result is consistent with the increasing marginal cost view common in economic theory [17].
For a closer look at the current situation, we use the German 2022/23 energy demand and project it into the past. We also use the mix of installed capacity in July 2023, thereby ignoring nuclear power capacity and considering coal as the first step in a reserve capacity. Now, let us consider the additional heat pump-induced demand shown in Figure 4 and all information gathered above as follows: (a) the July 2023 installed wind and solar capacities [11], (b) the simulated factors as described above, and (c) the demand for fueling the installed heat pump. As a consequence, we can derive the residual demand similar to Figure 3, i.e., the required supply from other sources (fossil fuels or water, for example). In Figure 4, we see that due to seasonality, winter demand has increased even more; especially in winter, there is up to 80,000 MWh/h additional demand, while in summer peak times, we have 47,000 MWh/h of unused supply. That is not a new problem and already exists today. However, heat pumps increase the issue by approximately 25%, assuming that their demand is satisfied by the current renewable supply mix.
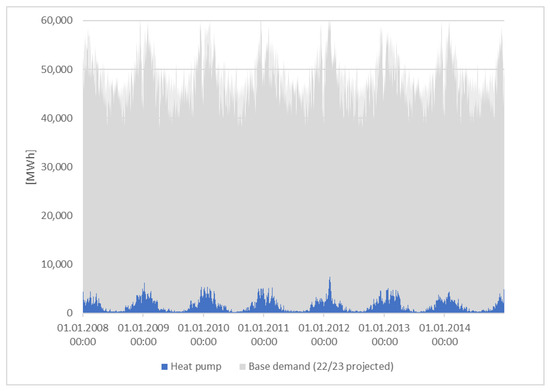
Figure 4.
Heat pump demand compared to the total demand.
This leads to our first finding, as follows: a heat pump-based strategy increases the need for seasonal storage, especially since the commodity substitutes, namely, oil and gas, offer this solution. We do not only substitute a commodity for another one but also an infrastructure without having a market-ready solution for the latter one.
Another crucial question is whether and how the existing energy mix can cover the demand peaks; as seen in Figure 5, the maximum is about 78,630 MW. Given the 2023 supply mix [11,18], Germany has a controllable capacity of 85,350 MW (coal, gas, and pump storage). If we assume that coal should be removed from the mix, this number decreases to a 41,364 MW capacity, which is not enough anymore and implies investments into state-of-the-art gas-fired power plants as replacements (see also Section 4.3). Given these numbers and numbers from Table 4 and considering the gap of 37,000 MW, approximately 64% of the coal-fired power plants have to be replaced by pump storage or gas-fired power plants in order to structure demand. In the case of gas-fired power plants, this immediately raises the question of whether this move is consistent with the climate targets. The answer might be CCS and/or H2, which of course increases the costs significantly (see also Section 4.3 and Section 4.4). Following the results from [2], in which the diversification logic is discussed for H2, an equivalent social cost approach can show that it is very likely economically efficient to split the technologies to fill the above-mentioned gap between pump storage, which is capital-intensive and linked with social cost, and battery/renewable overcapacity. Batteries are thereby used to flatten the daily renewable production.
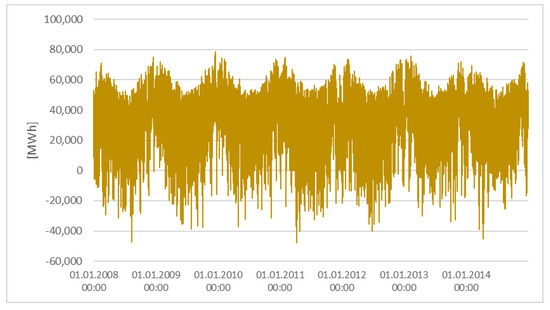
Figure 5.
Residual demand in the base model given the July 2023 energy mix.
Table 4.
German installed power generation in July 2023. All values in MW [11].
These derived capacity requirements allow for a view of the implications for resource demand. The capacity numbers for 2023 are summarized in Table 4. If we include the required renewables, we end up with the numbers in Table 5.
Table 5.
Adjusted German installed power generation in July 2023. All values in MW [11].
Of a demand of 21,317 MW in total, 6897 MW would be onshore wind power capacity, 1881 MW would be offshore wind power, and 12,540 MW would be solar power. Based on the sources and numbers from Section 2 and Section 3.2, we obtain a rough idea of the costs and raw material demand (see Table 6), e.g., over 1700 new onshore windmills would be required. The total costs of this transformation would be estimated at 21.69 bn EUR (ceteris paribus).
Table 6.
Costs and raw material demand [19].
Regarding wind power, we talk of a required net growth of installed capacity of 1200 MW per year, which is approximately the rate in 2023, ignoring the growth needed for charging electric vehicles, general demand growth, e.g., caused by the debate about de-risking (i.e., battery and chip production in Germany) and the increase in the renewable share in general.
With the numbers stated above, the consequences of an overcapacity in terms of investment and resource demand are shown. Thereby, the fact that the increase in resource demand is likely to increase, their prices are ignored. Effects on the energy demand are ignored as well, although [20] argue that this increase in resource demand will increase global energy demand as well.
Therefore, doubling the renewables will mean that the cost will be multiplied by a factor of two or more. Even if we assume a linear relationship, we talk about EUR 82 billion (bn) (factor 3.79) or EUR 237 bn (factor 10.92), ignoring further costs, e.g., for batteries, as described above. We can conclude that this renewable-only approach is not going to work and that at least for a certain residual part, we need a flexible solution, which in the short term—due to the absence of alternative options—has to be natural gas supported by pumped hydro storage.
If we structure the hourly demand using only the sources of the system, i.e., fossil fuels, we end up with the numbers in Table 7; for all tested years, the fossil share was above 14%. Note that based on the 2023 installed capacity, we assume a capacity of 22,934 MW for biomass and water-based power, which we always use first and consider to be available. Effectively, this is not true and may increase the share of fossil power generation even more. This illustrates that without an effective storage solution, we will still end up with a high fossil share, even if we overshoot the annual demand. Diversification is needed, as well as an efficient seasonal storage approach or a solution to decarbonize the fossil power share (potentially CCS).
Table 7.
Demand, installed renewable power, and fossil fuels (TWh).
4.2. Flattening the Daily Demand Using Batteries
So far, in Germany, we operate on an hourly basis and assume that the daily structuring is performed by the system (i.e., fossil power sources), which is currently the reality. But there is a clear target and agenda in Germany, as well as in other parts of the world, to increase the amount of battery storage significantly. For the case of Texas it has already been shown that this has a positive effect on both energy transition and CO2 footprint [5]—although the production of batteries is very CO2- and resource-intensive and induces some bow wave problems. This is especially the case if the timing of constructing heat pumps, batteries, and renewable power capacities is not well matched. For this section, we choose a stepwise approach. First, we derive the costs and resource demand for batteries. Based on the above-described backtest, we can calculate the required capacity for the daily flattening of the heat pump demand (Case 1). In a second step, using the same methodology, we will analyze the case of the 100% renewable portfolio (Case 2). This gives us an insight into possible synergy effects.
Based on [5] we assume that a battery has an efficiency of 92% both for injection and withdrawal. As a consequence, from any produced quantity, after injection and withdrawal, only 84.62% is actually available, which makes our calculations slightly more complicated. Again, we use an easily replicable two-step approach; in the first step, we calculate the flat quantity given the daily production. Doing this, we can calculate the daily energy loss and reduce the flat quantity by the corresponding amount. This is not an exact 1:1 calculation, but since this is close to a theoretical perfect foresight scenario, it is already very idealized. In reality, the steering and optimization of a battery cluster is an important but complicated issue, but this is out of the scope of this paper. If batteries are used myopically, which may be the case for, e.g., household battery storage, there may be a notable social loss with respect to the system’s optimal steering. In Table 8, the respective maximum monthly numbers for the years 2008–2014 are given. In the last two columns, we compute the ratio of maximum withdrawal and maximum injection to the installed capacity of renewables in order to see how much battery capacity is needed. Thereby we see that you need between 20% and 40% battery capacity.
Table 8.
MW needed to flatten the daily production.
In the next step, we simulate the utilization of the storage to show the effectiveness and analyze the change compared to the simulated residual power demand in total. From Figure 6, we see that the assumed storage system is, in general, well-designed and able to provide the necessary structuring, especially in winter. Nevertheless, the loss of energy induces low levels in the nighttime.
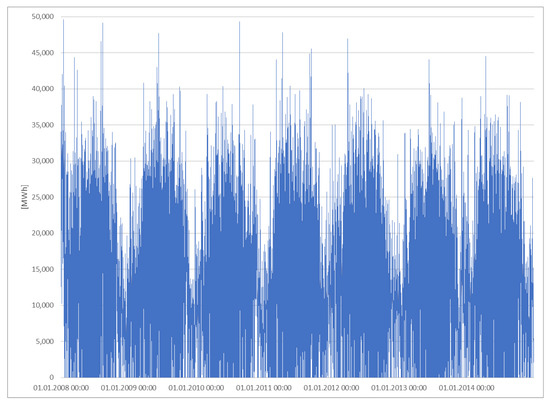
Figure 6.
Utilization of the battery storage system given historical demand data (Case 1).
The question is now how the power demand–supply balance, in general, is affected. For that, we analyze the peak residual demand, the peak surplus, and the total overproduction. One expected finding is that batteries reduce the overproduction in both peak capacity and non-utilized power, which will be an important factor for the hydrogen analysis in Section 4.3. However, peak demand is only marginally reduced—both regarding total quantity and required peak capacity (Table 9). While in the base case, our simulations show a demand of 78,630 MW, we now have a peak demand for other power generation of 77,876 MW in the simulation, thus only 1% less. Given the nature of the analysis, one may ask whether this is a significant effect after all. In addition, the effective renewable energy consumption decreases slightly, and the residual demand increases, which implies that it is likely that more fossil power generation is necessary. Again, the difference is small, so approximately, one can say that batteries imply no significant quantity effect, which is a somewhat surprising result.
Table 9.
Total aggregated demand and supply for the base case.
Finally, we add the numbers of scaling-up batteries and installing a corresponding number of renewables. We again use the methodology described at the beginning of this chapter, but this time consider the fully modeled renewable production. We end up with almost 49,540 MW of 7 h battery storage and a battery utilization pattern, as described in Figure 7. Now, we talk about an investment of 14.88 bn Euro and a CO2 bow wave of about 22 to 35 million tons. This already shows a more significant impact with regard to the necessary backup capacity (74,684 MW vs. 78,630 MW). Moreover, the overproduction is reduced; nevertheless, we see a decrease of 3.7% in the effective production of renewable energy (see Table 10).
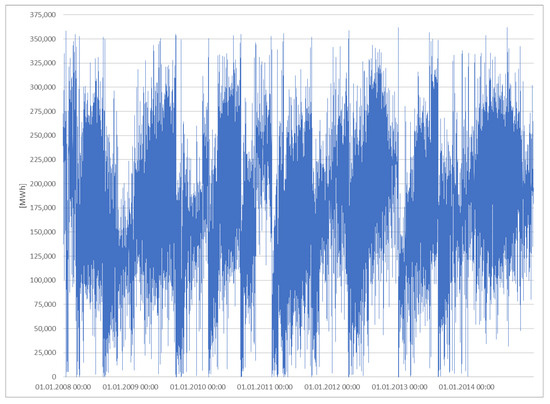
Figure 7.
Utilization of the battery storage system in the 100% renewable case (Case 2).
Table 10.
Total aggregated demand and supply in case of flattening the total renewable production.
As a consequence, we have to state an even strengthened counterintuitive effect of battery storage “wasting” renewable energy. This is mainly due to the aforementioned energy loss of almost 14%, which is completely eating up gross efficiency gains in renewable energy production. If battery storage would work without loss, we indeed would see a boost in production. Note that this conclusion is rather simplified and based on multiple assumptions; hence, it cannot be used as an argument against renewables and batteries. However, it highlights an important issue; a myopic and unstructured investment into batteries may lead to an inefficient infrastructure and may increase the total amount of wasted energy. Research efforts to develop an intelligent and adaptive system control are required to realize the benefits of a battery park.
If no residual fossil power generation is available, batteries are advantageous and required, as shown by our calculation of ensuring 100% supply only with renewables. However, in this scenario, the main advantage of batteries is them being the only remaining flexibility in the system. One may reduce the effect and turn it into a positive contribution using a more focused storage control, but this analysis is out of scope for this paper.
4.3. The Hydrogen Strategy Revised—Hydrogen/Natural Gas Mix
An alternative to batteries is to use H2 as a storage medium. We also include the possibility of decarbonizing the remaining share of power plants (which are needed for H2 anyway) by utilizing CCS, thereby following the portfolio approach for the transition pathway discussed in von [2]. Moreover, we now know the estimated costs of one alternative, namely, batteries.
The basic idea is as follows: for natural gas, there exists a significant storage and pipeline infrastructure. According to the German (European) grid regulation, up to a 10% hydrogen share is acceptable, despite, of course, potentially inducing some issues for old household connections and some industrial applications. Not every industrial plant is ready to work with a natural gas/hydrogen mixture, which means that a hydrogen removal unit may be necessary, especially if the share exceeds the 10% limit. It is also not proven that the gas network can be operated safely with a higher ratio of hydrogen. Additional investments may be needed. For more information regarding this topic, please refer to [21,22]. Moreover—like biogas—it is a reasonable approach to virtualize parts of the H2 logistics by injecting it into the natural gas grid and working with H2 certification, which disconnects the physical and contractual usage [23,24]. This would at least partly relax the situation if we base the analysis on the recent regulation and ignore further costs and efforts to improve the grid for higher hydrogen degrees. Moreover, in the sense of a diversification approach, one may compare the additional cost induced by the 95% case and the 100% case of Section 4.1 with the potential costs of these measures, whereby the costs of the H2 generation infrastructure have to be included as well.
Note that we also have to consider the positive synergies with the hydrogen strategy, which is beyond the scope of this work. In particular, increasing the wind share of the required capacity of Section 4.1 might contribute to the hydrogen targets; having more wind power increases the likelihood of excess power, which would then be available for hydrogen production.
As a first step, we ignore the storage issue since there are a lot of unsolved questions; large parts of the German storage capacity are depleted gas fields. In addition to the question of how a large hydrogen share will influence the capacity and dynamics of the storage, one must consider that there will be a lot of migration of the hydrogen in the first years (cushion gas) to the permanent gas in the storage, so 1 MW hydrogen injected will be mean less than 1 MW hydrogen withdrawn. In a virtual system, this is manageable, but in general, this needs to be analyzed. Research about how hydrogen can be stored in depleted gas fields still needs to be conducted.
We again consider the renewable power production from our model and aggregate our data to a monthly level. Let us also assume an electrolyzer efficiency of 70% [1] and a machine life of 20 years, which is a typical but nevertheless hydrogen-friendly assumption for leverage cost calculation. Then, we yield the hydrogen levels aggregated in Table 11 in MWh. Since in the summertime, physical consumption is generally flat within the month, a monthly granularity is sufficient for our analysis. Using data from [25] and the website of Trading Hub Europe, Germany’s virtual gas trading hub (URL: https://www.tradinghub.eu, accessed on 12 June 2024), we derive the numbers in Table 12.
Table 11.
Hydrogen production in MWh with surplus renewable energy.
Table 12.
Hydrogen production in major months with surplus renewable energy.
So, on average for the backtest period, 2008–2014, the ratio of hydrogen and gas is comfortably below 5%, but in the low-demand months, in which we have the highest solar intensity (June–August), we are at a peak above 10%. Moreover, in reality, the allocation is an issue, so locally, the degree of H2 may significantly exceed 10%. This effect could be managed since solar generation, which is the main driver of the surplus power generation, can be built more or less uniformly distributed across Germany. Nevertheless, one should note that the direct effect, i.e., the amount of H2 stored in the system, is quite low. We talk on average about approximately 23.55 TWh. On the other side of the balance sheet, we have to consider the loss of energy. As stated above, only 70% of the energy is transferred in H2. The loss of energy in re-converting the H2 to power is more complicated to estimate and depends on the use case. However, since we assume introducing H2 into the natural gas infrastructure, highly efficient cases like H2 cells can be neglected since this necessitates refining the H2 from the gas mix, which is linked with a significant energy loss. The best assumption is that the H2 is just burned in a modern power plant. If we assume that in this case, only modern highly efficient turbines are used with 50% efficiency, we end up with 35% of the original energy used in such a storage concept. This means that we can generate 12.28 TWh of power. This is only 1% of the fossil power needed, but more or less the green H2 target for 2030 in the German hydrogen strategy 2030. This highlights another dimension of the issue. We cannot easily replace fossil power if we want to balance and structure the system in the short run. Reality lies between this scenario and the 95% case scenario stated in the beginning if we want to replace fossil power generation in total. The alternative is to decarbonize a fraction for a period of 20 to 30 years via CCS. We do not consider resource availability issues but highlight that in a more detailed analysis, this is an important external factor for the transition strategy.
In the next step, we have to evaluate the costs. The use of the gas grid may be considered for free at first (also some investment to be H2 ready should be expected), but the installation of the required H2 generation capacity has to be calculated. Ref. [26] estimate the costs for a 70% electrolyzer to be around 500 EUR/kW. In our backtest, we see a peak power surplus of almost 48,000 MW in summer. Fueling respective electrolyzer capacities with this excess power would thus mean investment costs of EUR 16.8 bn. Adding the construction costs of windmills and solar panels (EUR 21.7 bn, see above), we end up at a total sum of about EUR 40 bn. Of course, H2 production can be increased by installing more renewables that partly replace fossil sources, and given the German target of 80% renewable share compared to the model share of approximately 36%, this would likely be the case. This would boost the overproduction, which can be then utilized for H2 production; as long as the power would be unused and therefore has a marginal cost of zero, we obtain an expensive but acceptable price, e.g., considering 50,000 MW of installed renewable capacity, given the 500 EUR/kW investment costs for the electrolyzer and calculating an aggregated efficiency of 35% (power → H2 → power), the leverage price of this power would be about 744 EUR/MWh since the units will be only utilized 96 h per year (see Table 13). This can be optimized to reduce the capacity for H2 generation not covering all peak days. Table 13 shows various scenarios depending on the amount of utilizable excess power.
Table 13.
Costs of the hydrogen, depending on installed capacity.
Therefore, we see in all cases a level far below 5000 average operation hours per year (mentioned in the current government’s hydrogen strategy), which is below any threshold in which hydrogen as a measure to prevent the loss of power makes sense.
If we install more renewables, it will provide more peak power supply but may also have more days in which we have excess power. Let us now consider the 95% renewable case, in which we scale the installation of each type by 3.792. Results are given in Table 14. We see that we are still below the 5000 average operating hours mentioned in the hydrogen strategy, which is not surprising since, all in all, the renewable production has 1430 usage hours.
Table 14.
Costs of hydrogen-generated power in the 95% renewables case.
If we assume 10,000 MW as the installed capacity, which would provide the highest degree of usage and a power price level that seems internationally competitive, we could replace merely 4% of the fossil stocks.
In total, we consider H2 not to be a realistic option, as long as natural gas is available and not extraordinarily expensive. If we now install seasonal overcapacity to reduce fossil fuels as much as possible, it can be analogously shown that a certain capacity is effective, but H2 is still too expensive to utilize peak power. More or less 20% of the potential excess capacity can be used for H2. These findings raise doubts about whether H2 can be a seasonal storage solution—at least with regard to a short- to medium-term time horizon. Finally, we must note that the findings are based on a number of simplifications and assumptions. However, these were mostly beneficial for the H2 case, so in reality, the costs are likely to be higher.
An alternative approach would be a 100% hydrogen infrastructure, which allows us to install more efficient fuel cell units, increasing efficiency from 50% to 70%. However, infrastructure investments, as well as high fuel cell costs, are likely to erase the gains in efficiency. While the first issue is complex and location-dependent, there is a lot of research about fuel cell technology and cost. High-end fuel cells generating electricity at efficiencies of 70% or higher degrees are estimated to have a range of about 65 USD/MWh to 87 USD/MWh leveraged cost of energy [27]. According to [27], assuming a EUR/USD exchange rate of 1.08, 5000 operating hours per year, and 20 years of operation, the 100% fuel cell options would add costs of between 18.24 and 15.37 EUR/MWh to the tables above. Hence, compared to the results in Table 14, we conclude that this approach would not provide a significant cost advantage and add additional questions about locations, time of availability, etc. without changing our general conclusions. Hence, we refrain from a more detailed discussion of this case.
4.4. Carbon Capture and Storage—A Mid-Term Solution for Structuring
We see in all scenarios described above that fossil power generation is needed in winter in order to structure demand and provide security of supply. Thereby, on average, we still have a share of fossil power generation of around 36%, assuming that we only install new renewables to meet additional demand for heat pumps. Nevertheless, due to the limited contribution of H2 and battery storage, we have a trade-off between installing a massive overcapacity and accepting a certain share of fossil fuels. Decarbonizing this share requires methods to capture and store carbon, i.e., CCS. This idea is not new [28] but in the last 20 years, CCS has faced considerable opposition both from the scientific [29] and political and emotional sides (especially in Germany and Central Europe). However, with the current EU regulation and investment initiatives in Norway underway, CCS has become a key element in emission reduction policy. That is why we also consider this case. Schmelz et al. [30] see CCS costs for sites in the United States of between 52 and 90 USD/t, depending on the form of storage, whereby we can expect a certain decrease in costs. Thereby, experts estimate costs of 2–14 USD/t for onshore transport in the United States and 15 USD/t CO2 for (onshore) storage [31,32]; thus, we yield (simplified) a range of 15 to 30 USD/t, or about 14 to 28 EUR/t at the current (2024) exchange rate. According to European project sources, storage cost and transportation are expected to be at 50 to 100 EUR/t for many locations, which corresponds to [32]. Therefore, we can work with a scenario range of 100 to 170 EUR/t CO2 for the full CCU chain (leverage cost-based) if we want to use decarbonized fossil power. For reasons of simplification, we assume 100% efficiency of the capturing. In reality, this will be 95% to 98%, and we would still have to invest some money in purchasing European emission allowances.
5. Discussion
One major finding of this paper is consistent with the results in the H2 case of [2]; the solution is not a single technology but a mix of different approaches, such as the gas grid combined with hydrogen injection, CCS, additional renewable capacity, and battery storage in large amounts. Given our calculations, this proves to be the only realistic option for the transformation of the German heating landscape toward heat pumps. This is because we not only have to replace the fuel but also the storage system of the fossil alternatives. Nevertheless, contrary to [2], we see a distinct tendency; as long as gas and coal are available, the best option is to use fossil power generation combined with CCS for structuring and providing the marginal demand. This is simply due to the fact that charging and using batteries consumes too much power; in addition, batteries prove to be only suitable for providing short-term flexibility. The often-promoted perfect fit of heat pumps and solar power for households is not working on an annual basis due to opposed seasonal patterns. Hydrogen, again, is too expensive in our calculation, despite rather favorable assumptions; we do not assume any cost either to adjust the gas grid to inject hydrogen or to utilize the hydrogen-rich natural gas. The installation of battery storage will be linked to massive adjustments as well. Also not considered but important is the water consumption of green hydrogen generation. Some locations will imply the usage of salt water. Desalination also consumes energy and will decrease the already low degree of effective usable energy. We will definitely need a hydrogen and battery infrastructure in the future, especially hydrogen as an alternative if gas becomes limited and expensive. This may be the case for Germany much earlier than for other countries due to political factors. This is—such as all disruptions—both a competitive disadvantage and a chance. Germany will need a strategy that focuses on industry sectors that can also survive under high energy prices.
Another issue is the timing of the transition strategy—especially from an environmental point of view. All measures described in this paper consume time and money, especially the CO2 transport infrastructure for CCS and the hydrogen infrastructure. Even utilizing the gas grid requires a considerable investment and a clear mid-term plan about where to locate the hydrogen clusters to ensure efficient production, given the local restrictions for the hydrogen/methane mixture (a problem we especially see come up in summertime). The latest hydrogen strategy involves plans for a 12,000 km grid until 2032, in which most of the capacity is probably taken from the current natural gas infrastructure. Next is the question of how to replace the gas, which is also a question of whether we are able to install the necessary H2 capacity to utilize such a grid (given the amount of gas needed). We see in our hydrogen analysis that hydrogen is expensive, even if the power is excess (renewable) power that would be lost otherwise if we consider full-cycle costs. This also implies the need for a certain amount of water desalination capacity. Even if we choose this way, the required adjustments and installation of required capacity will take years. This is also true for CCS. Currently, no transportation infrastructure is installed in all relevant countries. In the case of Germany, both a regulation for any CCS activity (currently this is prohibited) and an export framework are missing. Most CCS projects will be exploration projects. Thus, we have timelines of seven to eight years for large infrastructures such as CO2 pipelines and therefore all the timing and financing risk, which requires acceptance, despite all risks and problems, and a stable/adaptive investment environment. This is of course true for every part of the solution and especially one problem, namely, the current gap between energy prices and the necessary hydrogen price. This corresponds to the widely discussed risk of a dark lull. Our analysis shows that this can be handled only if we accept a certain fossil production and a backup capacity close to the current level. If we want to shut down all coal-fired power plants, this means investments in gas and hydrogen-based plants. Given the energy demand and efficiency loss, the latter option is minor. An open question is if it is necessary to step out of coal completely if we manage to speed up the implementation of CCS and use it in the decarbonization of power generation. Note that, due to the high CO2 coefficient here, CCS would be an absolutely necessary condition. From the point of view of risk diversification—especially regarding politics and logistics—coal should remain an option. This is an old idea that has already been described [28].
As mentioned above, an all-renewable solution would mean an extensive overcapacity. It has to be doubted whether the necessary financial resources are available and whether the resulting bow wave in terms of resource demand of CO2, human resources, and required production capacities is manageable. Considering our model assumptions for 2030, we see a considerable demand for investment and a lot of required measures not taken to that extent so far (and not even planned to be taken). In particular, the German and EU hydrogen strategy has to be revised; the electrolyzer capacity to store surplus power in the gas grid should be prioritized. This should be combined with the virtualization of the hydrogen market by using hydrogen certificates, which would also be a good approach to boosting hydrogen itself and the right approach to establishing a liquid tradable hydrogen market in the near future.
Finally, one has to consider that without subsidies and additional regulations, the price of European CO2 certificates is unlikely to increase and remain reliable at a level of 100 to 150 EUR/t, which is required to attract investments into CCS and hydrogen. Such a price scenario will slightly affect each of the scenarios discussed above but will not change the major finding, i.e., that a new inter-seasonal structuring solution must be implemented.
6. Conclusions
According to the current German government (Year 2024), up to 6 million heat pumps are to be installed by 2030. This article is concerned with how to supply the required (renewable) energy and at what costs—taking into account that the challenge is not only providing this additional energy but also delivering it on any day at any demand level. For natural gas, a well-designed storage infrastructure exists, which is to be substituted by heat pumps without an alternative for structuring. Various possibilities, such as batteries and hydrogen, are discussed. We show that the shift to heat pumps induces a need to redesign the energy production itself and use all available technologies, i.e., renewables, batteries, hydrogen, the natural gas system, and CCS, in an integrated manner to maximize success and reduce cost. Otherwise, we risk unnecessary investments by factors 4 to 10 or effectively increase the demand for fossil power, also on an annual level. Using synergy and portfolio effects among all these technologies and combining them is not only a key factor but from our point of view, the only way to success.
In the current debate, the technologies and corresponding political measures are discussed separately. Based on our analysis, integrated and portfolio-based planning has to be intensified. In particular, the hydrogen strategy should be adjusted, and the hydrogen/gas combination to store and distribute hydrogen via the gas grid has to be strengthened since we see this as a key factor and the most realistic measure within the timeline between 2030 and 2035. In addition, this seems to be the only post-gas solution. Alternatives such as a certain overcapacity and, especially, CCS combined with a high fossil share are less expensive. Other inter-seasonal battery storage still shows a low technology readiness level and is simply too expensive at current price levels. Moreover, their resource demand is considerable and not consistent with the target of reducing the long-term dependency on foreign fossils. CCS is cheaper than the alternatives regarding pure numbers but critical with respect to the time frame and the fact that we talk about an extensive and expensive new infrastructure. Thus, we remain doubtful in that direction since we do not see enough measures so far to believe that CCS can become a realistic option. The market lacks scalable seasonal battery technology with adequate market readiness and at reasonable costs so far [5]. Using conventional batteries would be highly inefficient.
Finally, please note that this article is not an exact forecast but is based on multiple assumptions. At this point, many effects cannot be quantified exactly, and technologies such as CCS have to be applied first in order to actually show costs and performance. The adequate combination of different technologies needs to be analyzed for different regions like southern Europe or the US individually. An important question is also the timing, since a quick and cheap 50% solution, plus postponing the perfect solution for some years, may work better from an intertemporal point of view than waiting for the expensive 100% solution that might come up in some years. The winning strategy is avoiding as much CO2 as possible for a given amount of money and spending as little money as possible for future solutions.
Author Contributions
Conceptualization, A.v.D. and S.S.; methodology, A.v.D. and S.S.; validation, A.v.D. and S.S.; formal analysis, A.v.D. and S.S.; investigation, A.v.D. and S.S.; resources, S.S.; data curation, A.v.D. and S.S.; writing—original draft preparation, A.v.D. and S.S.; writing—review and editing, A.v.D. and S.S.; visualization, A.v.D.; supervision, A.v.D. and S.S.; project administration, S.S. All authors have read and agreed to the published version of the manuscript.
Funding
This research received no external funding.
Data Availability Statement
The data presented in this study are available on request from the corresponding author. The data are not publicly available due to legal reasons.
Conflicts of Interest
This article solely represents the personal views of the authors, especially of Andreas von Döllen, and not necessarily the position of the Wintershall Dea AG, the employer of Andreas von Döllen. The company has not been involved in the research at all.
References
- BMBF (2023a) Federal Ministry for Economic Affairs and Climate Action. The National Hydrogen Strategy. Available online: https://www.bmbf.de/bmbf/shareddocs/downloads/files/bmwi_nationale-wasserstoffstrategie_eng_s01.pdf?__blob=publicationFile&v=2 (accessed on 12 June 2024).
- von Döllen, A.; Hwang, Y.S.; Schlüter, S. The Future is Colorful—An Analysis of the CO2 Bow Wave and Why Green Hydrogen Cannot Do It Alone. Energies 2021, 14, 5720. [Google Scholar] [CrossRef]
- Ganzer, C.; Pratama, Y.W.; Dowell, N.M. The role and value of inter-seasonal grid-scale energy storage in net zero electricity systems. Int. J. Greenh. Gas Control 2022, 120, 103740. [Google Scholar] [CrossRef]
- Albertus, P.; Manser, J.S.; Litzelman, S. Long-Duration Electricity Storage Applications, Economics, and Technologies. Joule 2020, 4, 21–32. [Google Scholar] [CrossRef]
- Armstrong, R.; Chiang, Y.-M.; Grünspecht, H.; Brushett, F.; Deutch, J.; Engelkemier, S.; Gençer, E.; Jaffe, R.; Joskow, P.; Mallapragada, D.; et al. The Future of Energy Storage; MIT Energy Initiative, Massachusetts Institute of Technology: Cambridge, MA, USA, 2022. [Google Scholar]
- Papadakis, C.N.; Fafalakis, M.; Katsaprakakis, D. A Review of Pumped Hydro Storage Systems. Energies 2023, 16, 4516. [Google Scholar] [CrossRef]
- Ruhnau, O.; Hirth, L.; Praktiknjo, A. Time Series of Heat Demand and Heat Pump Efficiency for Energy System Modeling. Nat. Sci. Data 2019, 6, 189. [Google Scholar] [CrossRef] [PubMed]
- Reichel, C.; Müller, A.; Friedrich, L.; Herceg, S.; Mittag, M.; Neuhaus, D.H. CO2 Emissions Of Silicon Photovoltaic Modules—Impact of Module Design and Production Location. In Proceedings of the WCPEC-8, 8th World Conference on Photovoltaic Energy Conversion, Milan, Italy, 26–30 September 2022. [Google Scholar]
- Umweltbundesamt. (2023) Photovoltaik. Available online: https://www.umweltbundesamt.de/themen/klima-energie/erneuerbare-energien/photovoltaik#photovoltaik (accessed on 12 June 2024).
- BMBF (2023b) Federal Ministry for Economic Affairs and Climate Action (2023a). Neuer Schwung für Erneuerbare Energien. Available online: https://www.bmwk.de/Redaktion/DE/Infografiken/Schlaglichter/2022/10/05-neuer-schwung-fuer-erneuerbare-energien-download.pdf?__blob=publicationFile&v=1 (accessed on 12 June 2024).
- SMARD. (2023) Energy Market Data Provided by the Bundesnetzagentur. Available online: https://www.smard.de/home/downloadcenter/download-marktdaten/?downloadAttributes=%7B%22selectedCategory%22:1,%22selectedSubCategory%22:3,%22selectedRegion%22:false,%22selectedFileType%22:%22XLSX%22,%22from%22:1627596000000,%22to%22:1627682399999%7D (accessed on 12 June 2024).
- OPSD (2023) Open Power System Data—A Free and Open Platform for Power System Modelling. Available online: https://open-power-system-data.org/ (accessed on 12 June 2024).
- Watson, S.D.; Crawley, J.; Lomas, K.J.; Buswell, R.A. Predicting Future GB Heat Pump Electricity Demand. Energy Build. 2023, 286, 112917. [Google Scholar] [CrossRef]
- Kost, C.; Shammugam, S.; Fluri, V.; Peper, D.; Memar, A.D.; Schlegl, T. Levelized Cost of Electricity Renewable Energy Technologies. In Fraunhofer Institute for Solar Energy Systems ISE Working Paper; Fraunhofer Institute for Solar Energy Systems ISE: Freiburg, Germany, 2021. [Google Scholar]
- Jean, J.; Brown, P.R.; Jaffe, R.L.; Buonassisi, T.; Bulović, V. Pathways for solar photovoltaics. Energy Environ. Sci. 2015, 8, 1200–1219. [Google Scholar] [CrossRef]
- Destatis Statistisches Bundesamt. Umweltökonomische Gesamtrechnung, Berichtszeitraum 2000–2020; Deutsches Statistisches Bundesamt: Wiesbaden, Germany, 2022; Available online: https://www.destatis.de/DE/Themen/Gesellschaft-Umwelt/Umwelt/UGR/private-haushalte/Publikationen/Downloads/haushalte-umwelt-pdf-5851319.pdf?__blob=publicationFile (accessed on 12 June 2024).
- Lavoie, M. Post-Keynesian Economics: New Foundations; Edward Elgar Publishing: Gloucestershire, UK, 2022. [Google Scholar]
- Destatis Statistisches Bundesamt. Press Release No. N 012 of 1 March 2023; Deutsches Statistisches Bundesamt: Wiesbaden, Germany, 2023; Available online: https://www.destatis.de/DE/Presse/Pressemitteilungen/2023/03/PD23_N012_43.html (accessed on 12 June 2024).
- Carrara, S.; Alves Dias, P.; Plazzotta, B.; Pavel, C. Raw Materials Demand for Wind and Solar PV Technologies in the Transition towards a Decarbonised Energy System; Publication Office of the European Union: Luxembourg, 2020; EUR 30095 EN. [Google Scholar]
- Elshkaki, A.; Graedel, T.E.; Ciacci, L.; Reck, B.K. Resource demand scenarios for the major metals. Environ. Sci. Technol. 2018, 52, 2491–2497. [Google Scholar] [CrossRef] [PubMed]
- Gondal, I.A. Hydrogen integration in power-to-gas networks. Int. J. Hydrogen Energy 2019, 44, 1803–1815. [Google Scholar] [CrossRef]
- Bard, J.; Gerhardt, N.; Selzam, P.; Beil, M.; Wiemer, M.; Buddensiek, M. The Limitations of Hydrogen Blending in the European Gas Grid; Fraunhofer Institute for Energy Economics and Energy System Technology: Kassel, Germany, 2022; Available online: https://www.iee.fraunhofer.de/content/dam/iee/energiesystemtechnik/en/documents/Studies-Reports/FINAL_FraunhoferIEE_ShortStudy_H2_Blending_EU_ECF_Jan22.pdf (accessed on 12 June 2024).
- Mould, K.; Silva, F.; Knott, S.; O’Regan, B. A comparative analysis of biogas and hydrogen, and the impact of the certificates and blockchain new paradigms. Int. J. Hydrogen Energy 2022, 47, 39303–39318. [Google Scholar] [CrossRef]
- White, L.; Fazeli, R.; Cheng, W.; Aisbett, E.; Beck, F.J.; Baldwin, K.G.H.; Howarth, P.; O’Neill, L. Towards emissions certification systems for international trade in hydrogen: The policy challenge of defining boundaries for emissions accounting. Energy 2021, 215, 119139. [Google Scholar] [CrossRef]
- Bundesnetzagentur (2023) Rückblick: Gasversorgung im Jahr 2022. Available online: https://www.bundesnetzagentur.de/DE/Gasversorgung/a_Gasversorgung_2022/start.html (accessed on 12 June 2024).
- Holst, M.; Aschbrenner, S.; Smolinka, T.; Voglstätter, C.; Grimm, G. Cost Forecast for Low Temperature Electrolysis-Technology Driven Bottom-up Prognosis for PEM and Alkaline Water Electrolysis Systems; Fraunhofer Institute for Solar Energy Systems ISE: Freiburg, Germany, 2021. [Google Scholar]
- Chan, C.Y.; Rosner, F.; Samuelsen, S. Techno-Economic Analysis of Solid Oxide Fuel Cell-Gas Turbine Hybrid Systems for Stationary Power Applications Using Renewable Hydrogen. Energies 2023, 16, 4955. [Google Scholar] [CrossRef]
- Ansolabehere, S.; Beer, J.; Deutch, J.; Ellerman, D.; Friedmann, S.J.; Herzog, H.; Jacoby, H.; Joskow, P.; Mcrae, G.; Lester, R.; et al. Future of Coal; MIT Energy Initiative, Massachusetts Institute of Technology: Cambridge, MA, USA, 2007. [Google Scholar]
- Zoback, M.; Smit, D. Meeting the challenges of large-scale carbon storage and hydrogen production. Proc. Natl. Acad. Sci. USA 2023, 120, e2202397120. [Google Scholar] [CrossRef] [PubMed]
- Schmelz, W.J.; Hochman, G.; Miller, K.G. Total cost of carbon capture and storage implemented at a regional scale: Northeastern and midwestern United States. Interface Focus 2020, 10, 20190065. [Google Scholar] [CrossRef] [PubMed]
- Stern, A.; Berghout, N. Is Carbon Capture to Expensive; International Energy Agency: Paris, France, 2021; Available online: https://www.iea.org/commentaries/is-carbon-capture-too-expensive (accessed on 12 June 2024).
- Lockwood, T. Mapping the Cost of Carbon Capture and Storage in Europe; Clean Air task Force: Boston, MA, USA, 2023; Available online: https://www.catf.us/2023/02/mapping-cost-carbon-capture-storage-europe/ (accessed on 12 June 2024).
Disclaimer/Publisher’s Note: The statements, opinions and data contained in all publications are solely those of the individual author(s) and contributor(s) and not of MDPI and/or the editor(s). MDPI and/or the editor(s) disclaim responsibility for any injury to people or property resulting from any ideas, methods, instructions or products referred to in the content. |
© 2024 by the authors. Licensee MDPI, Basel, Switzerland. This article is an open access article distributed under the terms and conditions of the Creative Commons Attribution (CC BY) license (https://creativecommons.org/licenses/by/4.0/).