Article

The Impact of Temperature on the Performance and Reliability of Li/SOCl2 Batteries

1
School of Measurement and Communication Engineering, Harbin University of Science and Technology, Harbin 150080, China
2
Yantai Dongfang Wisdom Electric Co., Ltd., Yantai 264000, China
*
Author to whom correspondence should be addressed.
Energies 2024, 17(13), 3063; https://doi.org/10.3390/en17133063
Submission received: 8 December 2023 / Revised: 18 June 2024 / Accepted: 19 June 2024 / Published: 21 June 2024
(This article belongs to the Section D2: Electrochem: Batteries, Fuel Cells, Capacitors)

Abstract

:
The performance and reliability of lithium thionyl chloride (Li/SOCl2) batteries are significantly affected by temperature, but the reliability level and failure mechanisms of Li/SOCl2 batteries remain unclear. In this study, Weibull distribution statistics were used to infer the life expectancy of Li/SOCl2 batteries at different temperatures. Additionally, the battery failure mechanism was analyzed using electrochemical impedance spectroscopy (EIS). It is found that under the discharge condition of 7.5 kΩ load, the mean time between failures (MTBF) and reliable life of the battery decreased with increasing operating temperature. Under the discharge condition of 750 Ω load, the MTBF of the battery peaked at 60 °C. Furthermore, the influence of temperature on the voltage output characteristics of Li/SOCl2 batteries and the voltage hysteresis were analyzed. Both the battery output voltage and the hysteresis effect increased with rising temperature. This is because high temperature accelerates internal battery reactions, thus altering the formation process of the passivation film on the lithium metal negative electrode.

1. Introduction

Li/SOCl2 primary batteries have high and stable operating voltage (3.67 V), a wide operating temperature range (−55 to 80 °C), and high energy density (590 Wh/kg). As a result, Li/SOCl2 batteries are widely used as backup power sources in smart instruments, aerospace, transportation, and military equipment [1]. However, under high-temperature operating conditions, the performance of Li/SOCl2 batteries, such as discharge capacity, battery impedance, and is known to degrade. After being stored at high temperatures, the batteries could experience voltage hysteresis and poor performance during high-current discharge, which can affect the overall performance of Li/SOCl2 batteries.
Electrochemical impedance spectroscopy (EIS) is an effective method for studying battery reaction mechanisms, as its rich information response can identify the characteristics of various electrochemical phenomena in a wide range of variable systems [2,3]. Song et al. found that the mesopores in the cathode of Li/SOCl2 batteries had a significant impact on the discharge capacity, while the large pores on the cathode surface affected the discharge performance at high discharge rates. The ratio of mesopores to large pores in the cathode was a key factor in improving the discharge performance of Li/SOCl2 batteries [4]. Lee et al. proposed that the crystalline deposition of lithium chloride on the carbon cathode formed a dense layer, which hindered the diffusion process of SOCl2 and affected the battery’s discharge capacity and voltage [5]. Cheng et al. conducted research showing that the capacity of Li/SOCl2 batteries stored at different temperatures weakened over time, and the higher the aging temperature, the more significant the capacity reduction. In addition, impedance spectra at different temperatures exhibited similar characteristics, indicating the presence of the same degradation mechanism [6,7].
Ye et al. studied the capacity prediction and reliability of Li/SOCl2 batteries for smart metering based on a capacity degradation model. They introduced the capacity degradation mechanism of backup lithium batteries for smart meters [8]. Chen, Y. et al. proposed evaluating the health status of the system by using voltage as a degradation indicator based on the study of the degradation mechanism of lithium primary batteries. They employed a particle filter (PF) based method to estimate the degradation state and predicted the remaining useful life (RUL) [9]. From the perspective of critical battery materials, failure factors can be analyzed. The main causes of failure include degradation and failure of various critical materials such as positive electrode materials, negative electrode materials, separators, electrolytes, and current collectors [10,11,12].
When lithium contacts the electrolyte, an LiCl film is formed, which can be divided into a dense layer and a sparse layer. The growth rate of the sparse layer depends on temperature, electrolyte concentration, and electrolyte additives [13]. Li et al. pointed out that LiCl precipitation can be considered as the main aging process and the major product of capacity decay [14]. The formation of passivation film is the main process of capacity decay during open circuit storage of Li/SOCl2 batteries. Ziesche et al. revealed that the main reason for capacity loss during discharge at higher currents is the diffusion rate of lithium within the cathode. The higher current forced the chemical reaction between lithium and thionyl chloride, forming solid sulfur, which hinders the diffusion channels of the porous supporting carbon framework and reduces the diffusion rate of lithium. Therefore, unreacted SOCl2 stored in the internal cathode region cannot participate in the reaction [15]. Carmier et al. studied the variation of carbon cathode porosity during the discharge of Li/SOCl2 batteries and found that in most cases, the discharge ended when the pores of the porous carbon cathode were blocked or restricted by the product LiCl. Moreover, the smaller the discharge current, the more severe the blocking of the porous carbon cathode [16,17]. Research by others has found that the failure of Li/SOCl2 batteries at 200 °C is due to the escape of SOCl2, the generation of gas, poor battery sealing, and severe self-discharge reactions at high temperatures [18]. Despite this progress, there is limited research on the effects of temperature and current on battery output characteristics, and the impact of voltage hysteresis on batteries is not clear.
In this study, we analyze the impact of temperature and discharge current on Li/SOCl2 battery life through statistical analysis. We also present the statistical inference of battery life under the Weibull distribution and investigate the influence of temperature, current, and aging time on the loaded capacity of the battery. Furthermore, we analyze the impact of temperature on the voltage hysteresis of the battery and study the effect of temperature and current on the failure mechanism of the battery based on EIS analysis.

2. Battery Test Plan

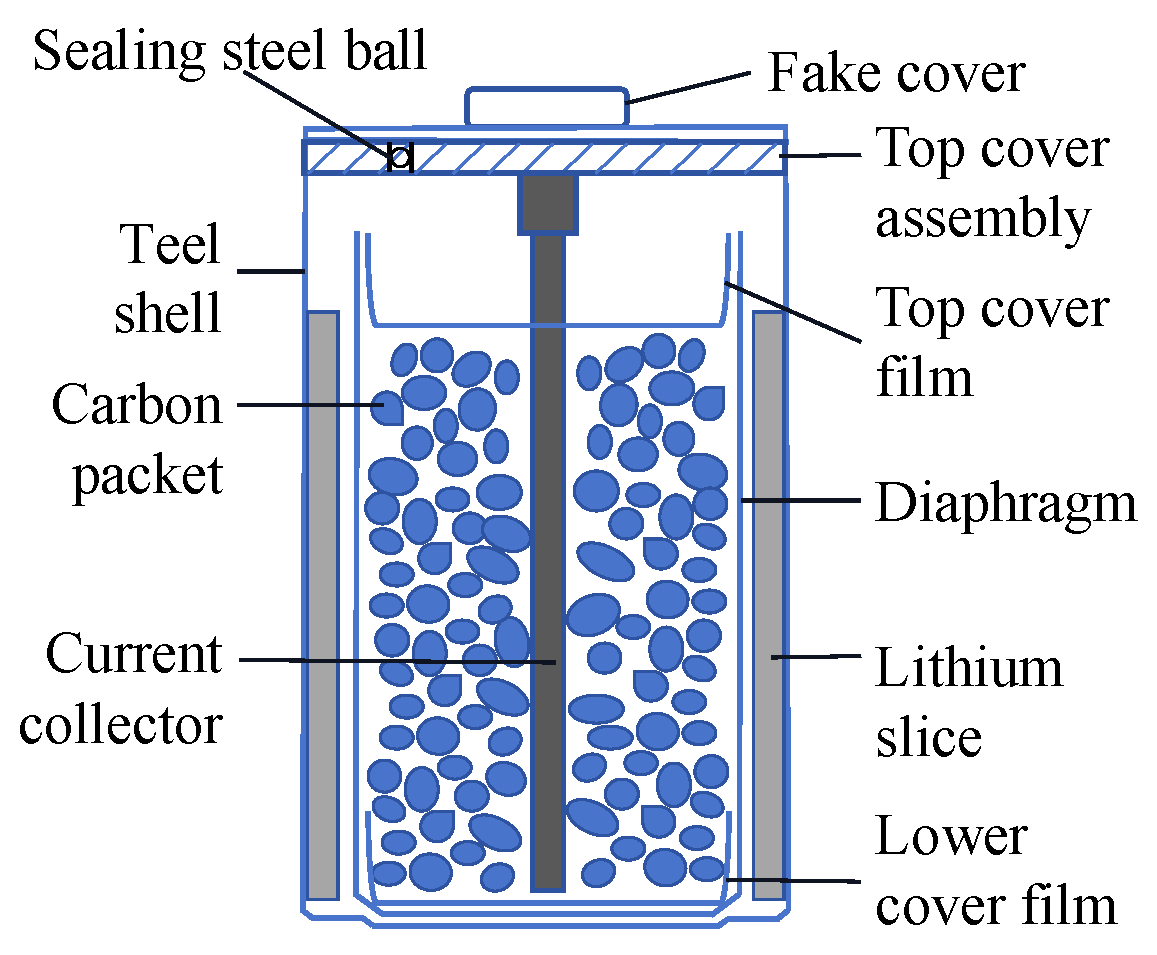
2.1. Battery Samples

The Li/SOCl2 battery model is ER14250, cylindrical in shape, with an open circuit voltage of 3.67 V, a rated capacity of 1200 mAh, and a maximum sustainable discharge current of 15 mA. The structure of the Li/SOCl2 battery is shown in Figure 1, where, the negative electrode is lithium foil, and the positive electrode is composed of SOCl2 as the active material, carbon black as the conductive agent, with polytetrafluoroethylene (PTFE) as the binder. High-purity lithium tetrachloroaluminate is used as the electrolyte. The reaction principle of the Li/SOCl2 battery is:
Negative electrode: 4Li − 4e = 4Li+.
Positive electrode: 2SOCl2 + 4e = 4Cl.
Total reaction: 4Li + 2SOCl2 = 4LiCl + S + SO2.
The generated sulfur dioxide dissolves in excess thionyl chloride electrolyte.

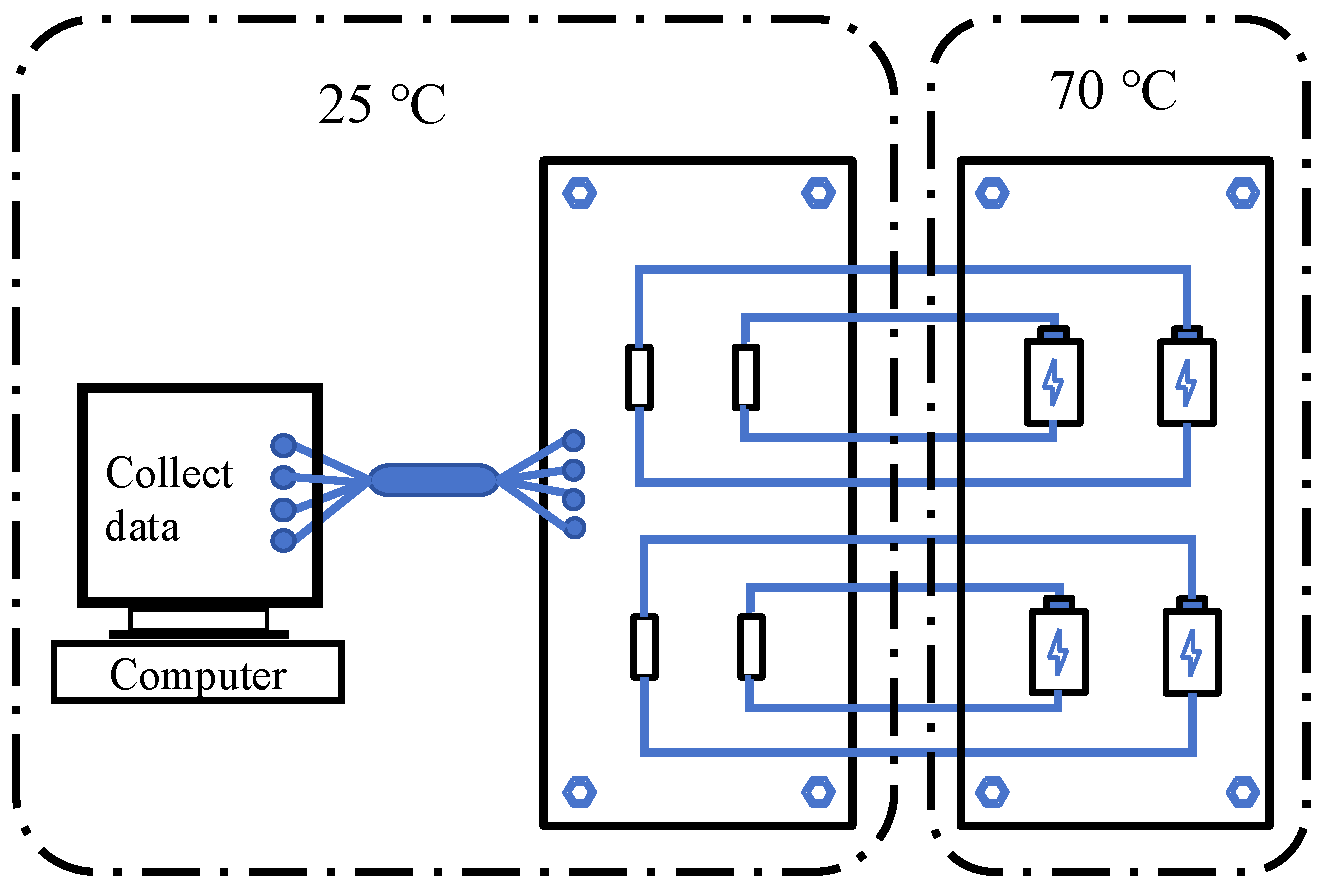
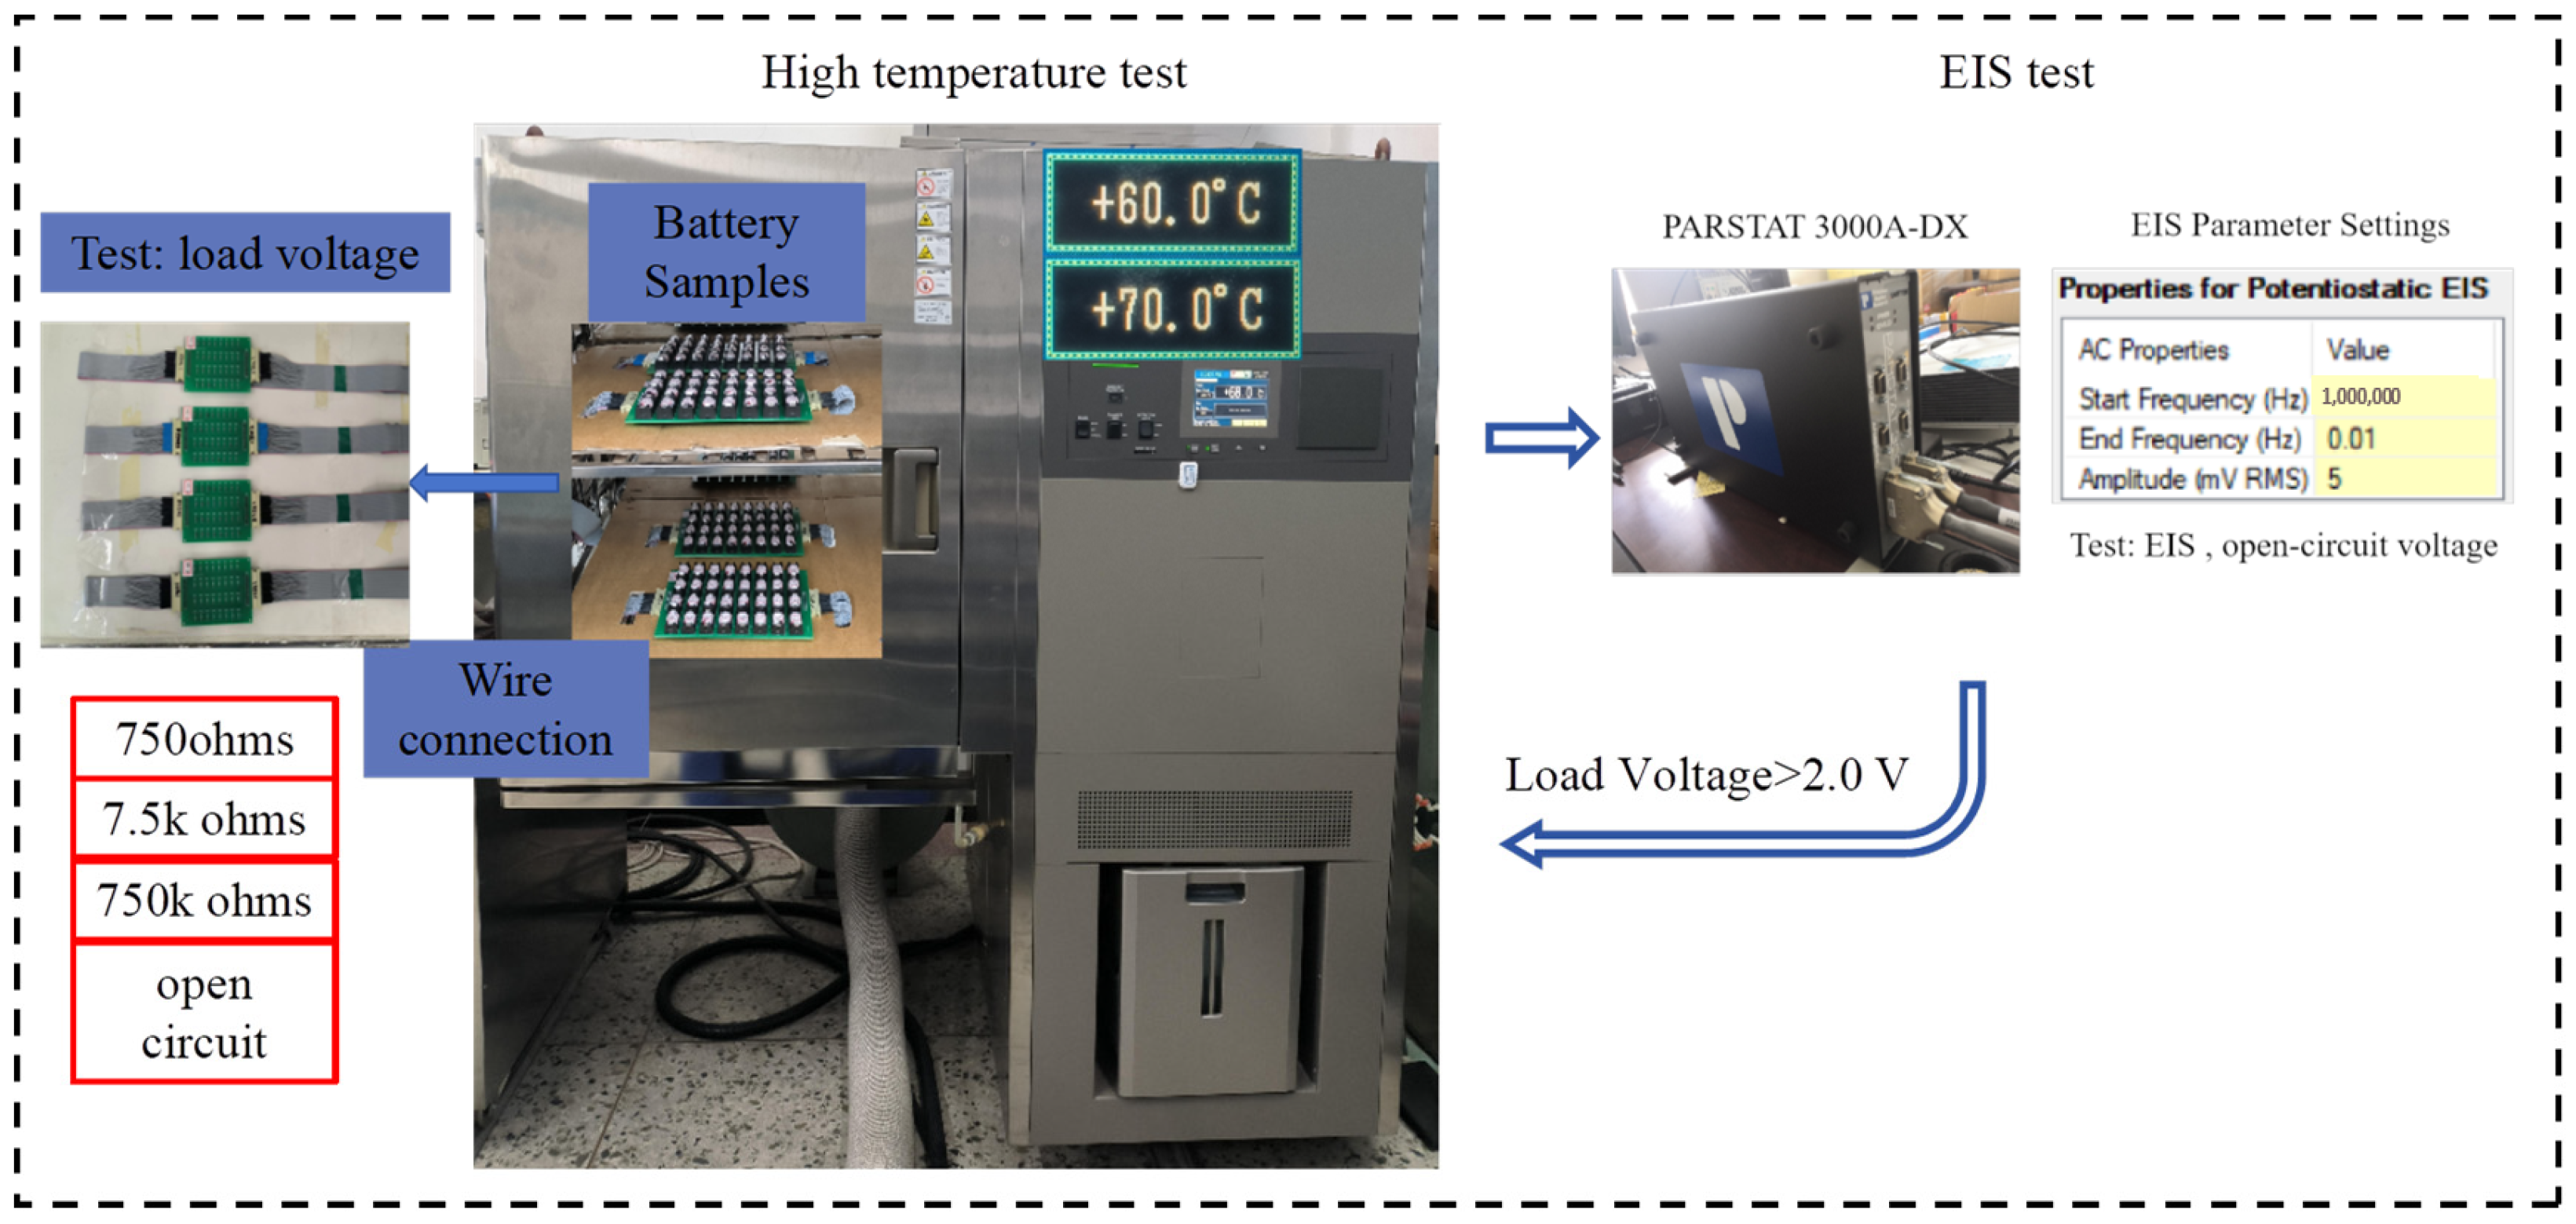
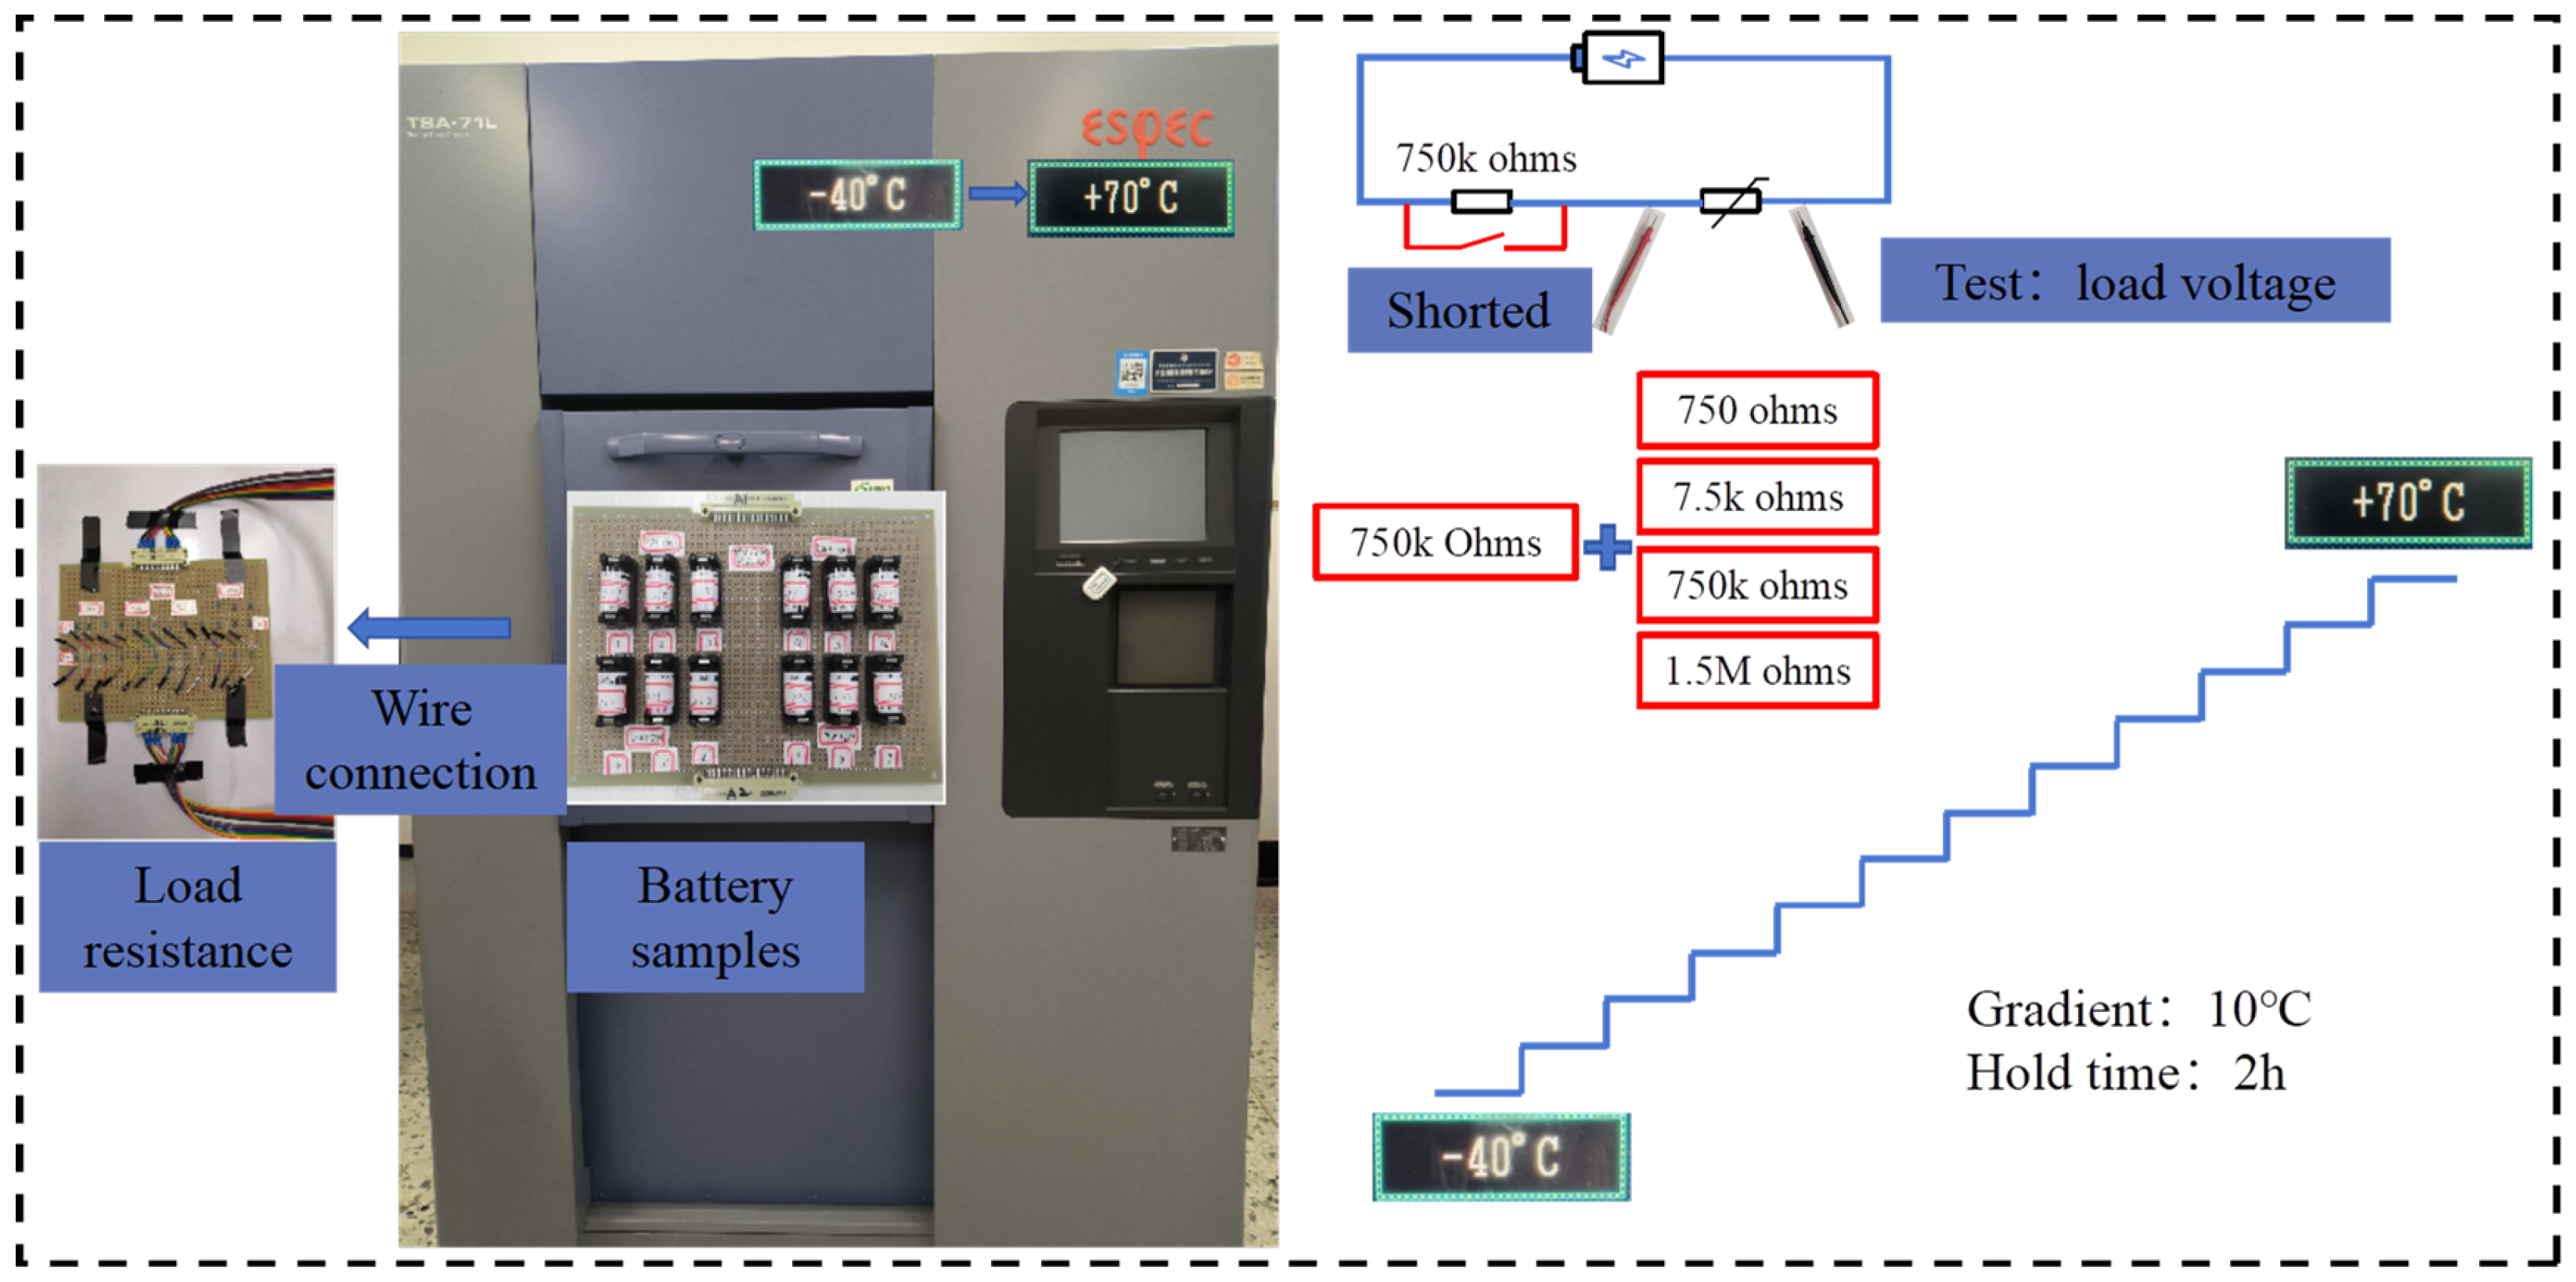
2.2. High-Temperature Battery Discharge Test

The Li/SOCl2 battery is connected in series with a load resistor R to construct a discharge circuit where the voltage across the load resistor R is monitored. The principle is shown in Figure 2.
Considering that the discharge current directly affects the battery’s lifespan, three different load resistor levels were chosen for the discharge tests: 750 Ω, 7.5 kΩ, and 750 kΩ. In addition, three temperature stress levels were selected: 70 °C, 60 °C, and 25 °C. A total of 216 battery samples were measured, and the number of samples for each combination of test conditions is shown in Table 1.
The principle of battery life testing at different temperatures is shown in Figure 3. The experimental device used for conducting the tests is a three-compartment temperature test chamber, as shown in Figure 4.

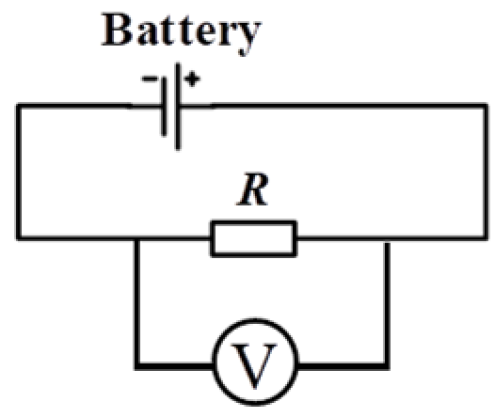
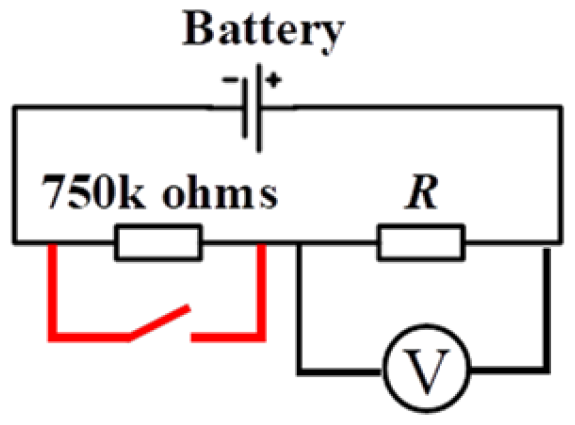
2.3. Battery Load Capacity Test

During the experiment, the battery load capacity test is conducted. A 750 kΩ resistor is used as the holding resistor to ensure consistency of the battery during the temperature characteristic process. The 750 kΩ holding resistor is shorted first, and then the load voltage test is conducted. The schematic of the test is shown in Figure 5. The test conditions and sample information are provided in Table 2.
The experimental device used for conducting the tests is a high and low-temperature shock test chamber, as shown in Figure 6.

2.4. Battery EIS Testing

The battery EIS test is conducted using the Princeton Applied Research 3000A-DX analyzer. The EIS test is carried out at intervals during the high-temperature battery discharge test. After removing the samples, they are allowed to stabilize at room temperature for 2 h before the EIS test is performed. The testing plan and equipment are shown in Figure 7 with the equipment shown in Figure 4.

3. Statistical Analysis of Battery Life at Different Temperatures

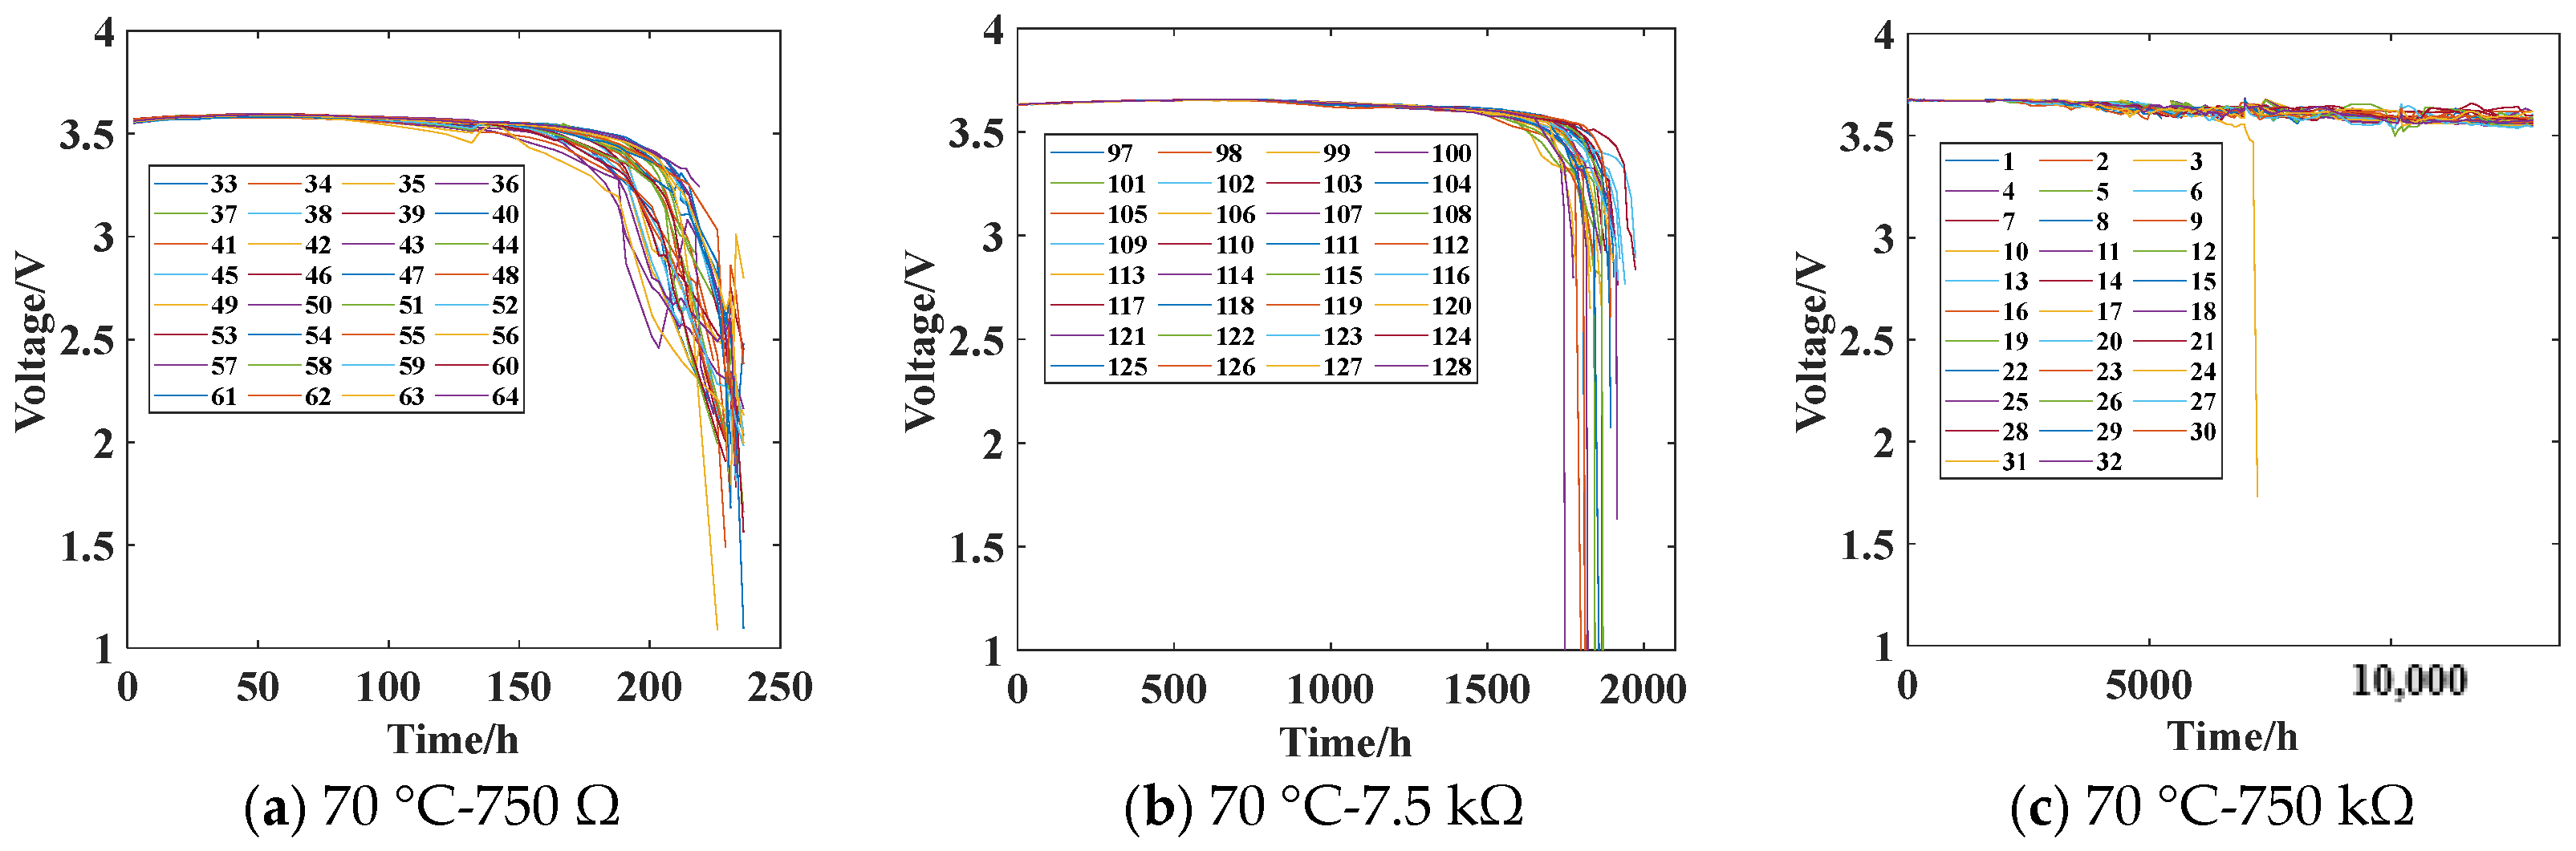
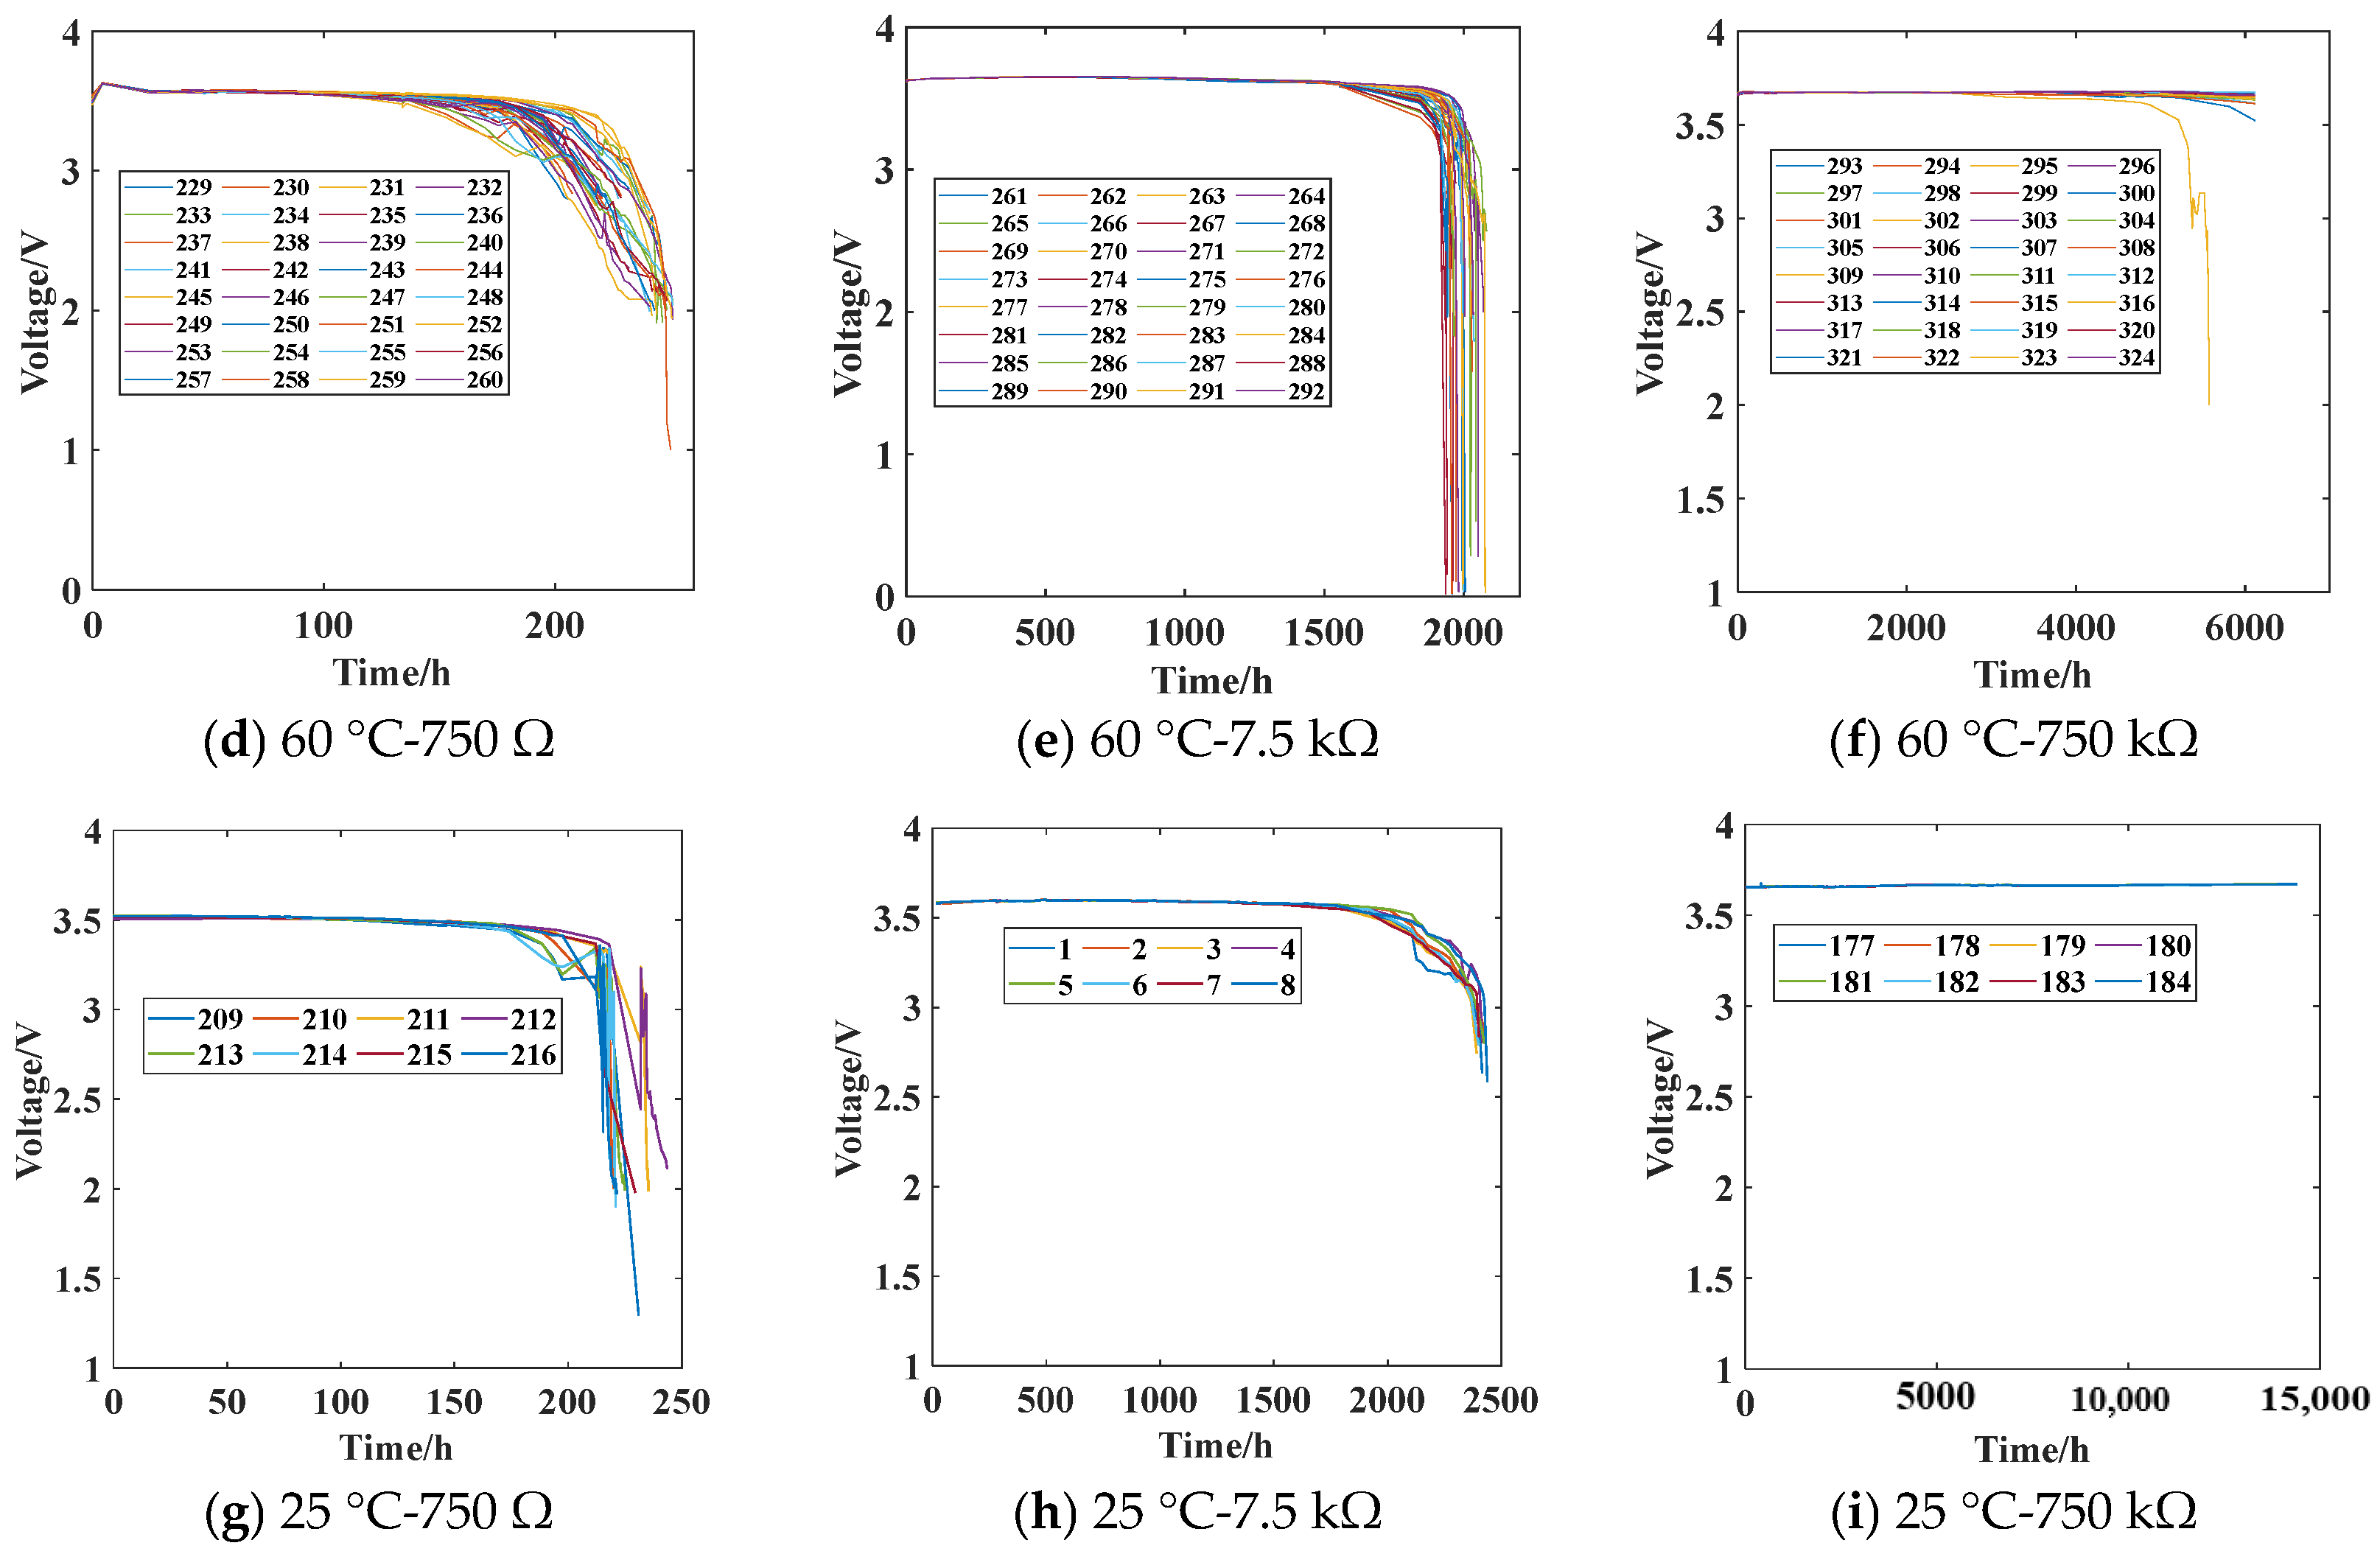
3.1. Battery Discharge Test Data

The battery discharge test is conducted according to the experimental plan outlined in Table 1. The voltage across the load resistor of the battery is continuously monitored to obtain the battery discharge test data, as shown in Figure 8.

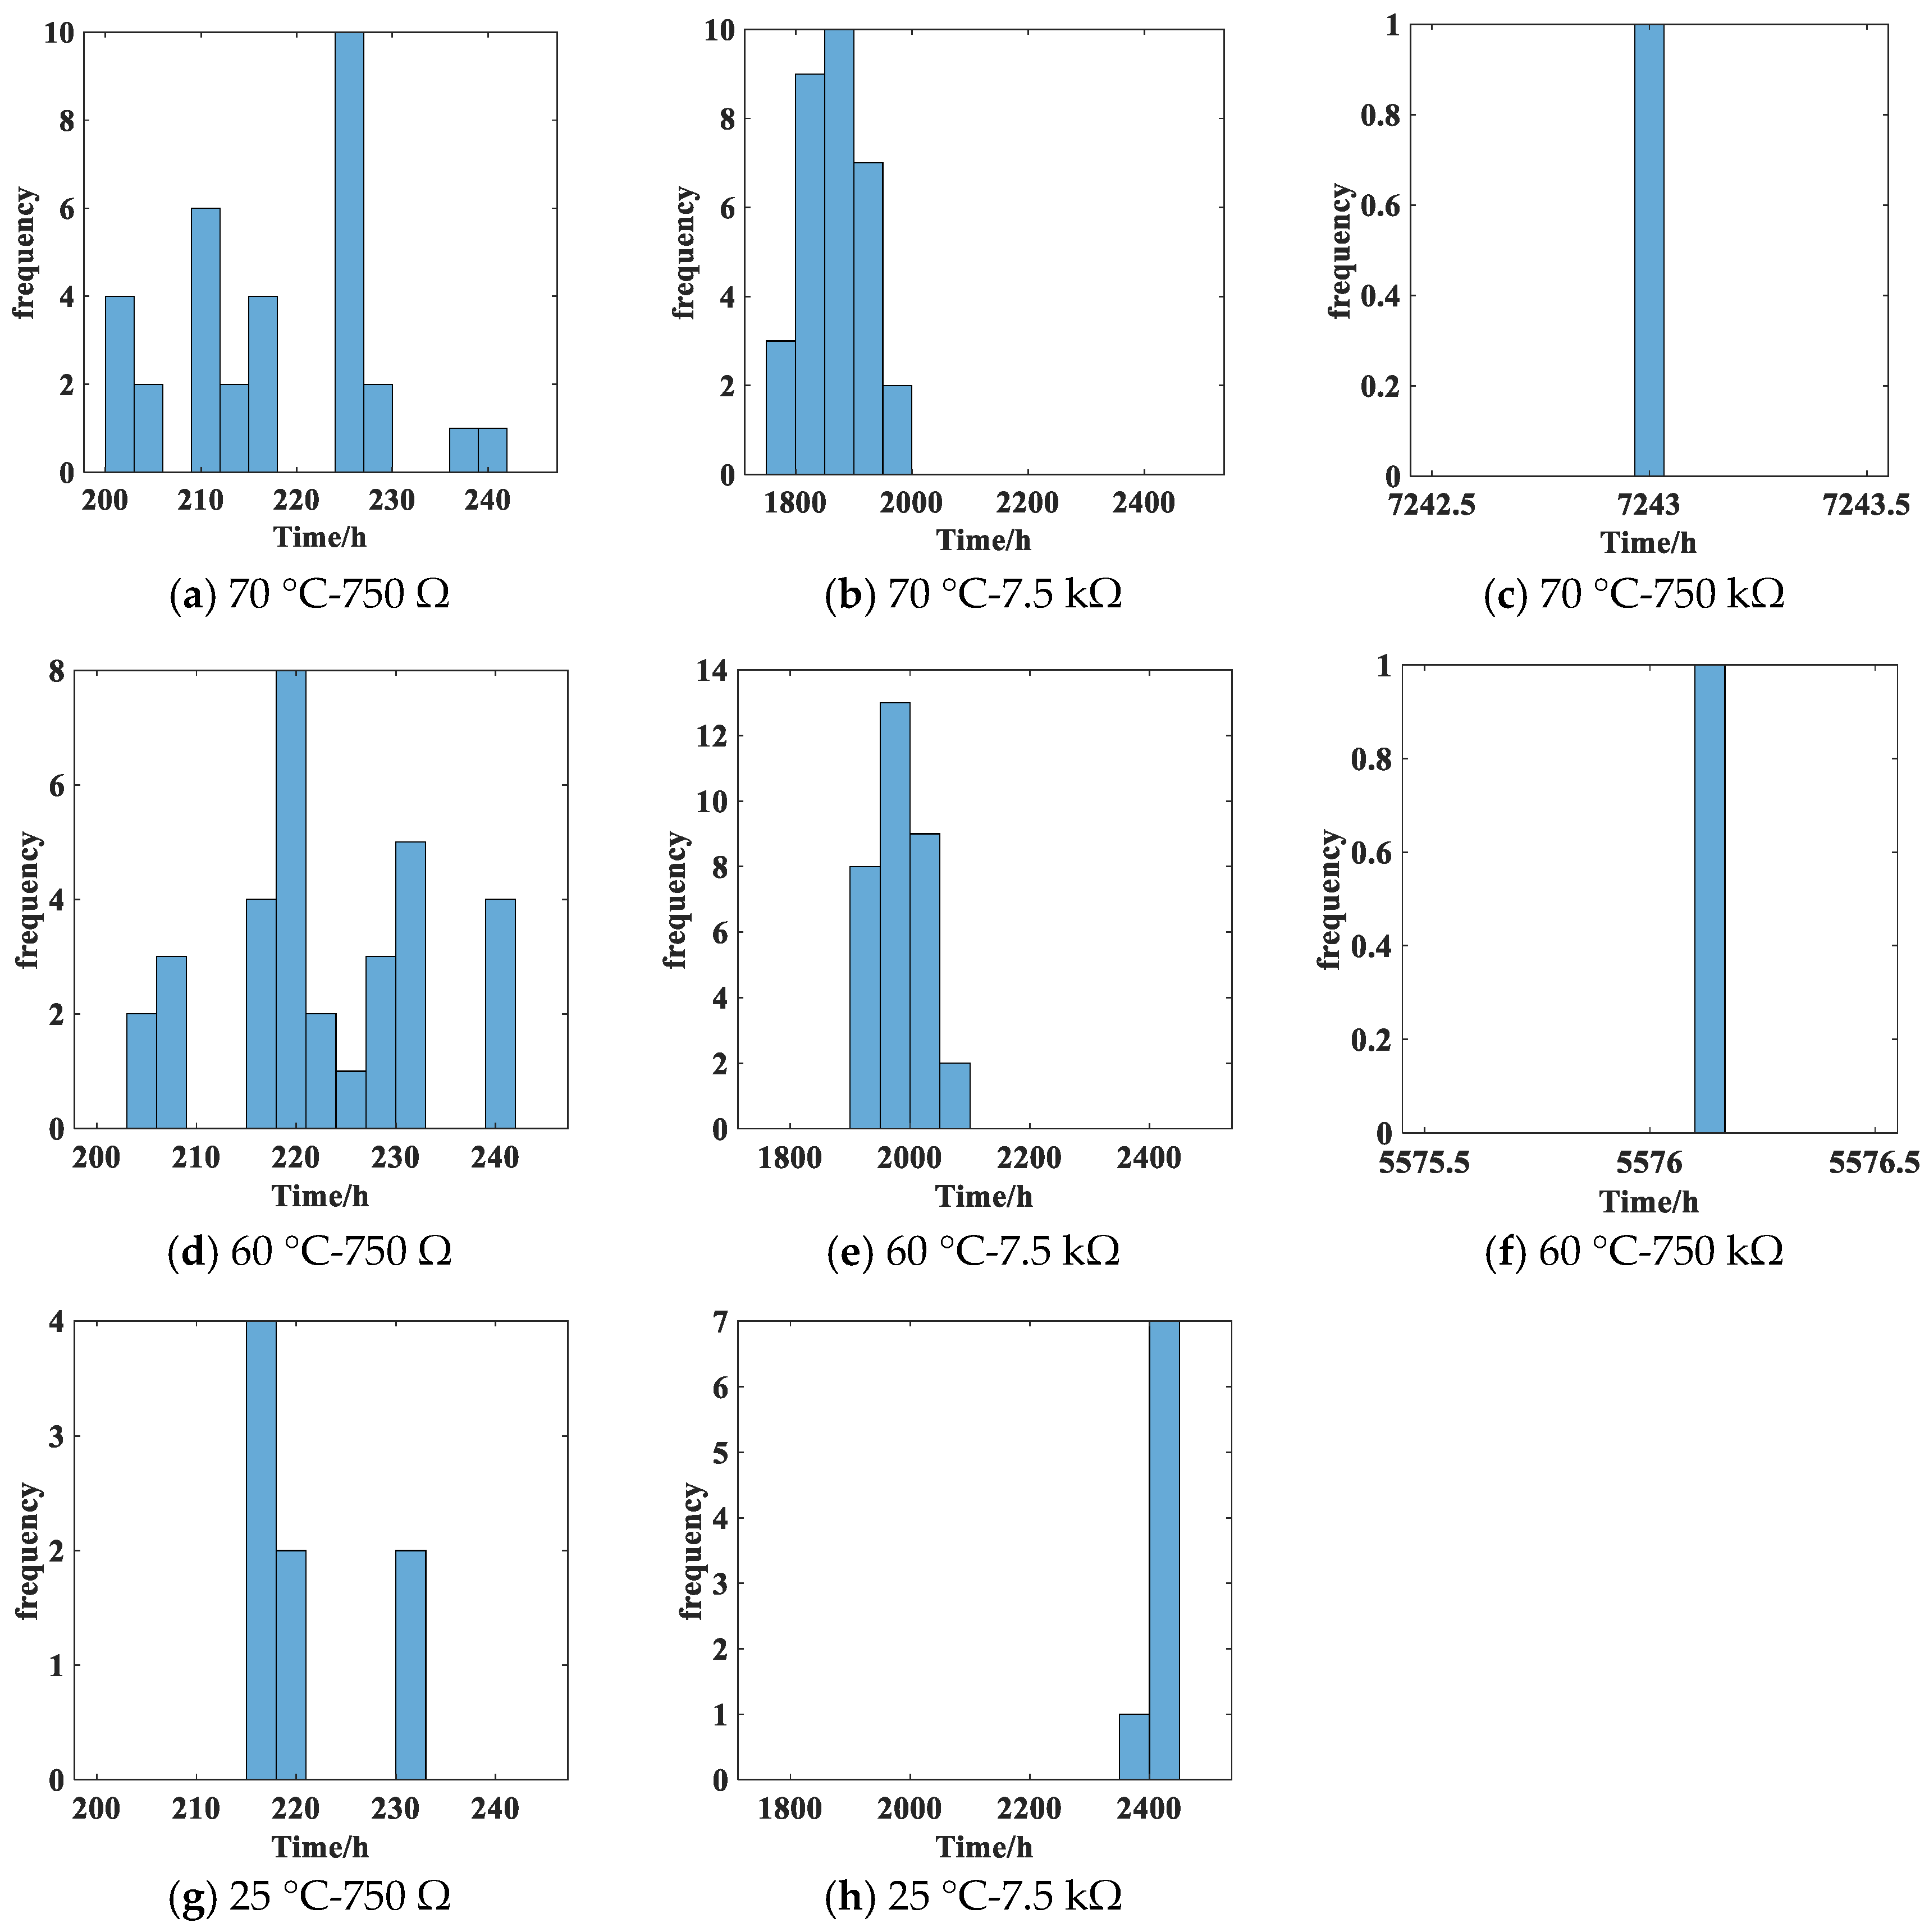
3.2. Battery Life Data

During the experiment, if the voltage at the load end of the battery circuit is lower than 2.8 V, it is considered as undervoltage, indicating battery failure. Based on this criterion, the cumulative test time for undervoltage occurrence under different test conditions is organized as battery life data and presented in a histogram, as shown in Figure 9. However, there are no battery failures observed in the 25 °C-750 kΩ group, so there is no battery life histogram available for this condition.

3.3. Inference on Battery Life Statistics

The Weibull distribution is used to infer the statistical characteristics of battery life. The probability density function of the Weibull distribution is given by:
f t = m η ( t η ) m 1 exp [ ( t η ) m ] , t > 0
where m and η are the shape parameter and scale parameter of the distribution, respectively. Their point estimates can be calculated as follows:
L ( t ) = f t i R ( T ) ( n r )
The estimated values of the shape parameter (m) and scale parameter (η) are calculated as:
1 m ^ = i = 1 r ( t m ^ ln t i ) + ( n r ) T m ^ ln T i = 1 r t m ^ + ( n r ) T m ^ 1 r i = 1 r ln t i
η ^ = ( i = 1 r t i m ^ + ( n r ) T m ^ k ) m ^ 1
The point estimation of the MTBF and the point estimation of the reliable life at R can be calculated as:
M T c = η ^ Γ ( 1 + 1 m ^ )
t R = η ^ ( ln R ) 1 / m ^
The average life and the reliable life at R = 0.9 for each stress condition are calculated, as shown in Table 3.

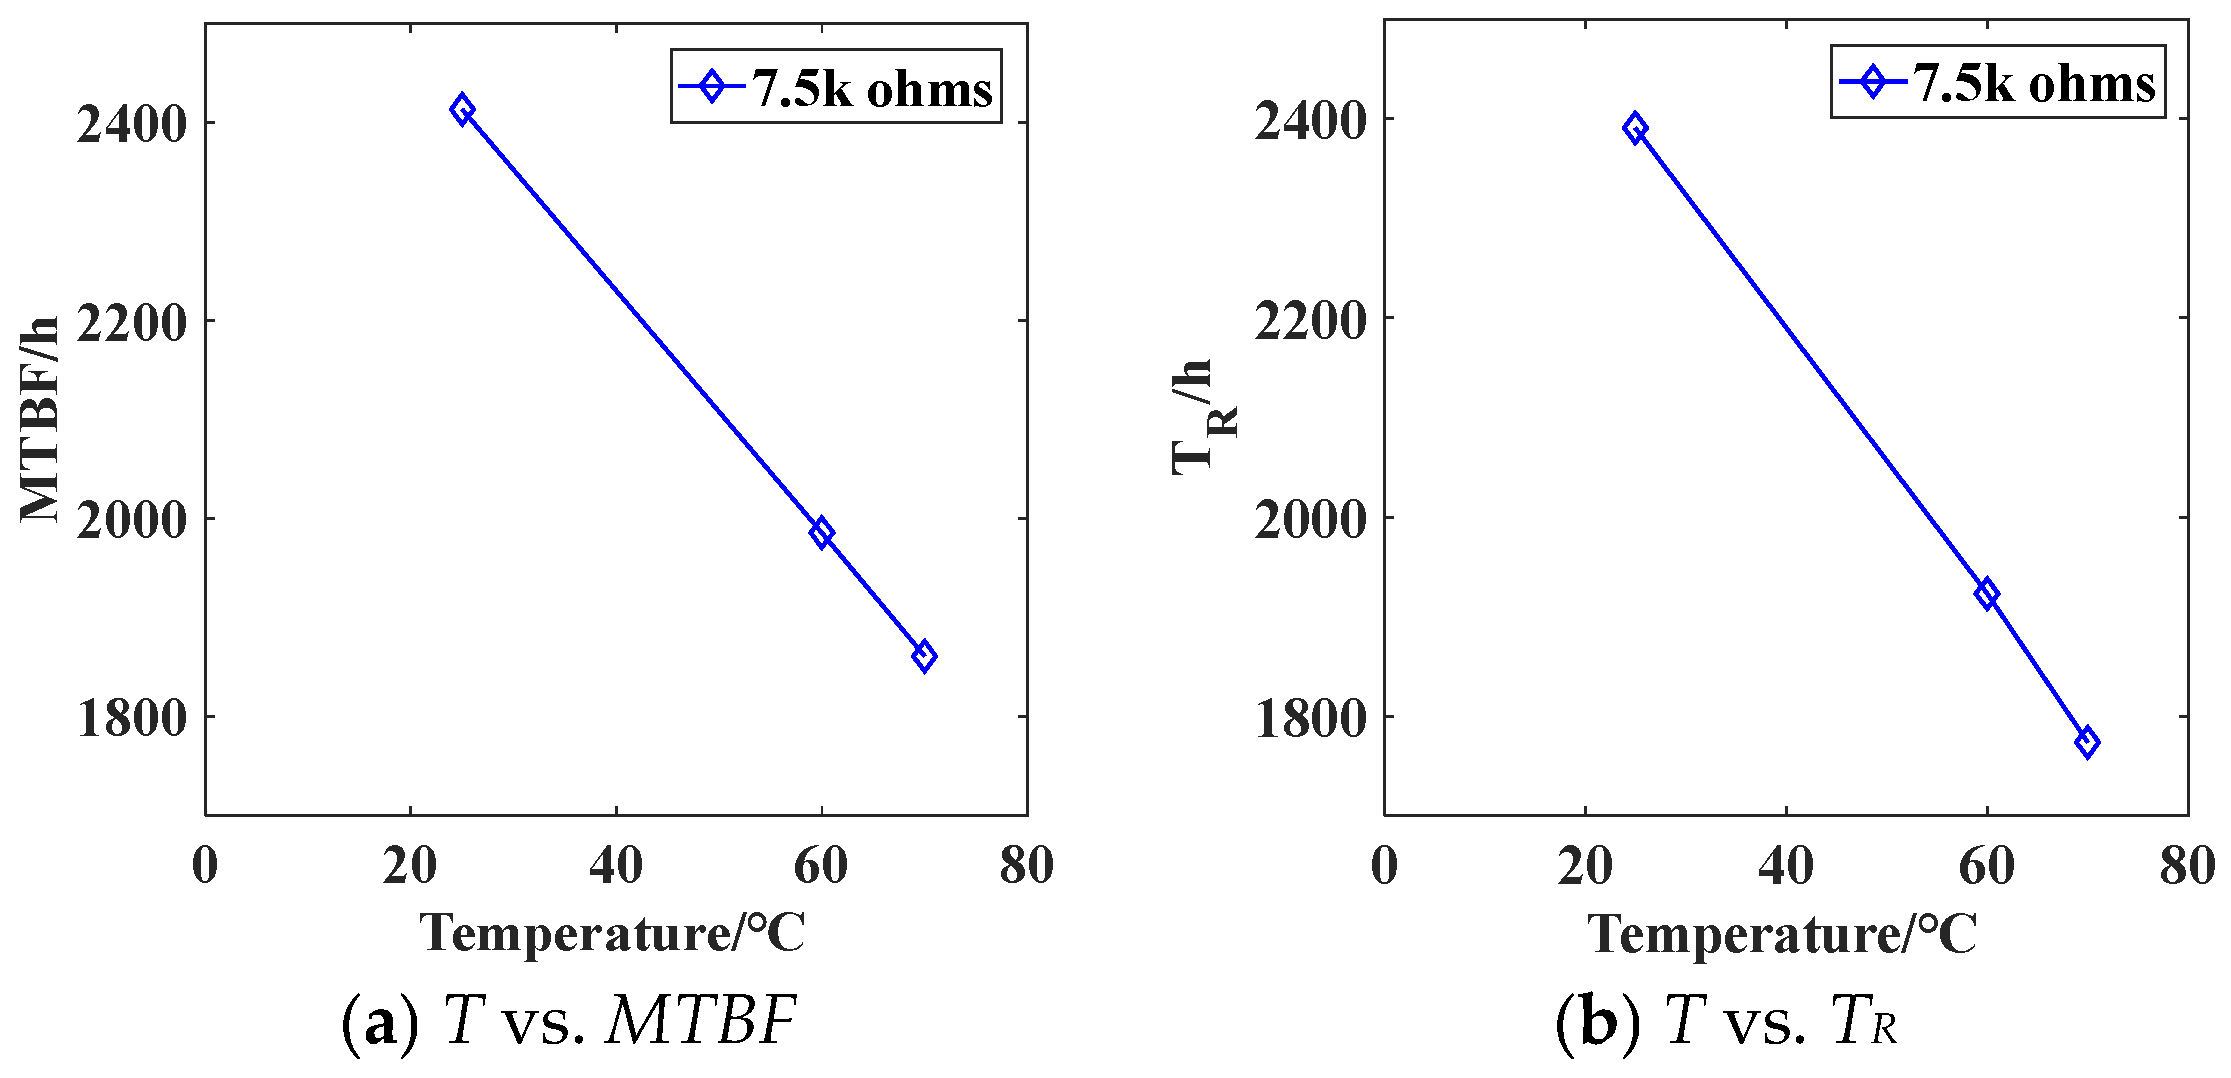
3.4. Influence of Temperature on Battery Life

The variation of MTBF and reliable life with temperature for battery load discharge with a resistance of 750 Ω is shown in Figure 10. As the temperature increases from 25 °C to 70 °C, the battery MTBF decreases from 2413.65 h to 1860.74 h. The battery life exhibits a linear negative correlation with temperature. Higher temperatures result in shorter battery life.
The variation of MTBF and reliable life with temperature for battery load discharge with a resistance of 7.5 kΩ is shown in Figure 11. As the temperature increases from 25 °C to 70 °C, the battery MTBF remains relatively stable within the range of 216.79 to 222.79 h. The reliable life of the battery slightly decreases as the temperature rises.
The discharge time for a load of 7.5 kΩ at room temperature is 10.9 times that for a load of 750 Ω; at 70 °C, the discharge time for a load of 7.5 kΩ is 8.5 times that for a load of 750 Ω; As the discharge current decreases, the discharge time increases. High temperatures increase the discharge time of the battery, resulting in a significant reduction in battery life. Under high-temperature conditions, there is a negative correlation between battery life and storage time. The higher the temperature and the longer the storage time, the greater the reduction in battery life.

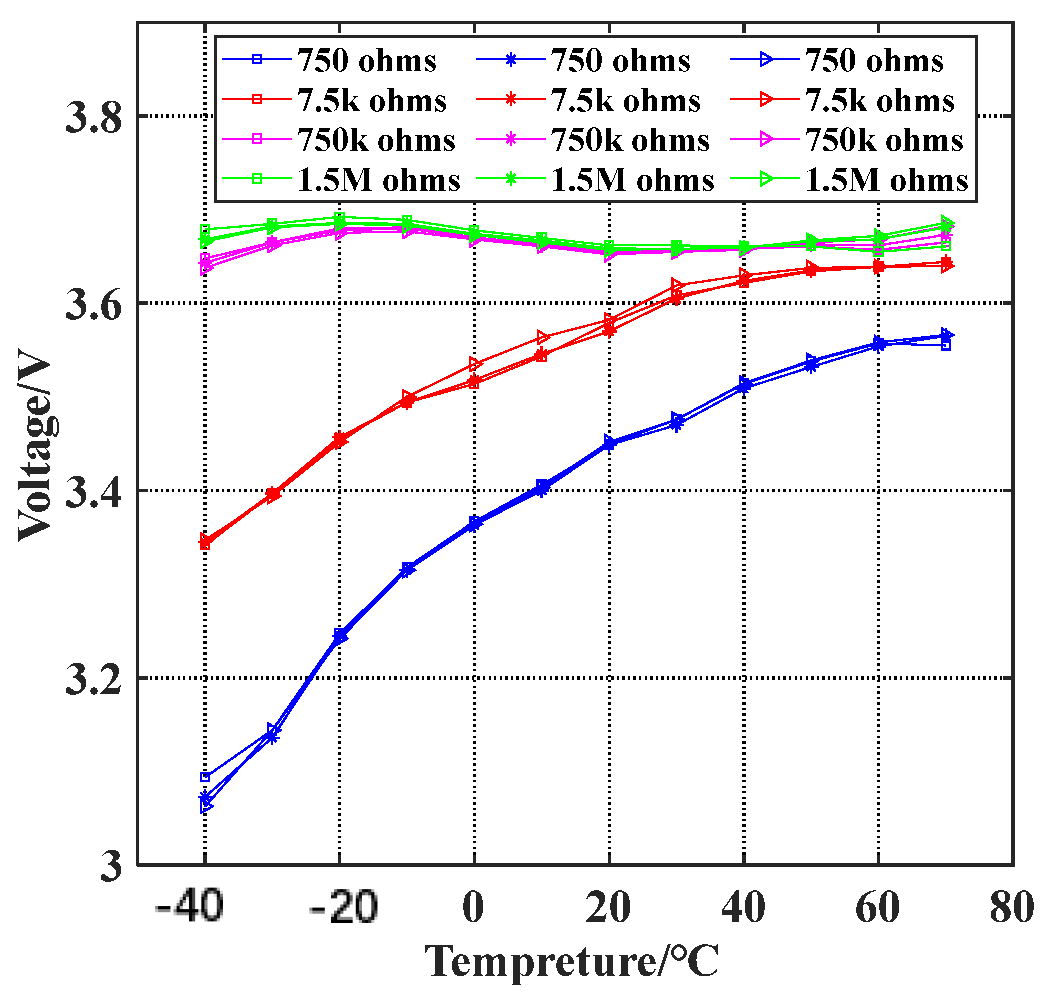
4. Impact of Temperature on Battery Voltage Output Characteristics

The battery load capacity test was conducted on 12 battery samples that did not undergo high-temperature discharge testing. The load output voltage during the discharge process is depicted in Figure 12.
(1)
Effect of temperature on the battery’s voltage output capability
As shown in the red line of the load output voltage curve in Figure 12, the battery load voltage increases with an increase in temperature. When the temperature is above 30 °C, the battery load voltage remains no lower than 3.6 V. However, when the temperature is −40 °C, the battery load voltage is approximately 3.35 V, which is lower than the open-circuit voltage of the battery (3.68 V). The lower temperature reduces the battery load voltage, thus causing a decrease in the battery’s load capacity.
(2)
Effect of current on the battery’s voltage output capability
The battery load voltage varies at different discharge currents. When the load is 750 kΩ and 1.5 MΩ, even with a temperature increase from −40 °C to 70 °C, the battery load voltage only changes within the range of 3.65 V to 3.7 V, with the voltage variation of only 0.05 V. Therefore, the impact of temperature on the battery load voltage is minimal, indicating that low current discharge has a minor effect on the battery’s load capacity. However, when the discharge current increases and the load is 750 Ω, the battery load voltage drops to 3.1 V at −40 °C, and even with a temperature rise to 60 °C, the battery load voltage is only approximately 3.55 V, significantly lower than the open circuit voltage of 3.68 V. Low-temperature and high-current discharge severely reduces the battery’s load capacity.
(3)
Effect of degradation level on the battery’s voltage output capability
Considering the performance degradation during battery usage, 12 batteries were selected to undergo battery load capacity testing after being subjected to high-temperature load 7.5 kΩ discharge for durations of 1296 h, 5244 h, and 7294.5 h. The battery load voltage is shown in Figure 13.
The aging data of the battery are shown in Figure 13. After approximately 1200 h of aging, the battery load voltage increases with an increase in temperature. When the aging time reaches 5000 h, the battery’s load capacity reaches its maximum value at around 30 °C. The load capacity of the battery shows a decreasing trend both below and above 30 °C. The most severe decrease in load capacity occurs during low-temperature and high-current discharge.
As shown in Figure 12 and Figure 13a, after 1296 h of aging, the voltage variation range of the battery compared to the new battery is only 0.05 V. At this point, the impact of temperature and current on the battery’s load capacity is minimal. As shown in Figure 13b, after aging for 5244 h with a load discharge of 750 Ω, when the temperature drops to −30 °C, the load capacity of one battery suddenly drops to 1.2 V, indicating that it has reached the failure condition. After aging for over 7000 h, as indicated by the blue curve in Figure 13c, the battery’s load voltage at −20 °C during a 5 mA discharge has already fallen to 2.9 V. At −40 °C, the load voltage consistently remains below 2.8 V. The battery’s load voltage shows a decreasing trend with an increase in aging time.
(4)
Functional relationship between battery’s voltage output capability, temperature, current, and aging time
The battery load voltage is related to temperature, discharge current, and the aging time of the battery. To illustrate their relationship, a three-variable linear equation is used to fit the battery load voltage:
U = W 1 I + W 2 T + W 3 t + W 0
In the fitting equations, W0, W1, W2, and W3 are 3.6381, −0.0762, 0.0019, and −0.000008395, respectively.

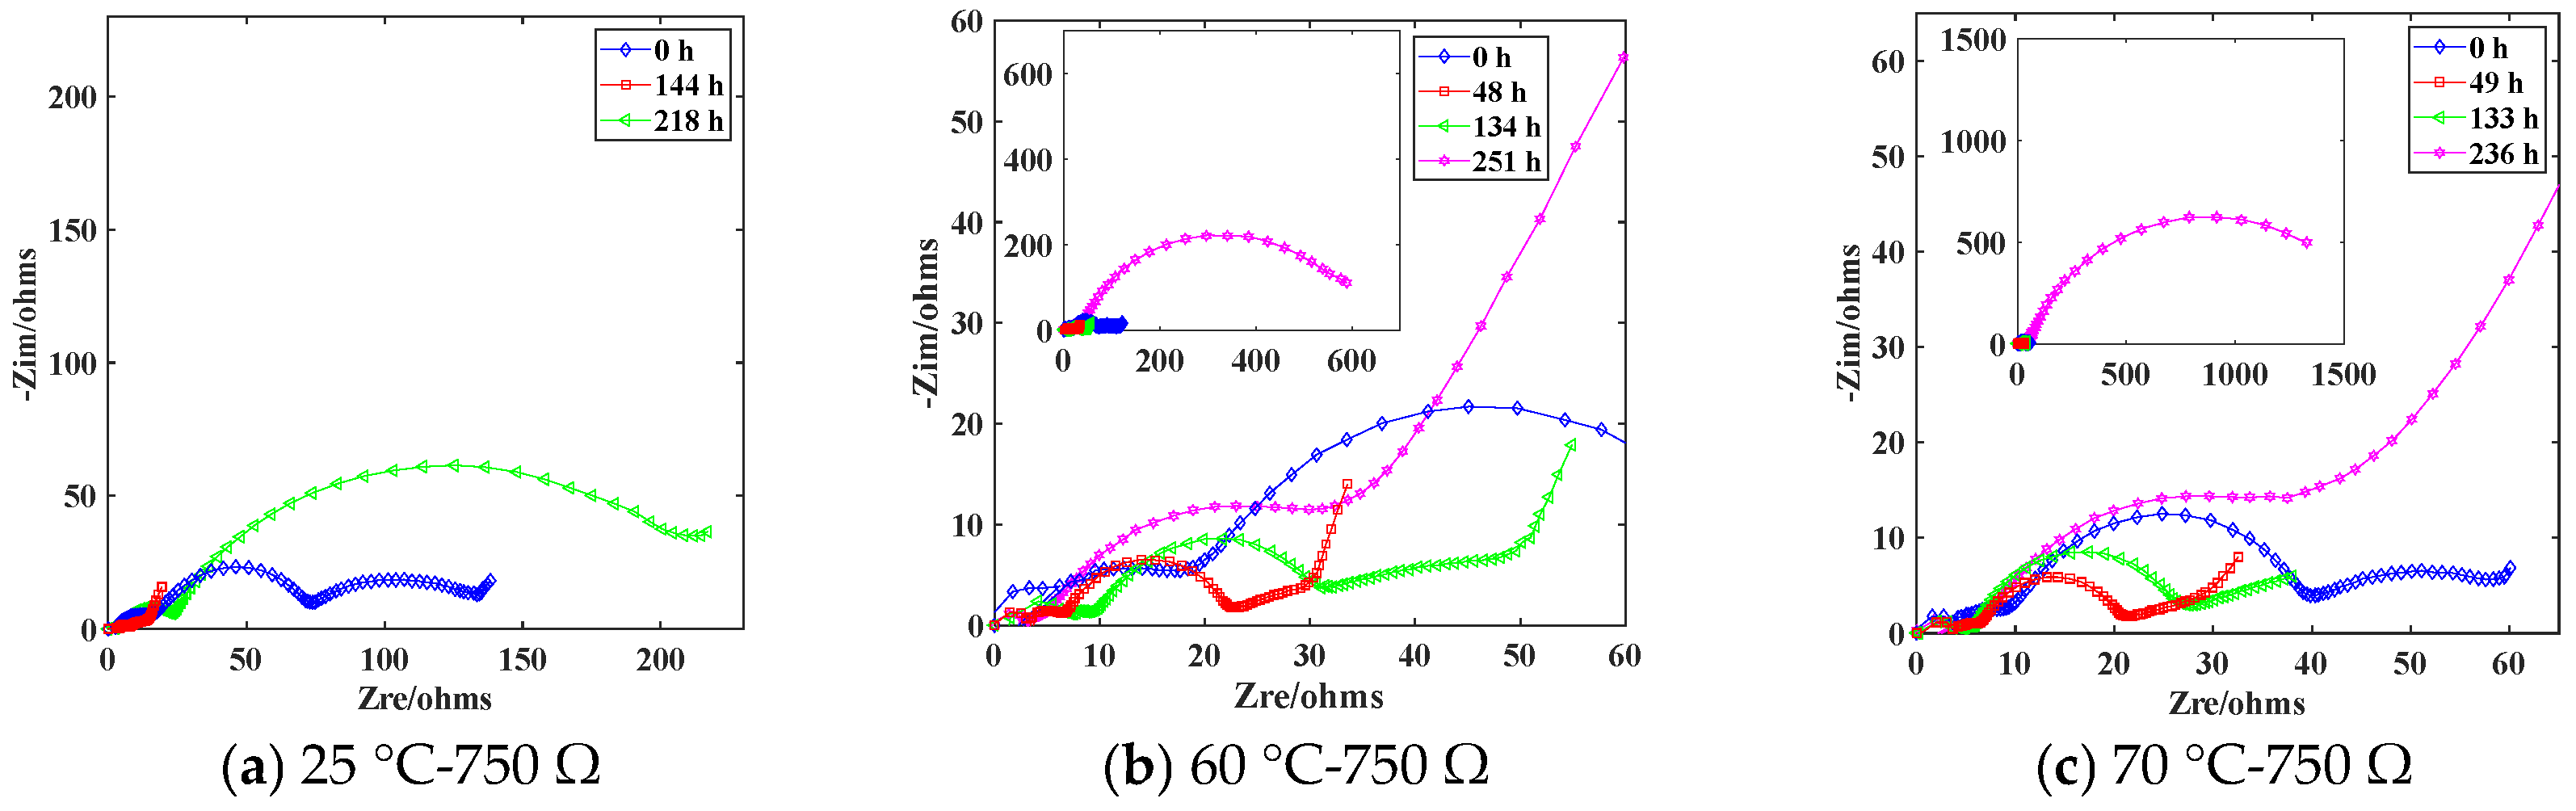
5. Effect of Temperature on the Failure Mechanism of Li/SOCl2 Batteries

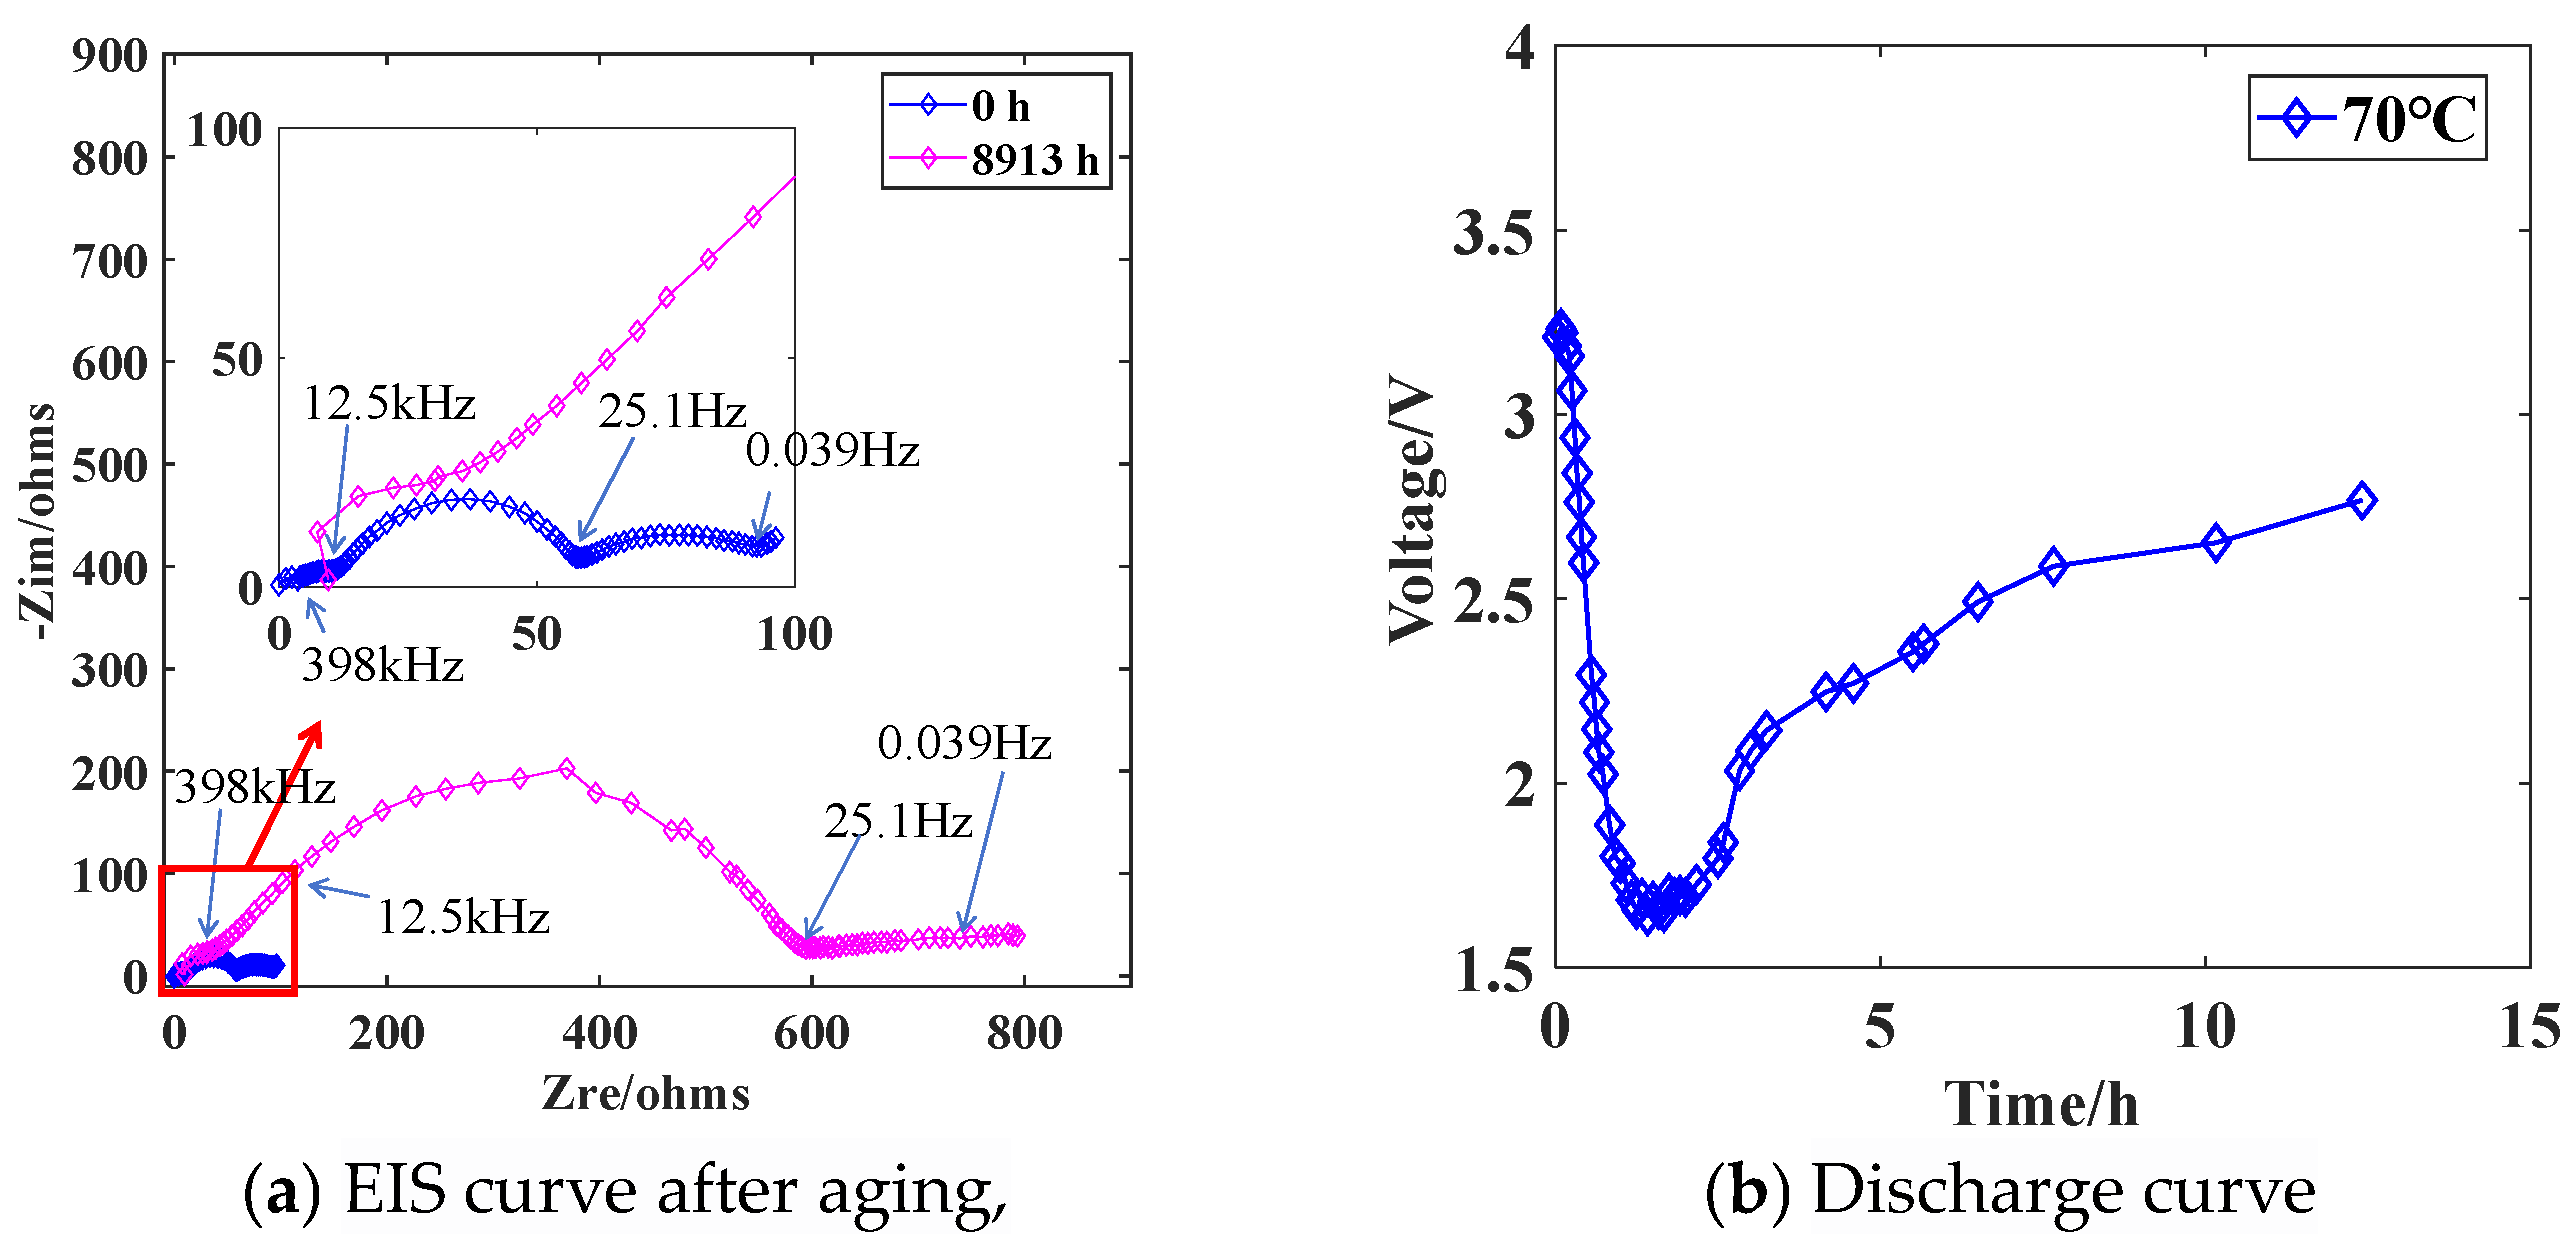
5.1. Analysis of Li/SOCl2 Battery Impedance Based on EIS

The EIS curves of the battery at different discharge times under temperature conditions of 25 °C, 60 °C, and 70 °C are shown in Figure 14. Long-term storage of Li/SOCl2 batteries results in the formation of a LiCl passivation layer on the surface of the electrode. This passivation layer acts as a physical barrier between the Li metal negative electrode and the electrolyte, protecting the Li metal negative electrode [19]. The EIS curves under this condition are represented by the blue curves in Figure 14a–c. When discharged with a 750 Ω resistance at a temperature of 25 °C, the high current breaks through the passivation layer attached to the Li metal negative electrode, forming holes that facilitate charge transfer through the passivation layer [20]. The damaged passivation layer exposes a larger area of the Li metal negative electrode to the electrolyte, reducing the charge transfer resistance on the Li metal surface. This condition is shown by the red EIS curve in Figure 14a. With continuous high current discharge, the Li metal in the negative electrode is rapidly consumed, and the electrolyte is filled with a large amount of decomposition products, resulting in difficulties in charge transfer on the Li metal negative electrode. This is evident from the significant increase in the radius of the semicircular arc in the high-frequency region of the EIS curve, as shown by the green EIS curve in Figure 14a.
As the temperature rises to 60 °C during the discharge process, the high current breaks through the passivation layer on the Li metal negative electrode. However, the high temperature intensifies the reaction between a large amount of Li+ and the electrolyte [21], leading to the formation of a large number of decomposition products that block the charge transfer pathways. This significantly increases the charge transfer impedance of the battery subjected to the 60 °C test compared to the battery subjected to the 25 °C test. As shown in Figure 14b, after 48 h of discharge, the charge transfer impedance of the battery decreases from about 60 Ω to about 14 Ω compared to the initial state, as shown by the red EIS impedance spectrum. However, it still significantly increases compared to the charge transfer impedance of the battery discharged for 144 h under 25 °C conditions, which is about 4 Ω. After a 49 h test at 70 °C, the charge transfer impedance is approximately 15 Ω, slightly higher than the charge transfer impedance observed in the 60 °C test. The EIS analysis of the battery under different temperatures indicates a positive correlation between temperature and charge transfer impedance under the same discharge conditions.

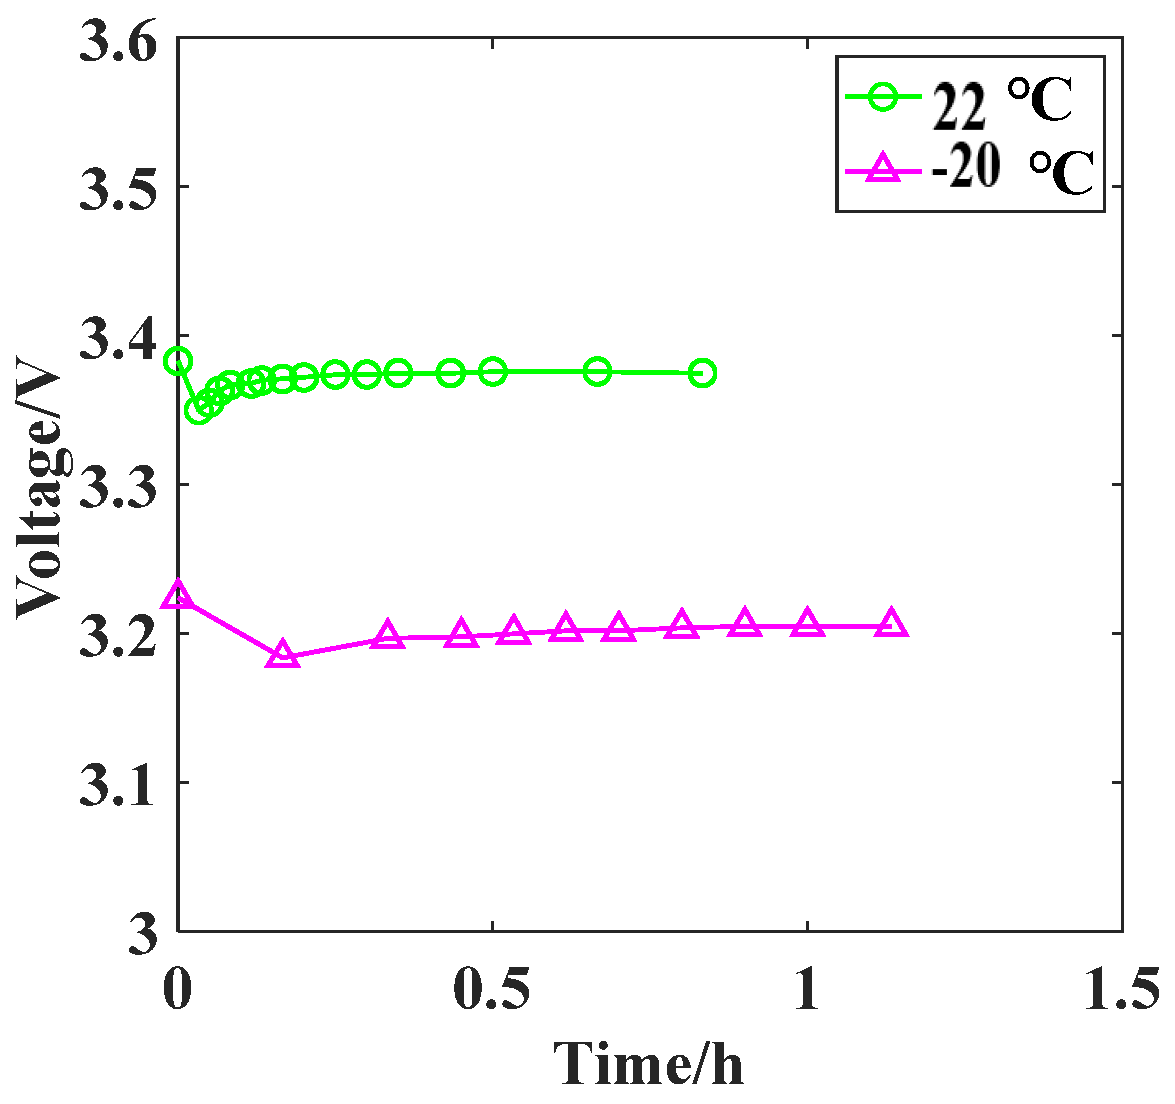
5.2. Impact of Temperature on Voltage Hysteresis in Batteries

The following reaction occurs inside the Li/SOCl2 battery: 4Li + 2SOCl2 = 4LiCl + S + SO2, yielding LiCl, S, and SO2. SO2 dissolves in an excess of SOCl2 electrolyte. LiCl deposits and attaches to the surface of the Li metal negative electrode, separating the Li metal from the SOCl2 electrolyte and protecting the Li metal negative electrode. The negative Li metal electrode undergoes the reaction 4Li − 4e = 4Li+, and the dense LiCl passivation layer leads to significant passivation film impedance at the Li metal negative electrode, as shown by the blue EIS curve in Figure 15a. Throughout the storage process, the LiCl passivation film gradually thickens. Under high-temperature storage conditions, the growth rate of the LiCl passivation film increases, leading to a sharp increase in charge transfer resistance at the Li metal negative electrode [22]. The EIS impedance spectrum exhibits a sharply increasing high-to-mid frequency semicircular arc radius, as illustrated by the red EIS curve in Figure 15a.
The Li/SOCl2 battery stored at 70 °C for 8913 h forms a dense passivation film on the surface of the Li metal negative electrode. When a 750 Ω resistor is connected to form the discharge circuit, at the beginning of initial circuit conduction, the load voltage is approximately 3.3 V, and a current of about 4.4 mA flows through the circuit. At this time, a large amount of Li+ is generated at the Li metal negative electrode. The Li+ passes through the weak points in the LiCl passivation film and enters the SOCl2 electrolyte, where it combines with Cl in the electrolyte to form LiCl, which continues to adhere to the outer layer of the passivation film. As the passivation film thickens, it becomes increasingly difficult for Li+ to penetrate the passivation film, leading to an increase in the internal resistance of the battery [23]. The internal resistance of the battery acts as a voltage divider in the circuit, causing the load voltage to decrease, as shown in Figure 15b, with the load circuit voltage dropping to approximately 1.6 V. When the resistance to Li+ penetration through the passivation film at a certain position on the negative electrode reaches a certain level, the Li+ breaks through the relatively weaker new location of the passivation film on the negative electrode, creating a new Li+ transport channel. This reduces the internal resistance of the battery and weakens the voltage division effect, resulting in a relative increase in the load voltage compared to the previous moment, as shown in Figure 15b, with the load voltage returning to approximately 2.8 V. The substantial generation of LiCl thickens the passivation film and results in a significant consumption of the SOCl2 electrolyte, overall increasing the internal resistance of the battery compared to the initial discharge moment. When the load voltage returns to a stable state, it remains lower than the load voltage at the initial discharge moment.
At a temperature of 22 °C, the load voltage in the circuit decreases slightly from approximately 3.39 V to around 3.35 V within 8 min and then recovers to about 3.38 V, as shown by the green curve in Figure 16. At this temperature, the activity of the SOCl2 electrolyte inside the Li/SOCl2 battery decreases. The reaction rate of 4Li + 2SOCl2 = 4LiCl + S + SO2 decreases, resulting in only a small amount of LiCl precipitation adhering to the periphery of the negative electrode in a short period of time. This hinders the penetration of Li+ through the passivation film and creates new Li+ transport channels at different positions on the negative electrode, reaching a dynamic equilibrium. When the temperature drops to −20 °C, the load voltage in the circuit further decreases to approximately 3.2 V, as shown by the red curve in Figure 16. This is due to a further decrease in the activity and flowability of the SOCl2 electrolyte inside the Li/SOCl2 battery, leading to an increase in the internal resistance of the battery and a greater voltage division effect.

6. Conclusions

This study used the Weibull distribution to investigate the lifespan of Li/SOCl2 batteries at different temperatures. It was found that the impact of temperature on battery life varied under different discharge current conditions. When the battery is discharged at a load of 7.5 kΩ, both the MTBF and the reliable life of the battery decrease as temperature increases. Conversely, under the battery is discharged at a load of 750 Ω, the reliable life of the battery also shows a decreasing trend with increasing temperature, while the MTBF reaches its peak at 60 °C. Although high temperature accelerates battery aging, under a 750 Ω discharge condition, the battery is discharged within a short period (240 h), whereas under the condition of load 7.5 kΩ discharge, the discharge time required more than 2000 h, resulting in the battery aging time at high temperatures being ten times higher under low current discharge conditions compared to high current conditions. Under long-term high-temperature aging conditions, electrolyte loss and leakage current within the battery intensified, leading to differences in the impact of temperature on battery life under different discharge currents.
The battery’s load-bearing capacity shows an increasing trend with rising temperature, which is due to the decrease in internal resistance as temperature rises. Batteries with longer aging times demonstrate a significant decrease in load-bearing capacity.
Through the analysis of the impact of temperature on the battery output voltage, it was found that the battery voltage output ability greatly decreased under low temperature and high current. When the new battery is discharged at a load of 750 Ω at −40 °C, the battery load voltage drops to 3.1 V. After aging, the battery voltage output ability continues to decrease. After aging for 7000 h, the battery voltage has dropped to 2.8 V under a 750 Ω load at a low temperature of −40 °C. Under long-term high-temperature aging conditions, the internal resistance of the battery continued to increase, and the voltage-dividing effect was enhanced, resulting in a decrease in load voltage. During the storage process of lithium-ion batteries, the LiCl passivation film gradually thickens, and the growth rate of the LiCl passivation film increases with high-temperature storage. Li+ has difficulty penetrating the passivation film, and the internal resistance of the battery gradually increases. The internal resistance of the battery plays a voltage-dividing role in the circuit, which causes the load voltage of the circuit to decrease, and the discharge temperature to decrease, resulting in a decrease in load voltage.
When the battery discharges, the current breaks through the passivation film attached to the Li metal anode to form holes, and the resistance to charge transfer on the Li metal surface decreases. With continuous current discharge, Li and electrolyte are consumed and insoluble substances LiCl and S are generated, resulting in difficulty in charge transfer on the Li metal anode, and the semicircle radius of the high-frequency EIS curve increases significantly. Under the condition of the same load resistance (750 Ω), the battery tested at 60 °C has a significantly increased charge transfer impedance compared to the battery tested at 25 °C, and the temperature is positively correlated with the charge transfer impedance.

Author Contributions

Conceptualization, writing—review and editing, writing—original draft, Y.S.; writing—review and editing, writing—original draft, X.Q.; writing—review and editing L.L.; visualization, validation, Y.Z.; visualization, formal analysis, J.Z.; methodology, reviewing, J.Q. All authors have read and agreed to the published version of the manuscript.

Funding

This work was supported by the Science and Technology Project of State Grid Xinjiang Electric Power Company (Grant No. 52301X24000).

Data Availability Statement

The data and materials used to support the results of this study cannot be obtained due to privacy reasons.

Conflicts of Interest

Author Jiahai Zhang was employed by the company Yantai Dongfang Wisdom Electric Co., Ltd. The authors declare that this study received funding from State Grid Xinjiang Electric Power Company. The remaining authors declare that the research was conducted in the absence of any commercial or financial relationships that could be construed as a potential conflict of interest.

References

  1. Dai, Y.J.; Jing, Z.; Sun, Y.Q. Reliability-centered prediction methods of clock battery low-output-voltage event for smart electricity meters. Microelectron. Reliab. 2022, 138, 114631. [Google Scholar] [CrossRef]
  2. Sun, X.; Zhang, Y.; Zhang, Y.; Wang, L.; Wang, K. Summary of health-state estimation of lithium-ion batteries based on electrochemical impedance spectroscopy. Energies 2023, 16, 5682. [Google Scholar] [CrossRef]
  3. Fan, M.S.; Geng, M.M.; Yang, K.; Zhang, M.J.; Liu, H. State of Health Estimation of Lithium-Ion Battery Based on Electrochemical Impedance Spectroscopy. Energies 2023, 16, 3393. [Google Scholar] [CrossRef]
  4. Song, H.Y.; Jung, M.H.; Jeong, S.K. Electrochemical properties of acetylene black/multi-walled carbon nanotube cathodes for lithium thionyl chloride batteries at high discharge currents. J. Electrochem. Sci. Technol. 2020, 11, 430–436. [Google Scholar] [CrossRef]
  5. Lee, S.B.; Pyun, S.I.; Lee, E.J. Effect of the compactness of the lithium chloride layer formed on the carbon cathode on the electrochemical reduction of SOCl2 electrolyte in Li–SOCl2 batteries. Electrochim. Acta 2001, 47, 855–864. [Google Scholar] [CrossRef]
  6. Cheng, S.J.; Li, B.; Yuan, Z.Z.; Zhang, F.Y.; Liu, J.C. Development of a lifetime prediction model for lithium thionyl chloride batteries based on an accelerated degradation test. Microelectron. Reliab. 2016, 65, 274–279. [Google Scholar] [CrossRef]
  7. Cheng, S.J.; Yuan, Z.Z.; Ye, X.P.; Zhang, F.Y.; Liu, J.C. Empirical prediction model for Li/SOCl2 cells based on the accelerated degradation test. Microelectron. Reliab. 2015, 55, 101–106. [Google Scholar] [CrossRef]
  8. Ye, X.R.; Sun, Q.S.; Li, H.X.; Li, W.W.; Liu, L.; Zhai, G.F. Reliability Evaluation of Li/SOCl2 Battery for Smart Electricity Meter Based on Remaining Capacity. Conf. Ser. Mater. Sci. Eng. 2021, 1043, 032016. [Google Scholar] [CrossRef]
  9. Chen, Y.; Chen, Z.Y.; Zhu, M.M.; Liao, Y.H.; Luo, F.; Li, X.R. Smart Electricity Meter Prognostics Based on Lithium Battery RUL Prediction. Distrib. Gener. Altern. Energy J. 2021, 37, 449–464. [Google Scholar] [CrossRef]
  10. Arora, P.; Ralph, E.; Doyle, W.M. Capacity fade mechanisms and side reactions in lithium-ion batteries. J. Electrochem. Soc. 1998, 145, 3647–3667. [Google Scholar] [CrossRef]
  11. Han, X.B.; Ouyang, M.G.; Lu, L.G.; Li, J.Q.; Zheng, Y.J.; Li, Z. A comparative study of commercial lithium ion battery cycle life in electrical vehicle: Aging mechanism identification. J. Power Sources 2014, 251, 38–54. [Google Scholar] [CrossRef]
  12. Ouyang, M.G.; Feng, X.N.; Han, X.B.; Lu, L.U.; Li, Z.; He, X.M. A dynamic capacity degradation model and its applications considering varying load for a large format Li-ion battery. Appl. Energy 2016, 165, 48–59. [Google Scholar] [CrossRef]
  13. Aubay, M.; Lojou, E. Film Formation on Lithium Electrode in LiAlCl4/SO2Cl2 and LiAlCl4: 3SO2 Based Electrolytes. J. Electrochem. Soc. 1994, 141, 865. [Google Scholar] [CrossRef]
  14. Li, S.; Dai, H.L.; Li, Y.H.; Lai, C.; Wang, J.L.; Huo, F.W.; Wang, C. Designing Li-protective layer via SOCl2 additive for stabilizing lithium-sulfur battery. Energy Storage Mater. 2019, 18, 222–228. [Google Scholar] [CrossRef]
  15. Ziesche, R.F.; Robinson, J.B.; Kok, M.D.R.; Markötter, H.; Kockelmann, W.; Kardjilov, N.; Manke, I.; Brett, D.J.L.; Shearing, P.R. Editors’ choice—4D neutron and X-ray tomography studies of high energy density primary batteries: Part I. Dynamic studies of LiSOCl2 during discharge. J. Electrochem. Soc. 2020, 167, 130545. [Google Scholar] [CrossRef]
  16. Carmier, D.; Vix-Guterl, C.; Lahaye, J. Porosity of the cathode during the discharge of SOCl2/Li batteries: I. Industrial cathodes. Carbon 2001, 39, 2181–2186. [Google Scholar] [CrossRef]
  17. Carmier, D.; Vix-Guterl, C.; Lahaye, J. Porosity of the cathode during the discharge of SOCl2/Li batteries: II. Model cathodes. Carbon 2001, 39, 2187–2193. [Google Scholar] [CrossRef]
  18. Jian, T.; Shenzhong, L. Failure process of Li/SOCl2 cells at 200 °C. J. Power Sources 1994, 52, 119–121. [Google Scholar] [CrossRef]
  19. Chen, L.T.; Yang, X.Y.; Wang, X.Q.; Hu, G.F.; Zhang, R.L.; Wang, N.S.; Zhao, J.S. High-efficiency electrocatalyst phthalocyanine in Li/SOCl2 batteries: From experimental to theoretical investigation. J. Electrochem. Soc. 2021, 168, 120505. [Google Scholar] [CrossRef]
  20. Chen, G.D.; Li, W.D.; Du, X.F.; Wang, C.; Qu, X.L.; Gao, X.Y.; Dong, S.M.; Cui, G.L.; Chen, L.Q. Transforming a Primary Li/SOCl2 Battery into a High-Power Rechargeable System via Molecular Catalysis. J. Am. Chem. Soc. 2023, 145, 22158–22167. [Google Scholar] [CrossRef]
  21. Chenebault, P.; Vallin, D.; Thevenin, J.; Wiart, R. Impedance analysis of the lithium discharge in Li/SOCl2 cells: Synergetic effect of SO2 and LiAl(SO3Cl)4. J. Appl. Electrochem. 1989, 19, 413–420. [Google Scholar] [CrossRef]
  22. Ko, Y.O.; Lee, C.T. Effects of the structural characteristics of carbon cathode on the initial voltage delay in Li/SOCl2 battery. J. Ind. Eng. Chem. 2012, 18, 726–730. [Google Scholar] [CrossRef]
  23. Zabara, M.A.; Uzundal, C.B.; Ulgut, B. Linear and nonlinear electrochemical impedance spectroscopy studies of Li/SOCl2 batteries. J. Electrochem. Soc. 2019, 166, A811. [Google Scholar] [CrossRef]
Figure 1. Structure of carbon-encased Li/SOCl2 battery.
Energies 17 03063 g001
Figure 2. Schematic diagram of voltage detection across load resistor in Li/SOCl2 battery.
Energies 17 03063 g002
Figure 3. Schematic diagram illustrating the principle of battery life testing at different temperatures.
Energies 17 03063 g003
Figure 4. Battery life testing device.
Energies 17 03063 g004
Figure 5. Schematic diagram illustrating the principle of battery load voltage temperature characteristic test.
Energies 17 03063 g005
Figure 6. Test plan.
Energies 17 03063 g006
Figure 7. Impedance spectrum testing.
Energies 17 03063 g007
Figure 8. Battery discharge data at different temperatures. The sequence numbers represent the numbering of battery samples under different stress conditions.
Energies 17 03063 g008aEnergies 17 03063 g008b
Figure 9. Battery life histogram.
Energies 17 03063 g009
Figure 10. The relationship between discharge life and temperature for a battery load of 7.5 kΩ.
Energies 17 03063 g010
Figure 11. The relationship between discharge life and temperature for a battery load of 750 Ω.
Energies 17 03063 g011
Figure 12. Battery load output voltage.
Energies 17 03063 g012
Figure 13. Discharge temperature characteristic diagram of 7.5 kΩ load after aging.
Energies 17 03063 g013
Figure 14. EIS of different temperature loads at 750 Ω discharge in each stage.
Energies 17 03063 g014
Figure 15. EIS curve and discharge curve after battery aging.
Energies 17 03063 g015
Figure 16. Discharge curves of aged battery.
Energies 17 03063 g016
Table 1. Constant current discharge test conditions and sample configuration.
Temperature/Load750 Ω7.5 kΩ750 kΩ
70 °C32 batteries32 batteries32 batteries
60 °C32 batteries32 batteries32 batteries
25 °C8 batteries8 batteries8 batteries
Table 2. Battery temperature characteristic test conditions and sample information.
Battery SamplesAging TimeR = 750 ΩR = 7.5 kΩR = 750 kΩR = 1.5 MΩ
New battery10 months, room temperature3 batteries3 batteries3 batteries3 batteries
70 °C-750 kΩ 1296 h3 batteries3 batteries3 batteries3 batteries
5244 h
7294.5 h
Table 3. Point estimates of battery MTBF and reliable life.
TemperaturePoint Estimates750 Ω7.5 kΩ
70 °CMTBF216.791860.74
t R 199.971773.81
60 °CMTBF222.791985.82
t R 206.991923.30
25 °CMTBF220.012413.65
t R 208.082391.09
Disclaimer/Publisher’s Note: The statements, opinions and data contained in all publications are solely those of the individual author(s) and contributor(s) and not of MDPI and/or the editor(s). MDPI and/or the editor(s) disclaim responsibility for any injury to people or property resulting from any ideas, methods, instructions or products referred to in the content.

