Article

A Multi-Type Dynamic Response Control Strategy for Energy Consumption

1
Shenyang Institute of Engineering, Shenyang 110000, China
2
China Energy Construction Group Liaoning Electric Power Survey and Design Institute Co., Ltd., Shenyang 110000, China
3
State Grid Liaoning Electric Power Academy, Shenyang 110000, China
*
Author to whom correspondence should be addressed.
Energies 2024, 17(13), 3092; https://doi.org/10.3390/en17133092
Submission received: 10 May 2024 / Revised: 29 May 2024 / Accepted: 15 June 2024 / Published: 23 June 2024
(This article belongs to the Section K: State-of-the-Art Energy Related Technologies)

Abstract

:
In the context of the “Dual-Carbon Strategy”, the seamless integration and optimal utilization of renewable energy sources present a pressing challenge for the emerging power system. The advent of demand-side response technology offers a promising solution to this challenge. This study proposes a two-stage response control strategy for multiple DR clusters based on the specific response time characteristics of industrial and residential loads. The strategy enhances the utilization rate of wind power, harnesses the joint response capability of various types of loads on the demand side, and ensures the overall revenue of the load aggregator (LA). It underscores the importance of industrial loads in large-scale energy consumption control throughout the overall consumption response process, while residential load clusters exhibit quick response flexibility. A homogeneous energy consumption sorting unit response strategy is established from the perspective of a residential load variable-frequency air conditioning cluster unit. This strategy addresses the challenge faced by industrial electrolytic aluminum plants in coping with long-term response intervals amidst significant fluctuations in wind power consumption demand, which may lead to incomplete consumption. This study constructs a response model based on industrial and residential time-sharing tariffs, as well as the aggregator consumption penalty price, with the optimal load energy economy index serving as the evaluation criterion. A series of simulations are conducted to comprehensively evaluate the energy consumption of the two load clusters at all times and the total revenue of the aggregator in the response zone. The objective is to achieve a win–win situation for the total wind power energy consumption rate and the aggregator’s economy. The results of the simulations demonstrate that the response control strategy proposed in this study enhances the overall energy consumption rate by nearly 4 percentage points compared to a single industrial cluster. The total benefit of the load aggregator can reach CNY 941,732.09. The consumption response scheduling strategy put forward in this paper bolsters wind power consumption, triggers demand response, and significantly propels the comprehensive construction and development of the dual-high power grid.

1. Introduction

1.1. Motivation and Related Works

In light of the comprehensive, in-depth implementation of the dual-carbon plan, it can be observed that the development of power systems has been focused primarily on the advancement of new energy development, the significant improvement of energy utilization efficiency, and the optimization and upgrading of the energy consumption structure. Nevertheless, the year-on-year growth of new energy installed capacity and the comprehensive grid connection of large-scale regional new energy stations, as evidenced in the literature [1,2,3], indicate that the stochasticity and volatility of new energy outputs are gradually becoming a significant threat to system stability. Furthermore, the literature [4,5,6] demonstrates that the development of new types of power systems necessitates the development of new grid technologies in the dimensions of generation, transmission, distribution, and storage.
The advancement of intelligent control technology and the construction of the smart grid have led to an increased focus on load-side demand response, or demand response, DR. DR has emerged as a significant tool in the effort to address challenges posed by the strong peak and valley differences inherent to the systems’ new energy generation. These differences have prompted a re-evaluation of traditional approaches, with DR offering a flexible and cost-effective solution that can be integrated into existing infrastructure to facilitate more efficient energy consumption patterns.
Thus, to date, the empirical research on demand-side response technology has yielded several notable findings. Among these is the identification of industrial loads that exhibit a positive response to demand and sufficient dispatch resources, as modeled in the literature [7,8]. Furthermore, these studies have conducted a clustering analysis of industrial loads to develop a theoretical framework for the incorporation of industrial load regulation into the energy consumption equation. To evaluate the demand-side response capability of industrial loads in cement plants, electric arc furnaces in iron and steel plants, and sewage treatment plants, respectively, modeling analysis and simulation have been reported in the literature [9,10,11]. Nevertheless, given the specificities of their industrial production operations, their regulation polling time is constrained.
In terms of the demand response control of residential loads, the research outcomes attained are noteworthy. The literature [12,13,14] demonstrates the profound impact of aggregating residential loads, including electric vehicles, air conditioners, heat pumps, electric water heaters, and other appliances, in response to energy consumption. This is accomplished through experiments and demonstration projects. The literature [15] proposes that the home energy management system, together with heat pumps and heat storage devices, can be used in conjunction with the management of electric vehicle charging and discharging to enhance the flexibility of community energy management system schemes for grid scheduling response. This would facilitate the construction of a multi-load resource aggregation model applicable to residential loads. The aforementioned study illustrates the potential of civil loads to exhibit optimal energy-consumption response patterns. However, under the context of extensive energy consumption scenarios that necessitate the provision of demand response (DR) services, the low response capacity of civil aggregated loads, attributable to their inherent single-model characteristics, renders a necessity for extensive single aggregations, which consequently escalates the operational costs associated with load aggregators. Furthermore, achieving a comparable level of response service with single industrial loads remains challenging.
Given the restrictions above, some scholars have opted for industrial and residential aggregation models for grid dispatch response services. The aggregation of industrial users, in particular, can effectively improve utilization rates for wind power, as evidenced by the work of [16]. This study suggests that aggregating industrial users with smaller, commercial, or residential users can enhance energy consumption demand response. The literature in [17] also investigated key technologies, such as the optimal operation of multi-energy microgrids, risk aversion model prediction control, and optimal operation planning for cooperative microgrid clusters. The work of [18] proposed an autonomous scheduling mechanism based on load decomposition, which identifies and classifies the behaviors of industrial consumers and participates effectively in the electricity market. It also integrates the use of transferable loads and load curtailment to achieve maximum utilization of wind energy. The work of [19] specifically combines industrial loads with energy storage to achieve energy consumption under high flexibility. While the study demonstrates promising results in the energy consumption stage, it lacks an understanding of the varying response times of individual load clusters, which hinders its ability to effectively schedule resources in response to sudden shifts in wind energy consumption. This is further compounded by the unpredictability of new energy generation, which can lead to the phenomenon of wind and light being abandoned. Concurrently, the incorporation of energy storage and other infrastructure has resulted in a less optimal economic outcome than that of a direct DR response.

1.2. Research Gap and Contributions

The aforementioned literature indicates that, in certain application scenarios, DR has been shown to result in more favorable energy consumption outcomes, including reduced energy consumption and faster energy consumption response times. However, when a single industrial load is subject to fluctuating energy consumption demands, it is challenging to achieve comparable energy-consumption response speeds and fine management with civil load clusters to ensure normal industrial production. In the context of significant energy consumption demands, the civil load aggregation model is constrained in its ability to achieve comparable energy consumption outcomes with industrial clusters due to limitations in its regulation threshold and high aggregation costs.
In general, when two types of loads respond to a single demand response, their consumption response process results in a poor matching of response time, restricted scenarios, consumption redundancy, and other phenomena that lead to a decline in the power system economy and stability. Furthermore, the current research on multiple types of load response makes it difficult to propose a targeted response strategy based on the characteristics of a specific load model. This ultimately fails to give full play to the response characteristics in each load model, leading to strong valley fluctuations and a decrease in the energy consumption effect. The current research on multi-type load response makes it challenging to propose targeted response strategies based on the response characteristics of specific load models. This ultimately leads to the inability of each load model to fully utilize its response characteristics, resulting in the redundancy of consumption and damage to the interests of load aggregators under the strong valley fluctuations. This is contrary to the original intention of the research. Given that the construction cost economy is a significant factor in the energy consumption equation, it is necessary to introduce civil loads in order to enhance the flexibility of industrial load responses during periods of high wind power generation. This will help to mitigate the impact of fluctuating wind power generation on overall energy consumption.

1.3. Article Organization

The preceding research findings have led to the formation of equations for a multi-type load cluster demand response (MLCDR) control strategy. Based on a comprehensive analysis of the response characteristics of each load cluster, and to ensure a high new energy consumption rate, this paper begins with an examination of the characteristics of the industrial aluminum electrolysis plant load and the civil air conditioning load model. It then combines these findings with the specific operational and control characteristics of the aggregation unit model and builds a two-model energy consumption response architecture. In the context of large-scale auxiliary energy consumption, the industrial load is designed to achieve the maximum energy consumption to reduce the civil load cluster’s energy consumption within the constraints of the response interval. This is followed by the industrial load achieving the maximum energy consumption. Subsequently, the Equal Energy Consumption Ranking (EECR) response strategy is introduced, based on the established industrial load consumption, to determine the consumption capacity of civil load clusters in multiple periods within a single industrial load control interval. This approach aims to optimize the utilization of the short-term consumption capacity of civil inverter air conditioning clusters in the context of fluctuating consumption demand. The EECR response strategy is employed to ascertain the response capacity of civil inverter air conditioning clusters across multiple periods within a single industrial load regulation interval. This is performed to optimize utilization of the response flexibility of civil inverter air conditioning clusters in the context of fluctuating consumption demand with a short regulation time.

2. Industrial DR Cluster Demand Response Analysis

2.1. Analysis on Characteristics of Industrial Load DR Cluster

China’s industrial sector plays a vital role in providing auxiliary services to the power grid due to its significant regulation capacity, rapid response, and stable behavior in managing time-domain fluctuations at the power grid response resource end. Industrial loads are well-suited to offer these services, with different aggregation scenarios falling into three categories based on the production work and operational characteristics of industrial equipment: reducible load, transferable load, and self-contained power plants.
Each type of industrial demand response (DR) aggregation cluster has distinct features when contributing to grid auxiliary services. Reducible loads can address peak demands but may face challenges in meeting energy consumption requirements during low-demand periods. Self-contained power plants have high energy consumption and carbon emissions, making it difficult to achieve environmental targets.
Transferable loads, such as DC power equipment like electrolytic aluminum, are equipped with speed regulation devices that allow for precise responses to dispatch signals. These loads demonstrate high accuracy in regulating auxiliary services, enabling an effective management of power intervals and aligning well with the response characteristics of civil load clusters. This enhances the overall effectiveness of demand response. Consequently, this study focuses on selecting typical electrolytic aluminum plants with transferable loads in the industrial sector as counterparts to civil DR clusters to carry out a two-stage auxiliary service of load aggregator energy consumption under the grid-side day-ahead dispatching model.

2.2. Electrolytic Aluminum Plant Response Model

An electrolytic aluminum plant is capable of utilizing strategies such as adjusting cell voltage or selectively halting the operation of specific electrolytic production cells to provide ancillary services to the power grid. To align with the rapid response features of demand response (DR) clusters and ensure the continuous operation of the facility while maintaining its responsiveness, the former approach is selected as the primary method for regulating power for auxiliary services at the plant.
As indicated by the findings in the work of [18], the power consumption pattern of an electrolytic aluminum enterprise, as depicted in Figure 1, indicates that power generation varies within a relatively narrow margin throughout its operational cycle, suggesting a limited level of power fluctuation. This consistency is crucial due to the operational requirements of industrial electrolytic aluminum production, where maintaining thermal equilibrium within the electrolytic cells is of the utmost importance. To maintain equilibrium, the overall regulation process requires that the increase and decrease in capacity at the electrolytic aluminum plant are balanced. The capacity of a single regulation in the auxiliary service process of electrolytic aluminum is as follows:
P d t = P d + α d t P d m a x
Among them, P d t is the electrolytic aluminum enterprise to participate in the regulation of load at time t; P d is the average load capacity of the electrolytic aluminum enterprise; P d m a x is the maximum operating capacity of the electrolytic aluminum enterprise during operation; α d t is the regulation coefficient of the electrolytic aluminum enterprise at time t; α d t > 0 indicated that this regulation is upward regulation, i.e., increasing load capacity; and α d t < 0 indicates that this regulation is downward regulation, i.e., reducing load capacity.
According to the work of [18], in order to maintain the overall operation energy efficiency stability of an electrolytic aluminum plant, the load regulation fluctuation range of electrolytic aluminum industry is set to −10% to 10%
10 % α d t 10 %
To safeguard the operational fervor of electrolytic aluminum companies engaged in ancillary services and to uphold their consistent progress, a regulation interval of 2 h has been designated for these enterprises, with no consideration given to a regulation cycle threshold. Additionally, to uphold the safety standards for electrolytic aluminum production, it is imperative for these entities to contribute to the collective stability of the electrolytic cell’s heat throughout the regulation procedure. This entails compliance with the comprehensive energy efficiency DR power constraint specific to industrial electrolytic aluminum, as delineated in Equation (2).
s u m P d t = n P d
where n is the number of regulations, given the characteristics of the work of electrolytic aluminum and scheduling in the day before the scheduling planning model. The contract for the specific control parameters for industrial DR is shown in Table 1.

3. Civil DR Cluster Response Analysis

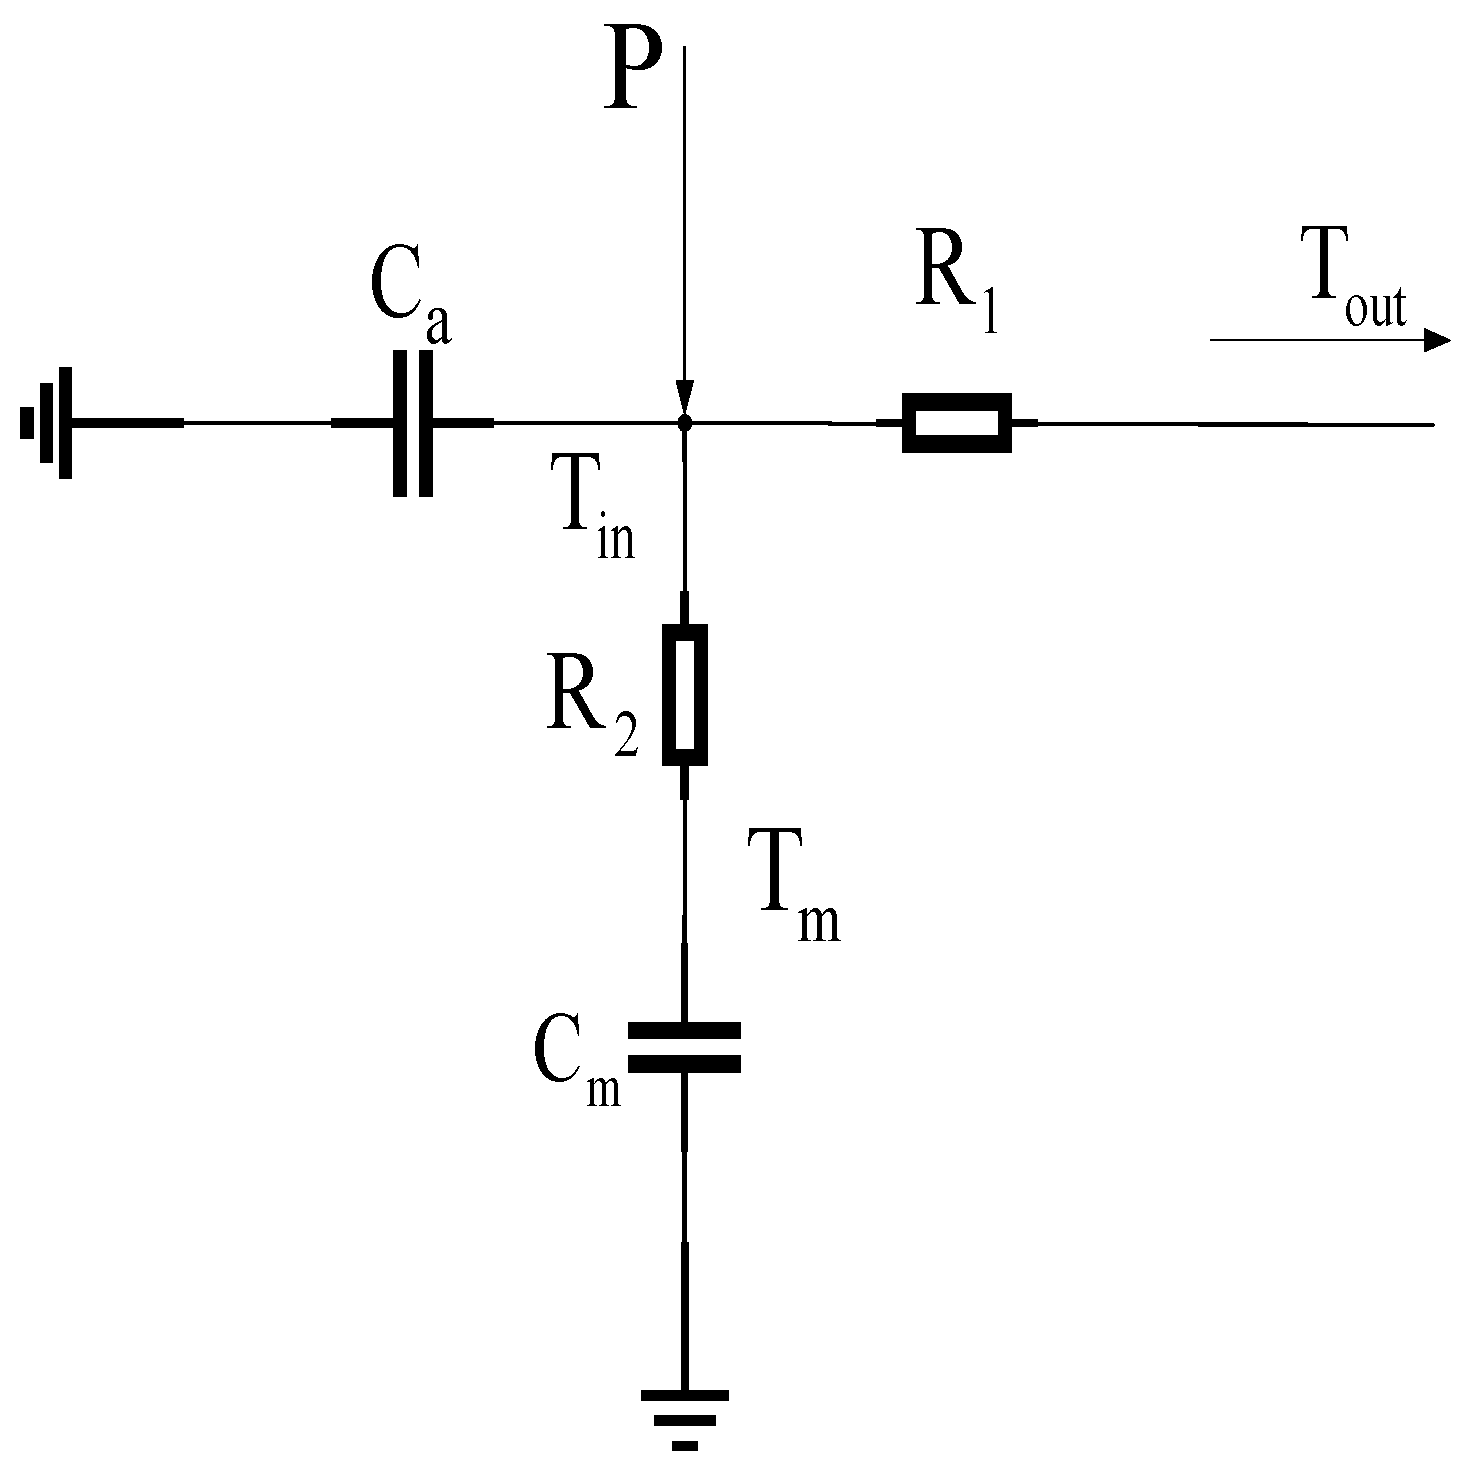
3.1. Response Analysis of Air Conditioning Model

Presently, scholarly investigations on civil demand response (DR) predominantly concentrate on air conditioners, heat pumps, electric water heaters, and electric vehicles, which have the capacity to engage in DR by making moderate power adjustments while maintaining user comfort. Within this framework, the inverter air conditioner, characterized by its swift regulation capabilities and widespread user adoption, emerges as a notable subject of interest. Consequently, this study opts to focus on the civilian inverter air conditioning cluster for response analysis.
To determine the combined power of the inverter air conditioning cluster, the initial phase involves establishing a specific correlation between the power output of the air conditioning model and the indoor temperature. Typically, in order to simplify the relationship structure and lessen computational intricacies, factors like internal and external wall treatments are streamlined for isothermal conditions. Subsequently, an equivalent thermal parameter (ETP) model equation is constructed based on circuit modeling principles, as detailed in the existing literature [19,20] and illustrated in Figure 2.
T m is the indoor solid temperature, which is subjected to the first-order equivalent simplification treatment to obtain the relationship (3).
d T i d t = 1 R l C a T o u t T i P c C a s t
T i denotes the indoor gas temperature. R l represents the equivalent heat resistance, expressed in units of J/°C. Similarly, C a denotes the equivalent heat capacity, also expressed in units of J/°C. Finally, T o u t represents the external temperature. P c is the capacity of the cooling system, expressed in kW. The state of the switch, designated s t , can assume two values: 0 or 1. The interpretation is as follows. When s t = 0, the cooling system is in the off state. Conversely, s t = 1 indicates that the cooling system is in the on state. The relationship between the air conditioning cooling capacity and the rated power is illustrated in Equation (4). The energy efficiency ratio, designated as ƞ, represents the specific value provided within the air conditioning contract.
P c = P ƞ
The air conditioner switch status and temperature dead zone are very closely related to the initial temperature setting
T m i n = T s e t δ 2
T m o x = T s e t + δ 2
T m a x ,   T m i n are the upper and lower temperature limits, T s e t is the temperature setpoint, and δ is the temperature dead zone, i.e., the operating temperature interval of the air conditioner.
Cluster units in the air conditioning cluster participate in the regulation of non-full process participation in the regulation service, i.e., non-full single-state moment. The specific regulation process is shown in Figure 3.
Where t o n and t o f f are the air conditioning unit’s responses to regulation of the on and off times, respectively, in hours (h), which are related to the weather temperature and the temperature dead zone. According to the work of [19], its specific model relationship equation is
t o n = C a R 1 l n R 1 P c + T m a x T o u t R 1 P c + T m i n T o u t t o f f = C a R 1 l n T o u t T m i n T o u t T m a x
t c = t o n + t o f f
Among these, t c adjusts the duration of polling periods and monitors the response characteristics of civil clusters and the pre-emptive response scheduling plan. Given the limited temporal resolution of wind power and industrial load DR response resource time, the polling time is set to 0.5 h, or t c = 0.5 h .

3.2. Response Strategy of Air Conditioning Cluster Unit Based on Equal Energy Consumption Ranking (EECR)

Due to the high expenses associated with small- and medium-sized demand response (DR) aggregation and the limited individual response power, achieving widespread effective consumption is challenging at present. To address this issue, the concept of a load aggregator is introduced. The LA (Load Aggregator) facilitates single aggregate power droop control through the establishment of effective contracts with aggregation units and auxiliary service agreements with the grid side. This approach aims to maximize the utilization of DR resources for energy resource response, with the primary objective of maximizing economic benefits throughout the energy consumption control process.
The LA focuses on the specific regulations for inverter air conditioning clusters, considering the unique characteristics of cluster unit regulation. This measure is implemented to mitigate the temperature boundary effects within the air conditioning cluster units. Traditional temperature sorting algorithms for room temperature often struggle to determine the specific level of cluster units’ willingness to participate, leading to challenges in effectively engaging in short-term open regulation times and potentially reaching temperature dead zones quickly. This results in an inefficient use of response resources.
Moreover, in order to determine the optimal number of participating units within the air conditioning cluster, the concept of Equivalent Energy Consumption Ratio (EECR) is proposed in this research. The EECR is utilized to establish the internal response strategy of inverter air conditioning clusters to homogenize the response capacity of the participating units, as depicted in Figure 4.
a.
The initial premise assumes that cluster units operate at rated power and specifically respond to turn-on runtime, using Equations (3) and (7).
b.
Equation (9) is used to solve the response participation power in the regulation interval of each cluster unit and to sort them according to the numerical value. At the same time, the response power of an air conditioning cluster unit can be obtained through logical processing and isothermal processing as follows:
P ¯ i = 0 t o n , i P c , i d t t c , i
P A C L , m a x = i = 1 I   T o u t T m i n η i R i
P A C L , m i n = i = 1 I   T o u t T m a x η i R i
where P ¯ i is the EECR response capacity of the air conditioning cluster unit, t o n , i is the opening of the regulation of the ith air conditioning unit when it responds, P A C L , m a x is the upper limit of the aggregate power of the air conditioning, P A C L , m i n is the lower limit of the aggregate power of the air conditioning, η i is the ith air conditioning energy efficiency ratio, and R i and is the ith air conditioning equivalent thermal resistance.
The overall EECR flow chart is shown in Figure 4.
The specific steps are as follows:
Step 1: This consumption is a simplified process, assuming that the cluster unit model occurs in a uniform response state. EECR processing is performed on the cluster unit described above in combination with Equations (3) and (8)–(11).
Step 2: Add and subtract uniform average sorting. Use Equation (12) to find the uniform response quantity of the unit.
I = P x P ¯ i
where I is the number of units participating in the response cluster. P x is the number of cluster unit EECR responses.
Step 3: Enter a two-stage response control strategy, output an overall air conditioning cluster response capacity, and evaluate whether the constraint condition is met with the one-stage industrial load cluster response capacity set. If the constraint condition is satisfied, then output the response capacity of each cluster. If the constraint condition is not met, the number of air conditioning cluster units can be increased or decreased in real-time by the day-ahead response scheduling model, and the EECR can be performed again. During this period, all cluster units participating in the calculation represent this regulation. The power value of the inverter air conditioning cluster unit represents the two-stage response value.
The specific quotation of the DR contract for two-stage inverter air conditioner clusters is shown in Table 2.

4. Two-Stage Optimization Model

4.1. Aggregator Regulation Process

The energy sector employs a range of compensation strategies based on response capabilities. These are implemented through the establishment of regulation contracts with industrial and civil users, as well as auxiliary service agreements with power grids. The specific liquidation income is determined by the full-time compensation price difference between liquidation income and liquidation outcome. To optimize the integration of wind and solar power, it is essential to take into account the distinctive response capacities, start–stop times, and flexibility of both large industrial users and residential users. The approach aims to capitalize on industrial users’ high capacity to absorb a consistent portion of wind power and to utilize the adaptable start–stop capabilities of inverter air conditioner clusters to stabilize the fluctuating portion. This strategy allows for the precise matching and utilization of renewable wind and solar resources.

4.2. Two-Stage Optimization Model Construction

For two load types with different regulation times and regulation thresholds, this paper establishes a multi-type load regulation model under a two-stage optimization model. An economic dispatch model is established, which takes industrial load as one stage and civil air conditioning clusters as two stages. The specific structure diagram is shown in Figure 5.
In the initial phase, the model incorporates new energy consumption data as a scenario, with the industrial load adjusting real-time power to prompt the air conditioning cluster to modify response power levels. This adjustment aims to enhance the wind rejection rate effectively, thereby achieving optimal returns for the aggregator during the first-stage regulation.
During the subsequent phase, the residential air conditioning cluster adapts local power response parameters within the industrial load regulation timeframe. This adjustment is based on the temperature dead zone and indoor temperature, ensuring the continuity of industrial load power within the regulation interval and the constancy of local power during the corresponding period. The objective is to facilitate wind power consumption matching and ultimately achieve comprehensive economic optimization of the full-time aggregation quotient.

4.3. Overall Objective Function and Evaluation Index Construction

4.3.1. Integral Objective Function Construction

In light of the necessity to guarantee the security and dependability of the power grid and the production security of industrial load enterprises, the output control of electrolytic aluminum enterprises is not a concern. The initial stage of optimization is based on the maximization of the aggregator gain as the objective function. According to the literature, the aggregator gain is comprised of three distinct components: (1) f 1 the compensating differential used to regulate industrial loads; (2) f 2 the compensation difference for clustering civil air conditioning loads; and (3) f 3 the penalty cost for abandoned wind energy. Specifically:
f = m a x ( f 1 + f 2 f 3 )
f 1 = ( c c , t c g , t ) ( P d ( t ) )
f 2 = ( c c , t c m , t ) ( P A C L ( t ) )
f 3 = c c , t ( P B ( t ) )
c c , t is the aggregator on the grid side’s participation in the absorption of the new energy income coefficient. c g , t is the compensation coefficient for aggregators to allow civil air conditioning users participation in scheduling. c m , t is the compensation coefficient for aggregators to give industrial electrolytic aluminum users participation in scheduling. P A C L ( t ) is the aggregate response power of air conditioning, and P B ( t ) is the unpunished consumption.

4.3.2. Construction of Consumption Evaluation Index

To facilitate a comprehensive evaluation of response cluster power, this paper introduces a comprehensive index of DR response. The index is designed to facilitate a comparison of the advantages and disadvantages of response strategies under different scheduling scenarios. In this context, energy consumption and the LA economy are identified as win–win objectives. Consequently, the introduction of Equations (17) and (18) is proposed.
L = f ε
ε = ε 1 / ε 2
Among them, f is the final economic income, ε is the energy consumption rate, ε 1 is the energy response amount, ε 2 is the energy consumption demand, and the greater the L value, the higher the confidence of win–win situation.

4.4. Consider the Load Regulation and Constraint Model under the Energy Consumption

4.4.1. One-Stage Constraints

In the initial phase of optimizing the energy consumption regulation, with the industrial load as the main body, the specific requirements are as follows:
(1)
Aggregation power constraints
The aggregator coordinates the participation of various types of loads in regulation by acquiring the day-ahead energy generation regulation demand from the grid side.
P A ( t ) = θ g r e , t P d ( t ) + θ m r e , t P A C L ( t )
0 P A ( t ) P m a ( t )
The total regulation amount of auxiliary service provided by the aggregation power grid at time t is denoted by P A ( t ) . The regulation coefficient of the electrolytic aluminium enterprise at time t is represented by θ g r e , t , taking on values of 0 or 1, respectively, indicating non-participation and full-time participation. θ m r e , t represents the auxiliary service coefficient of air conditioning aggregation, with values ranging from 0 to 1. Values of 0 indicate full-time non-participation, while values of 1 indicate full-time participation. P m a ( t ) represents the regulation demand of new energy purchased by the power grid at time t.
(2)
Electrolytic aluminum plant power constraints:
s u m ( P d ( t ) ) = n P d
0.9 P d P d ( t ) 1.1 P d
Electrolytic aluminum enterprises are industrial enterprises, and the regulation capacity cannot reach fine management; that is, P d ( t ) is an integer in the solving process.
Equations (21) and (22) represent the upper and lower power limits and the integrated control power constraints in the aluminum electrolysis control process, respectively, so that electrolyzed heat conservation is achieved at all times.
(3)
Air conditioning regulation power constraints:
P A C L , m i n P A C L t P A C L , m o x
Equation (23) ensures that the power demand of all-time air conditioning regulation is within the allowable range, and the participation of residents is improved while meeting human comfort, thus forming a benign interaction with load aggregator regulation.
(4)
Overall wind rejection rate constraint
0.85 P m a ( t ) P A ( t ) P m a ( t )
In accordance with Equation (24), it is recommended that the safety of the power grid is prioritized while the regulation and control of wind power curtailment rates simultaneously decreases. This approach aims to enhance energy consumption efficiency on the demand side and bolster the economic stability of the system.
By implementing a single-stage constraint mechanism with a 2 h regulation interval, the industrial demand response (DR) capacity can be determined, leading to the acquisition of a diverse range of regulation participation quantities primarily driven by industrial loads.

4.4.2. Two-Stage Constraints

During the following stage, industrial load regulation participation is determined by the first-stage optimization solution, and the solution in this stage is used to determine the civil load’s participation in the hourly segment regulation capacity in the industrial load regulation interval. The specific constraints of this stage constrain the response capacity solution while determining the aggregator energy economy indicators.

4.5. Model Solution Method

YAMLIP (20220201) and CPLEX (20.1.0·), which stand for Comparative Performance Analysis with X-validation and operate within the MATLAB 2019 framework, have been introduced as methods to address the two-level optimization model related to load aggregator operation, taking into account both industrial and civil load characteristics.
YAMLIP’s algorithm is characterized by its rapid solution speed. By leveraging advanced optimization algorithms and techniques, it enables efficient identification of the optimal or near-optimal solution, thereby saving time and resources. This approach also aids in streamlining mathematical model complexity while maintaining model accuracy. The optimization solver CPLEX is utilized in the initial stage to prevent convergence to local optimal solutions. A multi-type load optimization process is conducted based on the aggregator revenue target within a specified simulation timeframe.
In the subsequent stage, the YALMIP plug-in is employed, and the CPLEX solver is invoked to address the problem at hand. Throughout the solution procedure, the optimization of the aggregate quotient is pursued under the constraint of the predetermined industrial load regulation capacity. The objective is to continuously ascertain the regulation capacity of each cluster, ensuring the economic optimization of the aggregate quotient at all times.

5. The Example Analysis

5.1. Calculation Data Description

According to the short-term wind power prediction time characteristics and air conditioning DR cluster response time characteristics, to capture the typical day (where for the typical day-specific characteristics of the power of strong peaks and valleys characteristics, the wind power consumption demand response should not be much larger than the amount of industrial clusters to prevent more than the system’s basic aggregation of power total constraints on the upper limit, and at the same time, should not be lower than the minimum response adjustment power of industrial loads) this energy consumption considers LA work characteristics to be set as a few days ago. This scheduling model works according to the wind power short-term prediction research characteristics to ensure a certain prediction power accuracy, at a selected 0.5 h interval of wind power data, while facing large-scale energy consumption to retain the decimal point of data. The specific data are plotted in Figure 6.
(1)
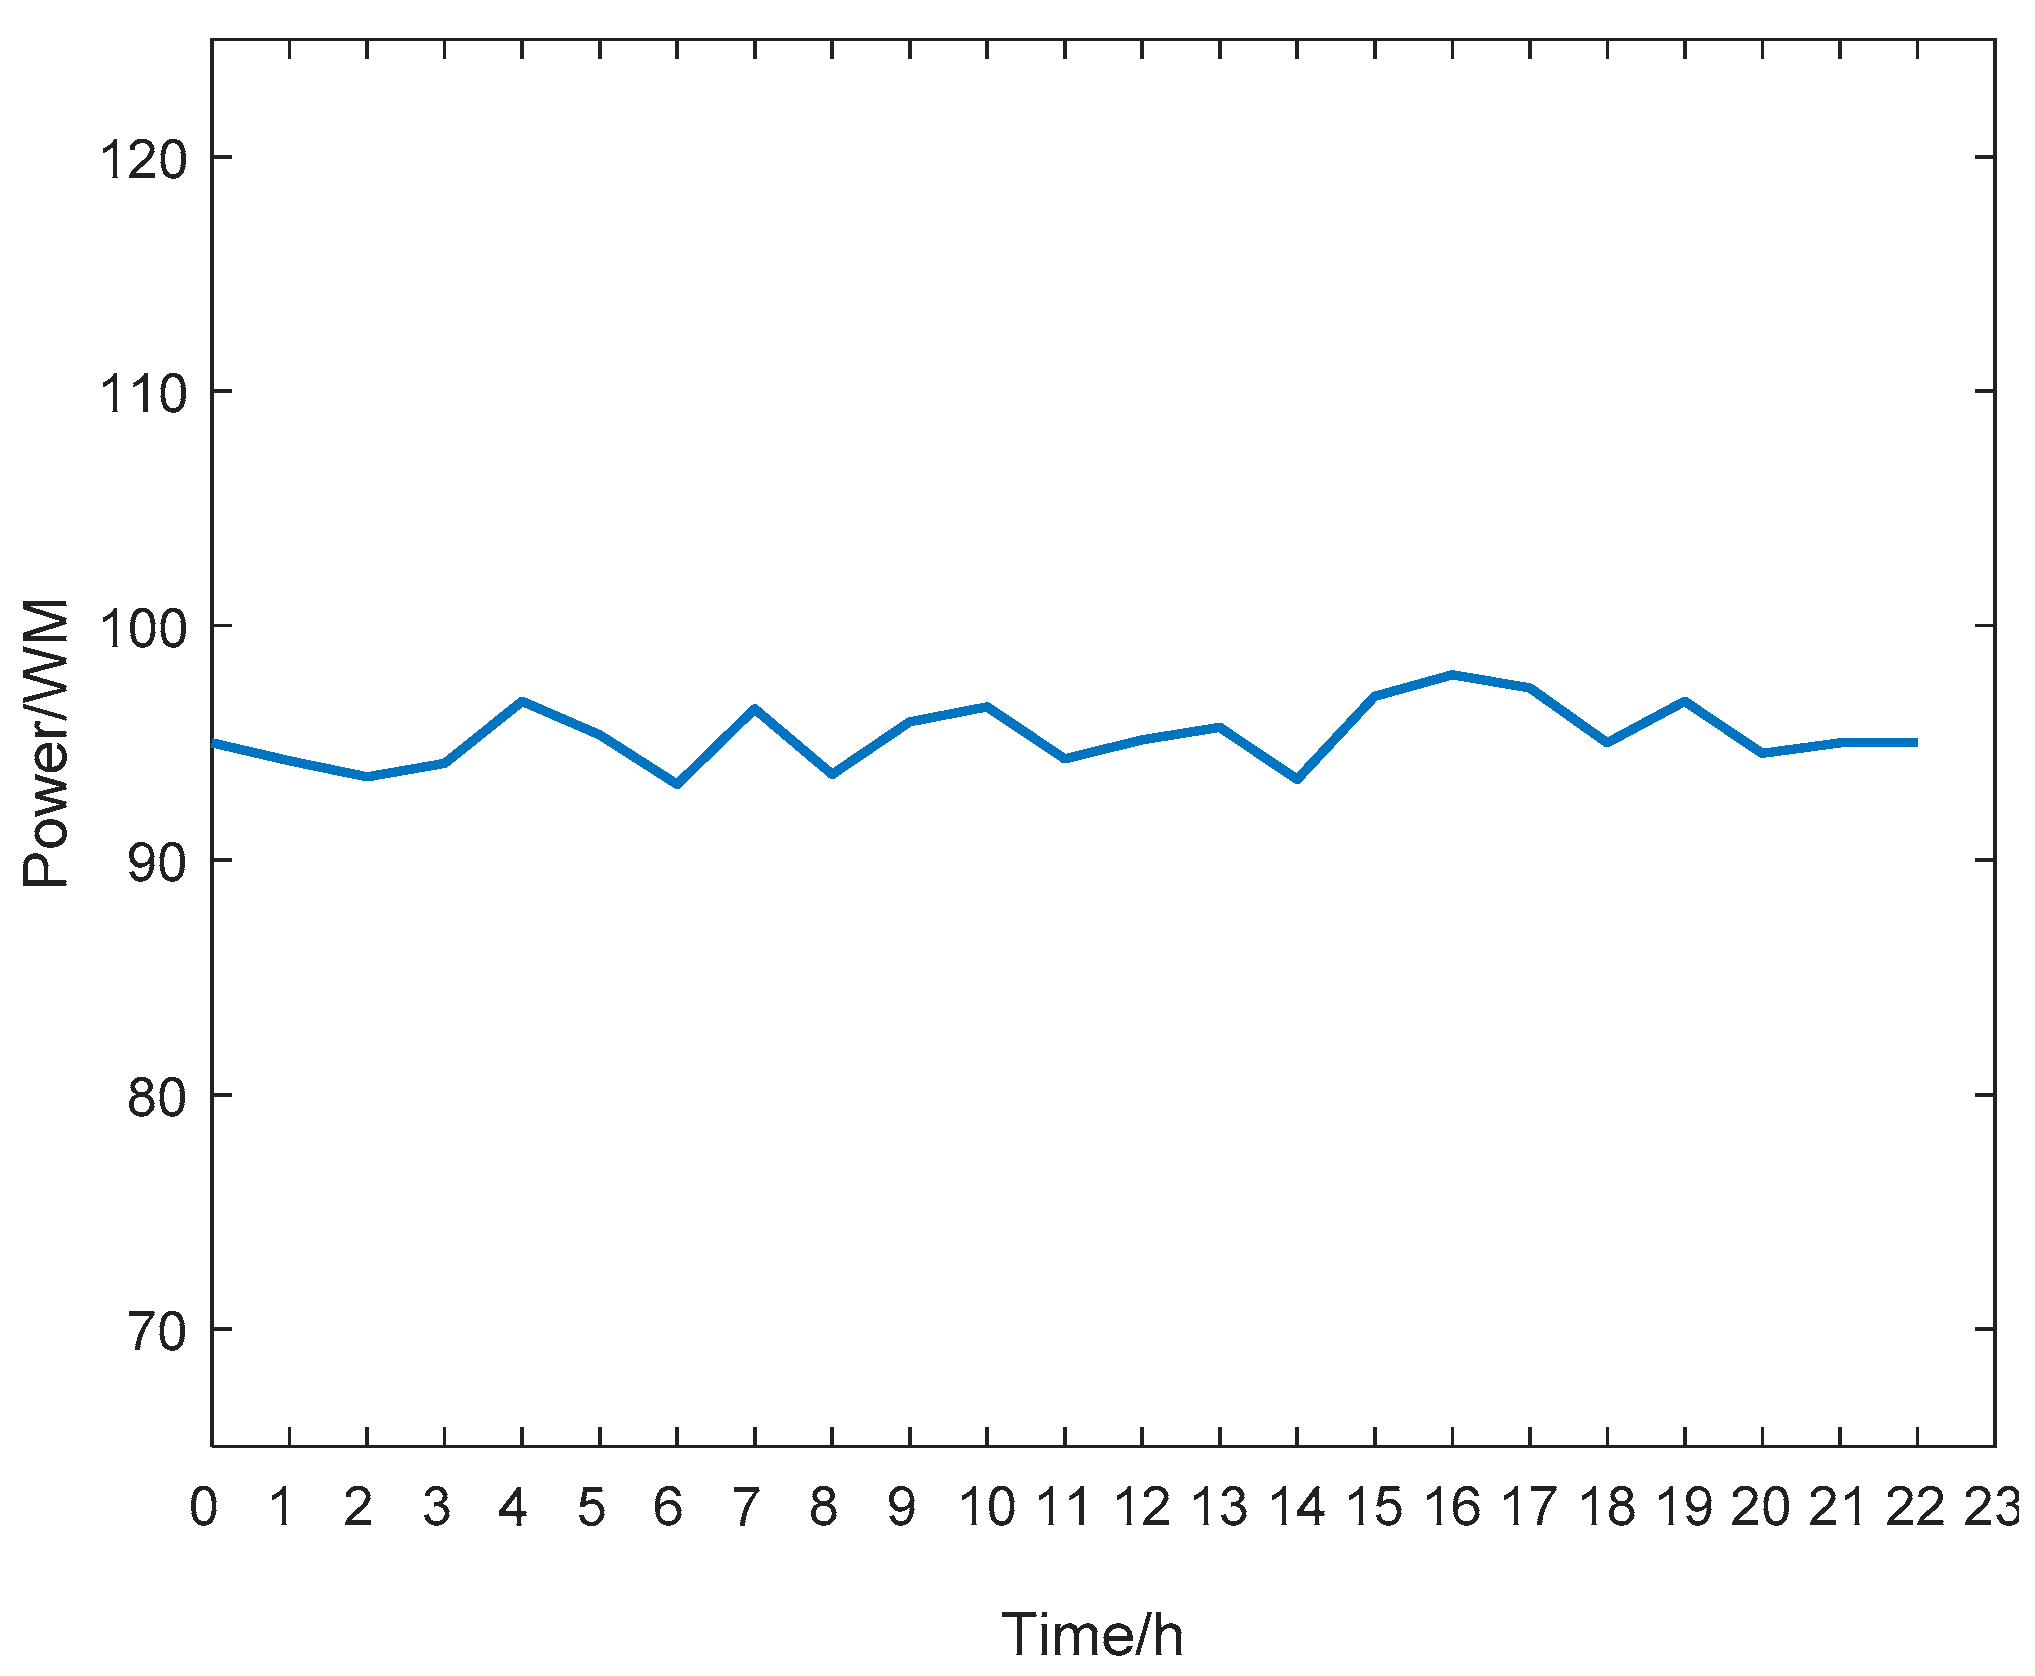
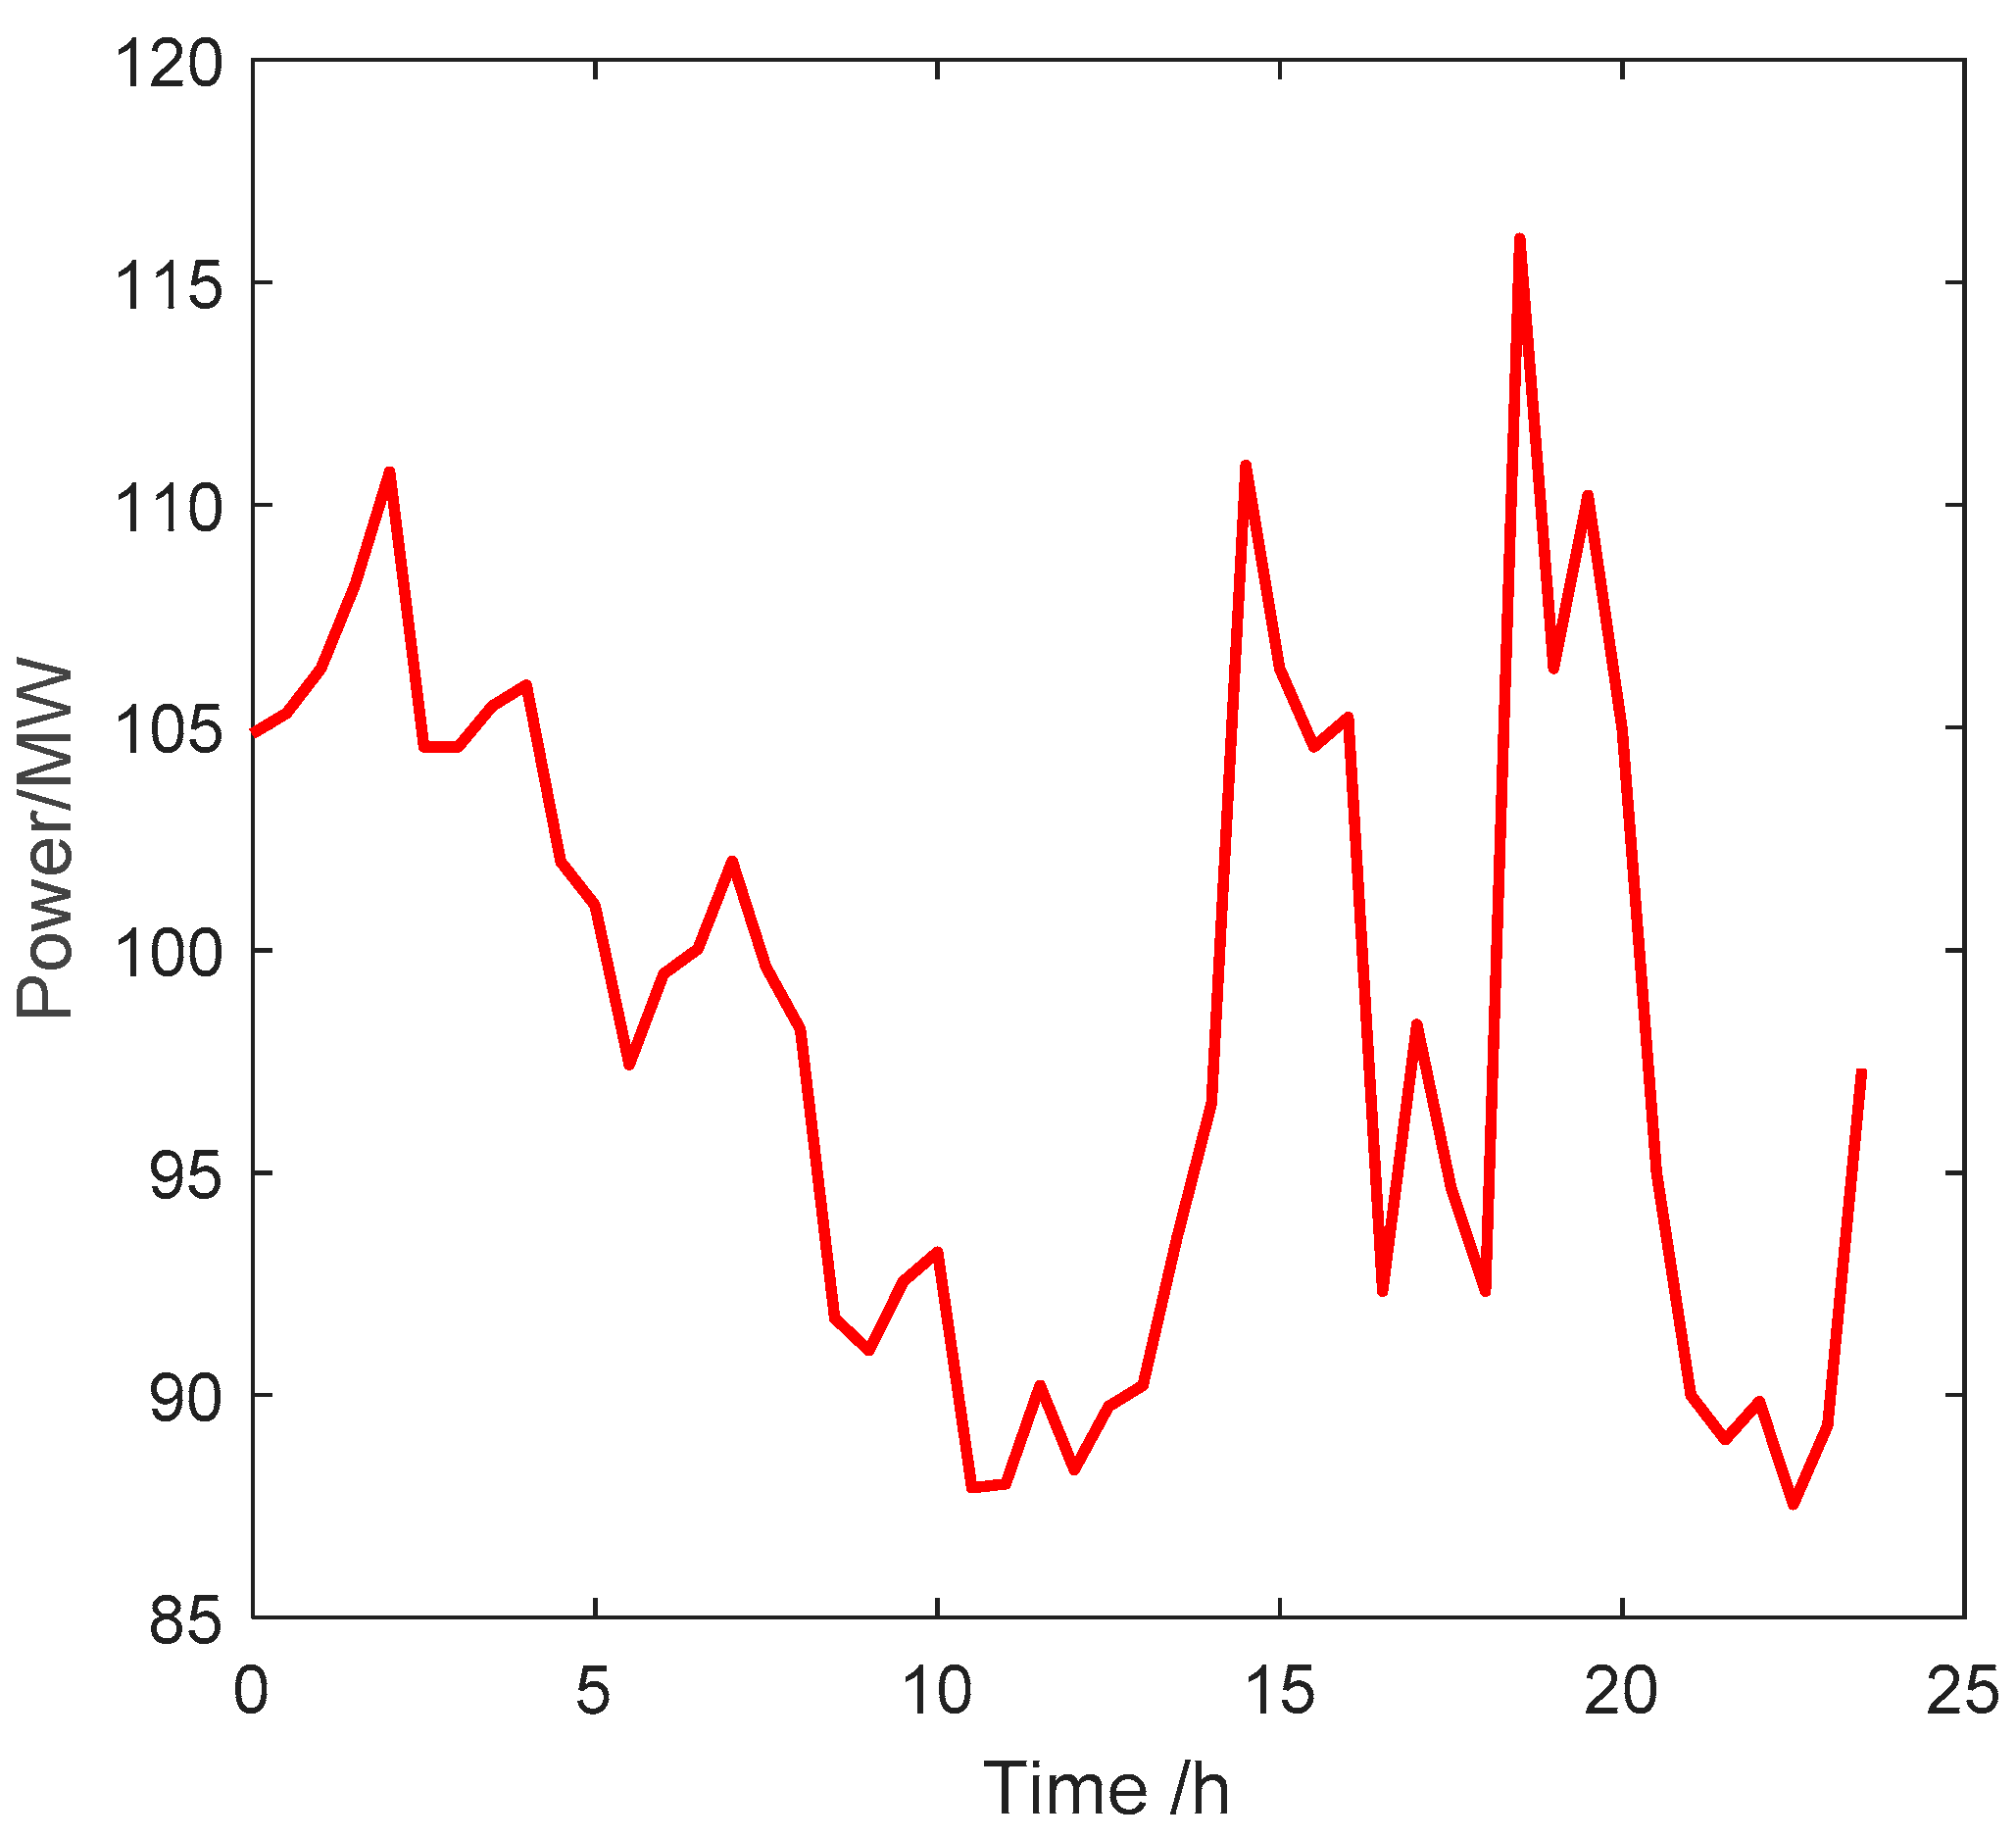
The data in the figure are initially grouped into 48 clusters. To streamline the data research and cleaning procedures, the starting time of the initial target consumption cluster is provisionally set at 0 time. Following the response patterns of the industrial DR cluster, a data selection interval of 2 h is employed, resulting in the formation of 12 data groups comprising the first target consumption cluster. The second target consumption demand consists of 48 groups of predicted wind power consumption data. Based on the optimization allocation model described above, specific parameters for industrial and civil load price contracts within a designated area are chosen as follows:
(2)
The compensation strategy of industrial load price
Peak hours are 0:00 to 2:00, 8:00 to 10:00; valley hours are 16:00 to 20:00. The specific electricity prices are shown in Table 3.
The civil load air conditioning cluster utilizes a continuous compensation approach, with a compensation rate of CNY 185 per megawatt (MW). The combined compensation and penalty rates on the grid side amount to CNY 320 per MW and CNY 400 per MW, respectively.

5.2. Optimization Results

To streamline the resolution procedure and reduce the computational duration, a total of 10,000 inverter air conditioning clusters were chosen, and the sorting method for EECR cluster units was further streamlined. The scenario assumes an indoor temperature distribution of 20 °C and an outdoor temperature of 36 °C. The precise contractual specifications of the inverter air conditioning cluster units are detailed in Table 4.

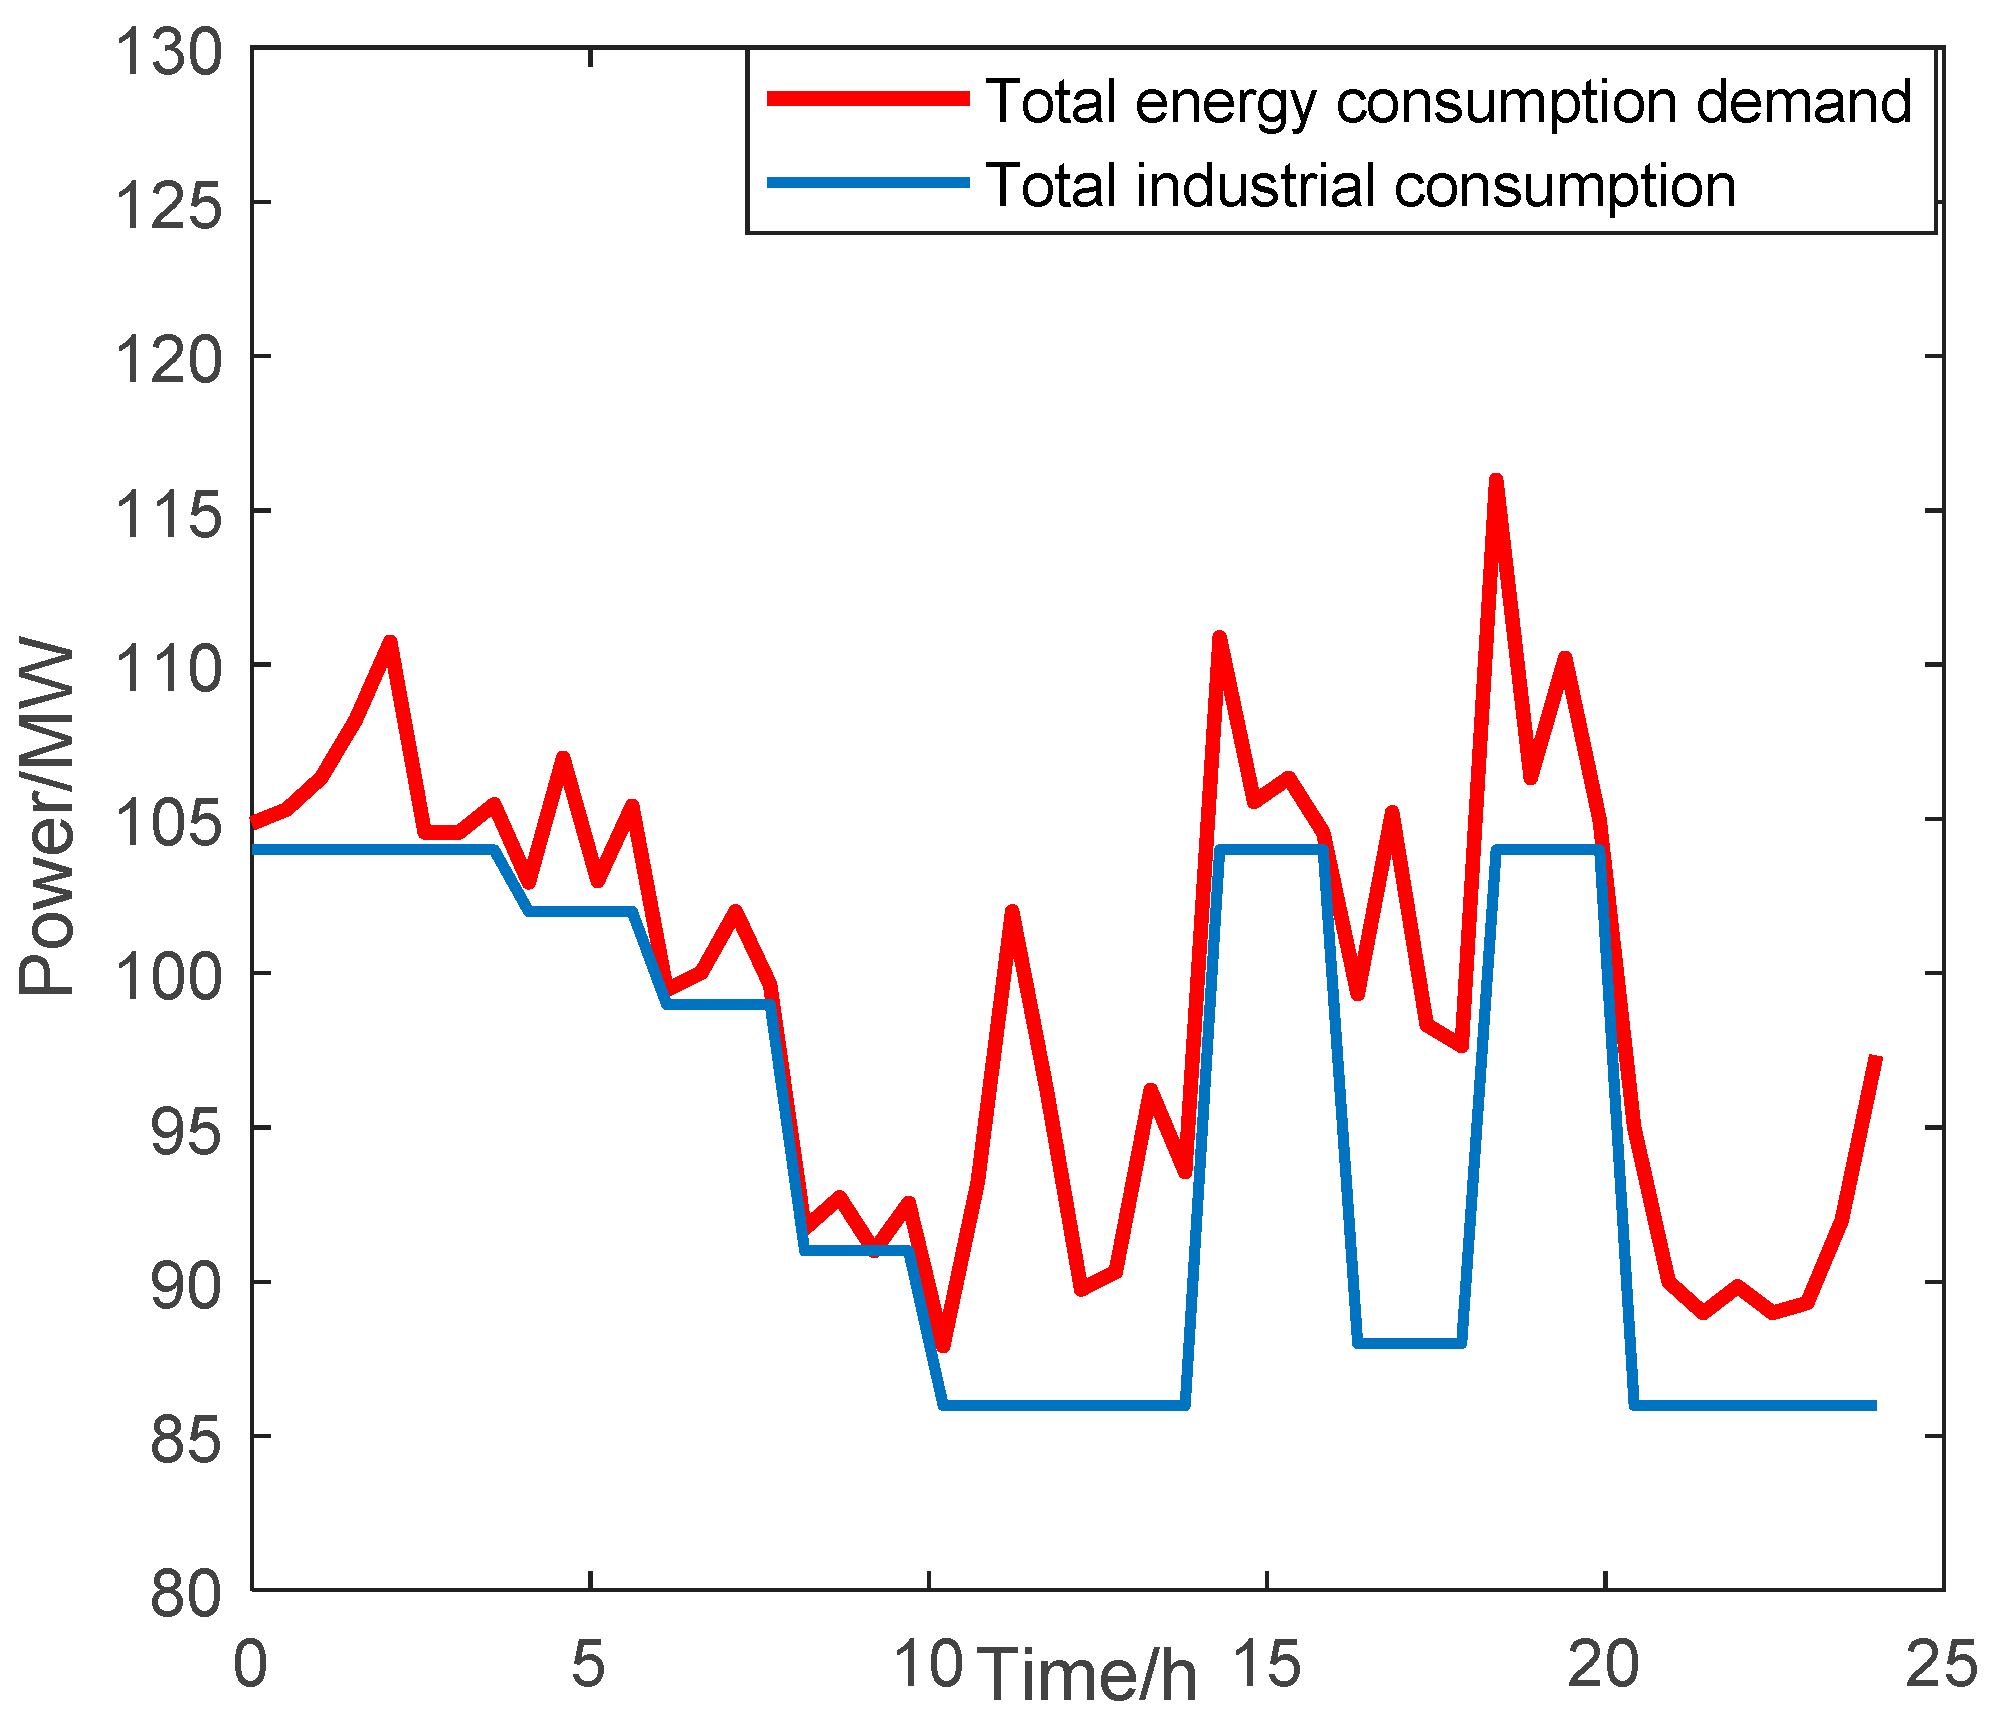
5.2.1. One-Stage Optimization Calculation Results

When conducting the initial optimization process, the industrial demand response (DR) cluster’s ability to regulate its response time is set to zero, while also considering the power grid side consumption acquired by the aggregator. The data on wind power consumption demand associated with the initial regulation are captured in conjunction with the characteristics of the regulation, as depicted in Figure 7.
Calculate the total load regulation capacity of an electrolytic aluminum facility and the level of involvement of specific air conditioning clusters when maximizing revenue from the LA in the initial phase of optimization, as illustrated in Figure 8.
The data presented in Figure 8 illustrate that the blue portion represents the demand response (DR) amount of the industrial cluster, while the orange portion represents the DR amount of the civil cluster. During the initial stage of consumption, the power response amount of the industrial cluster is notably high, indicating the influential role of the industrial cluster in the overall consumption process.
Figure 9 displays the comprehensive energy consumption during phase I.
During the initial phase implemented within specified limitations, the primary focus is on aligning the demand response with the industrial load in a time-sharing manner. Additionally, the wind energy absorption rate is set at 100%, ensuring complete utilization of wind energy fluctuations.

5.2.2. Two-Stage Optimization Results

Utilizing the one-stage industrial demand response (DR) optimization model as a foundation, a two-stage optimization approach is implemented for full-time air conditioning participation. This strategy aims to adhere to the regulatory time constraints, specifically ensuring that the total duration of polling regulation time does not exceed 0.5 h.
t o n + t o f f = 0.5
Figure 10 shows the specific AC cluster DR response obtained by using the CPLEX (20.1.0), solver.
Based on the distinct output features depicted in the graph, it can be inferred that a significant disparity exists in the overall response capabilities between the air conditioning cluster and the industrial cluster. This discrepancy underscores the prominent leadership role of the industrial load within these two clusters.
Combined with the industrial load data of one-stage optimization, the full-time downwind energy consumption is obtained, as shown in Figure 11.
The illustration demonstrates that full consumption is attained in this scenario. The comprehensive consumption depicted in Figure 11 is commendable, although achieving complete overall consumption is challenging at certain peak times due to the impact of industrial DR regulation polling intervals. Nevertheless, this situation does not result in significant frequency fluctuations and effectively preserves the stability of the power grid.
The DR response of each cluster is shown in Figure 12. The proportion of industrial cluster consumption in Figure 11 further comprehensively shows the guiding role of the industrial cluster in stabilizing the valley difference in energy consumption.
Where the energy consumption rate is 0.9908 and the payoff is
f = m a x f 1 + f 2 f 3 = 941,732.09   ( yuan ) L 1 = f ε = 933,068.15

5.3. Compare Optimization Schemes

Scheme 1: Only industrial load regulation capacity optimization results under full-time regulation are shown in Figure 13.
The overall income is CNY 2,237,242.02, and the energy consumption rate is 0.9532, which is far less than the overall consumption income of the two energy clusters.
L 2 = f ε = 226,139.09 L 1 > L 2
Analysis of the diagram reveals that the DR response of a single industrial cluster is minimal when multiple types of cluster DR regulations are implemented. This results in significant consumption redundancy and a higher injection of active power into the power grid, which may lead to widespread system oscillation issues. Such problems can greatly impact the power grid’s safety and consumption stability. In scheme II, which focuses on regulating air conditioning clusters at all times, it is noted that optimizing the participation level of these clusters poses challenges. In particular, the participation level of these clusters frequently fails to align with energy consumption constraints. Consequently, during large-scale energy consumption events, these clusters are unable to participate effectively and independently, serving only as a partial component of energy consumption regulation and control.

6. Conclusions

This study introduces a two-layer optimization model designed for managing inverter air conditioning clusters and industrial alumina loads in the context of wind power consumption. The model is solved using the YAMLIP (20220201) and CPLEX (20.1.0). The simulation results indicate several key findings:
  • In scenarios involving large-scale wind power consumption, individual civil load clusters exhibit limited energy consumption, posing challenges in maintaining high energy consumption rates and meeting system stability requirements.
  • The energy consumption of single industrial loads is significant due to adjustment intervals, leading to prolonged duration issues. Managing the strong fluctuations in energy consumption demand during the control operation stage becomes challenging, resulting in difficulties in matching fluctuations, leading to problems of over-consumption and under-consumption. This situation hampers the power grid’s frequency and phase adjustments.
  • The proposed MLCDR response strategy leverages the characteristics of civil air conditioning clusters and electrolytic aluminum loads. This strategy effectively combines the small-load and high-consumption features of industrial loads, reducing response aggregation costs. By utilizing civil loads as auxiliary components to industrial loads, the strategy ensures that industrial loads can positively and flexibly respond to energy consumption demands within control intervals. This approach enhances the flexibility and auxiliary response capabilities of industrial loads, thereby improving industrial load auxiliary service flexibility. The simulation model incorporates energy economic indicators, demonstrating the effectiveness of the proposed strategy in addressing large-scale wind power consumption fluctuations. The simulation data reveal a wind energy consumption rate that exceeds 99%, ensuring optimal control strategy benefits amounting to CNY 971,732.09 for LA.
  • This paper demonstrates how the research content of wider application scenarios can be applied to the new energy station power supply model, effectively improving the robustness of the power grid. However, in some periods, if the elimination of the overall need for the industrial load demand is significantly lower than the baseload power demand, the scheduling response strategy needs to be further optimized and adjusted.

Author Contributions

Software, E.W.; Formal analysis, L.J.; Investigation, L.W. and J.L.; Resources, Q.Z.; Writing—review & editing, L.J. All authors have read and agreed to the published version of the manuscript.

Funding

This research was funded by the Liaoning Provincial Department of Education Surface Project (LJKMZ20221707) and Liaoning Provincial Department of Science and Technology Joint Fund for Innovation Capacity Enhancement (2022-NLTS-16-05).

Data Availability Statement

The data presented in this study are available on request from the corresponding author due to confidentiality of wind power data.

Conflicts of Interest

Author Jinkuo Li was employed by the company China Energy Construction Group Liaoning Electric Power Survey and Design Institute Co., Ltd. Author Qiang Zhang was employed by the company State Grid Liaoning Electric Power Academy. The remaining authors declare that the research was conducted in the absence of any commercial or financial relationships that could be construed as a potential conflict of interest.

References

  1. Tong, Y.; Fan, W.; Liu, Z. Influence of Wind Power Generation System Accessing to Traction Power Supply System on Power Quality; Lecture Notes in Electrical Engineering; Jia, L., Qin, Y., Liang, J., Liu, Z., Diao, L., An, M., Eds.; Springer: Singapore, 2022; Volume 864. [Google Scholar]
  2. Tsai, W.-C.; Hong, C.-M.; Tu, C.-S.; Lin, W.-M.; Chen, C.-H. A Review of Modern Wind Power Generation Forecasting Technologies. Sustainability 2023, 15, 10757. [Google Scholar] [CrossRef]
  3. Bagdadee, A.H.; Zhang, L. Electrical Power Crisis Solution by the Developing Renewable Energy Based Power Generation Expansion. Energy Rep. 2020, 6, 480–490. [Google Scholar] [CrossRef]
  4. Moradi-Sepahvand, M.; Amraee, T. Integrated expansion planning of electric energy generation, transmission, and storage for handling high shares of wind and solar power generation. Appl. Energy 2021, 298, 117–137. [Google Scholar] [CrossRef]
  5. Impram, S.; Nese, S.V.; Oral, B. Challenges of Renewable Energy Penetration on Power System Flexibility: A Survey. Energies 2020, 13, 100539. [Google Scholar] [CrossRef]
  6. Guerra, K.; Haro, P.; Gutiérrez, R.E.; Gómez-Barea, A. Facing the High Share of Variable Renewable Energy in the Power System: Flexibility and Stability Requirements. Appl. Energy 2022, 310, 118561. [Google Scholar] [CrossRef]
  7. Silvestri, L.; De Santis, M. Renewable-Based Load Shifting System for Demand Response to Enhance Energy-Economic-Environmental Performance of Industrial Enterprises. Appl. Energy 2024, 358, 122562. [Google Scholar] [CrossRef]
  8. Woltmann, S.; Kittel, J. Development and Implementation of Multi-Agent Systems for Demand Response Aggregators in an Industrial Context. Appl. Energy 2022, 314, 118841. [Google Scholar] [CrossRef]
  9. Li, Y.; Yang, Z.; Li, G.; Zhao, D.; Tian, W. Optimal scheduling of an isolated microgrid with battery storage considering load and renewable generation uncertainties. IEEE Trans. Ind. Electron. 2019, 66, 1565–1575. [Google Scholar] [CrossRef]
  10. Wang, J.; Wang, Q.; Sun, W. Quantifying flexibility provisions of the ladle furnace refining process as cuttable loads in the iron and steel industry. Appl. Energy 2023, 342, 121178. [Google Scholar] [CrossRef]
  11. Liu, Y.; Mauter, M.S. Assessing the demand response capacity of U.S. drinking water treatment plants. Appl. Energy 2020, 267, 114899. [Google Scholar] [CrossRef]
  12. Khan, M.W.; Wang, J. Multi-agents based optimal energy scheduling technique for electric vehicles aggregator in microgrids. Int. J. Electr. Power Energy Syst. 2022, 134, 107346. [Google Scholar] [CrossRef]
  13. Hong, J.; Hui, H.; Zhang, H.; Dai, N.; Song, Y. Event-Triggered Consensus Control of Large-Scale Inverter Air Conditioners for Demand Response. IEEE Trans. Power Syst. 2022, 37, 4954–4957. [Google Scholar] [CrossRef]
  14. Zhao, Z.; Wang, C.; Wang, B. Adaptive model predictive control of a heat pump-assisted solar water heating system. Energy Build. 2023, 300, 113682. [Google Scholar] [CrossRef]
  15. Srithapon, C.; Månsson, D. Predictive control and coordination for energy community flexibility with electric vehicles, heat pumps and thermal energy storage. Appl. Energy 2023, 347, 121500. [Google Scholar] [CrossRef]
  16. Yang, Y.; Zhou, Z.; Xiao, X.; Pang, Y.; Shi, L. Intelligent day-ahead optimization scheduling for multi-energy systems. Front. Energy Res. 2024, 11, 1349194. [Google Scholar]
  17. Tostado-Véliz, M.; Hasanien, H.M.; Jordehi, A.R.; Turky, R.A.; Jurado, F. Risk-averse optimal participation of a DR-intensive microgrid in competitive clusters considering response fatigue. Appl. Energy 2023, 339, 120960. [Google Scholar] [CrossRef]
  18. Oskouei, M.Z.; Zeinal-Kheiri, S.; Mohammadi-Ivatloo, B.; Abapour, M.; Mehrjerdi, H. Optimal Scheduling of Demand Response Aggregators in Industrial Parks Based on Load Disaggregation Algorithm. IEEE Syst. J. 2022, 16, 945–953. [Google Scholar] [CrossRef]
  19. Hu, X.; Xu, G.; Shang, C.; Wang, L.; Wen, M.; Cheng, H. Joint Planning of Battery Energy Storage and Demand Response for Industrial Parks Participating in Peak Shaving. Autom. Electr. Power Syst. 2019, 43, 116–123. [Google Scholar]
  20. Dehghan-Dehnavi, S.; Fotuhi-Firuzabad, M.; Moeini-Aghtaie, M.; Dehghanian, P.; Wang, F. Decision-Making Tree Analysis for Industrial Load Classification in Demand Response Programs. IEEE Trans. Ind. Appl. 2021, 57, 26–35. [Google Scholar] [CrossRef]
Figure 1. Working curve of electrolytic aluminum plant.
Energies 17 03092 g001
Figure 2. Equivalent thermal parameter model of an air conditioning unit.
Energies 17 03092 g002
Figure 3. Schematic diagram of air conditioning switch regulation.
Energies 17 03092 g003
Figure 4. Flow chart of EECR.
Energies 17 03092 g004
Figure 5. Multi-type consumption response control flow.
Energies 17 03092 g005
Figure 6. Energy consumption demand.
Energies 17 03092 g006
Figure 7. Energy consumption demand in phase I.
Energies 17 03092 g007
Figure 8. DR response volume of each aggregation cluster in phase I.
Energies 17 03092 g008
Figure 9. Absorption degree of upper wind power.
Energies 17 03092 g009
Figure 10. DR response of a full-time air conditioning cluster.
Energies 17 03092 g010
Figure 11. Full-time cluster DR response curve.
Energies 17 03092 g011
Figure 12. DR response of each cluster.
Energies 17 03092 g012
Figure 13. Full-time regulation of industrial load.
Energies 17 03092 g013
Table 1. Industrial DR quotation contract.
Industrial DR
Type
Regulation RatioControl TimesRegulation DurationAdjustment Method
Electrolytic Aluminum−10~10%Repeatedly2 hUpward
Downward
Table 2. Air conditioning DR cluster quotation contract.
Civilian TypeRegulation RatioControl TimesRegulation Duration
Air conditioningAggregated powerMultiple regulation0.5 h
Table 3. Industrial load compensation strategy.
Peak Hour Electricity Price
(CNY/mWh)
Off-Peak Electricity Price
(CNY/mWh)
Valley Hour Price
(CNY/mWh)
26014596
Table 4. Air conditioning contract parameters.
ParametersNumerical
Equivalent thermal resistance/ω2
Average power/kw2
Setpoint/°C24
Temperature dead zone/°C5
Average heat capacity ca/f2
Energy efficiency ratio ƞ 2.5
Number of air conditioners i10,000
Disclaimer/Publisher’s Note: The statements, opinions and data contained in all publications are solely those of the individual author(s) and contributor(s) and not of MDPI and/or the editor(s). MDPI and/or the editor(s) disclaim responsibility for any injury to people or property resulting from any ideas, methods, instructions or products referred to in the content.

