
Modeling Liquid Droplet Sizes in Gas–Liquid Annular Flow

Petroleum Engineering Department, Colorado School of Mines, Golden, CO 80401, USA
*
Author to whom correspondence should be addressed.
Energies 2024, 17(13), 3094; https://doi.org/10.3390/en17133094
Submission received: 8 April 2024
/
Revised: 7 June 2024
/
Accepted: 19 June 2024
/
Published: 23 June 2024
Abstract
:Understanding droplet sizes is crucial for modeling gas–liquid annular flow and has many applications across various industries. This paper presents a comprehensive review and analysis of experimental data on droplet-size characteristics in gas–liquid annular flow from the open-source literature. The existing models for droplet-size predictions are evaluated against experimental data. Based on the data analysis, we propose two new correlations to predict the maximum droplet diameter and Sauter mean droplet diameter. Model evaluation and parametric study show that the new correlations capture the effects of fluid properties and flowing conditions on the droplet diameters well, outperforming other existing models. The average absolute relative errors are reduced to 14.8% and 29% for the maximum droplet diameter and the Sauter mean droplet diameter, respectively.
1. Introduction
Gas–liquid annular flow occurs at high gas velocities in pipe flows, where the liquid phase primarily flows as a film along the internal wall, and the gas phase occupies the center of the pipe. When the gas and liquid superficial velocities exceed critical thresholds, the liquid phase can be partially atomized into droplets carried by the continuous gas phase. This droplet entrainment from the liquid film into the gas core significantly alters the mechanisms of momentum, mass, and energy transfer between the phases [1,2].
The droplet-size characterization in gas–liquid annular flow is critical in many industrial applications, such as water-cooled nuclear reactors, evaporators and condensers of power-generating plants, pipeline transportation [3], chemical reactors, flow assurance predictions such as hydrate formation, pipe corrosion processes [1,4], geothermal and gas-oil wells [5], and numerous other engineering applications. The volume of entrained droplets and their size distribution determine the liquid film thickness and the interfacial area between the gas and liquid phases, which are essential for heat and mass transfer predictions [6,7] and flow assurance management [8].
The liquid-phase distribution in the film and gas core, along with the dynamic interchange process between droplet formation and deposition, are crucial for estimating the transport phenomena. Previous studies have found that the interaction between the liquid droplets and the gas phase increases the pressure drop of the system [9,10]. For instance, Fore and Dukler (1995b) noted that the liquid droplet entrainment and deposition accounted for about 20% of the pressure gradient in an upward gas–liquid annular flow system and increased with rising gas velocity [11]. Al Munif et al. (2021) observed that the liquid droplet sizes played an important role in gas well deliquification process [5]. Moreover, the liquid droplet size is commonly used as an input parameter in theoretical and numerical models to determine the flow behavior, liquid transport, and the transition between annular and churn flow [1,12,13].
In summary, characterizing dispersed liquid droplet sizes is important for modeling hydrodynamics in gas–liquid annular flow and ensuring safe operations. This study performs a detailed literature review on droplet-size characterization in gas–liquid annular pipe flow, as well as previous relevant modeling studies. It was found that most authors developed correlations to predict the droplet size based on their own or very limited experimental data, which often became inapplicable for other fluid and flow conditions. By examining experimental data encompassing a wider range of fluid properties and flow conditions, we proposed two predictive correlations for the maximum stable droplet size and the Sauter mean droplet diameter. The following sections provide a literature review on previous experimental studies on the liquid droplet size, followed by an introduction of the new correlations and model evaluation.
2. Review of Previous Experimental Studies
Numerous scientists have conducted experimental studies on the droplet formation process and their size characterization under various fluid properties and flowing conditions. The mechanisms of droplet formation and their characterization depend on the flow patterns [9,14]. This paper considers the experimental data and modeling studies focused on gas–liquid segregated flow, primarily annular flow, and a few on stratified flow with low liquid loading.
Also note that several studies have explored liquid droplet entrainment and characterization using numerical simulations with various methods. For instance, Wang et al. (2023) used a morphology-adaptive multifield two-fluid model to study the liquid entrainment based on the shear-off entrainment mechanism on the interfacial wave, which implies that the droplet formation is dominated by the balance between the shear forces and the surface tension forces at the gas–liquid interface [15]. Several other studies have employed volume of fluid and level set methods to study the entrainment processes and the deposition processes [16,17,18,19], as well as the liquid film features and interfacial wave development [20,21,22,23,24,25,26]. Additional studies have investigated the droplet characteristics using different methods, such as Lagrangian framework [13,27,28], the lattice Boltzmann method [29], and the population balance method [30]. In this study, we mainly focus on the findings from previous experimental studies.
2.1. Droplet Entrainment Mechanism
Liquid droplet entrainment can occur through various mechanisms. According to previous studies, liquid entrainment is closely related to the wave structures at the gas–liquid interface [2]. Droplet atomization depends on the disruptive forces (pressure variation, shear stress, and external viscous force) and stabilizing forces (gravity, surface tension, and internal viscous force) acting on the waves. The breakup of the disturbance waves occurs when the disruptive forces exceed the stabilizing forces, resulting in liquid entrainment. Ishii and Grolmes (1975) described five general liquid entrainment hypotheses, including roll-wave shearing off, wave undercut, bubble burst, liquid impingement, and liquid bulge disintegration (see detailed explanations in [9]). The first two are the common mechanisms for liquid entrainment in gas–liquid annular flow, as illustrated in Figure 1. With advancements in optical techniques, the phenomenon of liquid entrainment has been more accurately captured visually. Azzopardi (1983) described two mechanisms of droplet formation in upward vertical pipe flow, namely “bag-breakup” and “ligament-breakup” [31]. “Bag-breakup” occurs at low gas and liquid flow rates, where the gas undercuts the liquid wave and forms a “bag” that has a thin skin and thick rim. The breakup of the thin skin forms small droplets, while the rim forms larger droplets. “Ligament-breakup” occurs at high gas and liquid flow rates when the high shear force elongates the crests of roll waves, forming thin ligaments that are torn out from the film. These ligaments are subject to further disintegration due to the pressure disturbance in the gas flow field. In our opinion, the “bag-breakup” mechanism is more similar to the “wave undercut” hypothesis by Ishii and Grolmes (1975), while the “ligament-breakup” mechanism is more akin to the “roll-wave shearing off” hypothesis by Ishii and Grolmes (1975). The “bag-breakup” and “ligament-breakup” mechanisms have been visualized in several studies, such as [32,33,34,35,36,37]. Cherdantsev (2022) provided several illustrative images of these two liquid entrainment mechanisms in his review paper [38]. We recommend referring to this paper for a more detailed visual understanding of the “bag-breakup” and “ligament-breakup” processes. Several scientists have studied the minimum required criteria for droplet entrainment. A general observation from the previous studies is that the onset of entrainment is close to the onset of disturbance waves [2]. Several models and correlations have been developed to predict the critical liquid film Reynolds number for the onset of liquid entrainment, which depends on the fluid property and flowing conditions. On the other hand, there are several modeling studies on the liquid entrainment fraction. For a comprehensive literature review on the theory and modeling work related to the onset of liquid entrainment and liquid entrainment fraction, we refer to Berna et al. (2014) and Berna et al. (2015) [2,39].
The development of droplets in the gas core occurs in stages. After the droplets form at the gas–liquid interface, they are accelerated by the gas phase and move faster than the liquid film. Large droplet breakup has been observed in previous studies [40]. It could be due to the kinetic energy of the turbulent motion and pressure variation in the continuous gas phase. Kocamustafaogullari et al. (1994) [41] commented that the size of the initial droplets or ligaments sheared off from the roll-wave crests by the gas flow can be larger than the maximum stable droplet size in the center of the pipe. Whalley et al. (1979) [42] also observed that large droplets sheared off from the crest of roll-waves oscillated in the turbulent gas flow field, resulting in further disintegration. On the other hand, droplets can collide and coalesce as they travel in the gas core, with the extent of coalescence depending on the liquid entrainment or droplet concentrations. Higher droplet concentrations generally increase the likelihood of coalescence [6]. Zhang et al. (2019) [32] observed larger droplet sizes at the centerline of the pipe. We suspect it could be due to coalescence during the migration of droplets from the interface to the pipe center. Other studies have also noted that droplet sizes tend to be larger at the pipe’s centerline [10,11,43,44]. In vertical pipe flow, measurements indicated that the maximum stable droplets tend to remain at the centerline of the pipe due to their inertia, and droplet sizes continuously decrease towards the pipe wall [11,43]. Additionally, some droplets deposit back onto the liquid film due to gas turbulence. In gas–liquid annular flow, droplet atomization and deposition are recurring processes that reach equilibrium when the flow is stable [2].
2.2. Effect of Fluid Properties on Droplet Size
The physical properties of the fluids involved in hydrodynamic flow field play an important role in droplet formation and development. Droplet size has been found to depend on the fluid viscosity, density, and surface tension between the phases. This section analyzes the effects of these parameters on droplet size based on previous experimental observations. Please note that, in this paper, we do not consider the effects of valves and bends, which are inevitable parts of the flow system and can enhance the mixing between the phases.
2.2.1. Effect of Fluid Viscosity on Droplet Size
Several authors have observed a significant effect of the liquid viscosity on the droplet size [11,45,46,47,48]. Fore and Dukler (1995) used air–water and air–water/glycerin in their experimental study and observed larger droplet sizes with an increase in liquid viscosity from 1 to 6 mPa·s [11]. It is suspected that an increase in liquid viscosity resists the external disruptive forces applied by the high-velocity gas phase, enhancing droplet stability and resulting in larger droplet sizes.
Ishii and Grolmes (1975) pointed out the importance of liquid viscosity on liquid entrainment, noting that roll waves tended to diminish due to decreased interactions between the gas and liquid film, leading to reduced liquid entrainment [9].
Wang et al. (2020) [49] varied the liquid viscosity from 1 to 30 mPa·s in their experiments to study its effect on droplet size. They observed an increase in droplet size with increasing liquid viscosity, which agreed well with the logarithmic function growth model, as shown in Figure 2 (dashed lines are from the logarithmic function). The droplet size increased rapidly as the liquid viscosity increased from 1 to 10 mPa·s, and then more gradually from 10 to 30 mPa·s, indicating a limiting effect of liquid viscosity on droplet size. The authors explained this phenomenon through the mechanisms of droplet formation and coalescence. An increase in liquid viscosity may lead to larger initial droplet formation from the liquid film; however, it may also reduce the droplet coalescence rate during their migration from the liquid film to the centerline.
The effect of gas viscosity on the liquid droplet size has not been well studied experimentally yet. Further experimental studies are required to better understand its effect on liquid entrainment, droplet fragmentation and coalescence, and consequently on the droplet size.
2.2.2. Effect of Fluid Density on Droplet Size
Hinze (1955) [14] pointed out the importance of the density difference between the dispersed and continuous phases in droplet formation mechanisms. The density of gas can vary significantly with changes in system pressure due to its high compressibility. Jepson et al. (1989) [50] and Pan and Hanratty (2002a) [51] noted that the entrained liquid fraction increased with the increase in gas density. This could be explained by the higher shear stress defined by the Weber number (). Increased gas density applies more shear stress on the liquid film, inducing higher liquid droplet entrainment into the gas core, which in turn leads to more droplet coalescence due to higher droplet concentration. On the other hand, increased gas density also promotes droplet breakup due to higher shear forces. Fore et al. (2002) [48] experimentally studied the effect of gas density on droplet size, and the data are replotted in Figure 3. The droplet diameter increases slightly with the increase in gas density at low superficial gas velocities and high liquid flow rates, where droplet coalescence is believed to be more dominant. At low liquid flow rates, the trend seems opposite, possibly due to the lower likelihood of droplet collision/coalescence because of the low droplet concentration. Gibbons (1985) [47] varied the pressure to achieve gas densities in the range of 1.2–2.3 kg/m3 and observed larger droplets with increased gas density. However, Azzopardi (1997) [1] claimed that the source of the increased droplet size in their experiments could not be clearly identified. Patruno et al. (2010) [52] studied the effect of pressure on droplet size and observed an increase in the mean droplet diameter with increased pressure. In contrast, Jepson et al. (1989) [50] observed generally smaller droplet sizes for the air–water system compared to the helium–water system.
The gas density effect on droplet size can be very complex. On one hand, increasing gas density leads to higher liquid entrainment due to higher shear stress on the liquid film, which in turn increases the likelihood of droplet coalescence. On the other hand, the entrained liquid droplets are subject to higher fragmentation due to the increased shear in the gas core. More studies are required to make solid conclusions.
2.2.3. Effect of Surface Tension on Droplet Size
Previous experimental results generally showed that a lower surface tension resulted in an increase in the liquid film disintegration process and smaller droplet sizes [45]. Pan and Hanratty (2002a) [51] stated that liquid entrainment increased with decreasing surface tension. It could lead to a higher droplet concentration in the gas core, which is expected to result in larger droplet sizes due to the increased possibility of coalescence; however, on the other side, the dynamic pressure fluctuations in the gas core could more easily overcome the reduced surface tension, enhancing the droplet disintegration process. In addition, the droplet formation mechanism can change as surface tension is reduced. Van Nimwegen et al. (2015) [53] noticed that the surfactants changed the gas–liquid interface morphology by suppressing the liquid waves and enhancing air entrainment in the liquid film. The entrained bubbles led to foam formation, and the bubble-burst droplet entrainment mechanism (see [9]) can occur, which can develop smaller droplet sizes.
2.3. Effect of Flowing Conditions on Droplet Size
Flowing conditions, especially gas and liquid flow rates, play important roles in the droplet atomization process and its size determination. In this section, we discuss the effects of superficial gas and liquid velocities on droplet size.
2.3.1. Effect of Superficial Gas Velocity on Droplet Size
Previous experimental studies have shown that gas superficial velocity has the strongest effect on droplet formation and size. For a given liquid flow rate, an increase in the gas superficial velocity applies higher shear stress on the gas–liquid interface, leading to more liquid entrainment and therefore a higher droplet concentration in the gas core [54,55]. Note that maximum entrainment may exist for a given liquid flow rate, beyond which a further increase in the gas velocity does not necessarily increase the liquid entrainment [39]. On the other hand, higher dynamic pressure fluctuations and shear stresses with increasing gas velocity can lead to droplet breakup and overcome the droplet coalescence effect from the higher droplet concentration, resulting in smaller droplets. Figure 3 and Figure 4 demonstrate the decrease in droplet sizes with an increasing gas flow rate. This trend was generally observed in all previous experimental datasets.
2.3.2. Effect of Superficial Liquid Velocity on Droplet Size
The effect of superficial liquid velocity on droplet size is more complex and may depend on droplet formation mechanisms [6,10,50,56]. Figure 5 shows the variation in d32 with liquid mass flux, which was reproduced based on the data from [6]. The droplet size decreases with an increasing liquid mass flux at low gas and liquid flow rates, and then it increases after passing a minimum. Similar trends were also observed by several other researchers, such as [10,50,56]. Teixeira (1988) [10] noticed that the greater the gas flow rate, the lower the liquid flow rate at which the minimum occurred.
Jepson et al. (1989) [50] provided two explanations for the reduced trend of d32 with an increasing liquid mass flux. The first explanation suggested that increasing liquid entrainment at low liquid flow rates increased the gas flow turbulence, which could decrease the droplet size. The coalescence mechanism, which increased with the increasing liquid mass flux and could lead to larger droplet sizes, was insignificant at low liquid entrainment conditions. The second explanation was proposed by Azzopardi (1983) [31] and adopted by several subsequent studies. He suggested that, before reaching the minimum, droplet formation was dominated by the “bag-breakup” mechanism, where the droplets were formed by breaking a “bag” undercut by the gas phase. After the minimum, Azzopardi (1983) [31] suggested that the droplet formation shifted from being dominated by “bag-breakup” to “ligament-breakup”. In the “ligament-breakup” mechanism, droplets are formed by breaking ligaments that are torn off from the wave crests by high gas shear forces. At this condition, the droplet size is primarily influenced by the coalescence mechanism. In other words, an increase in the liquid flow rate could increase liquid entrainment [57], thereby raising droplet concentrations and the likelihood of droplet collision and coalescence, ultimately leading to larger droplet sizes. As the dominance of the “ligament-breakup” mechanism increases and the influence of the “bag-breakup” mechanism decreases, the droplet size follows a characteristic hooked shape, as illustrated in Figure 5.
However, it is still noteworthy that the increasing trend of droplet size with liquid flow rate has been commonly observed in most previous experimental studies.
2.4. Effects of Pipe Internal Diameter and Inclination on Droplet Size
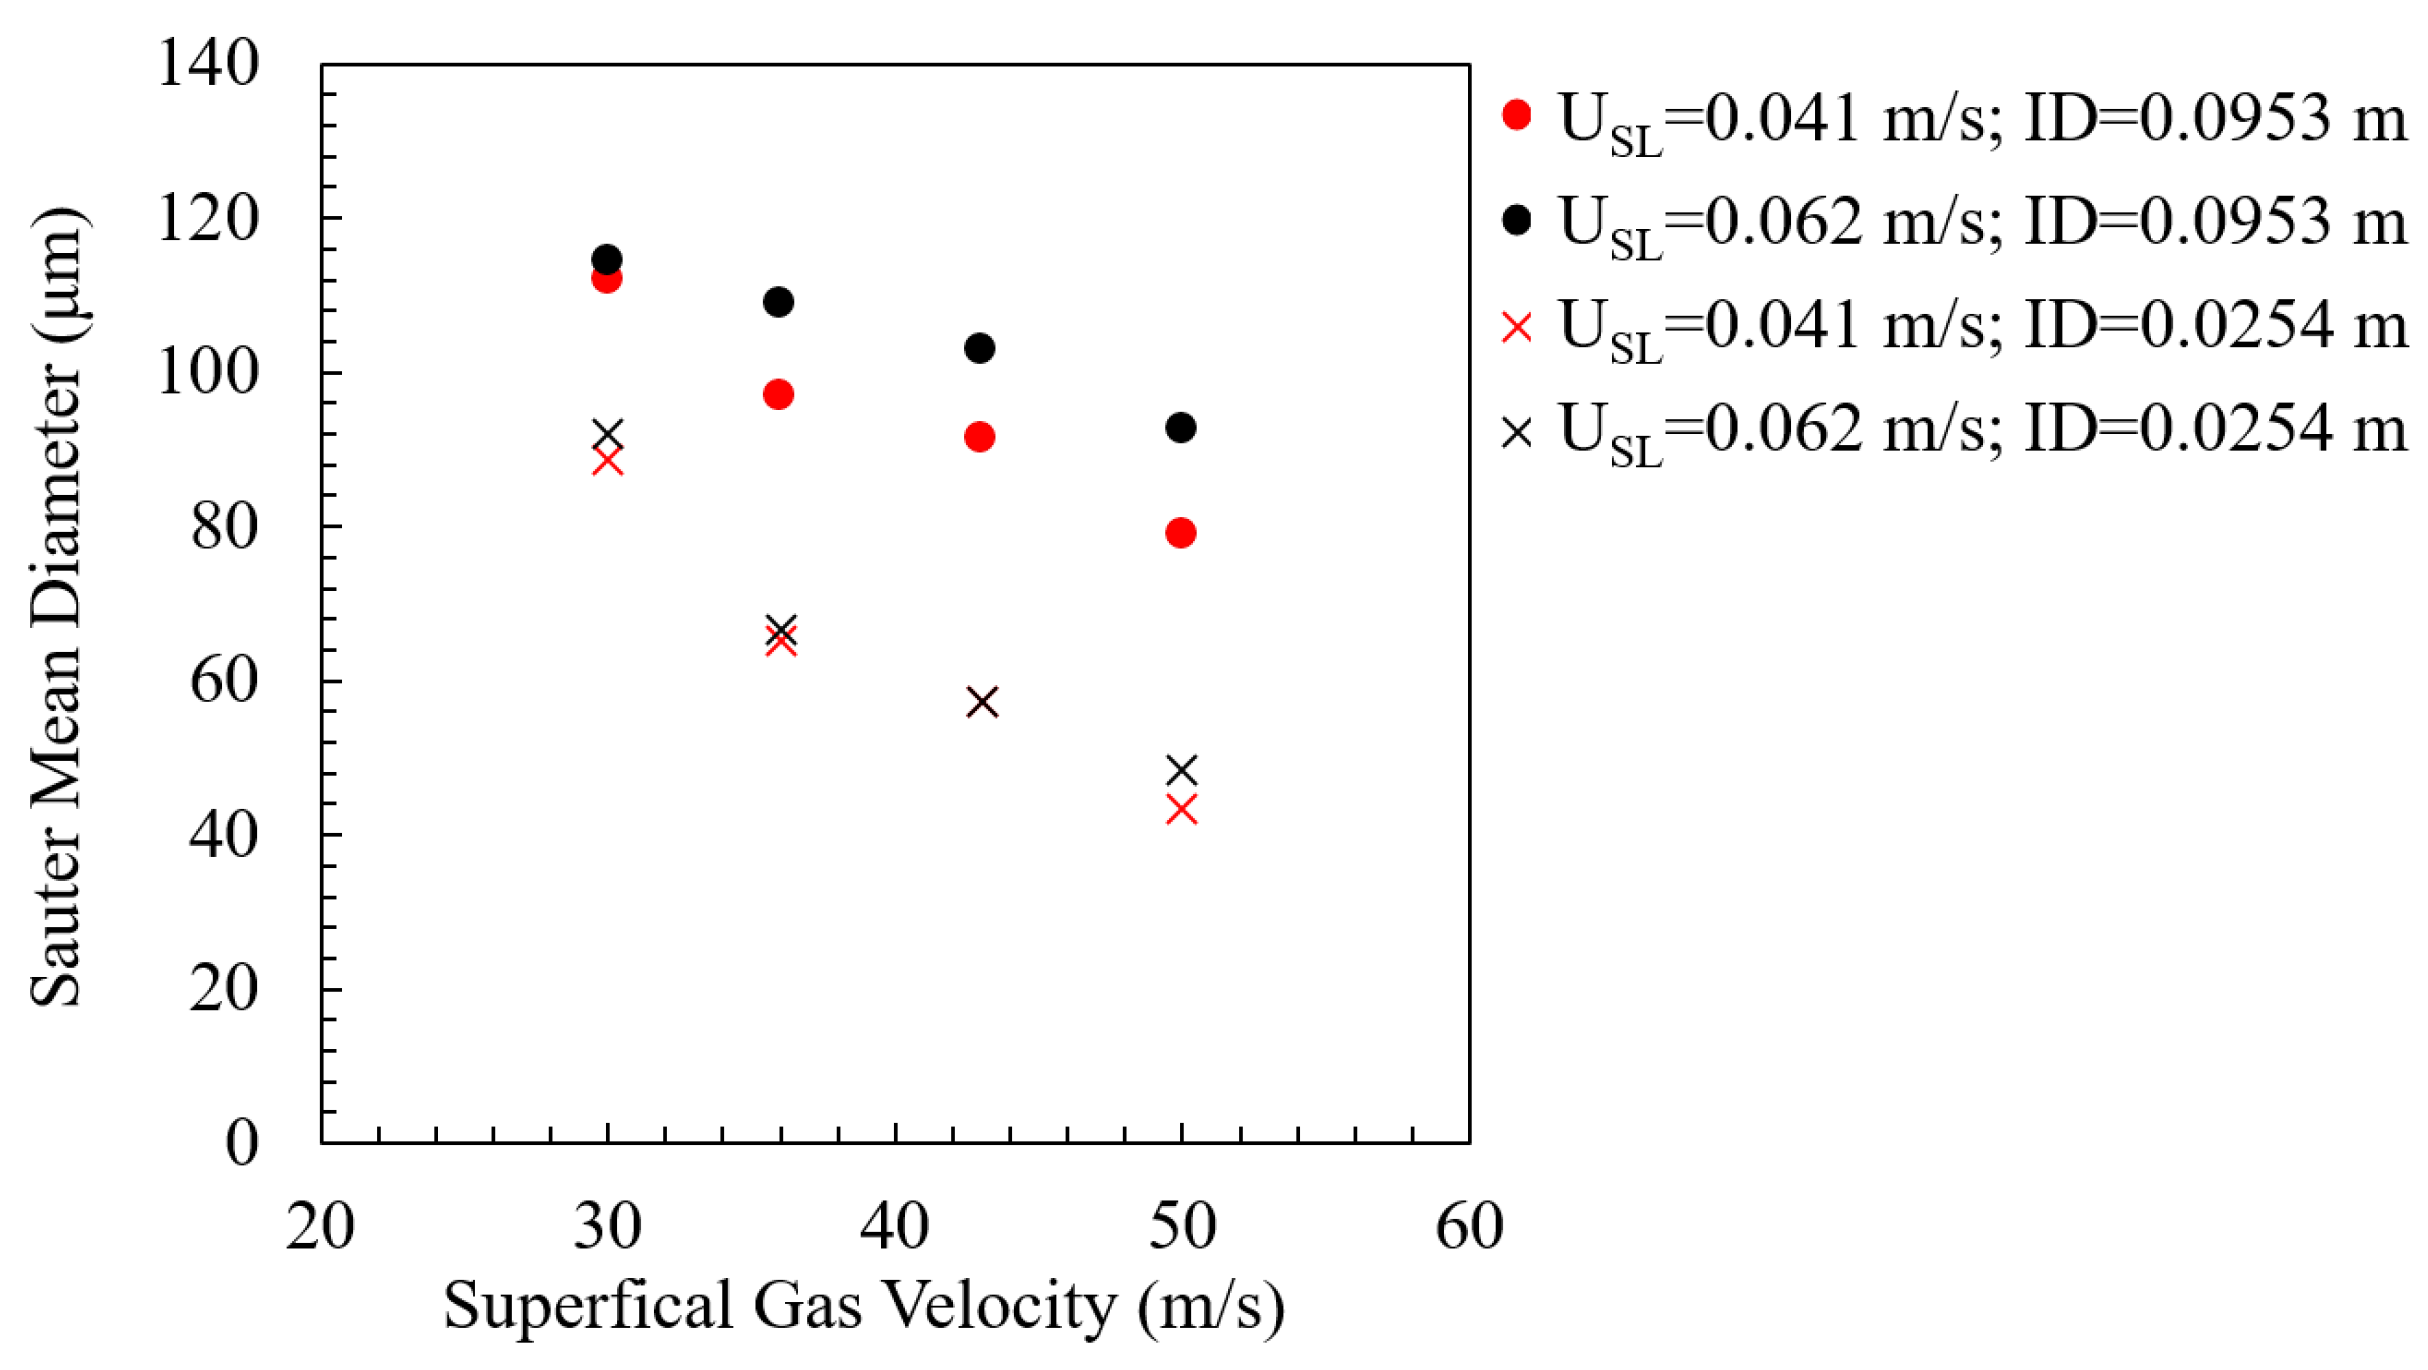
Azzopardi (1997) [1] reviewed several studies and observed that larger droplet sizes were associated with a bigger pipe internal diameter for both vertical and horizontal tubes. This finding is consistent with the experimental results from Ueda (1979) [45] and Al-Sarkhi and Hanratty (2002) [58]. Al-Sarkhi and Hanratty (2002) reported that the volume mean droplet diameter approximately correlated with the pipe diameter to the power of 0.5 for superficial gas velocities greater than 30 m/s. Pan and Hanratty (2002a) [51] noted that liquid entrainment increased with pipe diameter, potentially leading to higher droplet concentrations and increased coalescence in the gas core. Comparing the data between a pipe internal diameter (ID) of 0.0953 m from Simmons and Hanratty (2001) [59] and a pipe ID of 0.0254 m from Al-Sarkhi and Hanratty (2002) [58] shows larger droplet sizes with bigger pipe diameters, as illustrated in Figure 6. Additionally, the data from Simmons and Hanratty (2001) suggest that the effect of superficial liquid velocity on droplet size is more pronounced in larger internal pipe diameters when the superficial gas velocity exceeds 30 m/s.
Pipe inclination angle can also impact droplet formation, size, and distribution. According to previous studies, the gravity force increases the stability of the liquid film in horizontal and shallowly inclined pipes [9,60]. A higher gas superficial velocity is needed to obtain the same mechanism of droplet formation observed in vertical flows. The high gas velocity at the wave crest and low gas velocity at the wave trough cause pressure variations over the wave according to the Bernoulli theorem. The reduced pressure at the wave crest creates a suction force on the wave into the gas core. If this suction force exceeds the opposing surface tension and gravity forces, the wave crest grows rapidly and detaches from the liquid film surface, leading to droplet formation.
Several experimental studies investigated the droplet size in horizontal pipe flow, such as [55,56,58,59]. Unlike in an upward vertical flow, stratifications were observed at the pipe cross-section at low gas flow rates, with the droplet size generally decreasing from the bottom to the top of the pipe. However, these stratifications diminished at higher gas velocities [55,59,61].
Azzopardi (1997) [1] compared the data from Azzopardi et al. (1980) [62] and Ribeiro et al. (1995) [7], concluding that larger droplet sizes occur in an upward vertical pipe flow compared to a horizontal pipe flow. Zaidi et al. (1998) [63] studied the effect of flow orientation on droplet size at a superficial gas velocity of 30 m/s. They employed two techniques for droplet-size characterization: the laser diffraction technique and the phase Doppler technique. The laser diffraction results suggested that the droplet size remained almost constant when the deviation angle increased from 0° (vertical) to around 50°, then increased as the deviation angle increased further to 90° (horizontal). In contrast, the phase Doppler technique showed small changes (or a slight decrease in droplet size) when the pipe changed from vertical to horizontal.
3. Droplet-Size Modeling
Numerous experimental studies have led scientists to develop mathematical modeling approaches to determine droplet sizes in gas–liquid hydrodynamic flow fields. In this section, we summarize the main concepts in the previous droplet-size modeling approaches. A large set of measured droplet sizes was collected, covering a wider range of fluid properties and flow conditions, from various authors. These data are summarized in Table 1 for the maximum stable droplet diameter (130 data points) and Table 2 for the Sauter mean diameter (468 data points). This dataset enhanced the data analysis and validation of the existing models/correlations for droplet-size predictions. Additionally, we propose two new correlations for the maximum stable droplet size and Sauter mean diameter, which will be discussed in the following subsections.
Various droplet-size measurement techniques have been used by different authors as listed in Table 1 and Table 2. It is important to note that different techniques may cause some discrepancies. The droplet-size measurement techniques for gas–liquid annular flow and their differences were discussed in detail in [1,59], and will not be repeated in this paper. Teixeira (1988) [10] provided a detailed comparison between the phase Doppler and laser diffraction techniques of droplet-size measurements, noting that the difference between the measurements was about 10 percent, with phase Doppler measurements being slightly larger. This small difference does not significantly affect the modeling study. Azzopardi (1985) [6] reviewed the methods of the droplet-size measurements and the experimental data of several studies [45,67,68,69,70] and explained that their data were not reliable quantitatively to build and evaluate models. Therefore, these data are not considered in this study. Moreover, Simmons and Hanratty (2001) [59] reported maximum stable droplet-size data computed from the upper-limit log-normal (ULLN) distribution curve, which showed a positive power (0.25) dependency on the superficial gas velocity, contrary to the numerous other experimental results discussed above. Therefore, their data on the maximum droplet size were also not used in this analysis.
3.1. Modeling the Maximum Droplet Size
Tatterson et al. (1977) pointed out that 90% of the dispersed liquid volume was carried by only 10% of the droplets. Lopes and Dukler (1986) [71] also noted that over 95% of the entrained liquid mass was carried by liquid droplets larger than 200 microns in diameter. This implies the importance of studying the maximum droplet-size prediction.
A reliable estimation of the maximum stable droplet size (dmax) of the dispersed liquid phase is important for several reasons. First, the dmax can be used to make conservative estimates in fluid separation operations and the onset of liquid loading in gas condensate wells [72]. Second, dmax is an input parameter for the widely used droplet distribution function for pipe flow conditions, the upper-limit log-normal (ULLN) distribution function [73]. Third, dmax is required as an input value for computational fluid dynamics and other software to predict droplet transportation and distribution in multiphase flow simulations [5,13]. Also, dmax is used in some models/correlations to predict the Sauter mean diameter (d32), which is widely used in heat and mass transfer estimations [41] and the computation of dispersed liquid fraction and deposition rates in gas-liquid annular flows [6,12].
The external forces, namely the dynamic pressure force due to the velocity fluctuations and the shear stress from the velocity difference between the gas–liquid phases, are considered the main forces contributing to droplet destabilization and breakup mechanisms. External shear stress is suggested to be an initial disruptive force because of the high velocity difference between the gas and liquid phases, which also causes pressure variations in the gas–liquid droplet interface [14,40].
The internal viscous force of liquid and the surface tension force are considered to be the primary forces resisting droplet destabilization and breakup mechanisms. In cases where surface tension dominates, such as in gas and low-viscosity liquid flow, the maximum stable droplet size is determined by the balance between disruptive external forces and stabilizing surface tension [14,40,41].
Hinze (1955) [14] analyzed droplet breakup and stabilizing forces and proposed three force groups per unit of surface area of the droplet with a diameter (d) that controlled the droplet deformation and disintegration process, as follows:
The first group is an external disruptive force resulting from viscous stress or the dynamic pressure fluctuation of the continuous phase for droplet deformation and breakup. The second group is the surface tension force that counteracts the droplet deformation, and the third group represents the internal viscous stress of the droplet counteracting the droplet deformation.
Considering fluids with similar viscosities, Hinze (1955) [14] developed a model to predict the maximum stable droplet size under turbulent-flow conditions based on the ratio of the external disruptive force and surface tension. The external disruptive force was mainly caused by continuous-phase velocity fluctuations over a distance equal to the dispersed-phase droplet size. He suggested a generalized critical Weber number for the maximum stable droplet size, as shown in Equation (2). Droplet breakup occurred when the force ratio exceeded the critical Weber number.
where is the average square of velocity differences over a distance equal to the maximum stable droplet size in the whole flow field. Hinze (1955) [14] suggested using Kolmogorov’s (1949) [74] length scale to define turbulent velocity fluctuations assuming that the droplet size was equal to the turbulent eddies length scale with which the droplets interacted. The Kolmogorov’s (1949) [74] length scale represents the smallest length of turbulent eddies in the continuous-phase flow. The mathematical expression of is shown in Equation (3).
where [75].
With that, Hinze (1955) [14] proposed the expression for the maximum stable droplet size in a turbulent flow field, shown in Equation (4).
where , as suggested by Hinze (1955) [14] for turbulent flow. The turbulent energy dissipation rate, , can be calculated using Equation (5), according to [76].
Hinze’s (1955) model was used as a fundamental basis for many subsequent modeling approaches. Hinze (1955) [14] observed that the critical Weber number varied with the viscosity ratio between the involved fluids. Additionally, the dependence of the critical Weber number on the superficial gas velocity and fluid properties has been noted in other studies as well [9,77].
Kataoka et al. (1983) [46] identified the roll-wave shearing off mechanism as the dominant process for liquid entrainment into the gas core. Their model for the maximum stable droplet size, shown in Equation (6), builds upon the critical Weber number suggested by Hinze (1955) and incorporates the interfacial shear stress at the gas–liquid interface. The coefficient in Equation (6) was obtained based on their original correlation for the volume mean diameter, , with the assumption that .
Lopes and Dukler (1985) [40] considered the pressure fluctuations of the turbulent gas flow surrounding the droplets as the dominant force that determined the maximum stable droplet size. They proposed a predictive model for the maximum stable droplet size by including the effect of the internal pipe diameter, as shown in Equation (7). Lopes and Dukler (1985) recommended .
Kocamustafaogullari et al. (1994) [41] suggested using the maximum value of local relative velocity (), instead of (the mean square fluctuation velocity difference at a distance equal to ), to model the maximum stable droplet size in a gas–liquid annular flow field. They used the local energy dissipation rate approximated by Lopes and Dukler (1985) [40] and the interfacial shear stress for the gas–liquid annular flow defined by Ishii and Grolmes (1975) [9] to determine the eddy dissipation rate. Their correlation is shown in Equation (8), where the proportionality constants were determined using experimental data from Lopes and Dukler (1985) [40]. Kocamustafaogullari et al. (1994) also noted that the model was based on a single liquid droplet evolution in the gas flow field.
where is defined in terms of the liquid viscosity number, shown by Equation (9):
Pereyra et al. (2015) [78] proposed a comprehensive correlation for the maximum stable droplet size, shown in Equation (10), which was claimed to be applicable to a turbulent dilute dispersion system with any two fluids.
where , proposed by Pereyra et al. (2015) [78].
An evaluation of these existing models shows that they often fall short of considering the effects of several key factors on the maximum droplet size, including the liquid flow rate that impacts the total liquid volume fraction, liquid viscosity, superficial gas velocity, pipe inclination angle, and pipe internal diameter. To address this limitation, we developed a new correlation that incorporates these essential parameters, as discussed below.
The open source experimental data indicate the dependence of the maximum stable droplet size on the total liquid volume fraction to a power of approximately 1/3, as demonstrated in Figure 7.
Systematic data analysis indicated that the droplet formation mechanism changes depending on the internal pipe diameter and the gas flow rate. As previously mentioned, the droplet stratification effect diminishes when the superficial gas velocity is approximately above 30 m/s. The internal pipe diameter also plays an important role in the droplet coalescence process by influencing the droplet concentration at given superficial gas and liquid velocities. In our model, we incorporate the pipe diameter effect on as a function of the gas flow rate, which has been observed to improve the model predictions a lot. Most of the previous authors used dimensionless gas and liquid Reynolds and dispersed-phase viscosity numbers in their models. However, the dispersed-phase viscosity and Reynolds numbers include parameters such as fluid densities and viscosities and internal pipe diameter, which are also included in other terms within their equations, such as density and viscosity ratios and energy dissipation rate. In our model, we propose to use the ratios of the superficial velocities and fluid properties to minimize the cancellation effects between the dimensionless parameters and for the sake of simplicity. The ratio of superficial liquid and gas velocities captured the effect of the increasing droplet size well due to increasing the liquid flow rate. We also employed the Froude number that improved the model’s sensitivity to mixture velocity change. The dimensionless gas Weber number is still considered to be the main controlling factor for droplet-size determination. The new correlation to predict the maximum stable droplet size is shown in Equation (11), which incorporates the effects of flow orientation (vertical or horizontal), gas and liquid flow rates, pipe internal diameter, and fluid properties (density and viscosity ratios).
where and are defined by Equation (12).
and the Froude number is shown in Equation (13) based on [79]:
To understand the models’ sensitivity to the changes in different parameters, parametric studies were performed. Figure 8 shows the comparison between the experimental measurement and model predictions as functions of the gas and liquid flow rates for different liquid viscosities, using data from Fore and Dukler (1995) [11]. The models of Hinze (1955) [14], Lopes and Dukler (1985) [40], and Pereyra et al. (2015) [78] show stronger responses to the changes in the superficial gas velocity, but negligible responses to the superficial liquid velocity or the liquid viscosity (Figure 8). The models of Kataoka et al. (1983) [46] and Kocamustafaogullari et al. (1994) [41] perform poorly with varying liquid viscosities, showing higher predictions for low liquid-viscosity conditions, as shown in Figure 8. The new dmax correlation fairly follows the changes in both superficial gas and liquid velocities, predicting larger droplet sizes for higher liquid superficial velocities and smaller droplet sizes with increasing gas superficial velocity. It also accurately captures the increasing trend of droplet sizes with rising liquid viscosity, as shown in Figure 8.
A model evaluation was also performed by comparing the predicted and experimental measured data in parity plots. The average absolute relative errors (AAREs), calculated using Equation (14), were determined to quantify the overall prediction accuracy. The absolute value was considered to avoid canceling out positive and negative errors, providing a more robust measure of model deviation from the experimental data.
Figure 9 illustrates a graphical evaluation of the models’ prediction versus measured experimental data for the maximum stable droplet size. Table 3 illustrates the statistical parameter for each model, demonstrating the improved performance of the new model.
In general, the models of Hinze (1955) [14], Kataoka et al. (1983) [46], and Lopes and Dukler (1985) [40] largely over-predict the experimental data for both vertical and horizontal pipe flows, as shown in Figure 9. The models of Kocamustafaogullari et al. (1994) [41] and Pereyra et al. (2015) [78] demonstrate a reasonable prediction of the maximum stable droplet size for the vertical flow orientation, but fail for horizontal flow data as shown in Figure 9. In addition, the previous models are not sensitive to the effect of the liquid flow rate (or the total volume fraction of the liquid phase), thus the model predictions are spread horizontally for the increased superficial liquid velocity scenarios. The new model for the maximum stable droplet size shows a good agreement between the predictive and measured data, as shown in Figure 9.
In summary, the new correlation offers a more accurate prediction of the maximum stable droplet size in gas–liquid annular flow. This model accounts for the physical fluid properties and flow conditions, with an average absolute relative error of 14.8%. It successfully captures the trend of increasing maximum droplet size with an increase in the liquid flow rate or liquid viscosity.
3.2. Modeling the Sauter Mean Diameter
Several types of mean droplet diameters have been identified by researchers. Ribeiro (1993) [56] provided detailed descriptions for each type of mean droplet diameter and its applications. Kataoka et al. (1983) [46] tabulated approximate relationships between the mean diameters and the maximum stable droplet diameter. In general, the average droplet diameters, such as the arithmetic mean diameter (d10), the Sauter mean diameter (SMD or d32), and the volume median diameter (d50), are commonly used to characterize the droplet-size distribution, and in momentum, heat and mass transfer calculations. The SMD is a characteristic droplet size, which is defined as the diameter of a sphere that has the same volume-to-surface area ratio as the entire collection of droplets, shown in Equation (15). It can be used to estimate the interfacial area per unit volume of the dispersed phase, as shown in Equation (16), which is a critical parameter in mass and heat transfer calculations [1,40]. Therefore, most modeling approaches focus on predicting the Sauter mean diameter of dispersed droplets. The available predictive correlations for the Sauter mean diameter are summarized in Table 4 below.
From a practical perspective, the Sauter mean diameter () model is more easily implemented if it is directly based on the fluid properties and flowing system conditions, rather than requiring additional measurements and/or correlations, such as those for liquid film thickness and entrained liquid mass flow in the models of Azzopardi et al. (1980) [62], Azzopardi (1985) [6], Gibbons (1985) [47], Azzopardi et al. (1989) [80], Ambrosini et al. (1991) [81], Simmons and Hanratty (2001) [59], and Caraghiaur and Anglart (2013) [13]. While correlations exist to model the entrained liquid mass flow rate and liquid film thickness, applying one correlation on top of another can increase the overall uncertainty. Each additional equation introduces more empirical constants, which may accumulate and amplify the uncertainties in the final predictions. Therefore, a simpler model that directly relates to the fluid properties and flow conditions is preferred.
The literature and our model evaluation demonstrate that existing models show an unsatisfactory performance when predicting SMD accurately across a wide range of conditions. Jepson et al. (1989) [50] noted that the equations by Azzopardi et al. (1980) [62] and Azzopardi (1985) [6] did not fit their experimental data. Ambrosini et al. (1991) [82] also noted that their model underpredicted the data of Jepson et al. (1989) [50] taken from a small diameter at low gas velocities for air–water and helium–water annular flows. They assumed that this discrepancy might be related to the different atomization mechanisms proposed by Azzopardi (1983) [31]. The data of Jepson et al. (1989) [50] taken from a small internal pipe diameter of 0.01 m demonstrated a decreasing droplet size for an increasing liquid flow rate, especially for the helium–water flow case, and they suggested possible explanations for this phenomena, as explained previously. The model of Caraghiaur and Anglart (2013) [13] was not applicable to some data points of Lopes and Dukler (1985) [40], Fore et al. (2002) [48], and Alamu (2010) [65], and had limitations.
Through a systematic analysis of the open source literature data comprising 468 data points, we develop a new correlation for SMD that incorporates the effects of physical fluid properties and flowing system conditions. The new correlation is presented in Equation (17). It enhances predictions by accounting for the effects of the inclination angle and pipe diameter on SMD, while also improving sensitivity to variations in gas and liquid flow rates, as well as fluid properties’ impacts on SMD.
where and are defined in Equation (18).
The model evaluation was performed by cross-fitting the predictive and experimental data, and comparing the average absolute relative errors (AAREs) using Equation (14). Many existing models require entrained liquid mass flux, , to calculate the Sauter mean diameter, which is often not provided in the literature. In this study, the Wallis (1969) [84] correlation (Equation (19)) was employed [76]. Additionally, the interfacial friction factor in Lopes’s and Dukler’s (1985) [40] model was computed using Equations (20) and (21) [9].
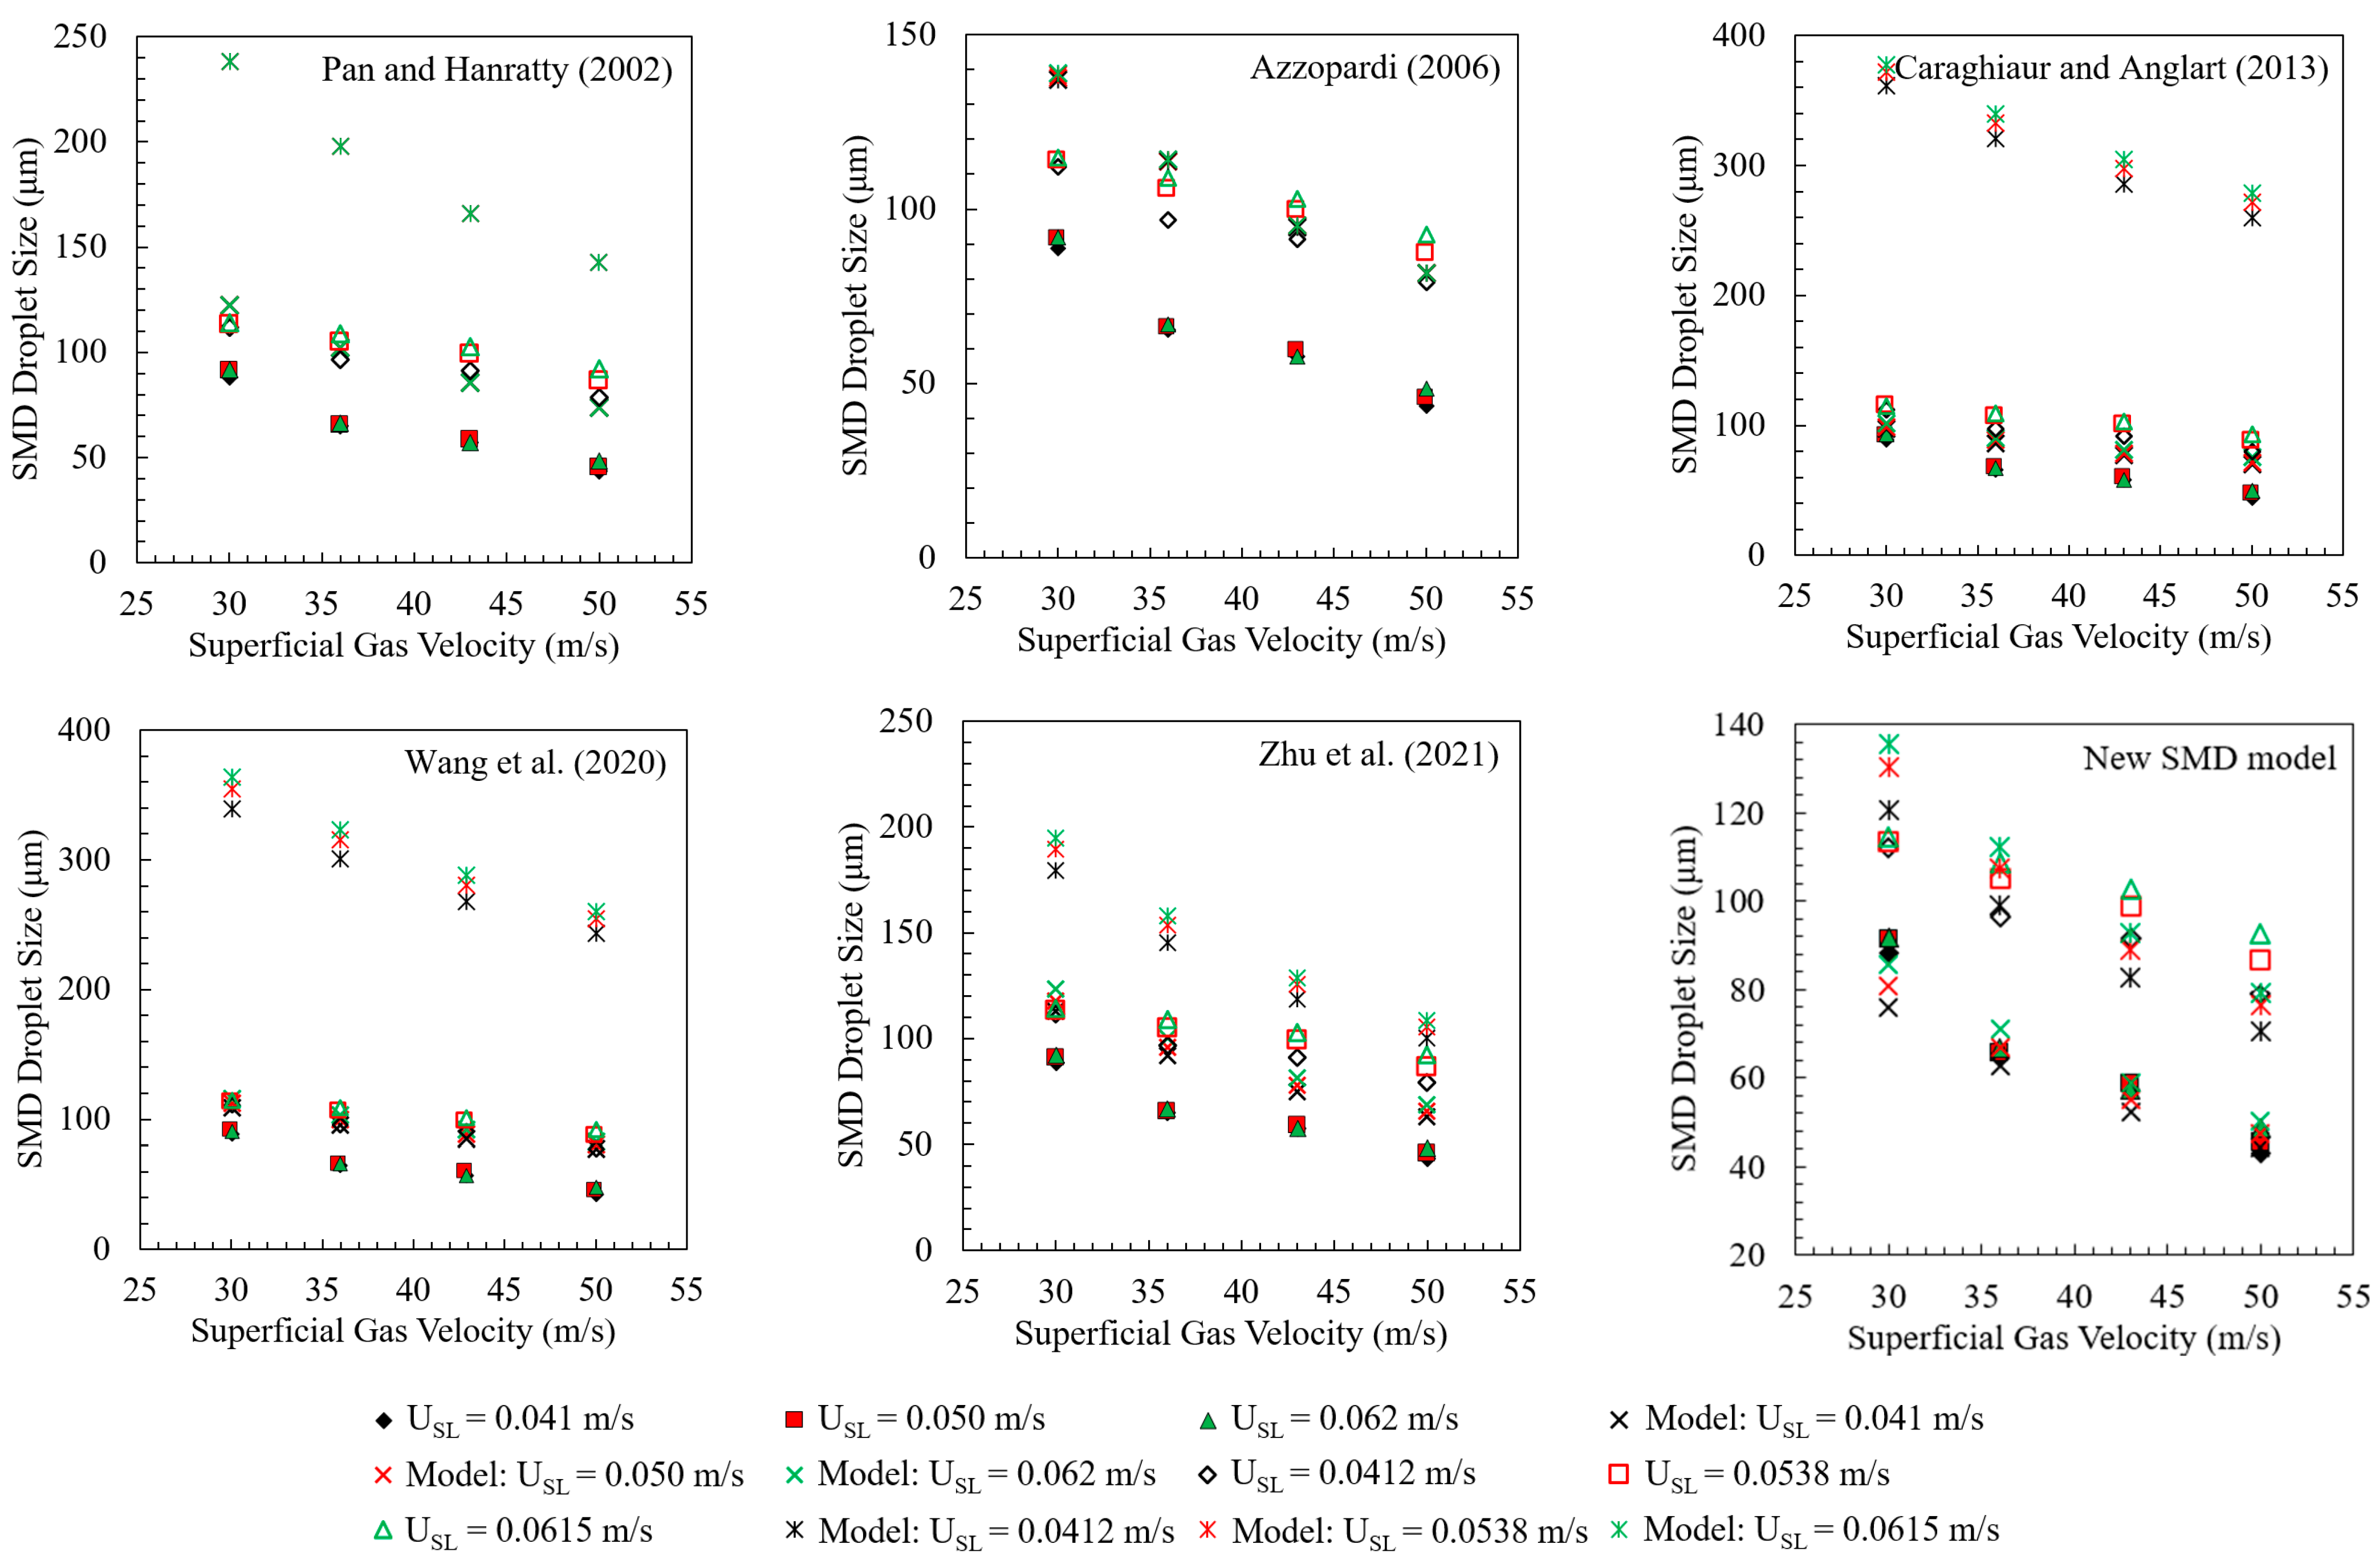
The new SMD model was tested for sensitivity to changes in the superficial gas and liquid velocities, liquid viscosity, gas density, and pipe internal diameter, which are discussed in Appendix A. The appendix also shows the performances of other existing models listed in Table 4. We keep them in the appendix concerning the number of figures. Our observations indicate that previous models perform best with their own experimental datasets, but their performance degrades with other datasets. The new correlation generally captures the effects of the investigated parameters on SMD well, including superficial gas and liquid velocities, liquid viscosity, gas density, and pipe internal diameter.
Figure 10 provides a visual comparison of the predictions of select models and the corresponding experimental data for SMD. These models are commonly referenced or developed based on experimental data obtained across various fluid and system properties. Additional parity plots for all other SMD models mentioned in Table 4 can be found in Appendix B. The experimental conditions can be found in Table 2.
Most experimental data show an increase in droplet size with increasing the total volume fraction of the dispersed liquid phase. Accordingly, the models that explicitly include the effect of the liquid flow rate (Azzopardi et al., 1980 [62]; Azzopardi, 1985 [6]; Azzopardi et al., 1989 [80]; Simmons and Hanratty, 2001 [59]; Wang et al. (2020) [49]; Zhu et al. (2021) [66], and the new correlation) predict the trend of larger droplet sizes with an increased liquid flow rate. On the other hand, it has come to our attention that the orthogonal data points shown in the cross plots correspond to the helium/water flow data from Jepson et al. (1989) [50]. The new correlation displays an opposite trend for these data points, which show a clear decreasing trend in the droplet size with increasing liquid flow rate. However, their other datasets using air/water mostly show a positive trend. We suspect that the relationship between droplet size and the liquid flow rate could also be impacted by gas density. Interestingly, the models predicting an increasing trend with liquid flow rate show opposite predictions for Jepson’s helium/water flow data, such as Azzopardi et al. (1989) [80], Wang et al. (2020) [49], and the new SMD correlation. Conversely, the models predicting a decreasing trend of droplet size with increasing liquid flow rate correctly predict the trend for Jepson’s helium/water data, but fail for most other datasets showing a positive relationship between droplet size and liquid flow rate. Further investigations may be required to better understand the relationships.
Overall, the new correlation demonstrates a fair agreement between prediction and measurement (Figure 10) for all data from both vertical and horizontal pipe flows and across all measurement techniques, with an average absolute relative error of 29%. Table 5 provides a summary of the average absolute relative errors for all SMD models. Note that, for Wang et al.’s (2020) [49] model, we modified the coefficient from 0.022 to 0.014 in their equation to better capture the liquid viscosity effects, reducing the AARE for their model from 120% to 62%.
Several authors observed a constant ratio between the maximum droplet size and the Sauter mean diameter based on experimental studies. Both experimental data and model predictions indicate that the ratio between the maximum droplet size and Sauter mean diameter may vary in the range of 1.9–5.4, with an average value of 3.7. Table A1 summarizes the relative ratio between dmax and d32 from the experimental observations and new model predictions, which may shed light onto future work on relative studies.
4. Conclusions
In summary, we performed a data analysis on the maximum droplet size and Sauter mean diameter in gas–liquid annular pipe flows based on open source experimental data, and proposed two new correlations for the maximum droplet diameterand Sauter mean diameter.
The experimental datasets from previous studies generally show that the liquid droplet size decreases with increasing superficial gas velocity and decreasing surface tension, while it increases with increasing liquid volumetric fraction, internal pipe diameter, and liquid viscosity. The effect of gas density requires more experimental investigations to make a definitive statement.
An investigation of existing models revealed limitations that motivated the development of the new correlations. We conducted model evaluations and parametric studies to assess model sensitivity to changes in different parameters and overall performance across a wide range of conditions. The results indicate that previous models perform best with their own experimental datasets, but their performance degrades with other datasets. In contrast, the new correlations generally capture the effects of the discussed parameters on SMD well, including superficial gas and liquid velocities, liquid viscosity, gas density, and pipe internal diameter. The average absolute relative errors are reduced to 14.8% for the maximum droplet diameter and 29% for the Sauter mean diameter.
We also wanted to highlight that the applicability of the correlations beyond the investigated conditions requires further examination. Additional research is needed to validate and potentially refine the correlations when applied to a broader range of conditions not covered in this study.
Author Contributions
Conceptualization, K.K. and Y.F.; methodology, K.K. and Y.F.; software, K.K. and Y.F.; validation, K.K. and Y.F.; formal analysis, K.K. and Y.F.; investigation, K.K. and Y.F.; resources, K.K. and Y.F.; data curation, K.K.; writing—original draft preparation, K.K.; writing—review and editing, Y.F.; visualization, K.K. and Y.F.; supervision, Y.F.; project administration, Y.F.; funding acquisition, Y.F. All authors have read and agreed to the published version of the manuscript.
Funding
This research received no external funding.
Data Availability Statement
Data are contained within the article. The other unpublished data presented in this study may be available on request from the corresponding authors. These data are not publicly available due to confidentiality.
Acknowledgments
The authors would like to acknowledge the financial support from the following organizations to support Karatayev’s Ph.D. study at the Colorado School of Mines–Kazakhstan’s Presidential International Scholarship Bolashak and the Karachaganak Petroleum Operating (KPO) company of the Republic of Kazakhstan.
Conflicts of Interest
The authors declare no conflicts of interest.
Appendix A
This appendix presents the parametric study that discusses the sensitivity of the SMD model to changes in gas and liquid flow rates, liquid viscosity, gas density, and pipe diameters.
Figure A1 shows the Sauter mean diameter model sensitivity studies for changes in liquid viscosity, as well as the gas superficial velocity. In summary, only three models (Caraghiaur and Anglart, 2013 [13]; Wang et al., 2020 [49]; and the new SMD model) capture the liquid viscosity effect on the droplet sizes. Some correlations (Kataoka et al., 1983 [46]; Kim et al., 1993 [82]; Zhu et al., 2021 [66]) incorrectly predict smaller droplet sizes at higher liquid viscosities, contradicting the experimental data results. Wang et al.’s (2020) [49] model provides the best predictions for the data shown in Figure A1, which are their own data. However, its performance degrades when compared with other datasets, which is demonstrated in the subsequent plots. Figure A1 illustrates that the new model accurately captures the increasing trend of SMD diameter with increasing liquid viscosity or decreasing gas flow rate.
Figure A1.
Model sensitivity for changes in liquid viscosity at various gas superficial velocities at a constant superficial liquid velocity of 0.04 m/s (data from Wang et al., 2020 [49]). Previous models are from [6,13,40,41,46,47,48,49,51,58,59,62,66,80,81,82,83].


Figure A2 shows Sauter mean diameter model sensitivity studies for changes in gas density. In summary, three models (Azzopardi et al., 1989 [80]; Fore et al., 2002 [48]; and the new SMD model) predict the effect of gas density on the droplet sizes, indicating larger droplet sizes for higher gas density and liquid flow rates. Some correlations (Kataoka et al., 1983 [46]; Lopes and Dukler, 1985 [40]; Zhu et al., 2021 [66]) clearly predict smaller droplet sizes at a higher gas density, which is contradictory to the experimental observations by Fore et al. (2002) [48]. Fore et al.’s (2002) model provides the best prediction for the data shown in Figure A2, which is expected since they are their own data. Its performance degrades when compared with other datasets.
Figure A2.
Model sensitivity for changes in gas density at various gas and liquid superficial velocities (data from Fore et al., 2002 [48]). Previous models are from [6,13,40,41,46,47,48,49,51,58,59,62,66,80,81,82,83].
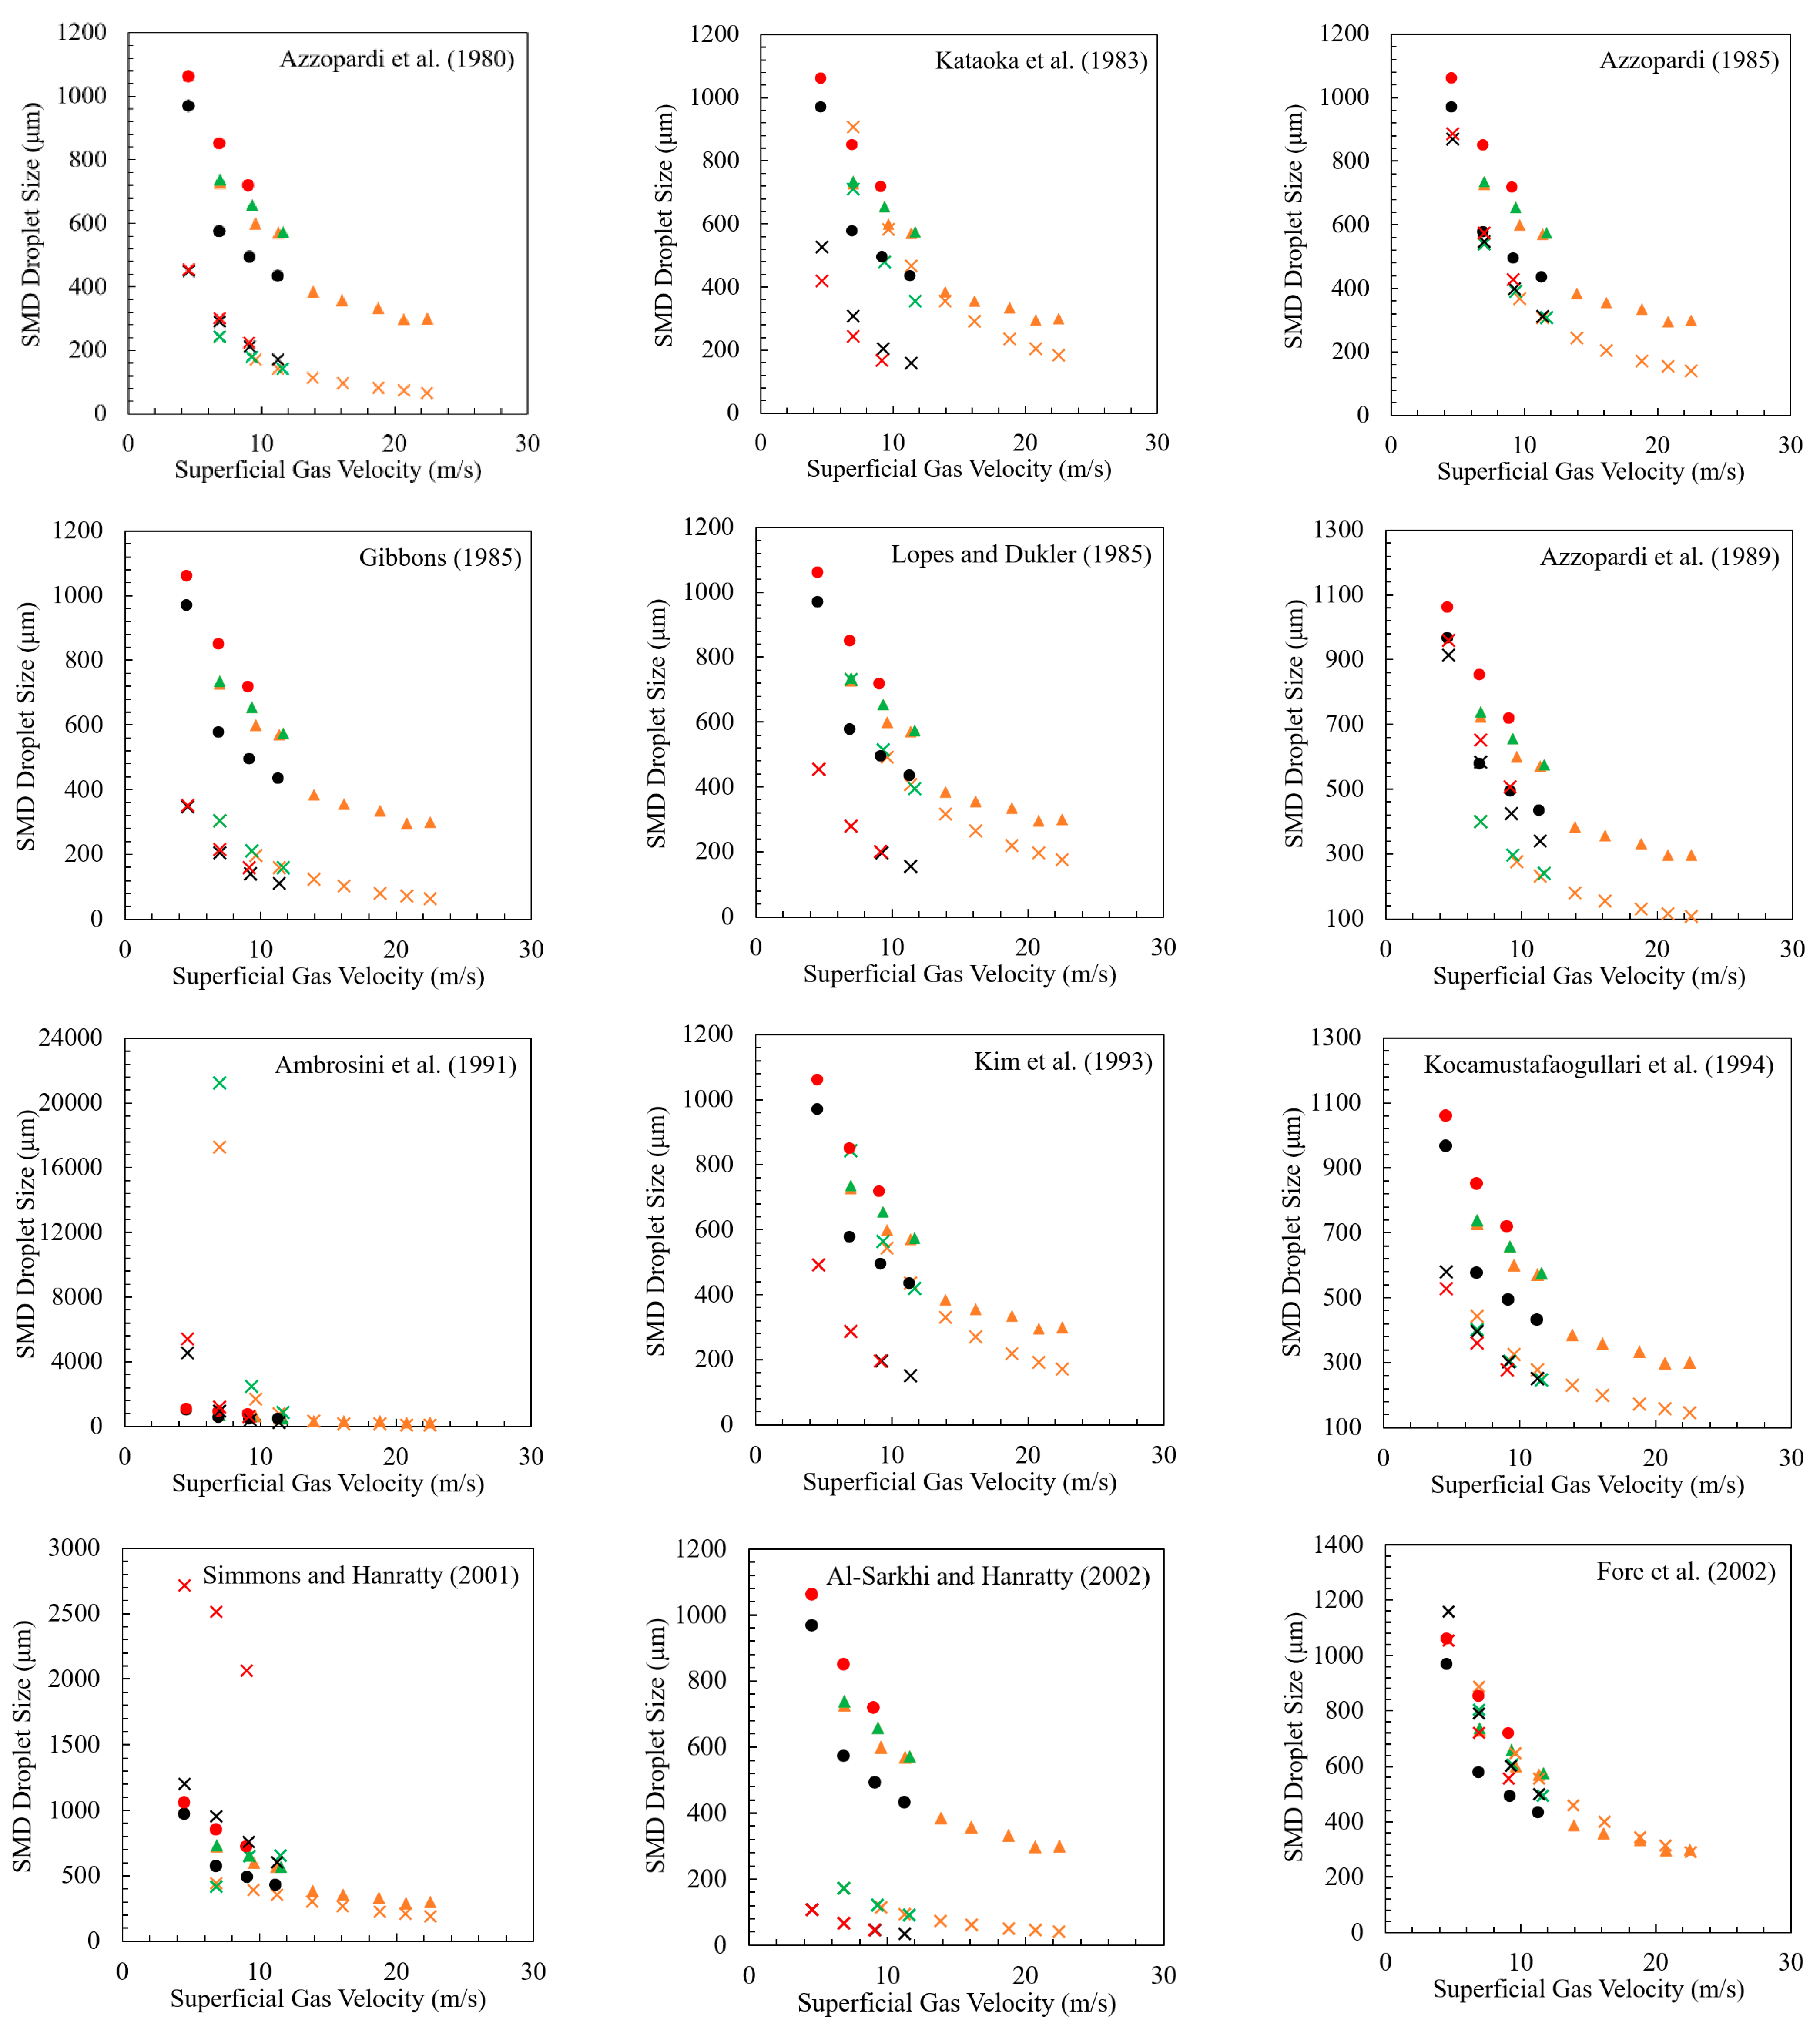
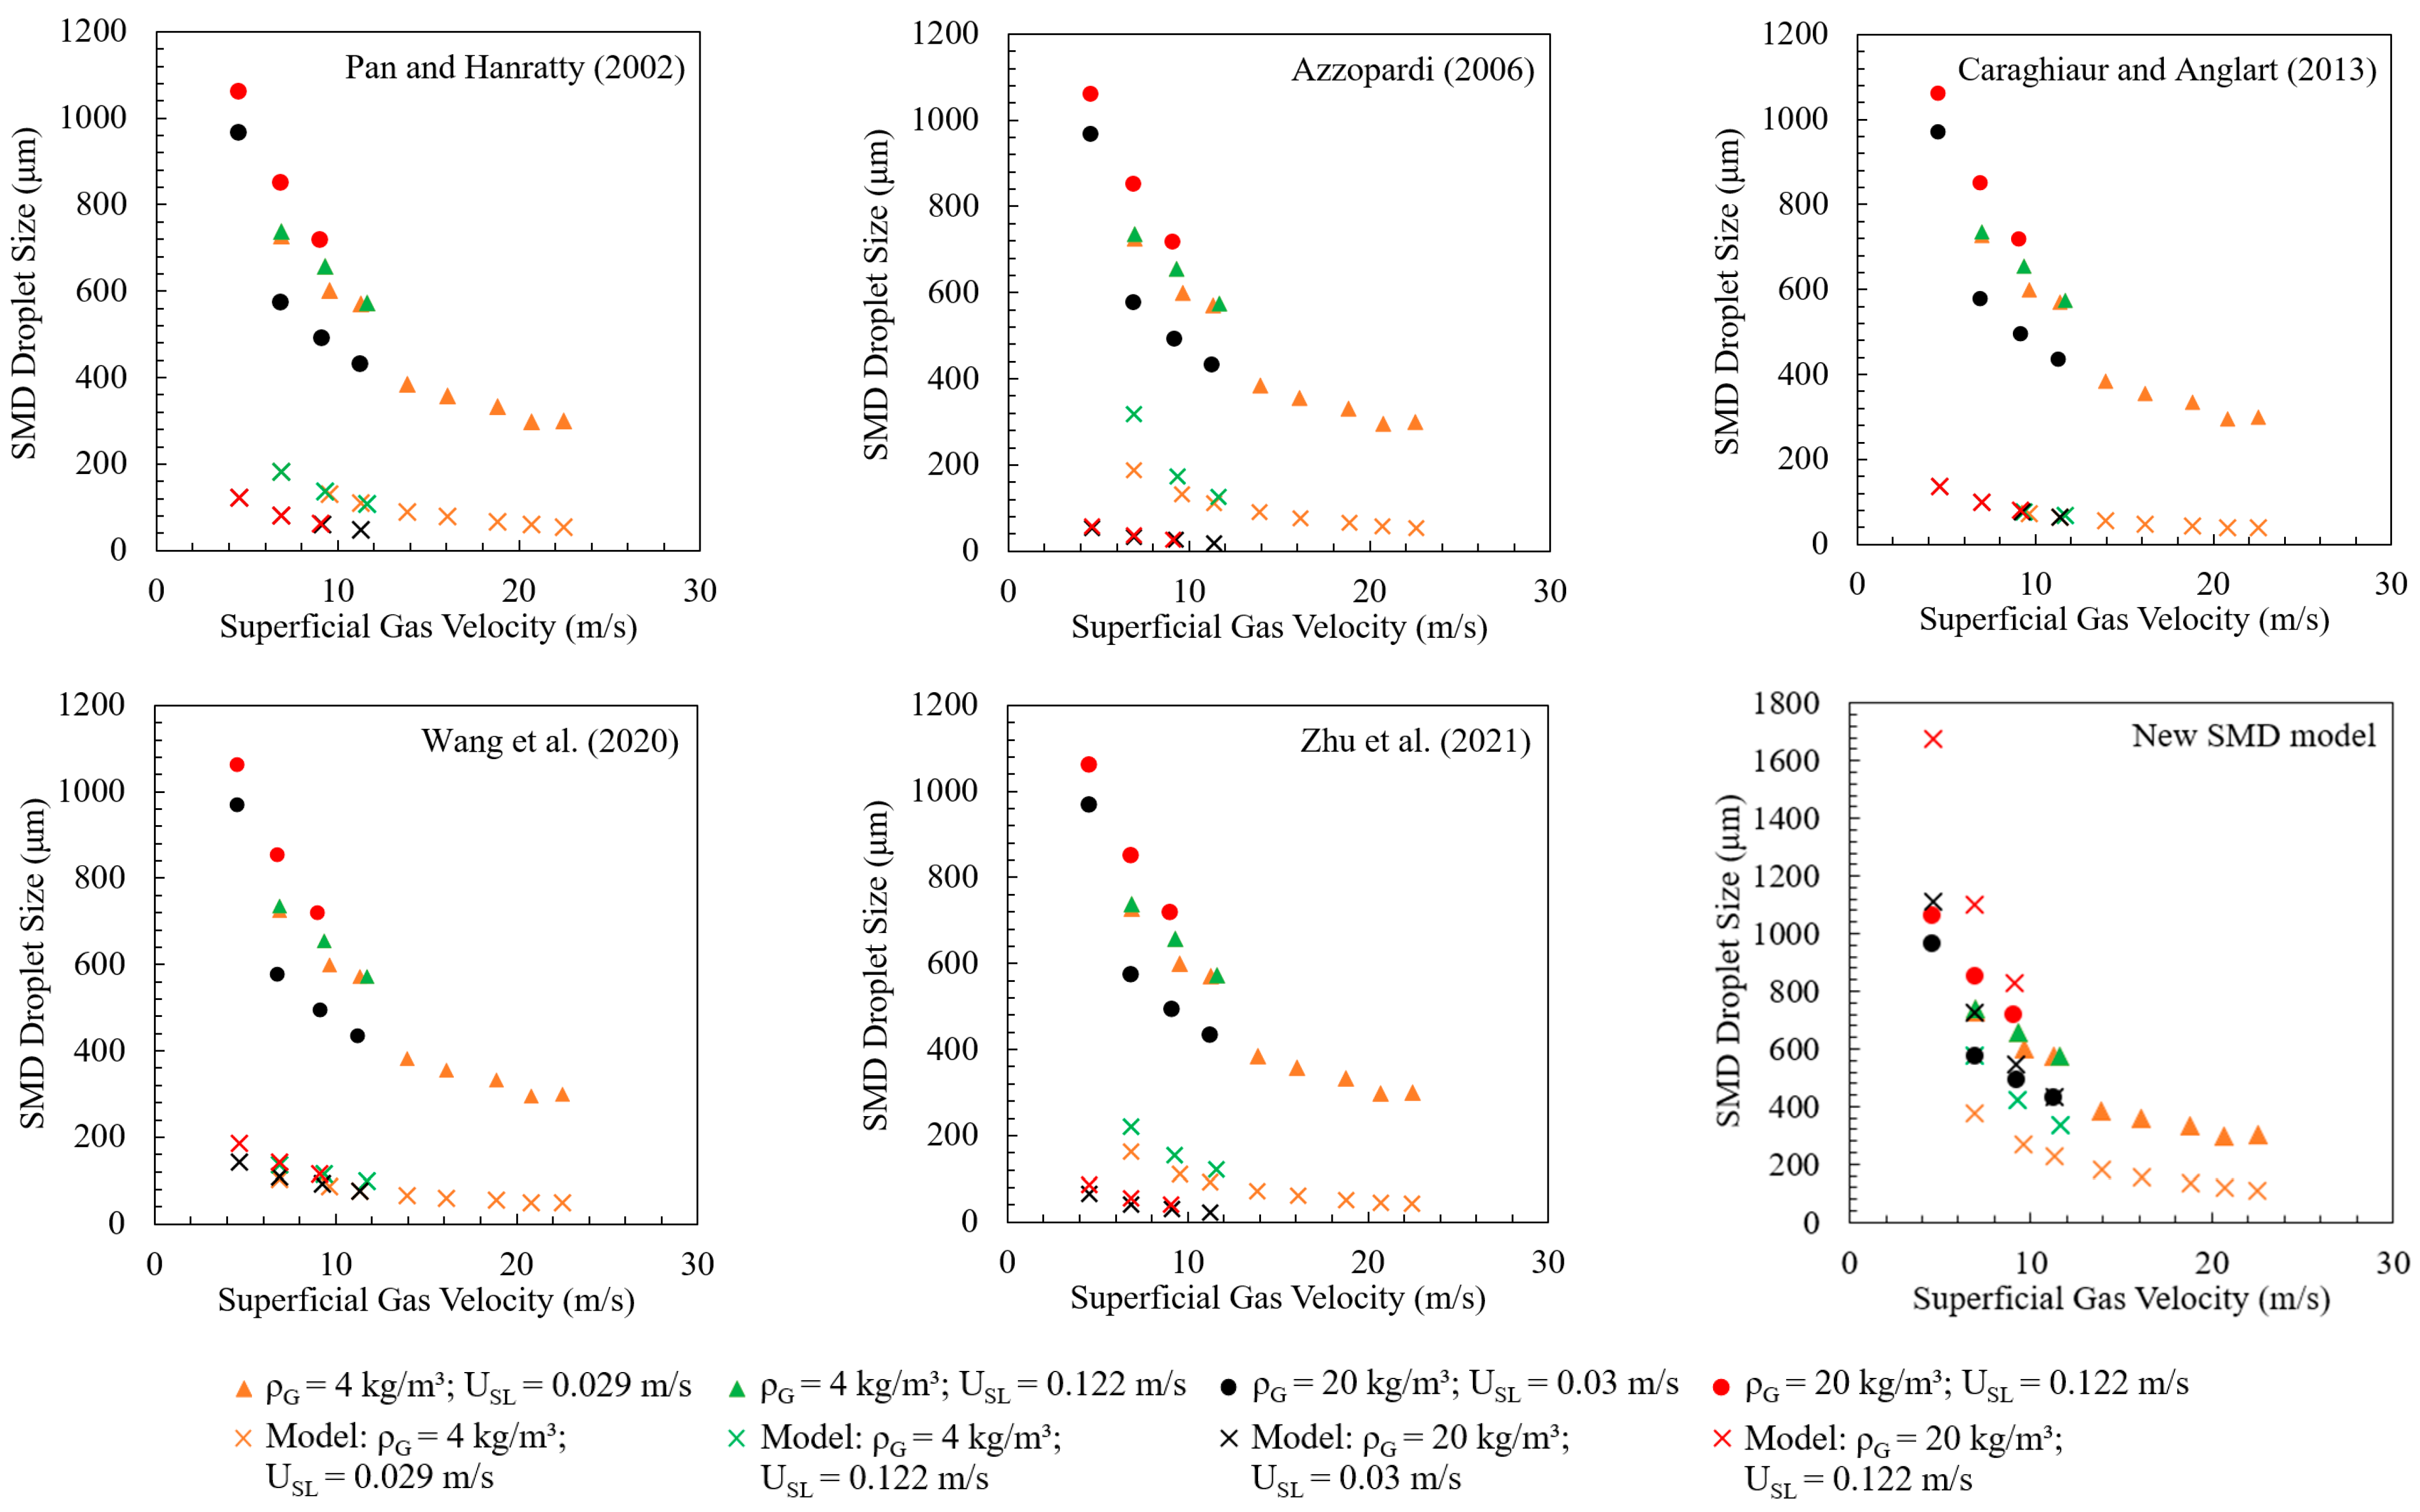
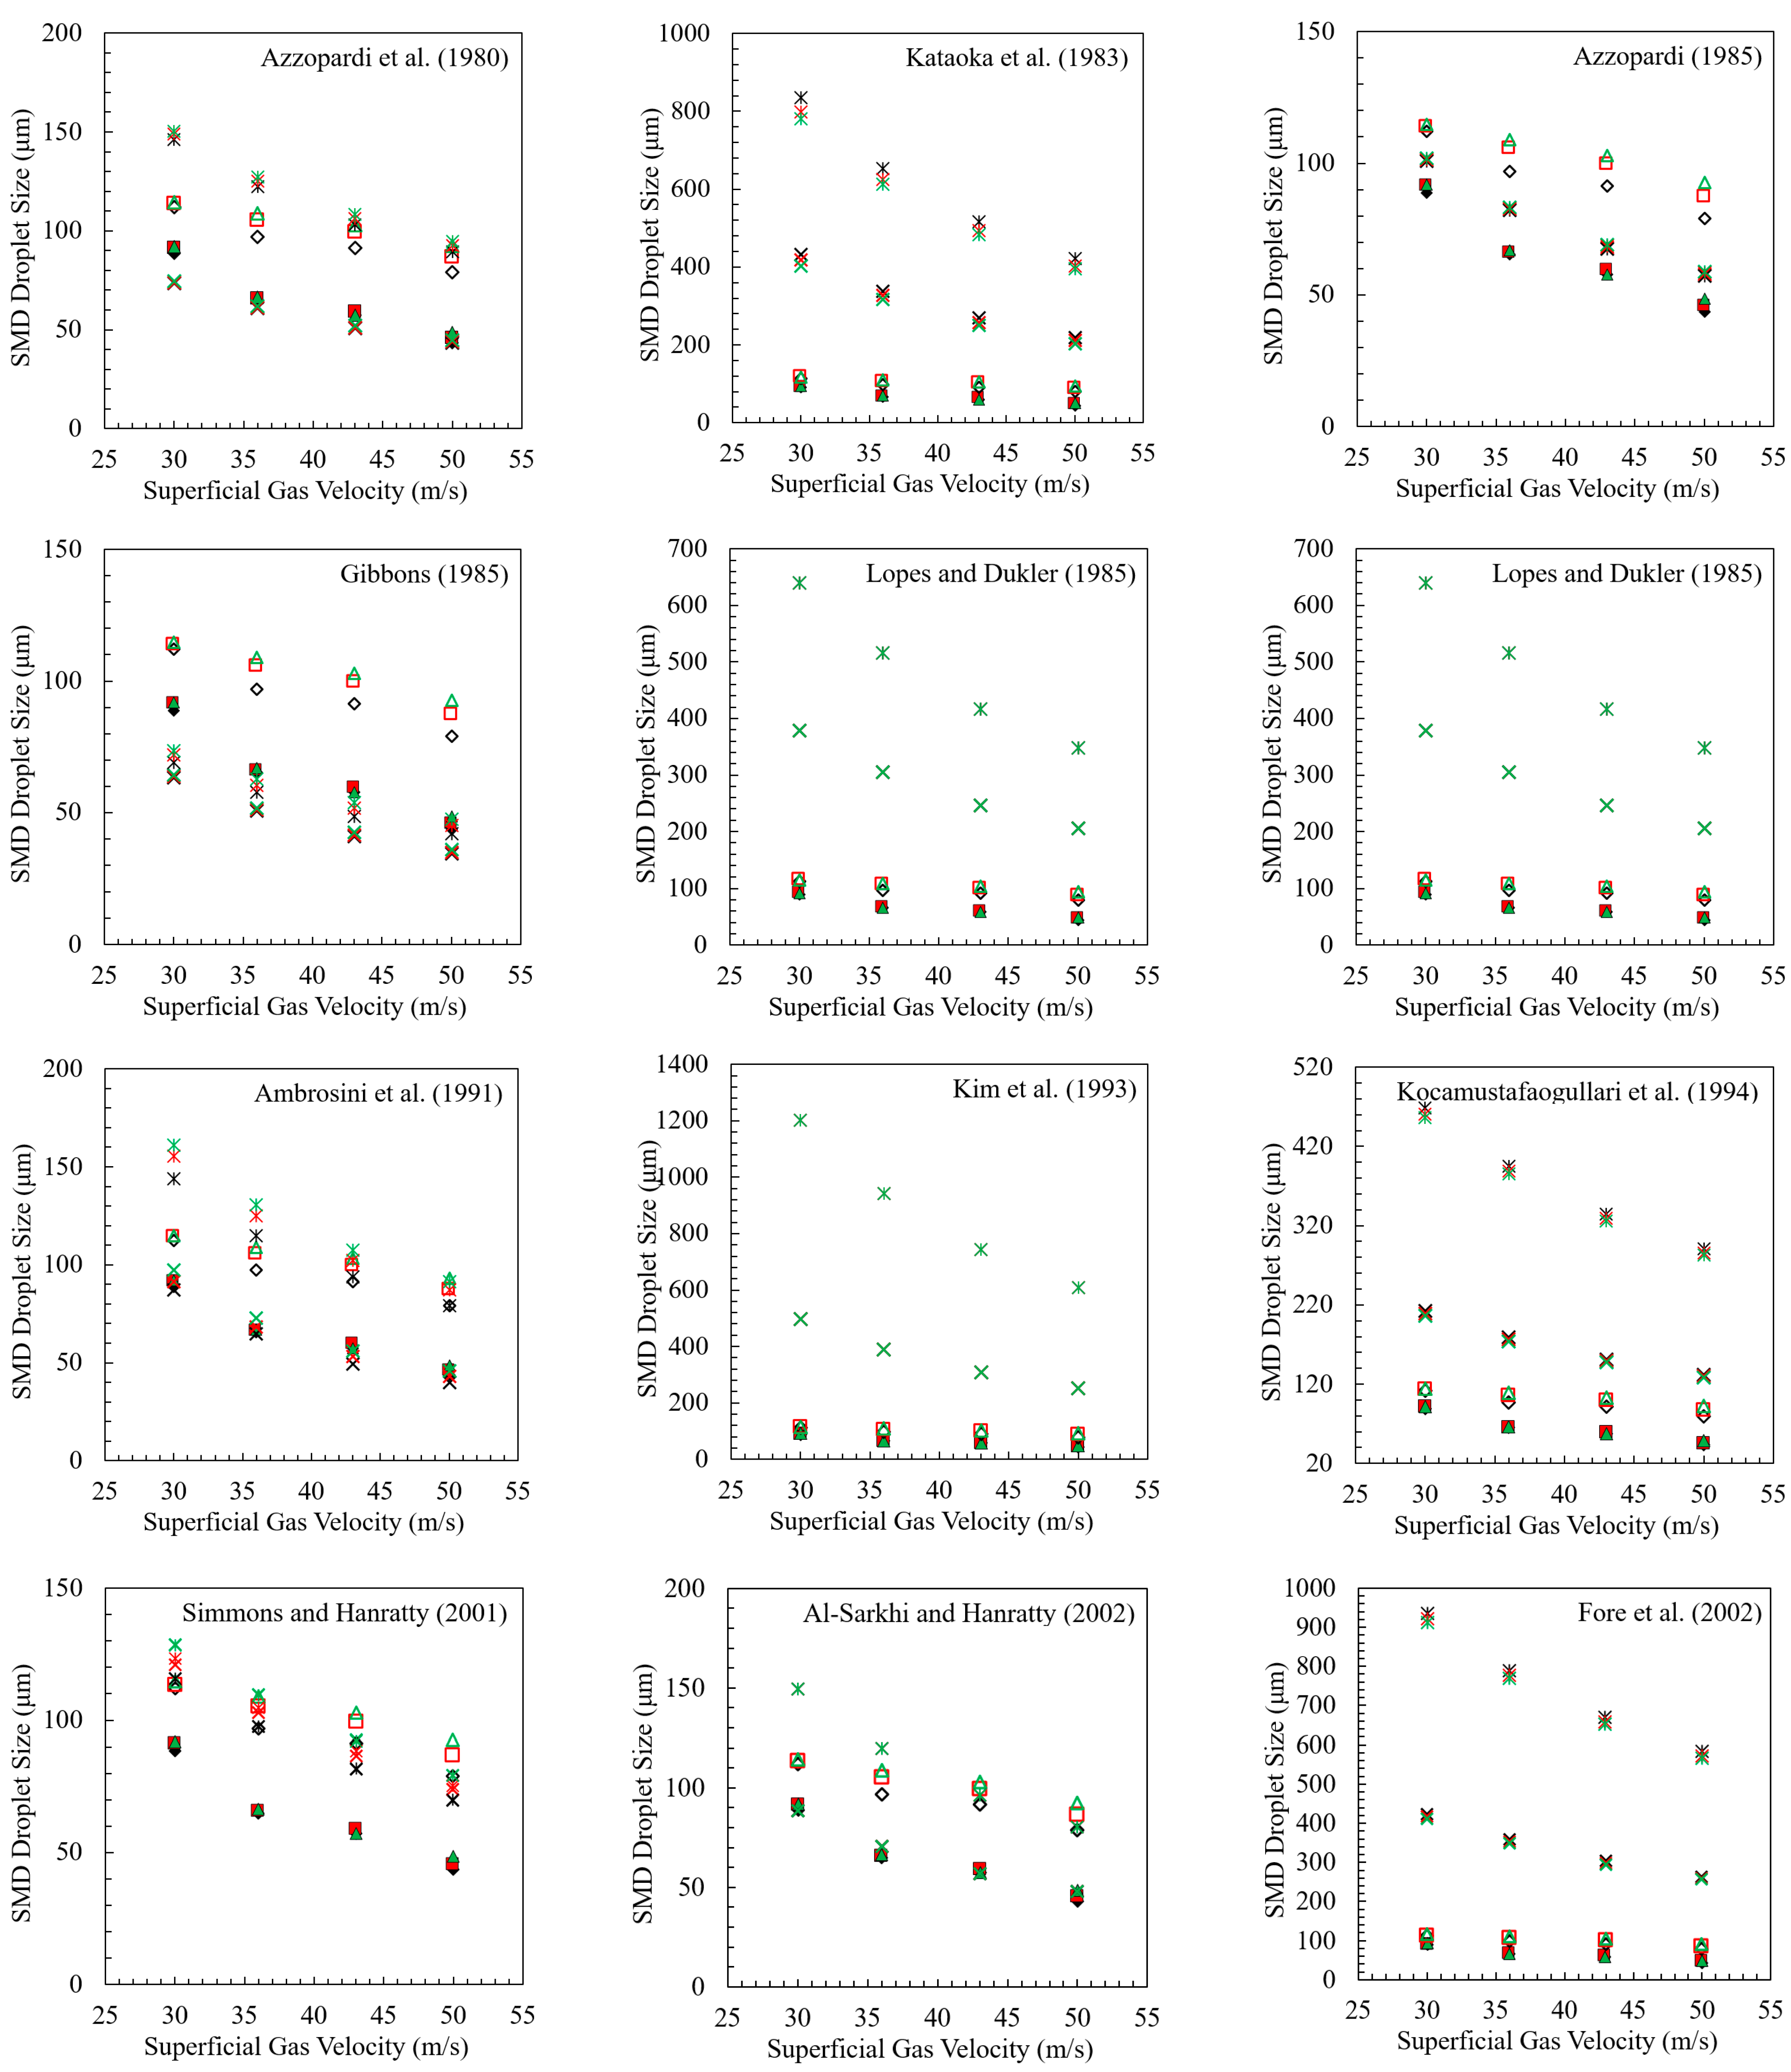
Figure A3 shows Sauter mean diameter model sensitivity studies for changes in pipe internal diameter. Only a few models (Azzopardi et al., 1980 [62]; Azzopardi et al., 1989 [80]; Ambrosini et al., 1991 [81]; Al-Sarkhi and Hanratty, 2002 [58]; and the new SMD model) capture the effect of the internal pipe diameter on the droplet sizes, showing larger droplet sizes for a larger internal pipe diameter at increasing liquid flow rates.
Figure A3.
Model sensitivity to changes in an internal pipe diameter at various gas and liquid superficial velocities (filled markers and cross markers (model) for the data of Al-Sarkhi and Hanratty, 2002 [58], and unfilled markers and star markers for the data of Simmons and Hanratty, 2001 [59]). Previous models are from [6,13,40,41,46,47,48,49,51,58,59,62,66,80,81,82,83].
Appendix B
Figure A4 shows the parity plots, illustrating the model predictions for the Sauter mean diameter (SMD) compared with the experimental data. The models presented in this appendix are the remaining ones that are not shown in Figure 10.
Figure A4.
Comparison of predictive models against experimental data for SMD for gas–liquid annular flow. Previous models are from [6,13,40,46,47,59,62,66,81,82,83]. The experimental data are from [6,10,11,40,44,48,49,50,55,56,58,59,61,64,65,66].
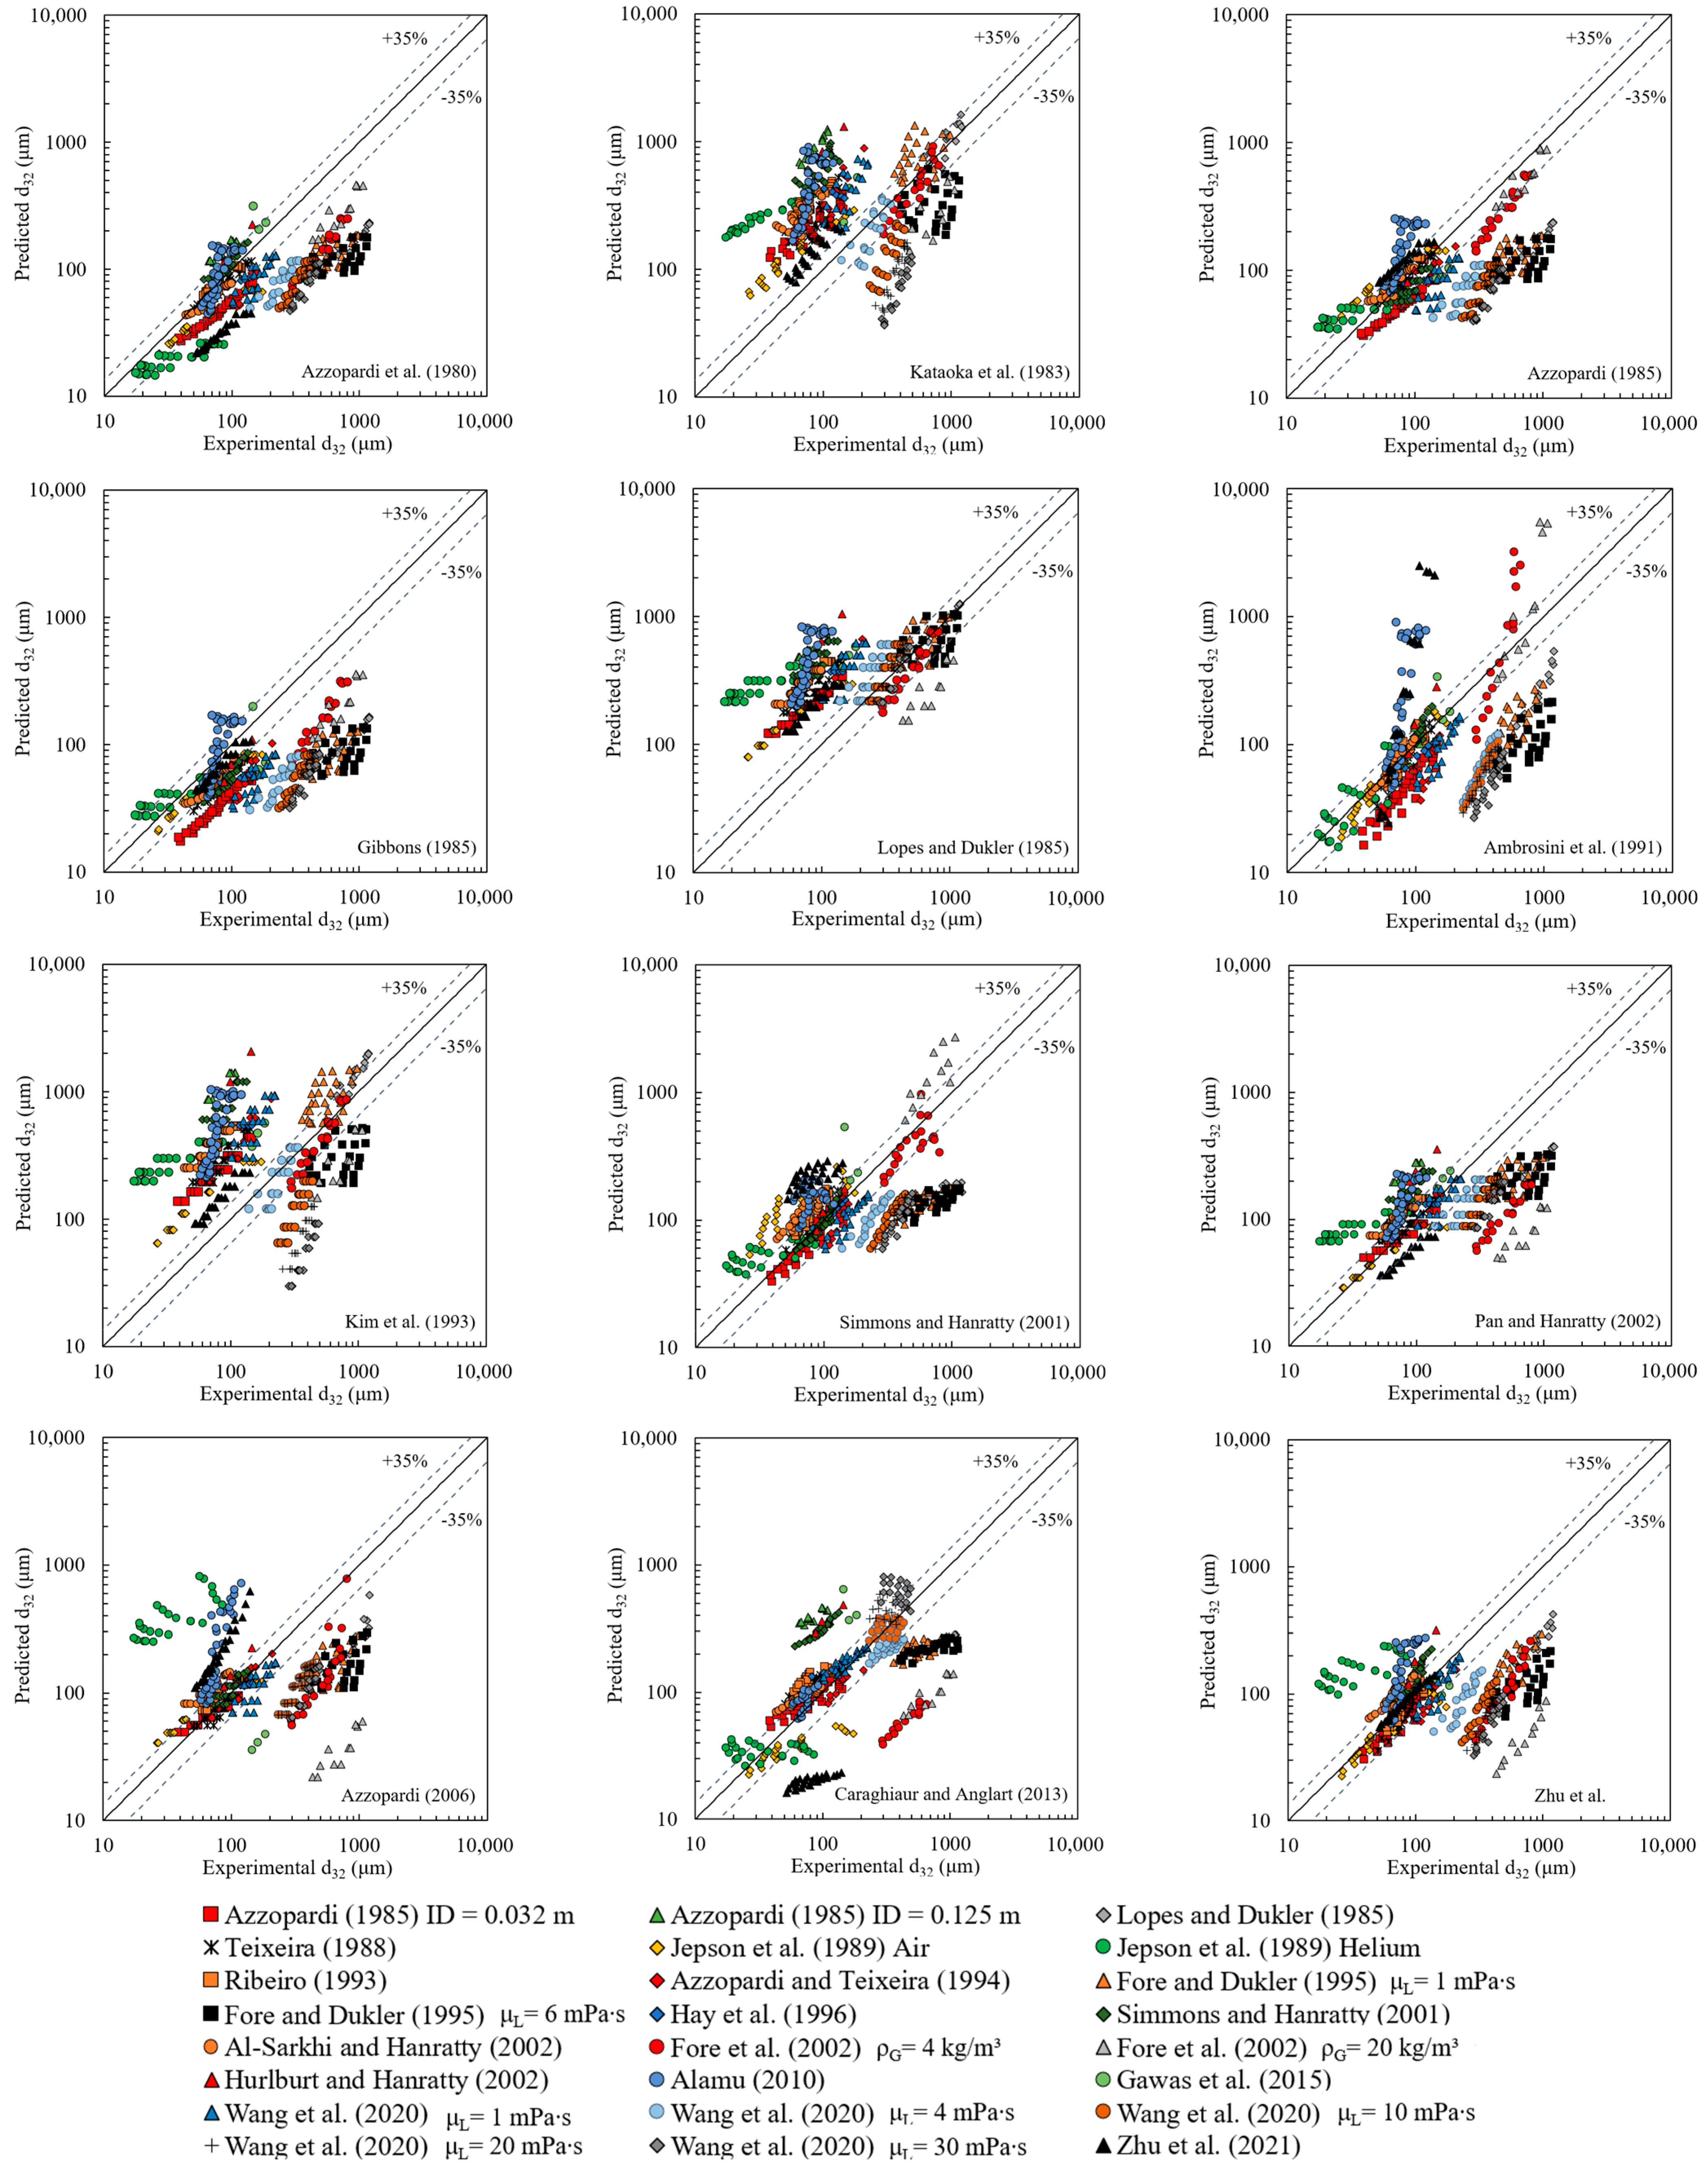

Table A1.
Relative ratio between the maximum droplet size and the Sauter mean diameter from experimental measurements and new model predictions.
Table A1.
Relative ratio between the maximum droplet size and the Sauter mean diameter from experimental measurements and new model predictions.
| Authors | dmax/d32 Based on Experimental Data | dmax/d32 Based on New Model Predictions |
|---|---|---|
| Lopes and Dukler (1985) [40] | 2.30 | 2.37 |
| Hurlburt and Hanratty (2002) [61] | 3.10 | 4.66 |
| Al-Sarkhi and Hanratty (2002) [58]; data analysis | 4.37 | 5.43 |
| Fore et al. (2002) [48]; data analysis | 2.65 | 3.41 |
| Gawas et al. (2015) [55]; data analysis | 2.74 | 1.89 |
References
- Azzopardi, B.J. Drops in annular two-phase flow. Int. J. Multiph. Flow 1997, 23, 1–53. [Google Scholar] [CrossRef]
- Berna, C.; Escrivá, A.; Muñoz-Cobo, J.L.; Herranz, L.E. Review of droplet entrainment in annular flow: Interfacial waves and onset of entrainment. Prog. Nuclear Energy 2014, 74, 14–43. [Google Scholar] [CrossRef]
- Andreussi, P.; Azzopardi, B.J. Droplet deposition and interchange in annular two-phase flow. Int. J. Multiph. Flow 1983, 9, 681–695. [Google Scholar] [CrossRef]
- Stoner, H.M.; Koh, C.A. Perspective on the role of particle size measurements in gas hydrate agglomeration predictions. Fuel 2021, 304, 121385. [Google Scholar] [CrossRef]
- Al Munif, E.; Alrashed, A.; Karatayev, K.; Miskimins, J.; Fan, Y. Modeling the Effects of Various Liquid Droplet Sizes in Acoustic Deliquification Techniques. Available online: https://onepetro.org/speeesc/proceedings-abstract/21EESC/2-21EESC/472408 (accessed on 1 November 2021).
- Azzopardi, B.J. Drop sizes in annular two-phase flow. Exp. Fluids 1985, 3, 53–59. [Google Scholar] [CrossRef]
- Ribeiro, A.M.; Bott, T.R.; Jepson, D.M. The influence of a bend on drop sizes in horizontal annular two-phase flow. Int. J. Multiph. Flow 2001, 27, 721–728. [Google Scholar] [CrossRef]
- Koh, C.A.; Sum, A. Natural Gas Hydrates in Flow Assurance; Gulf Professional Publishing: Houston, TX, USA, 2010. [Google Scholar]
- Ishii, M.; Grolmes, M.A. Inception criteria for droplet entrainment in two-phase concurrent film flow. AIChE J. 1975, 21, 308–318. [Google Scholar] [CrossRef]
- Teixeira, J.C.F. Turbulence in Annular Two Phase Flow; University of Birmingham: Birmingham, UK, 1988. [Google Scholar]
- Fore, L.B.; Dukler, A.E. The distribution of drop size and velocity in gas-liquid annular flow. Int. J. Multiph. Flow 1995, 21, 137–149. [Google Scholar] [CrossRef]
- Brauner, N. The prediction of dispersed flows boundaries in liquid–liquid and gas–liquid systems. Int. J. Multiph. Flow 2001, 27, 885–910. [Google Scholar] [CrossRef]
- Caraghiaur, D.; Anglart, H. Drop deposition in annular two-phase flow calculated with Lagrangian Particle Tracking. Nucl. Eng. Des. 2013, 265, 856–866. [Google Scholar] [CrossRef]
- Hinze, J.O. Fundamentals of the hydrodynamic mechanism of splitting in dispersion processes. AIChE J. 1955, 1, 289–295. [Google Scholar] [CrossRef]
- Wang, L.-S.; Krull, B.; Lucas, D.; Meller, R.; Schlegel, F.; Tekavčič, M.; Xu, J. Simulation of droplet entrainment in annular flow with a morphology adaptive multifield two-fluid model. Phys. Fluids 2023, 35, 103312. [Google Scholar] [CrossRef]
- Han, H.; Gabriel, K. A Numerical Study of Entrainment Mechanism in Axisymmetric Annular Gas-Liquid Flow. J. Fluids Eng. 2006, 129, 293–301. [Google Scholar] [CrossRef]
- Kumar, P.; Das, A.K.; Mitra, S.K. Physical understanding of gas-liquid annular flow and its transition to dispersed droplets. Phys. Fluids 2016, 28, 072101. [Google Scholar] [CrossRef]
- Liu, X.-L.; Hu, S.-Q.; Wang, Y.; Liu, L.-L.; Zhang, Y. Numerical investigation on the droplet entrainment from gas sheared liquid film of hydroxyl-terminated polybutadiene/paraffin fuels. Phys Fluids 2023, 35, 012108. [Google Scholar] [CrossRef]
- Xie, Z.; Hewitt, G.F.; Pavlidis, D.; Salinas, P.; Pain, C.C.; Matar, O.K. Numerical study of three-dimensional droplet impact on a flowing liquid film in annular two-phase flow. Chem. Eng. Sci. 2017, 166, 303–312. [Google Scholar] [CrossRef]
- Fan, W.; Li, H.; Anglart, H. Numerical investigation of spatial and temporal structure of annular flow with disturbance waves. Int. J. Multiph. Flow 2019, 110, 256–272. [Google Scholar] [CrossRef]
- Rodriguez, J.M. Numerical Simulation of Two-Phase Annular Flow. Ph.D. Dissertation, Rensselaer Polytechnic Institute, Troy, NY, USA, 2009. [Google Scholar]
- Liu, Y.; Cui, J.; Li, W.Z. A two-phase, two-component model for vertical upward gas–liquid annular flow. Int. J. Heat. Fluid. Flow 2011, 32, 796–804. [Google Scholar] [CrossRef]
- Nie, B.C.; Guan, X.; Vanden-Broeck, J.-M.; Dias, F. Air/water interfacial waves with a droplet at the tip of their crest. Phys Fluids 2023, 35, 012101. [Google Scholar] [CrossRef]
- Abobaker, E.; Elsanoose, A.; Shirokoff, J.; Rahman, M.A. CFD Simulation of Two-Phase Vertical Annular Flow in Both Upward and Downward Direction in a Small Pipe. In Proceedings of the ASME 2019 38th International Conference on Ocean, Offshore and Arctic Engineering, Glasgow, Scotland, UK, 9–14 June 2019. V008T11A051. [Google Scholar]
- Saxena, A.; Prasser, H.-M. A study of two-phase annular flow using unsteady numerical computations. Int. J. Multiph. Flow 2020, 126, 103037. [Google Scholar] [CrossRef]
- Huo, J.; Wang, L.; Tang, J.; Shi, X. Droplets impact against the random rough surface with a liquid film. Phys Fluids 2023, 35, 063314. [Google Scholar]
- Yun, G.; Ishiwatari, Y.; Ikejiri, S.; Oka, Y. Numerical analysis of the onset of droplet entrainment in annular two-phase flow by hybrid method. Ann. Nucl. Energy 2010, 37, 230–240. [Google Scholar] [CrossRef]
- Xie, H.; Koshizuka, S.; Oka, Y. Numerical Simulation of Liquid Drop Deposition in Annular-Mist Flow Regime of Boiling Water Reactor. J. Nucl. Sci. Technol. 2004, 41, 569–578. [Google Scholar] [CrossRef]
- Wang, S.; Wang, H.; Wu, Y.; Cheng, Y. Numerical simulation of the droplet formation involving fluids with high viscosity ratio by lattice Boltzmann method. Phys. Fluids 2023, 35, 063107. [Google Scholar]
- Liu, Y.; Li, W.Z. Numerical Simulation of Droplet Size Distribution in Vertical Upward Annular Flow. J. Fluids Eng. 2010, 132, 121402. [Google Scholar] [CrossRef]
- Azzopardi, B.J. Mechanisms of Entrainment in Annular Two Phase Flow; UKAEA Atomic Energy Research Establishment: Abingdon, UK, 1983. [Google Scholar]
- Zhang, Z.; Wang, Z.; Liu, H.; Gao, Y.; Li, H.; Sun, B. Experimental study on entrained droplets in vertical two-phase churn and annular flows. Int. J. Heat. Mass. Transf. 2019, 138, 1346–1358. [Google Scholar] [CrossRef]
- Badie, S.; Lawrence, C.J.; Hewitt, G.F. Axial viewing studies of horizontal gas–liquid flows with low liquid loading. Int. J. Multiph. Flow 2001, 27, 1259–1269. [Google Scholar] [CrossRef]
- Lecoeur, N. Interfacial Behaviour in Stratified and Stratifying Annular Flows. Ph.D. Dissertation, Imperial College London, London, UK, 2013. [Google Scholar]
- Pham, S.H.; Kawara, Z.; Yokomine, T.; Kunugi, T. Detailed observations of wavy interface behaviors of annular two-phase flow on rod bundle geometry. Int. J. Multiph. Flow 2014, 59, 135–144. [Google Scholar] [CrossRef]
- Cherdantsev, A.V.; Hann, D.B.; Azzopardi, B.J. Study of gas-sheared liquid film in horizontal rectangular duct using high-speed LIF technique: Three-dimensional wavy structure and its relation to liquid entrainment. Int. J. Multiph. Flow 2014, 67, 52–64. [Google Scholar] [CrossRef]
- Troitskaya, Y.; Kandaurov, A.; Ermakova, O.; Kozlov, D.; Sergeev, D.; Zilitinkevich, S. Bag-breakup fragmentation as the dominant mechanism of sea-spray production in high winds. Sci. Rep. 2017, 7, 1614. [Google Scholar] [CrossRef]
- Cherdantsev, A.V. Experimental Investigation of Mechanisms of Droplet Entrainment in Annular Gas-Liquid Flows: A Review. Water 2022, 14, 3892. [Google Scholar] [CrossRef]
- Berna, C.; Escrivá, A.; Muñoz-Cobo, J.L.; Herranz, L.E. Review of droplet entrainment in annular flow: Characterization of the entrained droplets. Prog. Nuclear Energy 2015, 79, 64–86. [Google Scholar] [CrossRef]
- Lopes, J.C.B.; Dukler, A.E. Droplet Sizes, Dynamics and Deposition in Vertical Annular Flow; Report No.: NUREG/CR-4424; Department of Chemical Engineering, Houston University: Houston, TX, USA, October 1985. [Google Scholar] [CrossRef]
- Kocamustafaogullari, G.; Smits, S.R.; Razi, J. Maximum and mean droplet sizes in annular two-phase flow. Int. J. Heat. Mass. Transf. 1994, 37, 955–965. [Google Scholar] [CrossRef]
- Whalley, P.B.; Hewitt, G.F. Photographic Studies of Two-Phase Flow Using a Parallel Light Technique; UKAEA Atomic Energy Research Establishment: Abingdon, UK, 1979. [Google Scholar]
- Tayali, N.E.; Bates, C.J.; Yeoman, M.L. Drop Size and Velocity Measurements in Vertical Developing Annular Two-Phase Flow. In Proceedings of the 3rd International Conference on Laser Anemometry Advances and Application, Swansea, UK, 26–29 September 1990. [Google Scholar]
- Azzopardi, B.J.; Teixeira, J.C.F. Detailed Measurements of Vertical Annular Two-Phase Flow—Part I: Drop Velocities and Sizes. J. Fluids Eng. 1994, 116, 792–795. [Google Scholar] [CrossRef]
- Ueda, T. Entrainment Rate and Size of Entrained Droplets in Annular Two-Phase Flow. Bull. JSME 1979, 22, 1258–1265. [Google Scholar] [CrossRef]
- Kataoka, I.; Ishii, M.; Mishima, K. Generation and Size Distribution of Droplet in Annular Two-Phase Flow. J. Fluids Eng. 1983, 105, 230–238. [Google Scholar] [CrossRef]
- Gibbons, D.B. Drop Formation in Annular Two-Phase Flow. Ph.D. Thesis, University of Birmingham, Birmingham, UK, 1985. [Google Scholar]
- Fore, L.B.; Ibrahim, B.B.; Beus, S.G. Visual measurements of droplet size in gas–liquid annular flow. Int. J. Multiph. Flow 2002, 28, 1895–1910. [Google Scholar] [CrossRef]
- Wang, Z.; Liu, H.; Zhang, Z.; Sun, B.; Zhang, J.; Lou, W. Research on the effects of liquid viscosity on droplet size in vertical gas–liquid annular flows. Chem. Eng. Sci. 2020, 220, 115621. [Google Scholar] [CrossRef]
- Jepson, D.M.; Azzopardi, B.J.; Whalley, P.B. The effect of gas properties on drops in annular flow. Int. J. Multiph. Flow 1989, 15, 327–339. [Google Scholar] [CrossRef]
- Pan, L.; Hanratty, T.J. Correlation of entrainment for annular flow in vertical pipes. Int. J. Multiph. Flow 2002, 28, 363–384. [Google Scholar] [CrossRef]
- Patruno, L.E.; Marchioro Ystad, P.A.; Jenssen, C.B.; Marchetti, J.M.; Dorao, C.A.; Svendsen, H.F.; Jakobsen, H.A. Liquid entrainment—Droplet size distribution for a low surface tension mixture. Chem. Eng. Sci. 2010, 65, 5272–5284. [Google Scholar] [CrossRef]
- van Nimwegen, A.T.; Portela, L.M.; Henkes, R.A.W.M. The effect of surfactants on air–water annular and churn flow in vertical pipes. Part 1: Morphology of the air–water interface. Int. J. Multiph. Flow 2015, 71, 133–145. [Google Scholar] [CrossRef]
- Magrini, K.L. Liquid Entrainment in Annular Gas-liquid Flow in Inclined Pipes. Master’s Thesis, The University of Tulsa, Tulsa, OK, USA, 2012. [Google Scholar]
- Gawas, K.; Pereyra, E.; Sarica, C. Experimental study of drop size distribution for air-oil two-phase flow in large diameter pipe. In Proceedings of the SPE Annual Technical Conference and Exhibition, Houston, TX, USA, 28–30 September 2015. [Google Scholar] [CrossRef]
- Ribeiro, A.M. Studies of Gas–Liquid Flow in Bends. Ph.D. Thesis, University of Birmingham, Birmingham, UK, 1993. [Google Scholar]
- Bates, C.J.; Sheriff, J.M. High data rate measurements of droplet dynamics in a vertical gas-liquid annular flow. Flow. Meas. Instrum. 1992, 3, 247–256. [Google Scholar] [CrossRef]
- Al-Sarkhi, A.; Hanratty, T.J. Effect of pipe diameter on the drop size in a horizontal annular gas–liquid flow. Int. J. Multiph. Flow 2002, 28, 1617–1629. [Google Scholar] [CrossRef]
- Simmons, M.J.H.; Hanratty, T.J. Droplet size measurements in horizontal annular gas–liquid flow. Int. J. Multiph. Flow 2001, 27, 861–883. [Google Scholar] [CrossRef]
- Schadel, S.A.; Hanratty, T.J. Interpretation of atomization rates of the liquid film in gas-liquid annular flow. Int. J. Multiph. Flow 1989, 15, 893–900. [Google Scholar] [CrossRef]
- Hurlburt, E.; Hanratty, T. Measurement of drop size in horizontal annular flow with the immersion method. Exp. Fluids 2002, 32, 692–699. [Google Scholar] [CrossRef]
- Azzopardi, B.J.; Freeman, G.; King, D.J. Drop Sizes and Deposition in Annular Two-Phase Flow; UKAEA Report AERE-R9634; United Kingdom Atomic Energy Authority: Abingdon, UK, 1980.
- Zaidi, S.H.; Altunbas, A.; Azzopardi, B.J. A comparative study of phase Doppler and laser diffraction techniques to investigate drop sizes in annular two-phase flow. Chem. Eng. J. 1998, 71, 135–143. [Google Scholar] [CrossRef]
- Hay, K.J.; Liu, Z.-C.; Hanratty, T.J. Relation of deposition to drop size when the rate law is nonlinear. Int. J. Multiph. Flow 1996, 22, 829–848. [Google Scholar] [CrossRef]
- Alamu, M.B. Investigation of Periodic Structures in Gas-Liquid Flow; University of Nottingham: Nottingham, UK, 2010. [Google Scholar]
- Zhu, F.; Yan, C.; Liu, A.; Gu, H.; Gong, S. Droplet size of vertically upward annular flow in a narrow rectangular channel. Chem. Eng. Res. Des. 2021, 174, 107–115. [Google Scholar] [CrossRef]
- Wicks, M.I.I.I.; Dukler, A.E. In situ measurements of drop size distribution in two-phase flow—A new method for electrically conducting liquids. In Proceeding of International Heat Transfer Conference; Begellhouse: Danbury, CT, USA, 2019. [Google Scholar] [CrossRef]
- Pogson, J.T.; Roberts, J.H.; Waibler, P.J. An Investigation of the Liquid Distribution in Annular-Mist Flow. J. Heat Transf. 1970, 92, 651–658. [Google Scholar] [CrossRef]
- Tatterson, D.F. Rates of Atomization and Drop Size in Annular Two-Phase Flow. Ph.D. Thesis, University of Illinois at Urbana-Champaign, Urbana, IL, USA, 1975. [Google Scholar]
- Andreussi, P.; Romano, G.; Zanelli, S. Drop size distribution in annular mist flow. In Proceedings of the First Inter-national Conference on Liquid Atomization and Spray Systems, Tokyo, Japan, 27–31 August 1978. [Google Scholar]
- Lopes, J.C.B.; Dukler, A.E. Droplet entrainment in vertical annular flow and its contribution to momentum transfer. AIChE J. 1986, 32, 1500–1515. [Google Scholar] [CrossRef]
- Rastogi, A.; Fan, Y. Experimental and modeling study of onset of liquid accumulation. J. Nat. Gas Sci. Eng. 2020, 73, 103064. [Google Scholar] [CrossRef]
- Mugele, R.A.; Evans, H.D. Droplet Size Distribution in Sprays. Ind. Eng. Chem. 1951, 43, 1317–1324. [Google Scholar] [CrossRef]
- Kolmogorov, A.N. On the Disintegration of Drops in Turbulent Flow. Dokl. Akad. Nauk. SSSR 1949, 66, 825–828. [Google Scholar]
- Batchelor, G.K. The Theory of Homogeneous Turbulence; Cambridge University Press: Cambridge, UK, 1953. [Google Scholar]
- Shoham, O. Mechanistic Modeling of Gas-Liquid Two-Phase Flow in Pipes; Society of Petroleum Engineers: Houston, TX, USA, 2006. [Google Scholar]
- Tatterson, D.F.; Dallman, J.C.; Hanratty, T.J. Drop sizes in annular gas-liquid flows. AIChE J. 1977, 23, 68–76. [Google Scholar] [CrossRef]
- Pereyra, E.J.; Shoham, O.; Gomez, L.E.; Mohan, R.S. Integration Methodology of Separation Units Using Steady-State Particle Size Approach. In Proceedings of the Twenty-fifth International Ocean and Polar Engineering Conference, Kona, HI, USA, 21–26 June 2015. [Google Scholar]
- Beggs, D.H.; Brill, J.P. A study of two-phase flow in inclined pipes. J. Pet. Technol. 1973, 25, 607–617. [Google Scholar] [CrossRef]
- Azzopardi, B.J.; Teixeira, J.C.F.; Jepson, D.M. Drop sizes and velocities in vertical annular two-phase flow. In Proceedings of the International Conference on Mechanics of Two-Phase Flows, Taipei, Taiwan, 12–15 June 1989; pp. 12–15. [Google Scholar]
- Ambrosini, W.; Andreussi, P.; Azzopardi, B.J. A physically based correlation for drop size in annular flow. Int. J. Multiph. Flow 1991, 17, 497–507. [Google Scholar] [CrossRef]
- Kim, B.H.; Peterson, G.P.; Kihm, K.D. Analytical and Experimental Investigation of Entrainment in Capillary Pumped Wicking Structures. J. Energy Res. Technol. 1993, 115, 278–286. [Google Scholar] [CrossRef]
- Azzopardi, B.J. Gas-Liquid Flows; Begell House: New York, NY, USA, 2006. [Google Scholar]
- Wallis, G.B. One-Dimensional Two-Phase Flow; McGraw-Hill: New York, NY, USA, 1969. [Google Scholar]
Figure 1.
Entrainment hypotheses of roll-wave shearing off (a) and wave undercut (b).
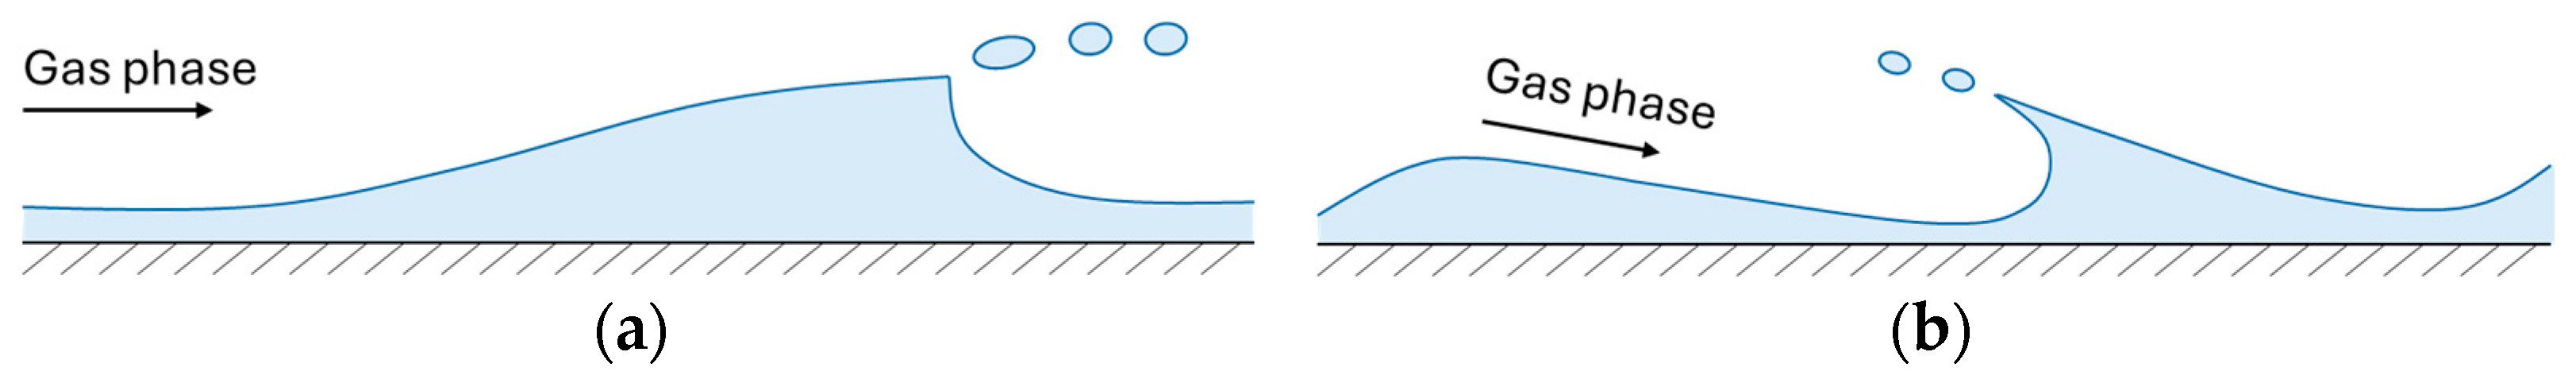
Figure 2.
Effect of liquid viscosity on d32 at the pipe centerline. The dashed line represents the trend of droplet-size variation from a logarithmic function (reproduced based on data from [49]).
Figure 2.
Effect of liquid viscosity on d32 at the pipe centerline. The dashed line represents the trend of droplet-size variation from a logarithmic function (reproduced based on data from [49]).
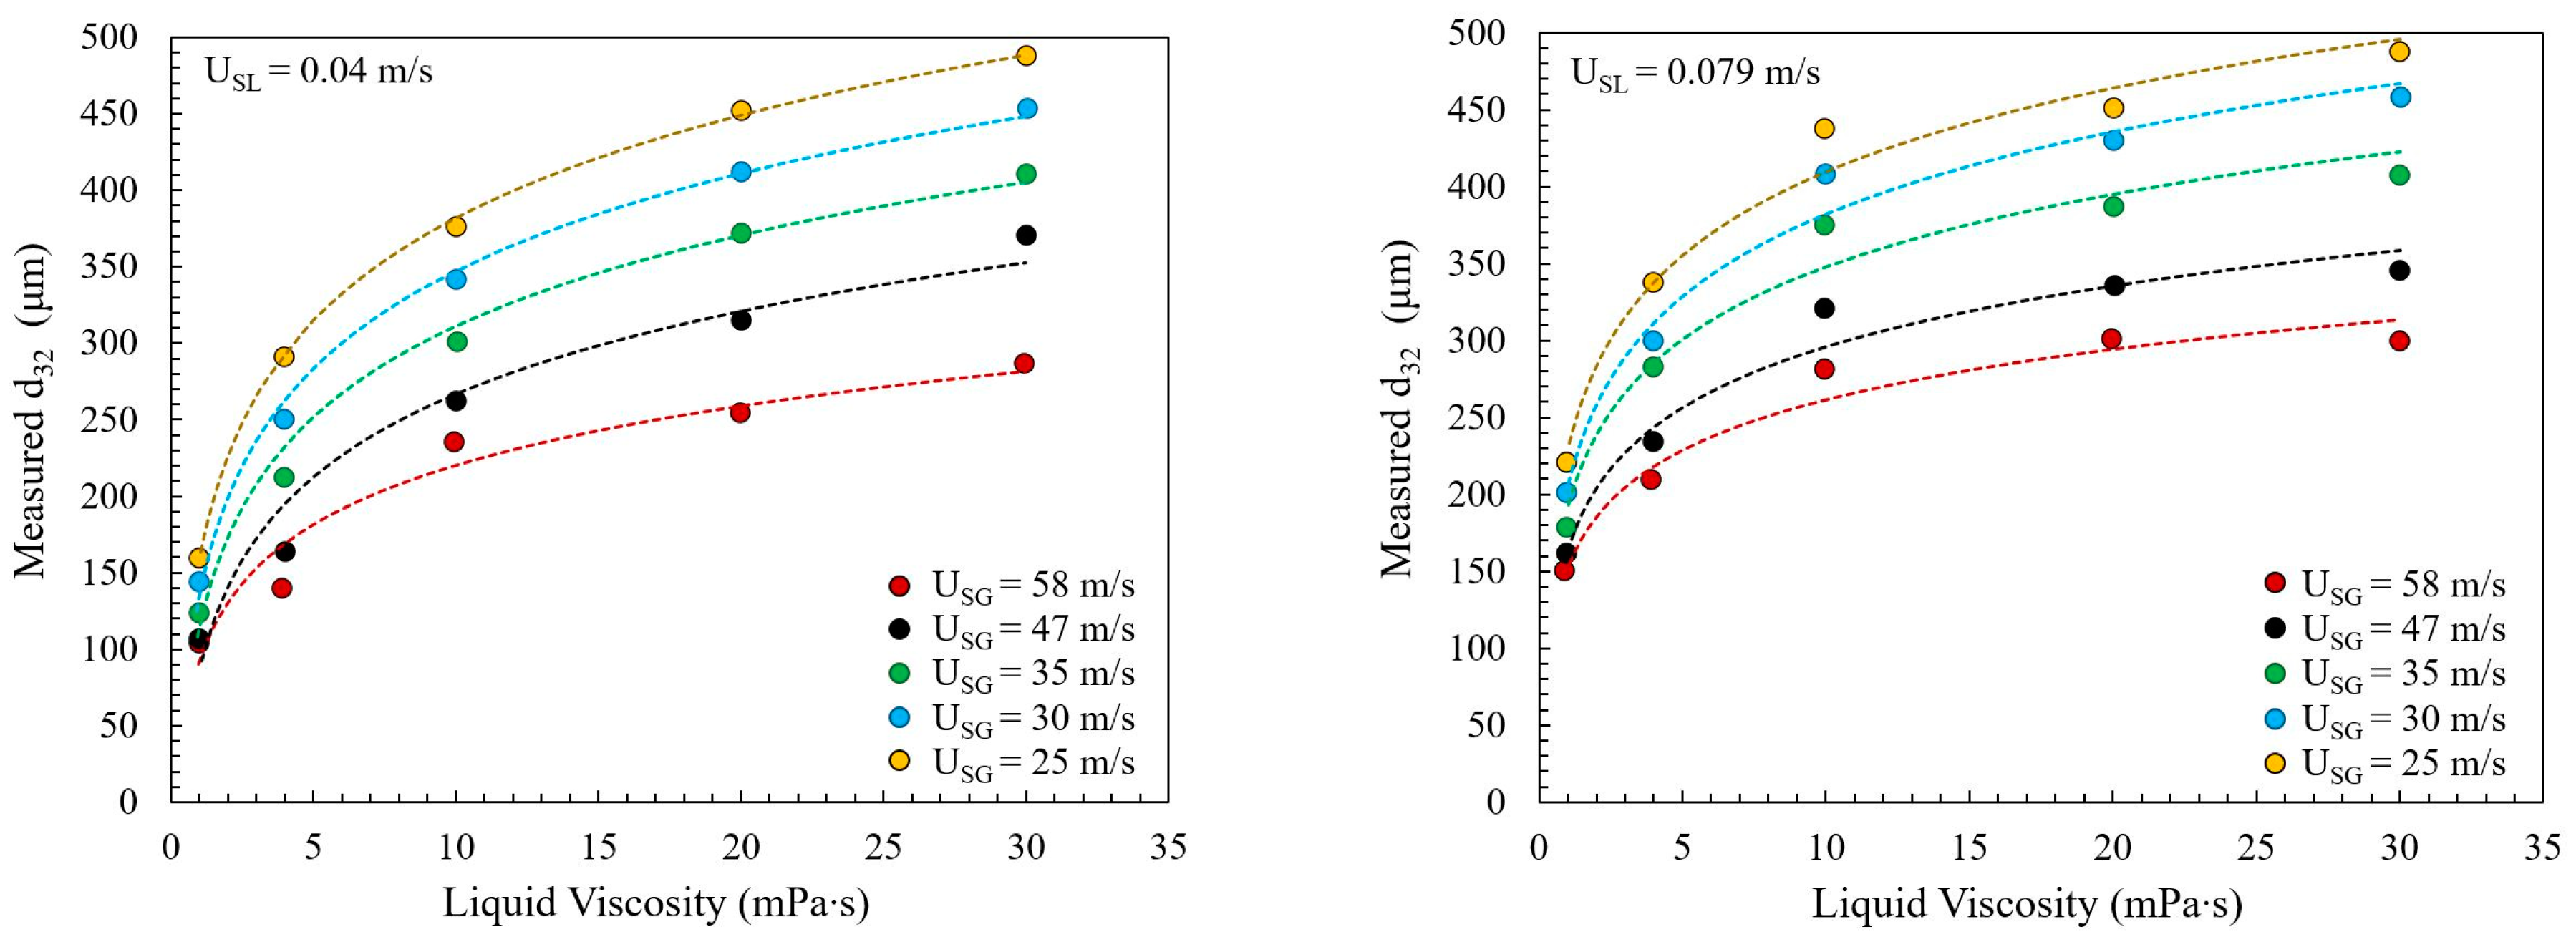
Figure 3.
Variation in d32 with superficial gas velocity at different gas densities (reproduced based on data from [48] in (a) and [50] in (b)).
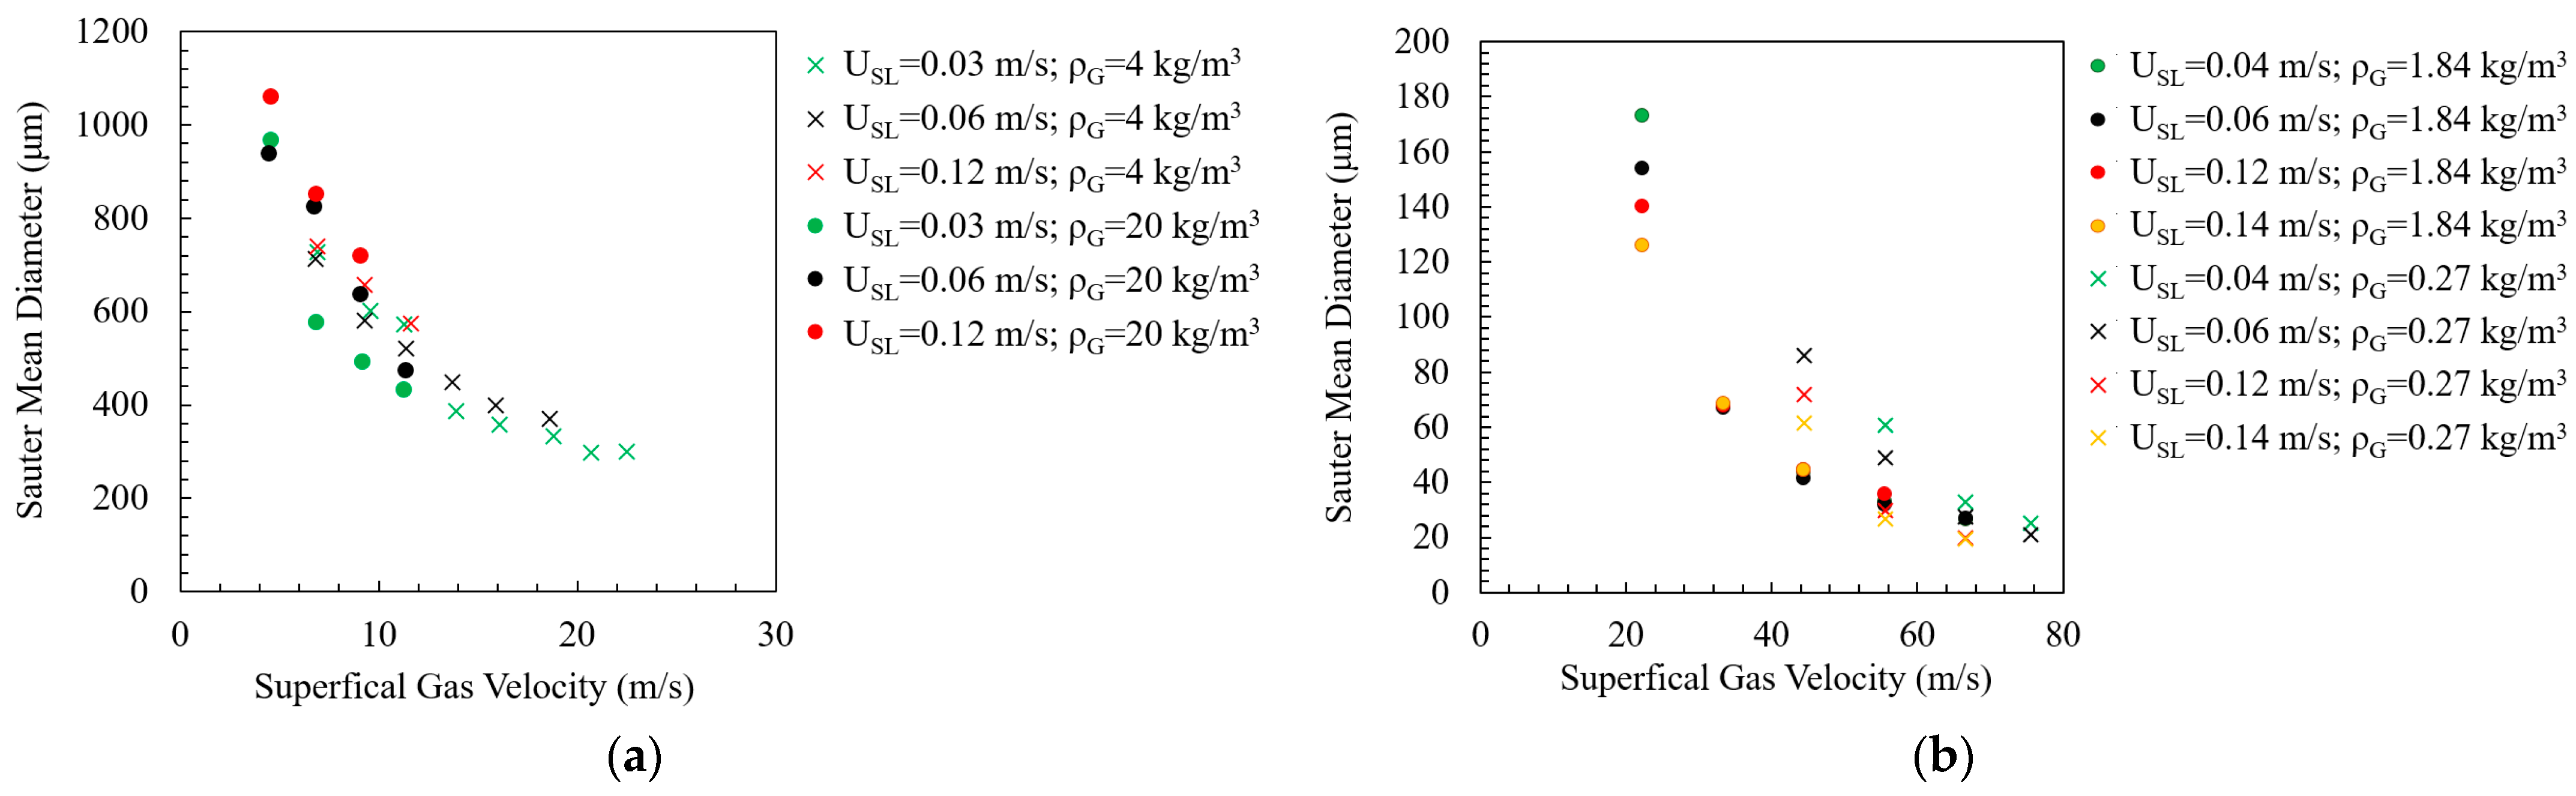
Figure 4.
Surface tension effect on mean droplet diameter (reproduced based on data from [45]).
Figure 4.
Surface tension effect on mean droplet diameter (reproduced based on data from [45]).

Figure 5.
Effect of superficial gas and liquid velocities on droplet-size diameter (reproduced based on data from [6]).
Figure 5.
Effect of superficial gas and liquid velocities on droplet-size diameter (reproduced based on data from [6]).
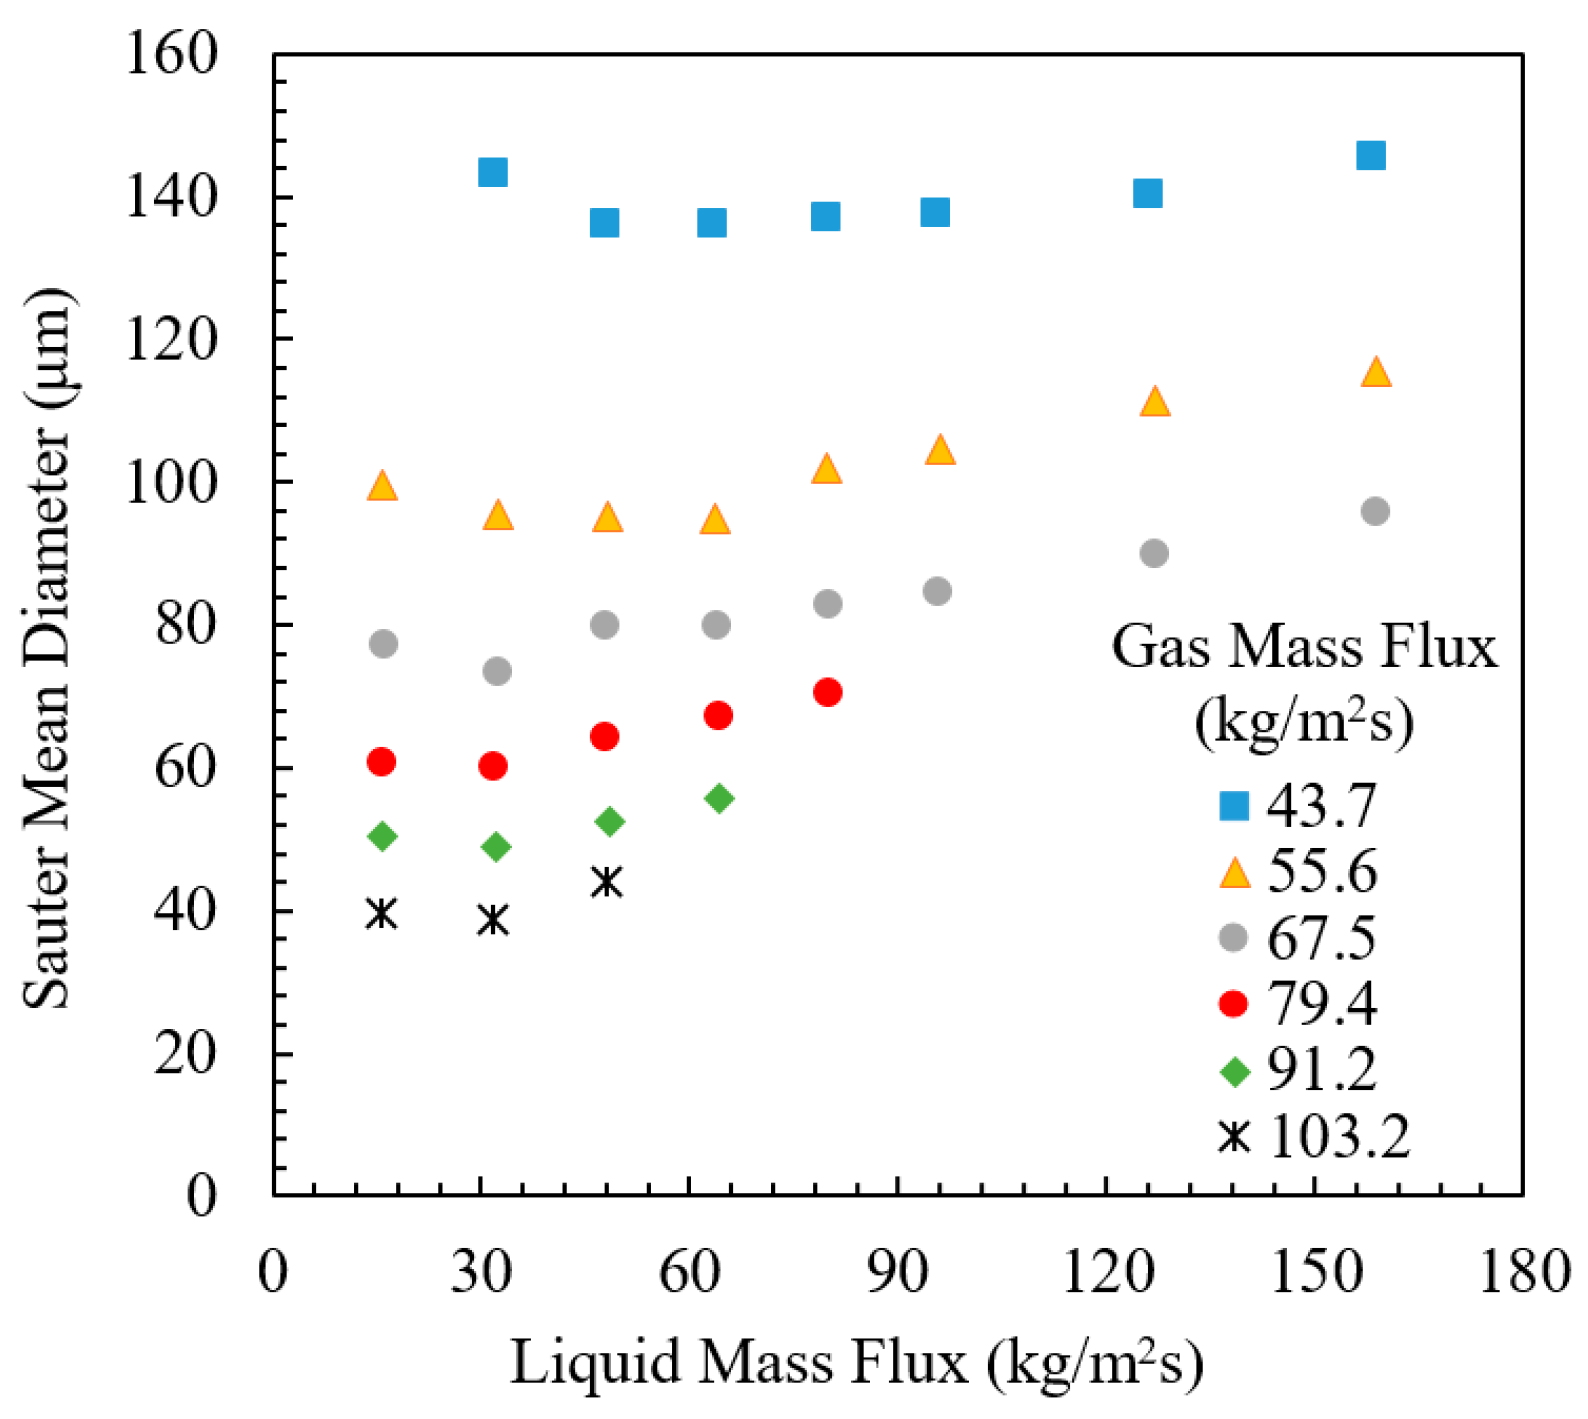
Figure 6.
Effect of pipe internal diameter on droplet-size diameter (reproduced based on data from Simmons and Hanratty, 2001 [59], and Al-Sarkhi and Hanratty, 2002 [58]).

Figure 8.
Model sensitivity for changes in gas and liquid superficial velocities using data from [11]. Previous models are from [14,40,41,46,78].
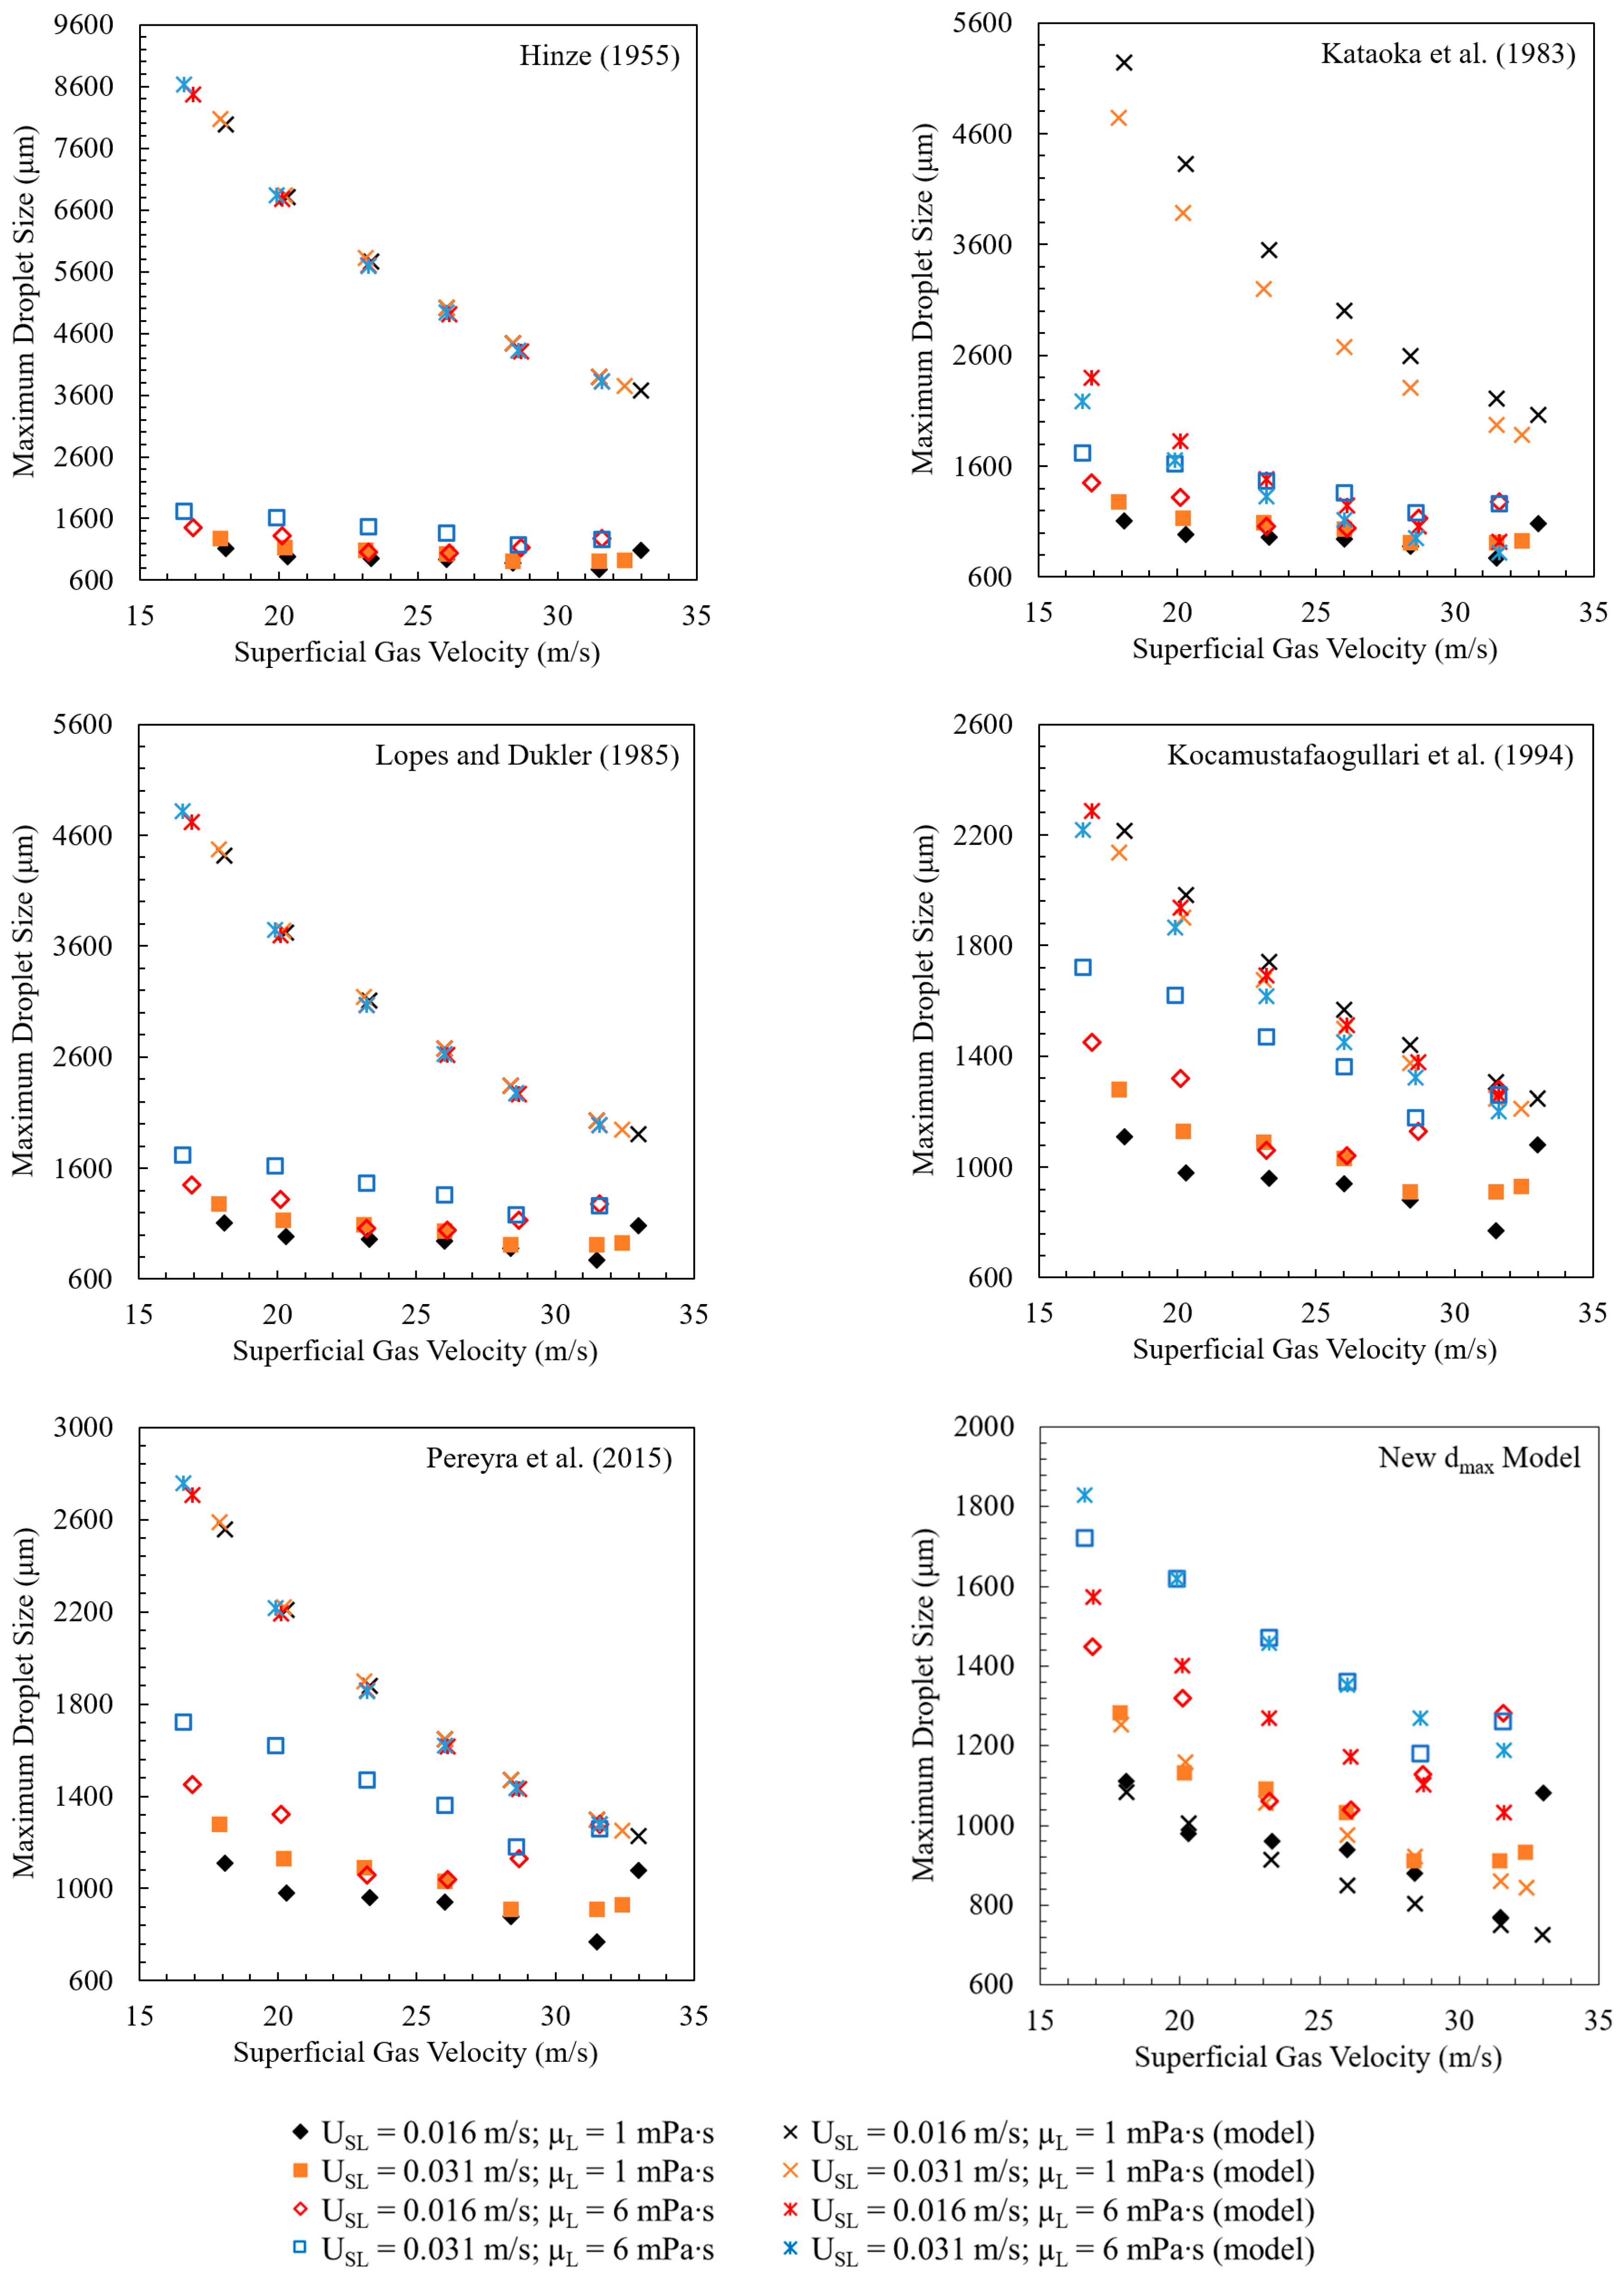
Figure 9.
Comparison of predictive model ([14,40,41,46,78] and the new model) results against experimental data of dmax in gas–liquid annular flow from [11,40,48,55,58,61,64].
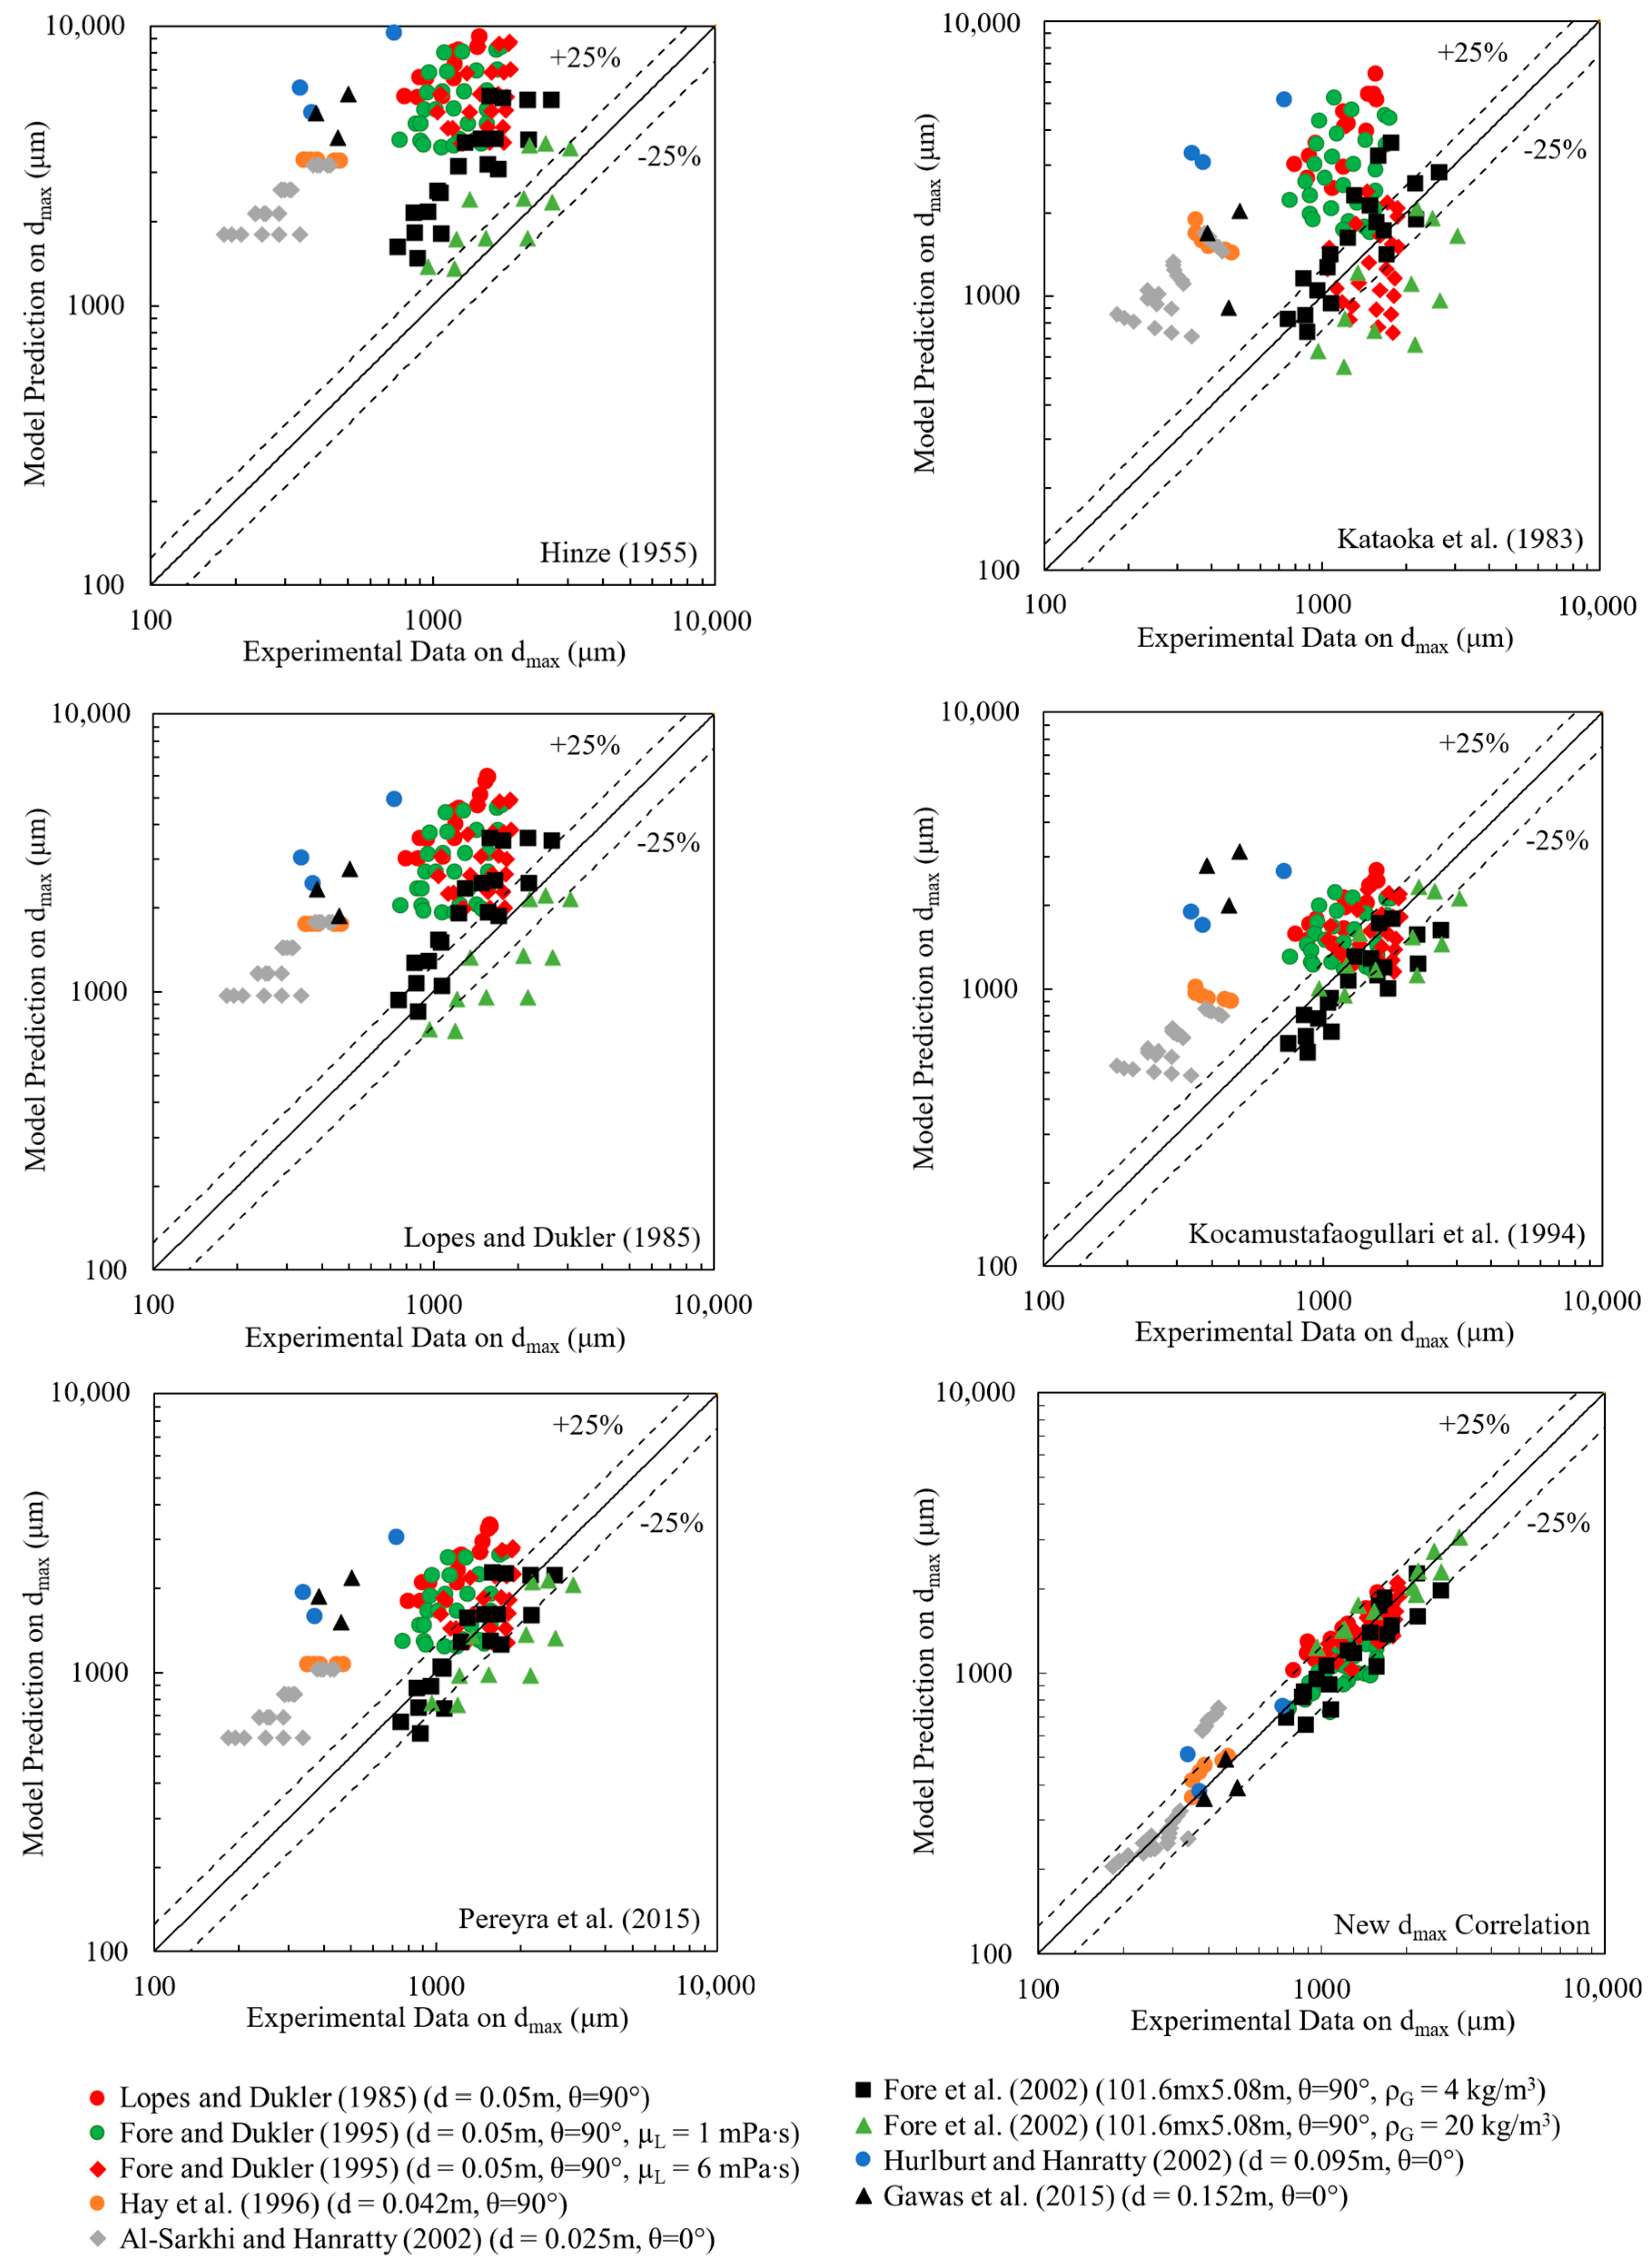
Figure 10.
Comparison of predictive model results against experimental data for SMD in gas–liquid annular flow. Previous models are from [41,48,49,58,80]. The experimental data are from [6,10,11,40,44,48,49,50,55,56,58,59,61,64,65,66].
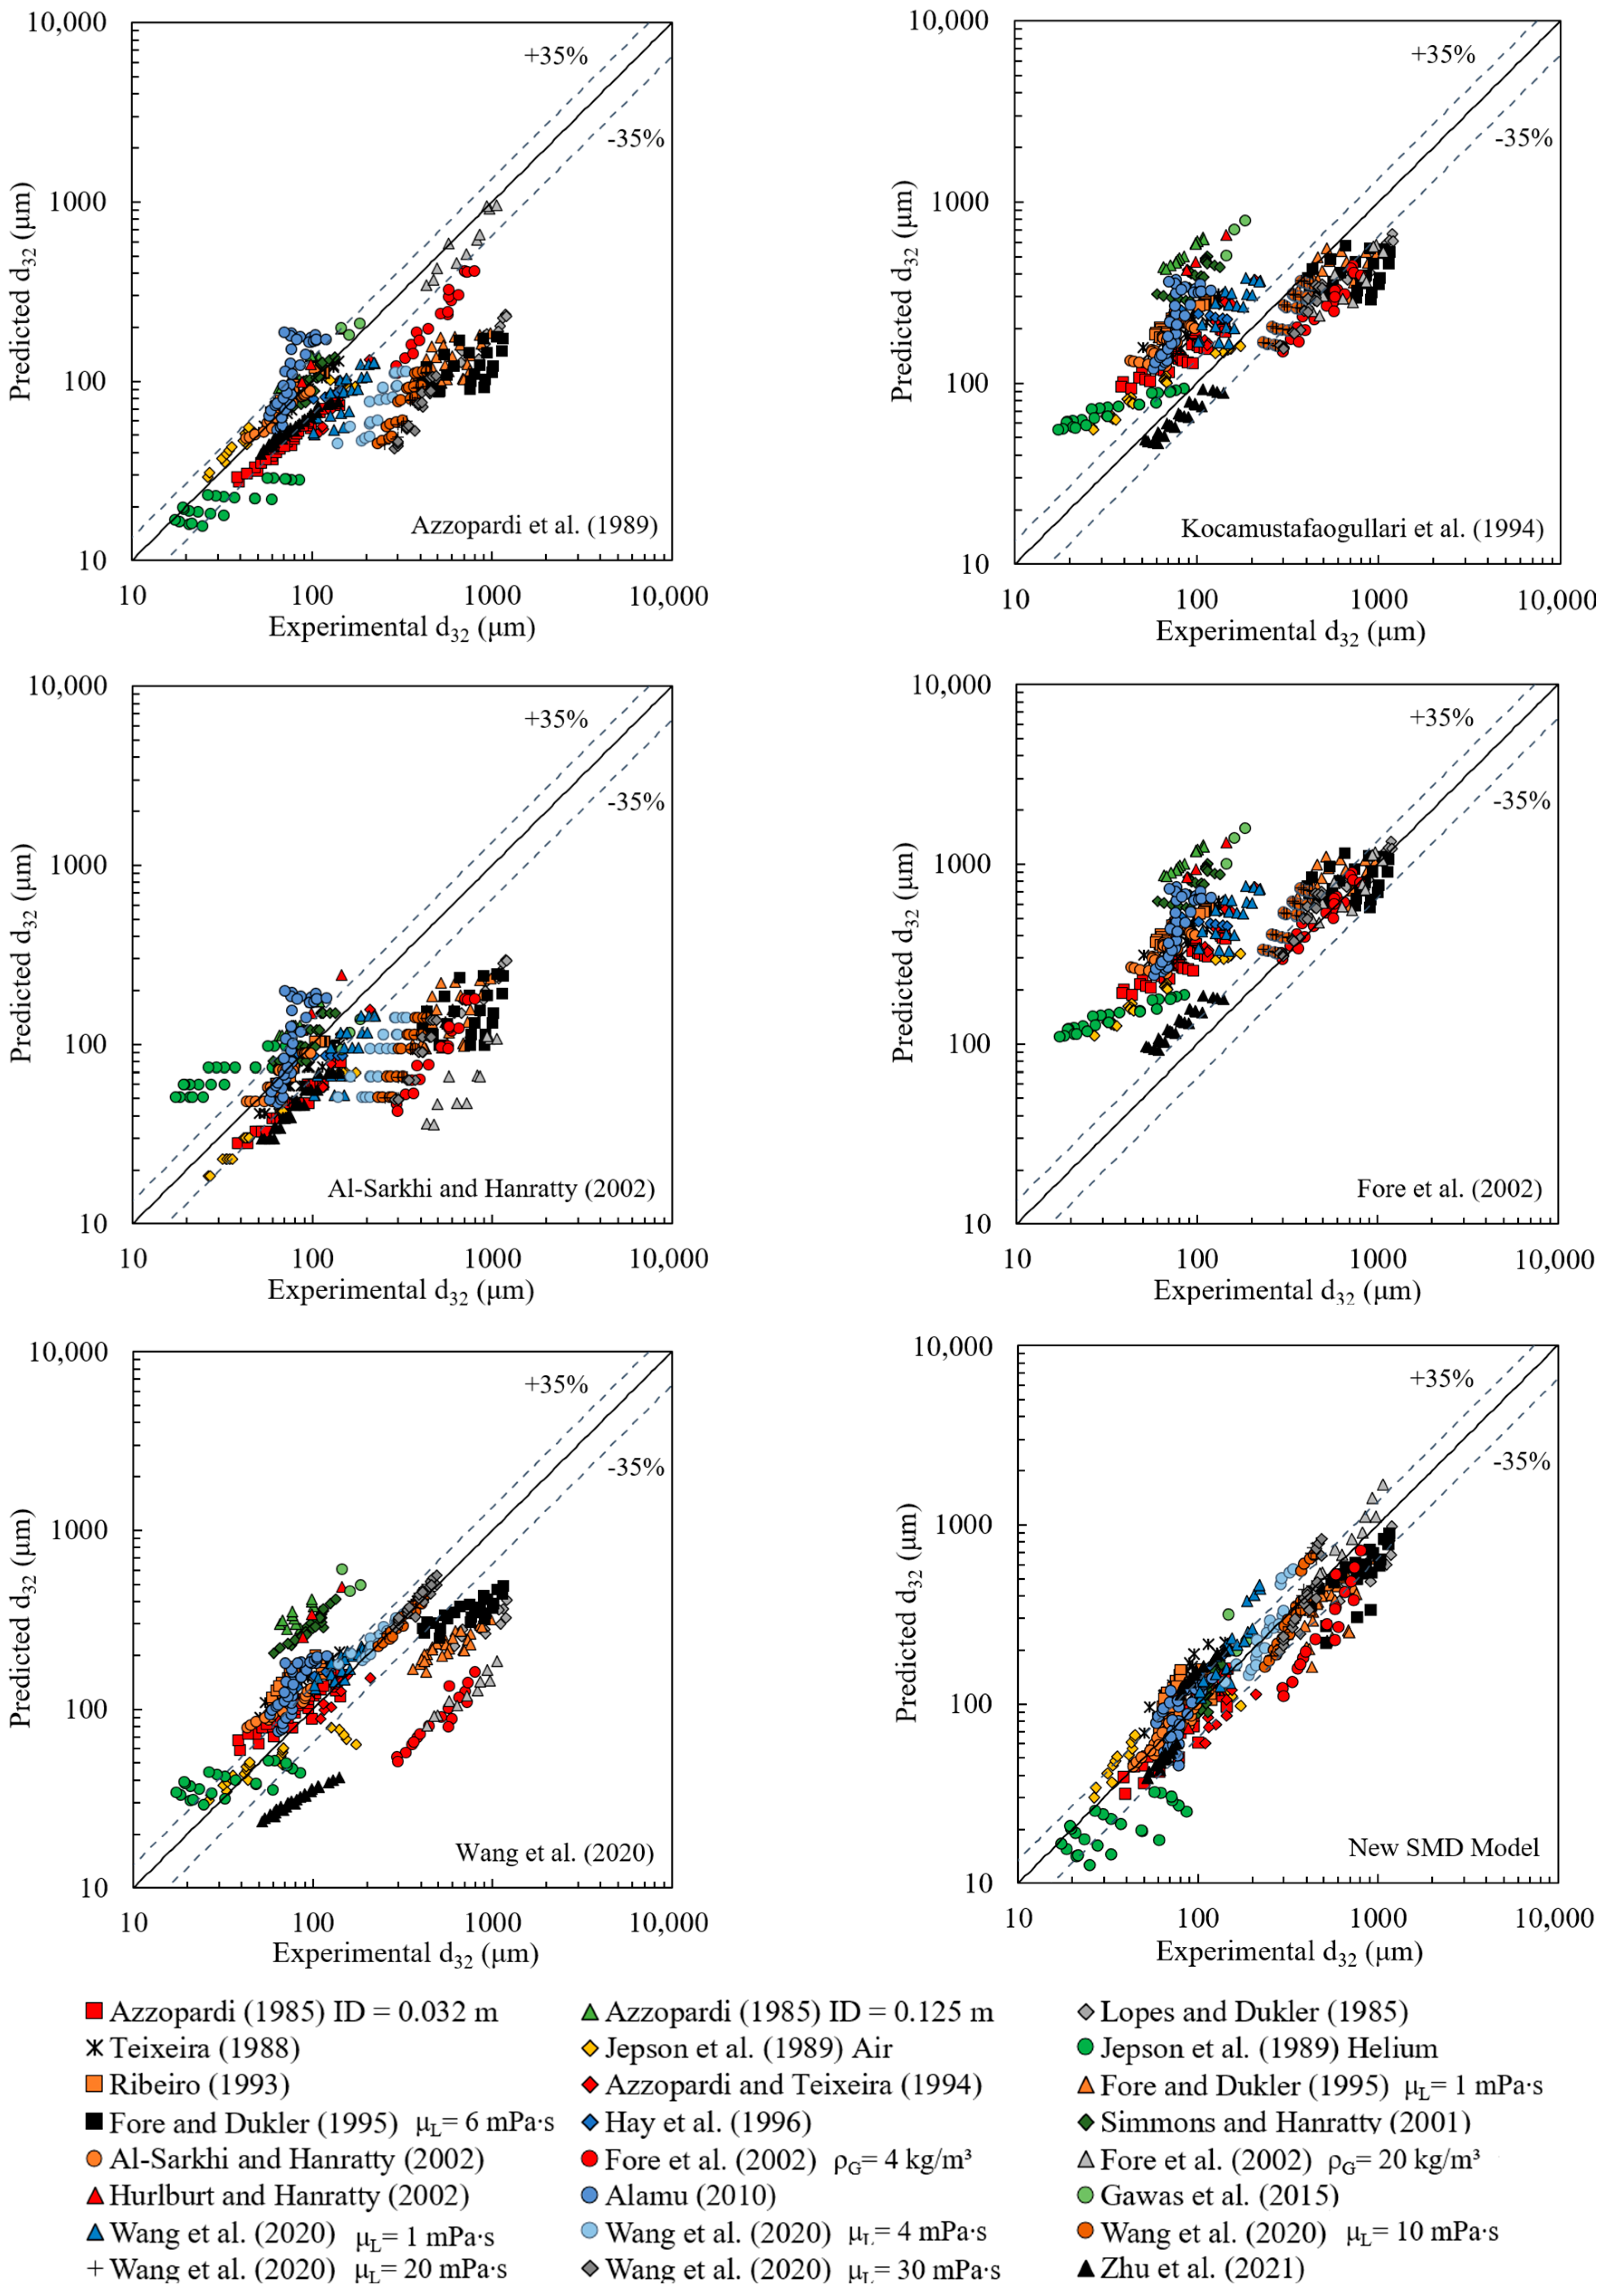
Table 1.
Datasets used to evaluate models and develop a new model for dmax.
| Authors | Fluids and Flow Geometry | Operational Conditions | Measurement Technique | ||
|---|---|---|---|---|---|
| Lopes and Dukler (1985) [40] | Air–water; vertical upflow pipe ID = 0.051 m | 833 | 53 | 1 atm, 20 °C; | Phase Doppler Anemometry |
| Fore and Dukler (1995a) [11] | Air–water; vertical upflow pipe ID = 0.051 m | 760 | 53 | 1 atm, 20 °C; | Laser Grating |
| Fore and Dukler (1995a) [11] | Air–water/glycerin Vertical upflow pipe ID = 0.051 m | 870 | 303 | 1 atm, 20 °C; | Laser Grating |
| Hay et al. (1996) [64] | Air–water; vertical upflow pipe ID = 0.042 m | 816 | 45 | 1 atm, 20 °C; | Direct In Situ Photography |
| Al-Sarkhi and Hanratty (2002) [58] | Air–water; horizontal flow pipe ID = 0.025 m | 816 | 45 | 1 atm, 20 °C; | Laser Diffraction |
| Fore et al. (2002) [48] | Nitrogen–water; vertical upflow 101.6 × 5.08 mm rectangular duct | 250 | 37 | 3.4 atm, 38 °C; | Video Images |
| Fore et al. (2002) [48] | Nitrogen–water; vertical upflow 101.6 × 5.08 mm rectangular duct | 50 | 37 | 17 atm, 38 °C; | Video Images |
| Hurlburt and Hanratty (2002) [61] | Air–water; horizontal flow pipe ID = 0.095 m | 816 | 45 | 1 atm, 20 °C; | Immersion Method |
| Gawas et al. (2015) [55] | Air–mineral oil; horizontal flow pipe ID = 0.152 m | 360 | 78 | 1 atm, 20 °C; | Backlit High-Speed Visualization |
Table 2.
Datasets used to evaluate models and develop a new model for d32.
| Authors | Fluids and Flow Geometry | Operational Conditions | Measurement Technique | ||
|---|---|---|---|---|---|
| Azzopardi (1985) [6] | Air–water, vertical upward ID = 0.032 m | 816 | 50 | 1 atm; 20 °C; ReSL = 500–5000 ReSG = 69,500–164,000 | Laser Diffraction |
| Azzopardi (1985) [6] | Air–water, vertical upward ID = 0.125 m | 816 | 50 | 1 atm; 20 °C; ReSL = 1000–3200 ReSG = 224,000–320,600 | Laser Diffraction |
| Lopes and Dukler (1985) [40] | Air–water, vertical upward ID = 0.051 m | 833 | 53 | 1 atm, 20 °C ReSL = 1600–5800 ReSG = 42,600–75,200 | Phase Doppler Anemometry |
| Teixeira (1988) [10] | Air–water, vertical upward ID = 0.032 m | 555 | 64 | 1.5 atm, 15 °C ReSL = 450–3500 ReSG = 78,250–163,300 | Laser Diffraction and Phase Doppler Anemometry |
| Jepson et al. (1989) [50] | Air–water, vertical upward ID = 0.010 m | 544 | 53 | 1.5 atm, 20 °C ReSL = 400–1400 ReSG = 20,900–62,800 | Laser Diffraction |
| Jepson et al. (1989) [50] | Helium–water, vertical upward ID = 0.010 m | 3733 | 56 | 1.5 atm, 20 °C ReSL = 400–1400 ReSG = 6500–11,100 | Laser Diffraction |
| Ribeiro (1993) [56] | Air–water, horizontal ID = 0.032 m | 591–640 | 64 | 1 atm, 20 °C ReSL = 500–3000 ReSG = 71,500–125,100 | Laser Diffraction |
| Azzopardi and Teixeira (1994) [44] | Air–water, vertical upward ID = 0.032 m | 833 | 53 | 1 atm, 20 °C ReSL = 500–1400 ReSG = 39,200–89,000 | Laser Diffraction |
| Fore and Dukler (1995a) [11] | Air–water, vertical upward ID = 0.051 m | 694–847 | 53 | 1 atm, 20 °C ReSL = 750–3000 ReSG = 51,800–120,700 | Laser Grating |
| Fore and Dukler (1995a) [11] | Air–water/glycerin vertical upward; ID = 0.051 m | 794–956 | 303 | 1 atm, 20 °C ReSL = 140–560 ReSG = 48,800–114,000 | Laser Grating |
| Hay et al. (1996) [64] | Air–water, vertical upward ID = 0.042 m | 816 | 45 | 1 atm, 20 °C ReSL = 1000–5700 ReSG = 92,600 | Direct In Situ Photography |
| Simmons and Hanratty (2001) [59] | Air–water, horizontal ID = 0.095 m | 816 | 45 | 1 atm, 20 °C ReSL = 1700–13,000 ReSG = 175,000–292,000 | Laser Diffraction |
| Al-Sarkhi and Hanratty (2002) [58] | Air–water, horizontal ID = 0.025 m | 816 | 45 | 1 atm, 20 °C ReSL = 1100–3500 ReSG = 46,700–77,800 | Laser Diffraction |
| Fore et al. (2002) [48] | Nitrogen–water; vertical upward 101.6 × 5.08 mm rectangular duct | 250 | 37 | 3.4 atm, 38 °C ReSL = 300–2600 ReSG = 10,800–35,700 | Photographic |
| Fore et al. (2002) [48] | Nitrogen–water, vertical upflow 101.6 × 5.08 mm rectangular duct | 50 | 37 | 17 atm, 38 °C ReSL = 300–1300 ReSG = 35,700–90,500 | Photographic |
| Hurlburt and Hanratty (2002) [61] | Air–water, horizontal ID = 0.095 m | 816 | 45 | 1 atm, 20 °C ReSL = 1600–7400 ReSG = 117,000–210,000 | Oil Immersion |
| Alamu (2010) [65] | Air–water, vertical upward ID = 0.019 m | 714 | 56 | 1.4 atm, 20 °C ReSL = 950–3700 ReSG = 19,400–63,400 | Light Scattering |
| Gawas et al. (2015) [55] | Air–mineral oil, horizontal ID = 0.152 m | 360 | 78 | 1 atm, 20 °C ReSL = 800–8200 ReSG = 296,000–408,000 | Backlit High-Speed Visualization |
| Wang et al. (2020) [49] | Air–water, vertical upward ID = 0.050 m | 816–955 | 50–1500 | 1 atm, 20 °C ReSL = 100–4000 ReSG = 76,500–177,600 | Particle Dynamic Analyzer |
| Zhu et al. (2021) [66] | Air–water, vertical upward 70 × 2 mm narrow rectangular channel | 816 | 50 | 1 atm, 20 °C ReSL = 580–1170 ReSG = 4760–9530 | Laser Diffraction |
Table 3.
AAREs of different model predictions for dmax.
| Models | Hinze (1955) [14] | Kataoka et al. (1983) [46] | Lopes and Dukler (1985) [40] | Kocamustafaogullari et al. (1994) [41] | Pereyra et al. (2015) [78] | New Model |
|---|---|---|---|---|---|---|
| AARE (%) | 417 | 154 | 185 | 71 | 84 | 14.8 |
Table 4.
Available correlations for the SMD predictions in gas–liquid annular flow.
| Models | Correlations |
|---|---|
| Azzopardi et al. (1980) [62] | |
| Kataoka et al. (1983) [46] | |
| Azzopardi (1985) [6] | |
| Gibbons (1985) [47] | |
| Lopes and Dukler (1985) [40] | |
| Azzopardi et al. (1989) [80] | |
| Ambrosini et al. (1991) [81] | |
| Kim et al. (1993) [82] | |
| Kocamustafaogullari et al. (1994) [41] | |
| Simmons and Hanratty (2001) [59] | |
| Al-Sarkhi and Hanratty (2002) [58] | |
| Fore et al. (2002) [48] | |
| Pan and Hanratty (2002b) [51] | |
| Azzopardi (2006) [83] | |
| Caraghiaur and Anglart (2013) [13] | |
| Wang et al. (2020) [49] | |
| Zhu et al. (2021) [66] |
Table 5.
AAREs of different model predictions for d32.
| Models | AARE (%) | Models | AARE (%) |
|---|---|---|---|
| Azzopardi et al. (1980) [62] | 49 | Simmons and Hanratty (2001) [59] | 63 |
| Kataoka et al. (1983) [46] | 228 | Al-Sarkhi and Hanratty (2002) [58] | 53 |
| Azzopardi (1985) [6] | 49 | Fore et al. (2002) [48] | 259 |
| Gibbons (1985) [47] | 55 | Pan and Hanratty (2002b) [51] | 59 |
| Lopes and Dukler (1985) [40] | 214 | Azzopardi (2006) [83] | 116 |
| Azzopardi et al. (1989) [80] | 44 | Caraghiaur and Anglart (2013) [13] | 67 |
| Ambrosini et al. (1991) [81] | 120 | Wang et al. (2020) [49] | 62 |
| Kim et al. (1993) [82] | 293 | Zhu et al. (2021) [66] | 67 |
| Kocamustafaogullari et al. (1994) [41] | 107 | New Model | 29 |
Disclaimer/Publisher’s Note: The statements, opinions and data contained in all publications are solely those of the individual author(s) and contributor(s) and not of MDPI and/or the editor(s). MDPI and/or the editor(s) disclaim responsibility for any injury to people or property resulting from any ideas, methods, instructions or products referred to in the content. |
© 2024 by the authors. Licensee MDPI, Basel, Switzerland. This article is an open access article distributed under the terms and conditions of the Creative Commons Attribution (CC BY) license (https://creativecommons.org/licenses/by/4.0/).
Share and Cite
MDPI and ACS Style
Karatayev, K.; Fan, Y. Modeling Liquid Droplet Sizes in Gas–Liquid Annular Flow. Energies 2024, 17, 3094. https://doi.org/10.3390/en17133094
AMA Style
Karatayev K, Fan Y. Modeling Liquid Droplet Sizes in Gas–Liquid Annular Flow. Energies. 2024; 17(13):3094. https://doi.org/10.3390/en17133094
Chicago/Turabian StyleKaratayev, Kanat, and Yilin Fan. 2024. "Modeling Liquid Droplet Sizes in Gas–Liquid Annular Flow" Energies 17, no. 13: 3094. https://doi.org/10.3390/en17133094
Note that from the first issue of 2016, this journal uses article numbers instead of page numbers. See further details here.