Article

A SWOT Analysis of the Green Hydrogen Market

by
Francisco L. D. Simões
1 and
Diogo M. F. Santos
2,*
1
Department of Mechanical Engineering, Instituto Superior Técnico, Universidade de Lisboa, 1049-001 Lisbon, Portugal
2
Center of Physics and Engineering of Advanced Materials, Laboratory for Physics of Materials and Emerging Technologies, Chemical Engineering Department, Instituto Superior Técnico, Universidade de Lisboa, 1049-001 Lisbon, Portugal
*
Author to whom correspondence should be addressed.
Energies 2024, 17(13), 3114; https://doi.org/10.3390/en17133114
Submission received: 14 May 2024 / Revised: 16 June 2024 / Accepted: 19 June 2024 / Published: 24 June 2024

Abstract

:
Since the Industrial Revolution, humanity has heavily depended on fossil fuels. Recognizing the negative environmental impacts of the unmoderated consumption of fossil fuels, including global warming and consequent climate change, new plans and initiatives have been established to implement renewable and sustainable energy sources worldwide. This has led to a rapid increase in the installed solar and wind energy capacity. However, considering the fluctuating nature of these renewable energy sources, green hydrogen has been proposed as a suitable energy carrier to improve the efficiency of energy production and storage. Thus, green hydrogen, produced by water electrolysis using renewable electricity, is a promising solution for the future energy market. Moreover, it has the potential to be used for the decarbonization of the heavy industry and transportation sectors. Research and development (R&D) on green hydrogen has grown considerably over the past few decades, aiming to maximize production and expand its market share. The present work uses a SWOT (strengths, weaknesses, opportunities, and threats) analysis to evaluate the current status of the green hydrogen market. The external and internal factors that affect its market position are assessed. The results show that green hydrogen is on the right track to becoming a competitive alternative to fossil fuels soon. Supported by environmental benefits, government incentives, and carbon taxes, roadmaps to position green hydrogen on the energy map have been outlined. Nevertheless, increased investments are required for further R&D, as costs must be reduced and policies enforced. These measures will gradually decrease global dependency on fossil fuels and ensure that roadmaps are followed through.

1. Introduction

The awareness of the effects of climate change caused by the current energy mix has initiated a transition towards a carbon-free energy system. The depletion of fossil fuel reserves and the steady rise in global energy consumption (Figure 1) due to population growth, technological advances, and economic development have intensified the urgency to attain a cleaner energy standard. Hydrogen (H2) is an attractive energy carrier, with the highest gravimetric energy density and a simple molecular structure. Despite the low volumetric energy density of H2, which complicates storage and distribution, its environmental benefits are immense. H2 combustion does not produce carbon dioxide (CO2) or other greenhouse gases, setting it apart from conventional fossil fuels. This feature makes H2 use a promising pathway for reducing carbon emissions and achieving carbon neutrality in the energy and power sectors [1]. Additionally, H2 is abundant in water and hydrocarbons and can be produced from these sources. To simplify, colors have been adopted to indicate the source and production method of H2. The currently used colors are black, brown, grey, blue, turquoise, yellow, pink, green, and white [2]. The most relevant colors, at least for the context of this study, are grey, produced from fossil fuels; blue, produced from fossil fuels while using carbon capture and storage; and green, generated from water electrolysis using renewable energy sources (RES), typically solar and wind power.
The current production of green H2 is nearly negligible compared to fossil fuel-based methods. According to the International Energy Agency’s (IEA) global energy review, the total global production in 2021 was 94 million tons (Mt) of H2. Natural gas accounted for 62%, coal for 19%, and naphtha reforming at refineries for 18%. The associated emissions of CO2 were more than 900 Mt. Low-carbon H2 production was less than 1 Mt, with blue H2 accounting for 0.7% of total H2 production and only 0.04% (35 kt H2) for green H2 [3].
Using fossil fuels for H2 production has already maximized its development with well-established distribution networks, infrastructures, and technologies. On the contrary, green H2 faces high production costs, low technology performance, a lack of infrastructure, and few policies and standards for its commercialization.
Even so, green H2 has become the current preferred approach, capable, if applied correctly, of halting the drastic climate changes caused by humankind’s global dependence on fossil fuels. Being less mature than other colors, green H2 has more room for opportunities and innovation. The current 0.04% share in H2 production already represents a 20% increase compared to 2020. Clearly, green H2 is a promising energy carrier that has been gaining momentum in recent years. The development of different H2 storage and transportation methods has enabled the start of many projects for its distribution. It has created new opportunities for its application in the transportation, industrial, maritime, building, and heating sectors.
The definition of green H2 and the processes it includes slightly vary from author to author. Green H2 is currently defined as H2 produced from water electrolysis using RES. Some have a wider perspective, where green H2 can be produced by water splitting through electrolysis, photolysis, and thermolysis [4], as well as from biomass through biological processes and even from thermochemical processes (e.g., reforming, gasification, pyrolysis) [5,6], as the CO2 released is equivalent to that absorbed during the biomass lifecycle, making the process carbon neutral. Hassan et al. [7] and Ajanovic et al. [8] clarify that only hydrogen from water splitting through electrolysis powered by RES is currently considered green. Accordingly, this report focuses on water electrolysis as the process for producing green H2 powered by RES, such as solar and wind, as these are the most abundant and better-positioned RES for coupling with electrolyzers.
Water electrolysis involves splitting water molecules into H2 and oxygen (O2) when a certain voltage is applied. The electrolysis cell contains two electrodes (anode and cathode) immersed in an electrolyte. When the required voltage is applied, two partial reactions take place at the electrodes’ surface. The electrolyte conducts the ions produced in said reactions from one electrode to the other, and H2 and O2 are formed at the cathode and anode. Again, H2 will only be considered green if the required electricity is produced from RES. Renewable electricity includes solar, wind, hydro, and geothermal energy production. Although some authors consider nuclear-powered electrolysis a green H2 production method [9,10], the H2 produced by nuclear power is generally known as pink H2. Renewable electricity production has significantly increased in recent decades due to its environmentally friendly nature. The only emissions associated with renewable energy are those from the extraction of materials and in the manufacturing stage. Many countries have deeply invested in this energy, reducing dependency on fossil fuels and paving the way for a green H2 transition. Still, green H2 is struggling to compete with gray and blue H2 costs. To become an attractive option for companies and investors, more R&D is required to decrease its levelized cost, as well as significant incentives from governments and private companies. With strict policies and carbon taxes, fossil fuels will eventually start to phase out, boosting the cost-competitiveness of green H2. IRENA expects that the use of green H2 will be around 2% by 2030 and 7% by 2050, compared to the negligible values of today [11]. Given the current pressure on climate change and environmental issues, all these factors are bound to happen, undoubtedly leading to a greener H2 future. Therefore, this work aims to contextualize green H2 in today’s energy market through a SWOT analysis. It highlights the considerable distance green H2 has already covered and is yet to cover before it can effectively compete with more established methods in the H2 production landscape. The primary focus is on water electrolysis powered by solar and wind electricity, as this is the most promising method and features more case studies. A review on a global scale is performed, not considering any geographical, technological, or financial conditions of a particular region. One of the unique contributions of this study is its attempt to synthesize a uniform perspective on green H2 market development despite the inherent variability in regulations, policies, and development phases across different nations. The approach taken to achieve this involved presenting case studies from multiple regions and considering their conclusions when assessing the arguments. The practical implications of these findings are significant for policymakers, industry stakeholders, and researchers, as they provide valuable insights into the strategic development and deployment of green H2 technologies on a global scale.
Currently, no general SWOT analysis of the green H2 market has been published. Rahimirad et al. [12] performed a SWOT analysis on green H2 technology development and its role in energy policymaking in Iran, and Khan et al. [13] did it for the H2 economy for sustainable development in Gulf Cooperation Council (GCC) countries. These analyses narrowed their studies to specific regions, considering their internal and external factors. The former study focused on the importance of policies and considered the growth of hydrogen through public acceptance as the next priority [12]. The latter encompassed H2 colors other than green and concluded that the growth of the hydrogen economy will largely depend on external factors beyond the control of the GCC countries [13]. There have also been SWOT analyses of H2 focused solely on China [14,15,16]. Ren et al. [14] performed a SWOT analysis coupled with a multi-criteria decision-making method. Of the nine strategies proposed, the “establishing hydrogen development prior strategy” was determined to be the most effective. Li et al. [15] used road mapping techniques to gather and analyze expert opinions on China’s hydrogen and fuel cell development through two rounds of surveys. The first survey’s results, organized in a SWOT framework, were refined in the second round to reach a consensus on development timelines and policy priorities. This study marked the first systematic road mapping effort for green H2 in China, indicating it will not be cost-competitive within the next three years, i.e., until 2027. One of the methodology steps of most of these SWOT analyses involves gathering the opinion of experts, stakeholders, and researchers in the intended field through surveys and/or questionnaires, explaining why they focus on specific countries or regions. The methodology adopted for this study is devoid of third-party opinions, thus allowing for a more holistic understanding of the matter. Out of the scope of a SWOT analysis, Squadrito et al. [17] and Zhou et al. [18] reviewed recent literature to describe the current status of green H2 production technologies, highlighting their advantages and bottlenecks.
The present study starts by referring to the methods utilized to collect the data, followed by some background on green H2. The results section presents the SWOT matrix and an in-depth explanation of each item in the matrix. The work finishes by highlighting the main conclusions and perspectives on the green H2 market.

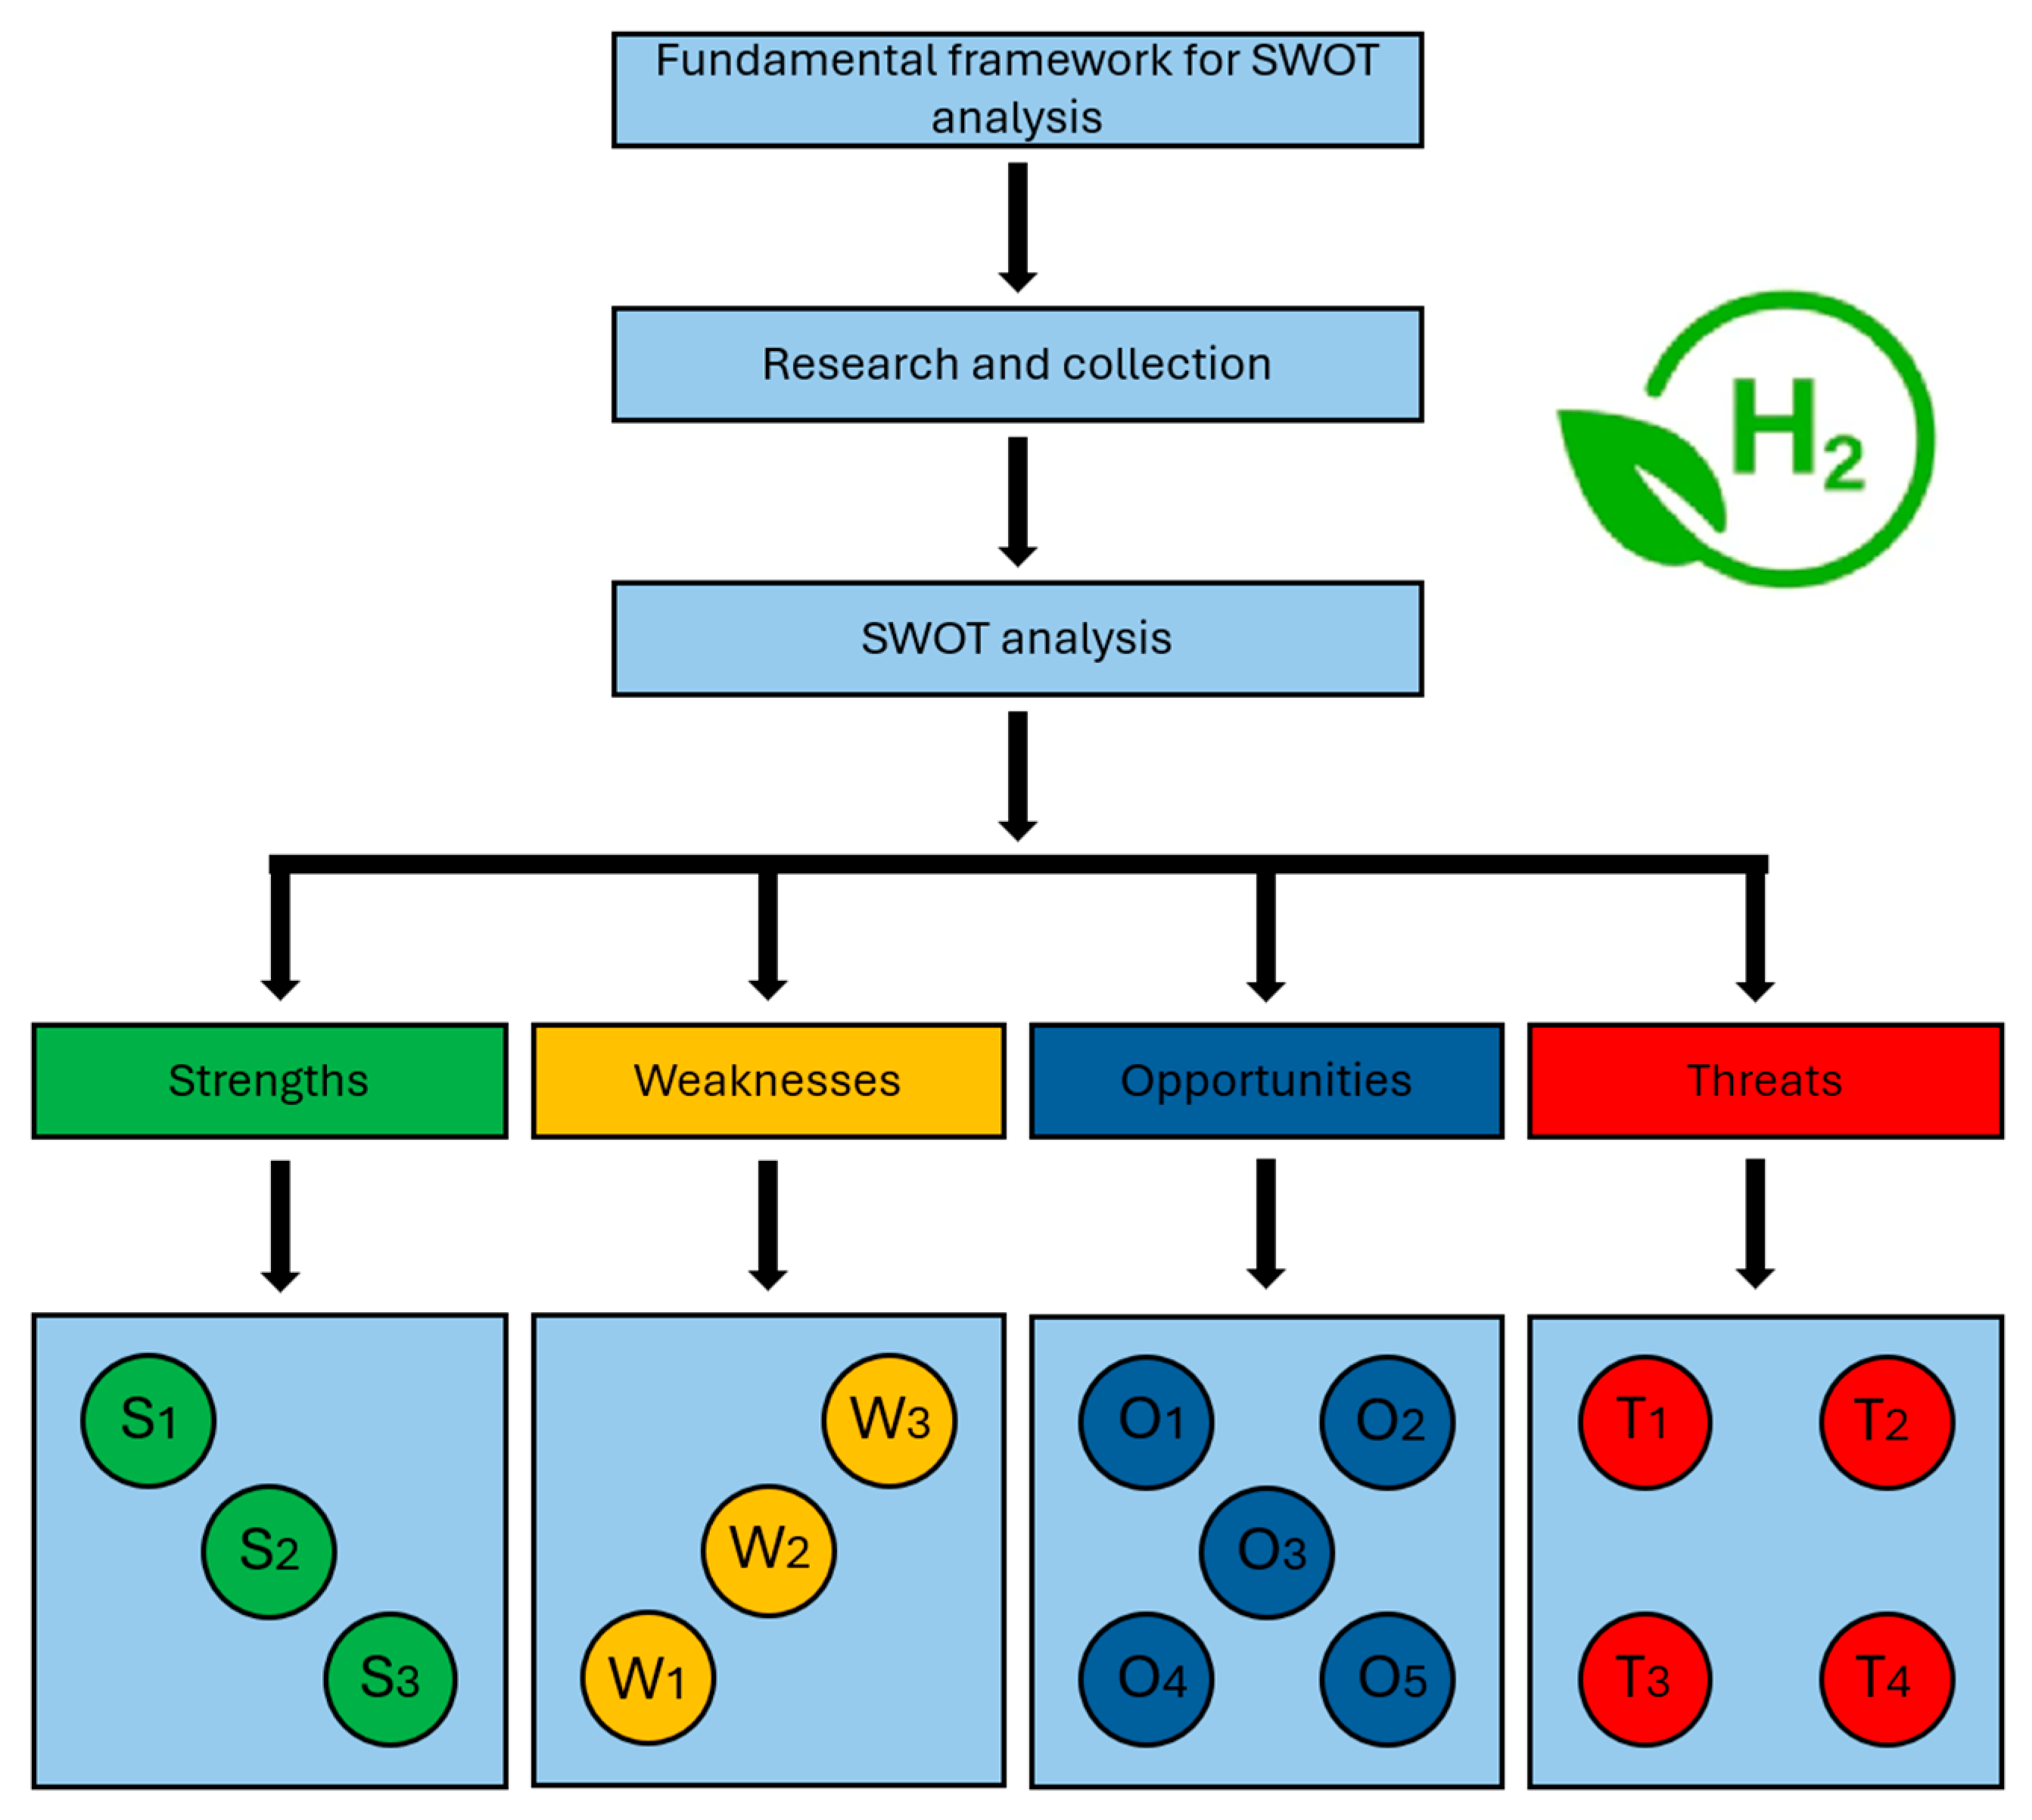
2. Materials and Methods

The adopted strategy to evaluate the current state of the green hydrogen (H2) market is a SWOT analysis. As a tool, it can be used to identify the external threats and opportunities of a system, as well as the internal strengths and weaknesses. To obtain data for the analysis, an initial search was performed via the “Scopus” search engine (SciVerse Scopus, Elsevier, Amsterdam, The Netherlands) using the keywords “green hydrogen”, “benefits”, “challenges”, “electrolyzers”, “production costs”, “developments”, and “emissions” to address the fundamentals for the SWOT matrix. Following that, exhaustive research into each item of the matrix was performed to discuss and assess the magnitude of each factor. Examples to justify arguments were found in specific case studies from various regions, and data concerning energy figures and emissions were extracted from reports published by reliable sources, including the IEA, the International Renewable Energy Agency (IRENA), the Hydrogen Council, and the European Commission. According to the obtained data, the SWOT matrix is formulated, and all the strengths, weaknesses, opportunities, and threats are discussed and analyzed. The framework of this process is presented in Figure 2.
Based on a thorough literature review, the SWOT matrix configuration involved selecting the factors influencing the green H2 market. The results are presented in Table 1. The following sections delve into and expand upon each element of the matrix: strengths, weaknesses, opportunities, and threats.

3. Results and Discussion

The SWOT matrix of the green hydrogen (H2) market (Table 1) was established by performing an extensive literature review and following the steps illustrated in Figure 2. The following sections describe and discuss the most important points found for each item in the SWOT matrix.

3.1. Strengths

These factors serve as internal indicators that confer advantages to green H2 and its recent developments. Green H2’s primary strength lies in its environmentally friendly nature, which is instrumental given the increased awareness of climate change’s effects. Government support and policies backing up this advantage benefit the growth of the green H2 market. These benefits also extend to the increase in RES, which is essential for green H2 production.

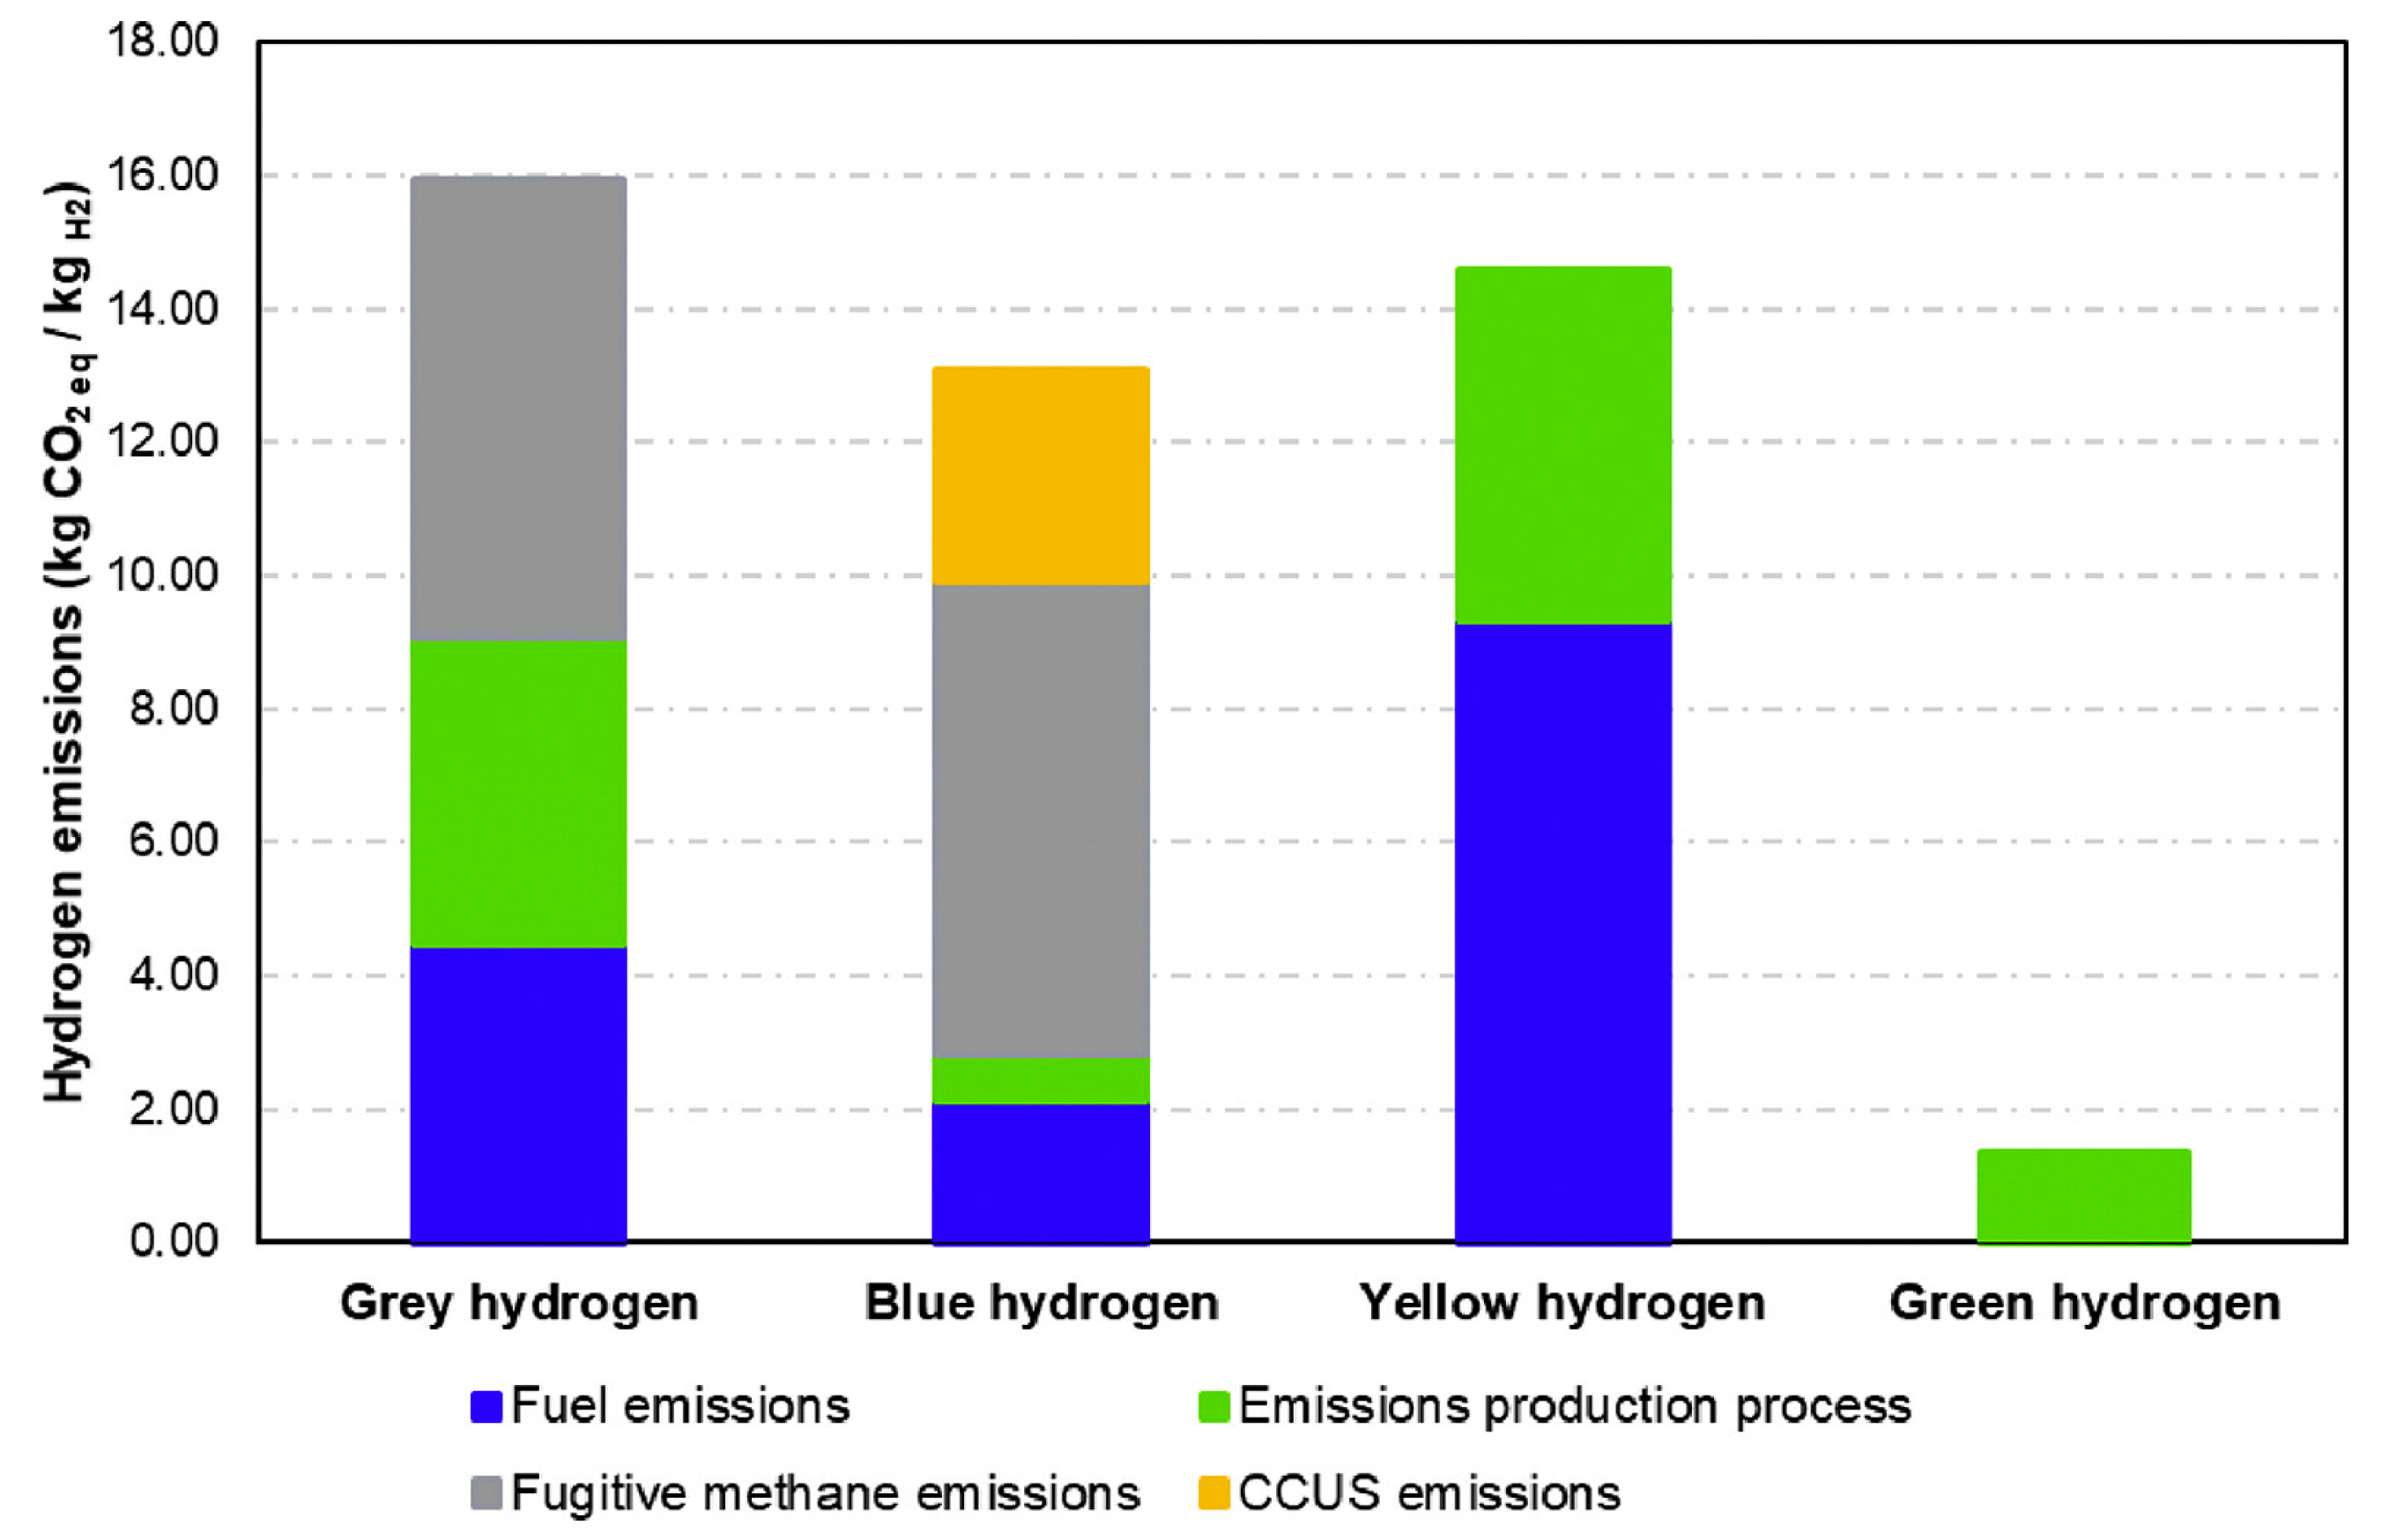
3.1.1. Environmental Benefits

The main environmental benefits of producing green H2 and its increased acceptance as an energy carrier are the release of no GHG emissions during the electrolysis process [19] and the reliance on RES, avoiding the extraction and consumption of fossil fuels. The sole by-product of water electrolysis is oxygen (O2), meaning no unwanted by-products such as sulfates, carbon oxides, and nitrogen oxides [20] are released through this technology.
Sadeghi et al. [21] used a life cycle assessment (LCA) as an analytical tool to evaluate GHG emissions consisting of carbon dioxide (CO2), methane (CH4), and nitrous oxide (N2O) of different H2 production methods used in the oil and gas industries and concluded that steam methane reforming and coal gasification led to emissions of 10.3 and 11.6 kgCO2/kgH2, respectively, much higher than the 3.08 and 2.06 kgCO2/kgH2 of photovoltaic (PV) and solar thermal electrolysis.
The emissions associated with electrolysis powered by clean energy processes are mainly linked to the manufacturing components required to generate that renewable electricity. For example, in the case of PV solar panels, it comes from their manufacturing and the crystalline and silicon requirements. For wind energy, the impacts are related to wind turbine production, of which steel and iron are the main contributors [22].
Ajanovic et al. [8] compared the emissions from four H2 production methods, namely gray, blue, yellow, and green, with yellow H2 produced using water electrolysis powered by grid electricity (whose energy mix usually involves fossil fuels). The results are presented in Figure 3.
The sources used for producing the electricity that drives the electrolysis process deeply influence the total environmental impacts of the whole cycle. In the case of the LCA made by Siddiqui et al. [23], H2 production through water electrolysis revealed higher CH4, CO2, and carbon monoxide (CO) emissions than conventional steam methane reforming and coal gasification. However, these higher emissions were attributed to the U.S. electricity mix, mainly composed of natural gas and coal, being used as the propeller of the electrolysis pathway. Hence, using RES to produce H2 through water electrolysis is imperative to obtain the environmental benefits that green H2 can offer.
The benefits of green H2 go beyond releasing fewer emissions; water electrolysis also produces high-purity O2, contributing positively to the environmental impact assessment. Fernández-Dacosta et al. [24] performed an LCA of different H2 production methods. The results demonstrated that water electrolysis allowed for a negative global warming potential (GWP), a metric commonly used for analyzing the contributions of gas emissions to global climate change. The credit was given to the production of high-purity O2 as a byproduct. An important aspect to be noted in that study is that the electricity was sourced from PV solar panels, and the cradle-to-grave environmental impacts of these panels were not considered.
Furthermore, green H2 has the potential to be used in the decarbonization of heavy industry (e.g., ammonia, oil and gas, iron and steel, cement), responsible for a significant share of the overall carbon emissions. The two main pathways through which green H2 can contribute to decarbonizing such industries are either by directly replacing conventional gray H2 used in the processes of ammonia production and oil and gas refining or by introducing new processes in which green hydrogen replaces fossil fuel-intensive processes, such as in the cases of iron and steel and cement industries. Other potential application sectors include road transportation, shipping, aviation, buildings, and heating.
The exact emissions from the green H2 production process are complicated to quantify, as all the steps surrounding it are hard to compile. For instance, the pressurization of H2 after the electrolyzer may not be included, nor may the manufacturing of the equipment that produces the RES. Even so, it is asserted that it is still possible to reiterate the environmental benefits of green H2 compared to other methods. It plays a crucial role in decreasing dependency on fossil fuels and promoting a sustainable energy transition by serving as a clean energy carrier.

3.1.2. Government Support and Policies

The increased energy demand noted in the last few decades and expected in the next ones, coupled with efforts to reduce climate change and GHGs, has boosted the implementation of government policies and support to produce clean and renewable energy, including green H2. A few agreements and goals have been developed, starting a collective movement towards a sustainable future.
In 2015, the United Nations developed the Sustainable Development Goals (SDGs) to achieve a better future for all. The 17 goals address the global challenges humankind currently faces and symbolize a united effort to overcome them. Two of these goals overlay on the green H2 transition: “SDG 7. Affordable and clean energy: Ensure access to affordable, reliable, sustainable, and modern energy for all” and “SDG 13. Take climate action: Take urgent action to combat climate change and its impacts” [25]. Along with these goals, the 2030 Agenda for Sustainable Development was announced, containing ambitious targets to achieve by 2030.
In December 2015, the Paris Agreement marked the collective commitment of 196 parties to mitigate global warming [26]. The main goals outlined were “holding the increase in the global average temperature to well below 2 °C above pre-industrial levels” and “pursuing efforts to limit the temperature increase to 1.5 °C above pre-industrial levels” [27]. It also included the global obligation for domestic action through nationally determined contributions (NDCs), which are comprised of the steps each country intends to follow to achieve the goals set out in the agreement [28].
Considering the Paris Agreement, the European Green Deal (EGD) has set out in 2019 a package of policy initiatives that aim to set the EU on the path to a green transition, with the overarching goal of being the first continent to reach a net-zero economy or a balanced emissions budget by 2050. Whereas the EGD mostly represents a general action plan to fight climate change, the “Fit for 55” package from 2021 offers the preparatory path to meet the EGD targets, particularly reducing 55% of the GHG emissions by 2030 compared to 1990 levels. In 2020, the European Commission unveiled the EGD Investment Plan, which will provide at least USD 1.1 trillion over the next decade. A clear objective of the European Union to facilitate the transition to a climate-neutral economy is to install 6 GW of electrolyzers by 2024 and at least 40 GW by 2030, providing financial support through various instruments, including the European Investment Bank and the Innovation Fund [7].
These agreements have further incentivized the global shift towards clean and renewable energy. Numerous countries have announced strategies and roadmaps for the increased production and adoption of green H2. Looking at more specific countries in the EU, Germany released its own National Hydrogen Strategy to achieve production of 6 GW by 2030, investing USD 7.6 billion [29] in new H2 businesses and research. In 2021, a grant program in Spain was created with USD 163 million to support projects to produce renewable H2 (including associated renewable electricity generation), distribution, and use in industry. In Denmark, in March 2022, a budget of USD 177 million was announced to tender support for projects on H2 production through renewable-based electricity [3].
Asian countries are leaders on this front. In March 2020, Japan completed the Fukushima Hydrogen Energy Research Field, equipped with 10,000 kW [30], producing H2 through electricity sourced from solar panels. Furthermore, Japan has implemented various regulatory and policy measures to support this industry, including tax incentives for H2-related investments and subsidies for Fuel Cell Electric Vehicles (FCEVs) and refueling stations [7]. In Australia, in 2021, USD 347 million was allocated to support the roll-out of Clean Hydrogen Industrial Hubs, which are networks consisting of H2 producers, consumers, and infrastructures [3].
Support for clean H2 is also being shown on the American continent. In the United States, a budget of USD 8 billion for regional clean H2 hubs and USD 1.1 billion for electrolysis programs to reduce production costs was approved in November 2021. In Uruguay, a call for proposals was launched in April 2022 with a total USD 9.8 million budget for electrolyzer projects above 1.5 MW that start operation by 2025 [3].
Carbon taxes related to fossil fuel use and their perpetual rise transform clean H2 into a more viable and competitive option, as avoiding carbon taxes can raise profits. In 2017, French carbon taxes amounted to 33 USD/tCO2 and are expected to reach 108 USD/tCO2 by 2030 [31].
This has also led to increased interest in green H2 in the private sector. Some international oil companies, electricity utilities, and grid operators have started to consider green H2 projects. In 2020, the oil and gas company BP, together with the energy company Orsted, developed the Lingen Green Hydrogen project. In this project, an electrolyzer with a capacity of 50 MW, powered by Orsted’s offshore wind farm, is to be operational by 2024 [32,33].
The appearance and increase of recent government support and policies, intensified by accords such as the Paris Agreement, has led to a change in behavior regarding the production of green H2. Projects towards substituting fossil fuels for clean energy have increased, even if at early stages. They are being financed by governments and private companies, which is a significant step towards the wider adoption of green H2. However, these policies need to be enforced, carbon taxes must continue rising, and funds need to be allocated well to achieve the environmental goals outlined in the roadmaps. Furthermore, these investments are insufficient to mitigate future investment risks, as many uncertainties are still associated with this shift.

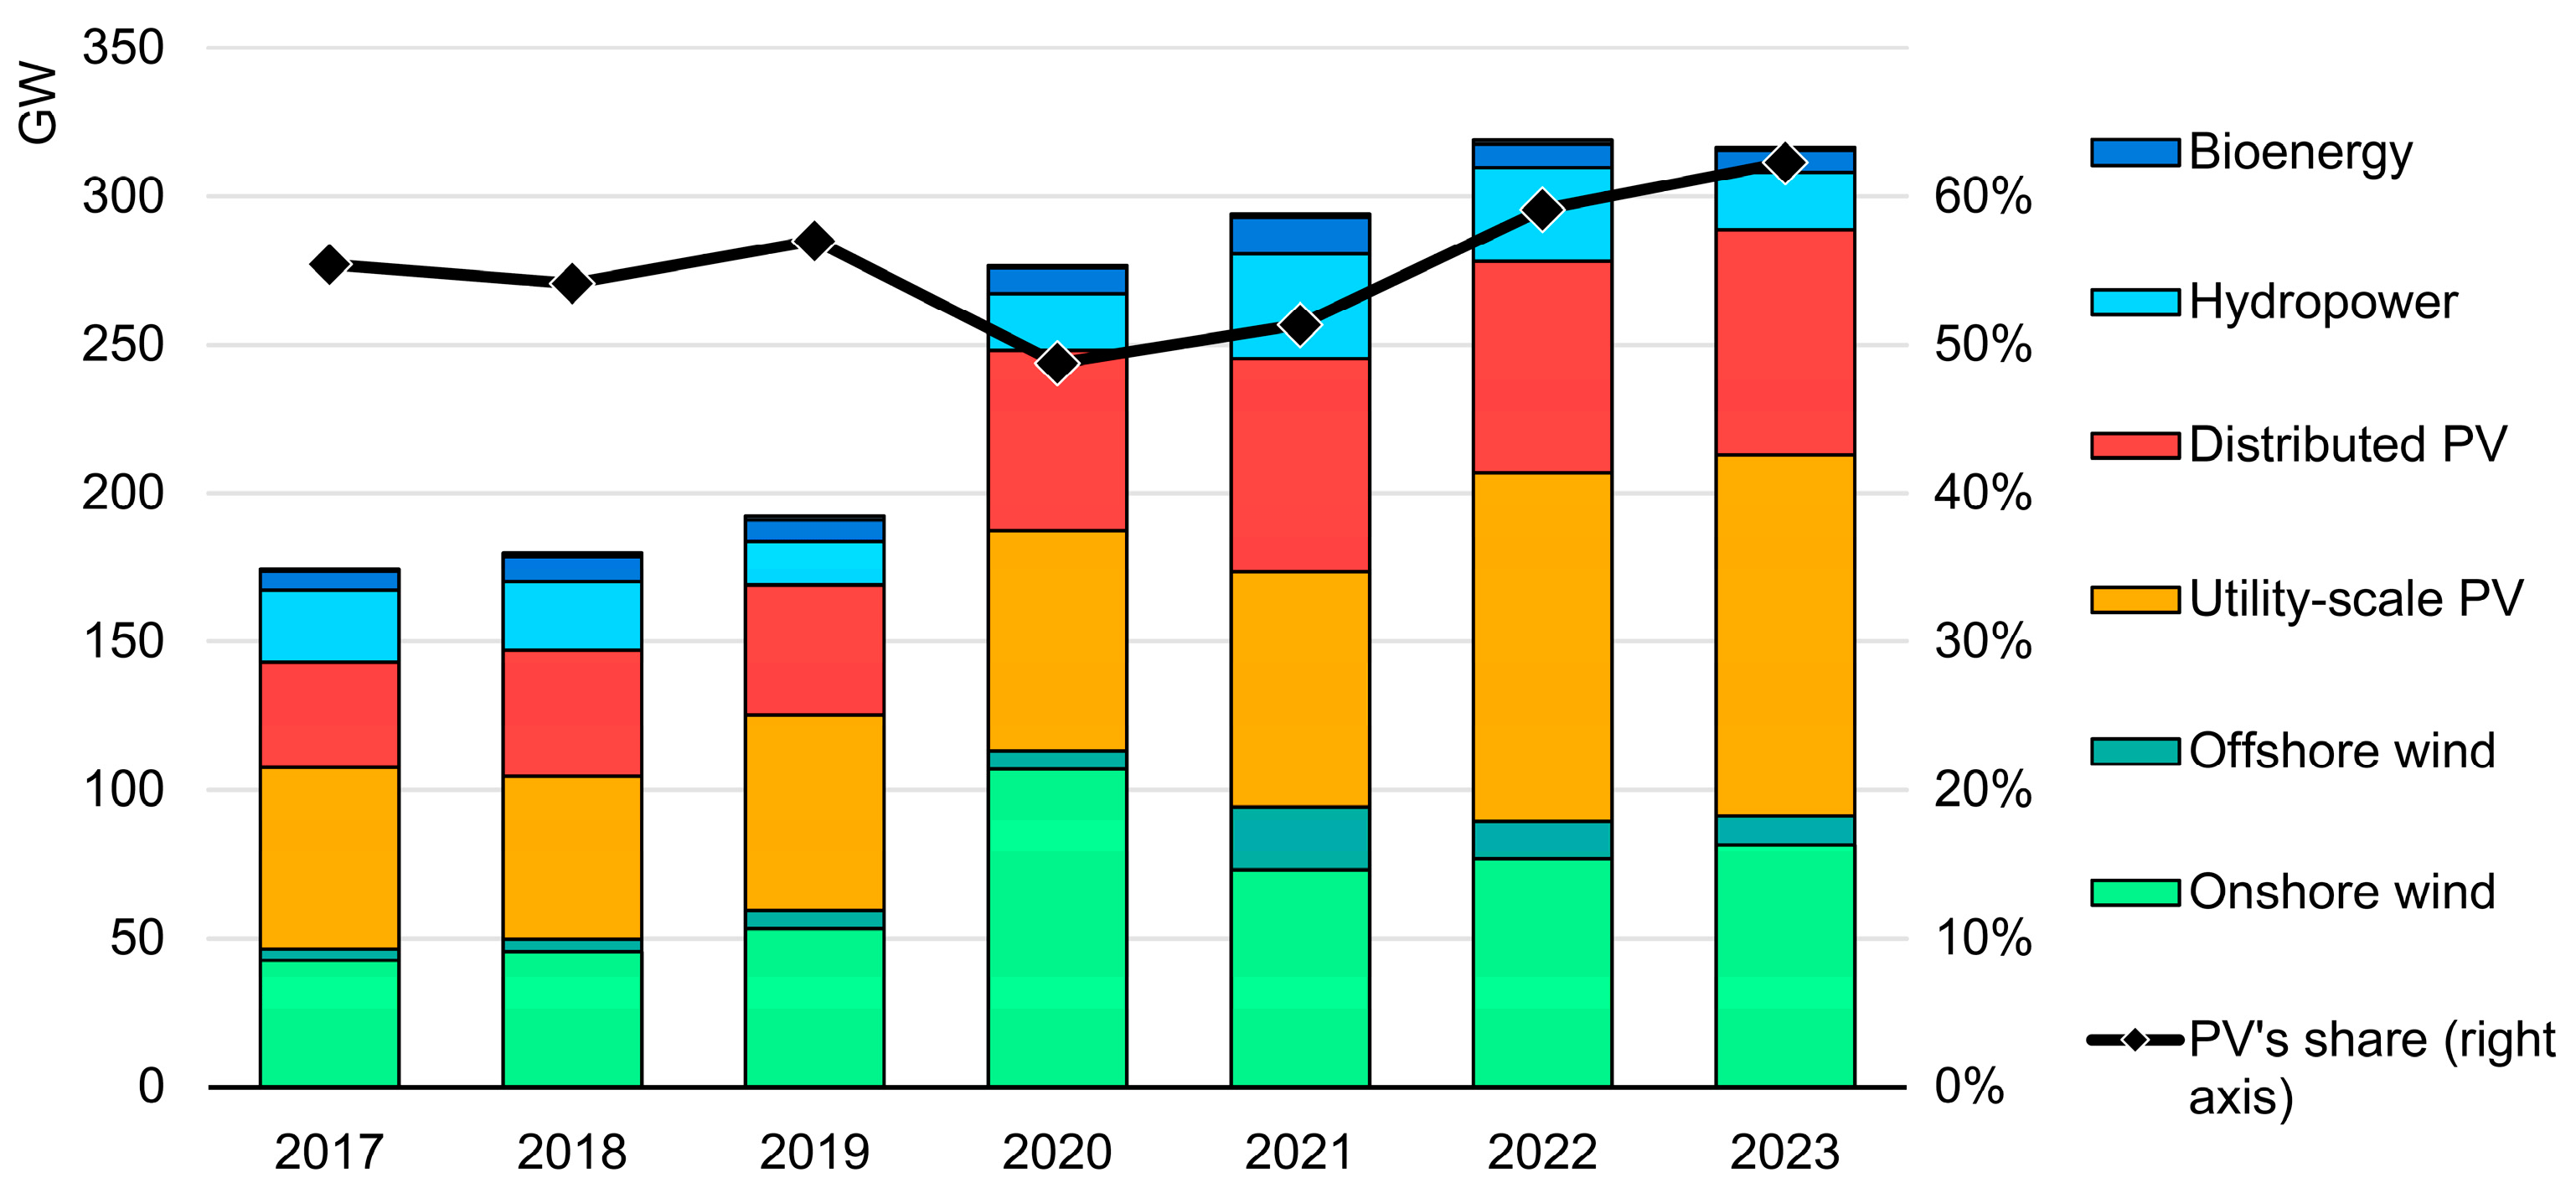
3.1.3. Increase in Renewable Energy Production

Government support and incentives towards clean energy also drive the production of RES, such as solar, hydro, wind, and geothermal energy, which are essential to producing green H2. The Russian invasion of Ukraine has increased the urgency of the transition to clean energy to reduce the dependency on fossil fuels from Russia. Russia supplies nearly 45% of the European Union’s natural gas imports for industry, homes, and electricity generation, of which natural gas accounts for 16% of the total production [34]. The war has also increased fossil fuel prices, which has made renewable electricity more competitive.
According to REN21 [35], from 2011 to 2021, the share of modern renewable energy in the world’s total energy consumption increased from 30 exajoules (EJ) to 50 EJ. Figure 4 compares the global power capacities of different renewable energy sectors from 2017 to 2023.
In 2021, the renewable energy share of electricity production in the world was 27.8% (GWh), an increase of 6.4% since 2013. Several countries, including Norway, Iceland, Bhutan, Nepal, Lesotho, Ethiopia, and others, already have a renewable energy share higher than 90% of the total electricity capacity [36]. Of course, renewable electricity production is more developed than green H2, showing high shares in the current market. A stable structure of this network, from production to consumer, from policies to taxes, will facilitate further production of green H2.
Consequently, the capital costs to produce renewable electricity have been steadily decreasing. According to the IEA, solar PV capital costs lowered by 75% from 2010 to 2019, and electricity from onshore wind became around one-quarter cheaper [37]. Cost reduction brings renewable energy closer to leveling the conventional methods of producing energy and, to an extent, lowers the overall price of green H2.
Still, renewable energy is an intermittent source that lacks the ability to continuously fulfill energy supply and demand. Additionally, one of the key features of H2 is its ability to be stored in multiple ways. Thus, a symbiotic relationship is formed, as one depends on the other for its production and the other for energy storage. As renewable energy costs decrease, the potential for green H2 goes upwards, and as green H2 develops, better renewable energy storage can be provided, thus improving energy efficiency.

3.2. Weaknesses

This section discusses the internal indicators hindering the advance of green H2 and its breakthroughs. A key flaw is the inadequate electrolyzer technology, which reduces efficiency and industrial scalability. Also, high production costs resulting from energy-intensive processes provide financial hurdles and may cancel out green H2’s overall environmental benefits. Furthermore, a lack of storage, transportation, and infrastructure exacerbates these problems, preventing widespread use and integration of green H2 technology.

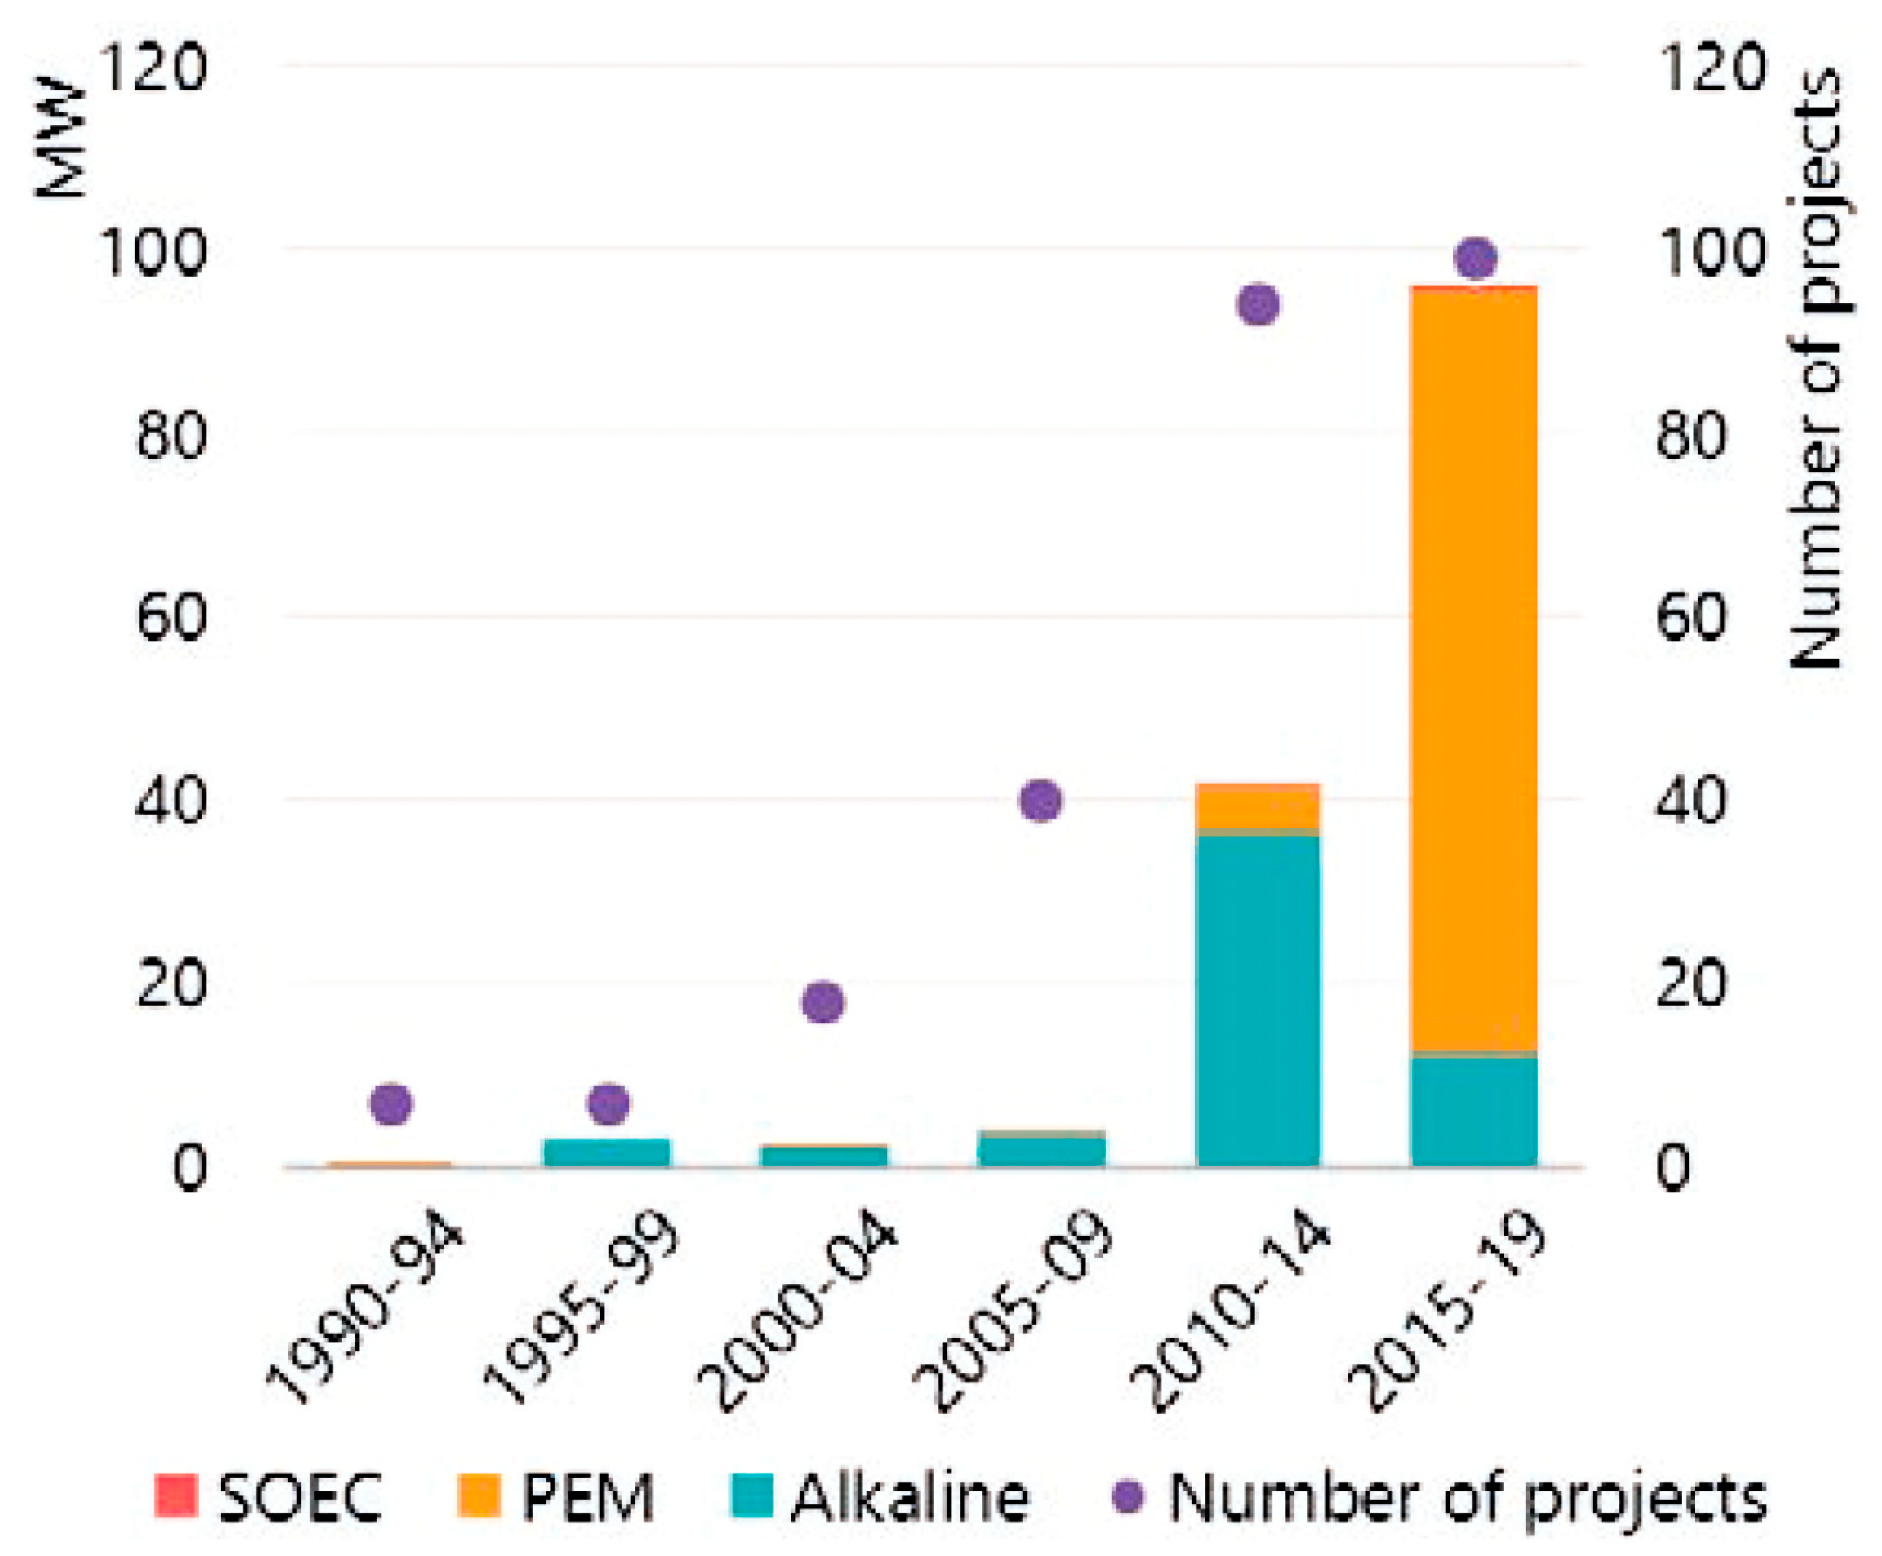
3.2.1. Underdeveloped Electrolyzer Technology

As mentioned, the industrial method for green H2 production is water electrolysis carried out in an electrolyzer. The basic components of electrolyzers are the two electrodes, an anode (positive) and a cathode (negative), separated by an electrolyte. There are currently many types of electrolyzers, with the oldest, most mature, and most widespread type being the alkaline water electrolyzer (AWE), with a current market share of 61%, followed by the proton-exchange membrane (PEM) electrolyzer, with 31% of the world’s total capacity [38], and the remaining 8% belonging to more recent types, including the solid oxide electrolysis cell (SOEC) and the anion-exchange membrane (AEM) electrolyzer.
Even though this technology was introduced decades ago, electrolyzers still hold some drawbacks, posing a major obstacle to the efficient production of green H2. The main challenges with AWEs are their low current densities, operating pressures, and partial load range [39]. AWEs use a strongly alkaline electrolyte solution, typically about 30 wt.% KOH, with a porous diaphragm used to separate the electrodes and the produced gases. This configuration, however, increases the ohmic resistance, limiting the current density at which AWEs operate [40], and increasing the electrolyzer’s volume. The H2 produced is at relatively low pressure due to the decrease in performance when higher pressures are applied, leading to extra energy and components for H2 pressurization, increasing operational costs [40]. The last major challenge in AWE is related to the variability of RES. The cold start time is relatively long, and startup and shutdown cycles accelerate the degradation of the electrodes, decreasing the operational lifetime of the AWE [41,42]. Various RES are required to avoid this problem, and electrodes with a better resistance to these cycles need to be developed [43].
The less mature but highly efficient PEM electrolysis technology currently outperforms other types of electrolyzers. PEM electrolyzers have a zero-gap configuration, leading to high current densities and a smaller volume. They have an excellent partial load range and produce extremely high-purity H2 at high pressures [44,45]. However, these advantages come at a cost. They require noble metal catalysts (e.g., platinum, iridium) for the electrodes and expensive membranes [46] to provide long-term stability and optimal electronic conductivity, significantly increasing the capital costs of these electrolyzers. Another limiting factor of PEM electrolyzers is their lifetime operating hours compared to AWE. According to IRENA, in 2017, the operating hours of AWEs were 80,000 h, while for PEM electrolyzers, it was only half of that [47]. Although PEM electrolyzers are rapidly gaining market traction due to their advantages, their high capital costs must be reduced by utilizing less expensive materials, and solutions to increase their operational lifetime are also required.
SOEC and AEM electrolyzers are recent types of electrolyzers that are barely available commercially. SOECs offer great promise in terms of efficiency, operate at very high temperatures, and use low-cost materials such as ceramic plates. They are currently facing challenges with their long start-up and shutdown times, rapid degradation due to the high operating temperatures, and low ion conductivity given by the ceramic plates [48]. AEM water electrolysis is a mix of AWE and PEM electrolysis, combining the main advantages of each technology, allowing for lower capital costs, zero-gap configuration, and using platinum group-free catalysts and ion-selective membranes. Given their immaturity, they currently have low stability and durability. The lifetime of AEM electrolyzers has been reported to be lower than 3000 h [49].
Electrolyzers are an essential piece of the puzzle for the large-scale production of green H2. However, materials, efficiency, lifetime, costs, and design configuration need further development to strengthen this technology.

3.2.2. High Production Costs

Cost is the most critical factor for technology commercialization, as it determines whether users can obtain affordable H2 and related products. Two main factors influence the price of green H2 production, namely the electrolysis process (efficiency, load factor, operating hours) and renewable electricity [50]. Factors such as labor, water, and land are practically negligible. Due to these challenges, the total global capacity of electrolysis and the share of renewable energy produced are still quite limited compared to the gray and blue H2 production processes. Consequently, the cost of green H2 is much higher, rendering it a less viable option.
Longden et al. [51] compared the estimates from 16 different studies on H2 production costs through steam methane reforming and coal gasification with and without CCS (blue and gray H2), as well as PV and wind RES. A median estimate was performed, and the study concluded that the price to produce gray H2 ranged from 1.66–1.84 USD/kgH2, and these values increased to 2.28–3.15 USD/kgH2 when a carbon penalty on remaining emissions of 50 USD/tCO2 was assumed. The production of blue H2 remained slightly higher due to the cost of the CCS equipment, ranging from 2.09–2.23 USD/kgH2 without a carbon tax to 2.24–2.70 USD/kgH2 with the carbon tax. As expected, the production costs of green H2 from PV and wind energy remained the highest, with an estimated 3.64 USD/kgH2. Serag et al. [52] performed a techno-economic study on the production of green H2 using a PEM electrolyzer powered by the tidal movement in the oceans surrounding the Socotra Islands in Yemen. The assessment results showed that the production cost of H2 was 9 USD/kgH2, with most of the fault being due to the high electricity costs. This proves that electrolyzers and renewable electricity costs remain very high compared to other technologies.
According to the IEA [37], by 2019, the capital expense requirements for AWE were in the range of 500–1400 USD/kW, and for PEM electrolysis, they were 1100–1800 USD/kW. SOEC electrolyzers, being less developed, ranged from 2800–5600 USD/kW. The cell stacks are responsible for around 40–60% of the total cost for both AWE and PEM electrolysis [53]. As mentioned, the latter requires noble metals, significantly increasing the overall expenditure. Electrolyzer technology has room for innovation, as its levelized costs are expected to decrease in the following decades. Studies and projects to improve performance and reduce costs by substituting noble metals with cheaper ones are already being executed.
The costs of renewable electricity have already witnessed a tremendous decrease in the last decade; however, they are still a major contributor to the high costs of green H2 production, accounting for approximately 50% of these levelized costs [53]. This value may differ from project to project depending on the source utilized and the respective status of its production. Khan et al. [54] evaluated the economic viability of H2 production using AWE powered by a concentrated photovoltaic (CPV) system with high conversion efficiencies. The CPV solar farm was the dominant factor, with 55.3% of the total costs, while only 27.3% was directed to the electrolyzer. The study was also performed for commercial crystalline silicon panels (c-Si PV), a cheaper and less efficient module. In this case, only 48.6% accounted for the c-Si PV farm, resulting in a considerably lower total expenditure, even when considering that the land area was twice that of the first study.
The overall decrease in the price of electricity generated from PV and wind sources in the last decade has significantly lowered the cost of H2 produced from electrolysis. However, to compete with conventional methods, its price must continue decreasing. Section 3.3.2. will explore prospects for decreasing green H2 production costs.

3.2.3. Lack of H2 Storage and Transportation Infrastructure

Currently, there is a lack of H2 storage technologies, distribution networks, and infrastructures. While there are a few pipelines and storage facilities, these are often not connected [55]. This problem affects the increase in the production of not only green H2 but all types of H2. H2 can be stored as a compressed gas, as a cryogenic liquid, or through physical or chemical bonding. Safety concerns associated with H2 properties have hampered the handling of this fuel. H2 is a highly flammable and explosive gas with a low energy barrier for combustion in the air. This raises concerns about leaks or ruptures in storage tanks or pipelines. It has the smallest atom, meaning it can easily leak through most materials [56]. To avoid these risks, storage tanks and pipelines must be designed to maintain their integrity, and frequent inspections and safety checks must be performed to detect and address potential issues [55].
Furthermore, it has the largest liquid-to-vapor volume ratio, occupying more than 860 times the volume in the gas phase than the liquid phase at ambient conditions. Thus, the expansion of liquid H2 confined in a sealed vessel can cause significant pressure buildup. It has a very low volumetric energy density (8.7 MJ/L in the liquid phase), requiring significantly larger storage vessels to carry the same energy as other fuels [56]. Refueling stations must be designed carefully, putting safety first and considering all emergency protocols. Currently, there are very few refueling stations—more precisely, 540 installed stations at the end of 2020, with the majority in Asia. H2 vehicle manufacturers are hesitant to sell FCEVs without an increase in infrastructure, while refueling station suppliers are doubtful to build more stations without more vehicles, creating a “chicken or egg” dilemma [57].
These issues lead to challenges in developing the H2 storage and transportation infrastructure, rendering H2 a less viable option. Unlike fossil fuels, which already have a well-established network and supply chains, H2 infrastructure is significantly underdeveloped. This has been a limiting factor for increasing the green H2 market. Further investments are required for R&D to improve storage and transportation technologies that can minimize the risks of leaks, fires, and explosions, enabling wider accessibility to green H2.

3.3. Opportunities

These elements operate as external indicators, highlighting prospects for the evolution of green H2 and its recent achievements. One of the main opportunities is developing electrolyzer technologies, which can improve efficiency and production scalability. Furthermore, the predicted reduction in electrolyzer and renewable energy costs offers opportunities for more cost-effective green H2 generation. The varied use of green H2 in many industries provides diversification and expanded market potential. Furthermore, repurposing natural gas pipelines for H2 transport is a creative and cost-effective option that aligns with the changing energy environment. Finally, expanding the green H2 sector generates new job possibilities, aids economic development, and cultivates a trained workforce.

3.3.1. Advances in Electrolyzer Technology

The main objectives for developing electrolyzers are performance optimization and cost reduction, which are major challenges for their future growth. Over the past few decades, electrolyzers have experienced a surge in attention and notable development, with an exponential increase in total capacity and the number of projects (Figure 5).
Given this technology’s recent emergence and the substantial investment it attracts, new developments are constantly appearing. Solutions to tackle some of the challenges previously mentioned are already being developed. Table 2 shows several studies on developments that can potentially lead to better electrolyzer performances for each type. These studies and numerous others represent stepstones to achieving a new standard for electrolyzer operation. Electrolyzer performance, namely efficiency and lifetime operating hours, is expected to increase in the following decades. Table 3 shows the expected ranges of these values according to the European Commission in 2030 and 2050 [58].
Furthermore, new electrolyzer types are emerging, bringing forth more opportunities and branches for innovation. A new concept currently being developed is seawater electrolysis, in which seawater is the H2 source. Its abundance and wide availability make it a great source for substituting clean water. Nevertheless, seawater comprises sediment, microorganisms, and complex ion species unsuitable for an intrinsic electrochemical process. Moreover, this composition is not fixed, and geographical location and seasonal changes affect the cleanliness of the water. Many ions cannot be filtered out by pretreatment (e.g., chloride and bromide anions, sodium cations) and have to be taken into account for the electrolysis process [66]. The complex chemical environment of seawater can create fluctuations in the electrodes’ pH, causing catalyst degradation. The small particles in the seawater also have the potential to poison the electrode/catalyst, limiting its long-term stability [67]. The presence of chloride in seawater is another problematic aspect of this process. The oxidation of this ion gives rise to chlorine evolution. This parasitic reaction takes place at the anode and overlaps the oxygen evolution reaction, the desired anodic process in water electrolysis [68]. As with the other electrolysis approaches, breakthroughs are bound to happen, reducing the number of challenges concerning the use of seawater for producing H2. Realizing this concept is becoming urgent, given the foreseeable awareness of using current clean water sources to supply the expected increase in water electrolysis; this threat is further discussed in Section 3.4.4.

3.3.2. Expected Decrease in Electrolyzer and Renewable Energy Costs

Innovations in electrolyzer technology and advances in manufacturing processes will undoubtedly influence future cost reductions. Figure 6 illustrates the potential for cost reduction in current AWE and PEM electrolysis by combining several stacks to increase the capacity of the overall system, according to the IEA [36].
In IRENA’s 2020 report “Green hydrogen cost reduction: scaling up electrolyzers to meet the 1.5 °C climate goal” [52], a detailed analysis of strategies for cost reduction at stack and system levels of electrolyzers, along with their associated challenges and benefits, is presented.
As mentioned, renewable energy costs have been on a downward trend. According to IRENA [69], from 2010 to 2022, the levelized cost of electricity (LCOE) of newly commissioned utility-scale PV and onshore wind projects decreased by 89% and 69%, respectively. These improvements are mainly due to the optimized manufacturing processes, optimized efficiencies, and enhanced outputs of these sources.
The COVID-19 pandemic harmed these prices; for instance, by March 2022, the cost of PV-grade silicon had quadrupled since the beginning of 2021. Nonetheless, this increase did not hamper their competitiveness, as the pandemic affected the costs of fossil fuels and electricity at a higher rate [33]. While this discrepancy will impact renewable energy costs in absolute terms, it will not change the expected trajectory in the long run, which is anticipated to decline consistently.
Even though H2 production through geothermal sources is not a well-established technology, numerous economic studies have been carried out. Yilmaz et al. [70] performed a thermodynamic analysis and an exergy-based cost formation of a PEM electrolyzer powered by a binary geothermal power plant for H2 production. The results revealed that the H2 cost was 2.37 USD/kgH2. Two years later, Yilmaz [71] conducted a thermoeconomic optimization of an AWE system powered by a combined flash-binary geothermal power plant for H2 production. The calculated cost of H2 production was 1.09 USD/kgH2. The costs were lower than those of H2 produced from solar and wind sources and would be competitive with current blue and possibly gray H2 costs. These results also bring forth new possibilities for a decrease in green H2 production costs.
There are many untapped regions rich in renewable energy that would lead to higher energy efficiencies and, ultimately, lower H2 production costs. For example, in Patagonia, the wind could have a capacity factor of around 50% with an electricity cost of 25–30 USD/MWh. This would be enough to achieve a green H2 production cost of 2.5 USD/kgH2, which is close to the blue H2 price range [52]. Nadaleti et al. [72] studied the potential to produce H2 in Paraguay using the excess energy from hydroelectric plants to power a PEM electrolysis system. The results showed that the cost of H2 production and storage could be as low as 0.22 SD/kgH2. The exploitation of these regions and the better management of resources can also lead to more accessible costs.
Ultimately, decreasing renewable energy and electrolyzer costs, the main pillars of green H2 production, will continue driving down green H2 costs. In recent years, these advances have already marked substantial progress, with green H2 costs decreasing by over 80% from 2002 to 2017 [73].
Prioritizing investments in green H2 will be crucial to achieving the targets outlined in the Paris Agreement or the European Union’s Green Deal in the following years. The distribution of funds for green H2 is anticipated to significantly surpass that of blue and gray H2. Consequently, the cost of green H2 is expected to continue its downward trend, making it more accessible than ever (Figure 7).

3.3.3. Application in Different Sectors

With the development of H2 storage and transportation solutions, green H2 has the potential to decarbonize various sectors, including transportation, shipping, buildings, and the heating sector, which have always depended on fossil fuels. Slowly replacing fossil-based fuels in these sectors will promote the transition towards a sustainable future and enhance the role of green H2 in society.

Transportation Sector

The transportation sector is a primary contributor to GHG emissions. In 2017, 20% of energy-related CO2 emissions were produced in the transportation sector [74]. Fuel cells, which convert the chemical energy of H2 into electricity, have enabled the use of H2 as a fuel in FCEVs. As of 2019, there were around 23,000 FCEVs, including cars, buses, and trucks [75]. Currently, only two models are available in the market, the Toyota Mirai and the Hyundai Nexo (following the discontinuation in 2021 of the Honda Clarity), and they are mainly available in Japan, South Korea, California, and Europe [76]. Given the competitiveness of battery electric vehicles as a mature commercial technology for green transportation (more advanced and widely available), and considering the lack of infrastructure (e.g., refueling stations) and distribution networks for H2, FCEVs are more suitable for pre-determined trips, and scheduled operating transportation, namely heavy-duty and long-range vehicles. For long journeys, FCEVs offer faster refueling times, which is crucial for vehicles such as freight trucks, which account for 25% of transportation-related CO2 emissions [74]. Buses also fit this description, working on fixed routes and having high operating times. In 2017, more than 450 FCEV buses were operational around the globe. South Korea has plans to replace 26,000 buses using compressed natural gas with fuel cell buses by 2030 [74]. The ability to use H2 in the transportation sector scales up the opportunities for the end-use of green H2, contributing to the transition to carbon-free transportation.

Buildings Heat and Power Sector

Buildings are another energy-intensive sector, which includes space heating, hot water production, and other conventional electric equipment. In 2019, nearly 28% of global CO2 emissions resulted from energy use in buildings [36]. A more competitive decarbonization alternative for this sector is the direct use of renewable electricity. Although it is not yet cost-competitive with currently used fossil fuels (e.g., propane, natural gas, and oil), it is unlikely that H2 can become a better option [77]. Nonetheless, H2 has a few advantages over this alternative. It can be stored for long periods, which is relevant as heating demand is highly seasonal, and it can take advantage of the existing natural gas infrastructure and equipment, therefore being less expensive to implement. Concerning the latter advantage, H2 can decarbonize the natural gas network in three ways: it can be blended with natural gas; used to produce e-methane; or used in its pure form [78]. The first option represents a transition stage towards the underdeveloped second and third options. H2 can make up 5 to 20 vol% of the natural gas supply [78]. For example, if one assumes blending green H2 into all natural gas usage globally at 3 vol%, the green H2 demand would increase to 12 Mt H2/year, equaling about 17% of the current global H2 production [36]. Additionally, this requires adequate testing to ensure system safety, efficiency, and environmental performance. The second option involves producing clean e-methane using green H2 and a source of CO2 through a low-efficiency methanation process known as the Sabatier reaction. The last option entails infrastructure and appliance upgrades, improvements in leakage control, and the replacement of steel pipelines. Even so, this is yet another sector in which green H2 can make an impact and grow its market share.

Maritime Sector

The maritime sector accounts for 2.2% of global CO2 emissions. The International Maritime Organization aims to achieve at least a 40% reduction in carbon emissions by 2030 and a 70% reduction by 2050, compared with 2008 emissions [9]. The damage the fossil fuel shipping industry has caused to marine and coastal systems reinforces the importance of replacing these fuels with clean alternatives. Green H2 is considered a promising solution for achieving these goals. The supply system would be composed of fuel cells and fed by liquified H2 [79]. There are a few challenges concerning implementing green H2 in ships, related to safety, storage time, supply chain, and space onboard.
Even so, green H2 is a competitive alternative to conventional fossil fuels in the marine industry, especially now that the involved costs have decreased. In line with the SDGs, this decrease may encourage stakeholders and investors to embrace green H2 as a sustainable energy carrier in the maritime sector. In particular, using green H2 might limit its pollution emissions, slowing down the rate of climate change and lowering the health hazards that go along with it.

3.3.4. New Employment Opportunities

The transition towards clean energy creates new opportunities and employment in renewable energy, energy efficiency, electrification, green fuels, and grid enhancement supply chains. These include jobs in academia and research, testing, manufacturing, installing, operating, and maintaining renewable energy technologies. The fossil fuel industry currently holds a substantial portion of employment within the energy sector. Nevertheless, the shift toward achieving net-zero emissions is poised to counterbalance these adverse effects by generating more employment opportunities. The IEA estimated that the transition towards net-zero emissions would lead to an overall increase in jobs: while roughly 5 million jobs in fossil fuel production would be lost by 2030, 14 million jobs would be created in clean energy generation [80].
The impact on employment for specific countries or regions depends on their readiness for renewables, economic structures, skills, and capacities, as well as their ability to align the resources at hand with the opportunities brought with this transition. Together with appropriate education, training programs, and coordination between industry and educational entities, investments in green H2 will foster new skilled jobs, reduce unemployment, and ensure sustainable economic growth [79].

3.3.5. Repurposing of Natural Gas Pipelines

H2 is mainly produced close to its final use due to the lack of distribution networks. Currently, 2600 km of H2 pipelines operate in the U.S. and 2000 km in Europe. However, there are more than 1.2 million km of natural gas pipelines, with projects for an extra 200,000 km under construction [3]. The existing natural gas infrastructure could be repurposed to accommodate H2. Adaptation and reconfiguration will be required. The compression strategy will need to be adjusted due to the differences in chemical properties, which includes compressor replacements and a thorough inspection of the pipeline and its integrity. In some cases, such as offshore pipelines, repurposing currently requires more research. Even so, this transition would be cheaper and faster than building new distribution networks for H2.
The cost of repurposing natural gas pipelines is expected to be 10–35% of the cost of building new ones [81]. On 7 March 2023, Floene introduced green H2 into Portugal’s gas distribution network at Seixal, marking a key milestone in the country’s energy transition and decarbonization efforts. The ‘Natural Energy of Hydrogen’ initiative began supplying 82 residential, tertiary, and industrial clients with a mixture of green H2 (up to 20 vol%) and natural gas. At Seixal Industrial Park, Gestene produces hydrogen using 100% renewable energy, which is then transported through a 1400 m polyethylene pipeline to a mixing facility before distribution [82].
When natural gas demand remains or repurposing is not feasible, constructing H2 pipelines along natural gas pipelines can benefit from established routes and siting permits, accelerating the development of pipelines [3]. Blending natural gas with H2 up to 20 vol% can be an intermediate strategy for H2 distribution until the market grows sufficiently to justify repurposing these pipelines. Repurposing the current natural gas network represents a promising opportunity for the fast and cheap implementation of H2 in the current energy mix.

3.4. Threats

These external variables highlight possible threats to green H2’s trajectory and future progress. A major challenge is the lack of worldwide standards, impeding the coordinated development and broad implementation of green H2 technology. Ineffective carbon taxes and the possibility of carbon lock-in are obstacles that may put the economic feasibility of green H2 at risk. The weaknesses of RES, such as the necessity for heavy metals, complicate the reliability of green H2 generation. Concurrently, difficulties surrounding clean water availability and accessibility exacerbate the challenges confronting the green H2 industry, possibly affecting its long-term viability and scalability.

3.4.1. Lack of International Standards

Since green H2 is an emerging market, no international standards concerning its production and use have yet been clearly established, resulting in single countries developing their own regulations and internal standards, or even unwritten or unclear rules [28]. These differences and fluctuations have created complexity and obstacles for global trade, posing green H2 as a higher-risk investment [83]. Even the definition of green H2 has not been fully standardized, with some countries presenting more flexible approaches to environmental issues. Although the goals outlined in the global agreements represent a united effort to decrease GHG emissions—leading to the development of national H2 strategies—the path to achieving them has been left unclear, leaving each country to proceed as they desire. This has resulted in some countries relying on fossil fuels and nuclear energy for their H2 development. Cheng et al. [84] assessed how green the national H2 strategies of numerous countries are. They concluded that countries such as India, Norway, and the U.S. have no intention of decreasing their usage of fossil fuels for H2 production. Green H2 can only be a more viable option if it is cheaper than other methods; however, this will not happen without plans to phase out fossil fuels. Therefore, it is vital to establish a standard international framework to avoid unfair competition and opportunistic practices and establish a global market.

3.4.2. Inefficient Carbon Taxes and Carbon Lock-In

Carbon pricing is often presented as a primary approach for mitigating climate change. Many experts defend the idea that carbon pricing will be the answer to deep decarbonization [85]. A few, however, believe that carbon taxes will not be enough and that their increase will only induce the optimization of current low-carbon technologies instead of a real change [86]. The urgency to limit global warming to less than 1.5 °C has led to doubt about the efficiency of the measures currently adopted. In 2019, carbon pricing only covered 20% of the total global emissions; two-thirds of these prices were below 20 USD/tCO2 [87], which is far too low. Carbon pricing strategies to date have induced limited opportunities for innovation and transformation; rather, few deviations from current emissions have been noticed. For instance, Sweden has one of the highest carbon prices in the world, at 140 USD/tCO2; it was expected that Swedish emissions would experience a substantial decrease. However, the emissions-covered sectors only decreased incrementally. Sweden’s road transportation emissions declined only 4% from 1990 (the year before the carbon tax was introduced) to 2015 [88]. Incremental abatement and small emission reductions are a good start, but not enough to achieve the goals outlined. The number of new gasoline and diesel vehicles in Sweden has increased in recent years, and no evidence of new investments in innovation, such as charging stations for transitioning to electric vehicles, has been noticed [88]. This proves that carbon taxes have induced little to no carbon reductions and have, until now, failed to set in motion the steps to achieve deep decarbonization.
The lack of international standards and uniform pricing also raises concerns about the risk of some nations taking advantage of others’ efforts and companies relocating to places with lower or no carbon taxes (“carbon leakage”). Therefore, using this measure solely can lead to stagnation in the pursuit of a no-carbon economy and exacerbate the challenge of carbon lock-in, a state where the self-reinforcing inertia created by extensive fossil fuel-based energy systems hampers efforts to implement alternative energy technologies. To avoid this, other regulations, such as innovation subsidies, which can help foster technological developments, must be coupled with carbon taxes to mitigate environmental issues.

3.4.3. Renewable Energy Vulnerabilities

A potential threat to the growth of green H2 production is the problem associated with the increase in renewable energy production. Concerns about the impact on land, fauna, and flora have been reported [77,78,89,90,91].
Activities of deforestation and contamination of soils have occurred during the construction phase of wind farms, and heavy machinery and cable installations have a negative impact on land and habitat in the case of PV farms [77]. Rehbein et al. [78] assessed the extent of current and future large renewable energy facilities (wind, PV, and hydro) within important conservation areas. The study results revealed that 17.4% of current renewable energy facilities operate inside important conservation areas, with Western Europe dominating the overall number of overlaps. When considering facilities under development, the study detected that this value increased to 29%.
Opposition to the construction of wind farms mainly stems from visual and noise pollution, perceived impacts on property values, and wildlife impacts. While habitat and wildlife impacts are smaller than those from fossil fuels, the constant noise pollution associated with wind turbine proximity has been linked with lower sleep quality and annoyance [92]. Other studies have found no correlation between the two whatsoever [93]. Solutions such as a minimum distance of 2 km between living areas and a wind turbine to avoid interference have been suggested by researchers. A few tourism officials have also raised concerns about the impact of wind turbines on the landscape, possibly threatening local tourism [94].
Social acceptance is a critical factor that has previously limited the development of renewable electricity facilities, mainly in developing countries. A study conducted in Germany revealed that 90% of the German population was in favor of renewable energy development [77]. However, in some low-income countries, opposition to these developments has surfaced due to unwanted local uses, unfair land compensation, forced relocations, and interference with cultures. In Mexico, the plans for constructing the largest wind farm in Latin America were halted due to the opposition of the local population. The reasons were associated with the interference of indigenous landscapes and cultural practices. A district judge even suspended construction. The lack of transparency between companies, authorities, and communities, as well as the social inequality this development generated, were also responsible for this disagreement [89].
Manufacturing renewable energy technologies is a metal-intensive process that requires more heavy and rare-earth metals than fossil fuels. They require high volumes of steel and aluminum for infrastructure. Several raw materials are required for PV cells, such as silicon, cadmium, tellurium, or copper. These materials involve mining and several extraction and purification processes [90].
Tammaro et al. [91] predict that the extensive growth of PV could release high amounts of cadmium (2.9 tons) and lead (30 tons) into the environment by 2050. Technological innovations are expected to reduce the requirement for these minerals. However, current solutions, such as recycling, are still lagging. For instance, only 1% of the current lithium demand is recycled [77].
These potential threats can affect the development of new renewable energy projects and facilities, impacting the extent of the green H2 market. Poor planning, a lack of communication, and insufficient study of the correlated impacts while developing these projects can easily lead to setbacks and create a negative perception of renewable energy. The life cycle of the metals used in renewable energy technologies must also be managed. Innovations that lead to a decrease in the usage of heavy metals are required to alleviate the intensive mining and extraction processes predicted in the coming years. Recycling procedures must be applied to create a circular economy, especially considering that, in the case of PVs, 90% of the materials can be recycled [90].

3.4.4. Issues with Drinking Water

The current electrolyzer technology requires water to be as pure as possible. Impurities present in the water can affect the lifetime of the electrolyzer stack, potentially increasing the cost of H2. From a purely stoichiometric perspective, 1 kg of H2 requires 9 kg of water [52]. However, due to some inefficiencies in the process, it can go as high as 25 kg of water, depending on the type of electrolyzer [52,77]. The scarcity of clean water sources does not threaten the future of green H2. A study conducted by Newborough and Cooley [16] concluded that if all fossil fuels being used were replaced by green H2, the water required for electrolysis would amount to 1.8% of the current global water consumption. However, a few countries in the Middle East, Saharan, and Sub-Saharan regions face water scarcity, posing a threat to their increase in green H2 production. Furthermore, the additional water demands expected due to climate change, population growth, economic development, and agricultural intensification have exacerbated the fear of water scarcity [16].
The use of seawater is a potential solution because it would prevent H2 production from contributing to increased demand for fresh water. Water desalination is being used in several locations, but it increases the cost of H2. Therefore, seawater electrolysis is a technology being developed to allow for the direct splitting of seawater into H2 and O2. Unfortunately, this technology is still immature and faces many challenges. Even though water scarcity does not pose a current threat to most countries actively working towards implementing a green H2 economy, alternatives for the input of water electrolysis are important to ensure that green H2 maintains its low impact on our current resources.

4. Conclusions

Fossil fuels have long dominated the energy landscape, contributing to the climate change challenges humankind faces today. Green hydrogen (H2) offers a promising clean energy alternative that can help mitigate these issues. However, as an emerging technology, green H2 is currently less competitive than other fuels, requiring substantial incentives and financial investment to promote its development and widespread adoption.
This study evaluated the current state of the green H2 market using a SWOT analysis to examine its strengths, weaknesses, opportunities, and threats. The aim was to facilitate the development of future strategies in this field. The analysis revealed that the environmentally friendly nature of green H2 is its most important strength, as it can mitigate rapid climate change. Governments, driven by environmental pressures, play a crucial role in this transition, as adequate policies and financial support can incentivize the adoption of cleaner energy sources. However, the current fragile network of green H2 leads to uncertainties and risks for private investors, mainly relying on government funding. Global agreements and commitments also boost the development of green H2 roadmaps and strategies. Nonetheless, further R&D is required to reduce costs and improve technological performance, making green H2 more accessible and enhancing distribution networks.
The phase-out of fossil fuels will also enhance the competitiveness of green H2. Overreliance on carbon taxing as the primary solution can lead to carbon lock-in, with carbon emissions remaining high despite the taxes. Carbon taxes have done little to curb carbon emissions and barely incentivized technology development toward zero-carbon energy. Instead, they have pushed companies to invest in blue and low-carbon H2 over green H2. Stricter measures and financial incentives are needed to foster real change.
The green H2 market has the potential to expand across various sectors, driven by anticipated cost reductions, technological innovations, and improvements in storage and distribution. This growth will particularly impact the transportation, maritime, buildings, and heating sectors, facilitated by blending H2 with natural gas and the repurposing of natural gas pipelines. Educating the general public about the benefits of the H2 economy is crucial, as a lack of awareness has previously hindered the construction of new renewable energy facilities. Effective communication and well-planned projects are essential. The lack of international standards also hampers stable global trade, with regulations and norms varying significantly between countries.
Most countries are on the right track toward a cleaner energy mix, with high production and use of renewable electricity and various projects to implement electrolyzers. Countries with less stable conditions face greater challenges, relying more on fossil fuels and lacking the resources to advance toward clean energy. This underscores the need for collaboration and support among nations to facilitate this transition.
Green H2 is struggling to compete with the price of fossil fuel-based energy. Fossil fuels are well-established and mature in the energy market, creating a high barrier for new technologies. Therefore, to attract new enterprises and investors, increased R&D is needed to reduce levelized costs, along with significant incentives from governments and private companies. Tight policies and carbon fees will eventually phase out fossil fuels, enhancing the cost-competitiveness of green H2. In the long term, the widespread adoption of green H2 can significantly contribute to achieving sustainability and reducing carbon footprints, fostering a cleaner and more resilient energy future.

Author Contributions

Conceptualization, F.L.D.S. and D.M.F.S.; methodology, F.L.D.S.; investigation, F.L.D.S.; writing—original draft preparation, F.L.D.S.; writing—review and editing, D.M.F.S.; supervision, D.M.F.S. All authors have read and agreed to the published version of the manuscript.

Funding

Fundação para a Ciência e a Tecnologia (FCT, Portugal) is acknowledged for funding a research contract in the scope of programmatic funding UIDP/04540/2020 (D.M.F.S.).

Data Availability Statement

The original contributions presented in the study are included in the article, further inquiries can be directed to the corresponding author.

Conflicts of Interest

The authors declare no conflicts of interest.

References

  1. Masoudi Soltani, S.; Lahiri, A.; Bahzad, H.; Clough, P.; Gorbounov, M.; Yan, Y. Sorption-Enhanced Steam Methane Reforming for Combined CO2 Capture and Hydrogen Production: A State-of-the-Art Review. Carbon Capture Sci. Technol. 2021, 1, 100003. [Google Scholar] [CrossRef]
  2. Arcos, J.M.M.; Santos, D.M.F. The Hydrogen Color Spectrum: Techno-Economic Analysis of the Available Technologies for Hydrogen Production. Gases 2023, 3, 25–46. [Google Scholar] [CrossRef]
  3. Global Hydrogen Review 2022—Analysis. Available online: https://www.iea.org/reports/global-hydrogen-review-2022 (accessed on 27 March 2024).
  4. Hermesmann, M.; Müller, T.E. Green, Turquoise, Blue, or Grey? Environmentally Friendly Hydrogen Production in Transforming Energy Systems. Prog. Energy Combust. Sci. 2022, 90, 100996. [Google Scholar] [CrossRef]
  5. Zainal, B.S.; Ker, P.J.; Mohamed, H.; Ong, H.C.; Fattah, I.M.R.; Rahman, S.M.A.; Nghiem, L.D.; Mahlia, T.M.I. Recent Advancement and Assessment of Green Hydrogen Production Technologies. Renew. Sustain. Energy Rev. 2024, 189, 113941. [Google Scholar] [CrossRef]
  6. Nikolaidis, P.; Poullikkas, A. A Comparative Overview of Hydrogen Production Processes. Renew. Sustain. Energy Rev. 2017, 67, 597–611. [Google Scholar] [CrossRef]
  7. Hassan, Q.; Algburi, S.; Sameen, A.Z.; Salman, H.M.; Jaszczur, M. Green Hydrogen: A Pathway to a Sustainable Energy Future. Int. J. Hydrogen Energy 2024, 50, 310–333. [Google Scholar] [CrossRef]
  8. Ajanovic, A.; Sayer, M.; Haas, R. The Economics and the Environmental Benignity of Different Colors of Hydrogen. Int. J. Hydrogen Energy 2022, 47, 24136–24154. [Google Scholar] [CrossRef]
  9. Atilhan, S.; Park, S.; El-Halwagi, M.M.; Atilhan, M.; Moore, M.; Nielsen, R.B. Green Hydrogen as an Alternative Fuel for the Shipping Industry. Curr. Opin. Chem. Eng. 2021, 31, 100668. [Google Scholar] [CrossRef]
  10. Dincer, I. Green Methods for Hydrogen Production. Int. J. Hydrogen Energy 2012, 37, 1954–1971. [Google Scholar] [CrossRef]
  11. World Energy Transitions Outlook 1.5 °C Pathway 2022 Edition. Available online: https://www.irena.org/publications/2022/mar/world-energy-transitions-outlook-2022 (accessed on 27 March 2024).
  12. Rahimirad, Z.; Sadabadi, A.A. Green Hydrogen Technology Development and Usage Policymaking in Iran Using SWOT Analysis and MCDM Methods. Int. J. Hydrogen Energy 2023, 48, 15179–15194. [Google Scholar] [CrossRef]
  13. Khan, M.I.; Al-Ghamdi, S.G. Hydrogen Economy for Sustainable Development in GCC Countries: A SWOT Analysis Considering Current Situation, Challenges, and Prospects. Int. J. Hydrogen Energy 2023, 48, 10315–10344. [Google Scholar] [CrossRef]
  14. Ren, J.; Gao, S.; Tan, S.; Dong, L. Hydrogen Economy in China: Strengths–Weaknesses–Opportunities–Threats Analysis and Strategies Prioritization. Renew. Sustain. Energy Rev. 2015, 41, 1230–1243. [Google Scholar] [CrossRef]
  15. Li, Y.; Shi, X.; Phoumin, H. A Strategic Roadmap for Large-Scale Green Hydrogen Demonstration and Commercialisation in China: A Review and Survey Analysis. Int. J. Hydrogen Energy 2022, 47, 24592–24609. [Google Scholar] [CrossRef]
  16. Li, Y.; Phoumin, H.; Kimura, S. Hydrogen Sourced from Renewables and Clean Energy: A Feasibility Study of Achieving Large-Scale Demonstration; ERIA Research Project Report 2021, No. 19; ERIA: Jakarta, Indonesia, 2021. [Google Scholar]
  17. Squadrito, G.; Maggio, G.; Nicita, A. The Green Hydrogen Revolution. Renew. Energy 2023, 216, 119041. [Google Scholar] [CrossRef]
  18. Zhou, Y.; Li, R.; Lv, Z.; Liu, J.; Zhou, H.; Xu, C. Green Hydrogen: A Promising Way to the Carbon-Free Society. Chin. J. Chem. Eng. 2022, 43, 2–13. [Google Scholar] [CrossRef]
  19. Sarker, A.K.; Azad, A.K.; Rasul, M.G.; Doppalapudi, A.T. Prospect of Green Hydrogen Generation from Hybrid Renewable Energy Sources: A Review. Energies 2023, 16, 1556. [Google Scholar] [CrossRef]
  20. Osman, A.I.; Mehta, N.; Elgarahy, A.M.; Hefny, M.; Al-Hinai, A.; Al-Muhtaseb, A.H.; Rooney, D.W. Hydrogen Production, Storage, Utilisation and Environmental Impacts: A Review. Environ. Chem. Lett. 2022, 20, 153–188. [Google Scholar] [CrossRef]
  21. Sadeghi, S.; Ghandehariun, S.; Rosen, M.A. Comparative Economic and Life Cycle Assessment of Solar-Based Hydrogen Production for Oil and Gas Industries. Energy 2020, 208, 118347. [Google Scholar] [CrossRef]
  22. Al-Qahtani, A.; Parkinson, B.; Hellgardt, K.; Shah, N.; Guillen-Gosalbez, G. Uncovering the True Cost of Hydrogen Production Routes Using Life Cycle Monetisation. Appl. Energy 2021, 281, 115958. [Google Scholar] [CrossRef]
  23. Siddiqui, O.; Dincer, I. A Well to Pump Life Cycle Environmental Impact Assessment of Some Hydrogen Production Routes. Int. J. Hydrogen Energy 2019, 44, 5773–5786. [Google Scholar] [CrossRef]
  24. Fernández-Dacosta, C.; Shen, L.; Schakel, W.; Ramirez, A.; Kramer, G.J. Potential and Challenges of Low-Carbon Energy Options: Comparative Assessment of Alternative Fuels for the Transport Sector. Appl. Energy 2019, 236, 590–606. [Google Scholar] [CrossRef]
  25. THE 17 GOALS|Sustainable Development. Available online: https://sdgs.un.org/goals (accessed on 24 February 2024).
  26. The Paris Agreement|UNFCCC. Available online: https://unfccc.int/process-and-meetings/the-paris-agreement (accessed on 24 February 2024).
  27. The Paris Agreement—Publication|UNFCCC. Available online: https://unfccc.int/documents/184656 (accessed on 25 February 2024).
  28. Gomez-Echeverri, L. Climate and Development: Enhancing Impact through Stronger Linkages in the Implementation of the Paris Agreement and the Sustainable Development Goals (SDGs). Philos. Trans. R. Soc. A Math. Phys. Eng. Sci. 2018, 376, 20160444. [Google Scholar] [CrossRef]
  29. Scita, R.; Raimondi, P.P.; Noussan, M. Green Hydrogen: The Holy Grail of Decarbonisation? An Analysis of the Technical and Geopolitical Implications of the Future Hydrogen Economy; Fondazione Eni Enrico Mattei (FEEM): Milan, Italy, 2020. [Google Scholar] [CrossRef]
  30. Giant Leap towards a Hydrogen Society/the Government of Japan—JapanGov. Available online: https://www.japan.go.jp/tomodachi/2020/earlysummer2020/hydrogen.html (accessed on 24 February 2024).
  31. Dolci, F.; Thomas, D.; Hilliard, S.; Guerra, C.F.; Hancke, R.; Ito, H.; Jegoux, M.; Kreeft, G.; Leaver, J.; Newborough, M.; et al. Incentives and Legal Barriers for Power-to-Hydrogen Pathways: An International Snapshot. Int. J. Hydrogen Energy 2019, 44, 11394–11401. [Google Scholar] [CrossRef]
  32. Industry News & Market Insights|Breakbulk Events & Media|Breakbulk. Available online: https://breakbulk.com/Articles/bp-orsted-launch-green-hydrogen-project (accessed on 25 February 2024).
  33. Noussan, M.; Raimondi, P.P.; Scita, R.; Hafner, M. The Role of Green and Blue Hydrogen in the Energy Transition—A Technological and Geopolitical Perspective. Sustainability 2020, 13, 298. [Google Scholar] [CrossRef]
  34. Renewable Energy Market Update—May 2022—Analysis. Available online: https://www.iea.org/reports/renewable-energy-market-update-may-2022 (accessed on 27 March 2024).
  35. Renewables Global Status Report—REN21. Available online: https://www.ren21.net/reports/global-status-report/ (accessed on 27 March 2024).
  36. Renewable Energy Statistics 2023. Available online: https://www.irena.org/Publications/2023/Jul/Renewable-energy-statistics-2023 (accessed on 27 March 2024).
  37. The Future of Hydrogen—Seizing today’s Opportunities. Available online: https://www.iea.org/reports/the-future-of-hydrogen (accessed on 27 March 2024).
  38. Electrolysers for the Hydrogen Revolution. Available online: https://www.swp-berlin.org/publikation/electrolysers-for-the-hydrogen-revolution (accessed on 27 March 2024).
  39. Khatib, F.N.; Wilberforce, T.; Ijaodola, O.; Ogungbemi, E.; El-Hassan, Z.; Durrant, A.; Thompson, J.; Olabi, A.G. Material Degradation of Components in Polymer Electrolyte Membrane (PEM) Electrolytic Cell and Mitigation Mechanisms: A Review. Renew. Sustain. Energy Rev. 2019, 111, 1–14. [Google Scholar] [CrossRef]
  40. Santoro, C.; Lavacchi, A.; Mustarelli, P.; Di Noto, V.; Elbaz, L.; Dekel, D.R.; Jaouen, F. What Is Next in Anion-Exchange Membrane Water Electrolyzers? Bottlenecks, Benefits, and Future. ChemSusChem 2022, 15, e202200027. [Google Scholar] [CrossRef]
  41. Brauns, J.; Turek, T. Alkaline Water Electrolysis Powered by Renewable Energy: A Review. Processes 2020, 8, 248. [Google Scholar] [CrossRef]
  42. Haoran, C.; Xia, Y.; Wei, W.; Yongzhi, Z.; Bo, Z.; Leiqi, Z. Safety and Efficiency Problems of Hydrogen Production from Alkaline Water Electrolyzers Driven by Renewable Energy Sources. Int. J. Hydrogen Energy 2024, 54, 700–712. [Google Scholar] [CrossRef]
  43. Kojima, H.; Nagasawa, K.; Todoroki, N.; Ito, Y.; Matsui, T.; Nakajima, R. Influence of Renewable Energy Power Fluctuations on Water Electrolysis for Green Hydrogen Production. Int. J. Hydrogen Energy 2023, 48, 4572–4593. [Google Scholar] [CrossRef]
  44. Abu, S.M.; Hannan, M.A.; Ker, P.J.; Mansor, M.; Tiong, S.K.; Mahlia, T.M.I. Recent Progress in Electrolyser Control Technologies for Hydrogen Energy Production: A Patent Landscape Analysis and Technology Updates. J. Energy Storage 2023, 72, 108773. [Google Scholar] [CrossRef]
  45. Guo, X.; Zhu, H.; Zhang, S. Overview of Electrolyser and Hydrogen Production Power Supply from Industrial Perspective. Int. J. Hydrogen Energy 2024, 49, 1048–1059. [Google Scholar] [CrossRef]
  46. Krishnan, S.; Koning, V.; Theodorus De Groot, M.; De Groot, A.; Mendoza, P.G.; Junginger, M.; Kramer, G.J. Present and Future Cost of Alkaline and PEM Electrolyser Stacks. Int. J. Hydrogen Energy 2023, 48, 32313–32330. [Google Scholar] [CrossRef]
  47. Hydrogen from Renewable Power: Technology Outlook for the Energy Transition. Available online: https://www.irena.org/publications/2018/Sep/Hydrogen-from-renewable-power (accessed on 27 March 2024).
  48. Grigoriev, S.A.; Fateev, V.N.; Bessarabov, D.G.; Millet, P. Current Status, Research Trends, and Challenges in Water Electrolysis Science and Technology. Int. J. Hydrogen Energy 2020, 45, 26036–26058. [Google Scholar] [CrossRef]
  49. Li, D.; Motz, A.R.; Bae, C.; Fujimoto, C.; Yang, G.; Zhang, F.-Y.; Ayers, K.E.; Kim, Y.S. Durability of Anion Exchange Membrane Water Electrolyzers. Energy Environ. Sci. 2021, 14, 3393–3419. [Google Scholar] [CrossRef]
  50. Yu, M.; Wang, K.; Vredenburg, H. Insights into Low-Carbon Hydrogen Production Methods: Green, Blue and Aqua Hydrogen. Int. J. Hydrogen Energy 2021, 46, 21261–21273. [Google Scholar] [CrossRef]
  51. Longden, T.; Beck, F.J.; Jotzo, F.; Andrews, R.; Prasad, M. ‘Clean’ Hydrogen?—Comparing the Emissions and Costs of Fossil Fuel versus Renewable Electricity Based Hydrogen. Appl. Energy 2022, 306, 118145. [Google Scholar] [CrossRef]
  52. Serag, S.; AL-Khawlani, A.; Echchleh, A. Technical Economic Study for Electricity Production by Using (Tidal-Hydrogen) in Socotra Island, Yemen. E3S Web Conf. 2021, 314, 01002. [Google Scholar] [CrossRef]
  53. Green Hydrogen Cost Reduction. Available online: https://www.irena.org/publications/2020/Dec/Green-hydrogen-cost-reduction (accessed on 25 February 2024).
  54. Khan, M.A.; Al-Shankiti, I.; Ziani, A.; Idriss, H. Demonstration of Green Hydrogen Production Using Solar Energy at 28% Efficiency and Evaluation of Its Economic Viability. Sustain. Energy Fuels 2021, 5, 1085–1094. [Google Scholar] [CrossRef]
  55. Hassan, Q.; Sameen, A.Z.; Salman, H.M.; Jaszczur, M.; Al-Jiboory, A.K. Hydrogen Energy Future: Advancements in Storage Technologies and Implications for Sustainability. J. Energy Storage 2023, 72, 108404. [Google Scholar] [CrossRef]
  56. Ratnakar, R.R.; Gupta, N.; Zhang, K.; Van Doorne, C.; Fesmire, J.; Dindoruk, B.; Balakotaiah, V. Hydrogen Supply Chain and Challenges in Large-Scale LH2 Storage and Transportation. Int. J. Hydrogen Energy 2021, 46, 24149–24168. [Google Scholar] [CrossRef]
  57. Genovese, M.; Fragiacomo, P. Hydrogen Refueling Station: Overview of the Technological Status and Research Enhancement. J. Energy Storage 2023, 61, 106758. [Google Scholar] [CrossRef]
  58. European Commission; Directorate-General for Energy; Cihlar, J.; Villar Lejarreta, A.; Wang, A.; Melgar, F.; Jens, J.; Rio, P.; van der Leun, K.; Guidehouse; et al. Hydrogen Generation in Europe: Overview of Costs and Key Benefits; Publications Office: Luxembourg, 2020; Available online: https://op.europa.eu/en/publication-detail/-/publication/7e4afa7d-d077-11ea-adf7-01aa75ed71a1/language-en (accessed on 25 February 2024).
  59. Gannon, W.J.F.; Newberry, M.; Dunnill, C.W. Performance Assessment of a Low-Cost, Scalable 0.5 kW Alkaline Zero-Gap Electrolyser. Int. J. Hydrogen Energy 2022, 47, 30347–30358. [Google Scholar] [CrossRef]
  60. Kim, J.-H.; Lee, J.-N.; Yoo, C.-Y.; Lee, K.-B.; Lee, W.-M. Low-Cost and Energy-Efficient Asymmetric Nickel Electrode for Alkaline Water Electrolysis. Int. J. Hydrogen Energy 2015, 40, 10720–10725. [Google Scholar] [CrossRef]
  61. Choi, B.; Panthi, D.; Nakoji, M.; Kabutomori, T.; Tsutsumi, K.; Tsutsumi, A. A Novel Water-Splitting Electrochemical Cycle for Hydrogen Production Using an Intermediate Electrode. Chem. Eng. Sci. 2017, 157, 200–208. [Google Scholar] [CrossRef]
  62. Yang, G.; Mo, J.; Kang, Z.; Dohrmann, Y.; List, F.A.; Green, J.B.; Babu, S.S.; Zhang, F.-Y. Fully Printed and Integrated Electrolyzer Cells with Additive Manufacturing for High-Efficiency Water Splitting. Appl. Energy 2018, 215, 202–210. [Google Scholar] [CrossRef]
  63. Mo, J.; Kang, Z.; Yang, G.; Retterer, S.T.; Cullen, D.A.; Toops, T.J.; Green, J.B.; Zhang, F.-Y. Thin Liquid/Gas Diffusion Layers for High-Efficiency Hydrogen Production from Water Splitting. Appl. Energy 2016, 177, 817–822. [Google Scholar] [CrossRef]
  64. Si, X.; Wang, X.; Li, C.; Lin, T.; Qi, J.; Cao, J. Joining 3YSZ Electrolyte to AISI 441 Interconnect Using the Ag Particle Interlayer: Enhanced Mechanical and Aging Properties. Crystals 2021, 11, 1573. [Google Scholar] [CrossRef]
  65. Lee, J.G.; Jeon, O.S.; Ryu, K.H.; Park, M.G.; Min, S.H.; Hyun, S.H.; Shul, Y.G. Effects of 8mol% Yttria-Stabilized Zirconia with Copper Oxide on Solid Oxide Fuel Cell Performance. Ceram. Int. 2015, 41, 7982–7988. [Google Scholar] [CrossRef]
  66. Gao, F.-Y.; Yu, P.-C.; Gao, M.-R. Seawater Electrolysis Technologies for Green Hydrogen Production: Challenges and Opportunities. Curr. Opin. Chem. Eng. 2022, 36, 100827. [Google Scholar] [CrossRef]
  67. Hu, L.; Tan, X.; Yang, X.; Zhang, K. Electrolysis of Direct Seawater: Challenges, Strategies, and Future Prospects. Chin. J. Chem. 2023, 41, 3484–3492. [Google Scholar] [CrossRef]
  68. Maril, M.; Delplancke, J.-L.; Cisternas, N.; Tobosque, P.; Maril, Y.; Carrasco, C. Critical Aspects in the Development of Anodes for Use in Seawater Electrolysis. Int. J. Hydrogen Energy 2022, 47, 3532–3549. [Google Scholar] [CrossRef]
  69. Renewable Power Generation Costs in 2022. Available online: https://www.irena.org/Publications/2023/Aug/Renewable-Power-Generation-Costs-in-2022 (accessed on 27 March 2024).
  70. Yilmaz, C.; Kanoglu, M.; Abusoglu, A. Thermoeconomic Cost Evaluation of Hydrogen Production Driven by Binary Geothermal Power Plant. Geothermics 2015, 57, 18–25. [Google Scholar] [CrossRef]
  71. Yilmaz, C. Thermoeconomic Modeling and Optimization of a Hydrogen Production System Using Geothermal Energy. Geothermics 2017, 65, 32–43. [Google Scholar] [CrossRef]
  72. Nadaleti, W.C.; Lourenço, V.A.; Americo, G. Green Hydrogen-Based Pathways and Alternatives: Towards the Renewable Energy Transition in South America’s Regions—Part A. Int. J. Hydrogen Energy 2021, 46, 22247–22255. [Google Scholar] [CrossRef]
  73. Lebrouhi, B.E.; Djoupo, J.J.; Lamrani, B.; Benabdelaziz, K.; Kousksou, T. Global Hydrogen Development—A Technological and Geopolitical Overview. Int. J. Hydrogen Energy 2022, 47, 7016–7048. [Google Scholar] [CrossRef]
  74. Hydrogen, Scaling Up|Hydrogen Council. Available online: https://hydrogencouncil.com/en/study-hydrogen-scaling-up/ (accessed on 27 March 2024).
  75. Oliveira, A.M.; Beswick, R.R.; Yan, Y. A Green Hydrogen Economy for a Renewable Energy Society. Curr. Opin. Chem. Eng. 2021, 33, 100701. [Google Scholar] [CrossRef]
  76. Hardman, S.; Tal, G. Who Are the Early Adopters of Fuel Cell Vehicles? Int. J. Hydrogen Energy 2018, 43, 17857–17866. [Google Scholar] [CrossRef]
  77. Cremonese, L.; Mbungu, G.K.; Quitzow, R. The Sustainability of Green Hydrogen: An Uncertain Proposition. Int. J. Hydrogen Energy 2023, 48, 19422–19436. [Google Scholar] [CrossRef]
  78. Rehbein, J.A.; Watson, J.E.M.; Lane, J.L.; Sonter, L.J.; Venter, O.; Atkinson, S.C.; Allan, J.R. Renewable Energy Development Threatens Many Globally Important Biodiversity Areas. Glob. Change Biol. 2020, 26, 3040–3051. [Google Scholar] [CrossRef]
  79. Mneimneh, F.; Ghazzawi, H.; Abu Hejjeh, M.; Manganelli, M.; Ramakrishna, S. Roadmap to Achieving Sustainable Development via Green Hydrogen. Energies 2023, 16, 1368. [Google Scholar] [CrossRef]
  80. Net Zero by 2050—Analysis. Available online: https://www.iea.org/reports/net-zero-by-2050 (accessed on 7 May 2024).
  81. Repurposing Onshore Pipelines for Hydrogen: Guiding Operators through the Re-Evaluation Process. Available online: https://www.dnv.com/focus-areas/hydrogen/repurposing-pipelines-for-hydrogen-guiding-operators-through-the-re-evaluation-process/ (accessed on 31 May 2024).
  82. Green Pipeline Project: The Natural Energy of Hydrogen. Available online: https://floene.pt/en/green-pipeline-project/ (accessed on 31 May 2024).
  83. Working Paper: Regional Insights into Low-Carbon Hydrogen Scale Up|World Energy Insights. Available online: https://www.worldenergy.org/publications/entry/regional-insights-low-carbon-hydrogen-scale-up-world-energy-council (accessed on 26 February 2024).
  84. Cheng, W.; Lee, S. How Green Are the National Hydrogen Strategies? Sustainability 2022, 14, 1930. [Google Scholar] [CrossRef]
  85. Baranzini, A.; Van Den Bergh, J.C.J.M.; Carattini, S.; Howarth, R.B.; Padilla, E.; Roca, J. Carbon Pricing in Climate Policy: Seven Reasons, Complementary Instruments, and Political Economy Considerations. WIREs Clim. Change 2017, 8, e462. [Google Scholar] [CrossRef]
  86. Want an Effective Climate Policy? Heed the Evidence. Available online: https://policyoptions.irpp.org/magazines/february-2016/want-an-effective-climatepolicy-heed-the-evidence/ (accessed on 24 February 2024).
  87. Rosenbloom, D.; Markard, J.; Geels, F.W.; Fuenfschilling, L. Why Carbon Pricing Is Not Sufficient to Mitigate Climate Change—And How “Sustainability Transition Policy” Can Help. Proc. Natl. Acad. Sci. USA 2020, 117, 8664–8668. [Google Scholar] [CrossRef]
  88. Tvinnereim, E.; Mehling, M. Carbon Pricing and Deep Decarbonisation. Energy Policy 2018, 121, 185–189. [Google Scholar] [CrossRef]
  89. Zárate-Toledo, E.; Patiño, R.; Fraga, J. Justice, Social Exclusion and Indigenous Opposition: A Case Study of Wind Energy Development on the Isthmus of Tehuantepec, Mexico. Energy Res. Soc. Sci. 2019, 54, 1–11. [Google Scholar] [CrossRef]
  90. Tawalbeh, M.; Al-Othman, A.; Kafiah, F.; Abdelsalam, E.; Almomani, F.; Alkasrawi, M. Environmental Impacts of Solar Photovoltaic Systems: A Critical Review of Recent Progress and Future Outlook. Sci. Total Environ. 2021, 759, 143528. [Google Scholar] [CrossRef]
  91. Tammaro, M.; Salluzzo, A.; Rimauro, J.; Schiavo, S.; Manzo, S. Experimental Investigation to Evaluate the Potential Environmental Hazards of Photovoltaic Panels. J. Hazard. Mater. 2016, 306, 395–405. [Google Scholar] [CrossRef]
  92. Mueller, J.T.; Brooks, M.M. Burdened by Renewable Energy? A Multi-Scalar Analysis of Distributional Justice and Wind Energy in the United States. Energy Res. Soc. Sci. 2020, 63, 101406. [Google Scholar] [CrossRef]
  93. Henningsson, M.; Jönsson, S.; Bengtsson, J.; Bluhm, G.; Bolin, K.; Bodén, B.; Ek, K.; Hammarlund, K.; Hannukka, I.-L.; Johansson, C.; et al. The Effects of Wind Power on Human Interests. A Synthesis. Report 6545, 2013, The Swedish Environmental Protection Agency. ISBN 978-91-620-6545-4. Available online: https://tethys.pnnl.gov/sites/default/files/publications/Henningsson-et-al-2013.pdf (accessed on 25 February 2024).
  94. Nazir, M.S.; Mahdi, A.J.; Bilal, M.; Sohail, H.M.; Ali, N.; Iqbal, H.M.N. Environmental Impact and Pollution-Related Challenges of Renewable Wind Energy Paradigm—A Review. Sci. Total Environ. 2019, 683, 436–444. [Google Scholar] [CrossRef]
Figure 1. Global energy and electricity consumption [3].
Energies 17 03114 g001
Figure 2. The path followed to perform a SWOT analysis of the green hydrogen (H2) market.
Energies 17 03114 g002
Figure 3. Comparison of emissions from various hydrogen (H2) production methods [8].
Energies 17 03114 g003
Figure 4. Evolution of the global power capacity among different renewable energy sectors (adapted from [34]).
Energies 17 03114 g004
Figure 5. Development of electrolyzer capacity and number of projects [36].
Energies 17 03114 g005
Figure 6. Expected cost reduction in electrolyzers by using a multi-stack system [36].
Energies 17 03114 g006
Figure 7. Expected trend for H2 production costs [73]. Adapted with permission from Elsevier.
Energies 17 03114 g007
Table 1. SWOT matrix of the green hydrogen (H2) market.
StrengthsWeaknesses
  • Environmental benefits
  • Government support and policies
  • Increase in renewable energy production
  • Underdeveloped electrolyzer technology
  • High production costs
  • Lack of storage, transportation, and infrastructure
OpportunitiesThreats
  • Advances in electrolyzer technology
  • Expected decrease in electrolyzer and renewable energy costs
  • Application in different sectors
  • New employment opportunities
  • Repurposing of natural gas pipelines
  • Inefficient carbon taxes and carbon lock-in
  • Lack of international standards
  • Renewable energy vulnerabilities
  • Issues with the use of clean water
Table 2. Studies offering potential advances in AWE, PEM, and SOEC.
ElectrolyzerStudyPotential ImprovementsSource
AWEZero-gap design using a polyethersulphone
membrane
Higher efficiencies, reduction in ohmic
losses and cost
[59]
Zero-gap design with porous nickel
electrodes
Cost-effective and higher current density[60]
Configuration with manganese dioxide
intermediate electrode
Ohmic loss reduction, high-purity
gas
[61]
PEMAdditive manufacturing of multifunctional
plate
Reduced weight, high efficiencies, and
ultralow ohmic resistance
[62]
Titanium thin and well-tunable liquid/gas
diffusion layers
Higher efficiencies, lower voltage[63]
SOECInterconnected 3YSZ electrolyte and
AISI441 by Ag particle intercalation
Good mechanical and stability performance[64]
8 mol.% yttria-stabilized zirconia with
copper oxide electrolyte
Higher ionic conductivity[65]
Table 3. Expected efficiency and stack lifetime of AWE, PEM, and SOEC in the following decades [58].
YearAWEPEMSOEC
Efficiency (%)Stack Lifetime (h)Efficiency (%)Stack Lifetime (h)Efficiency (%)Stack Lifetime (h)
202063–7050,000–90,00056–6330,000–90,00074–8110,000–30,000
203063–7272,500–100,00061–6960,000–90,00074–8440,000–60,000
205070–80100,000–150,00067–74100,000–150,00077–8475,000–100,000
Disclaimer/Publisher’s Note: The statements, opinions and data contained in all publications are solely those of the individual author(s) and contributor(s) and not of MDPI and/or the editor(s). MDPI and/or the editor(s) disclaim responsibility for any injury to people or property resulting from any ideas, methods, instructions or products referred to in the content.

