Article

Analysis of Stray Current Leakage in Subway Traction Power Supply System Based on Field-Circuit Coupling

1
Guangzhou Metro Design & Research Institute Co., Ltd., Guangzhou 510010, China
2
School of Electrical and Automation Engineering, East China Jiaotong University, Nanchang 330013, China
*
Author to whom correspondence should be addressed.
Energies 2024, 17(13), 3121; https://doi.org/10.3390/en17133121
Submission received: 20 May 2024 / Revised: 11 June 2024 / Accepted: 18 June 2024 / Published: 25 June 2024

Abstract

:
In a rail transit system, there is a constant leakage of current from the subway rails to the earth, and these stray currents have complex propagation paths and a wide range of influence. Since no stray current collection devices are installed at subway depots, some of the stray current leaking from the mainline will converge at the depot, seriously corroding the structural reinforcement and buried metal of the station, thereby jeopardizing the normal operation of subway trains and passenger safety. In this paper, a field-circuit coupling method is proposed to analyze the current leakage and distribution law of the subway mainline and depot. It is found that the failure of the gauge block at the mainline will trigger the maximum leakage of rail current. Additionally, it is observed that the stray current distribution at the depot is mainly influenced by the operating status of the one-way conduction device (OWCD) and the change of rail potential. These results validate the applicability and effectiveness of the field-circuit coupling method proposed in this paper and provide new technical support for the study of stray current leakage distribution in subways.

1. Introduction

In rail transit systems, rails are usually used as the return path for subway traction current [1]. However, since the rails cannot be completely insulated from the ground, there exists a partial current leakage into the earth, which is called stray current. Subway stray current has the characteristics of a complex propagation path and a wide influence range [2]. If no stray current collection device is installed at a subway depot, some of the stray current leaking from the mainline will converge at the depot, causing serious corrosion to the structural reinforcement of the station and the buried metal [3]. This situation jeopardizes the normal operation of the subway train and the safety of the passengers. In-depth exploration and analysis of the subway stray current leakage situation can help implement corresponding measures to ensure the safe operation of the subway system, prolong the service life of the facilities, and reduce maintenance costs, thus making a contribution to the safety and sustainable development of urban rail transit. Therefore, it is of great significance to accurately analyze the current leakage situation and distribution law in the mainline and depot.
Ref. [4] evaluates the stray current leakage on a long subway line by considering the variability of the subway structure, splitting the return current system into several differential units, modeling the resistive network, and discussing the uniform boundary conditions for solving the equations. Ref. [5] proposes a coupling simulation model during the dynamic operation of multiple trains, analyzes the coupling effect of the mainline and the depot, and quantitatively calculates and analyzes the stray current and rail potentials by using the constructed resistive network model, and evaluates the coupling effect. Ref. [6] uses finite element software to build a subway tunnel model based on the open excavation method, explores the mechanism of track transition resistance on stray current, and accurately analyzes the distribution law of subway stray current under many different track transition resistances. Ref. [7] couples a single subway line with the power system structure, builds a finite element model, and studies the stray current distribution characteristics under different soil structure conditions and traction conditions. Ref. [8] proposes a simulation model of field-circuit coupling, which accurately analyzes the diffusion distribution of the stray current by regionally equating the spatial and conductor structures in the DC subway return system and modeling the stray current diffusion field using the direct boundary element method.
The resistive network method used by the above-mentioned scholars is based on Kirchhoff’s circuit laws and Ohm’s law, and differential equations are established to solve for the stray current distribution. The equivalent circuit model is often built according to the structure of the ground network; there are the “rail–earth” two-layer equivalent model [4], the “rail–SCCM–earth” three-layer equivalent model [9], and the “rail–SCCM–buried metal-earth” four-layer equivalent model [10], as well as the equivalent model of the subway depot [11], and so on. In related studies, loop resistance (transition resistance, rail longitudinal resistance, buried metal longitudinal resistance, etc.) [12], traction load [13], train position [14], and substation distance [8] are analyzed as variable covariates for correlation analysis, and the changes of the actual system covariates are simulated by raising the transition resistance and shortening the substation distance.
However, the resistive network model can only be calculated based on the equivalent of the set resistance value, which makes it difficult to accurately reflect the diffusion distribution of stray current around the line. The advantage of the finite element method, on the other hand, lies in the modeling of complex three-dimensional diffusion scenarios [7,15,16,17] of stray currents or the calculation of dynamic processes in complex structures to accurately simulate real physical systems. When using finite element for the dynamic simulation of stray current, each simulation moment needs to manually modify the size and location of the equivalent current source of the train, and then carry out the repetitive dissections of the whole model, which leads to a greatly extended time for the dynamic simulation of the stray current distribution.
In summary, to accurately and efficiently analyze the stray current distribution, a field-path coupling method is proposed in this paper. The field model of stray current leakage distribution is established by the finite element method to accurately obtain the stray current circulation path and distribution, and then the convenience of the equivalent calculation of the resistance network is utilized, and the equivalent resistance network of the traction power supply system is coupled to obtain the dynamic simulation of the stray current and simulate the leakage distribution of the stray current in the surrounding soil.
The main contributions of this paper can be summarized as follows:
(1)
In this paper, a field-circuit coupling method is proposed.
(2)
In this paper, two scenarios are modeled, analyzed, and discussed for the mainline and depot of the subway line, respectively.
(3)
This paper analyzes the current leakage and distribution law at the mainline and depot of the subway.
(4)
The methodology presented in this paper will facilitate the design of stray current mitigation measures for high-risk areas in both the mainline and the subway depot.
This paper describes the principle of finite element field and resistor network in Section 2, the coupling modeling of two scenarios of mainline and depot in Section 3, and the current leakage distributions and laws of the subway mainline and depot in Section 4, which validates the model proposed in this paper. The results are compared and discussed in Section 5, and conclusions are drawn in Section 6.

2. Modeling Fundamental

2.1. The Finite Element Field

Considering that stray current distribution is a constant electric field problem, the soil is simplified and can be regarded as uniformly distributing the stray current in the nearby soil. Therefore, the physical field current module is used in the finite element modeling; i.e., Maxwell’s equations are solved using the “AC/DC module” [18]. The governing equations of the model are
J = 0
× E = 0
The constitutive relationship is
J = σ E
The boundary condition is
E 1 t = E 2 t
J 1 n = J 2 n
where E is the electric field strength, J is the current density, γ is the soil conductivity, Et is the tangential component of the electric field strength, and Jn is the normal component of the current density.

2.2. The Resistor Network

An equivalent resistive network is used to represent the subway traction return system. The scope of equivalence mainly includes the overhead contact line, rails, stray current collection mat (SCCM), earth, track-bed, rail-to-SCCM transition resistance, and SCCM-to-earth transition resistance [19]. All the symbols are used in Figures 3 and 6.
(1)
Overhead contact line equivalent
The overhead contact line of length L is equivalent to n resistors in series, so for each resistor, the equivalent length is also l = L/n. The resistance value of each resistor is RC∙l, where RC is the unit resistance of the overhead contact line. The current source is used as an equivalent of the train, extracting current from the overhead contact line nodes and injecting it into the rail nodes.
(2)
Rail equivalent
The rails are the main trajectory of the DC current returning to the substation. A rail of length L is equivalent to n resistors in series, so for each resistor, the equivalent length is l = L/n. The resistance of each resistor is therefore RGl, where RG is the unit resistance of the rail.
(3)
SCCM equivalent
The SCCM is used as an absorber of leakage current from the rail. An SCCM of length L is equivalent to n resistors in series, so for each resistor, the equivalent length is l = L/n. The resistance value of each resistor is therefore RPl, where RP is the unit resistance of the grid.
(4)
Earth equivalent
The earth can provide many paths for stray currents in DC subway systems, especially in subway depots. Horizontal resistive networking is used as an equivalent of the earth. A rectangular X-Y coordinate system is established in this paper by choosing an area of length X and width Y covering the inner zone of the depot, the outer zone of the depot, and part of the mainline [20]. The earth in this area is divided into q-row and p-column units along the x and y directions, respectively. Therefore, the equivalent length of a single unit is a = X/q and the equivalent width is b = Y/p, as shown in Figure 1, where h is the depth of the earth unit. According to the conductor resistance equation, the equivalent resistance of the earth unit is Rx in the x-direction and Ry in the y-direction.
(5)
Track-bed equivalent
To calculate the transition resistance, the equivalent resistance of the track-bed needs to be calculated first, as shown in Equation (6):
R d = ρ 1 L y S
Rd is the resistance of the track-bed; ρ1 is the resistivity of the track-bed concrete; Ly is the distance from the surface of the track-bed to the SCCM; and S is the area of the track-bed in the transverse direction.
(6)
Rail-to-SCCM transition resistance equivalent
The rail-to-SCCM transition unit resistance Rg is calculated as shown in Equation (7):
R g = ( d 1 R f L + d 1 + R d ) L
Rg is the transition resistance of the interval; Rf is the equivalent resistance of a single set of fasteners; and Rd is the resistance of the track-bed in that interval.
(7)
SCCM-to-earth transition resistance equivalent
The SCCM-to-earth transition unit resistance Rg′ is calculated as shown in Equation (8):
R g = ρ 2 l s = ρ 2 l L d 2
where ρ2 is the transition resistivity of the SCCM-to-earth; l is the depth of the SCCM from the earth; and d2 is the width of the SCCM.
(8)
OWCD equivalent
The OWCD is equivalent to a diode that cuts off when a reverse voltage is applied.

2.3. Field-Circuit Coupling

Dynamic processes in complex structures can be calculated using finite elements [21], which are capable of accurately modeling real physical systems. The resistor network is suitable for reducing spatial problems to planar problems [22], and it can transform the 3D current electric field problem into a 2D distributed parameter problem of a circuit. However, the resistance network does not consider the effect of grounding resistance and it cannot obtain the distribution of current and voltage on any wire.
Therefore, this paper combines these two methods and proposes a field-circuit coupling method, which can utilize the characteristics of the resistive network model to calculate the stray current distribution simply and conveniently, and it also can take advantage of the software simulation model to accurately simulate the distribution of electric fields and currents within the earth environment.

3. Modeling of Field-Circuit Coupling

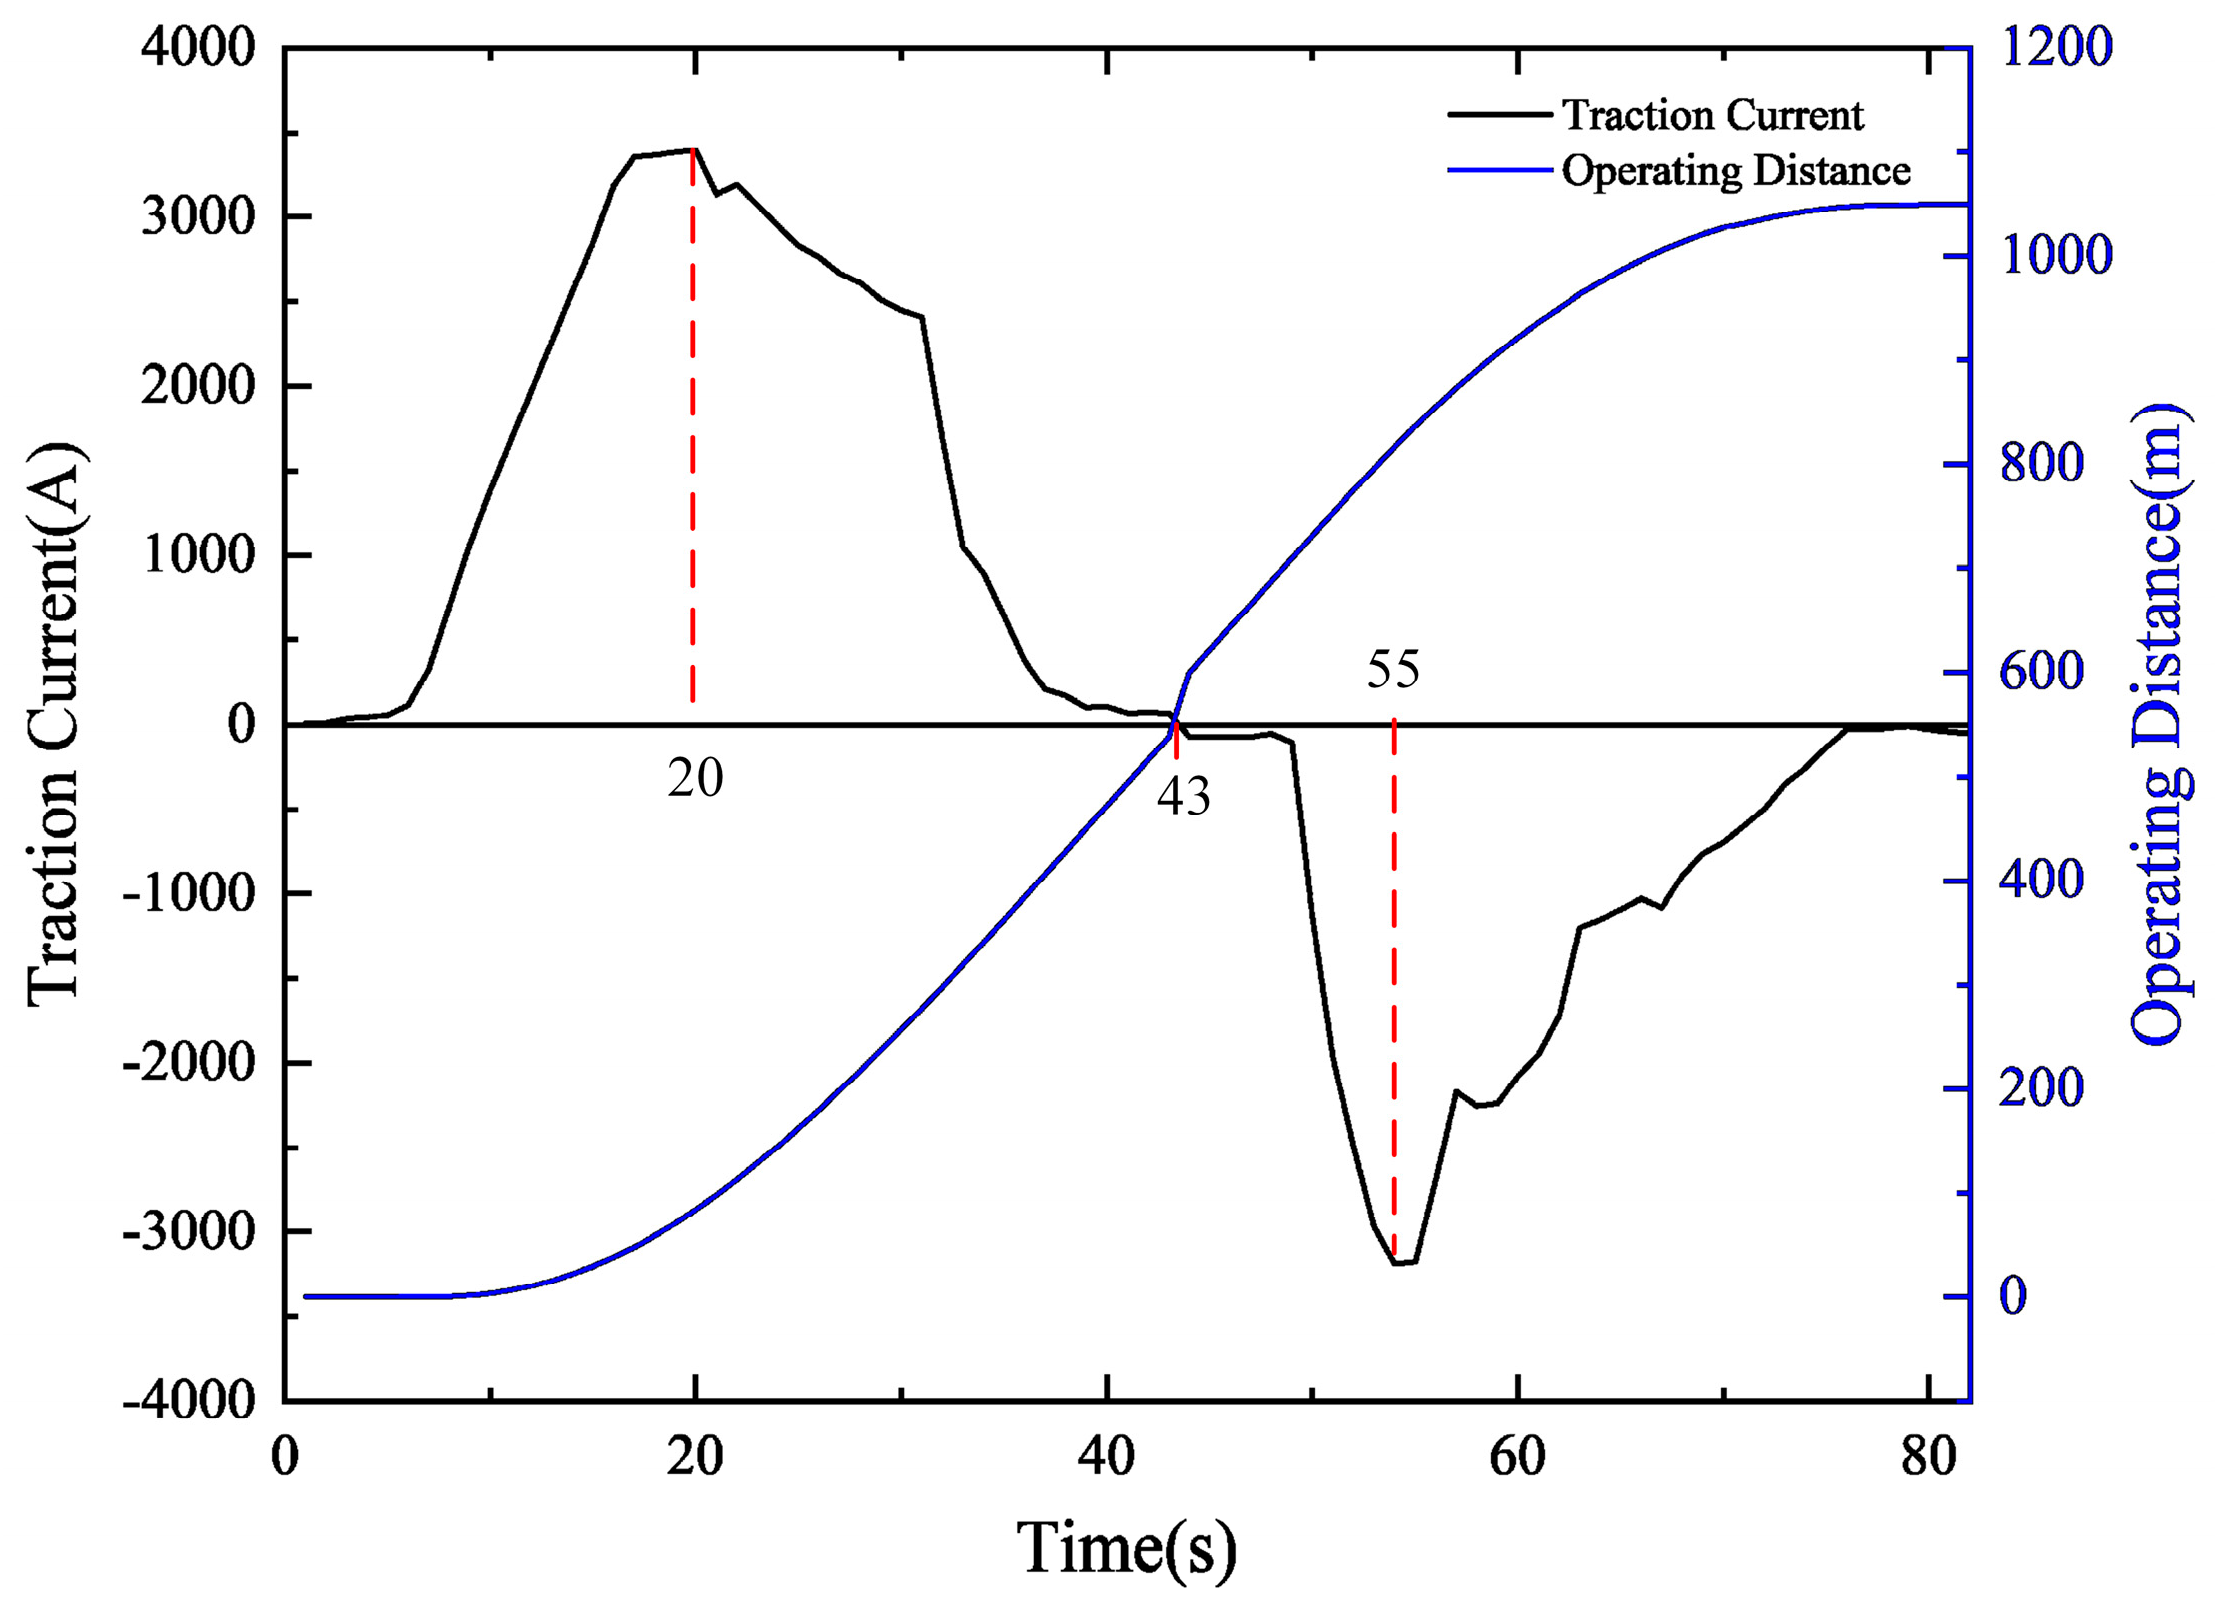
According to the actual operation of a Guangzhou subway line from station A to station B, the traction current and distance data are collected when the train is traveling, as shown in Figure 2. The total length of the section from station A to station B is 1050 m, and the time of train travel is 82 s. When the train has been traveling for 20 s, it is 84 m away from station A, it is in the acceleration stage, and the positive traction current is 3390 A. When the train has been traveling for 43 s, it is 538 m away from station A, in a state of uniform speed, and the traction current is 67 A; after 43 s then the train enters the deceleration stage, and the traction current becomes negative. When the train has been traveling for 55 s, it is 836 m away from station A, it is in the deceleration stage, and the traction current is reversed to a maximum of −3177 A.
To verify the correctness and efficiency of the field-circuit coupling method proposed in this paper, this paper analyzes and discusses a total of 2 scenarios for the mainline and the depot of the subway, respectively.

3.1. Modeling of Current Leakage at the Mainline

3.1.1. Modeling of Field-Circuit Coupling

The field-circuit coupling method is used to analyze the mainline, and the overall modeling is shown in Figure 3. In the model, finite element modeling is used for the middle section of the mainline within a range of 10 m, and the rest of the traction power system section is modeled by the resistive network, to analyze the leakage of current and the distribution law at the mainline.

3.1.2. Modeling of Finite Element Field

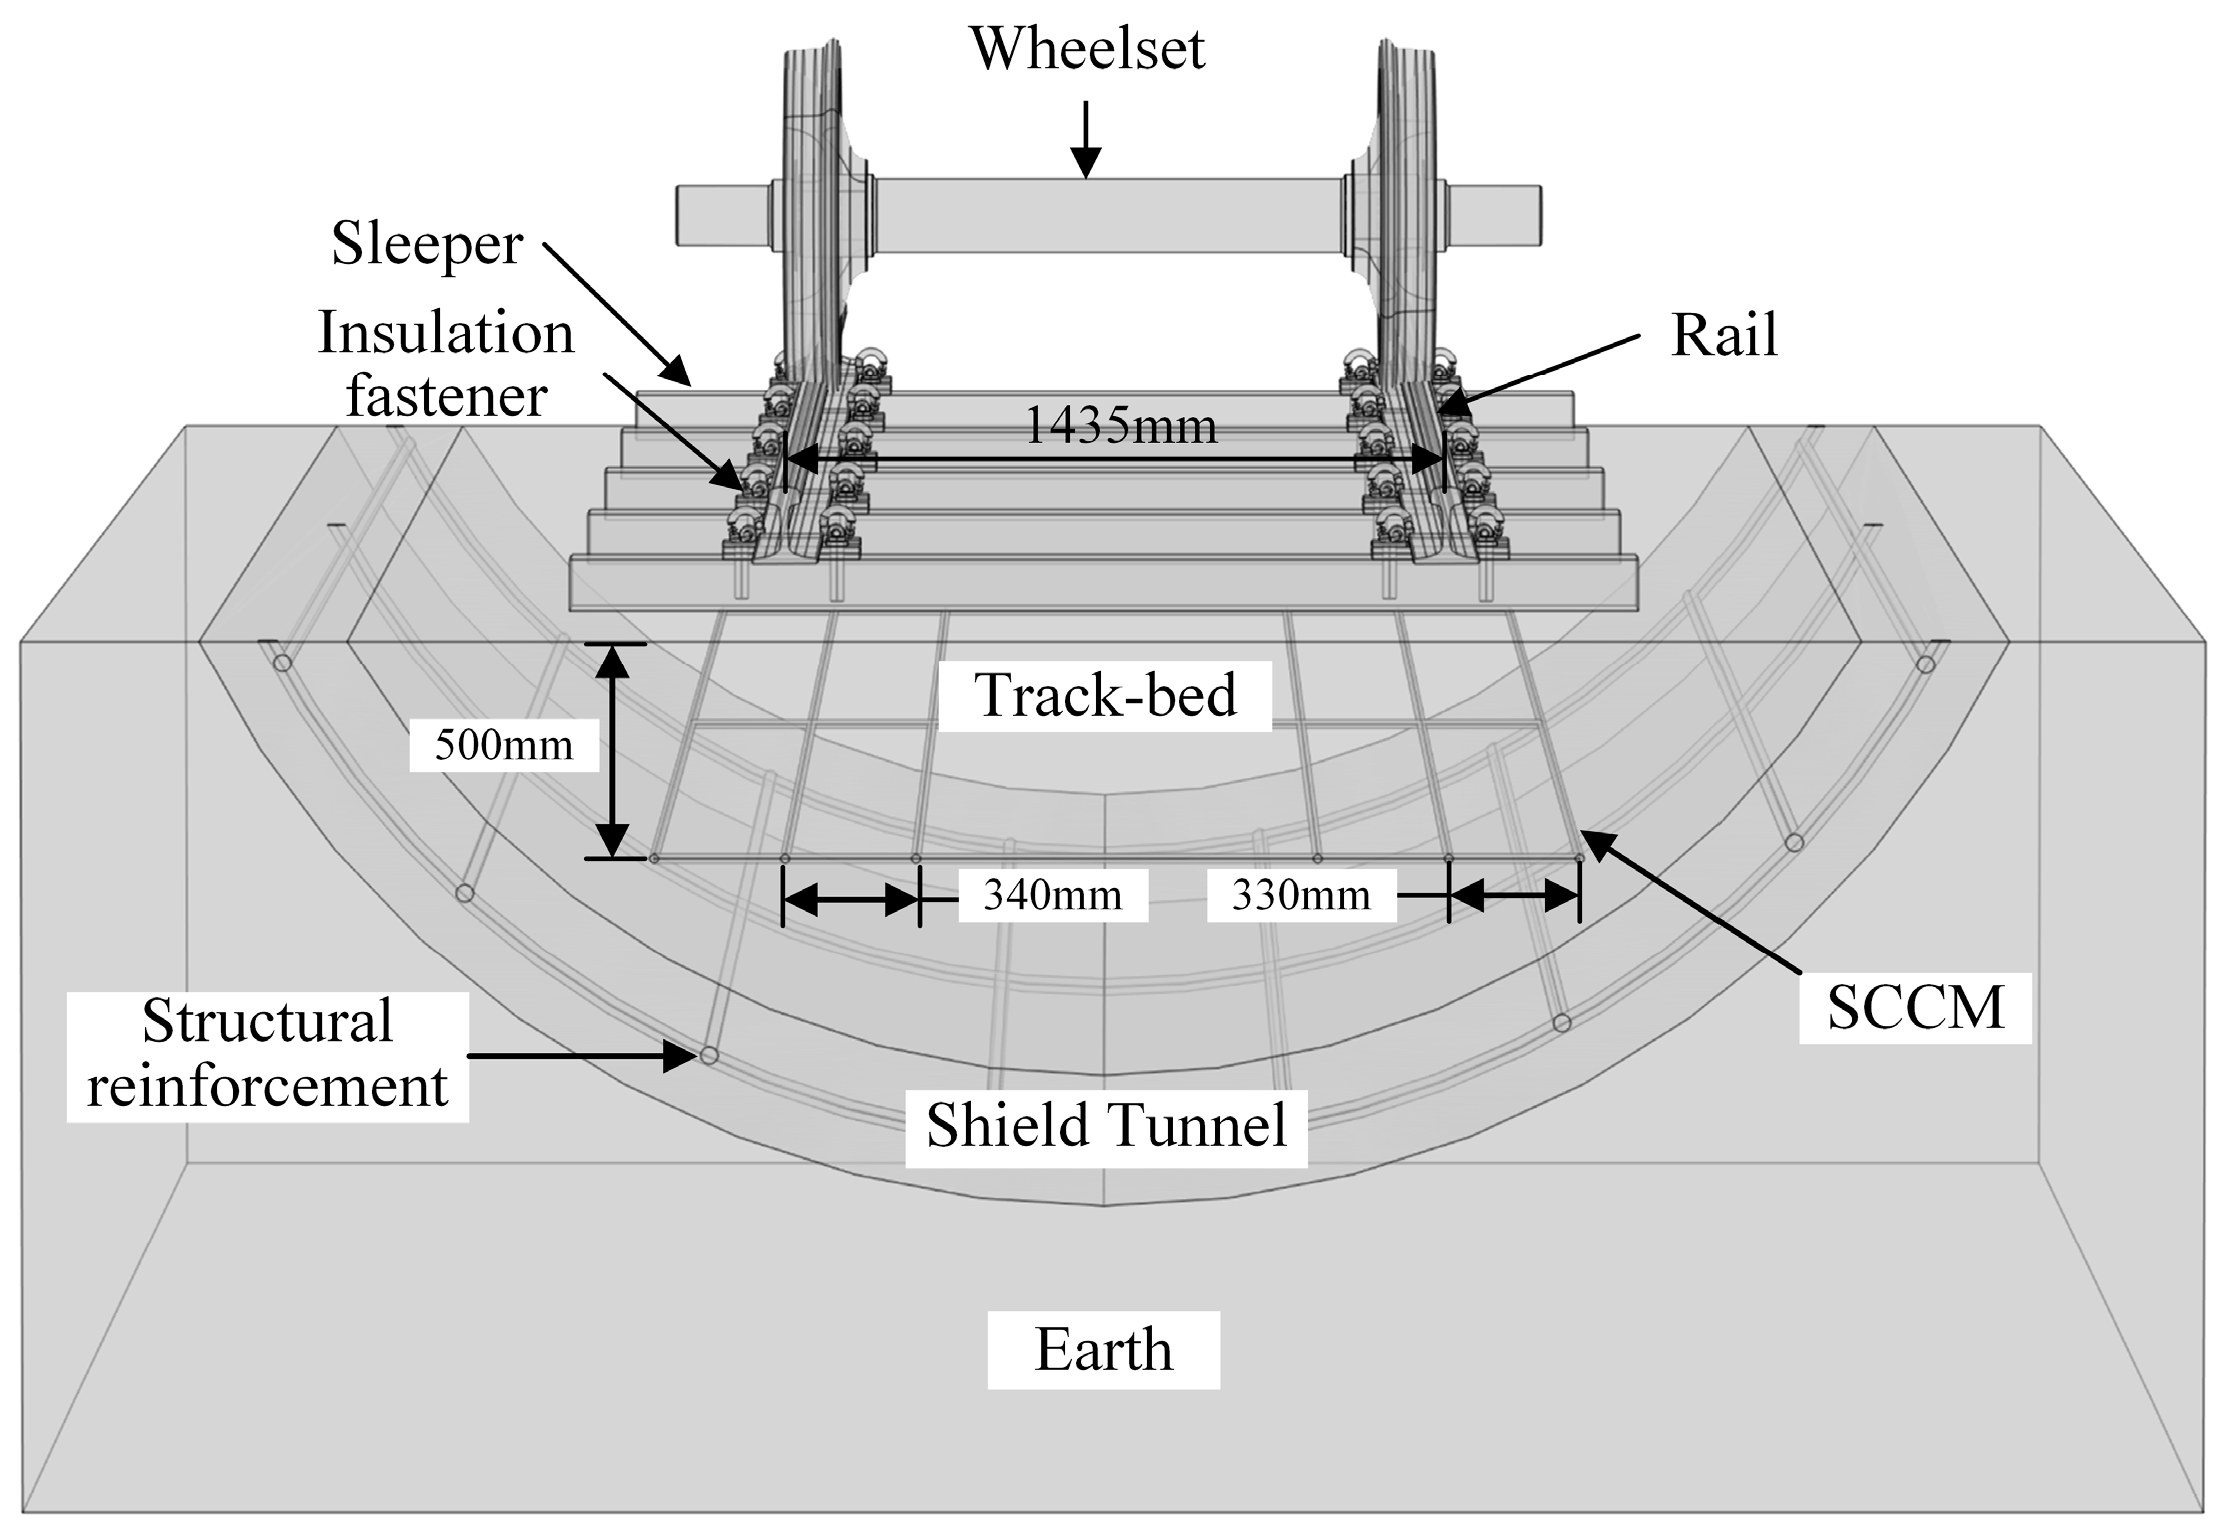
A finite element solution model containing wheels, rails, fasteners, sleepers, track-bed, SCCM, and shield tunnel structure is established, as shown in Figure 4. Among these, the longitudinal structural reinforcement is uniformly distributed along the shield tunnel, the transverse reinforcements are welded to all the longitudinal structural reinforcements every 5 m, and three longitudinal reinforcements of the SCCM are arranged under each rail. The line was constructed using 60 kg/m rails with 1435 mm standard gauges. The wheelset is located directly above the rail and serves as the port of the model to which the DC current excitation is applied. The material properties in the model other than fasteners are shown in Table 1.
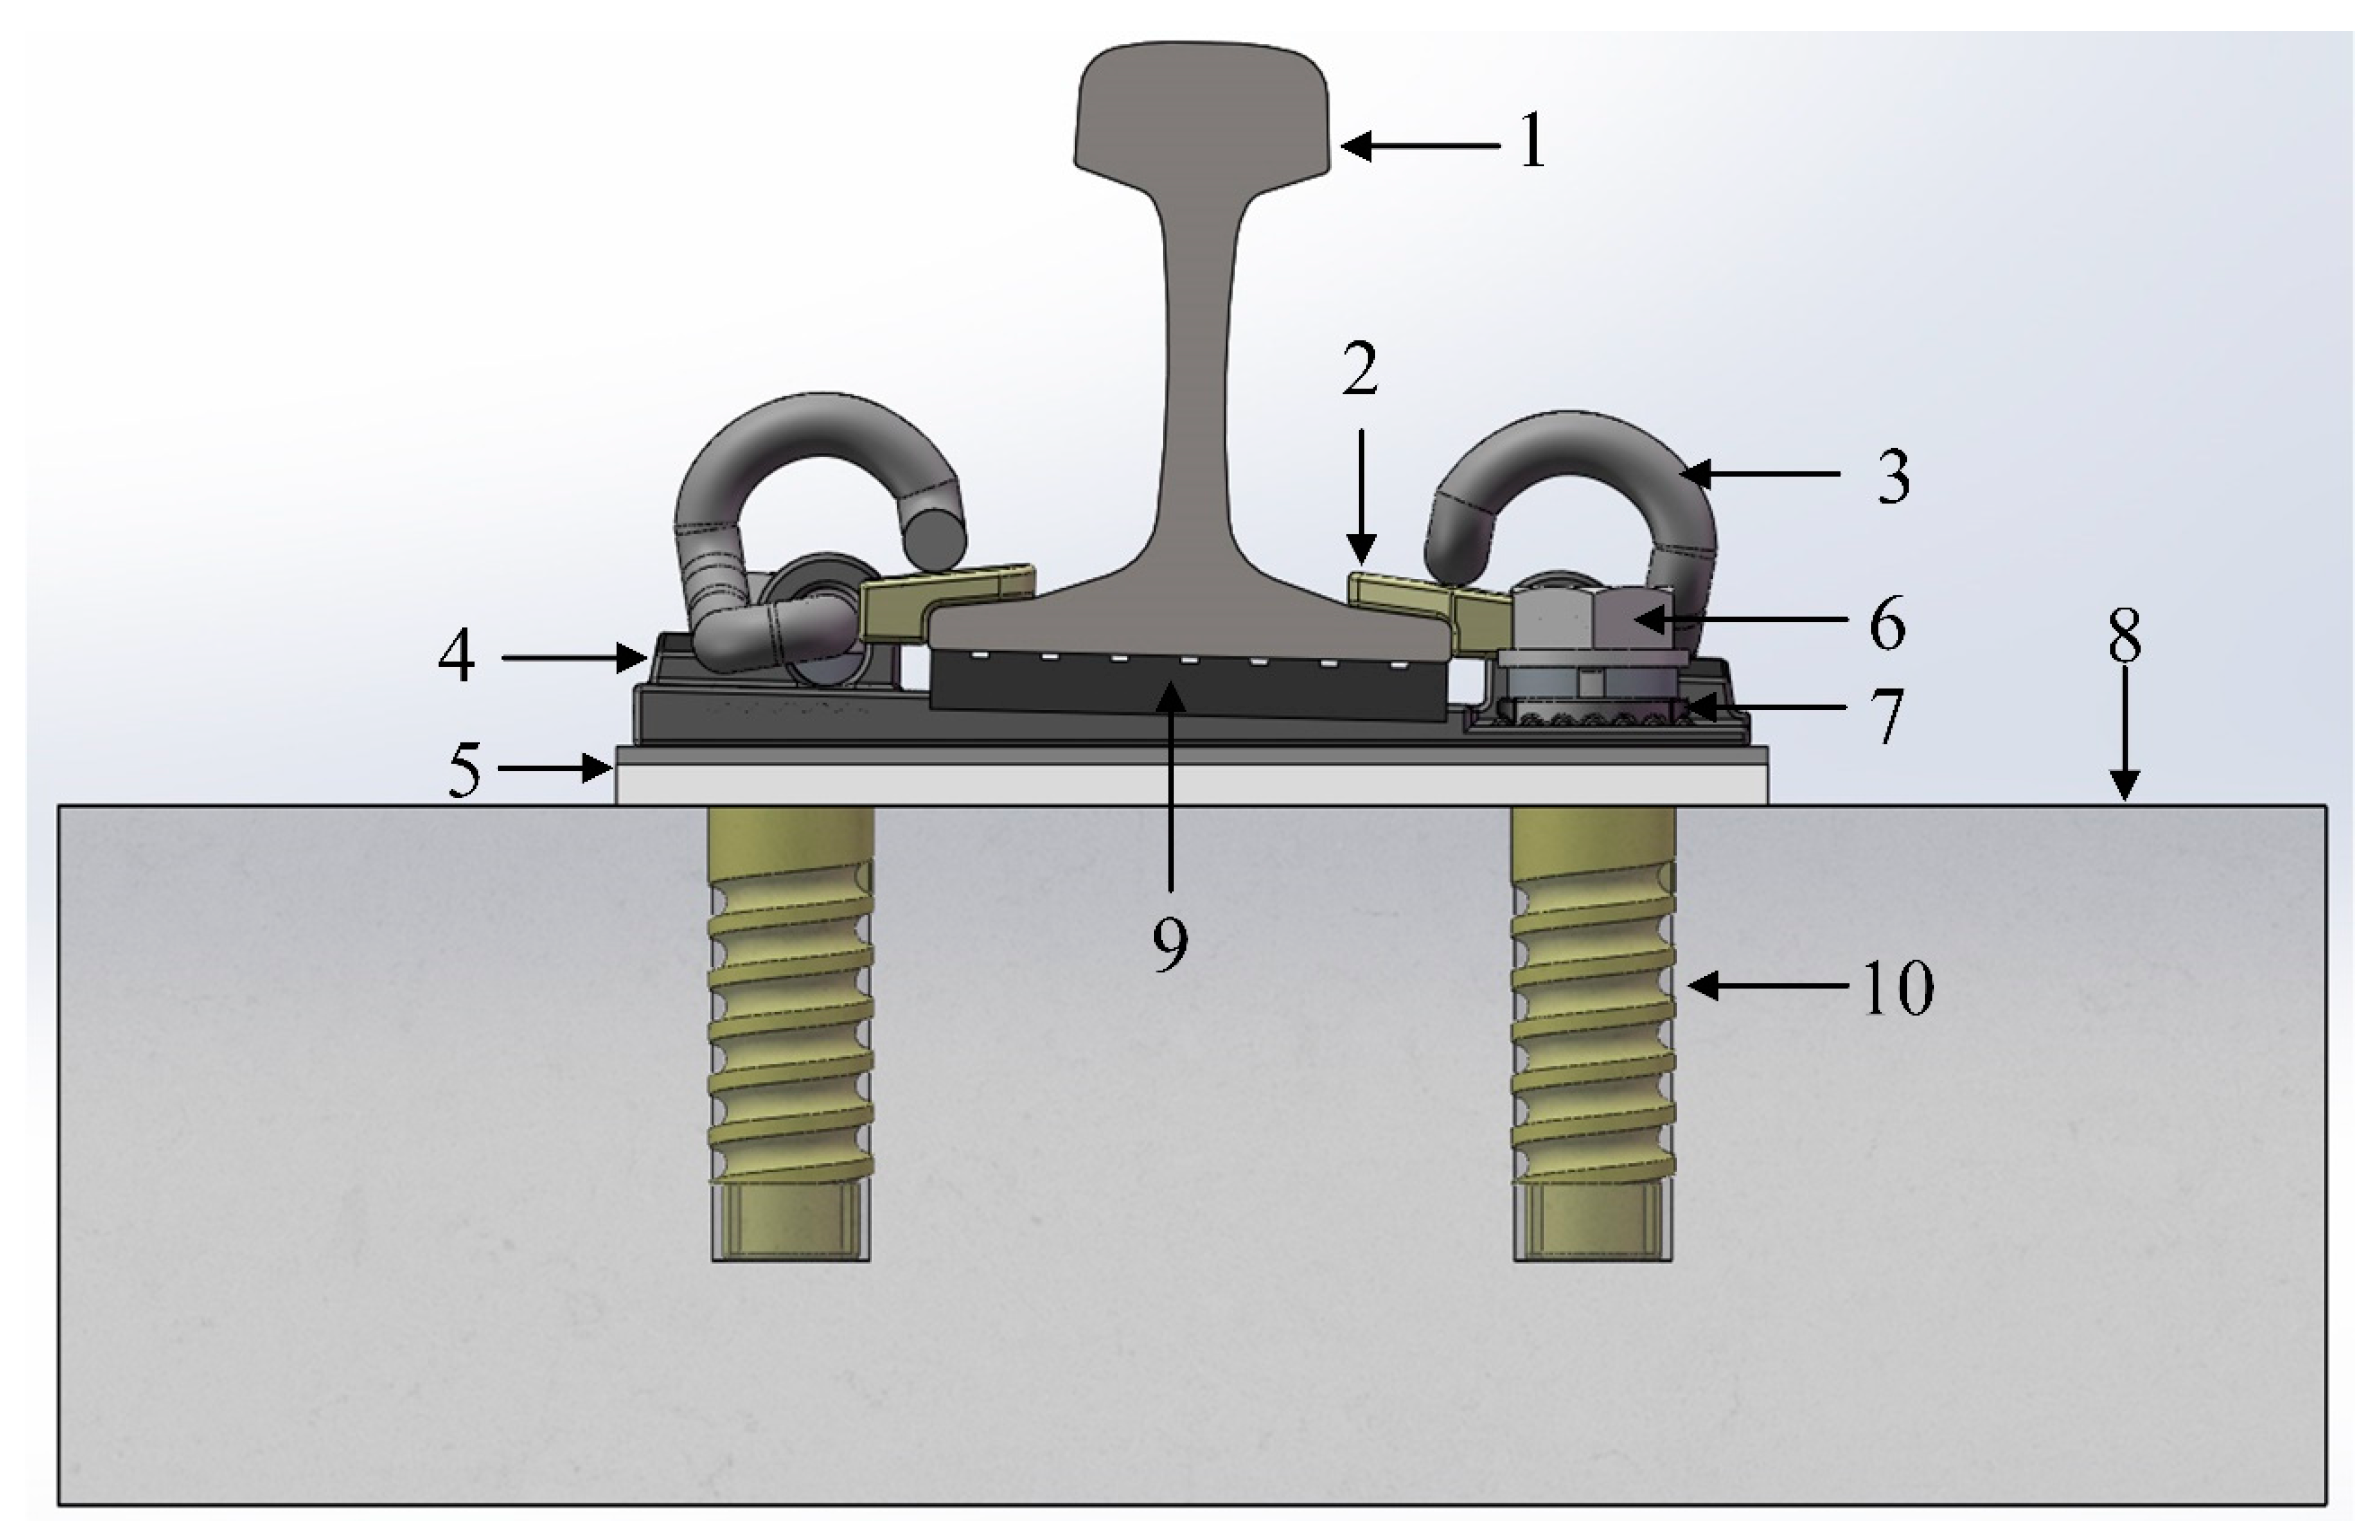
The fastener, as the only rail-to-ground insulation device, is the main source of current leakage at the mainline [23], so the fastener is modeled separately in this paper. At present, elastic bar type III fasteners are widely used in the subway, and the fastener structure in the model is shown in Figure 5. The materials and properties of the type III fastener are shown in Table 2. The fastener is made up of gauge blocks, type III elastic strips, iron tie-plates, under-rail pads, elastic pads, bolts, gaskets, and insulated bushing. Of these, gauge blocks, under-rail pads, and elastic pads are the main insulating devices. Gauge blocks adjust the rail gauge and also isolate the rails from the elastic strips. The under-rail pad reduces the vibration generated when the train passes by, and at the same time avoids the contact edge between the rail and the iron tie-plates. Elastic pads are mainly used to dampen vibration and maintain electrical insulation between the iron tie-plates and concrete sleepers.

3.1.3. Modeling of Resistive Networks

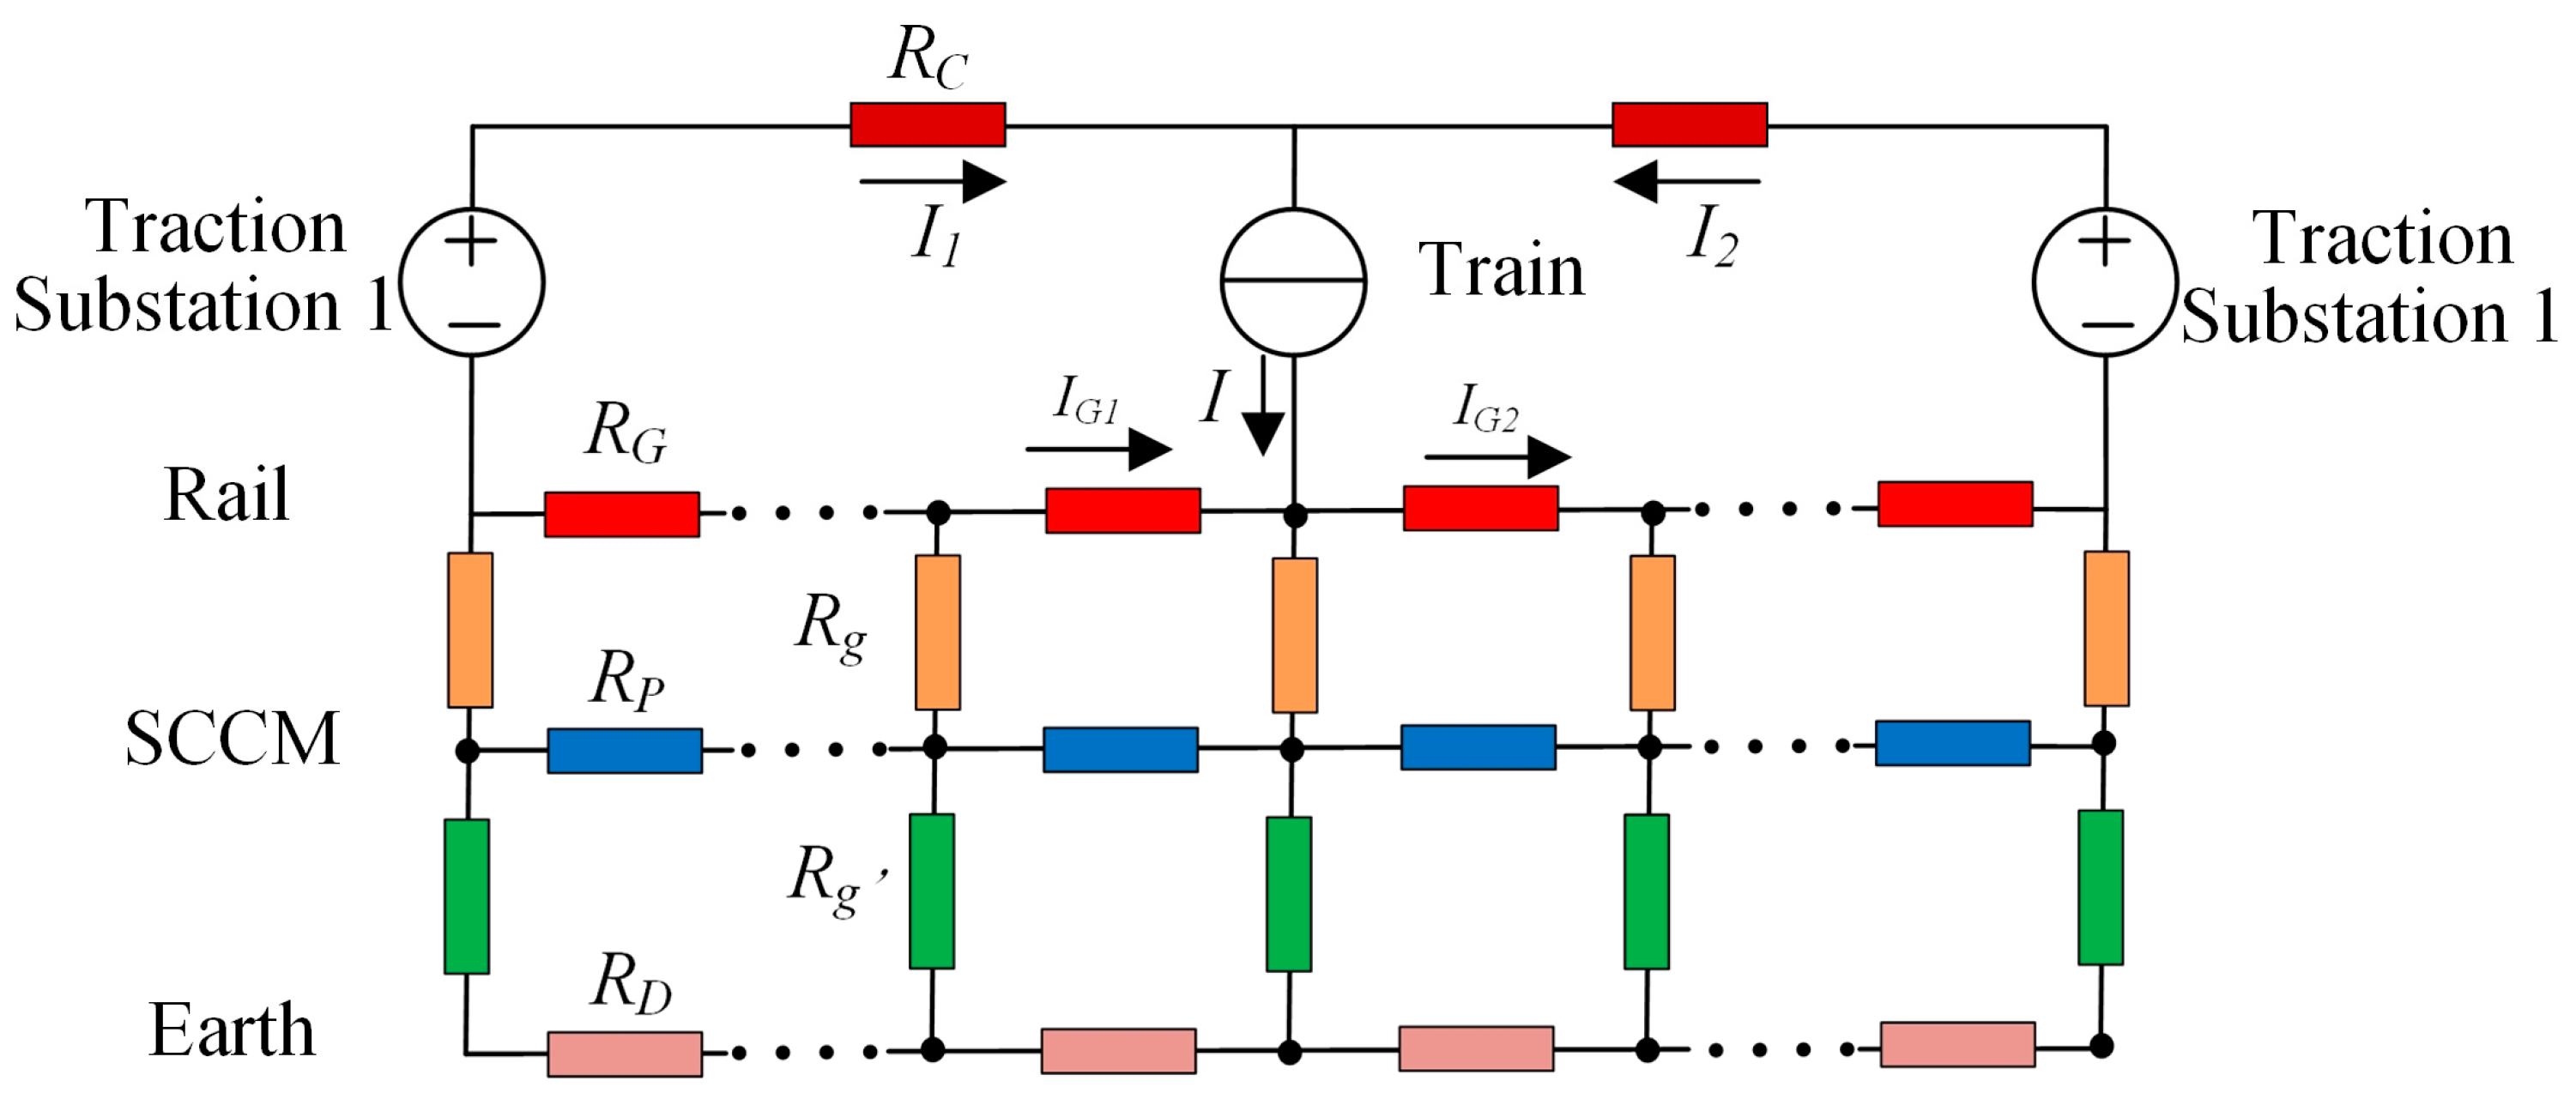
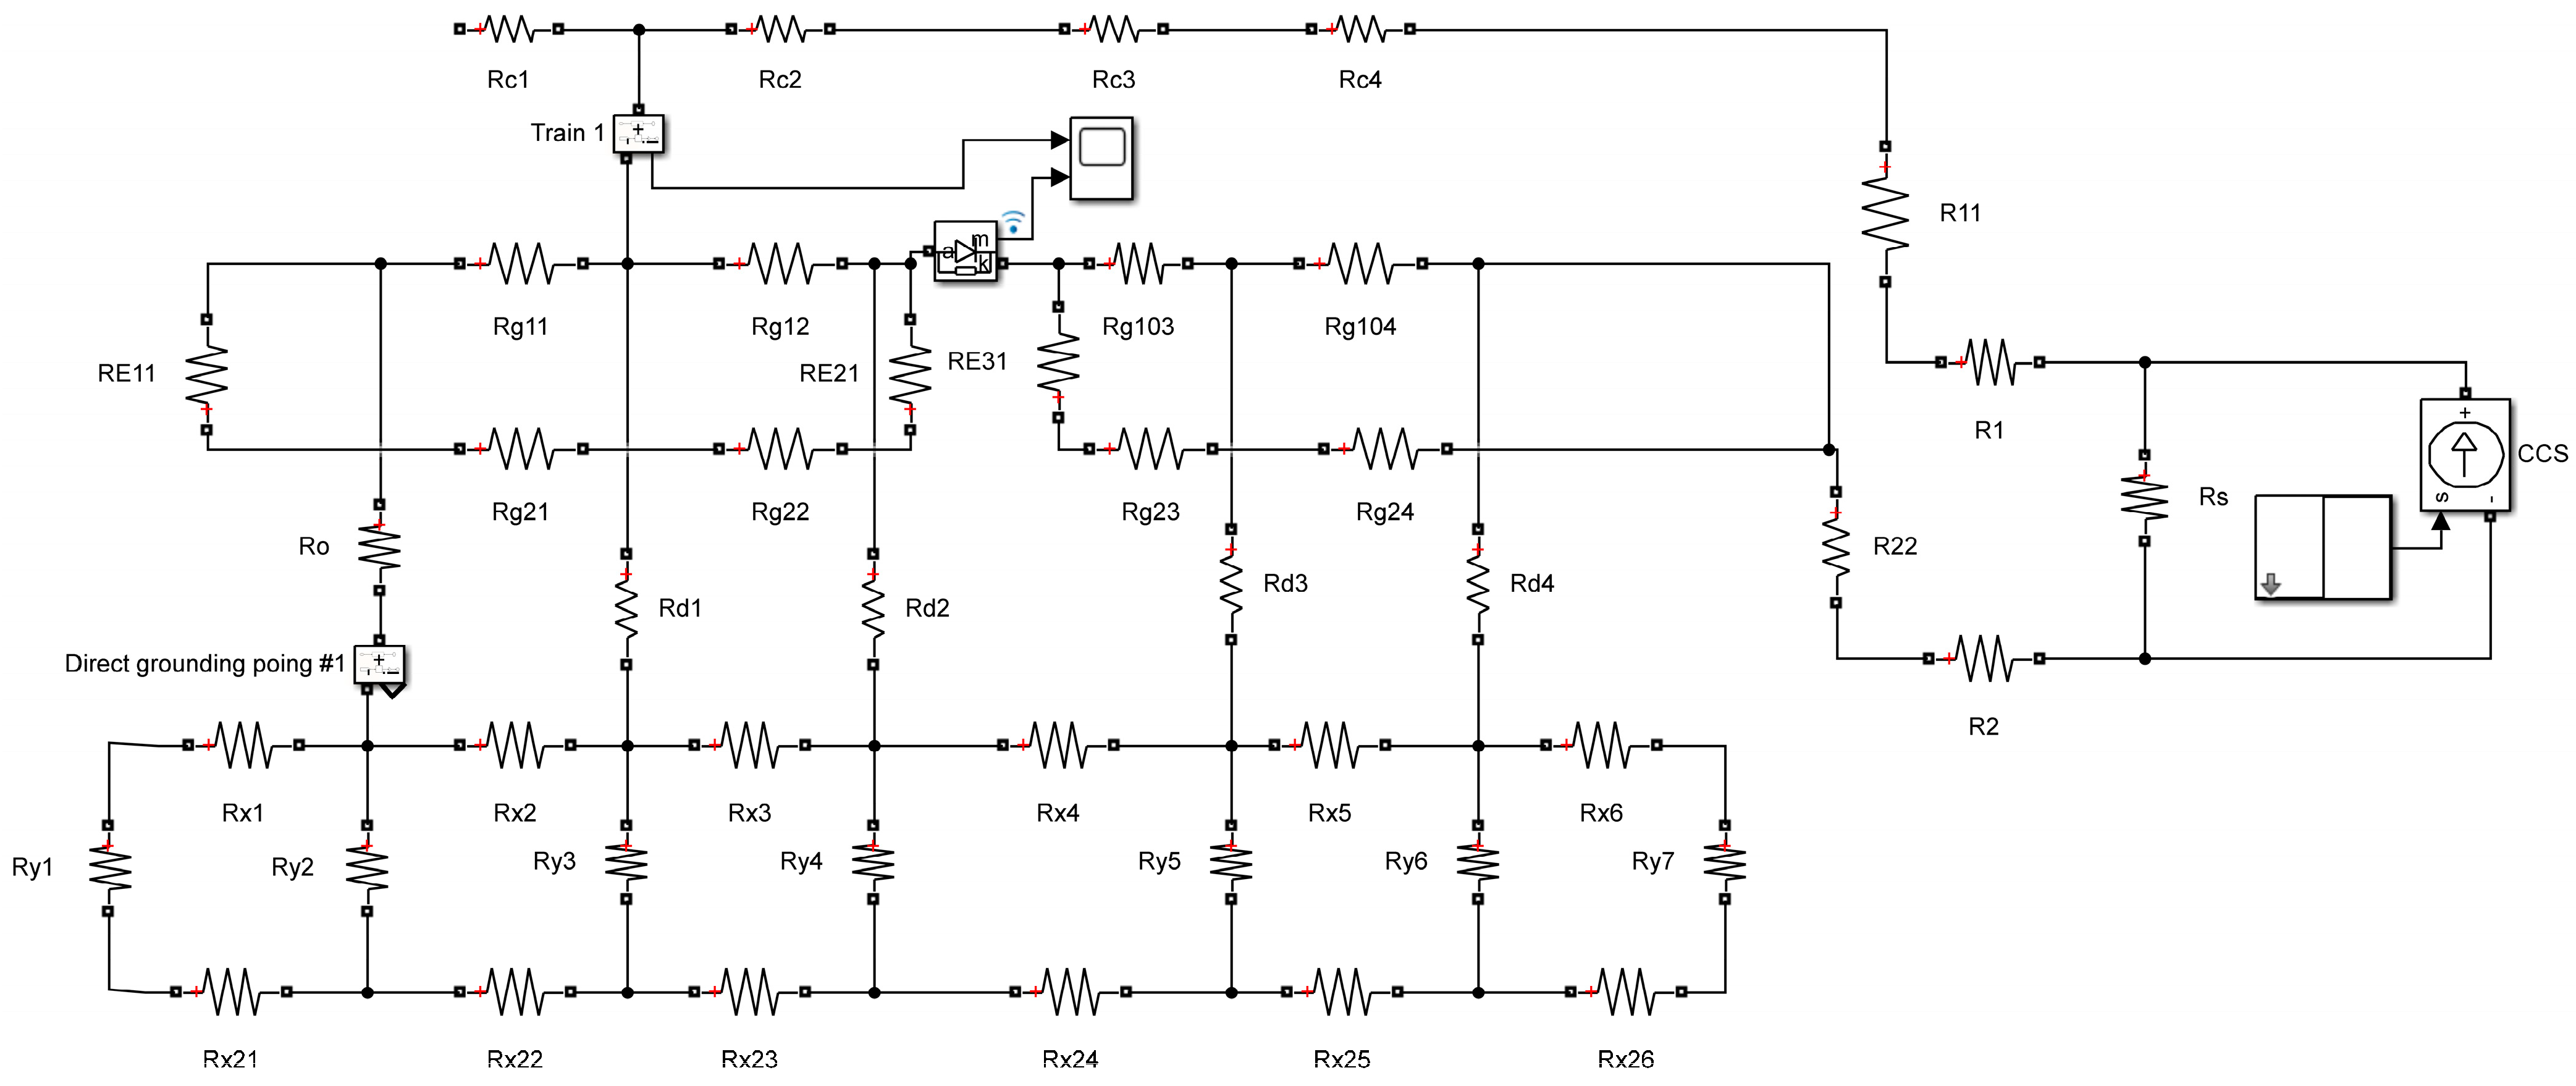
The establishment of a bilateral power supply “rail–SCCM–earth” three-layer resistance network model, based on the circuit Kirchhoff’s law and Ohm’s law calculations to analyze the distribution of stray currents, sets the direction of the current in the reflux system to the right, as shown in Figure 6.
I is the traction current; I1 and I2 are the traction currents supplied to the train by the traction substation. RC is the overhead contact line unit resistance; RG is the rail unit resistance; RP is the SCCM unit resistance; RD is the earth unit resistance; Rg is the rail-SCCM transition unit resistance; Rg’ is the SCCM–earth transition unit resistance. IG1 and IG2 are the train currents flowing in the left and right rails, respectively.

3.2. Modeling of Current Leakage at the Depot

3.2.1. Modeling of Field-Circuit Coupling

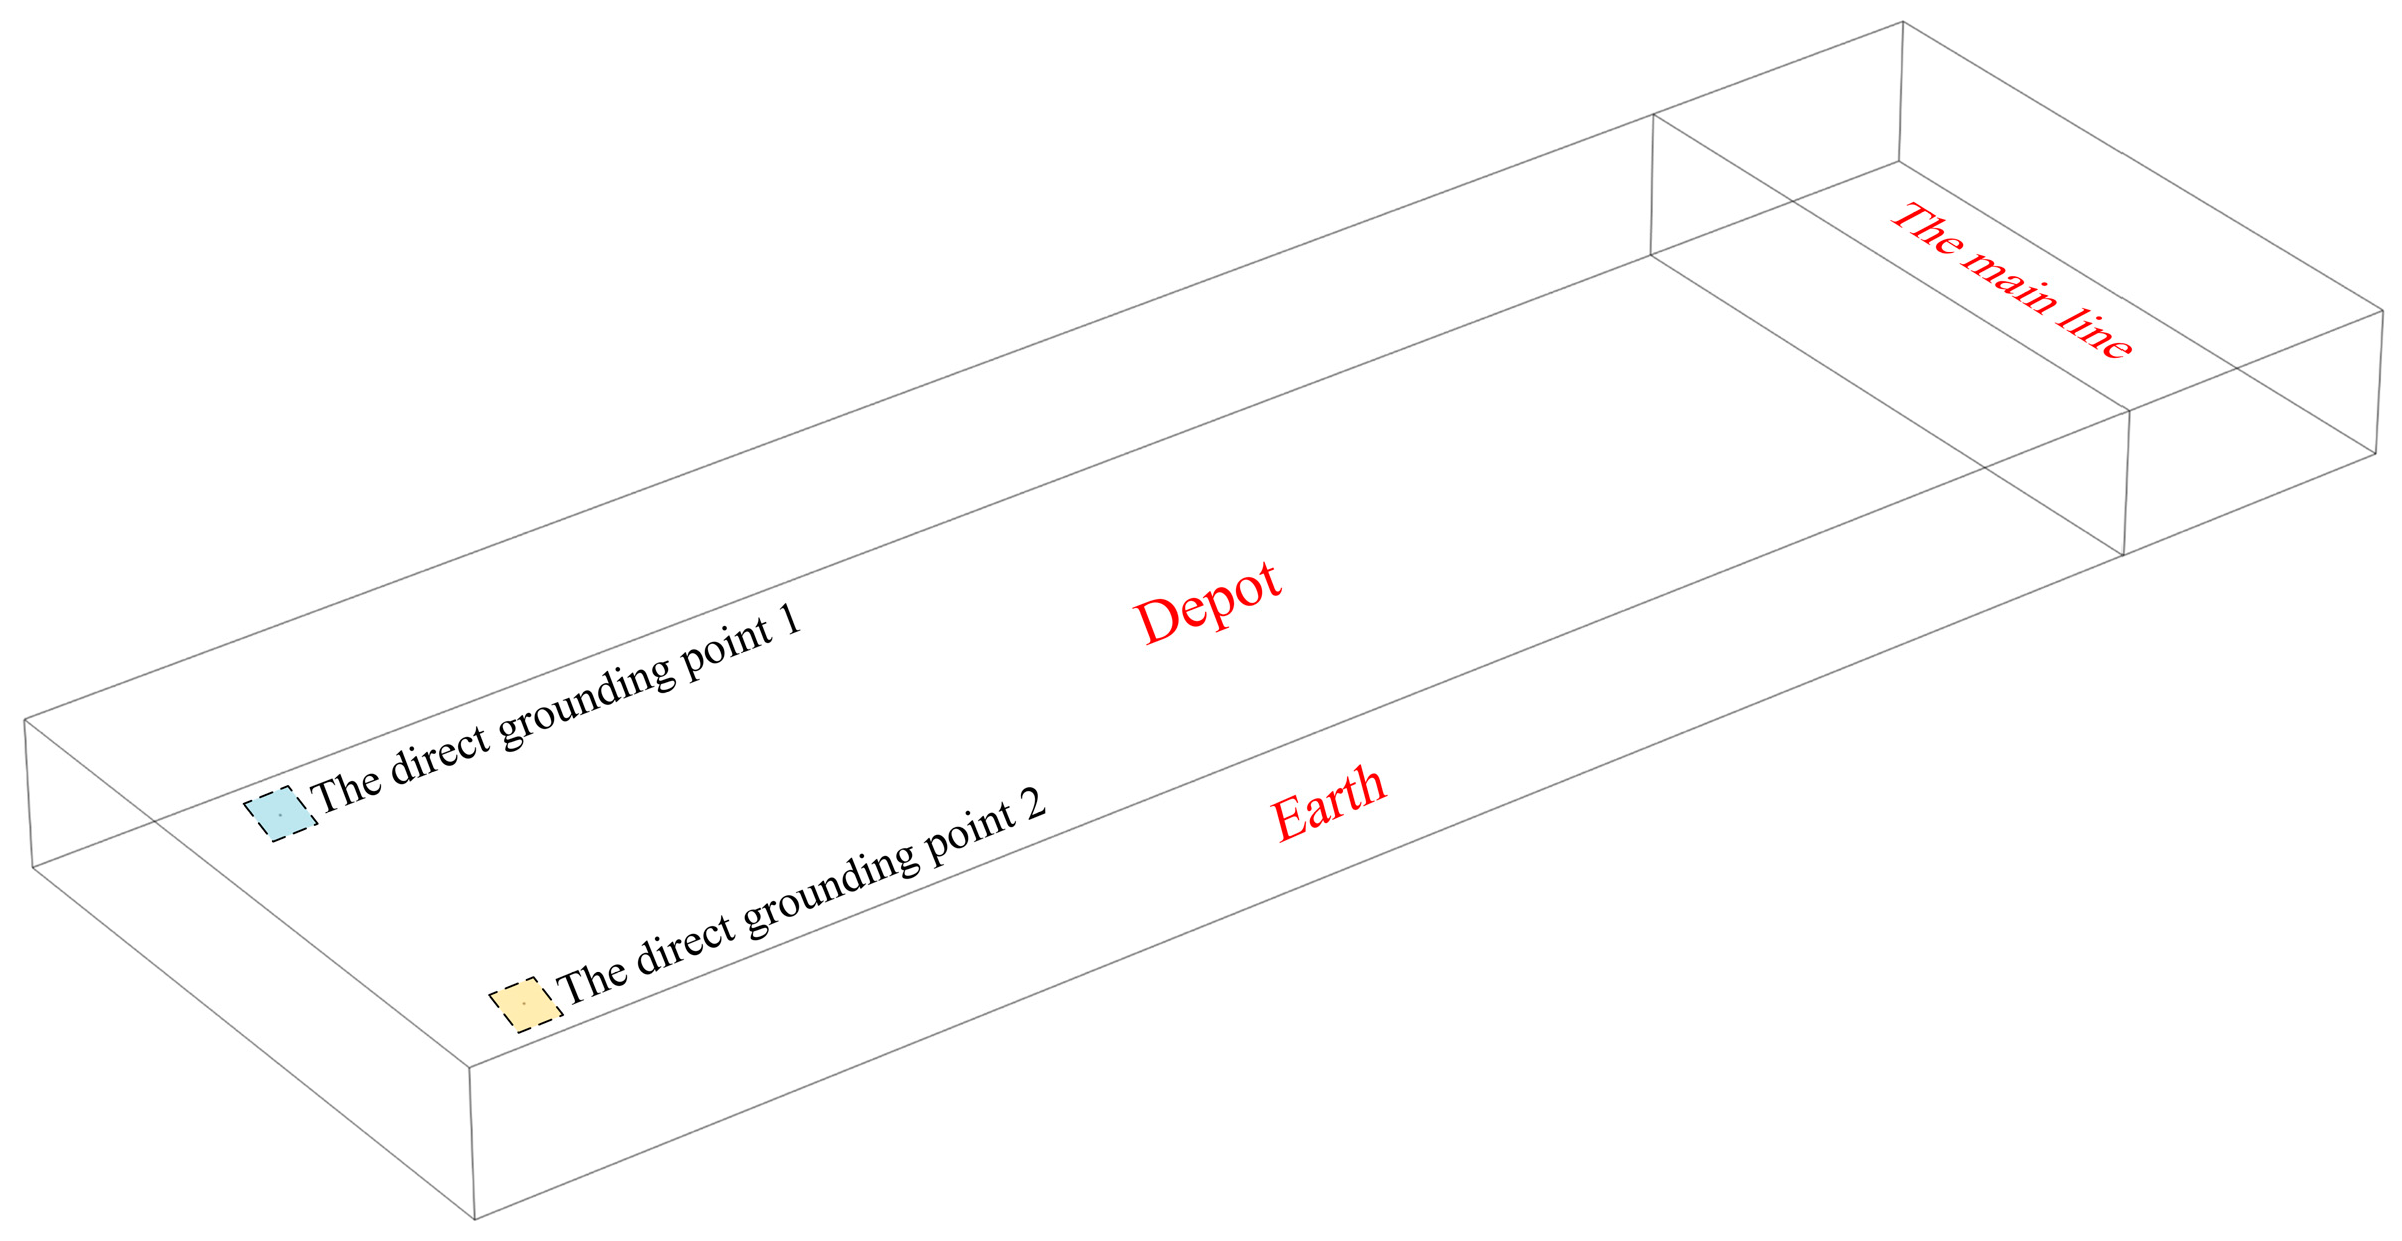
Using the field-coupled method to analyze the subway depot, finite element simulation software is used to establish the finite element solution model including the train, the parking inspection depot, and the line rails outside the depot, a small portion of the mainline rails, a small portion of the mainline SCCM, the one-way conduction device, and the earth. The direct grounding point current obtained from the Simulink resistance network model is used as input to couple with the earth domain finite element simulation model to obtain the field-circuit coupling model of the stray current distribution in the depot, and the overall modeling at the depot is shown in Figure 7.

3.2.2. Modeling of Finite Element Field

The volume of earth is 1400 m × 500 m × 100 m, of which the size of depot is 1200 m × 500 m × 100 m; the size of part of the mainline is 200 m × 500 m × 100 m. The SCCM of the mainline is located at 2 m below the rails of the mainline, and the coordinates of the direct grounding point #1 and #2 are x = 100, y = 180, z = 0; x = 100, y = 450, and z = 0, respectively. Where the earth is set to a constant conductivity factor of 2 × 10⁻² S/m, the conductivity of metals (e.g., rail, SCCM, train, etc.) is set to 3 × 10⁶ S/m, and the conductivity of the sleeper is 1 × 10⁻⁵ S/m. The model is shown in Figure 8.
The direct grounding points #1 and #2 are used as the input boundaries for modeling stray currents in the depot. The lower surface of the earth model is set to 0 potential to simulate the potential at earth infinity, to study the distribution of the corresponding direct grounding point current in the earth domain when the train is running at different positions.

3.2.3. Modeling of Resistive Networks

When dealing with the depot where the ground rail line is closely arranged, it is crucial to consider the boundary conditions when utilizing the resistance network equivalent model. When the boundary conditions are complex, the results of the analytical expression of the stray current distribution are obtained with a huge error. Therefore, in this paper, the analysis has been carried out using resistive equivalence in Section 2, and the calculation of the stray current distribution in the depot has been implemented using Simulink 2019b. Build the equivalent circuit model of traction power supply to the depot, transfer the finite element calculation data to Simulink, and re-feed the waveform and amplitude information to the GUI interface after simulation. The design structure is shown in Figure 9.
The simulation software platform is used to set the parameters of each component and run the data results and current waveforms. After repeated parameter calculations and adjustments to correct the test, accurate data on depot stray currents are obtained. These data serve as the basis for constructing the field-circuit coupling model.

4. Analysis of Results

4.1. Analysis of Current Leakage under Different Insulation Properties of Fasteners at the Mainline

The fastener, as the only rail-to-ground insulation device, is the main source of current leakage on the mainline. This section analyzes the impact of the fastener at the mainline on the current leakage of the rail under 3 insulation conditions.

4.1.1. Fastener Insulation Intact

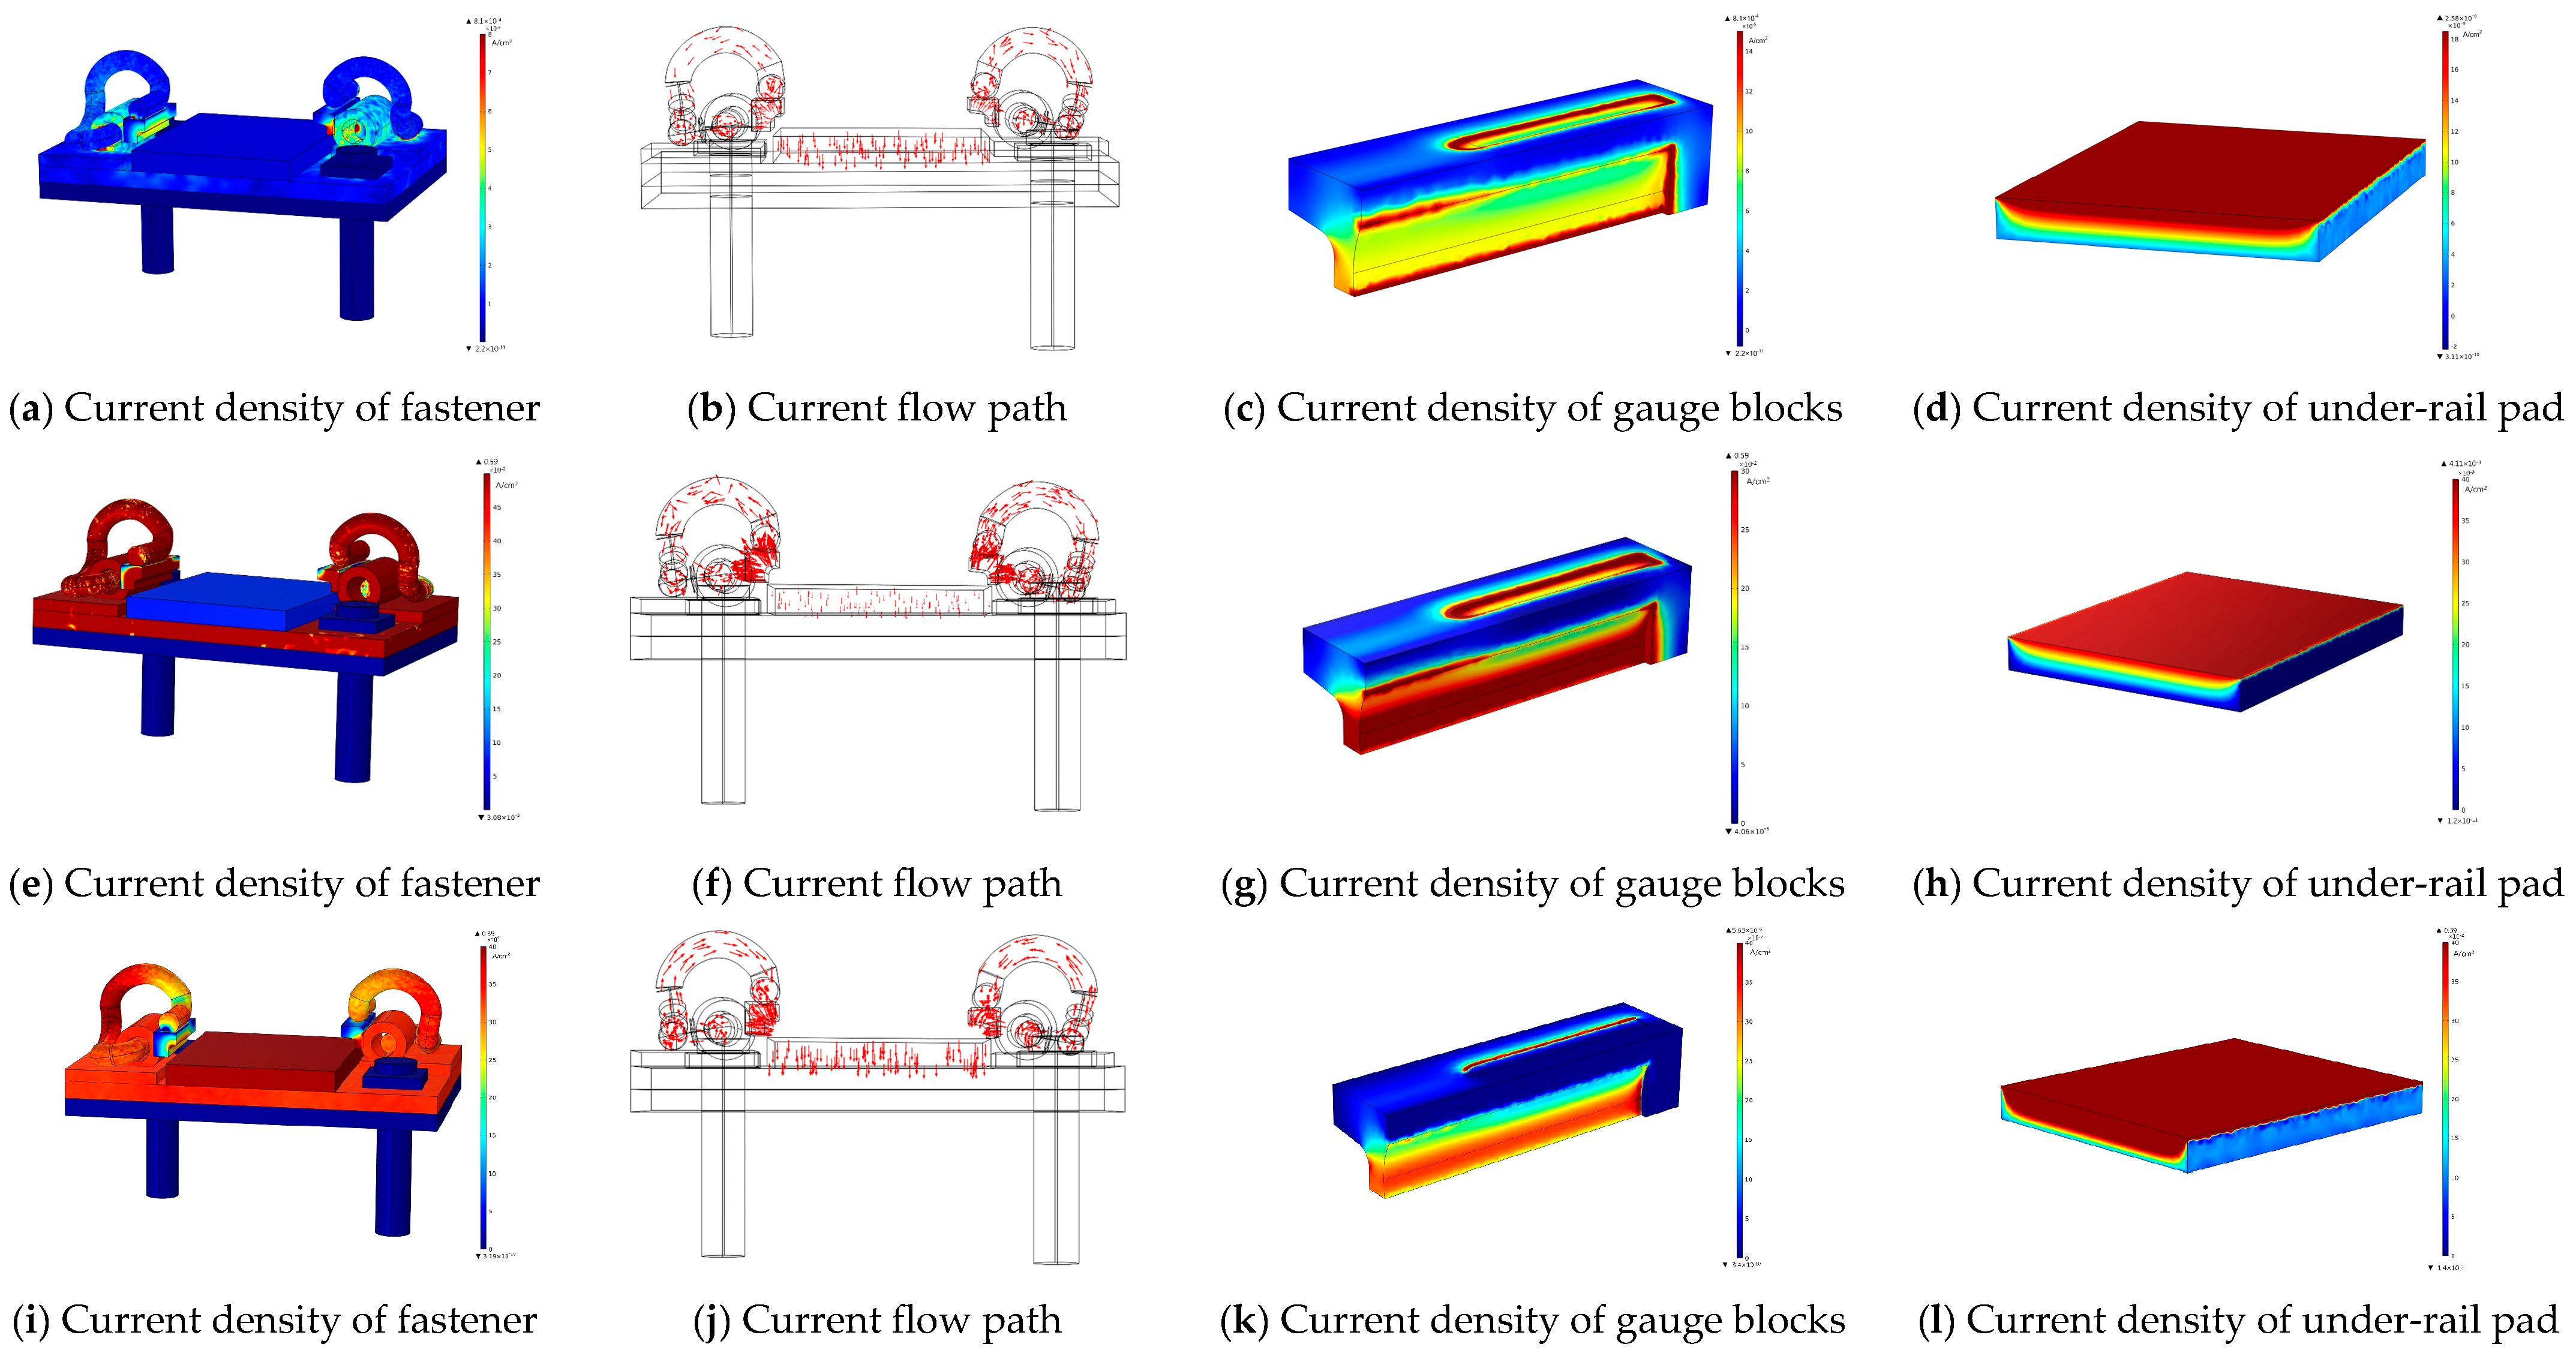
The distribution of current when the fastener insulation is intact is shown in Figure 10a,b. Figure 10a shows the current density of the fastener; the maximum value is 8.1 × 10⁻⁴ A/cm2, located in the direct connection between the gauge block and rail; the minimum value is 2.2 × 10⁻¹¹ A/cm2, mainly concentrated in the elastic pad and rail between the sleeper. As the fastener insulation is intact, the conductivity of each insulating part meets the design requirements, and the overall current density remains low. The current leakage mainly has two paths, as shown in Figure 10b. One is through the gauge block, and the second is through the under-rail pad, circulating to the iron tie-plate, elastic pad, sleeper, and track-bed. Since the conductivity of the gauge block at room temperature is higher than that of the under-rail pad, the current flow arrows of the gauge block in Figure 10b are more intensive.
Since the insulating materials are in direct contact with the rail, analyzing the current density of the gauge block and the under-rail pad helps in understanding the distribution of rail leakage. The current density distributions of the gauge block and the under-rail pad are shown in Figure 10c,d when the train has been running for 20 s. The current density modes of the gauge block and the under-rail pad are shown in Figure 10c,d. Figure 10c shows the current density mode distribution of the gauge block, with a maximum value of 8.1 × 10⁻⁴ A/cm2. Figure 10d shows the distribution of the current density mode of the under-rail pad, and the maximum value is 2.58 × 10⁻⁸ A/cm2. It can be seen that the current density mode of the gauge block is much larger than that of the under-rail pad, which indicates that when the insulating property of the rail fasteners is intact, the current leaking from the rails is mainly conducted from the gauge block to the iron tie-plate. Therefore, the stray current density of the fastener leakage is roughly equivalent to the current density mode of the gauge block.

4.1.2. Gauge Block Insulation Failure

The surface resistance of the gauge block decreases due to humidity, water leakage, pollution, and other factors. At the same time, the train running back and forth will bring long-term stress and vibration to the gauge block, which will lead to ruptures and internal insulating property damage and accelerate aging. Considering these factors together, the insulating performance of the gauge block will be seriously degraded, and it is difficult to ensure rail-to-ground insulation. According to stray current protection regulations [24], the DC conductivity threshold of the gauge block is 1 × 10⁻⁸ S/m, which is higher than this threshold, indicating that it cannot meet the normal rail-to-ground insulation. When the conductivity of the gauge block decreases to 1 × 10⁻⁵ S/m, it indicates a serious failure of its insulating effect. Therefore, in this paper, the conductivity of the fastener gauge block at 535 m from station A in the mainline is changed from 1 × 10⁻¹⁰ S/m to 1 × 10⁻⁵ S/m, to simulate the serious failure of the insulating effect of the gauge block at this location and analyze its effect on the current leakage of the rail.
Figure 10e,f demonstrate the fastener current density distribution during the 20 s of train operation. As shown in the fastener current density graph in Figure 10e, the current densities at the gauge block, iron tie-plate, and elastic strip are larger, and the maximum value is located on the inner side of the gauge block, which is 0.59 A/cm2. When the gauge block insulation is severely compromised, it exacerbates the current leakage into the gauge block, with a corresponding increase in current density at the iron tie-plate and elastic strip. The flow path is depicted based on the ratio of current density values in each part of the fastener, as illustrated in Figure 10f. It shows that the gauge block becomes the main path for current leakage, and the current density arrows become dense, while the current density arrows at the under-rail pad become sparse.
When the gauge block insulation fails, the current density mode of the gauge block and the under-rail pad is shown in Figure 10g,h. As can be seen from the figure, the maximum value of the gauge block current density mode is 0.59 A/cm2, and the maximum value of the under-rail pad current density mode is 4.11 × 10⁻⁸ A/cm2. The significant difference of five orders of magnitude between the two values indicates that when the gauge block fails, its current density mode is primarily responsible for the stray current density of the rail leakage.

4.1.3. Under-Rail Pad Insulation Failure

The under-rail pad is exposed to the air, contaminated and affected by underground water seepage, or subjected to long-term overload stress leading to aging and cracking, resulting in a reduction of surface resistance and a decline in the internal insulating properties, affecting the level of insulation between the rail and the earth. According to stray current protection regulations, the DC conductivity threshold is 1 × 10⁻⁸ S/m, and when the conductivity drops to 2 × 10⁻⁶ S/m, the insulation of the under-rail matting fails seriously. Therefore, in this paper, the conductivity of the fastener under-rail pad at 535 m from station A in the model line is changed from 1.587 × 10⁻¹² S/m to 2 × 10⁻⁶ S/m to simulate the effect of the serious failure of the under-rail pad’s insulating performance on the leakage current of the rails at this location.
The distribution of fastener current density when the train has been running for 20 s is shown in Figure 10i,j. Figure 10i shows that the current density at the under-rail pad, iron tie-plate, and elastic strip is larger, of which the current density at the upper surface of the under-rail pad is the largest, reaching a maximum value of 0.39 A/cm2. The current density at the gauge block is small. The current path is plotted according to the ratio of current density values in each part of the fastener, as shown in Figure 10j. After the failure of the under-rail pads, the under-rail pad becomes the main path of current leakage, and their current density arrows are denser. The conductivity of the gauge block is smaller compared to the elastic pad, so some of the current will flow through the iron tie-plate-elastic strip and then converge at the gauge block.
When the insulation of the under-rail pad fails, the current density modes of the gauge block and under-rail pad are depicted in Figure 10k,l. It can be seen that the maximum value of the gauge block current density mode is 5.63 × 10⁻⁶ A/cm2, and the maximum value of the under-rail pad current density mode is 0.39 A/cm2. The difference between the two values is 5 orders of magnitude, so when the under-rail pad fails, it is mainly believed that the under-rail pad current density mode is used as a leakage current density of the rail.

4.2. Analysis of Current Leakage under Different Positions of Trains at the Depot

This section analyzes the stray current distribution law in the depot of the train in 4 different positions, as shown in Table 3, modeled using the field-circuit coupling method proposed in this paper.

4.2.1. The Train in the Inner Zone of the Depot

For safety, trains departing from inside the garage have lower speeds and lower traction currents. In this paper, for example, a train on the P3 parking line is assumed to run from the end of P3 (x = 100 m, y = 180 m) to the depot entrance (x = 380 m, y = 180 m) assuming that the traction current is kept at 300 A.
To make the calculation clearer and easier to analyze, the data are logarithmically processed, as shown in Figure 11a. When the train is located at x = 200 m, y = 180 m at the inner zone of the depot area, the maximum value of stray current is 1.39 A/m2, located in the direct grounding point #1; the minimum value of stray current is −1.58 A/m2, located in the direct grounding point #2. At the end of the depot, the stray currents are relatively large and are concentrated at the direct grounding points #1 and #2. Outside the depot, the stray currents in the earth are small. From the figure, it can be seen that the stray currents flow in the earth diverge at the end of P3 but collect at the end of P6. It can be inferred that this is because the running rails of P3 and P6 are directly grounded at the end, and OWCD#2 is in conduction at the same time, which provides a return path with better conductivity, allowing the current to mainly leak from the ground at P3 and be absorbed by the ground at P6.

4.2.2. The Train in the Outer Zone of the Depot

As the train runs in the outer area of the depot, it begins to speed up and the traction current increases. As an example, a train on P3 in front of the depot is assumed to keep the traction current at 450 A. The train runs from the entrance of the depot (x = 380 m, y = 180 m) to the exit of the depot (x = 1200 m, y = 250 m).
When the train is located at x = 600 m and y = 180 m, the same logarithmic treatment is applied to the data, and the distribution of stray current in the depot is shown in Figure 11b. When the train is located in the outer zone of the depot, the maximum value is 7.38 × 10⁻³ A/m2, which is located at the direct grounding point #2, and the minimum value is −1.29 × 10⁻³ A/m2. The value of the stray current on the earth’s surface is generally small, with most of the stray currents being concentrated at the direct grounding point #2. It can be seen that when the train operates in the outer zone of the depot, the stray currents in the earth are pooled into the direct grounding point #2 inside the depot.

4.2.3. The Train on the Mainline

The speed of the train is further increased when it runs on the mainline, and the traction current gets even larger. Taking a train at P3 in front of the depot as an example, assuming that the traction current is kept at 1500 A, the train runs from the exit of the depot (x = 1200 m, y = 250 m) to the first section of the partial mainline (x = 1400 m, y = 250 m).
When the train is located at x = 1300 m and y = 250 m, the data are also logarithmically processed, and the stray current distribution in the depot is shown in Figure 11c. The maximum value is 0.03 A/m2 and the minimum value is −5.37 × 10⁻³ A/m2 when the train is located at the mainline. The cathode of OWCD#3 is connected to the rails of the mainline and is subjected to a reverse voltage up to the point. The current on the mainline cannot enter the depot through OWCD#3, but stray currents leak into the earth pass through the structural reinforcement of the depot, converge at the direct grounding points #1 and #2, and flow into the depot rails. It can be seen that the currents on the earth’s surface mainly converge at the direct grounding points #1 and #2 in the inner zone of the depot. Since the OWCD#3 cutoff, the stray current in the mainline propagates mainly through the earth to the direct grounding point, so the currents on the earth’s surface in the outer zone of the depot are low.

4.2.4. Two Trains in the Depot

To simulate a realistic stray current distribution in the depot, two trains are considered as running in different states. Train 1 is located at x = 400 m, y = 180 m, with a traction current of 420 A, in the acceleration state; Train 2 is located at x = 1200 m, y = 250 m, with a traction current of −420 A, in the deceleration state.
The same logarithmic process is applied to the data, and the stray current distribution in the depot is shown in Figure 11d. When there are two trains in the depot, the maximum value of stray current is 0.17 A/m2, which is located directly under train 1; the minimum value is −0.15 A/m2, which is located directly under train 2. Since the leakage current at traction train 1 is positive and the leakage current at braking train 2 is negative, the energy of the braking train is fed back to the traction train. In this case, all OWCDs are cut off, the magnitude of stray currents is greatly reduced, and the stray currents are mainly distributed on the ground from the vicinity of the traction train to the braking train. It can be seen that the leakage current dissipates at traction train 1 and converges at braking train 2. Since all the unidirectional conductors are reverse cutoff, there is no current dissipation or convergence at the direct grounding points #1 and #2.

5. Discussion

5.1. Discussion of the Situation at the Mainline

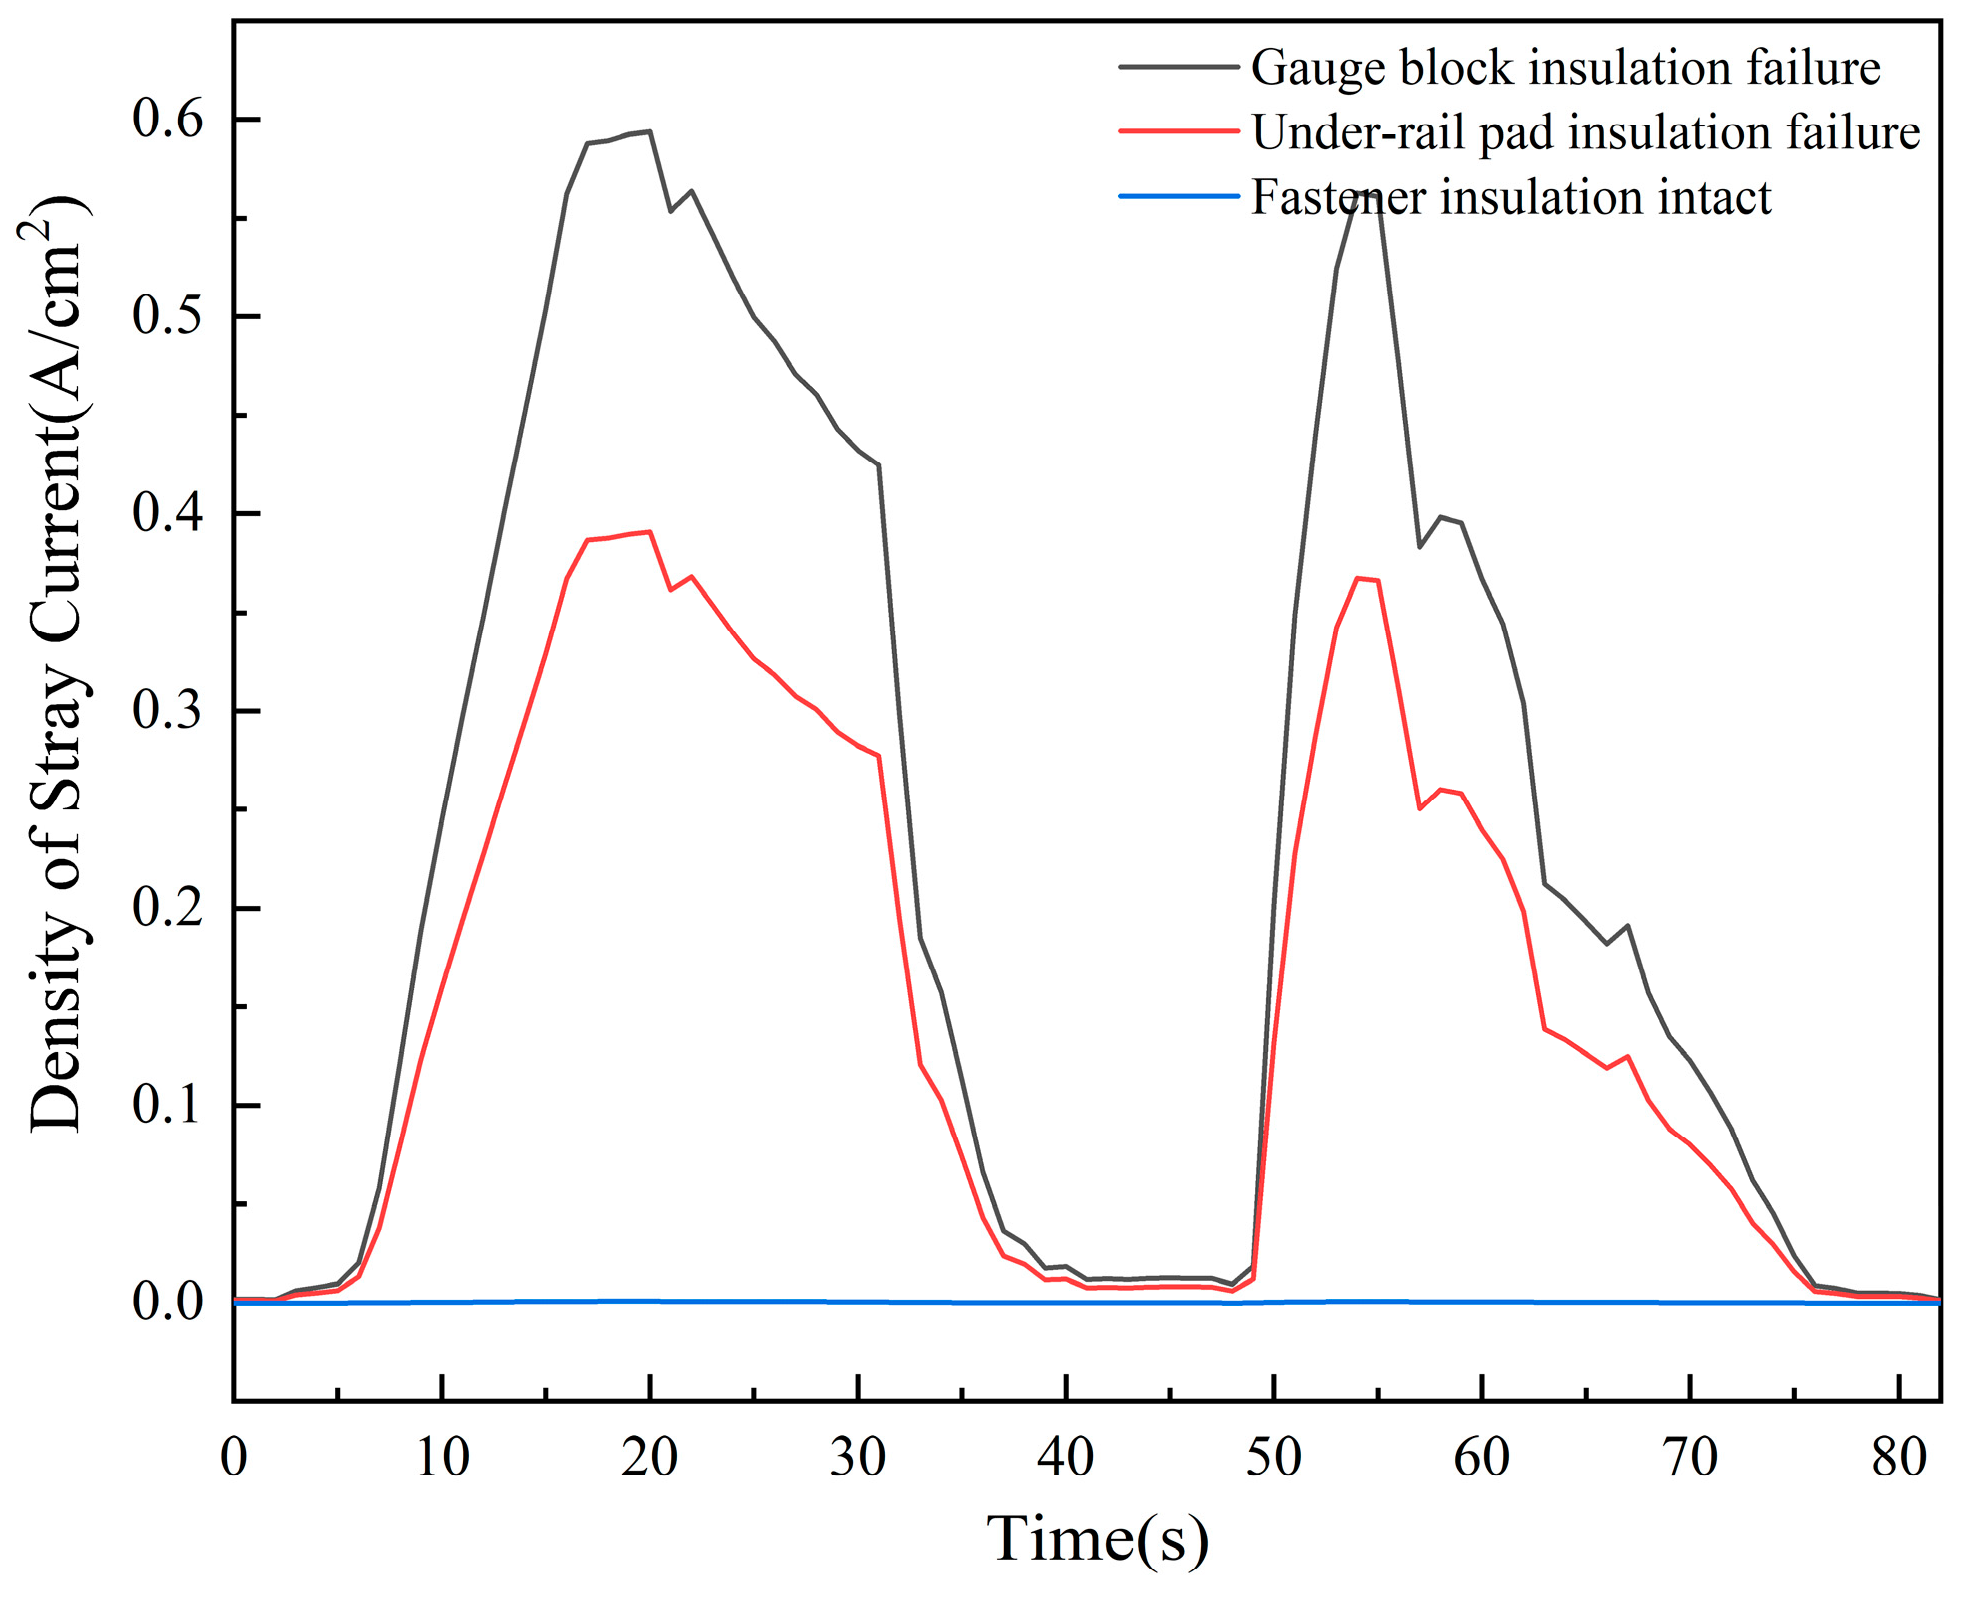
The stray current leakage of the fastener under three insulation conditions is shown in Figure 12. The current density mode of the fastener gauge block at 535 m from station A is chosen as the stray current leaking from the rail, and the current leaking from the rail when the train runs from station A to station B is obtained. When the fastener insulation is intact and the train has been running for 20 s, the leakage current tends to be close to 0. However, when the gauge block insulation fails due to aging or other factors, causing serious insulation failure, the leakage current value increases dramatically. During a 20-s run of the train, the positive traction current is the largest, with the current density reaching 0.59 A/cm2. Conversely, during a 55-s run, the traction current is negatively the largest, with the current density reaching 0.56 A/cm2 at its maximum value. When the under-rail pad board surface is covered in dirt or experiences aging cracking, its internal insulation performance declines. During a 20-s train run, the positive traction current is large, with the current density reaching up to 0.39 A/cm2. In a 55-s run of the train, the negative traction current is large, with the current density reaching up to 0.36 A/cm2.

5.2. Discussion of the Situation at the Depot

The stray currents are mainly concentrated at direct grounding point #2 when the train is located in the inner zone of the depot, as compared to when the train is located in the outer zone of the depot. Since the OWCD of the parking line P1-P3 is subjected to a counter voltage and cutoff, the current flow path is cut off by the OWCD, resulting in small stray currents at direct grounding point #1.
While the train is located in the mainline, the current primarily leaks through grounding points #1 and #2. Compared with the train located in the depot, the leakage current from the rail is reduced. This reduction is due to the OWCD withstanding the reverse voltage, preventing the return current on the mainline from flowing through the OWCD into the depot. However, some stray currents leak to the earth through the structural reinforcement of the depot, converging at direct grounding points 1 and 2 before flowing into the depot rail.

6. Results

The work fulfills the stated objective of providing a field-circuit coupling method to analyze stray current distribution on earth surfaces. The main conclusions of this paper are as follows:
(1)
This paper proposes a field-circuit coupling method and analyzes the leakage current and its distribution law in two scenarios: subway mainline and the depot. The applicability and effectiveness of the proposed field-circuit coupling method are verified through these analyses.
(2)
This paper builds a model of current leakage from fasteners on the subway mainline. By modeling the structure of type III fasteners, it studies and analyzes the influence of fasteners on rail current leakage under three different insulating conditions. It is found that the failure of the gauge block results in the greatest degree of current leakage from the rails.
(3)
This paper builds a current leakage model of the grounding point at the subway depot and investigates four different actual subway depot line layouts and grounding situations. Simulation results indicate that the characteristics of stray current distribution in the depot are primarily influenced by the operational status of the OWCD, which is in turn affected by changes in rail potential. Additionally, when multiple trains are running in the depot, the complex operational status of the OWCD leads to a more varied and intricate distribution of stray current.

Author Contributions

Software, X.L. and Y.L.; Resources, S.L. and X.C.; Writing—original draft, Z.T.; Writing—review & editing, Z.T. All authors have read and agreed to the published version of the manuscript.

Funding

This research was funded by Natural Science Foundation of Jiangxi grant number 20224BAB204053.

Data Availability Statement

The original contributions presented in the study are included in the article, further inquiries can be directed to the corresponding authors.

Conflicts of Interest

Authors Shan Lin, Xia Chen were employed by the company Guangzhou Metro Design & Research Institute Co., Ltd. The remaining authors declare that the research was conducted in the absence of any commercial or financial relationships that could be construed as a potential conflict of interest.

References

  1. Yang, S.; Liu, C. Discrete modeling and calculation of traction return-current network for 400 km/h high-speed railway. Proc. Inst. Mech. Eng. Part F-J. Rail Rapid Transit 2023, 237, 445–457. [Google Scholar] [CrossRef]
  2. Chen, L.; Huang, K.; Wei, K.; Gao, D.; Peng, Q.; Lin, S. Study on the Potential Distribution Characteristics of Substation Grounding Grid Considering Stray Current. In Proceedings of the 2022 IEEE 6th Conference on Energy Internet and Energy System Integration (EI2), Chengdu, China, 11–13 November 2022; pp. 1284–1289. [Google Scholar]
  3. Li, C.; Du, Q.; Guo, Y.; Liu, Y.; Yang, F.; Chen, L.; Zhang, X.; Huang, G.; Gao, G.; Wu, G. Modeling of Stray Currents from Metro Intruding into Power System Considering the Complex Geological Conditions in Modern Megacities. IEEE Trans. Transp. Electrif. 2023, 9, 1653–1663. [Google Scholar] [CrossRef]
  4. Zhou, Q.; Lin, S.; Lin, X.; Wang, A. A Uniform Model for Stray Current of Long-Line DC Metro Systems. IEEE Trans. Transp. Electrif. 2022, 8, 2915–2927. [Google Scholar] [CrossRef]
  5. Zheng, Z.; Du, G.; Huang, W.; Wang, J.; Fan, M.; Zhu, Z. Coupling Effect of Reflux Safety Parameters in Main line and Depot of Multitrain DC Traction Power Systems. IEEE Trans. Transp. Electrif. 2022, 8, 527–541. [Google Scholar] [CrossRef]
  6. Song, C.; Li, Z.; Wang, H.; Liu, X. Analysis of influence law of rail transition resistance on subway stray current. In Proceedings of the 2022 7th Asia Conference on Power and Electrical Engineering (ACPEE), Hangzhou, China, 15–17 April 2022; pp. 1631–1635. [Google Scholar]
  7. Gao, H.; Wei, R.; Liu, J.; Wang, Z.; Zhong, H.; Cao, Y.; Tang, M.; Zhang, J. Analysis of Stray Current Intrusion into Grid Substation under Multiple Factors. In Proceedings of the 2022 4th International Conference on Control and Robotics (ICCR), Guangzhou, China, 2–4 December 2022; pp. 188–192. [Google Scholar]
  8. Liu, W.; Pan, Z.; Tang, Y.; Zhou, L.; Bhatti, A.A.; Niu, J. A Field-Circuit Coupling Diffusion Model for Stray Current of DC Metro System. IEEE Trans. Transp. Electrif. 2023; early access. [Google Scholar]
  9. Mariscotti, A.; Fichera, F.; Ogunsola, A. Evaluating stray current from DC electrified transit systems with lumped parameter and multi-layer soil models. In Proceedings of the IEEE Eurocon 2013, Zagreb, Croatia, 1–4 July 2013; pp. 1187–1192. [Google Scholar]
  10. Wang, C.; Li, W.; Wang, Y.; Xu, S.; Fan, M. Stray Current Distributing Model in the Subway System: A review and outlook. Int. J. Electrochem. Sci. 2018, 13, 1700–1727. [Google Scholar] [CrossRef]
  11. Liu, W.; Zhou, L.; Pan, Z.; Bhatti, A.A.; Huang, X.; Zhang, J. Dynamic diffusion model of stray current in DC traction power supply system. IEEE Trans. Power Deliv. 2023, 38, 2170–2182. [Google Scholar] [CrossRef]
  12. Vranesic, K.; Serdar, M.; Lakusic, S.; Kolar, V.; Mariscotti, A. Dynamic Stray Current Measuring Methods in Urban Areas. Balt. J. Road Bridge Eng. 2022, 17, 146–170. [Google Scholar] [CrossRef]
  13. Zhu, J.; Mao, C.; Wang, Z.; Chen, J.; Wang, D.; Luan, L.; Qiao, Y.; Wang, H. A novel suppression method for grounding transformer against earth current from urban rail transit. IEEE Trans. Ind. Electron. 2020, 68, 11651–11662. [Google Scholar] [CrossRef]
  14. Du, G.; Wang, J.; Jiang, X.; Zhang, D.; Yang, L.; Hu, Y. Evaluation of Rail Potential and Stray Current with Dynamic Traction Networks in Multitrain Subway Systems. IEEE Trans. Transp. Electrif. 2020, 6, 784–796. [Google Scholar] [CrossRef]
  15. Vranesic, K.; Lakusic, S.; Serdar, M.; Alar, V. Detrimental effect of stray current on rails and fastening systems in urban railway tracks. Constr. Build. Mater. 2023, 400, 132645. [Google Scholar] [CrossRef]
  16. Chang, W.C.; Kuo, C.C.; Lin, W.C.; Hsieh, M.N. Simulation of Stray and Core Shielding Loss for Power Transformer Based on 2D/3D FEM. IEEE Access 2023, 11, 16943–16950. [Google Scholar] [CrossRef]
  17. Jabbehdari, S.; Mariscotti, A. Distribution of stray current based on 3-Dimensional earth model. In Proceedings of the 2015 International Conference on Electrical Systems for Aircraft, Railway, Ship Propulsion and Road Vehicles (ESARS), Aachen, Germany, 3–5 March 2015; pp. 1–6. [Google Scholar]
  18. Lin, S.; Liu, X.; Zhang, X.; Cai, Z. Research on Stray Current Distribution in a Multitrain Subway System using Finite Element Modeling. Int. J. Electrochem. Sci. 2021, 16, 211250. [Google Scholar] [CrossRef]
  19. Kunpeng, L.; Xiaobin, C.; Hao, S.; Chao, X.; Yunyun, Z.; Wei, L.; Haiou, S.; Zhixin, H. The Equivalent Circuit and Influencing Factors of Subway Rail Fastener Track-to-earth Resistance. In Proceedings of the 2018 IEEE Transportation Electrification Conference and Expo, Asia-Pacific (ITEC Asia-Pacific), Bangkok, Thailand, 6–9 June 2018; pp. 1–5. [Google Scholar]
  20. Lin, S.; Huangfu, Y.; Zhou, Q.; Wang, A. Evaluation and Analysis Model of Stray Current in the Metro Depot. IEEE Trans. Transp. Electrif. 2021, 7, 1780–1794. [Google Scholar] [CrossRef]
  21. Cai, Z.; Zhang, X.; Cheng, H. Evaluation of DC-Subway Stray Current Corrosion with Integrated Multi-Physical Modeling and Electrochemical Analysis. IEEE Access 2019, 7, 168404–168411. [Google Scholar] [CrossRef]
  22. Ni, Y.; Yu, K.; Zhuo, C.; Zeng, X.; He, F.; Leng, Y.; Han, W. Study on distribution characteristics of metro stray current. In Proceedings of the 2021 IEEE International Conference on Electrical Engineering and Mechatronics Technology (ICEEMT), Qingdao, China, 2–4 July 2021; pp. 19–25. [Google Scholar]
  23. Vranešić, K.; Lakušić, S.; Serdar, M. Influence of Stray Current on Fastening System Components in Urban Railway Tracks. Appl. Sci. 2023, 13, 5757. [Google Scholar] [CrossRef]
  24. Mariscotti, A. Stray Current Protection and Monitoring Systems: Characteristic Quantities, Assessment of Performance and Verification. Sensors 2020, 20, 6610. [Google Scholar] [CrossRef] [PubMed]
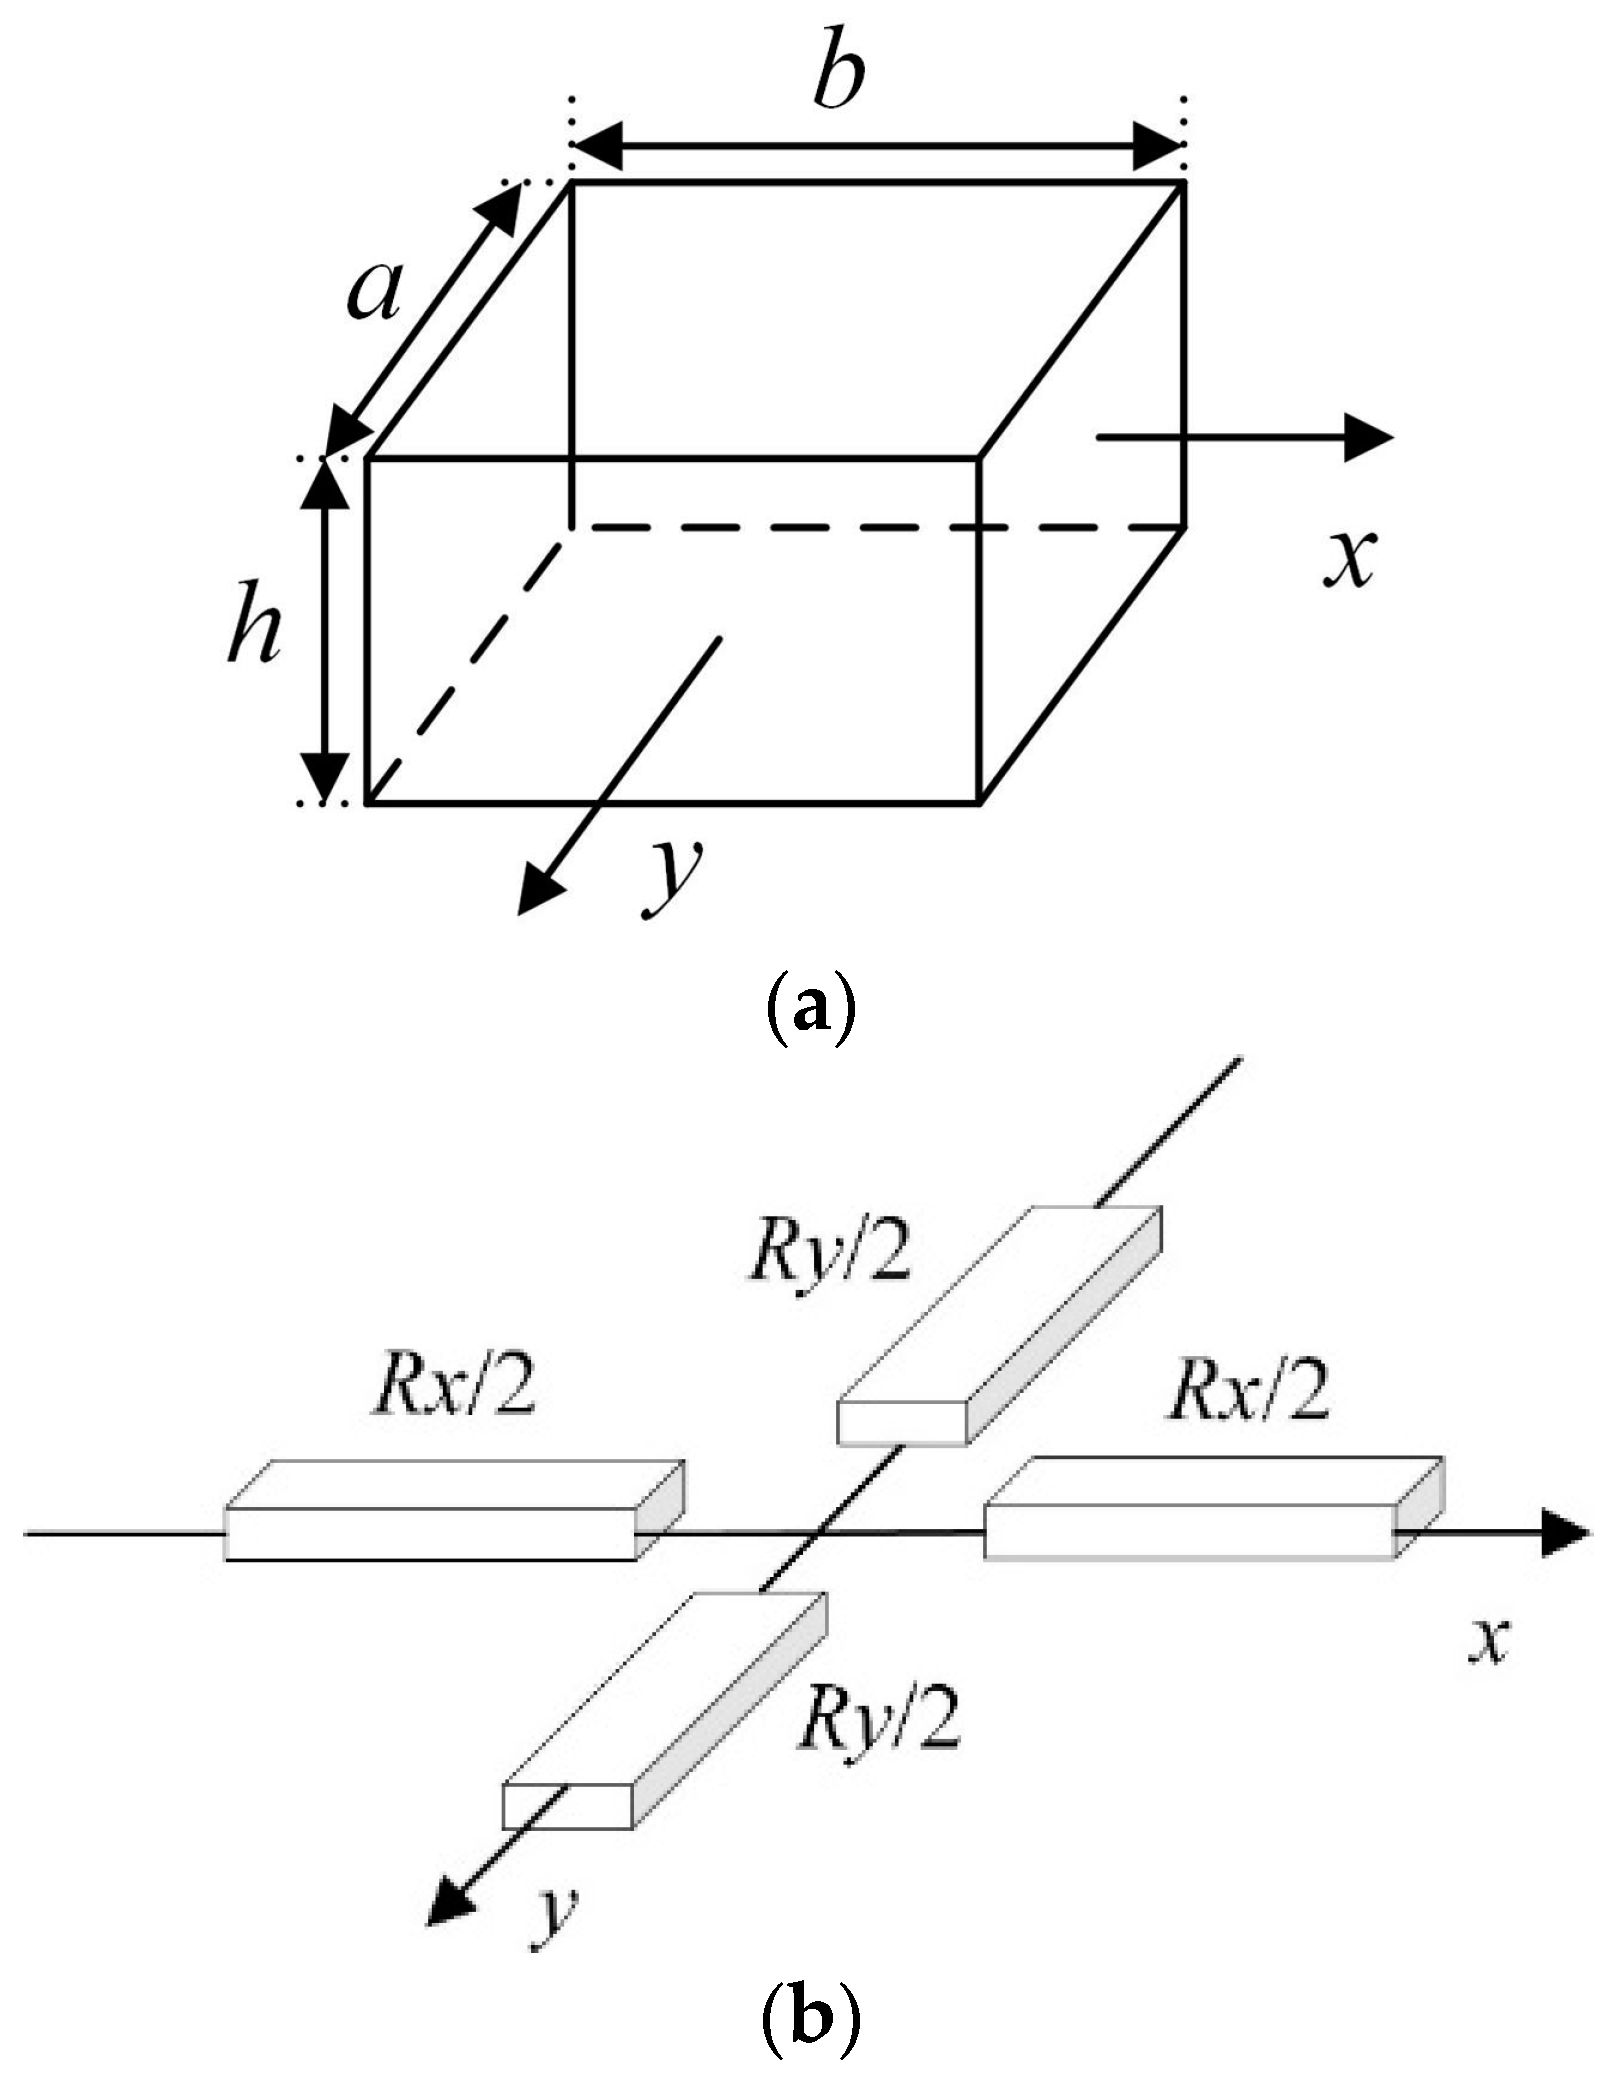
Figure 1. Equivalent of the earth unit. (a) The earth unit; (b) equivalent in x and y directions.
Energies 17 03121 g001
Figure 2. Train operating data.
Energies 17 03121 g002
Figure 3. Modeling of field-circuit coupling at the mainline.
Energies 17 03121 g003
Figure 4. Finite element model.
Energies 17 03121 g004
Figure 5. The structure of an elastic bar type III fastener. 1—rail, 2—gauge block, 3—III-type elastic strip, 4—iron tie—plate, 5—elastic pad, 6—bolt, 7—gasket, 8—sleeper, 9—under-rail pad, 10—insulated bushing.
Energies 17 03121 g005
Figure 6. “Rail–SCCM–earth” resistance network model.
Energies 17 03121 g006
Figure 7. Field-circuit coupling model at depot.
Energies 17 03121 g007
Figure 8. Regional division.
Energies 17 03121 g008
Figure 9. Simplified simulation model of the depot.
Energies 17 03121 g009
Figure 10. Finite element simulation of fastener under 3 insulation conditions.
Energies 17 03121 g010
Figure 11. Distribution of stray currents on the earth surface of the depot under different positions of the train.
Energies 17 03121 g011
Figure 12. Comparison of current density under 3 insulation conditions for fastener.
Energies 17 03121 g012
Table 1. Simulation model material parameters.
ProjectRelative PermittivityConductivity (S/m)
Rail13 × 106
SCCM12.8 × 106
Reinforcing bar12.9 × 106
Tunnel concrete12 × 10−3
Track-bed concrete12 × 10−3
Earth12 × 10−2
Table 2. Material and parameters of type III fastener.
StructureMaterialRelative PermittivityConductivity (S/m)
Elastic strip60Si2Mn12.38 × 106
Gauge blockGlass fiber-reinforced polyamide1.631 × 10−10
Iron tie-plateQT450-1012 × 106
Under-rail padThermoplastic polyester elastomer51.587 × 10−12
Elastic padThermoplastic polyester elastomer51.587 × 10−12
GasketQ235-A steel13 × 106
BoltS45C steel14.59 × 107
Insulated bushingGlass fiber-reinforced polyamide1.631 × 10−10
Table 3. Parameters of different operating states and simulation results.
ModeTrain PositionTraction CurrentStateDirect Grounding Points #1 and #2 Current
1inner zone of the depot (x = 200, y = 180)280 Aacceleration65 A; −64 A
2outer zone of the depot (x = 600, y = 180)420 Aacceleration0 A; −0.02 A
3Mainline (x = 1300, y = 250)1500 Aacceleration0.012 A; −0.012 A
4inner zone of the depot (x = 600, y = 180)420 AaccelerationCurrent at Train 1: 0.54 A
outer zone of the depot (x = 1200, y = 250)−420 AdecelerationCurrent at Train 2: −0.54 A
Disclaimer/Publisher’s Note: The statements, opinions and data contained in all publications are solely those of the individual author(s) and contributor(s) and not of MDPI and/or the editor(s). MDPI and/or the editor(s) disclaim responsibility for any injury to people or property resulting from any ideas, methods, instructions or products referred to in the content.