Article

Characterization of the TCO Layer on a Glass Surface for PV IInd and IIIrd Generation Applications

by
Paweł Kwaśnicki
1,2,
Anna Gronba-Chyła
1,
Agnieszka Generowicz
3,*,
Józef Ciuła
4,
Agnieszka Makara
5 and
Zygmunt Kowalski
6
1
Faculty of Natural and Technical Sciences, John Paul II Catholic University of Lublin, Konstantynów 1H, 20-708 Lublin, Poland
2
Research & Development Centre for Photovoltaics, ML System S.A., Zaczernie 190G, 36-062 Zaczernie, Poland
3
Department of Environmental Technologies, Cracow University of Technology, 31-155 Kraków, Poland
4
Faculty of Engineering Sciences, State University of Applied Sciences in Nowy Sącz, 33-300 Nowy Sącz, Poland
5
Faculty of Chemical Engineering and Technology, Cracow University of Technology, 31-155 Kraków, Poland
6
Mineral and Energy Economy Research Institute, Polish Academy of Sciences, 31-261 Kraków, Poland
*
Author to whom correspondence should be addressed.
Energies 2024, 17(13), 3122; https://doi.org/10.3390/en17133122
Submission received: 16 May 2024 / Revised: 14 June 2024 / Accepted: 21 June 2024 / Published: 25 June 2024
(This article belongs to the Section A2: Solar Energy and Photovoltaic Systems)

Abstract

:
In the dynamic field of photovoltaic technology, the pursuit of efficiency and sustainability has led to continuous novelty, shaping the landscape of solar energy solutions. One of the key elements affecting the efficiency of photovoltaic cells of IInd and IIIrd generation is the presence of transparent conductive oxide (TCO) layers, which are key elements impacting the efficiency and durability of solar panels, especially for DSSC, CdTe, CIGS (copper indium gallium diselenide) or organic, perovskite and quantum dots. TCO with low electrical resistance, high mobility, and high transmittance in the VIS–NIR region is particularly important in DSSC, CIGS, and CdTe solar cells, working as a window and electron transporting layer. This layer must form an ohmic contact with the adjacent layers, typically the buffer layer (such as CdS or ZnS), to ensure efficient charge collection Furthermore it ensures protection against oxidation and moisture, which is especially important when transporting the active cell structure to further process steps such as lamination, which ensures the final seal. Transparent conductive oxide layers, which typically consist of materials such as indium tin oxide (ITO) or alternatives such as fluorine-doped tin oxide (FTO), serve dual purposes in photovoltaic applications. Primarily located as the topmost layer of solar cells, TCOs play a key role in transmitting sunlight while facilitating the efficient collection and transport of generated electrical charges. This complex balance between transparency and conductivity highlights the strategic importance of TCO layers in maximizing the performance and durability of photovoltaic systems. As the global demand for clean energy increases and the photovoltaic industry rapidly develops, understanding the differential contribution of TCO layers becomes particularly important in the context of using PV modules as building-integrated elements (BIPV). The use of transparent or semi-transparent modules allows the use of building glazing, including windows and skylights. In addition, considering the dominant position of the Asian market in the production of cells and modules based on silicon, the European market is intensifying work aimed at finding a competitive PV technology. In this context, thin-film, organic modules may prove competitive. For this purpose, in this work, we focused on the electrical parameters of two different thicknesses of a transparent FTO layer. First, the influence of the FTO layer thickness on the transmittance over a wide range was verified. Next, the chemical composition was determined, and key electrical parameters, including carrier mobility, resistivity, and the Hall coefficient, were determined.

1. Introduction

The use of renewable energy sources is becoming a social norm today. The most popular alternative energy sources include hydropower, biofuels, solar energy, wind energy, biomass, and geothermal energy. Of these, solar energy is the most reliable, least expensive, and easiest to use [1]. A variety of solar cells have been developed, including crystalline silicon cells (c-Si), amorphous silicon cells (a-Si), dye-sensitized solar cells (DSSCs), hybrid solar cells [2,3,4], nanocrystalline solar cells, multijunction SCs, perovskite SCs, organic SCs, photoelectrochemical cells (PEC), plasmonic SCs, quantum dot SCs (QDSCs), multilayer SCs with a gradient band gap, and semiconductor SCs [5,6]. The physical basis and photovoltaic potentials of nanowire-IBSCs based on dilute III–V nitride compounds are discussed: these photovoltaic devices promise to overcome many of the limitations encountered to date in the practical implementation of IBSCs based on QD III–V or III-planar NV heterostructures [7]. Organic SCs are increasingly recognized because of their intrinsic properties, such as lightweight, mechanical flexibility, and transparency as well as low production costs. The c-Si-based SC cell showed a high efficiency of 27.3% (LONGi) for heterojunction back-contact (HBC) architecture improving the previous world record of 27.09%, which was also set by Longi at the end of last year [8]. It is worth noting that the presented HBC architecture minimizes the reliance on traditional indium-based transparent conductive oxide (ITO). In this context, research on thinner, low resistance, and high-quality FTO layers presented in this work is important. It is well known that an effective method to ensure low reflectance for heterojunction cells is the deposition of layers of transparent conductive oxide (TCO) on c-Si substrates [9].
All optically transparent and electrically conductive oxides (TCOs) are binary or ternary compounds containing one or two metallic elements. Their resistivity can be as low as 10−4 Ω, and their extinction coefficient k in the optical visible range (VIS) can be lower than 0.0001 due to their wide optical band gap (Eg), which can be larger than 3 eV. This combination of conductivity and transparency is usually impossible in intrinsic stoichiometric oxides. It is achieved by producing them with a nonstoichiometric position or by introducing appropriate admixtures [9,10]. The potential and actual application of TOC thin films is in transparent electrodes for photovoltaic cells [11]. Indium tin oxide (ITO) is currently the best TCO electrode material because it has very high transmission (>80%), high conductivity (104 Ω−1 cm−1), a low refractive index, low light absorption, high strength, and stability [12]. Some of the most commonly used semiconductor TCO materials for photovoltaic applications are oxide-doped materials, such as indium-doped tin oxide (ITO), Al-doped zinc oxide (AZO), F-doped tin oxide (FTO), boron-doped zinc oxide and zinc doped with Ga (GZO) [13,14,15]. In this section, some of their important parameters will be resumed. The deposition by DC sputtering of ZnO:Al thin films at high temperature (>350 °C) on Al2O3 (sapphire) oriented monocrystalline substrates (00.1) using a low-cost and ultra-high density composite ceramic target produced by pressureless (non-pressure) casting of ZnO-Al2O3 (AZO) powders is described [16]. Thin films of amorphous indium-zinc oxide (IZO) were prepared on glass substrates by direct current magnetron sputtering at room temperature [17]. In the paper, the results show that Al-doped SnO2 has a p-type conductivity character and its band gap decreases compared to undoped SnO2, and the accompanying oxygen vacancies can introduce localized gap states below the bottom of the conductivity band and lead to a change in conductivity character to n-type from p-type in Al-doped SnO2 [18]. The thermal and chemical instability and lower surface energy of ITO limit its widespread use [19,20]. The disadvantage of using ITO is the shortage of indium resources, which is expected to soon lead to an increase in market prices and shortages in ITO supplies [21,22]. The brittleness of ITO foil seriously limits its use in flexible applications [23,24]. Among TCOs, alumina zinc oxide (AZO) is known to have performance comparable to that of ITO and FTO, including other advantages [25], such as lower toxicity, low cost, and simple production methods. However, grain boundaries and electron scattering have reduced the mobility of the TCO carrier, consequently affecting the performance of these materials [26]. One of the main disadvantages of TCO glasses is that they are brittle, do not withstand high temperatures, and are not suitable for all pH levels [27].
ZnO is of great interest in large-area optoelectronic devices, such as transparent conductive oxides (TCOs), due to its good optical properties. Jang et al. (2019) deposited thin films of quaternary ZnO on a soda-lime glass substrate using Mg and group III elements such as Al, Ga, and In to improve the optical and electrical properties [28]. However, many studies have been conducted to improve the properties of ZnO by co-doping it with various elements. ZnO doped with group III elements is a good alternative to ITO because it shows good optical transparency in the visible wavelength range and high conductivity compared to ITO [29]. In particular, both the electrical and optical properties of TCO can be improved by double doping with Mg and group III elements such as Ga, Al, and In. Tian et al. examined thin films of ZnO doped with Mg and Ga (MGZO) and observed a wide optical bandgap energy of 3.66 eV and a low resistivity of 6.27 × 10⁻⁴ Ω [30]. ZnO films doped with Al are a good alternative to ITO due to their superior electro-optical properties [31]. In Saarenpaa et al.’s study, Al-doped ZnO films showed better photocatalytic performance than undoped ZnO films [32]. Pure ZnO and Ce-doped ZnO nanoparticles were synthesized by a sol-gel coprecipitation method to investigate the temperature-dependent photoluminescence properties of Ce-doped ZnO nanoparticles. Kumawat et al. analyzed the importance of microstrains in influencing the band gap and photoluminescence (PL) intensity of ZnO thin films [33] doped with Ce on glass substrates spin-deposited using the sol-gel method [34]. Recently, ZnO films doped with various elements have attracted much interest because they can significantly improve the photocatalytic performance compared to that of a single metal-doped ZnO photocatalyst. Therefore, scientists have investigated Al and rare earth-doped ZnO materials due to the mentioned properties of Al and rare earth elements. ZnO was doped with Gd and A [35], AZO was doped with Eu3+ [36], AZO was doped with Sm+3 [37] ZnO was doped with Y/Al [38], ZnO was doped with Al and/or Ho [39], Ce and Al were doped with ZnO [40], and Pr was doped with Al:ZnO [41] and Zn(Al,Ce)O nanoparticles [42].
Fluoride-doped SnO2 (FTO) films are semiconductor materials with wide bandgaps (e.g., =3.65 to 4.25 eV) due to their optical transmittance in the visible region [43]. Moreover, because of their resistivity, FTO is currently available for practical application. The conductivity of transparent conductive materials is an effective solution [44,45]. Li et al. found that ZnO nanorods on an annealed AZO/FTO film exhibit a denser distribution and better orientation than those on FTO glass and unannealed AZO/FTO films. As a result, the annealed AZO/FTO film coated with ZnO nanorods showed superhydrophobicity, high transparency, and low visible reflectance and had the lowest surface resistance of 4.0 Ω/kW, suggesting good electrical conductivity [46]. In Li et al.’s study, transparent conductive layers of ITO and FTO layers with the same sheet resistance were used. PSCs with ITO-coated glass achieved a conversion efficiency of 10.8%, which was higher than that of FTO (9.0%). PSCs with ITO-coated glass substrates have lower resistance in series and parallel connections than those with ITO-coated substrates, ITO-coated glass substrates have greater transmittance than do PSCs with ITO-coated glass substrates, and PSCs with ITO-coated glass substrates can achieve high IPCEs [47]. Mishima et al. investigated the influence of optical properties and surface morphology on the short-circuit current density (Jsc) of tin fluoride (FTO)-coated glass substrates for the production of perovskite solar cells (PVSCs). Compared with the PVSC on commercially available FTO substrates, the PVSC on our FTO substrate showed an increase in the Jsc of 1.4–1.6 mA/cm2. This is due not only to the low absorption of the FTO substrate but also to the suppression of reflection loss caused by the light-trapping effect on the textured surface [48]. Shibayama et al. in their study write the appropriate selection of nanoparticles has been proven to be crucial for tuning the properties of F:SnO2 (FTO) nanocomposites. This paper establishes guidelines for the fabrication of FTO and other transparent conductive oxide (TCO) nanocomposites as promising solar cell electrodes with tunable structural, electrical, and optical properties [49]. FTO films are mainly prepared by pulsed lasers, spray painting, and chemical vapor deposition (CVD). The main source of fluorine was NH4F or HF. When the SnF2 content was 10 wt% and the substrate temperature was 300 °C, the resistivity and light transmittance of the film reached 5 × 10⁻⁴ Ω.cm and 87%, respectively [50]. However, the resistivity of FTO films prepared by spraying can reach 6 × 10⁻⁴ Ω.cm [51]. AFM was used to study the surface morphology of different layers on ITO and FTO. The surface of FTO was much rougher than that of ITO, and the root mean square roughness (Rrms) was 0.63 nm for ITO and 16.0 nm for FTO [52].
Alternative materials and processing technologies have been proposed that can lead to similar PCEs, which have led to the development of the second generation of photovoltaic cells, mainly filled with thin-film photovoltaic cells (TFPVs) [53]. Thin films have the advantage of reducing the amount of semiconductor used to prepare photovoltaic cells, reducing—in several cases—the cost by more than half [54]. Among the most famous technologies for third-generation solar cells, dye-sensitized solar cells (DSSCs) have emerged when hybrid and highly abundant materials are selected as the main components [55].
In this work, we compare two FTO layers with different thicknesses made by standard commercial pyrolytic processes in order to show the applicability of layers in areas, requiring specific electrical and optical parameters such as PV or transparent electronics. The usability of the characterization method for different thicknesses of the TCO layer was verified, additionally from the measurements carried out, one can select the optimal thickness of the layer taking into account layer quality and electrical and optical parameters.

2. Materials and Methods

Samples Preparation

Two FTO layers made by a pyrolytic process on glass substrates were investigated to determine their chemical, electrical, and optical parameters. The first coating with a thickness of 540 nm was prepared on 3.2 mm glass (Sample 1). Another sample contained a 340 nm TCO coating on a 3.2 mm glass substrate (Sample 2). Both samples were measured by SEM—EDS and a Hall Effect Measurement Analyser (HCS10, Linseis GmbH, Hitachi, Japan) to determine their chemical composition and electrical parameters, particularly the charge carrier concentration and mobility. For the substrate commercial (dyglassco glass tech), 3.2 mm tempered clear glass with C edge grinding was used. Local curvature was specified to be lower than 2‰ and transmittance of 89%. Before deposition, the process glass substrates were cleaned in an ultrasonic cleaner using acetone for 10 min and then for 15 min in isopropanol. After that, substrates were dried using nitrogen blow-through. The FTO layers were made using a standard ultrasonic 1.62 MHz spray pyrolysis process in a furnace chamber heated up to 480 °C and tin (IV) chloride pentahydrate with ammonium fluoride as precursors. The spray nozzles were placed 15 cm above the glass substrate, and the scan speed was set up to 1.5 cm/s for sample 1 and 1 cm/s for sample 2. Before spraying, the substrates were heated to reach a temperature of 480 °C and then stabilized for 15 min. The original dimensions of the measured samples were 300 × 300 mm2. Because the sample holder is suitable for 10 × 10 mm2, glasses were cut for that dimension before any measurement and cleaned from the dust by a dry nitrogen stream. Since the substrate glass was tempered for cutting a 10 picosecond, 1064 nm wavelength laser machine was used. They were not cleaned in an ultrasonic bath to avoid damaging the coatings. Prepared as described above, the samples were then mounted in sample holders (see Figure 1) and transferred to the measurement chamber in the HCS10 device and in a secondary electron microscope (SEM) system equipped with EDS. Scanning electron microscope (SEM) Hitachi Regulus 8230 for sample imaging was used. The SEM was equipped with Cold Field Emission Gun (CFE) and In-column), a secondary electron SE detector, two in-lens SE detectors, and a backscatter detector BSE detector along with energy dispersive spectroscopy (EDS) detectors (Thermo Scientific, Rzeszów, Poland) with a detector surface of 60 mm2 and a resolution of 129 eV specified for the manganese K line. The images were registered at the accelerating voltage varied from 10 to 15 keV and working distance between 2 and 4 mm.

3. Results and Discussion

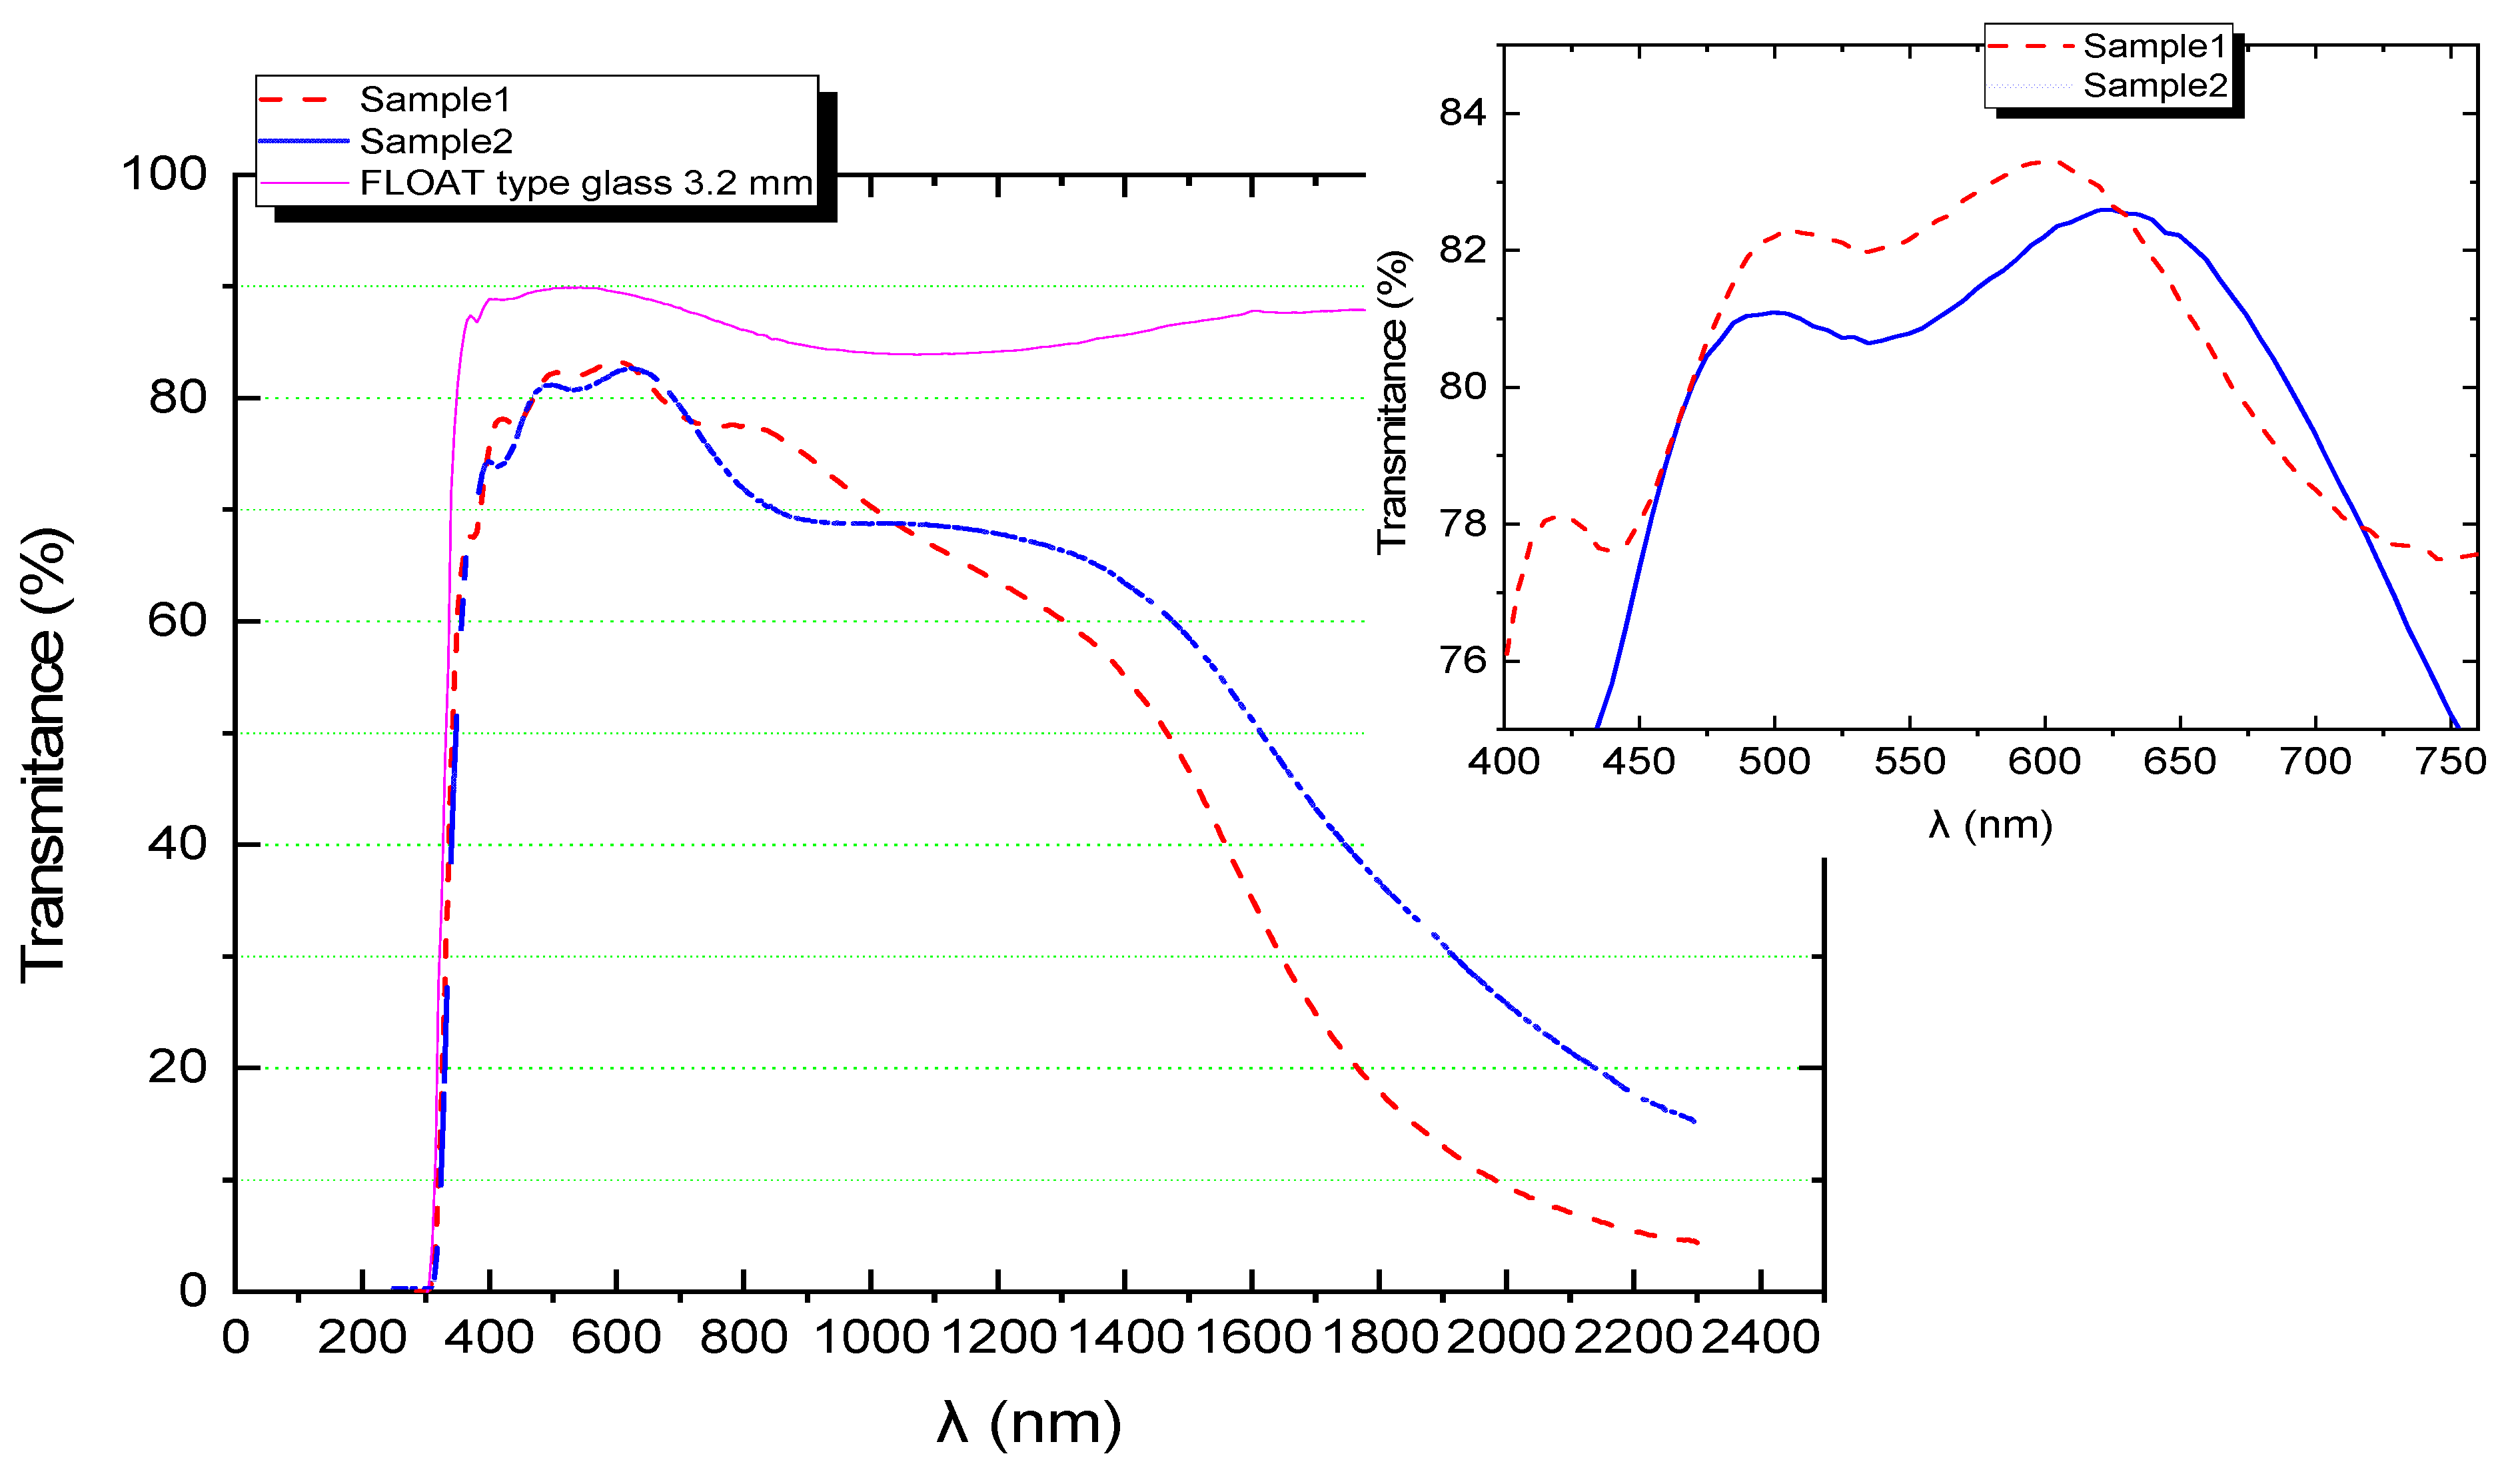
Optical measurements were performed using a double-beam UV–VIS–NIR spectrophotometer (ABL&E-Jasco V-670; Tokio; Japan) with a halogen lamp as the light source. The obtained results show no significant difference between Samples 1 and 2 in the visible region and perceptible changes in transmittance in the NIR region were noticed (as shown in Figure 2).
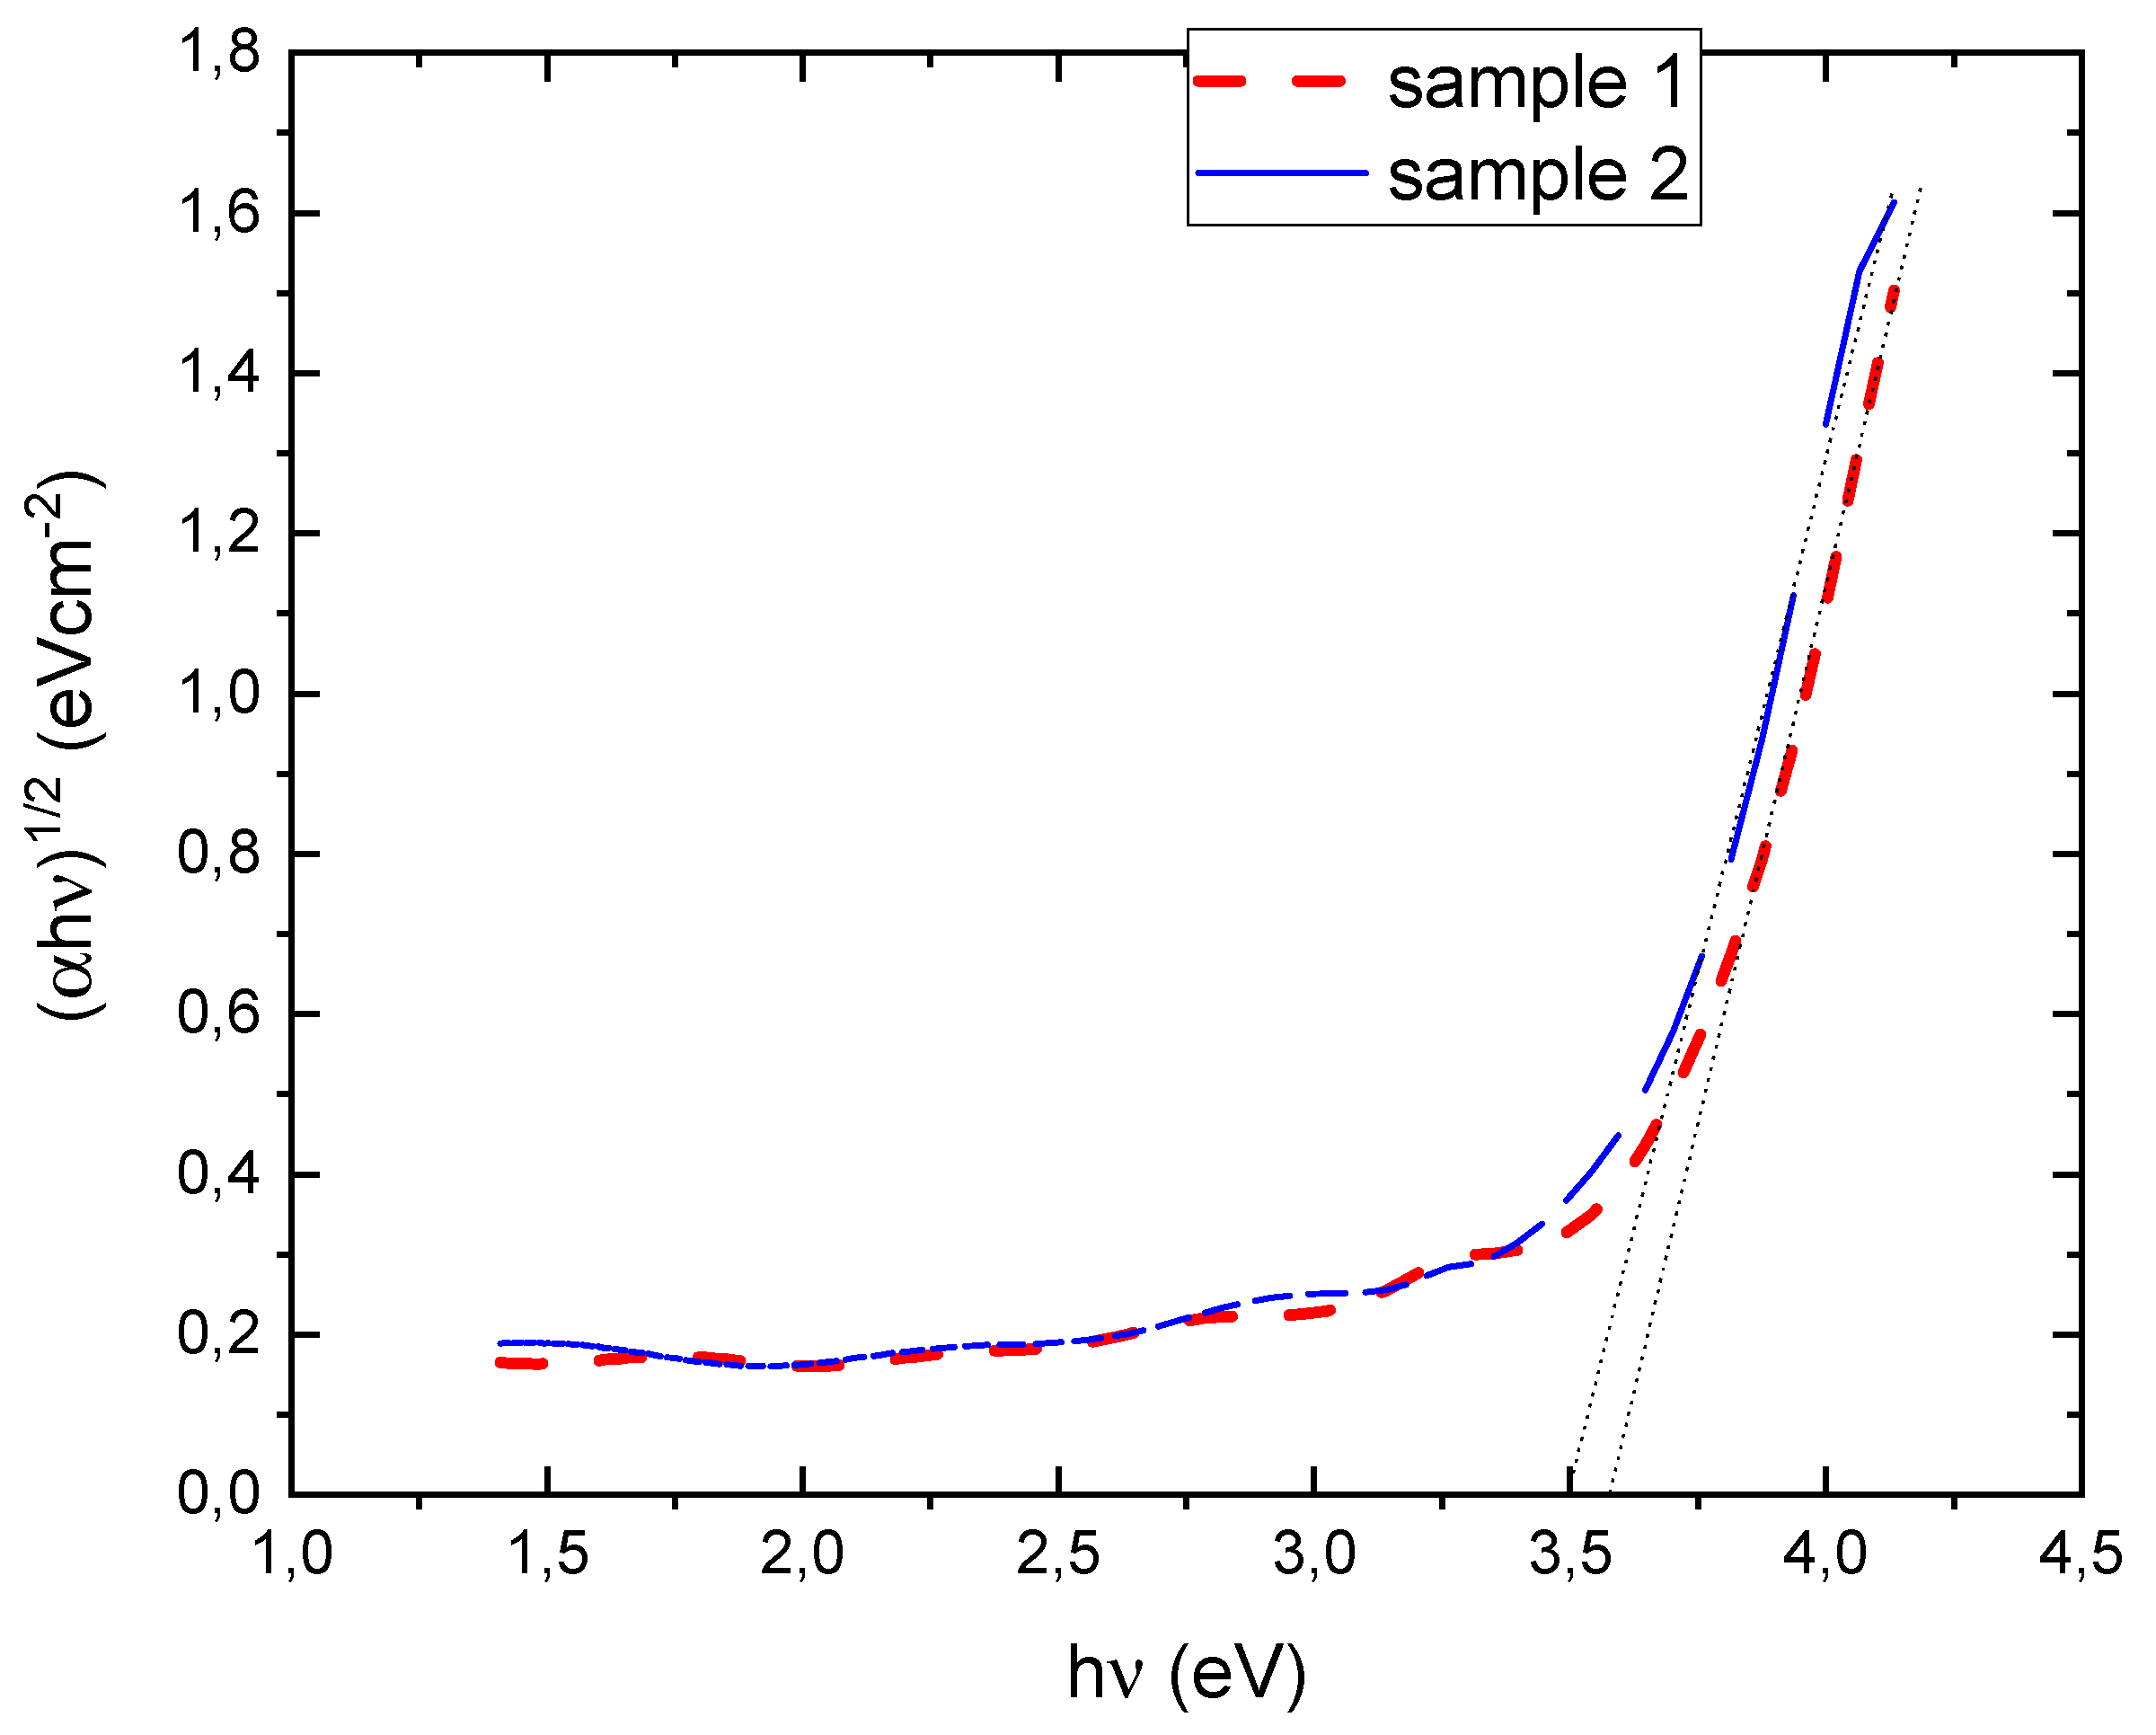
Differences in the thickness of the 200 nm FTO layers did not slightly affect the transmittance in the VIS-IR range. A significant decrease in the transmittance of the samples with FTO layers (samples 1 and 2) compared to that of the clean substrate (Float 3.2 mm) is especially visible in the IR range. Furthermore, for a thicker sample (sample 1), a higher absorption in the IR region was noticed. This is due to free carrier absorption and can also be related to chemical composition or surface roughness. The specific composition of FTO, including the ratio of tin to fluorine and the doping level, can influence its optical properties. In some cases, variations in composition may lead to increased absorption in the IR region. Since there were no significant differences in the spectra of the measured samples, it can be concluded that the chemical compositions of both samples were similar. Moreover, one can conclude from optical measurements that the surface morphology is similar. Furthermore, the difference in thickness, namely, 200 nm, is pronounced in the optical spectrum, showing that spectroscopic measurements are useful for determining the differences in thickness between layers. The average transmittance of the VIS region (300–880 nm) calculated for samples 1 and 2 totals 73.4 and 71.02, respectively, which is rather unsatisfactory for transparent conductive layers for electronics applications (the expected transmittance should be in the range of 80%). The low transmittance can be associated with the low quality of the layer and is also related to the substrate (float glass). According to [56,57], the average transmittance in the VIS region should not be influenced much by different fluorine doping levels. From the optical spectrum of the VIS region (Figure 2 insertion), very few fringes can be observed, which may be associated with the low fluoride concentration. From Tauc’s plot (Figure 3), the direct transition and energy band gap values were found to equal approximately 3.59 eV and 3.49 eV for samples 1 and 2, respectively, which is consistent with the FTO optical Eg values in the literature. The obtained value is slightly lower than that of the undoped tin oxide material, which is approximately 3.7 eV. According to the Burstein–Moss effect, the energy of the band gap for doped metal oxide layers should be greater than that for undoped metal oxide layers. This can be explained by the fact that the energy gap between the valence band and the lowest empty state in the conduction band is found to increase due to the filling of low-lying energy levels in the conduction band, which is caused by the increase in the carrier concentration. For very thin films of a few hundred nanometres (340–540 nm for analyzed samples), a shift in the bandgap may be the result of infernal stress or free carrier concentration. It is well known that for different thicknesses of the FTO layer, one can obtain different surface morphologies [58]. For the film with a high thickness (1.38 mm), almost full of larger grains were observed. For films with thicknesses between 0.92 and 1.01 mm, the grains were found to be similar in size and were clustered in a cuboidal shape. When the thickness of the layer is decreased to 0.72 and 0.84 mm, the grains with regular rectangular shapes are clustered on the surface. For the films with other thicknesses, the morphology is characteristic of needle-shaped grains.
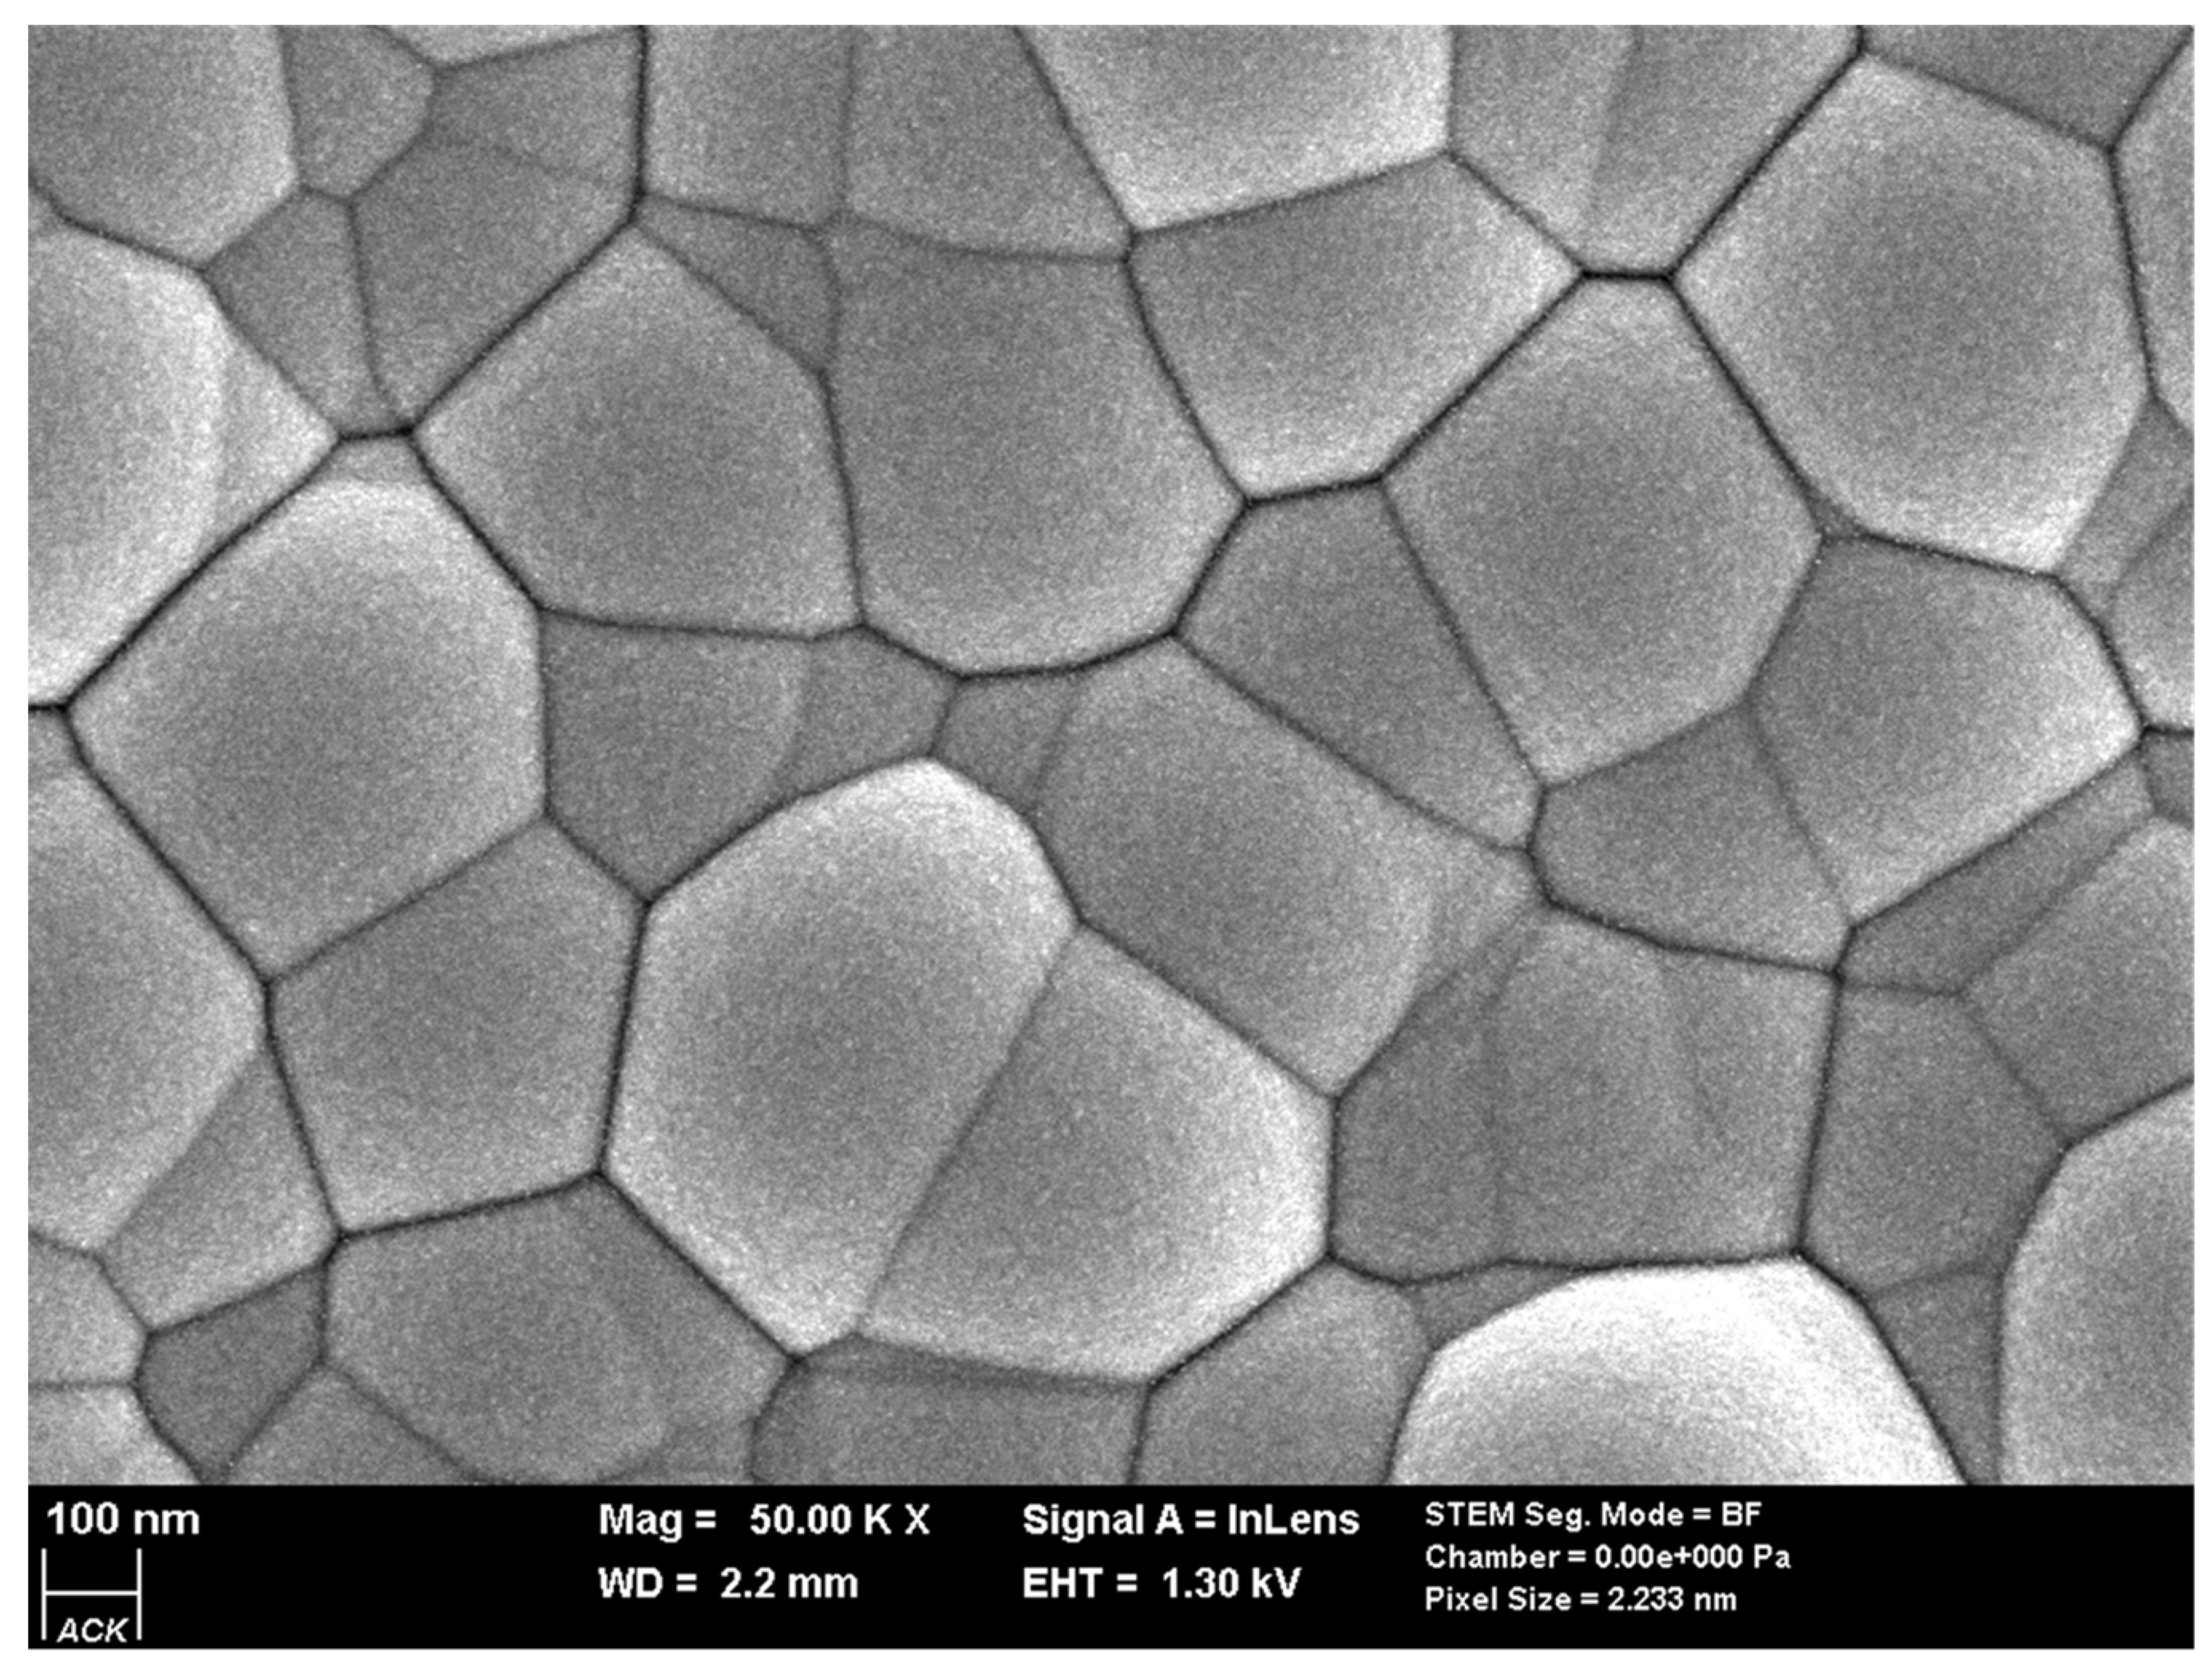
No significant differences in the bandgap between samples with different thicknesses were observed; for both samples, identical values of Eg were determined. For the 340 and 540 nm thick layers, a regularly shaped structure closely adjacent to each of the other crystallites was observed. The average size of the crystallites was approximately 220 nm for sample 1 (Figure 4) and 230 nm for sample 2. In general, the size of the grain is related to the doping concentration and higher F doping results in smaller grain size. For the measured samples, no significant differences were observed; nonetheless, we should expect to obtain a slightly higher concentration of F doping for sample 1. Since the size and shape of the grains are also related to the film thickness, no straightforward conclusions can be drawn.
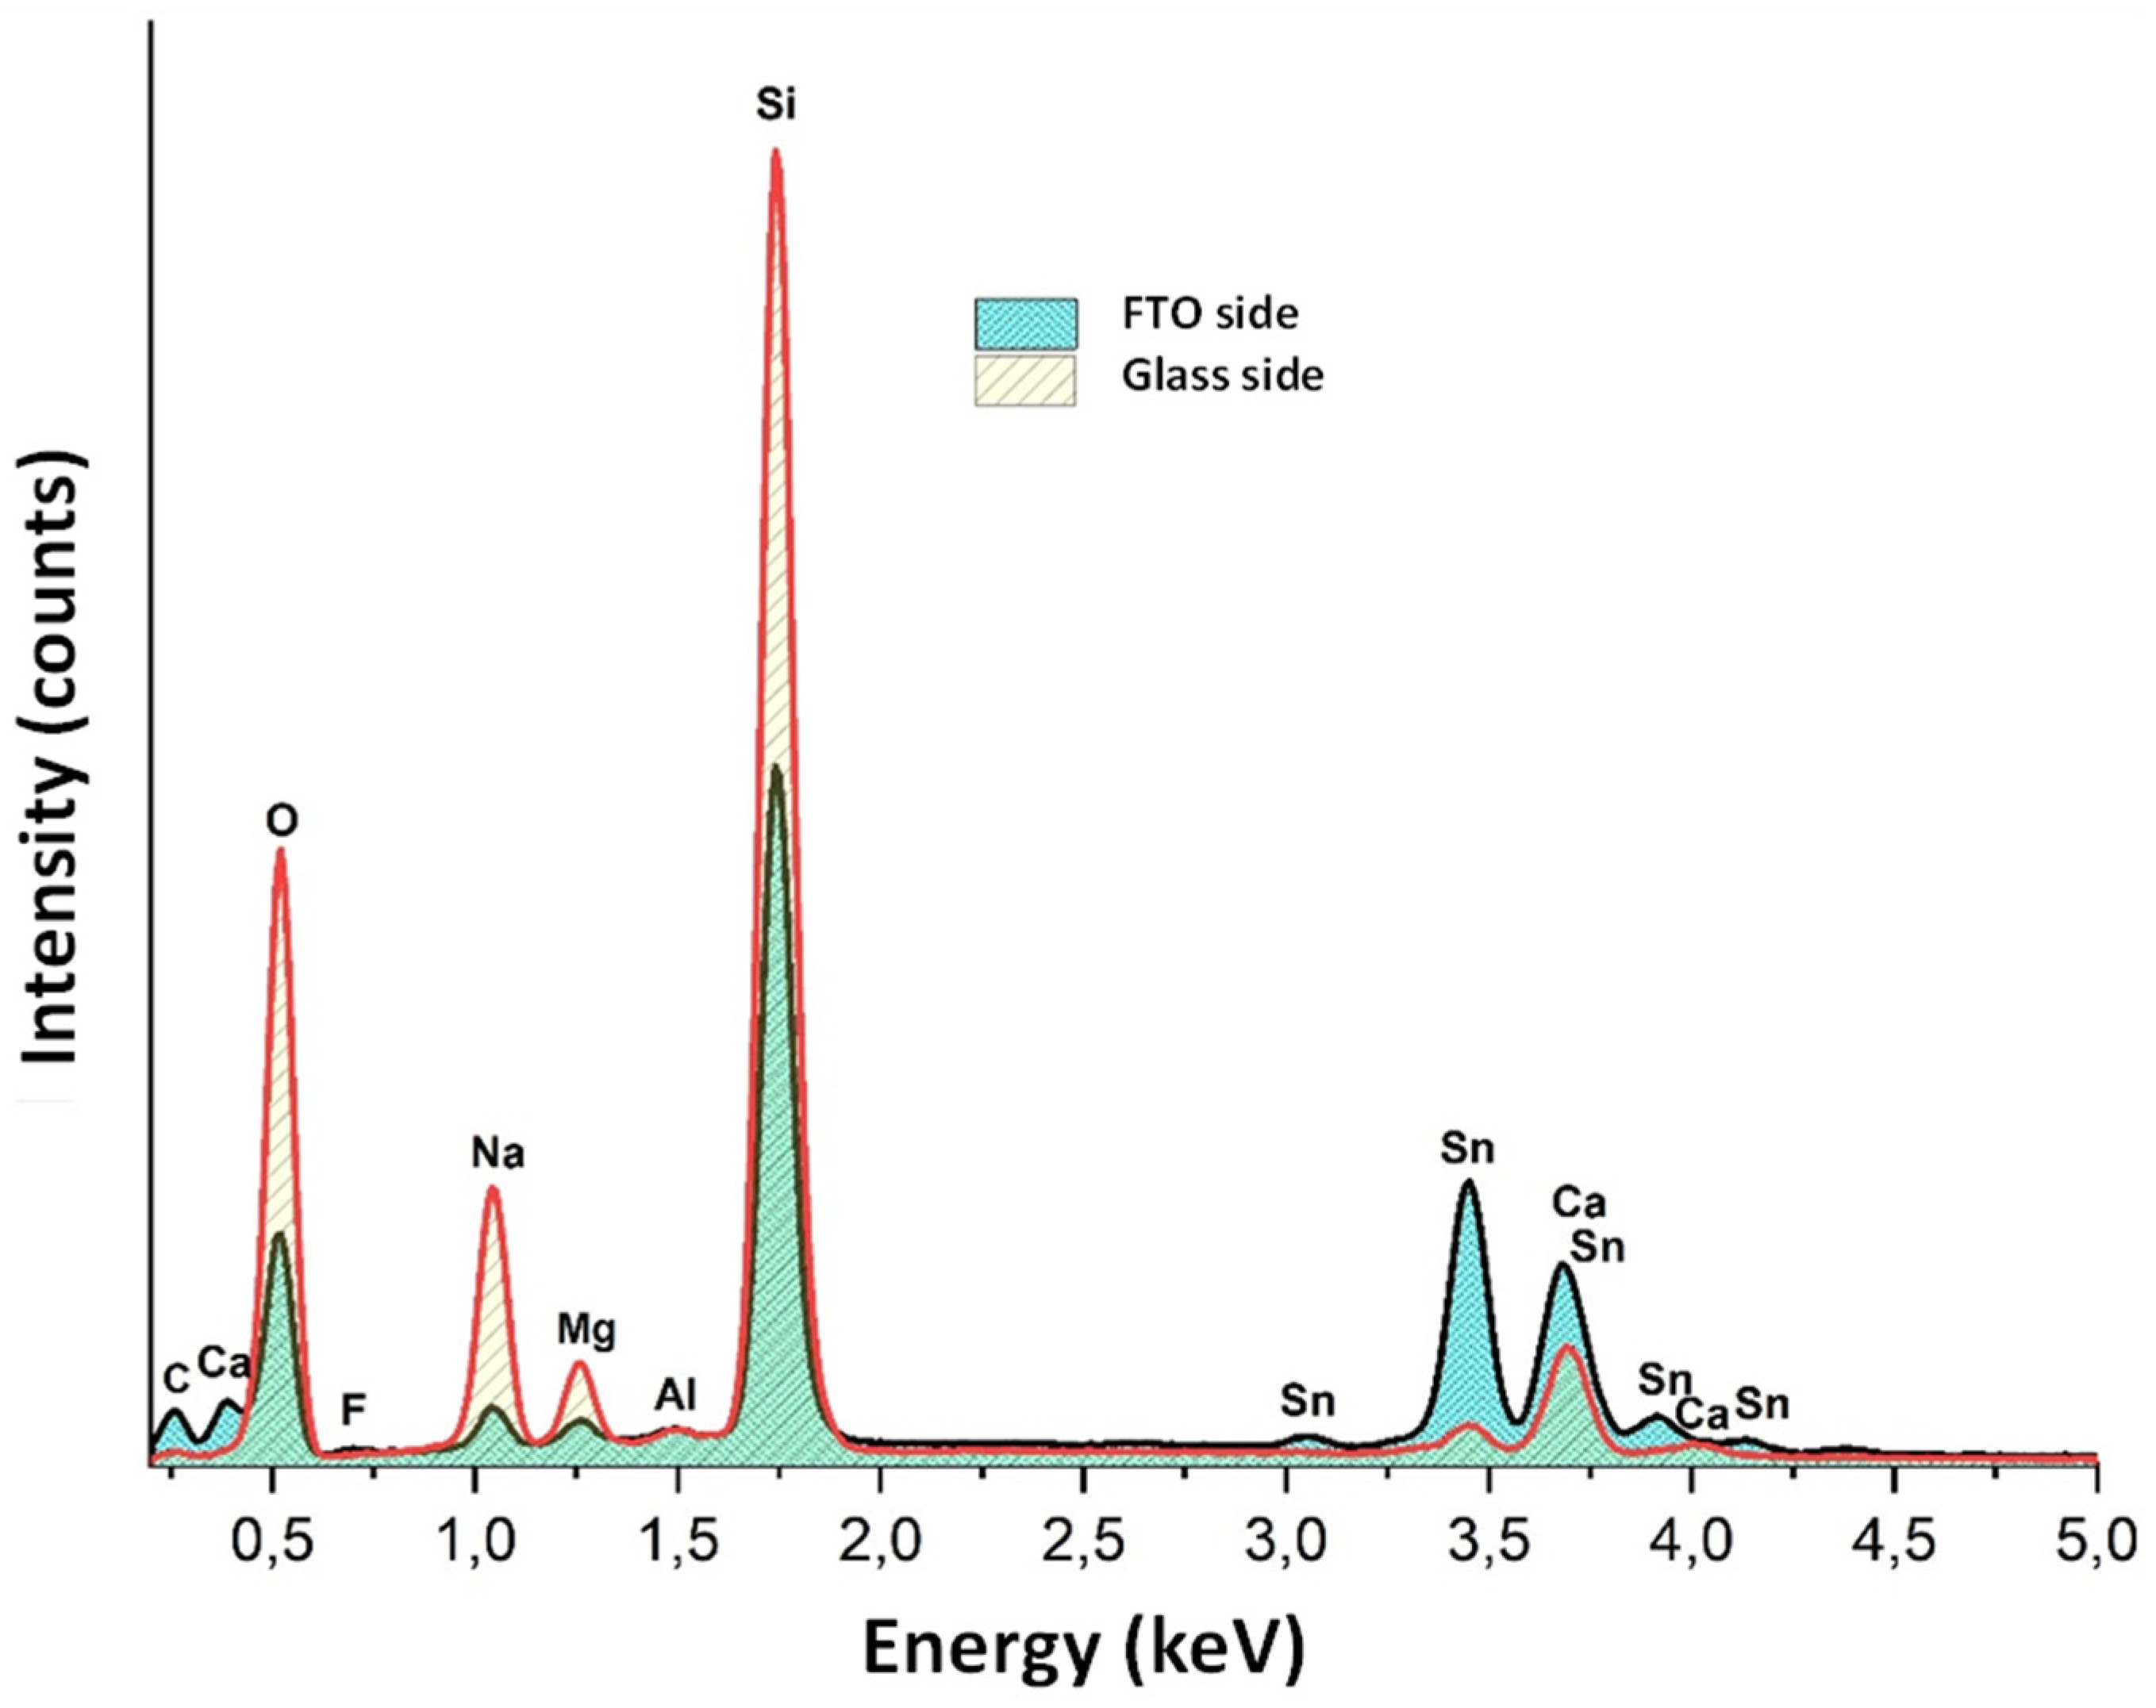
The chemical composition was verified using an SEM Hitachi Regulus 8230 instrument equipped with an energy dispersive spectroscopy (EDS) detector. Two pieces of glass with an FTO layer were placed inside the SEM chamber, and for both samples, measurements were performed on two sides: an FTO coating and a glass-bearing electron source. The elemental composition was determined at an accelerating voltage of 15 kV and a working distance set up at 2.2 mm. Since the FTO layer is conductive, a high-resolution image was easy to obtain; additionally, the applied high voltage did not damage the surface. The situation was diametrically different when measurements were conducted from the glass side. A high charge accumulation effect was observed, which significantly influenced the collected data.
A clear signature of atoms in the FTO layer is visible, namely, Sn (La 3.443) and F (Ka 0.677). Since the layer is relatively thin (540 nm), a clear signature of atoms from the glass substrate is noticeable (Si, Na, Ca). For a thinner FTO layer, one can expect to observe a significantly greater signal from the glass. Fluorine is present in the FTO coating; however, one small content (<0.1% by weight) is present. Its presence is confirmed by a visible signal in the spectrum (Figure 5 and Figure 6). The relatively high ratio of the oxygen peak (Ka 0.525) to the silicon peak (Ka 1.739) suggested that the electron beam was less likely to penetrate the glass surface, and most of the observed oxygen was present in the FTO film.
For very thin FTO coatings, fluorine is barely noticeable in the spectrum, and only a clear indication of the presence of an FTO layer is a significant difference in the presence of Sn between the samples measured from the top (FTO) and bottom (glass) sides. The peak from silicon is definitely more visible, which correlates with the fact that in this case, we have deeper penetration of the electron beam. Interestingly, the relative intensity of the oxygen peak relative to silicon is lower for the thinner layer, which may indicate greater detection of oxygen atoms in the FTO layer than in the glass substrate. Because float glass contains tin atoms in its composition (depending on the side: tin or air with a higher or lower amount), determining the presence of the FTO layer for very thin layers below 300 nm is not unambiguous using EDS. The key parameters for FTO are electrical parameters, and Hall measurements were used to determine them.
The determined Hall parameters are summarized in Table 1 for SAMPLE1 and Table 2 for SAMPLE2. The values presented in both tables were obtained for samples 1 and 2, each of which was taken from a different place (the three measurements for each sample are indicated as 1.1, 1.2, and 1.3). Then, the data were averaged (AVG), and the standard deviation (SD) was calculated. As expected, the thicker FTO layer led to lower sheet resistances of 7.50 and 13.80 Ω−1 for SAMPLE1 and SAMPLE2, respectively. A similar conclusion could be drawn for conductivity. At 540 nm, the conductivity of FTO was 2469 Ω−1 cm−1, while at 340 nm, it was 2135 Ω−1 cm−1. These results indicate that, electrically, SAMPLE1 performs better. The obtained data showed that the bulk charge carrier concentration (CCC) was greater for SAMPLE2 (−4.45 × 1020 cm−3) than for SAMPLE1 (−4.02 × 1020 cm−3); however, the sheet CCC was greater for SAMPLE1 (−2.17 × 1020 cm−2) than for SAMPLE2 (−1.51 × 1020 cm−2). A higher bulk CCC may suggest that the quality of the thinner layer is better since the presence of defects and impurities in the material can significantly affect the bulk charge carrier concentration. These defects can act as trap states, influencing the mobility and concentration of charge carriers, which was observed in the case of the measured samples. During the measurement, the HCS10 device measures the Hall coefficient between BD connection points and then between AC connection points. These points are labeled on the sample holder (see Figure 1). The final Hall coefficient is then determined by calculating the average value of these two results. As presented in both tables, the coefficient is negative, which means that the majority of carriers in the material are electrons. The last calculated parameter was mobility. It was significantly greater for thicker FTO coatings in SAMPLE1 (−38.34 cm2V−1s−1) than in SAMPLE2 (−29.92 cm2V−1s−1). The obtained mobility values are greater than those reported in [59], where samples were prepared using a similar technique but with a significantly thicker layer in the range of 1–2 µm. The thinness of the layer may be related to the high quality of the layer, which reduces the resistance. Thinner films might have higher defect densities and surface scattering, which can lower mobility, however, for thicker layers, the mobility can improve mobility to an extent, but very thick films might introduce other issues like strain or stress, which can also affect mobility. In the present case, one can conclude that thicker film has a lower defect concentration.
The measured resistivity in the range of 4.05–4.69 Ω cm corresponds to carrier concentrations between 0.9 and 6.12 × 1020 cm−3 [60,61,62], and if we take into consideration mobility of 38.34 cm2 V−1 s−1 for sample 1 and 29.92 cm2 V−1 s−1 for sample 2, one can estimate the carrier concentration to be approximately 3.7 cm−3 and 4.6 cm−3, respectively. The resistivity is dependent on the fluoride concentration level and the favored orientation. For a high F concentration, the increase in resistivity is due to the reduction in the mobility of the charge carriers, which in turn, is due to a reduction in the preferred orientation. The decrease in mobility can be attributed to fluorine ions occupying the oxygen sites in the SnO2 lattice, creating free electrons and decreasing the electrical resistivity. Nonetheless, a higher concentration of F causes the resistivity to increase due to the cancellation of the effect of oxygen vacancies by the substitution of fluorine atoms and the accumulation of fluorine atoms at the grain boundaries, which form Sn–F bonds. For a more accurate estimation, the resistivity must be correlated with the fluoride and oxygen levels measured by EDS; however, for these measurements, a lower acceleration voltage is preferred to minimize the influence of the substrate for very thin layers. The very high mobility observed for both samples is due to the combined effect of an increase in the grain size and a decrease in the grain boundary potential and film homogeneity. Thicker films may exhibit higher carrier concentrations due to a reduction in surface-related defects and scattering phenomena. However, excessively thick films can introduce strain and stress, potentially leading to defect formation that can adversely affect carrier concentration and mobility.

4. Conclusions and Summary

Two TCO samples were investigated by optical spectroscopy, SEM—EDS, and Hall measurements. The first sample was made of a float glass substrate and 540 nm FTO coating (SAMPLE1), while the second sample was also prepared on a similar substrate, but the thickness of the FTO layer was 340 nm (SAMPLE2). No significant differences were detected by spectroscopic characterization. Similar spectra for both samples suggested very similar chemical and electrical parameters. If it was possible to easily determine the basic parameters using simple and quick spectrophotometric measurements, this method could be widely used in quality control processes at the production stage. This hypothesis was not supported by further studies using EDS and Hall. First, SEM with EDS demonstrated that for such a thin layer of FTO, unambiguous determination of the chemical composition of specific atoms is difficult. Additionally, the significant influence of the substrate can disturb the results. As expected, the thicker layer had better electrical parameters, such as sheet resistance or conductivity. Additionally, the mobility of charge carriers was the highest for that sample. From the optical spectrum in the VIS region, the bandgap values were found to be identical for both samples. In both cases, the Hall coefficient was negative, which indicated that electrons are the majority carriers in that material. The sheet charge carrier concentration was greater for SAMPLE1, but surprisingly, the bulk charge carrier concentration was greater for the SAMPLE2 sample. This could be caused by the relatively low thickness of the coating, which introduces quantum effects on the surface. In this work, we show that a thicker FTO layer made using the pyrolysis process (540 nm) is more suitable for PV and transparent electronic applications due to its higher mobility and lower resistivity. Moreover, a thicker layer does not reduce the transmittance in the VIS I IR region, which is crucial for the III generation of photovoltaic devices.

Author Contributions

Conceptualization, P.K.; Methodology, P.K.; Software, P.K., A.G.-C., A.G. and J.C.; Validation, P.K.; Formal analysis, P.K.; Investigation, P.K., A.G.-C. and A.G.; Resources, P.K., A.G.-C., J.C., A.M. and Z.K.; Data curation, P.K., A.G.-C., J.C., A.M. and Z.K.; Writing—original draft, P.K., A.G.-C., A.G., J.C., A.M. and Z.K.; Writing—review & editing, P.K.; Visualization, P.K. All authors have read and agreed to the published version of the manuscript.

Funding

This research received no external funding.

Data Availability Statement

The original contributions presented in the study are included in the article, further inquiries can be directed to the corresponding author. This study was supported by the POIR.01.02.00-00-0265/17-00.

Conflicts of Interest

Author Paweł Kwaśnicki was employed by the company ML System S.A. The remaining authors declare that the research was conducted in the absence of any commercial or financial relationships that could be construed as a potential conflict of interest.

References

  1. Ciuła, J.; Generowicz, A.; Gronba-Chyła, A.; Wiewiórska, I.; Kwaśnicki, P.; Cygnar, M. Analysis of the Efficiency of Landfill Gas Treatment for Power Generation in a Cogeneration System in Terms of the European Green Deal. Sustainability 2024, 16, 1479. [Google Scholar] [CrossRef]
  2. Sciuto, G.L.; Capizzi, G.; Shikler, R.; Napoli, C. Organic solar cells defects classification by using a new feature extraction algorithm and an EBNN with an innovative pruning algorithm. Int. J. Intell. Syst. 2021, 36, 2443–2464. [Google Scholar] [CrossRef]
  3. Sciuto, G.L.; Coco, S. A 3D finite element model of degradation phenomena in organic solar devices affected by oxidation. Int. J. Energy Environ. Eng. 2020, 11, 431–437. [Google Scholar] [CrossRef]
  4. Barbusiński, K.; Kwaśnicki, P.; Gronba-Chyła, A.; Generowicz, A.; Ciuła, J.; Szeląg, B.; Fatone, F.; Makara, A.; Kowalski, Z. Influence of Environmental Conditions on the Electrical Parameters of Side Connectors in Glass–Glass Photovoltaic Modules. Energies 2024, 17, 680. [Google Scholar] [CrossRef]
  5. Sciuto, G.L.; Napoli, C.; Capizzi, G.; Shikler, R. Organic solar cells defects detection by means of an elliptical basis neural network and a new feature extraction technique. Optik 2019, 194, 163038. [Google Scholar] [CrossRef]
  6. Kwaśnicki, P.; Gronba-Chyła, A.; Generowicz, A.; Ciuła, J.; Wiewiórska, I.; Gaska, K. Alternative method of making electrical connections in the 1st and 3rd generation modules as an effective way to improve module efficiency and reduce production costs. Arch. Thermodyn. 2023, 44, 179–200. [Google Scholar] [CrossRef]
  7. Prete, P.; Lovergine, N. Dilute nitride III-V nanowires for high-efficiency intermediate-band photovoltaic cells: Materials requirements, self-assembly methods and properties. Prog. Cryst. Growth Charact. Mater. 2020, 66, 100510. [Google Scholar] [CrossRef]
  8. Ziani, N.; Belkaid, M.S. Computer Modelling Zinc Oxide/Silicon Heterojunction Solar Cells. J. Nano Electron. Phys. 2018, 10, 06002. [Google Scholar] [CrossRef]
  9. Afre, R.; Sharma, N.; Sharon, M.; Sharon, M. Transparent Conducting Oxide Films for Various Applications: A Review. Rev. Adv. Mater. Sci. 2018, 53, 79–89. [Google Scholar] [CrossRef]
  10. Yu, L.; O’Donnell, B.; Alet, P.-J.; Cabarrocas, P.R. All-in situ fabrication and characterization of silicon nanowires on TCO/glass substrates for photovoltaic application. Sol. Energy Mater. Sol. Cells 2010, 94, 1855–1859. [Google Scholar] [CrossRef]
  11. Preeti; Kumar, S. Extraction and analysis of TCO coated glass from waste amorphous silicon thin film solar module. Sol. Energy Mater. Sol. Cells 2023, 253, 112227. [Google Scholar] [CrossRef]
  12. He, T.; Xie, A.; Reneker, D.H.; Zhu, Y. A tough and high-performance transparent electrode from a scalable and transfer-free method, Wu. ACS Nano 2014, 8, 4782–4789. [Google Scholar] [CrossRef]
  13. Chiu, H.L.; Hong, K.B.; Huang, K.C.; Lu, T.C. Photonic Crystal Surface Emitting Lasers with Naturally, Formed Periodic ITO Structures. ACS Photonics 2019, 6, 684–690. [Google Scholar] [CrossRef]
  14. Sima, C.; Grigoriu, C.; Antohe, S. Comparison of the dye-sensitized solar cells performances based on transparent conductive ITO and FTO. Thin Solid Film. 2010, 519, 595–597. [Google Scholar] [CrossRef]
  15. Sang, B.; Kushiya, K.; Okumura, D.; Yamase, O. Performance improvement of CIGS-based modules by depositing high-quality Ga-doped ZnO windows with magnetron sputtering. Sol. Energy Mater. Sol. Cells 2001, 67, 237–245. [Google Scholar] [CrossRef]
  16. Miccoli, I.; Spampinato, R.; Marzo, F.; Prete, P.; Lovergine, N. DC-magnetron sputtering of ZnO:Al films on (00.1)Al2O3 substrates from slip-casting sintered ceramic targets. Appl. Surf. Sci. 2014, 313, 418–423. [Google Scholar] [CrossRef]
  17. Li, G.F.; Zhou, J.; Huang, Y.W.; Yang, M.; Feng, J.H.; Zhang, Q. Indium zinc oxide semiconductor thin films deposited by dc magnetron sputtering at room temperature. Vacuum 2010, 85, 22–25. [Google Scholar] [CrossRef]
  18. Lai, K.; Sun, Y.; Chen, H.; Zhi, L.; Wei, W. Effect of oxygen vacancy and Al-doping on the electronic and optical properties in SnO2. Phys. B Condens. Matter. 2013, 428, 48–52. [Google Scholar] [CrossRef]
  19. Park, J.H.; Buurma, C.; Sivananthan, S.; Kodama, R.; Gao, W.; Gessert, T.A. The effect of postannealing on Indium Tin Oxide thin films by magnetron sputtering method. Appl. Surf. Sci. 2014, 307, 388–392. [Google Scholar] [CrossRef]
  20. Chavan, G.T.; Kim, Y.; Khokhar, M.Q.; Hussain, S.Q.; Cho, E.-C.; Yi, J.; Ahmad, Z.; Rosaiah, P.; Jeon, C.-W. A Brief Review of Transparent Conducting Oxides (TCO): The Influence of Different Deposition Techniques on the Efficiency of Solar Cells. Nanomaterials 2023, 13, 1226. [Google Scholar] [CrossRef]
  21. Hussain, S.Q.; Kim, S.; Ahn, S.; Balaji, N.; Lee, Y.; Lee, J.H.; Yi, J. Influence of high work function ITO:Zr films for the barrier height modification in a-Si:H/c-Si heterojunction solar cells. Sol. Energy Mater. Sol. Cells 2014, 122, 130–135. [Google Scholar] [CrossRef]
  22. Lee, J.Y.; Connor, S.T.; Cui, Y.; Peumans, P. Solution-processed metal nanowire mesh transparent electrodes. Nano Lett. 2008, 8, 689–692. [Google Scholar] [CrossRef] [PubMed]
  23. Madaria, A.R.; Kumar, A.; Ishikawa, F.N.; Zhou, C. Uniform, highly conductive and patterned transparent films of a percolating silver nanowire network on rigid and flexible substrates using a dry transfer technique. Nano Res. 2010, 3, 564–573. [Google Scholar] [CrossRef]
  24. Rathmell, A.R.; Bergin, S.M.; Hua, Y.L.; Li, Z.Y.; Wiley, B.J. The growth mechanism of copper nanowires and their properties in flexible, transparent conducting films. Adv. Mater. 2010, 22, 3558–3563. [Google Scholar] [CrossRef] [PubMed]
  25. Mohl, M.; Dombovari, A.; Vajtai, R.; Ajayan, P.M.; Kordas, K. Self-assembled large scale metal alloy grid patterns as flexible transparent conductive layers. Sci. Rep. 2015, 5, 13710. [Google Scholar] [CrossRef] [PubMed]
  26. Jung, Y.S.; Park, Y.S.; Kim, K.H.; Lee, W.J. Properties of AZO/Ag/AZO multilayer thin film deposited on polyethersulfone substrate. Trans. Electr. Electron. Mater. 2013, 14, 9–11. [Google Scholar] [CrossRef]
  27. Rosli, N.N.; Ibrahima, M.A.; Ludin, N.A.; Teridi, M.A.M.; Sopian, K. A review of graphene based transparent conducting films for use in solar photovoltaic applications. Renew. Sustain. Energy Rev. 2019, 99, 83–99. [Google Scholar] [CrossRef]
  28. Sun, J.; Jasieniak, J.J. Semitransparent solar cells. Phys. D Aplik. Fiz. 2017, 50, 093001. [Google Scholar] [CrossRef]
  29. Jang, J.S.; Kim, J.; Ghorpade, U.; Shin, H.H.; Gang, M.G.; Park, S.D.; Kim, H.J.; Lee, D.S.; Kim, J.H. Comparison study of ZnO-based quaternary TCO materials for photovoltaic application. J. Alloys Compd. 2019, 793, 499–504. [Google Scholar] [CrossRef]
  30. Kim, I.Y.; Shin, S.W.; Gang, M.G.; Lee, S.H.; Gurav, K.V.; Patil, P.S.; Yun, J.H.; Lee, J.Y.; Kim, J.H. Comparative study of quaternary Mg and Group III element codoped ZnO thin films with transparent conductive characteristics. Thin Solid Film. 2014, 570, 321–325. [Google Scholar] [CrossRef]
  31. Karakaya, S.; Kaba, L. Wrinkle type nanostructured of Al-Ce codoped ZnO thin films for photocatalytic applications. Surf. Interfaces 2024, 44, 103655. [Google Scholar] [CrossRef]
  32. Saarenpaa, H.; Niemi, T.; Tukiainen, A.; Lemmetyinen, H.; Tkachenko, N. Aluminum doped zinc oxide films grown by atomic layer deposition for organic photovoltaic devices. Sol. Energy Mater. Sol. Cells 2010, 94, 1379–1383. [Google Scholar] [CrossRef]
  33. Gultepe, O.; Atay, F. The effect of Al element on structural, optical, electrical, surface and photocatalytic properties of Solgel derived ZnO films. Appl. Phys. A 2022, 128, 25. [Google Scholar] [CrossRef]
  34. Kumawat, A.; Sharma, A.; Chattopadhyay, S.; Misra, K.P. Temperature dependent photoluminescence in Sol-gel derived Ce doped ZnO nanoparticles. Mater. Today Proc. 2021, 43, 2965–2969. [Google Scholar] [CrossRef]
  35. Kumawat, A.; Chattopadhyay, S.; Misra, R.D.K.; Misra, K.P.; Valiyaneerilakkal, U. Significance of microstrain in impacting band gap and photoluminescence behavior of Ce-doped ZnO thin films deposited via sol-gel process. Phys. Scr. 2023, 98, 025816. [Google Scholar] [CrossRef]
  36. Anand, V.; Sakthivelu, A.; Kumar, K.D.A.; Valanarasu, S.; Ganesh, V.; Shkir, M.; Kathalingam, A.; AlFaify, S. Novel rare earth Gd and Al co-doped ZnO thin films prepared by nebulizer spray method for optoelectronic applications. Superlattices Microstruct. 2018, 123, 311–322. [Google Scholar] [CrossRef]
  37. Anand, V.; Sakthivelu, A.; Kumar, K.D.A.; Valanarasu, S.; Ganesh, V.; Shkir, M.; AlFaify, S.; Algarni, H. Rare earth Eu3+ codoped AZO thin films prepared by nebulizer spray pyrolysis technique for optoelectronics. J. Solgel Sci. Technol. 2018, 86, 293–304. [Google Scholar] [CrossRef]
  38. Anand, V.; Sakthivelu, A.; Deva Arun Kumar, K.; Valanarasu, S.; Kathalingam, A.; Ganesh, V.; Shkir, M.; AlFaify, S.; Yahia, I.S. Rare earth Sm3+ codoped AZO thin films for opto-electronic application prepared by spray pyrolysis. Ceram. Int. 2018, 44, 6730–6738. [Google Scholar] [CrossRef]
  39. Üzar, N.; Algün, G.; Akçay, N.; Akcan, D.; Arda, L. Structural, optical, electrical and humudity sensing properties of (Y/Al) codoped ZnO thin films. J. Mater. Sci. Mater. Electron. 2017, 28, 11861–11870. [Google Scholar] [CrossRef]
  40. Mereu, R.A.; Mesaros, A.; Vasilescu, M.; Popa, M.; Gabor, M.S.; Ciontea, L.; Petrisor, T. Synthesis and characterization of undoped, Al and/or Ho doped ZnO thin Films. Ceram. Int. 2013, 39, 5535–5543. [Google Scholar] [CrossRef]
  41. Ahmed, M.A.M.; Meyer, W.E.; Nel, J.M. Effect of (Ce, Al) codoped ZnO thin films on the Schottky diode properties fabricated using the sol-gel spin coating. Mater. Sci. Semicond. Process. 2019, 103, 104612. [Google Scholar] [CrossRef]
  42. Kumar, K.D.A.; Thomas, R.; Valanarasu, S.; Ganesh, V.; Shkir, M.; AlFaify, S.; Thirumalai, J. Analysis of Pr codoped Al: ZnO thin flms using feasible nebulizer spray technique for optoelectronic technology. Appl. Phys. A 2019, 125, 712. [Google Scholar] [CrossRef]
  43. Sharma, A.; Kumawat, A.; Chattopadhyay, S.; Khangarot, R.K.; Halder, N.; Misra, R.D.K.; Misra, K.P. Band gap reduction and Zn related defects enhancement in Zn(Al, Ce)O nanoparticles. Mater. Today Proc. 2022, 60, 21–25. [Google Scholar] [CrossRef]
  44. Kambe, M.; Fukawa, M.; Taneda, N.; Sato, K. Improvement of a-Si solar cell properties by using SnO2: F TCO films coated with an ultrathin TiO2 layer prepared by APCVD. Sol. Energy Mater. Sol. Cells 2006, 90, 3014–3020. [Google Scholar] [CrossRef]
  45. Consonni, V.; Rey, G.; Roussel, H.; Doisneau, B.; Blanquet, E.; Bellet, D. Preferential orientation of fluorine-doped SnO2 thin films: The effects of growth temperature. Acta Mater. 2013, 61, 22–31. [Google Scholar] [CrossRef]
  46. Yu, S.; Li, L.; Lyu, X.; Zhang, W. Preparation and investigation of nanothick FTO/Ag/FTO multilayer transparent electrodes with high figure of merit. Sci. Rep. 2016, 6, 20399. [Google Scholar] [CrossRef] [PubMed]
  47. Li, B.; Huang, L.; Ren, N.; Kong, X.; Cai, Y.; Zhang, J. Superhydrophobic and anti-reflective ZnO nanorod-coated FTO transparent conductive thin films prepared by a three-step method. J. Alloys Compd. 2016, 674, 368–375. [Google Scholar] [CrossRef]
  48. Mishima, R.; Hino, M.; Uzu, H.; Meguro, T.; Yamamoto, K. High-current perovskite solar cells fabricated with optically enhanced transparent conductive oxides. Appl. Phys. Express 2017, 10, 062301. [Google Scholar] [CrossRef]
  49. Shibayama, N.; Fukumoto, S.; Sugita, H.; Kanda, H.; Ito, S. Influence of transparent conductive oxide layer on the inverted perovskite solar cell using PEDOT: PSS for hole transport layer. Mater. Res. Bull. 2018, 106, 433–438. [Google Scholar] [CrossRef]
  50. Zhang, S.-T.; Foldyna, M.; Roussel, H.; Consonni, V.; Pernot, E.; Schmidt-Mende, L.; Rapenne, L.; Jiménez, C.; Deschanvres, J.-L.; Muñoz-Rojas, D.; et al. Tuning the properties of F:SnO2 (FTO) nanocomposites with S:TiO2 nanoparticles—Promising hazy transparent electrodes for photovoltaics applications. J. Mater. Chem. C 2017, 5, 91–102. [Google Scholar] [CrossRef]
  51. Kim, H.; Auyeung, R.C.Y.; Pique, A. Transparent conducting F-doped SnO2 thin films grown by pulsed laser deposition. Thin Solid Film. 2008, 516, 5052–5056. [Google Scholar] [CrossRef]
  52. Qia, F.; Chu, H.; Xie, Y.; Weng, Z. Recent progress of transparent conductive electrodes in the construction of efficient flexible organic solar cells. Int. J. Energy Res. 2022, 46, 4071–4087. [Google Scholar] [CrossRef]
  53. Way, A.; Luke, J.; Evans, A.D.; Li, Z.; Kim, J.-S.; Durrant, J.R.; Ka Hin Lee, H.; Tsoi, W.C. Fluorine doped tin oxide as an alternative of indium tin oxide for bottom electrode of semi-transparent organic photovoltaic devices. AIP Adv. 2019, 9, 085220. [Google Scholar] [CrossRef]
  54. Yang, Z.; Song, J.; Zeng, H.; Wang, M. Organic composition tailored perovskite solar cells and light-emitting diodes: Perspectives and advances. Mater. Today Energy 2019, 14, 100338. [Google Scholar] [CrossRef]
  55. Pulli, E.; Rozzi, E.; Bella, F. Transparent photovoltaic technologies: Current trends towards upscaling. Energy Convers. Manag. 2020, 219, 112982. [Google Scholar] [CrossRef]
  56. Husain, A.A.F.; Hasan, W.Z.W.; Shafie, S.; Hamidon, M.N.; Pandey, S.S. A review of transparent solar photovoltaic technologies. Renew. Sustain. Energy Rev. 2018, 94, 779–791. [Google Scholar] [CrossRef]
  57. Bhuvaneswari, P.V.; Velusamy, P.; Babu, R.R.; Babu, S.M.; Ramamurthi, K.; Arivanandhan, M. Effect of fluorine doping on the structural, optical and electrical properties of spray depositedcadmium stannate thin films. Mater. Sci. Semicond. Proc. 2013, 16, 1964–1970. [Google Scholar] [CrossRef]
  58. Arefi-Khonsari, F.; Bauduin, N.; Donsanti, F.; Amouroux, J. Deposition of transparent conductivetin oxide thin films doped with fluorine by PACVD. Thin Solid Film. 2003, 427, 208–214. [Google Scholar] [CrossRef]
  59. Elangovan, E.; Ramamurthi, K. Studies on microstructural and electrical properties of spray-deposited fluorine-doped tin oxide thin films from low-cost precursor. Thin Solid Film. 2005, 476, 231–236. [Google Scholar] [CrossRef]
  60. Elangovan, E.; Ramamurthi, K. A study on low cost-high conducting fluorine and antimony-doped tin oxide thin films. Appl. Surf. Sci. 2005, 249, 183–196. [Google Scholar] [CrossRef]
  61. Kim, J.H.; Jeon, K.A.; Kim, G.H.; Lee, S.Y. Lee Electrical, structural, and optical properties of ITO thin films prepared at room temperature by pulsed laser deposition. Appl. Surf. Sci. 2006, 252, 4834. [Google Scholar] [CrossRef]
  62. Martinez, A.I.; Acosta, D.R. Effect of the fluorine content on the structural and electrical properties of SnO2 and ZnO–SnO2 thin films prepared by spray pyrolysis. Thin Solid Film. 2005, 483, 107. [Google Scholar] [CrossRef]
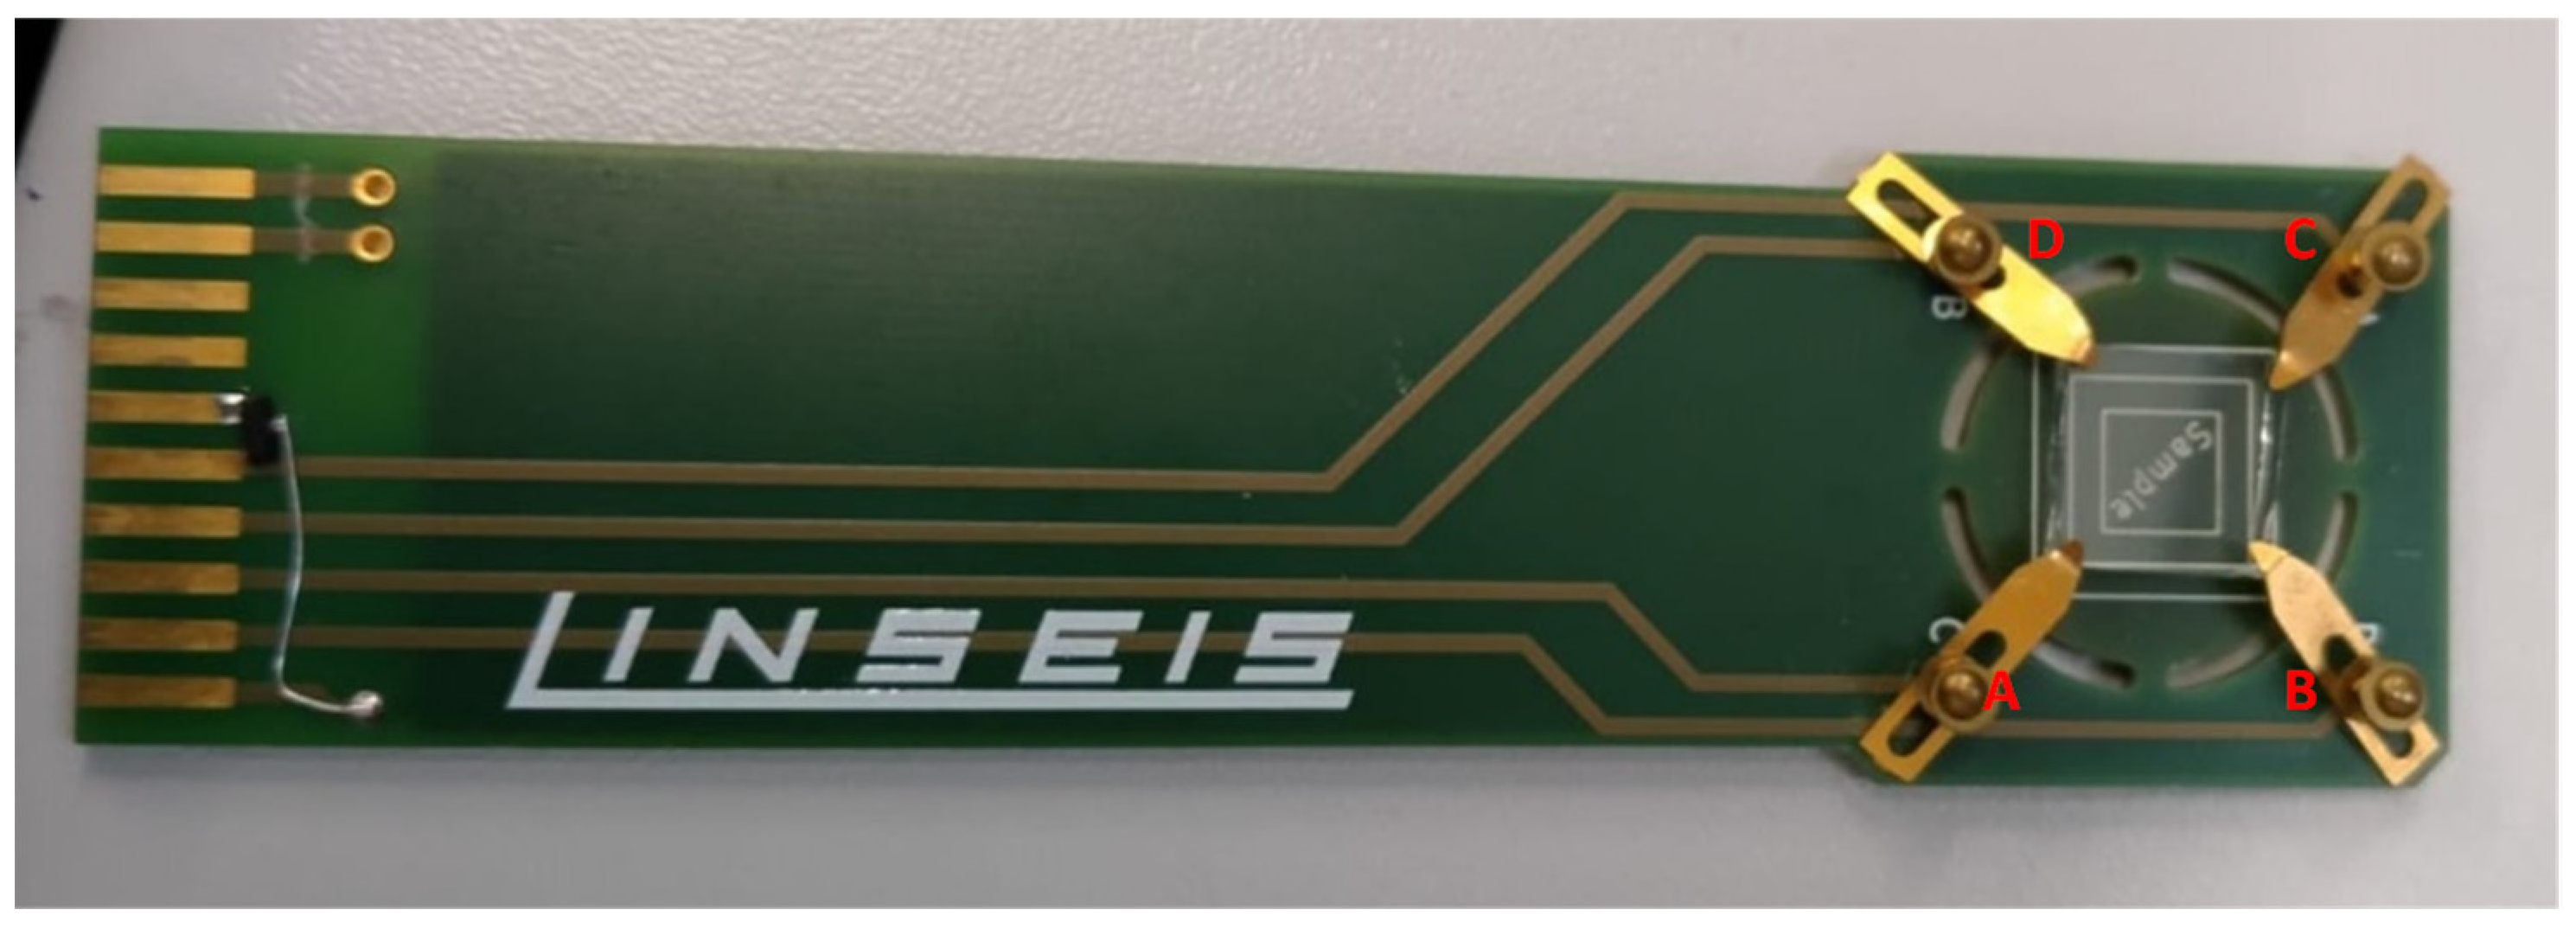
Figure 1. A sample with dimensions of 10 × 10 mm2 was mounted in the sample holder.
Energies 17 03122 g001
Figure 2. Results of optical measurements on samples 1 and 2 and substrates: standard float glass and highly transparent optical white glass for comparison.
Energies 17 03122 g002
Figure 3. Tauc plot of the allowed direct FTO transition.
Energies 17 03122 g003
Figure 4. SEM image of the surface of sample 1.
Energies 17 03122 g004
Figure 5. EDS spectrum collected on sample 1 (FTO 540 nm) for both sides (FTO and the back glass on top).
Energies 17 03122 g005
Figure 6. EDS spectrum collected on sample 2 (FTO 340 nm) for both sides (FTO and the back glass on top).
Energies 17 03122 g006
Table 1. Hall parameters were determined for the SAMPLE1 sample (540 nm of FTO).
SAMPLE1
Sample IDSheet
Resistance (Ω−1)
±0.01
Resistivity
(Ω cm)
±0.02 × 10−0.4
Conductivity (Ω−1 cm−1)
±0.02 × 10²
CCC Bulk (cm−3)
±0.05 × 10²⁰
CCC Sheet (cm−2)
±0.05 × 10²⁰
BD Cross Hall Coef. (cm3 C−1)
±0.01 × 10⁻²
AC Cross Hall Coef. (cm3 C−1)
±0.01 × 10⁻²
Avg. Hall Coef. (cm3 C−1)
±0.01 × 10⁻²
Mobility
(cm2 V−1 s−1)
±0.01
1.17.474.03 × 10−42480−4.18 × 10²⁰−2.26 × 10²⁰−0.0150−0.0149−0.0149−37.06
1.27.504.05 × 10−42470−3.91 × 10²⁰−2.11 × 10²⁰−0.0161−0.0159−0.0160−39.44
1.37.544.07 × 10−42456−3.98 × 10²⁰−2.15 × 10²⁰−0.0158−0.0156−0.0157−38.54
AVG7.504.05 × 10−42469−4.02 × 10²⁰−2.17 × 10²⁰−0.0156−0.0155−0.0155−38.34
SD0.040.02 × 10−4120.14 × 10200.08 × 10200.00060.00050.00051.20
Table 2. The Hall parameters were determined for sample 2 (with a wavelength of 340 nm for FTO).
SAMPLE2
Sample IDSheet
Resistance (Ω−1)
±0.01
Resistivity
(Ω cm)
±0.02 × 10−0.4
Conductivity (Ω−1 cm−1)
±0.02 × 10²
CCC Bulk (cm−3)
±0.05 × 10²⁰
CCC Sheet (cm−2)
±0.05 × 10²⁰
BD Cross Hall Coef. (cm3 C−1)
±0.01 × 10⁻²
AC Cross Hall Coef. (cm3 C−1)
±0.01 × 10⁻²
Avg. Hall Coef. (cm3 C−1)
±0.01 × 10⁻²
Mobility
(cm2 V−1 s−1)
±0.01
2.113.794.69 × 10−42133−4.34 × 10²⁰−1.48 × 10²⁰−0.0144−0.0144−0.0144−30.67
2.214.444.91 × 10−42037−4.35 × 10²⁰−1.48 × 10²⁰−0.0143−0.0144−0.0143−29.23
2.313.164.47 × 10−42235−4.67 × 10²⁰−1.59 × 10²⁰−0.0134−0.0134−0.0134−29.85
AVG13.804.69 × 10−42135−4.45 × 10²⁰−1.51 × 10²⁰−0.0140−0.0141−0.0140−29.92
SD0.640.22 × 10−4990.19 × 10200.07 × 10200.00060.00060.00060.72
Disclaimer/Publisher’s Note: The statements, opinions and data contained in all publications are solely those of the individual author(s) and contributor(s) and not of MDPI and/or the editor(s). MDPI and/or the editor(s) disclaim responsibility for any injury to people or property resulting from any ideas, methods, instructions or products referred to in the content.