Abstract
There has been a rising interest in the iron and steel industry in replacing fossil-based carbon carriers in their processes because they are the main origin of the anthropogenic carbon emissions within the industry. The use of bio-based carbon carriers could be one solution to partly tackle this challenge. Conventionally, biocarbon is produced by pyrolysis with fixed heating rate, pyrolysis temperature, and retention time. Although the mechanisms behind the formation of biocarbon and the decomposition temperatures of the main compounds of biomass-based materials are known, this knowledge is rarely being utilized in the design of commercial pyrolysis reactors, even though the pyrolysis mechanism-based approach increases the biocarbon yield. In this study, the mechanistic pathway of carbonization of lignocellulosic biomass is taken into account to produce biocarbon with higher yield and quality than conventional pyrolysis with the same process time. Results show that when the process time is the same in both methods, segmented pyrolysis increases biocarbon yield up to 5.4% within a pyrolysis temperature range from 300 °C to 900 °C. Also, fixed carbon yield increased 1.5% in this temperature area. When using segmented pyrolysis, the most suitable pyrolysis temperature is 700 °C based on the characteristics of the produced biocarbon.
1. Introduction
Carbon is an essential element in metallurgical processes. Depending on the process, carbon is used as an alloying element, reducing agent, foaming agent, or even as a structural bed material to provide uniform distribution of gas and heat in the furnace [1,2]. Carbon also works as a fuel, providing heat for the endothermic reactions in the process. In pyrometallurgical processes, the functionality of carbon is often based on its reaction with oxygen, thus generating considerable amounts of carbon dioxide (CO2) emissions [3]. To prevent excessive amounts of CO2 formation, alternatives to fossil-based carbon have been proposed and investigated for a few decades already [4]. Based on the findings so far, biomass is considered to be a potential secondary carbon carrier in the iron and steel industry [1,2,3,4,5]. Biomass-based carbon sources can be used in steel making, for example, as a part of coke blends, directly injected into blast furnaces (BF) or as a foaming agent in electric arc furnaces [1,6].
There are several factors that define how suitable the produced biocarbon is for metallurgical use, and the needed properties vary between the applications. For example, when biocarbon is used as a blast furnace injectant, the moisture content could be as high as 20%, whereas when used as a foaming agent in an electric arc furnace (EAF), the suitable moisture content is typically below 7% [7]. In general, carbon carriers must have high fixed carbon content and low volatile matter and moisture content when used in metallurgical applications [8].
These requirements set up several problems related to the use of biomass-based carbon sources without any pre-treatment of the biomass. Generally, the carbon content of raw, lignocellulosic biomass is low, while the oxygen and moisture content are relatively high. The excessive volatile and moisture content may further lead to difficulties in process controllability and flue gas treatment. In terms of meeting the requirements of metallurgical applications, thermochemical conversion of biomass for example pyrolysis could be considered as a potential method to improve the properties of biomass. Pyrolysis is a method whereby thermal energy, in the absence of oxygen, is used for conversion of raw biomass into different products such as biocarbon, pyrolysis oil, and pyrolysis gas [2].
Traditionally, the ways to produce biocarbon are divided into three main categories based on process parameters, such as heating rate and pyrolysis temperature. These categories are slow, fast, and flash pyrolysis [9,10]. The yield of different pyrolysis products can be varied by altering the process conditions. For example, slow pyrolysis favors the formation of solid biocarbon, whereas fast pyrolysis leads to increased formation of pyrolysis oil [11]. In recent years, the research in these three categories has been focused on studying the effect of process parameters such as pyrolysis temperature, reaction time, and heating rate on biocarbon yield during pyrolysis. Additionally, the effect of process conditions on carbon and oxygen content has been investigated [12,13,14].
In those previously mentioned studies, linear heating rates were used [12,13,14]. The linear heating rate means that the feedstock is heated at a constant heating rate to the target temperature and then held at that target temperature for a specified time. However, it is suggested that instead of using one heating ramp and one temperature where feedstock is held, pyrolysis could be divided into multiple stages [15,16]. This is called segmented or multi-stage pyrolysis. The concept of multi-stage pyrolysis was originally developed for utilizing the exothermic temperature areas of pyrolysis of lignocellulosic biomass for the reduction of energy consumption in the process [17]. Based on this concept, two-stage pyrolysis was introduced in 2010 by Lam et al. [16]. In this concept, pyrolysis is divided into four phases:
- Heating at a constant rate to the first target temperature.
- Holding stage at the target temperature.
- Heating at a constant rate to the second target temperature.
- Holding stage at the target temperature.
Based on the concept presented above, the two-stage pyrolysis was mathematically modelled by Lam et al. [16]. The model showed that, in theory, two-stage pyrolysis could reduce energy consumption by 21.7% compared to conventional slow pyrolysis with a linear heating rate [16]. The modelling work of two-stage pyrolysis was continued by Cheung et al. [15]. They concluded that the energy-saving potential is even higher, up to 22.5%, compared to conventional pyrolysis [15].
Oyedun et al. [18] performed two-stage pyrolysis experiments using a laboratory scale pyrolysis reactor. The feedstock used was endospermum wood (Endospermum chinense). They reported that energy consumption was reduced by up to 29% compared to conventional pyrolysis when two-stage pyrolysis was used. They pointed out that the main reason behind reduced energy consumption was that the heat from the exothermic reactions was used to heat the samples to higher temperatures. According to them, the temperature area where the exothermic reactions occur is relatively narrow, between 270 °C and 400 °C. Because of this, they suggested that when using segmented pyrolysis, the optimal temperature for the first phase is in this temperature range [18]. Cai et al. [19] pyrolyzed different wood-based feedstock. They suggested that when segmented pyrolysis is being used, the suitable temperature range for the first stage is from 270 °C to 360 °C. This temperature range was selected based on the decomposition of feedstock. Jian et al. [20] ended up suggesting that based on biocarbon yield, the suitable temperature range for the first stage is even narrower, between 320 °C and 380 °C.
Oyedun et al. [21] focused on comparing the biocarbon properties produced by both segmented and conventional methods when the final pyrolysis temperature was 400 °C. They found out that two-stage segmented pyrolysis increases biocarbon and fixed carbon yield when the endospermum wood (Endospermum chinense) was pyrolyzed at 400 °C. Babinszki et al. [12] increased the final pyrolysis temperature to 700 °C. They found out that when two-stage pyrolysis takes place with a final temperature between 500 °C and 700 °C, it leads to increased biocarbon yield compared to conventional pyrolysis. However, it was shown by Jian et al. [20] that the biocarbon yield in two-stage pyrolysis depends on the temperature of the first stage and the final temperature of the pyrolysis. Their studies showed that with the final pyrolysis temperature of 1028 °C, biocarbon yield decreases when the first stage temperature is increased from 320 °C to 380 °C. On the other hand, when final pyrolysis occurs at 800 °C, biocarbon yield increases when the temperature for the first stage increases from 320 °C to 358 °C. These results suggest that the optimal temperature for the first stage varies depending on the final pyrolysis temperature.
The concept of three-stage pyrolysis was first introduced by Han et al. [22], and the idea was further developed by Qian et al. [23]. The idea of this concept is very similar to two-stage pyrolysis, but instead of using two holding stages, three holding stages are used. The idea of these stages is that the first stage is used to reduce the feedstock’s moisture content. In the second stage, the feedstock temperature is brought close to its decomposition temperature, and the third stage is used to finalize the pyrolysis process. The results obtained by Han et al. [22] and Qi et al. [23] show that three-stage pyrolysis leads to increased mass and energy yield compared to conventional pyrolysis. Also compared to conventional pyrolysis, biocarbon quality is increased when three-stage pyrolysis is used [23].
The aim of this study was to improve the production rate of solid biocarbon in pyrolysis without degrading, or even simultaneously improving, the quality of the produced biocarbon. This was done by implementing three-stage pyrolysis instead of conventional pyrolysis. Conventional pyrolysis was investigated as a reference case in this study. Solid yield, yield of fixed carbon, and higher heating value (HHV), among other properties of the soft wood-based biocarbon, were analyzed for determination of the differences in quality and production rate of biocarbon between the two pyrolysis methods. Linear heating rates were applied in the reference case while staged heating was carried out in the three-stage pyrolysis. The stages of the three-stage pyrolysis were based on the thermal decomposition temperature data of the major components of woody biomass (cellulose, hemicellulose, and lignin), which were pre-determined using thermogravimetric analysis (TGA). The final pyrolysis temperatures were chosen so that biocarbons produced at those temperatures have utilization potential on metallurgical applications [2]. Moreover, the total process time between the reference pyrolysis and three-stage pyrolysis were kept the same, which means that the differences in biocarbon production rates between the methods can be observed from solid biocarbon yield and yield of fixed carbon.
2. Materials and Methods
2.1. Materials
In these experiments, Finnish spruce (Picea abies) cutter flakes were used. The biomass was milled into powder prior to the proximate analysis. In pyrolysis experiments, non-milled cutter flakes were used. The proximate analysis of feedstock is given in Table 1. The obtained volatile content was close to the value of 79.21% reported by Grigiante et al. [24]. The ash content of spruce is in line with the typical ash content of wood, which varies from 0.1% to 16.5% [25].

Table 1.
Proximate analysis of spruce.
2.2. Charazterization Methodology
2.2.1. Thermogravimetric Analysis and Mass Spectrometry
The proximate analysis of ground spruce and non-milled biocarbons was done by using the TGA device Netzsch STA 449 F3 Jupiter (Netzsch-Gerätebau GmbH, Selb, Germany) coupled with the Netzsch QMS 403C quadropole mass spectrometer (Netzsch-Gerätebau GmbH, Selb, Germany). The program to determine moisture, volatile matter, and ash content was designed based on the program reported by Cassel and Menard [26].
Approximately 50 mg of spruce and biocarbons were used in the thermogravimetric analyses. At the beginning of the program, the total gas flow was 200 mL/min, and nitrogen (N2) gas was used. The heating rate was 20 °C/min. When the temperature reached 105 °C, it was held at that temperature for 20 min to determinate the moisture content of the samples. After that, the heating rate was set again to 20 °C/min, and the target temperature was 950 °C. The samples were kept at that temperature for 20 min to determinate their volatile matter content. After that, the gas flow was changed to contain 20% N2 and 80% air. Because of this mixture of gases, the carbonaceous material burns away. Based on the final weight, it is possible to determine the samples’ ash and fixed carbon content. The MS scanning width was 120, ranging from m/z 0 to 120. The scanning time was 60 s for each scan. The m/z range was based on values reported by Ingermarsson et al. [27]. The gas signals were characterized according to the National Institute of Standards and Technology (NIST). All of the tests were conducted at once, except for the 700L and 900L samples; these tests had to be repeated because of the unexplained anomalous results in the first measurements. Also, because of the 20 min holding stage, there was unwanted interference on DTG signal, so when these results are presented, the temperature axis starts at 135 °C.
To study the pyrolysis behavior of conventional and segmented pyrolysis, a TGA device, Netzsch STA 449 F3 Jupiter (Netzsch-Gerätebau GmbH, Selb, Germany), coupled with the Netzsch QMS 403C quadroble mass spectrometer (Netzsch-Gerätebau GmbH, Selb, Germany), was used. The used pyrolysis program was similar to actual pyrolysis experiments, but when conventional pyrolysis was used, samples were kept at their target temperature for 15 min. With three-stage pyrolysis, the holding time for each stage was 5 min. A more detailed description of the used heating programs is presented later in this study.
For conventional pyrolysis, the used programs were similar to actual pyrolysis experiments. This means that a heating rate of 5 °C/min was used for all programs, and samples were kept at their final pyrolysis temperatures for 15 min.
Argon was used as an inert gas for pyrolysis experiments conducted for both methods. A gas flow of 200 mL/min was applied in the experiments. Argon was selected as an inert gas because it does not have overlapping m/z signal peaks with devolatilized gaseous compounds released from spruce. In both conventional and segmented pyrolysis, the MS scanning width was 60, ranging from m/z 1 to 60. The scanning time was 30 s for each scan. This narrower scanning range improved the identification of the low-mass volatile compounds that were released during the pyrolysis.
2.2.2. Elemental Analysis
The milled biocarbons were subject to ultimate analysis. The ultimate analysis of five compounds—carbon (C), hydrogen (H), nitrogen (N), sulfur (S), and oxygen (O)—was made using an elemental analyzer Flash 2000 by Thermo Fisher Scientific (Waltham, MA, USA).
2.2.3. Biocarbon Yield
The biocarbon yield indicates how biomass resists thermal degradation. The mass yield of biocarbon (YC) is calculated using Equation (1), which was reported by Chen et al. [28].
where MP and MR are the sample weights before and after pyrolysis.
2.2.4. Fixed Carbon Yield
It is reported by Oyedun et al. [29] that in order to evaluate a biocarbon production method’s efficiency, the fixed carbon yield must also be taken into account alongside biocarbon content and fixed carbon content [21]. Fixed carbon yield provides information about the chemical changes of material conversion, and it helps to better compare biocarbons with different yields. Fixed carbon yield is defined as follows [21] (Equation (2)):
where feed ash is the ash content of the original feedstock.
2.2.5. Bulk Density
The bulk density of produced biocarbons was measured using the method presented by Abdullah and Geldart [30]. The samples were put into a container with known volume and weight. The container was filled up, and the surface of the container was flattened to remove any extra material. After that, the mass of the container was weighed. Based on the containers volume and mass, the bulk density was calculated using Equation (3), reported by Chevanan et al. [31].
2.2.6. Higher Heating Value
The higher heating value (HHV) of biocarbon was calculated using a modified Dulong’s formula reported by Theegala and Midgett [32]. Higher heating value is defined as follows (Equation (4)):
where wt.%C, wt.%H, and wt.%O are the weight percentages of carbon, hydrogen, and oxygen. Equation (4) assumes that the material does not contain sulfur, and that the difference between the masses of carbon, hydrogen, and nitrogen determines the oxygen content [32].
2.2.7. Energy Density
The energy density (E) of produced biocarbon was calculated using the measured bulk density and higher heating value. The energy density is calculated as follows (Equation (5)):
where HHV is the higher heating value (KJ/kg) and is the loose density of biocarbon (kg/m3).
2.3. Grinding
To grind material, a centrifugal mill, Retsch ZM 200 (Retsch GmbH, Haan, Germany), was used. In this study, spruce chips were only ground prior to determining spruce combustion behavior. This means that spruce chips were not ground before pyrolysis. For produced biocarbon, biocarbon was crushed first manually and then fed into a mill to produce pulverized biocarbon. At the grinding stage, the following parameters were used: rotor speed of 18,000 rpm, 12-tooth rotor blade, and a 0.50 cm grid.
2.4. Pyrolysis Experiments
Pyrolysis experiments were done using two methods: conventional and three-stage pyrolysis. Pyrolysis experiments were performed in an inert nitrogen atmosphere (2 L/min flow rate) in a laboratory-scale vertical furnace for both methods. The schematic illustration of the furnace is presented in Figure 1. The volume of the reactor was 10.1 L, with the diameter of the reactor tube being 200 mm, and the maximum feedstock bed height being 320 mm. During the experiments, cutter flakes were pre-dried at 105 °C for 21 h to determinate their moisture content. The moisture content of cutter flakes varied from 3.3% to 4.4%. Because the moisture content varied, the mass of pre-dried cutter flakes fed into the reactor also varied from 210.4 g to 212.8 g.
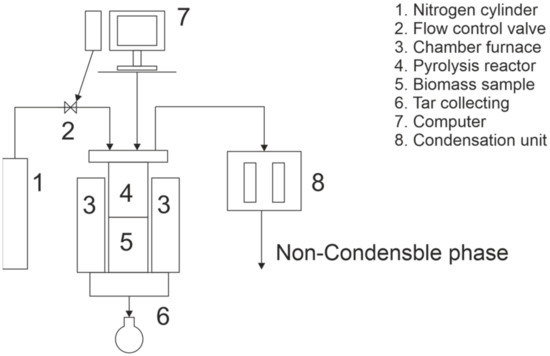
Figure 1.
Schematic illustration of used furnace.
The conventional pyrolysis of spruce was carried out by heating the spruce directly from room temperature to the target pyrolysis temperature using a heating rate of 5 °C/min. Pyrolysis temperatures were 300 °C, 500 °C, 700 °C, and 900 °C (300L, 500L, 700L and 900L, L = Linear). Samples were kept at their target temperatures for 8 h to ensure full carbonization of the samples. After the program ended, the reactor cooled freely to room temperature. The pyrolysis temperatures and holding times at the final pyrolysis temperature were chosen based on the literature. It is reported that the biocarbon yield decreases when the pyrolysis temperature rises from 300 °C to 500 °C. This decrease also continues towards higher temperatures. At the same time, the carbon content of biocarbon increases [2]. The long residence time increases the carbon content of produced biocarbon and ensures that the full carbonization of material takes place [12,33].
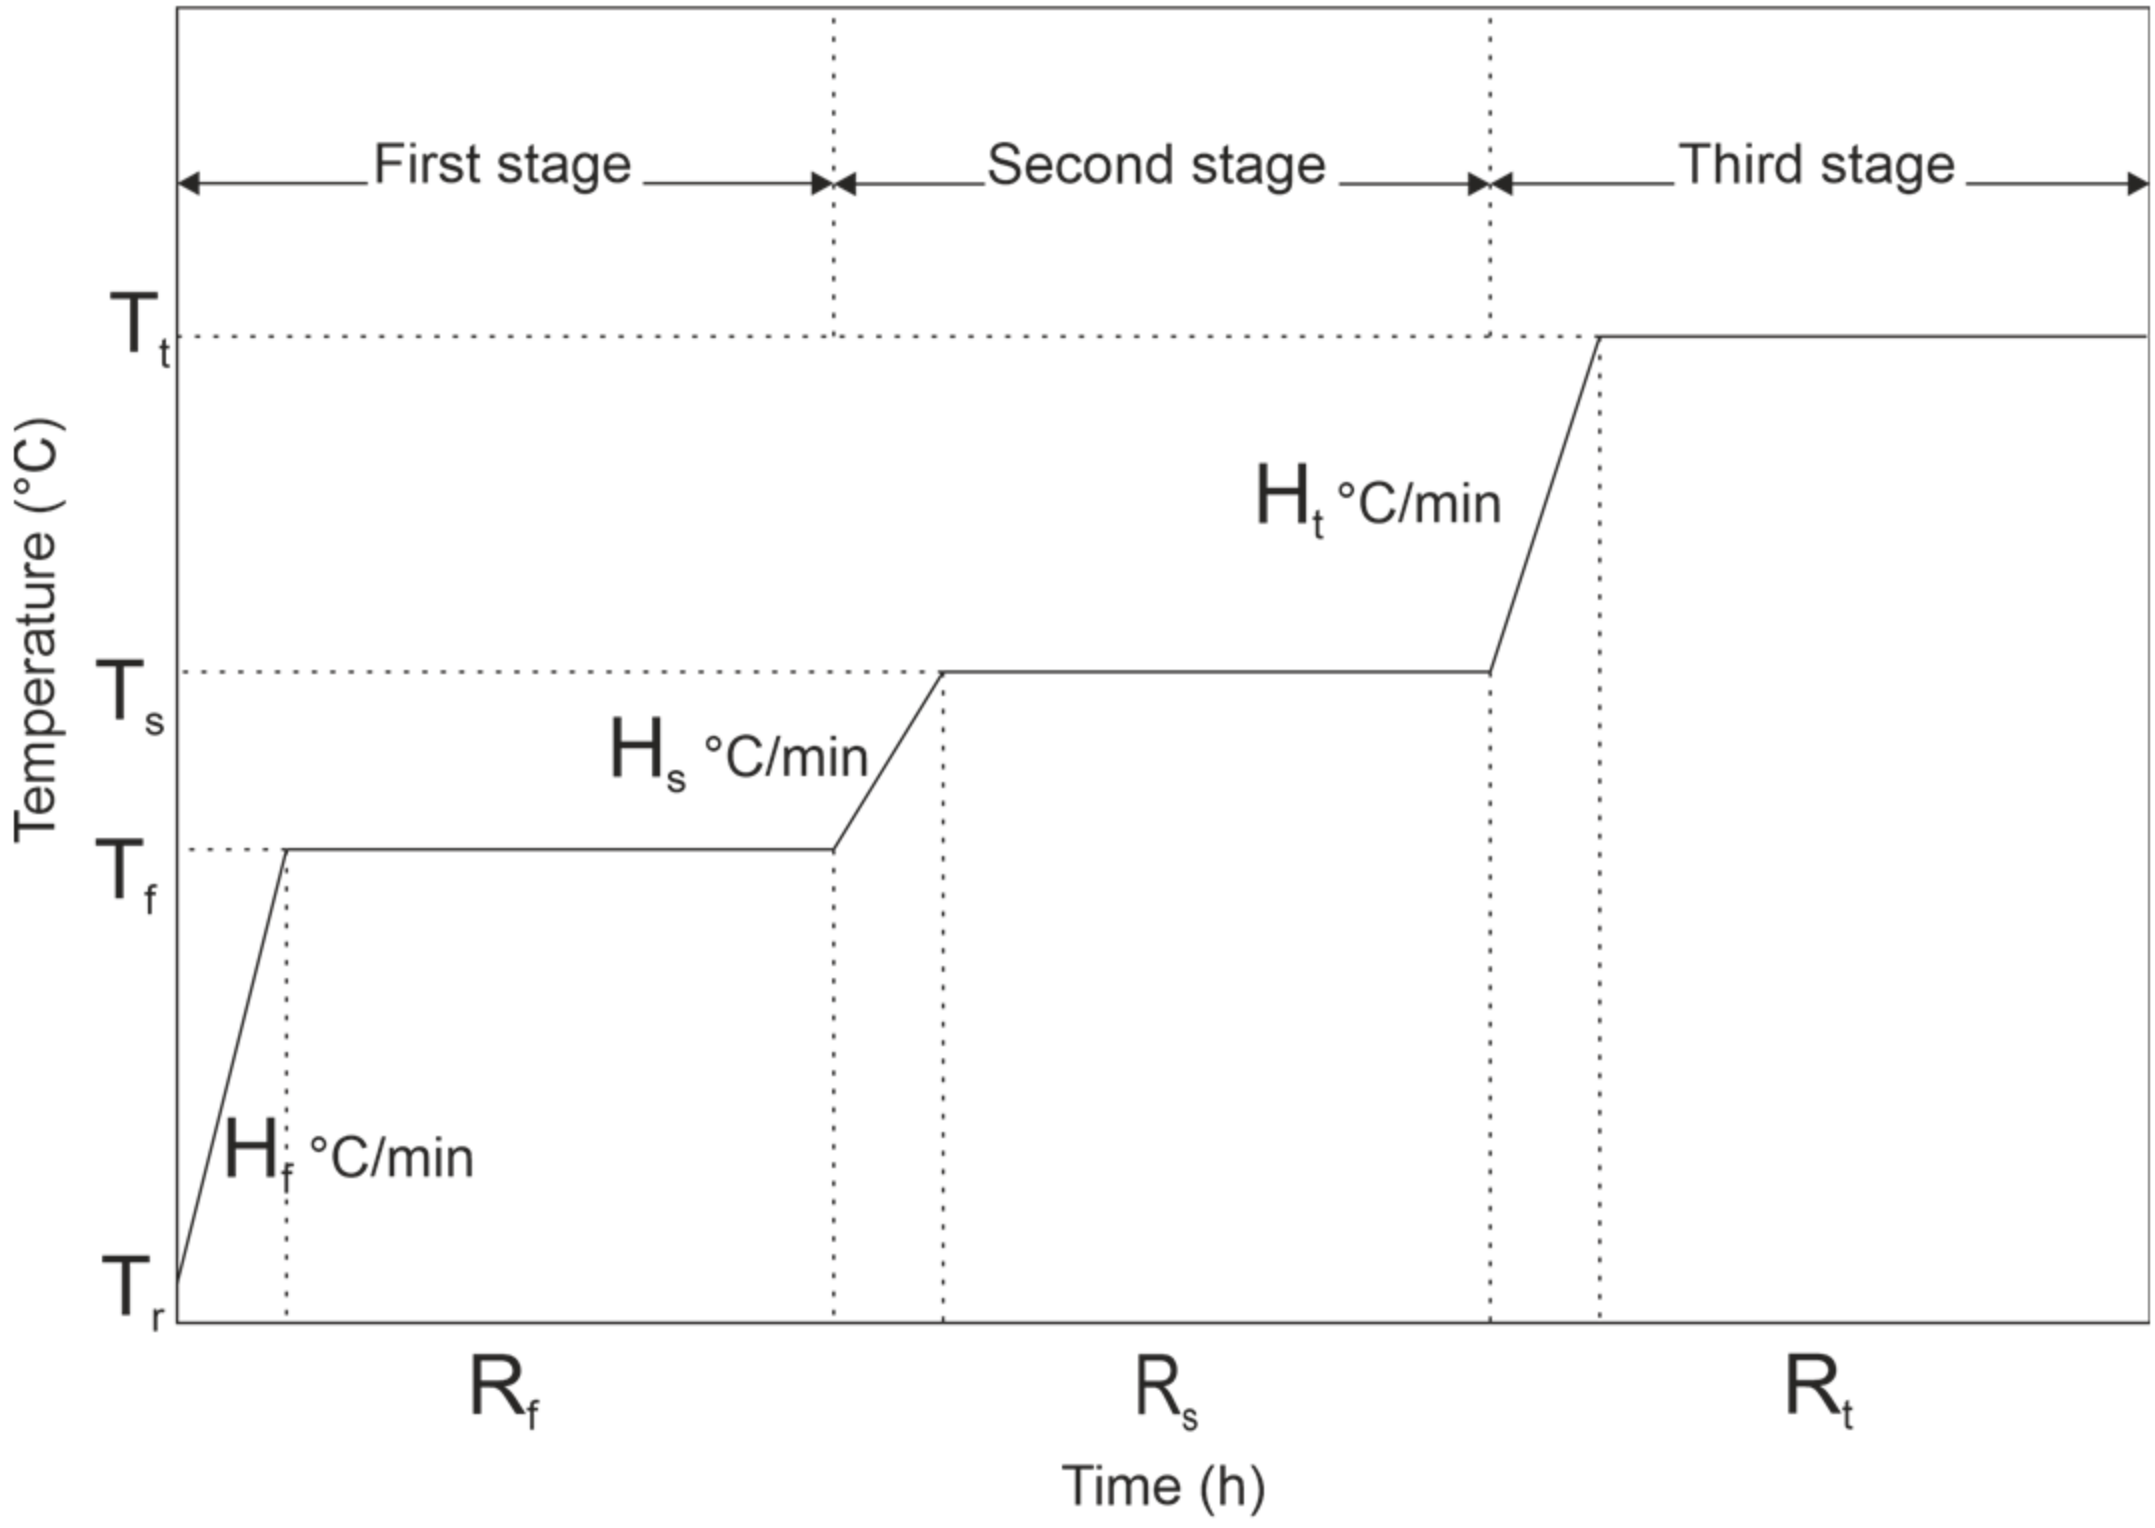
Three-stage segmented pyrolysis for spruce was done with final pyrolysis temperatures of 300 °C, 500 °C, 700 °C, and 900 °C (300S, 500S, 700S and 900S, S = Segmented). The temperature pattern of segmented pyrolysis is shown in Figure 2. The Tr refers to room temperature; Tf, Hf, and Rf refer to pyrolysis temperature, heating rate, and residence time at the first stage. Ts, Hs, and Rs refer to pyrolysis temperature, heating rate, and residence time in the second stage. Respectively, Tt, Ht, and Rt refer to pyrolysis temperature, heating rate, and residence time in the third stage.
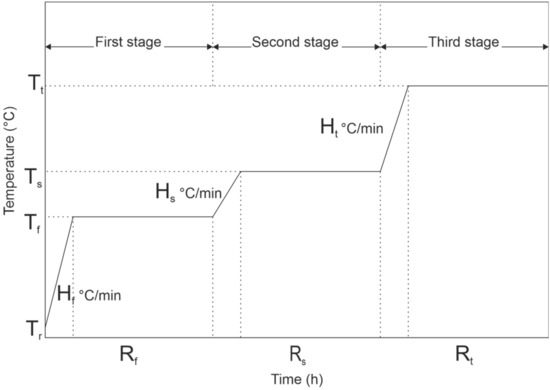
Figure 2.
Temperature pattern for three-stage pyrolysis.
3. Results and Discussion
3.1. Proximate Analysis of Feedstock
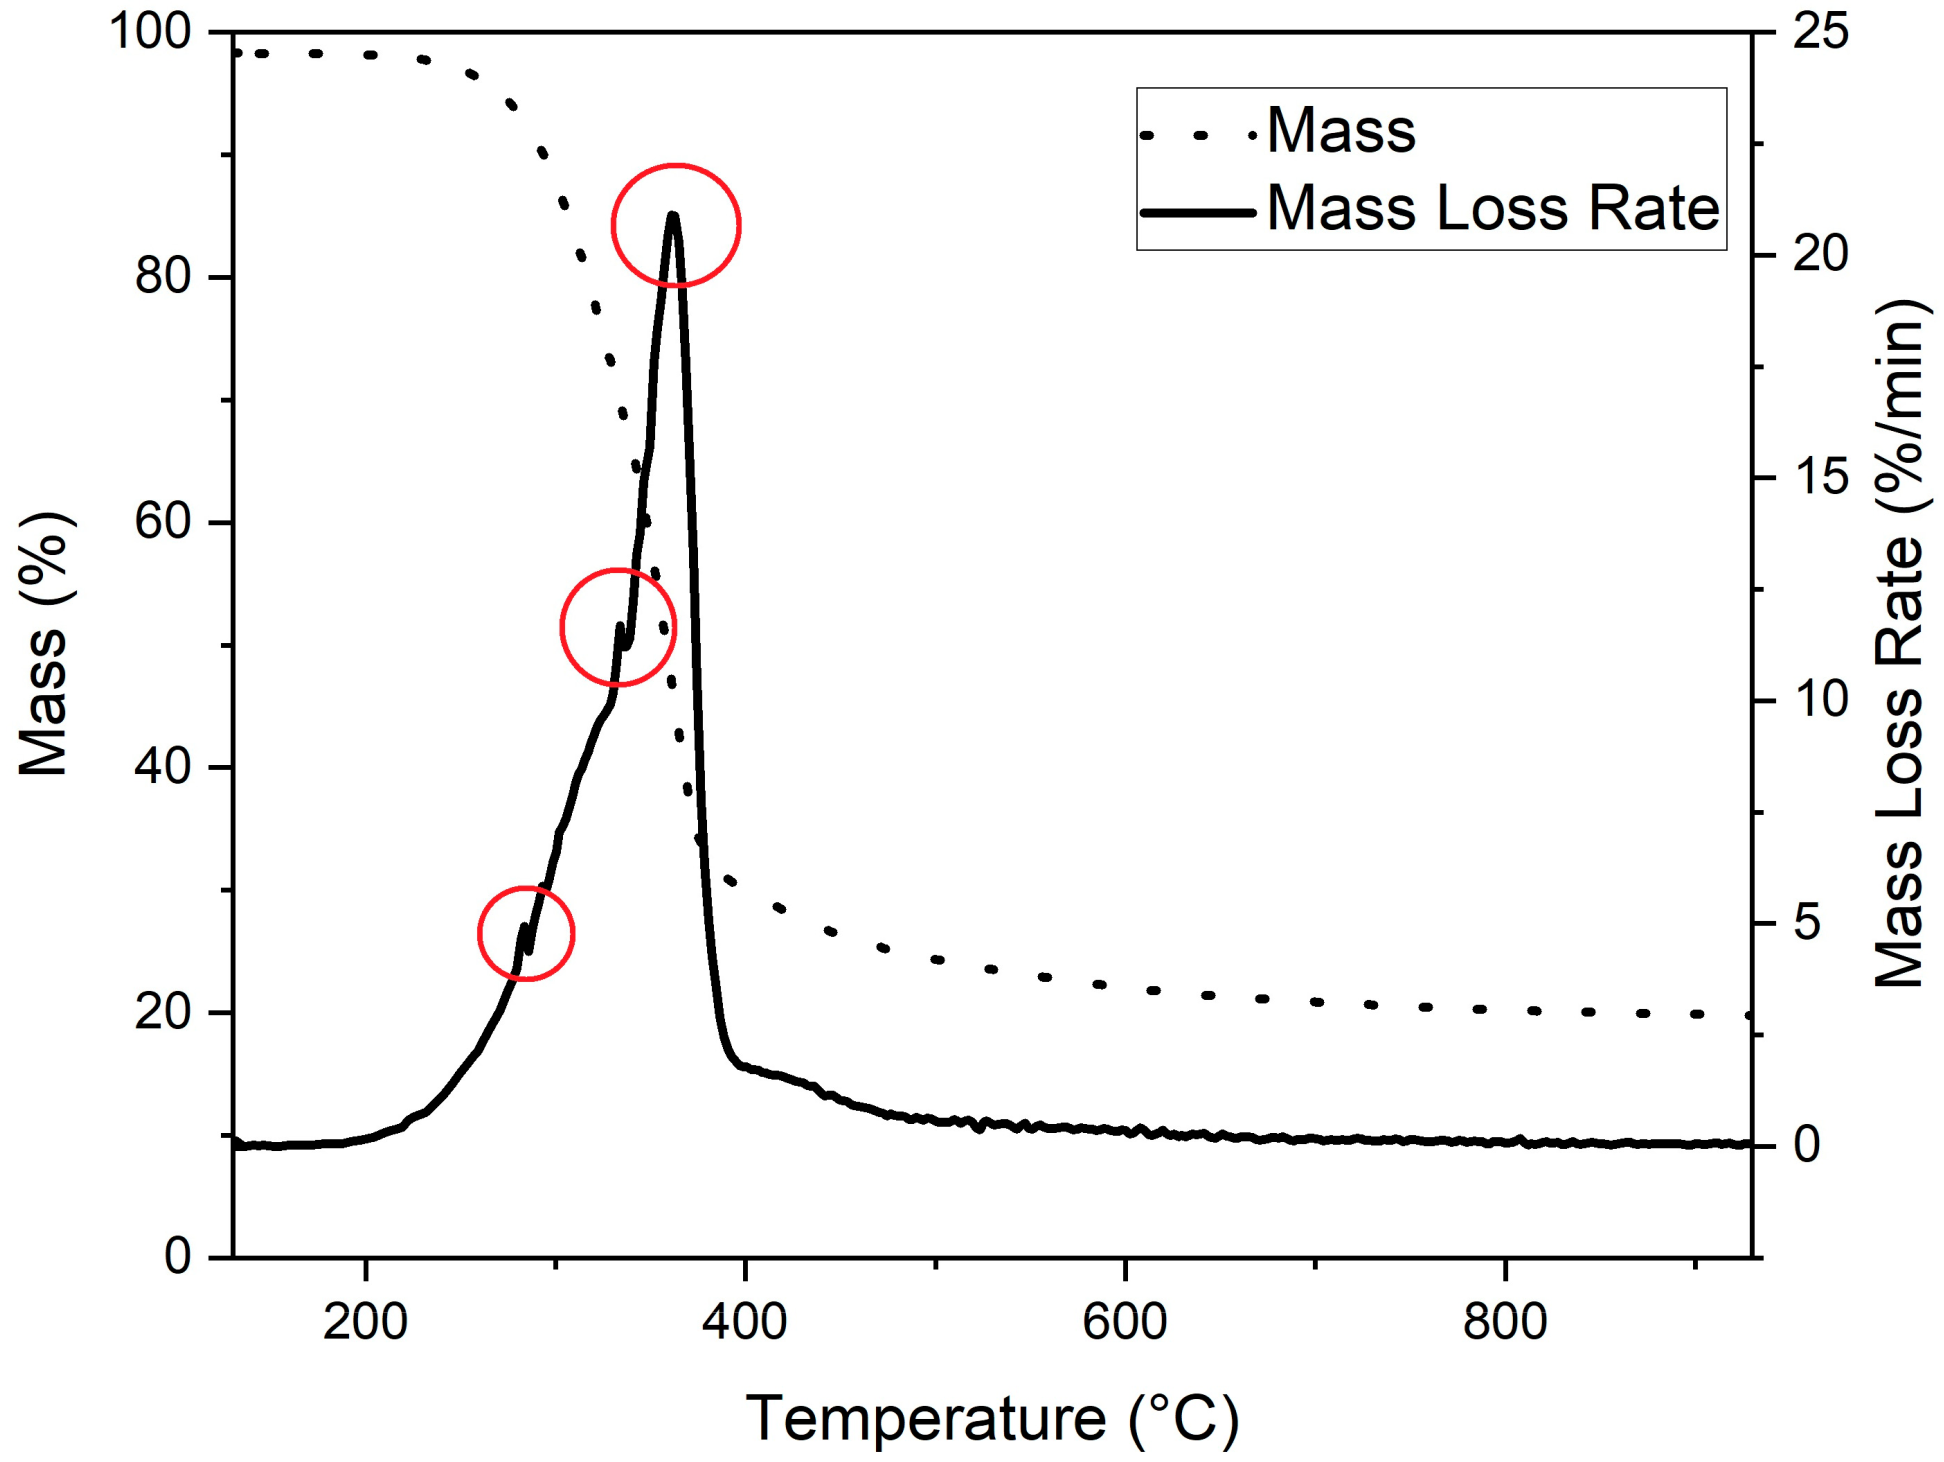
The thermogravimetric (TG) curve and the first derivative of the TG (DTG) curve of milled spruce are shown in Figure 3. As Figure 3 shows, the main degradation of spruce occurred at temperatures from 250 °C to 390 °C, where three major decomposition peaks can be observed at temperatures of 283 °C, 333 °C, and 362 °C. Those peaks are highlighted using red circles in Figure 3.

Figure 3.
TG and DTG curve of milled spruce. Observed decomposition peaks highlighted using red circles.
In the literature, it is reported that the biomass contains three main compounds: hemicellulose, cellulose, and lignin [34]. The major decomposition of these compounds takes place at temperatures of 268 °C and 322 °C for hemicellulose and 355 °C for cellulose [34]. The decomposition of lignin took place in a much broader temperature range, starting from 150 °C and ending at 900 °C [35]. Therefore, the observed peaks at temperatures 283 °C and 333 °C could be identified as caused by hemicellulose decomposition. The decomposition peak at 362 °C is most likely caused by cellulose decomposition.
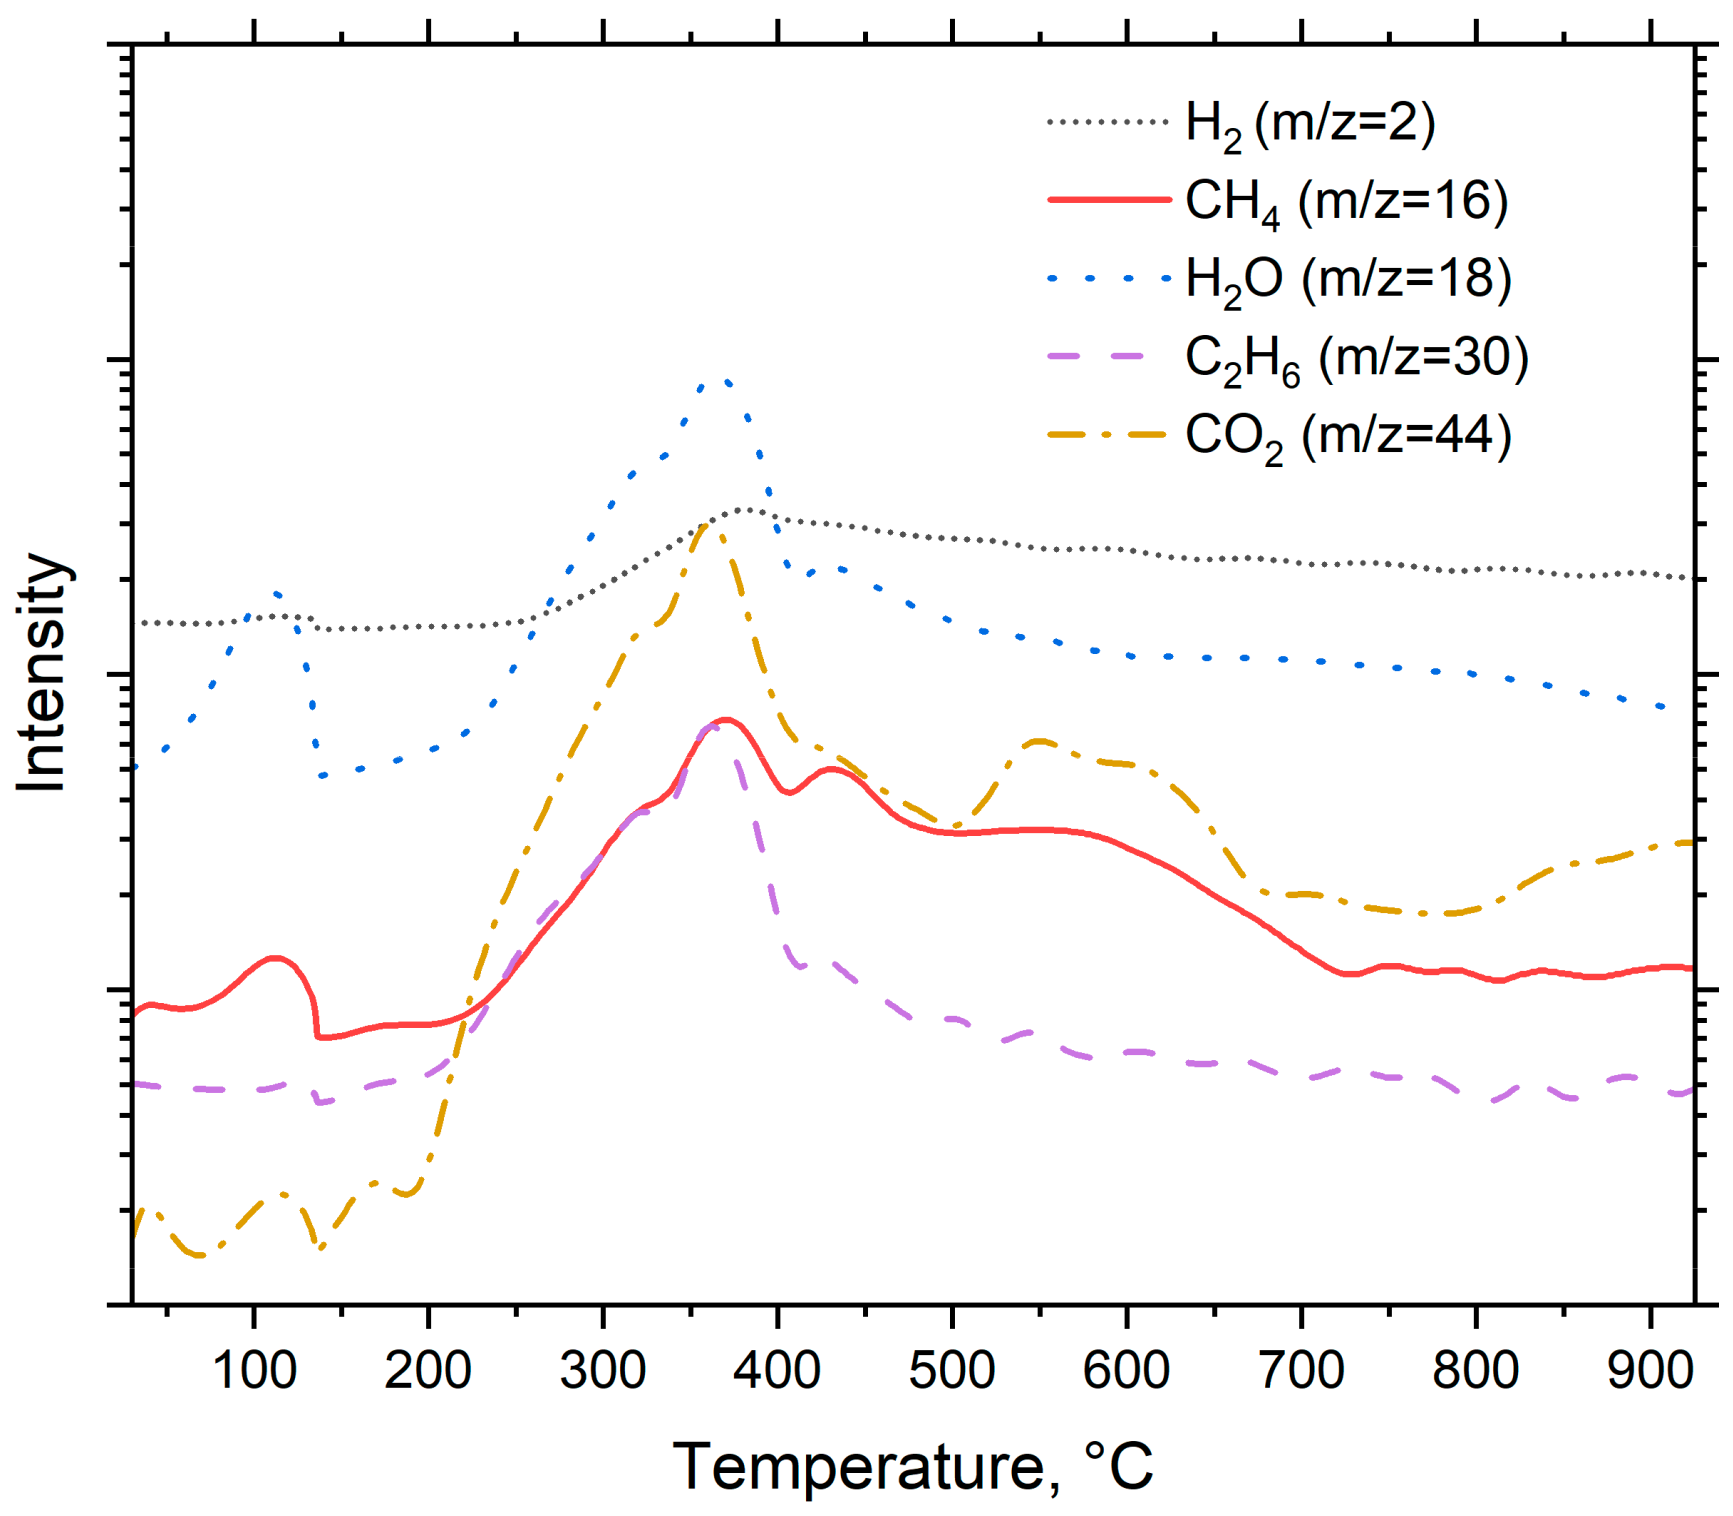
The intensity of the detected compounds is presented in Figure 4. The scan values varied from 0 to 120, but the actual identification of compounds took place between m/z values of 0 and 45. The primary reason behind this was that the signal intensities were much lower outside the given range, and this made it harder to identify the compounds.
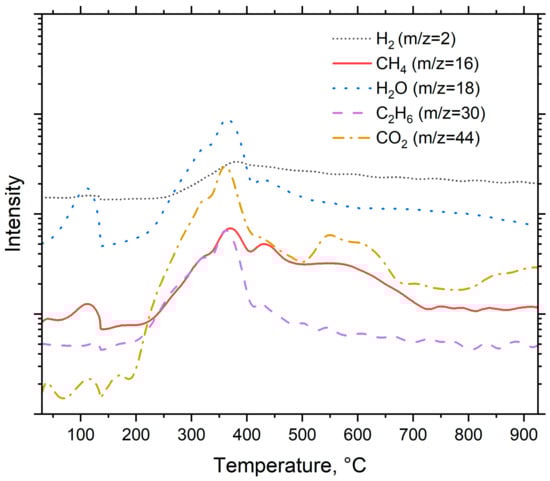
Figure 4.
Pyrolysis products of spruce.
As seen in Figure 4, the m/z signal 2 was identified as a hydrogen (H2) and its signal reaches its peak at around 360 °C. This peak is related to decomposition of cellulose into C-H groups [36]. The m/z = 16 was identified as methane (CH4). Methane has two main peaks. These peaks occur at temperatures around 360 °C and 430 °C. The peak at 360 °C most likely originates from decomposition of cellulose, and the peak at 430 °C from decomposition of lignin [36,37]. The signal m/z = 18 was identified as water (H2O). Water has two peaks. The first one occurs at temperature around 105 °C and is related to release of the moisture from the feedstock. The second peak around 360 °C is caused by the decomposition of oxygen-based functional groups [36]. The signal m/z = 30 was identified as an ethane (C2H6). It has two main peaks, at 360 °C and 450 °C. The first one most likely originates from the decomposition of cellulose and the latter from the decomposition of lignin. The m/z = 44 was identified as carbon dioxide (CO2) and has two main peaks: the first peak occurs at 360 °C, suggesting that it originates from the decomposition of cellulose, and the second peak occurs around 600 °C, which could be attributed to macromolecular cracking [36]. At 800 °C, the peak intensity growth is suggested to originate from the decomposition of carbonyl and carboxyl groups which occur around this temperature [36].
3.2. Pyrolysis Temperatures for Segmented Pyrolysis
As described in Figure 3, the main decomposition of spruce occurs in the temperature range from 250 °C to 390 °C. Based on this decomposition area, temperatures for each stage were chosen. The chosen temperatures alongside the used heating rates are shown in Table 2.
Table 2.
Process conditions for designed segmented pyrolysis program.
3.3. Thermal Analysis of Pyrolysis
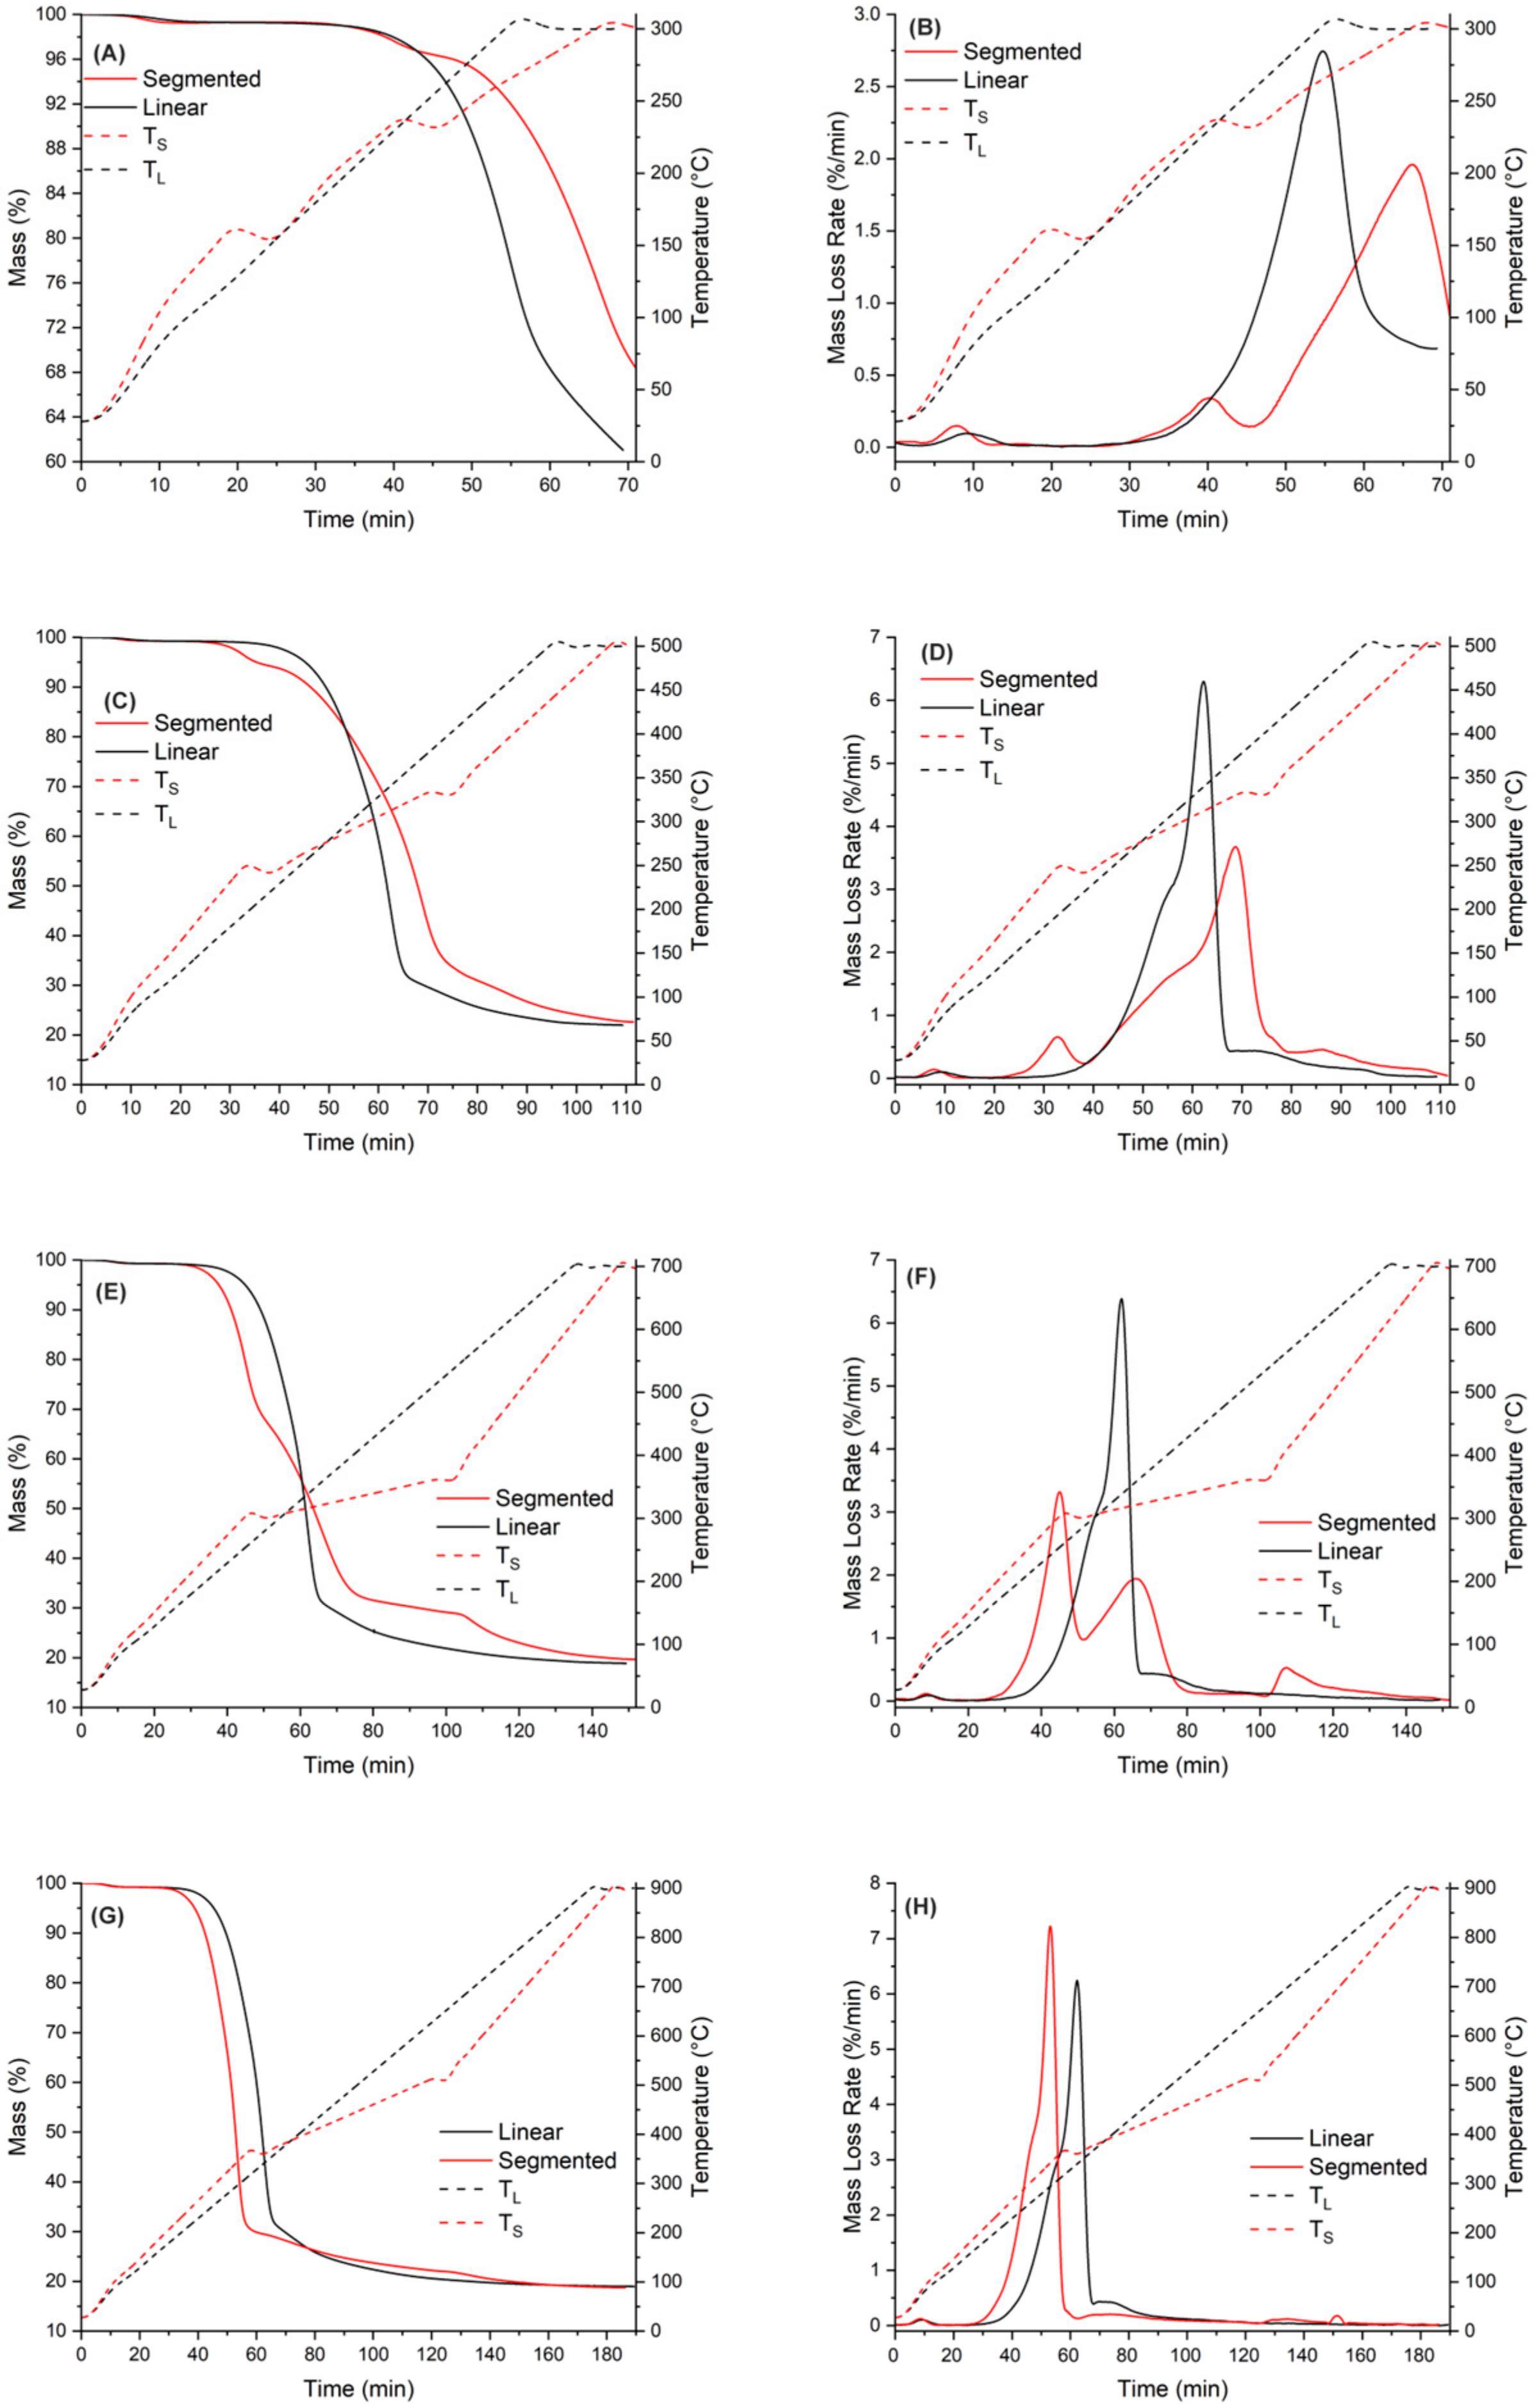
A thermogravimetric analysis was used to compare pyrolysis behavior between linear and segmented pyrolysis. The used programs were similar to those presented in Table 2, but instead of keeping the samples for 160 min at each holding stage, a 5 min holding time for each stage was applied. The difference between the pyrolysis behavior of these two methods is shown in Figure 5. As seen in Figure 5, there was a slight delay from the start of the program before the heating actually began. This delay was caused by the used device, because it took some time for the heating element to start heating the samples. Also, it is noteworthy that, especially in pyrolysis at temperatures of 300 °C and 500 °C, for segmented pyrolysis, the heating rate seems not to have been going as desired.
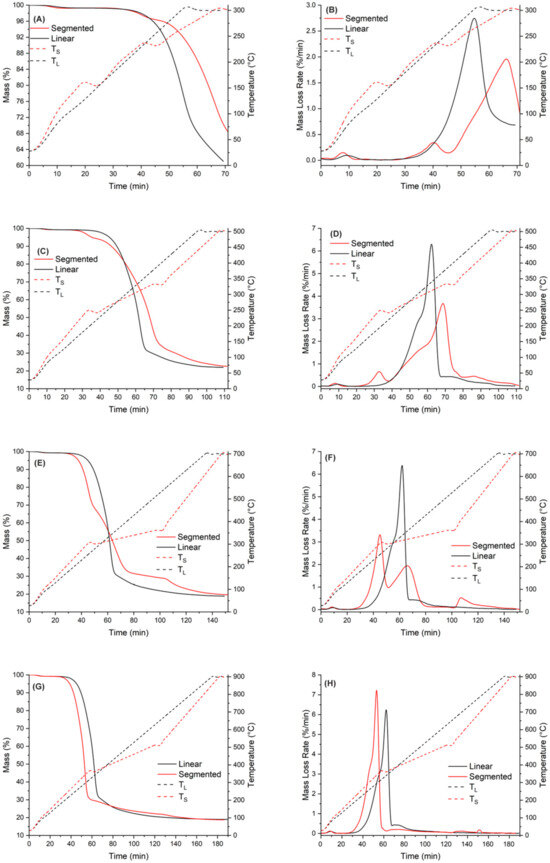
Figure 5.
Comparison of pyrolysis behavior with different pyrolysis temperatures ((A,B): T = 300 °C: (C,D): T = 500 °C, (E,F): T = 700 °C, (G,H): T = 900 °C).
The temperature curves clearly show that instead of going linearly from one ramp to another, there are problems with keeping the heating rate constant to heat the samples for the first and second target temperatures. Again, this was caused by the device used. The third noteworthy thing is that for segmented pyrolysis, the temperature for the first and second stages goes over the target temperature. This error was 5 °C at its maximum, but it caused unwanted oscillation in temperature curves.
As seen in Figure 5, when the pyrolysis temperature is 300 °C for conventional pyrolysis, the temperature was high enough to ensure that hemicellulose decomposition reaction could take place. For the segmented pyrolysis, two things can be noticed: The temperature for the first stage was not high enough to allow any decomposition reactions to take place. Secondly, the mass loss rate (DTG curve) at final pyrolysis temperature was not as high as it was in the conventional pyrolysis. The reason behind this is that, as seen in Figure 5B, the decomposition reactions of hemicellulose started to take place during the second stage of the pyrolysis, but the reaction rate quickly slowed down in the holding stage. The fact that these decomposition reactions took place may have lowered the mass loss intensity during the following heating ramp to the final pyrolysis temperature.
At 500 °C, the mass loss curve is similar to that presented in Figure 3 for conventional pyrolysis, meaning that most of the decomposition reactions of spruce took place before the temperature reached 500 °C. In the segmented pyrolysis, the decomposition reactions of hemicellulose take place in the first stage, at 240 °C. Because the decomposition was situated right into the beginning of the holding stage, the reaction rate of decomposition remained moderate. This further lowered the decomposition rate in the second stage. The lowered peak rate at the main decomposition range further leads to higher solid yield at the final temperature (500 °C).
The mass loss curve for conventional pyrolysis at 700 °C is similar to that of conventional pyrolysis at 500 °C. For segmented pyrolysis, several things can be noticed. The main decomposition took place during the first stage, peaking at around 300 °C. This peak is linked to decomposition of hemicellulose together with the second peak at around 320 °C. The third peak can be observed at around 360 °C and is linked to the decomposition of cellulose. Overall, the mass loss peaks in segmented pyrolysis remain quite moderate when compared to those in conventional pyrolysis.
At 900 °C, both methods have similar mass loss rates. However, in segmented pyrolysis, the main mass loss peak is more intense than that of conventional pyrolysis. The reason behind this is the higher heating rate used for segmented pyrolysis during the first stage. Because of this, the full decomposition of cellulose took place. As seen in Figure 5H, there are no observable mass loss rate peaks in the second stage; thus, the main decomposition phase of spruce was already finished in the first stage of segmented pyrolysis. Moreover, a small decomposition peak in segmented pyrolysis can be detected in Figure 5H around 700 °C. Because this peak cannot be found from Figure 5F, it is considered as a measurement error caused by the used device.
Based on the thermal analysis of segmented pyrolysis, the following remarks can be made:
- The temperature for the first stage should be close to feedstock’s decomposition temperature, regardless of the final pyrolysis temperature. For spruce, the peak decomposition temperature is around 360 °C.
- The temperature for the second stage should be between the temperatures of the first stage and final pyrolysis temperature. As seen in Figure 5, at pyrolysis temperatures over 400 °C, the decomposition has mainly taken place already. This further enables use of higher heating rates in the final stage, and possibly reduces the total process time compared to conventional pyrolysis.
3.4. Biocarbon Yield
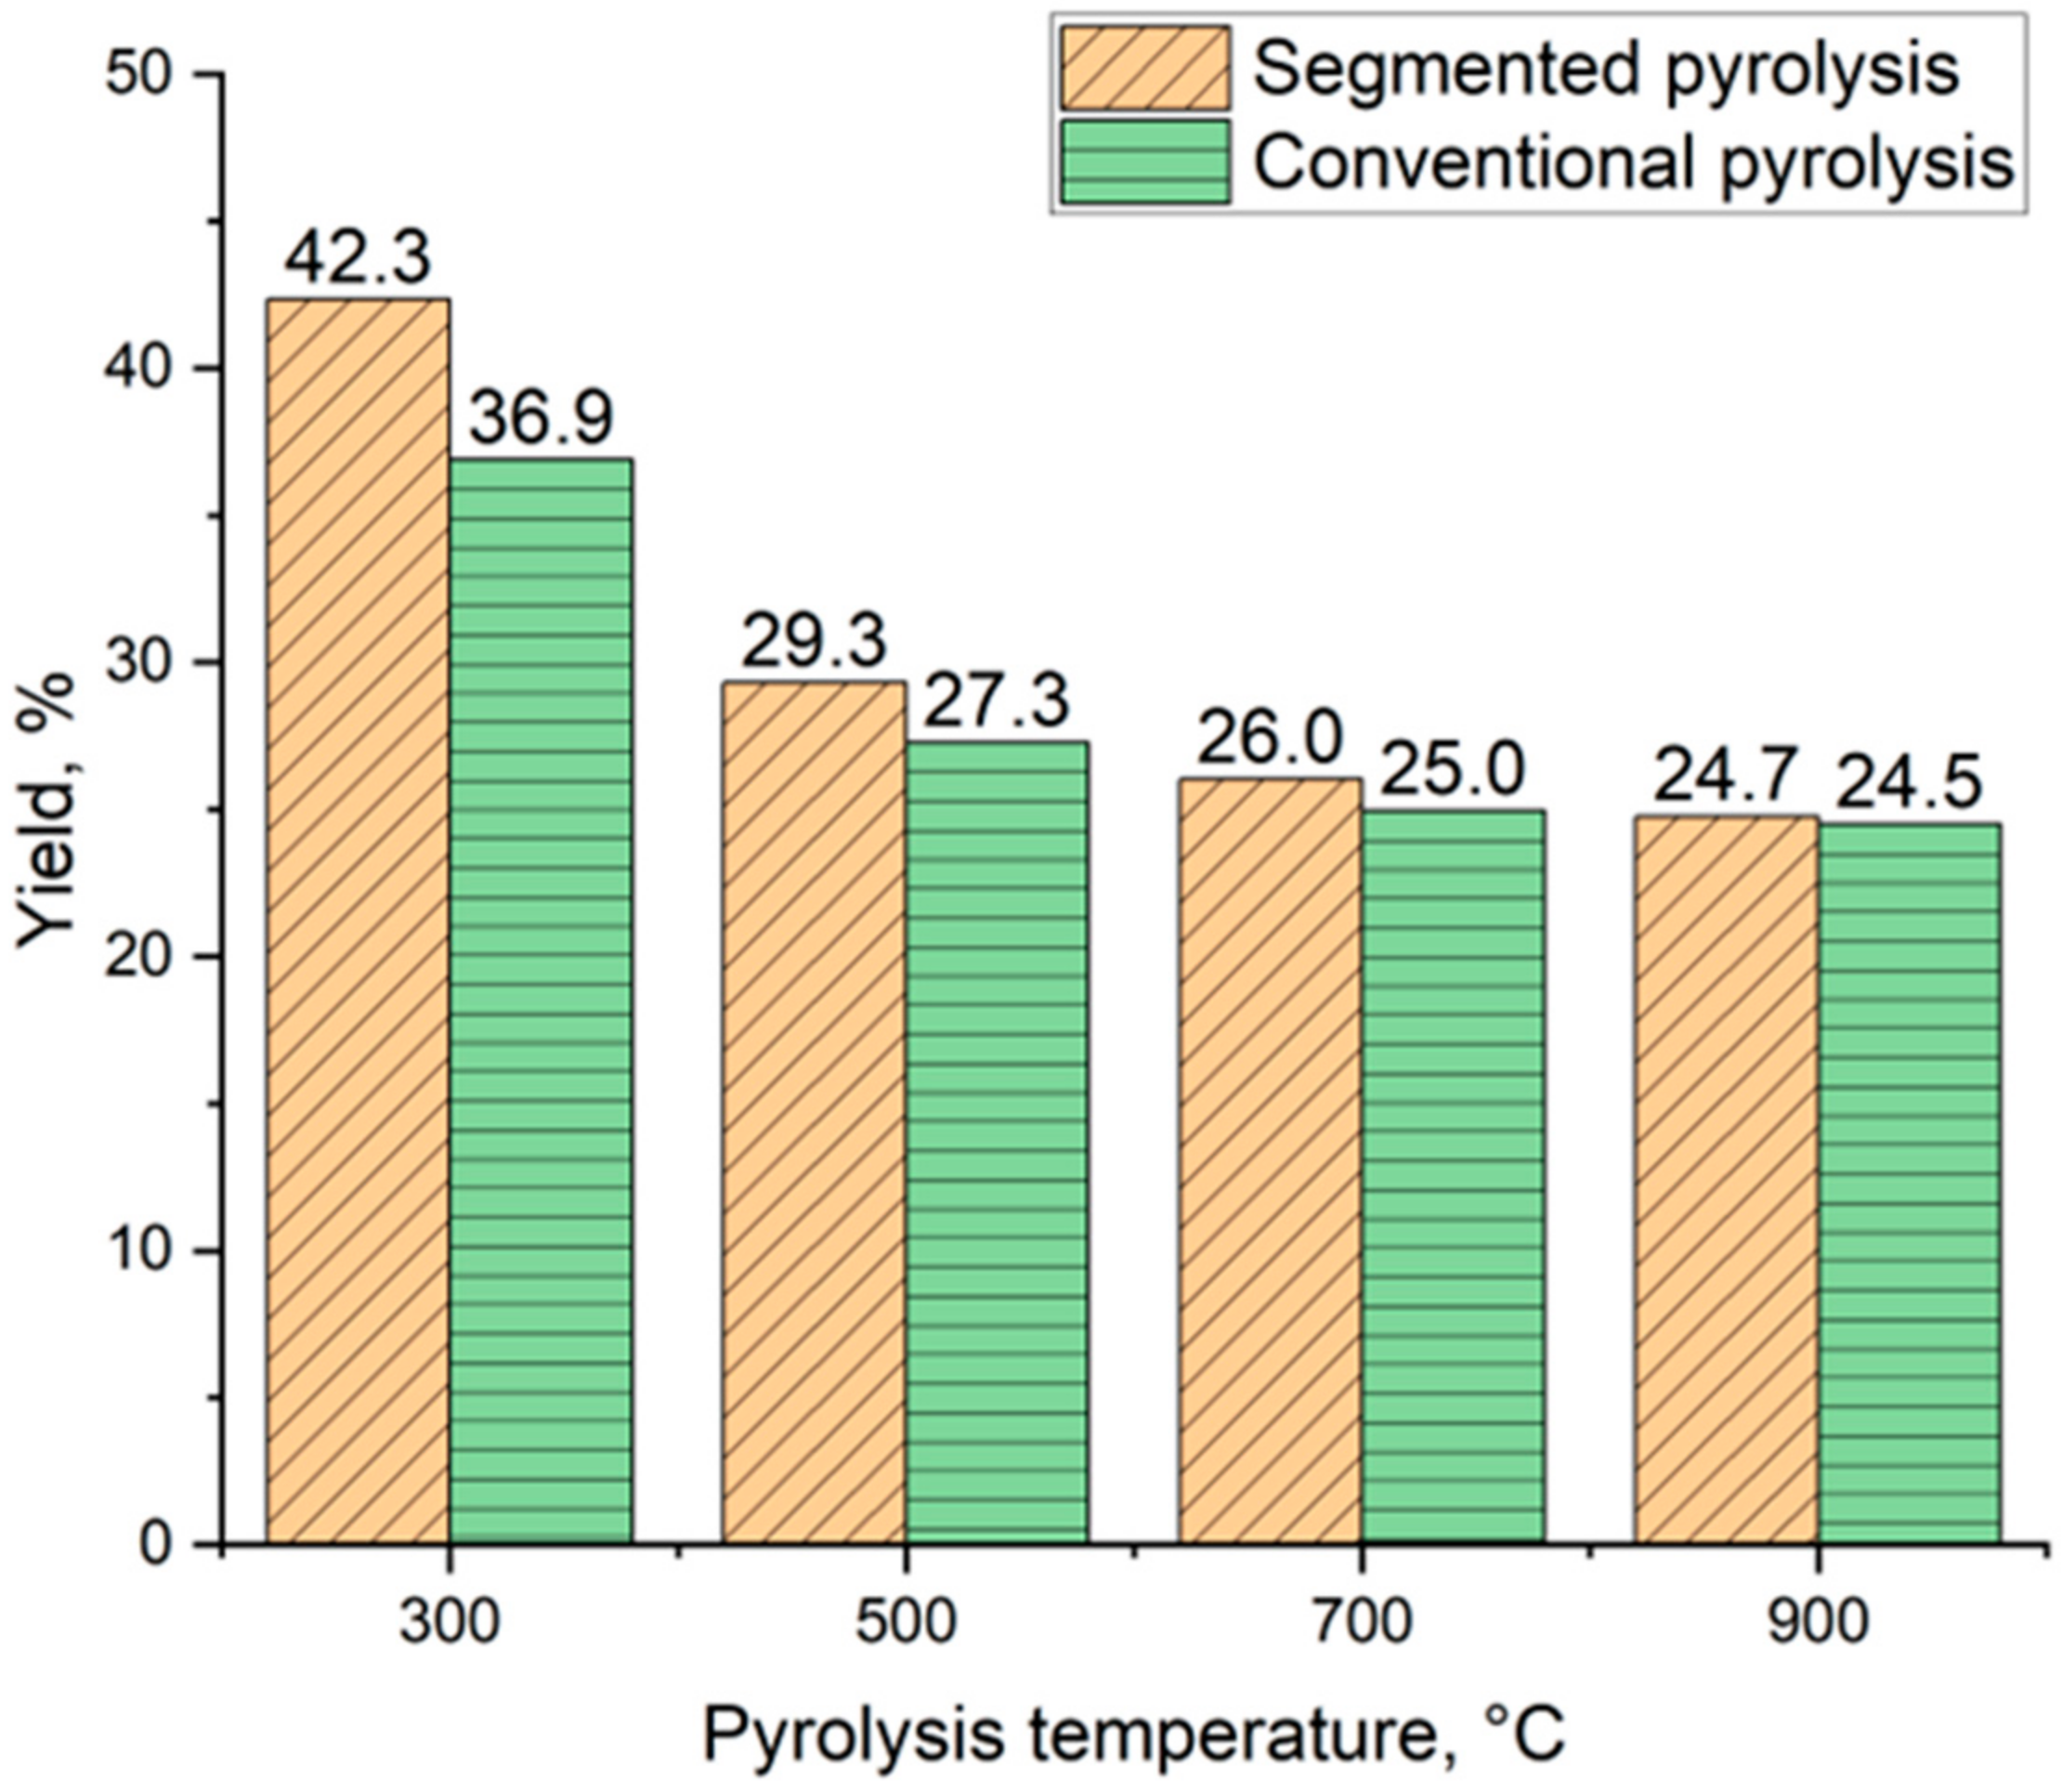
Figure 6 shows the biocarbon yield of spruce flakes pyrolyzed at four different temperatures using segmented and conventional pyrolysis. Biocarbon yield decreases as the final pyrolysis temperature is increased in both methods. Segmented pyrolysis led to increased biocarbon yield compared to conventional pyrolysis in the studied temperature range. The biocarbon yield varied from 42.3% to 24.7% when using segmented pyrolysis. Respectively, in conventional pyrolysis, biocarbon yield decreased from 36.9% to 24.5%. A similar decrease in biocarbon yield was reported by Suopajärvi et al. [38]. According to the literature, the decreased biocarbon yield as a function of temperature is related to the release of volatiles and depolymerization of biomass [39]. Besides the used pyrolysis temperature, biocarbon yield is affected by the used heating rate and reactor configuration [40].

Figure 6.
Biocarbon yield comparison.
3.5. Proximate and Thermal Analysis of Biocarbon
3.5.1. Proximate Analysis of Produced Biocarbons
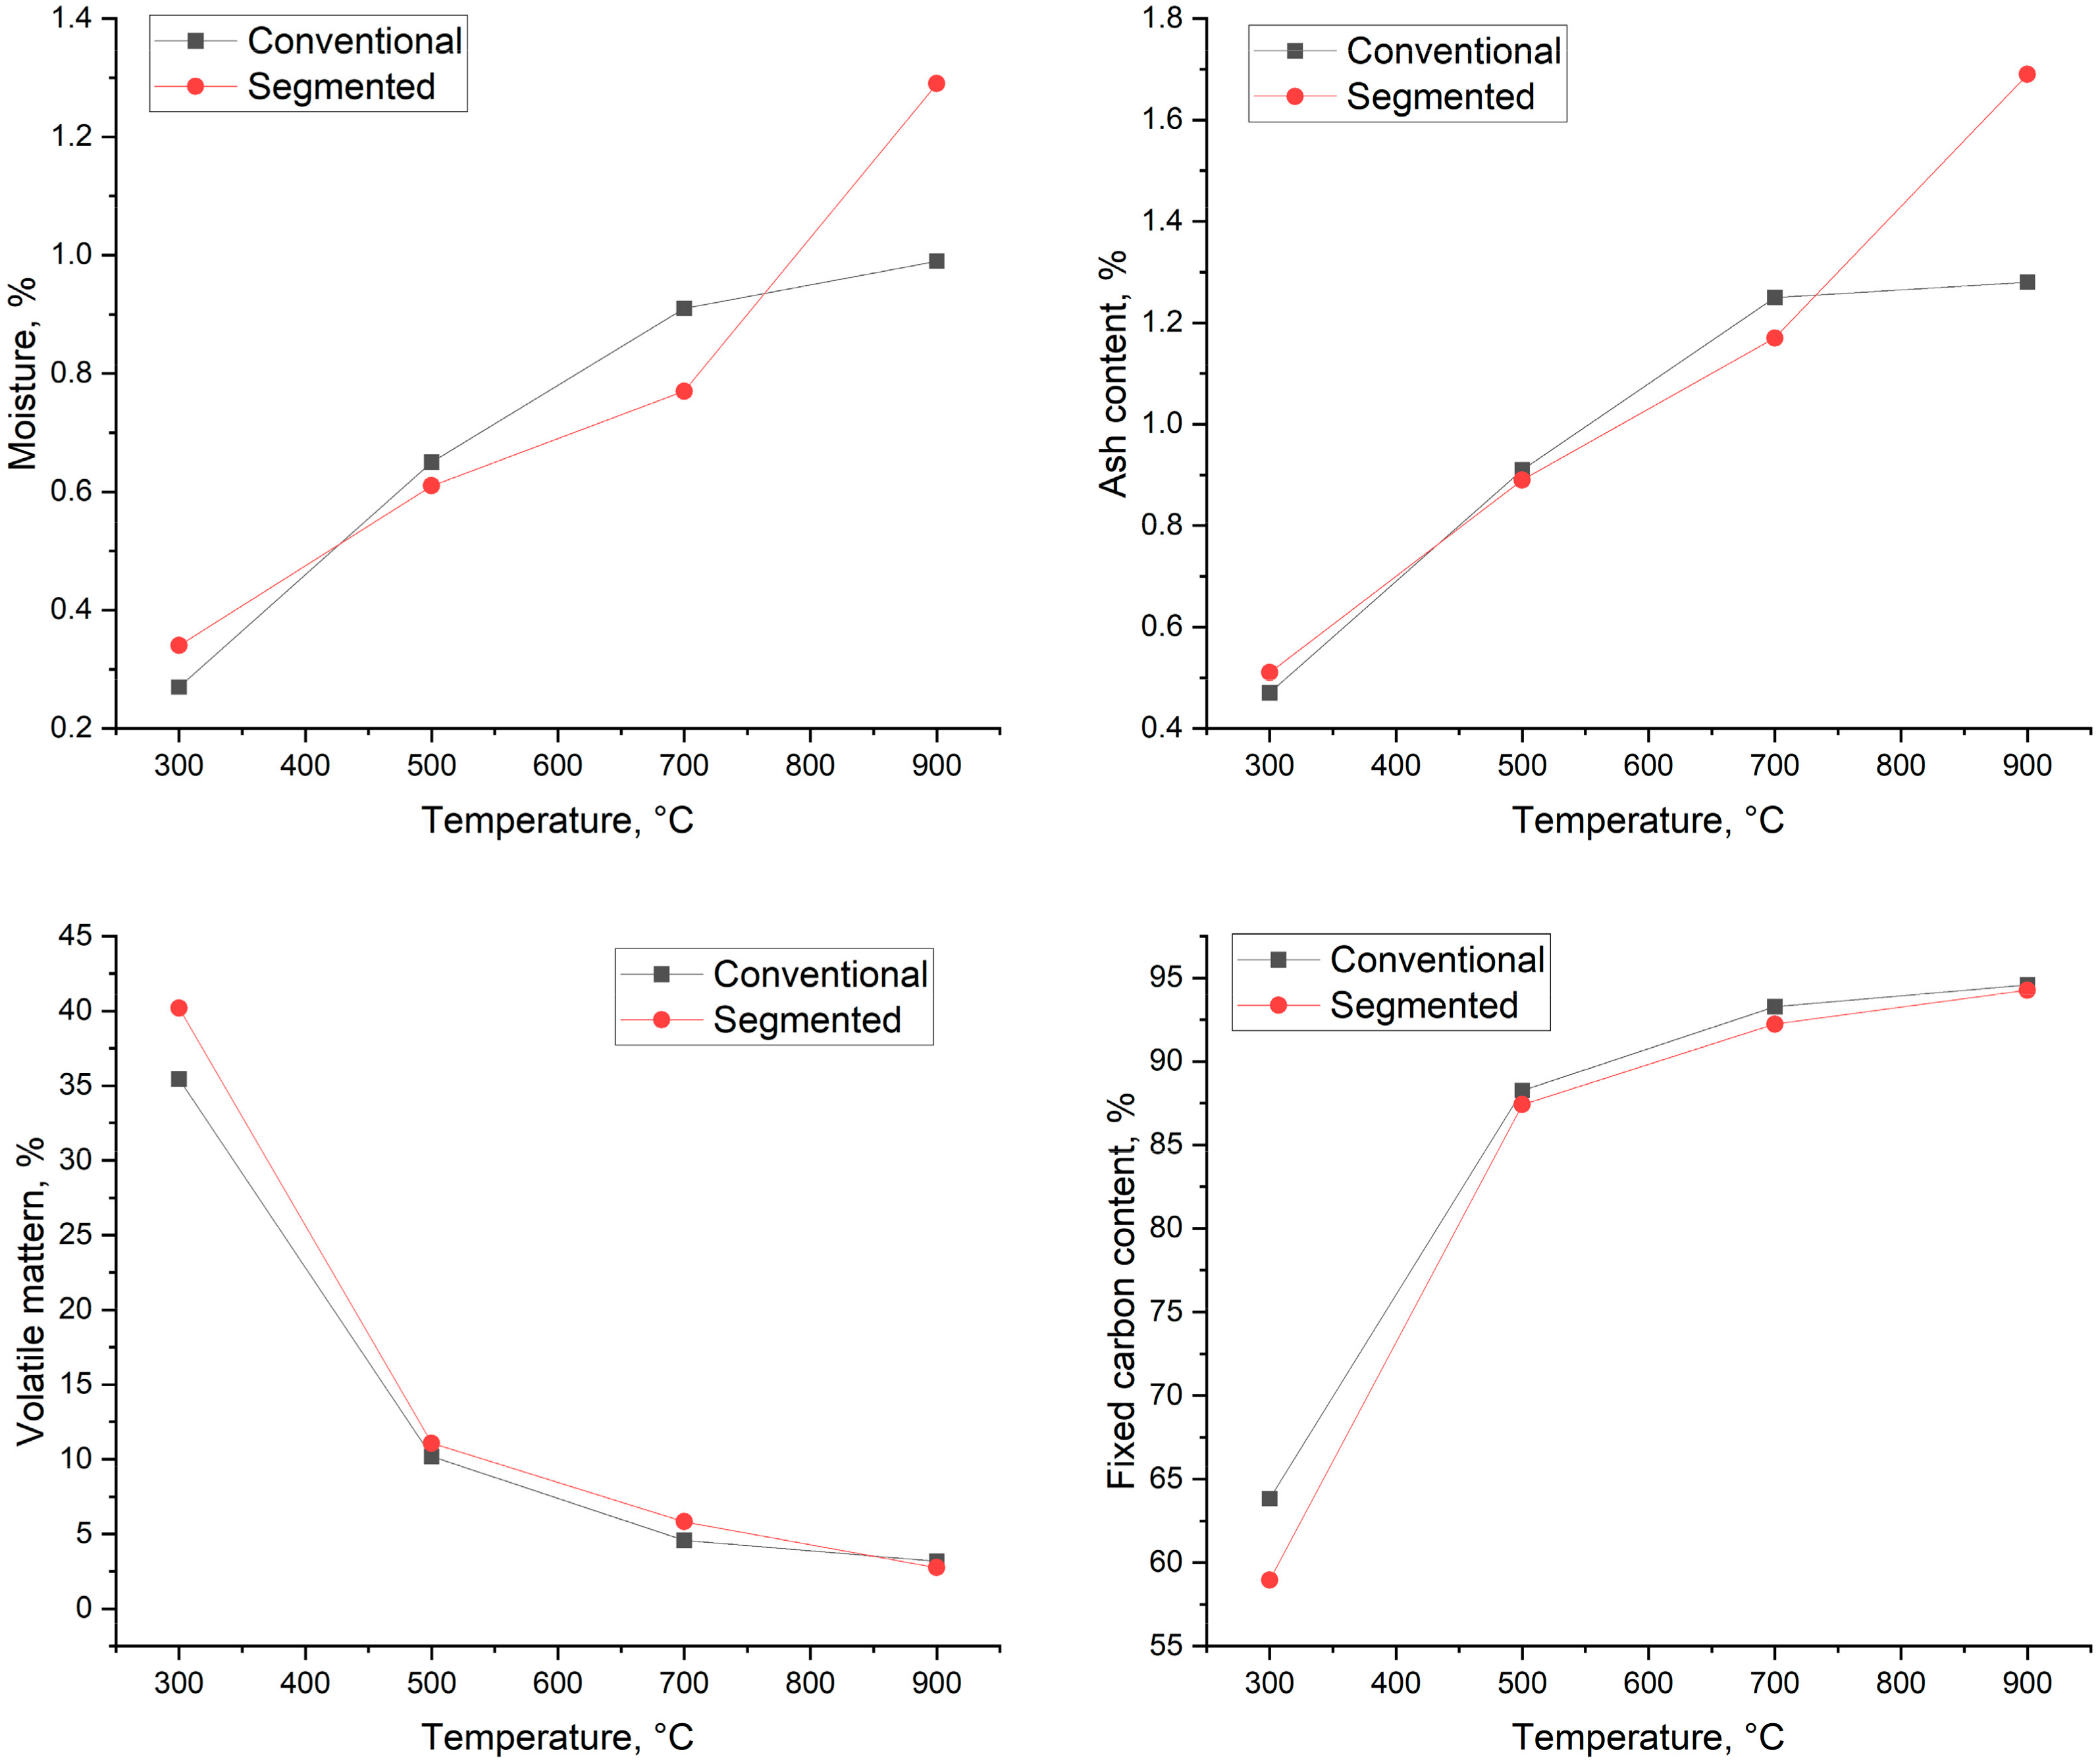
The results of the proximate analysis are presented in Figure 7. As Figure 7 shows, the moisture content of the biocarbons varied from 0.27% (300 °C) to 0.99% (900 °C) in conventional pyrolysis and 0.34% to 1.17% in segmented pyrolysis. Conventional pyrolysis leads to increased moisture content at the temperatures of 500 °C and 700 °C, and segmented pyrolysis leads to increased moisture content at the temperatures of 300 °C and 900 °C, respectively. In industrial storing conditions, the increase in moisture content could be even higher. The samples were stored in airtight containers, where the amount of moisture absorbed from air to biocarbon is limited. This is the ideal situation and, obviously, it is not possible everywhere. Wang et al. [41] reported that storing biocarbon at 98% relative humidity for 8 weeks increased biocarbon moisture content by 5.2%, leading to the biocarbon moisture content level being as high as 13.9%. It is reported in the literature that coke typically has a moisture content below 5% [1]. When taking into account this fact and the possibility that the moisture content increases during storage period, the material most likely needs to be dried before it is suitable to be used in metallurgical applications.

Figure 7.
Proximate analysis results.
For conventional pyrolysis, the amount of produced ash varied from 0.47% (300 °C) to 1.28% (900 °C). For segmented pyrolysis, the amount of ash varied from 0.51% (300 °C) to 1.17% (700 °C). The increased ash content is most likely caused by the relatively increased concentration of minerals and other inorganic constituents in ashes [42,43].
Volatile matter content varied from 35.44% to 3.17% in conventional pyrolysis and from 40.20% to 2.75% for segmented pyrolysis. The volatile matter content decreases in both methods when the pyrolysis temperature is increased. Biocarbons produced by the conventional method had lower volatile matter content when they were produced at 300 °C and 700 °C. At 900 °C, segmented pyrolysis leads to lower volatile matter content compared to conventional pyrolysis.
In the literature, it is reported that fixed carbon content increases as the pyrolysis temperature rises [9,38]. As seen in Figure 7, that is also the case for spruce: the fixed carbon content increases in both methods when the pyrolysis temperature rises. When conventional pyrolysis took place, the fixed carbon content was 63.82–94.58%, and for segmented pyrolysis, 58.95–94.68%. The desired fixed carbon content in the iron and steel industry varies depending on the used process. The fixed carbon content could be as low as 76% for carbon used in iron ore sintering and over 88% in processes that require metallurgical coke as carbon carrier [1]. This means that in view of fixed carbon content, the produced biocarbon temperatures from 500 °C to 900 °C fulfill the requirements of the processes in iron and steel industry.
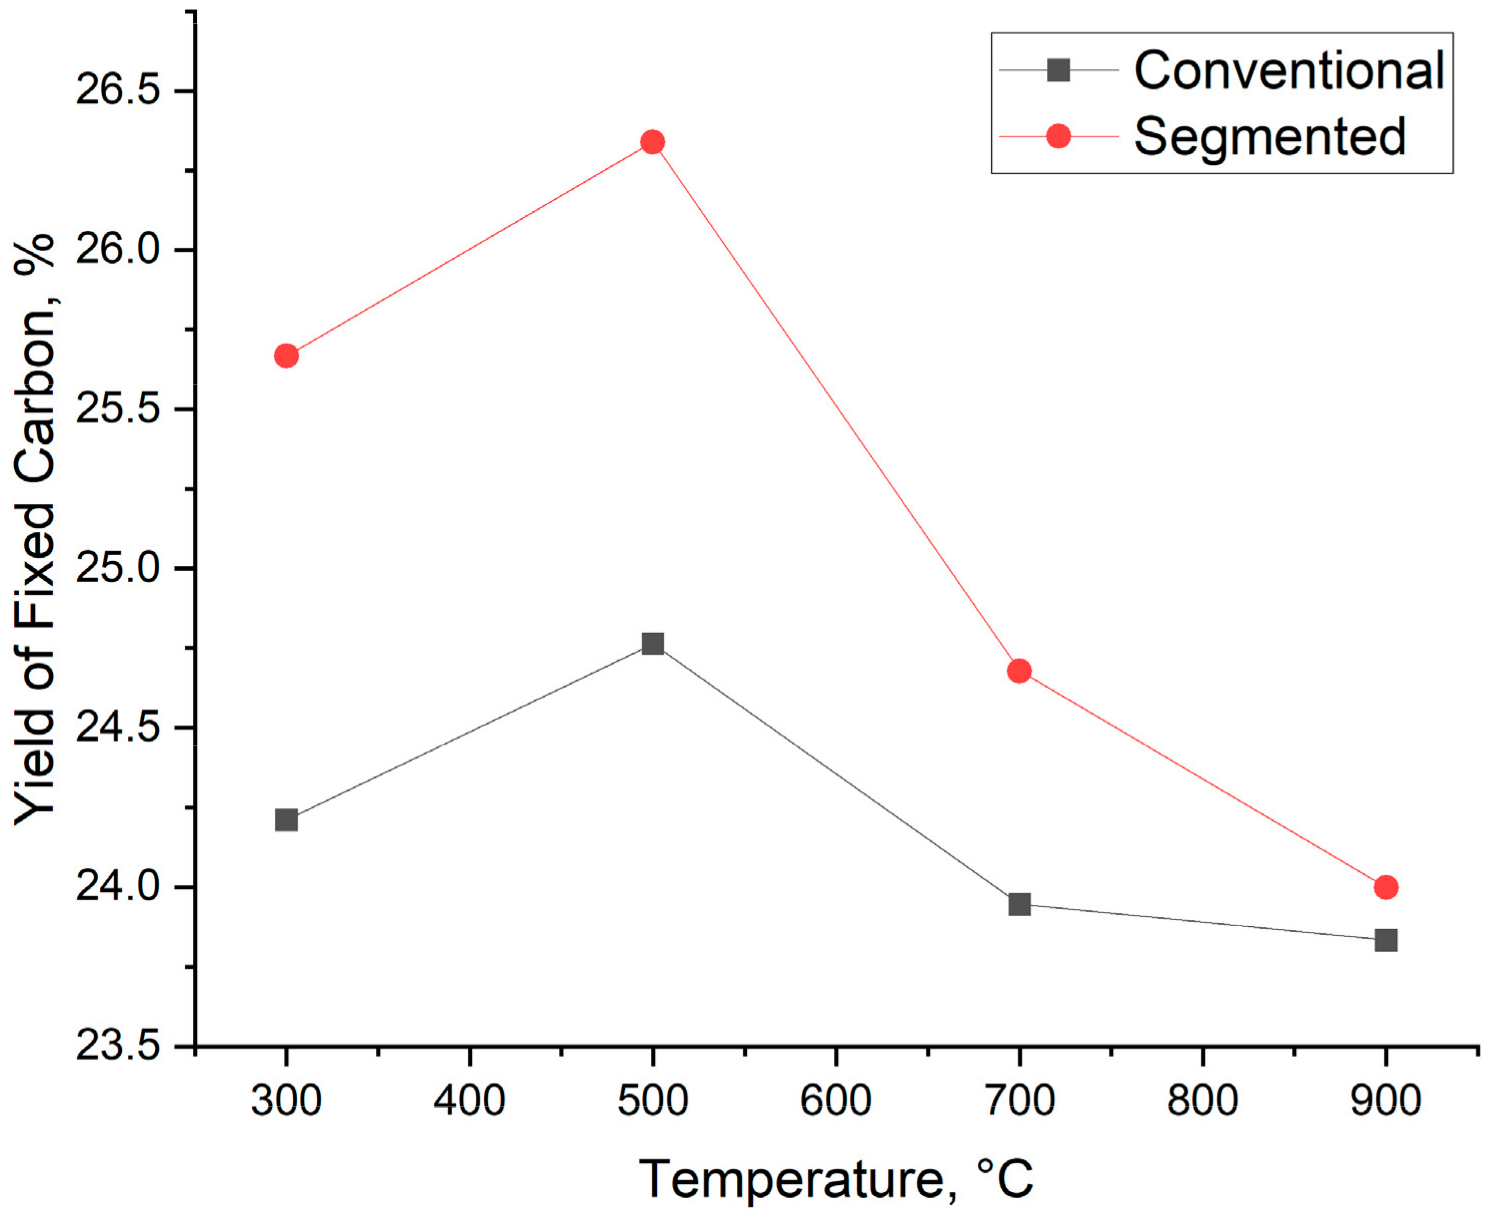
In addition to biocarbon yield and fixed carbon content, the yield of fixed carbon is also taken into account. Calculating the yield of fixed carbon not only takes into account the biocarbon yield but also the fixed carbon content of the samples. Because of this, it is easier to compare biocarbons produced with different temperatures, heating rates, and production technologies. The yield of fixed carbon is shown in Figure 8. The yield of fixed carbon varies from 24.76% to 23.83% for conventional pyrolysis and from 26.34% to 24.10% for segmented pyrolysis. The highest yield of fixed carbon is achieved at the temperature of 500 °C. When the temperature is over 500 °C, the yield of fixed carbon decreases for both methods. These results indicate that at 500 °C, the main reason behind the increased fixed carbon yield is the increased fixed carbon content of the samples. When the temperature is between 700 °C and 900 °C, the decrease in biocarbon yield is greater than the increased fixed carbon content, thus leading to a decreased yield of fixed carbon.
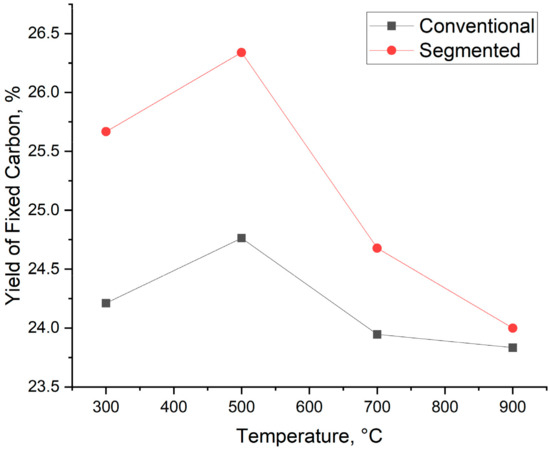
Figure 8.
Yield of fixed carbon.
Based on the proximate analysis results, the moisture, ash, volatile matter, and fixed carbon content of the biocarbons are dependent on the pyrolysis temperature. When the pyrolysis temperature increases, moisture, ash, and fixed carbon content increase. On the other hand, volatile matter content decreases. The yield of fixed carbon depends on fixed carbon content and biocarbon yield. When the pyrolysis temperature is kept below 500 °C, the yield of fixed carbon is affected mainly by the fixed carbon content of the samples. At pyrolysis temperatures higher than that, the yield of fixed carbon is mainly affected by the biocarbon yield.
3.5.2. Thermal Analysis of Produced Biocarbons
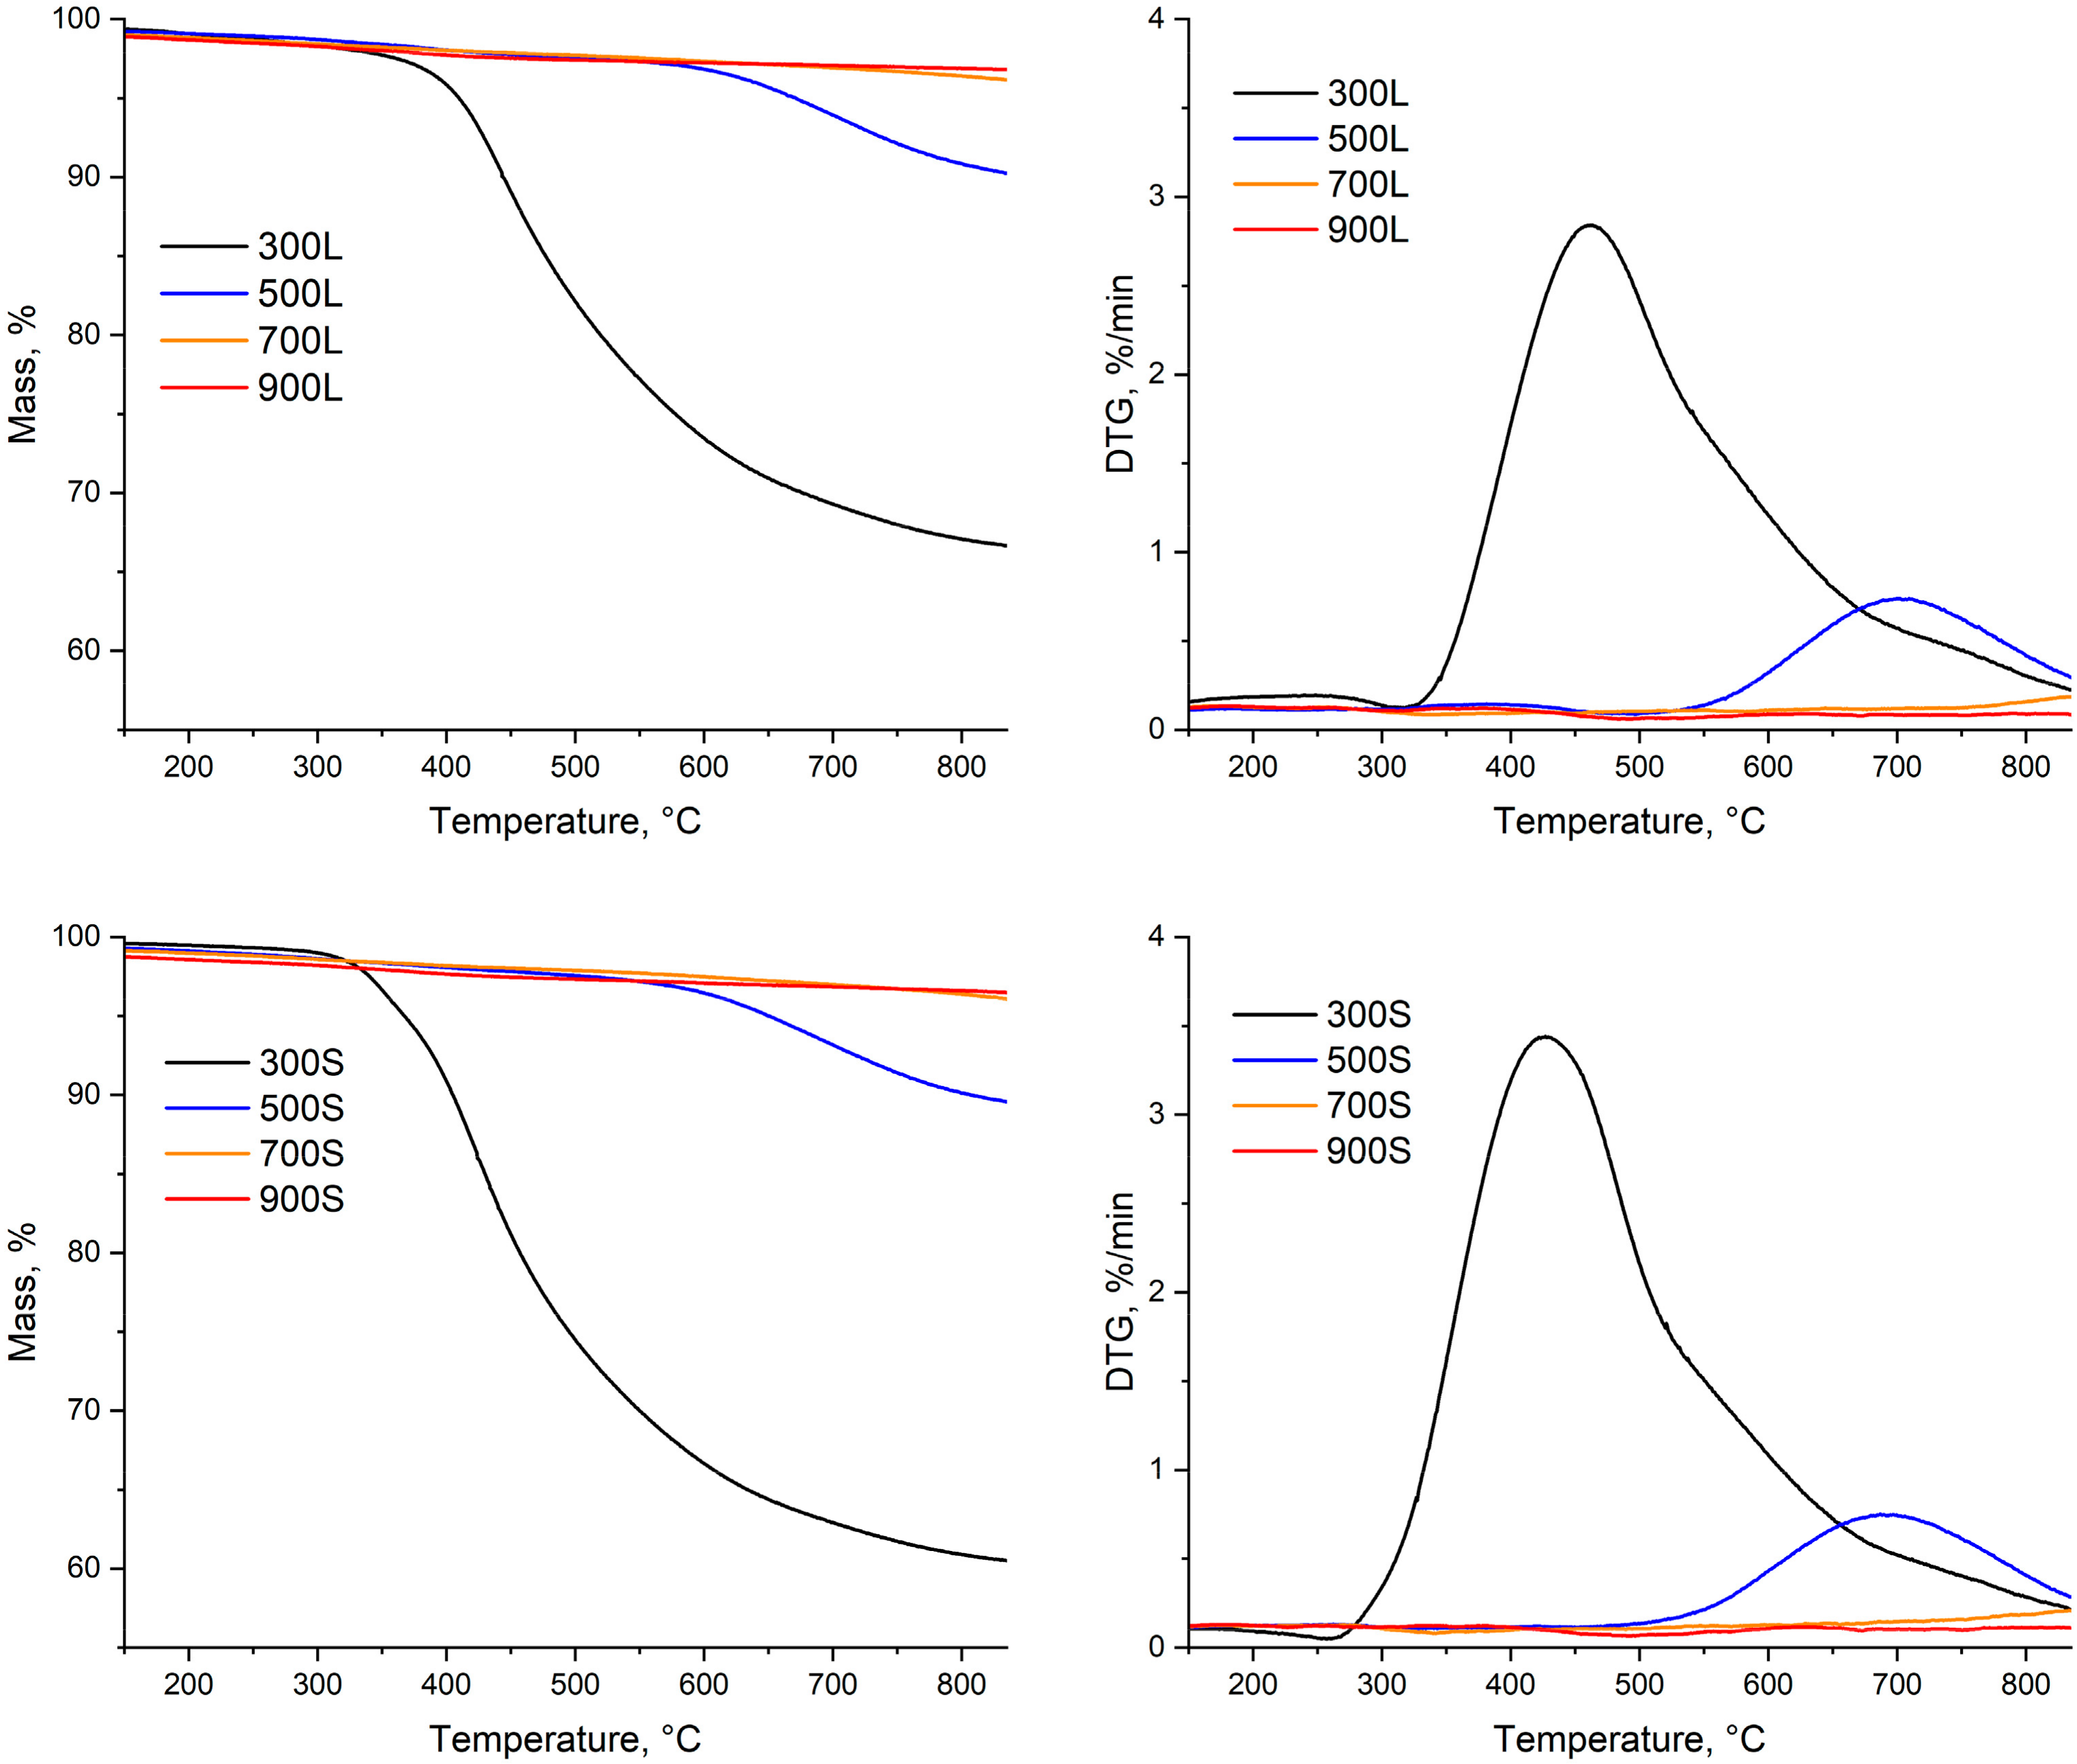
The TG and the TDG curves of produced biocarbons are shown in Figure 9. The DTG-curves show that the highest mass loss shifted towards a higher temperature when the final pyrolysis temperature was increased.
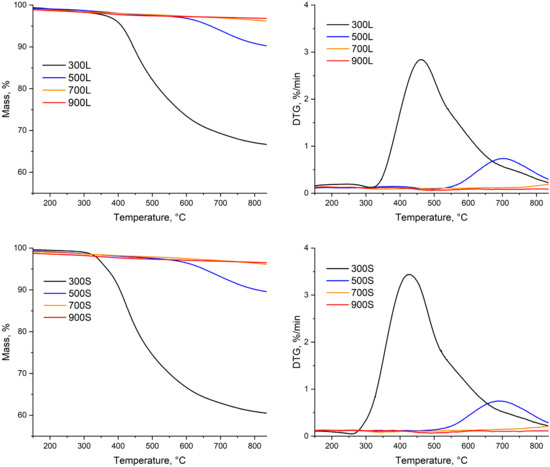
Figure 9.
Thermal stability of produced biocarbons.
The devolatilization behavior of the samples were highly related to the final pyrolysis temperature of the samples. This means that the mass loss of samples that were pyrolyzed at 300 and 500 °C started at lower temperatures than the mass loss of samples that were pyrolyzed at 700 and 900 °C. The segmented pyrolysis further emphasized this behavior, which can be observed by comparing the peak mass loss rate of 300S with other samples. However, at higher temperatures, there is no notable difference between the mass loss curves of samples of different production methods if the pyrolysis temperature was the same.
When the pyrolysis temperature increases, not only do the mass loss rates decrease, but also the overall mass loss decreases. This can be observed from the samples with the pyrolysis temperatures over 700 °C and 900 °C, where the total mass losses of biocarbons were around 2.5% and 4%, while the mass losses of the samples with lower pyrolysis temperatures (300 and 500 °C) were around 8% and 15%. These results mean that that the volatiles were removed at temperatures between 500 and 700 °C. Similar thermal stability behavior for biocarbon produced in conventional pyrolysis was reported by Tripathi et al. [44].
When combining the results from the proximate analysis and thermal analysis of biocarbons, it can be summarized that biocarbon produced at 700 °C by the segmented method is the best, not only by biocarbon yield and the yield of fixed carbon, but also from the point of view of the properties and suitability for pyrometallurgical processes. Biocarbons produced at this temperature have higher solid yield and yield of fixed carbon than in conventional pyrolysis. Also, the yield of fixed carbon at this temperature is only 0.1% lower than in conventional pyrolysis at 500 °C. Although the fixed carbon content of 700S is lower than that of 700L, it is still considered to be enough to be used in any metallurgical application [1]. Based on the thermal stability of biocarbons, 700S showed similar stability to biocarbons produced at 900 °C. Although the thermal stability and the results from the proximate analysis are better for the biocarbons at the pyrolysis temperature of 900 °C, the difference to samples with a pyrolysis temperature of 700 °C was not dramatic; thus, the performance of 700S in the metallurgical application is considered to be equally good with 900L and 900S. Therefore, when adding the longer total process time combined with the higher energy consumption of 900L and 900S, the biocarbons produced in the segmented way at 700 °C are considered the most suitable.
3.6. Ultimate Analysis
The results from the ultimate analysis are shown in Table 3 alongside the calculated hydrogen-to-carbon (H/C) and oxygen-to-carbon (O/C) ratios. The oxygen content for conventional pyrolysis varies from 19.91% to 2.00% and for segmented pyrolysis from 21.61% to 1.95%. Respectively, carbon and hydrogen contents varied from 74.79% to 95.25% and 3.59–0.10% for conventional and 72.69–95.25% and 4.38–0.18% for segmented pyrolysis. Sulfur was reported in only one of the studied samples, and nitrogen was not observed in the studied samples. In general, O and H content decreases when pyrolysis temperature is increased, and C content increases when pyrolysis temperature rises. According to Zou et al. [36], the decrease in hydrogen and oxygen content is caused by removing the hydrogen (CH4 and CH2O) and oxygen-containing groups (CO and CO2) of the biomass. Similarly, increased carbon content is caused by the formation of polycyclic aromatic hydrocarbon structures in the produced biocarbon [36]. The main step behind this is the formation of benzene rings during the pyrolysis. These rings are then combined with the biocarbon polycyclic structure, thus leading to increased biocarbon yield when slow pyrolysis takes place [45,46]. The slow heating rate favors the formation of stable structures, whereas high heating rates causes those benzene rings, alongside many more volatile compounds, to be cracked leading decreased char formation [45].
Table 3.
Ultimate analysis of produced biocarbons (wt. dry basis).
These proportions of oxygen, hydrogen, and carbon also affect the higher heating value of biocarbons. Higher hydrogen and oxygen proportions compared to carbon proportion lowers the HHV, because C-C bonds have higher energy than C-O and C-H bonds [8].
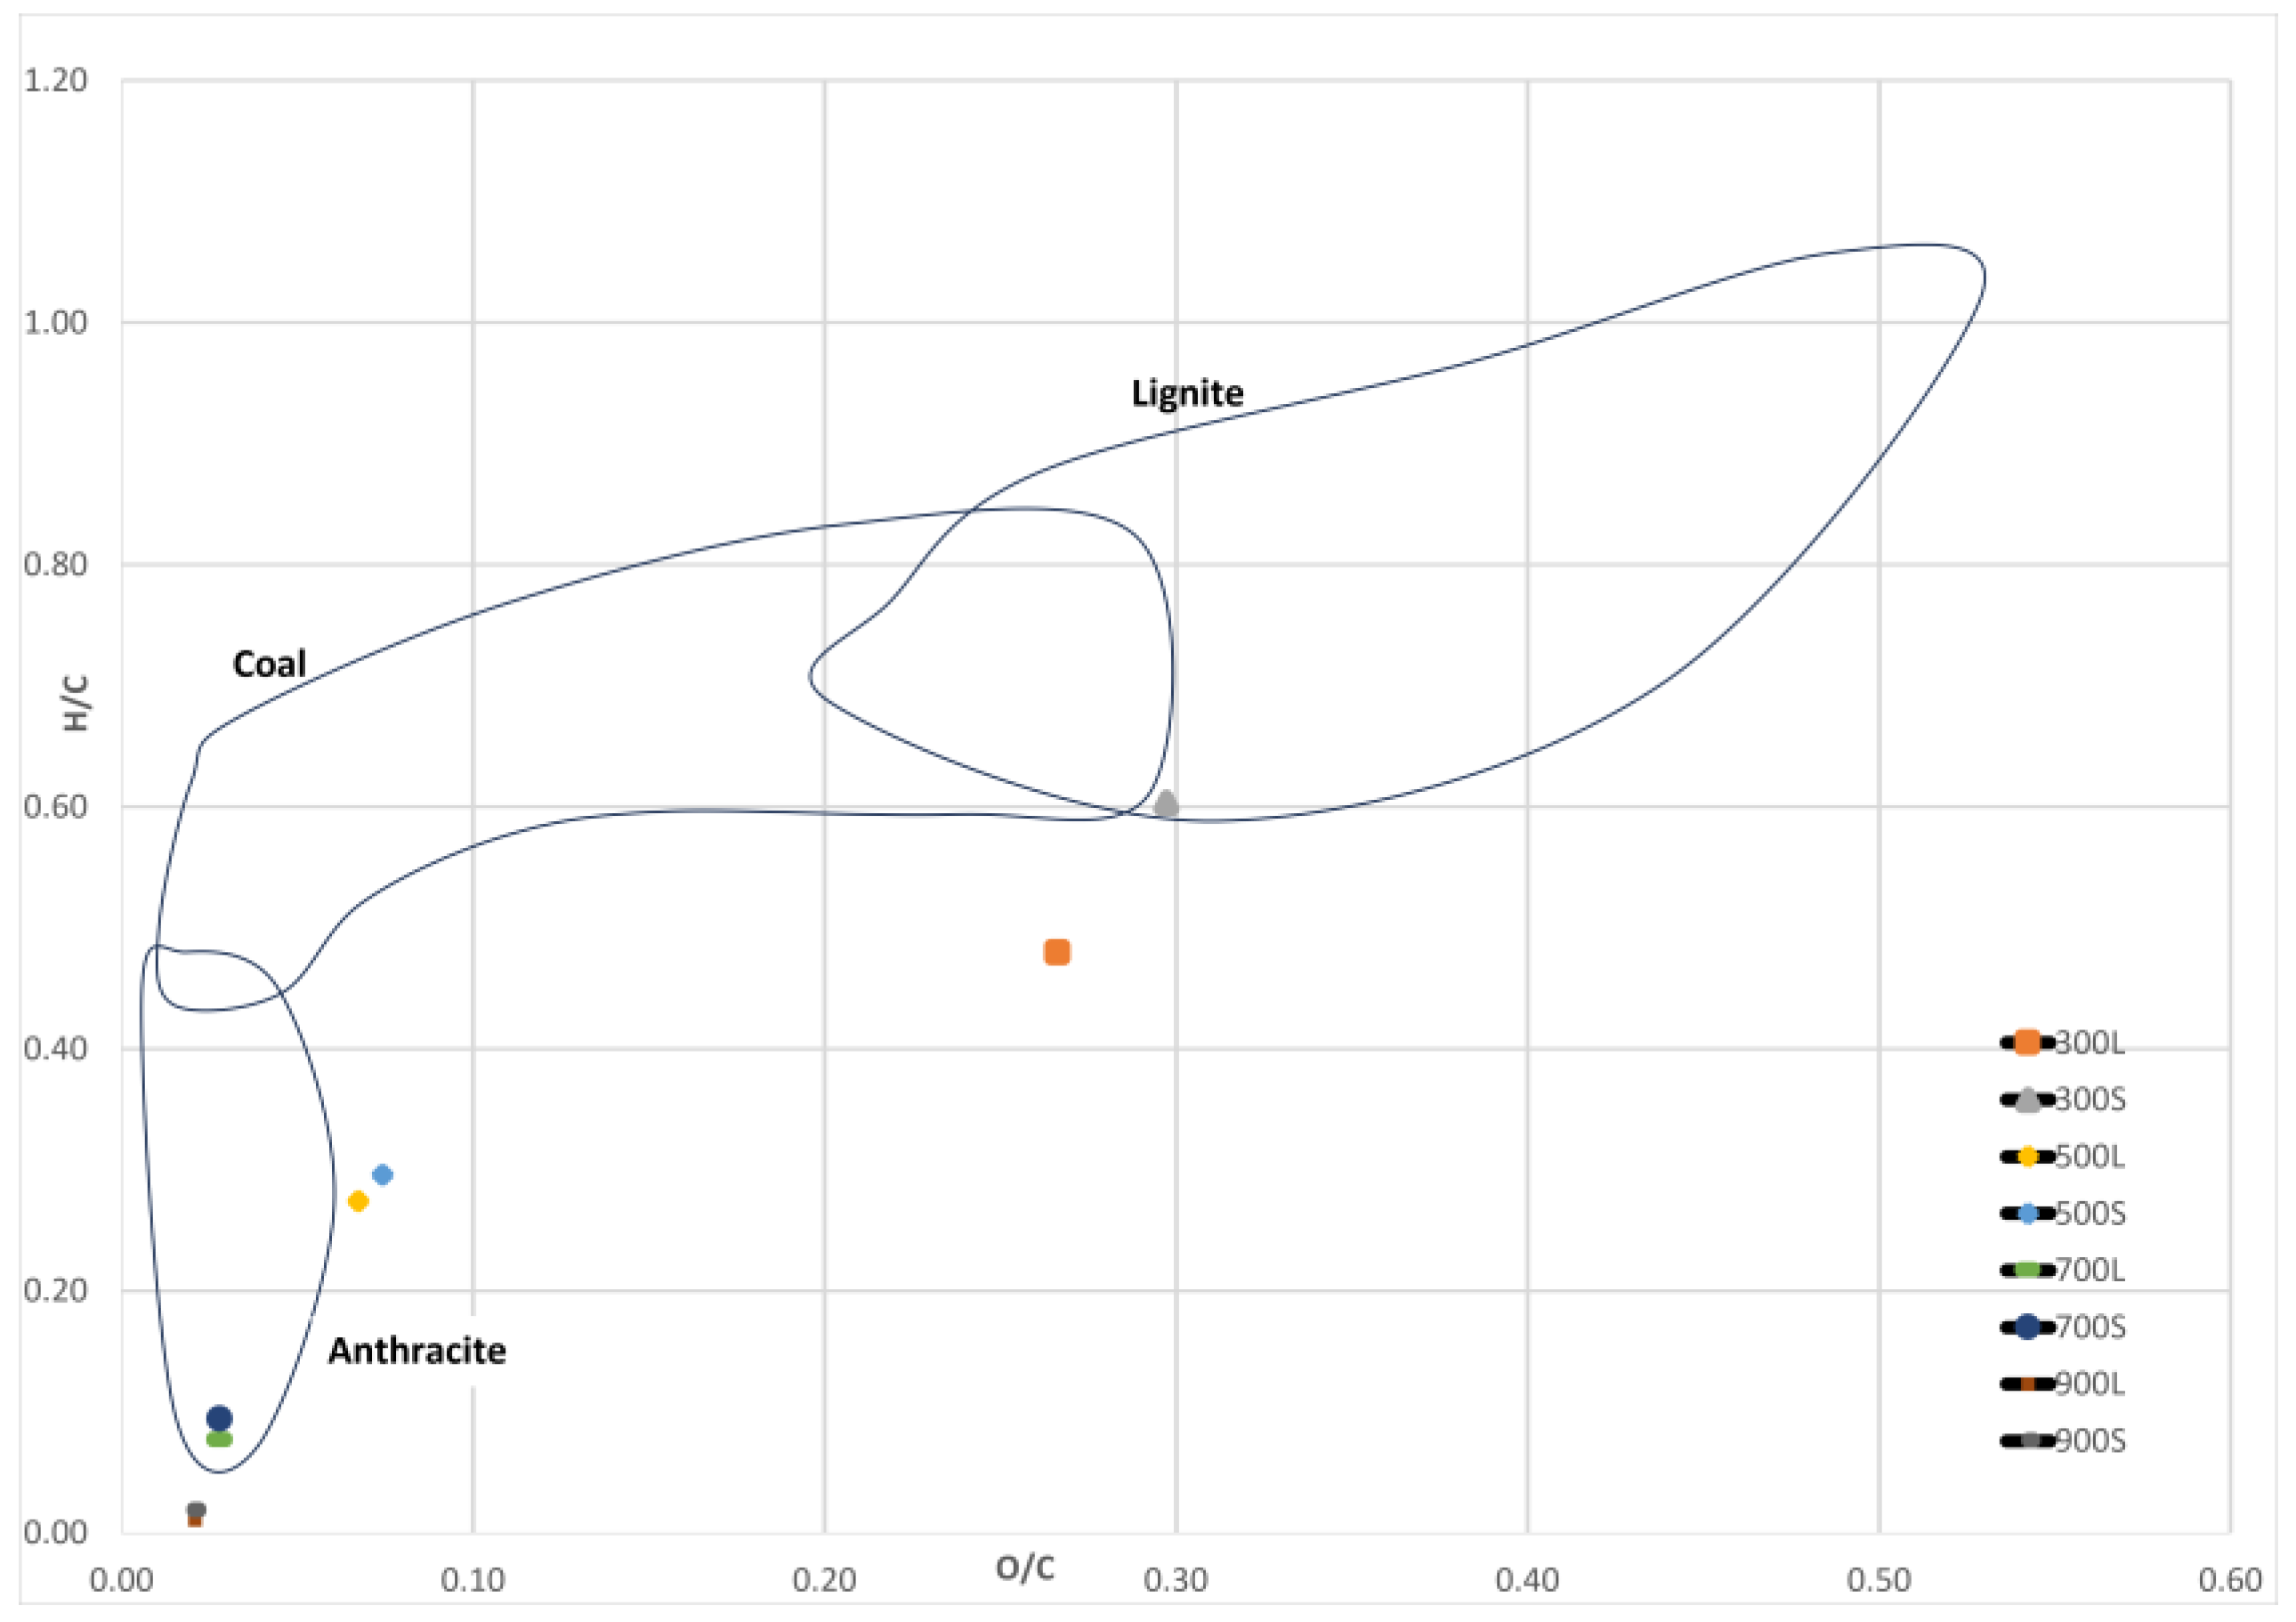
Figure 10 shows the calculated H/C and O/C values in the Van Krevelen diagram. The atomic O/C and H/C ratio of spruce biocarbons were in the range of 0.02–0.27 and 0.1–0.48 for conventional pyrolysis, respectively, and 0.02–0.30 and 0.02–0.60 for segmented pyrolysis, respectively. The results show that increasing pyrolysis temperature caused these values to decrease in both methods. The decrease in the ratios is linked to decreased content of oxygen and hydrogen and increased carbon content of the samples. Similar effects of pyrolysis temperature on H/C and O/C ratios have been reported in the literature [33,47].
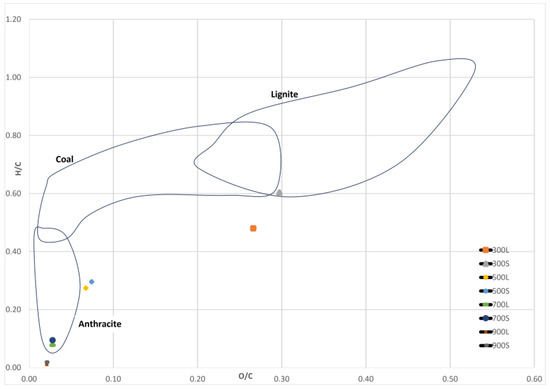
Figure 10.
Van Krevelen diagram. Data from different areas obtained from [48,49,50].
The results indicate that biocarbons produced in segmented pyrolysis at 300 °C have similar O/C and H/C ratios than lignite coal. When the pyrolysis temperature was 500 °C, the observed ratios of the samples in both methods were quite close to those of anthracite. Biocarbons produced at 700 °C had H/C and O/C ratios similar to those of anthracite.
3.7. Density and Higher Heating Value of Biocarbons
3.7.1. Density
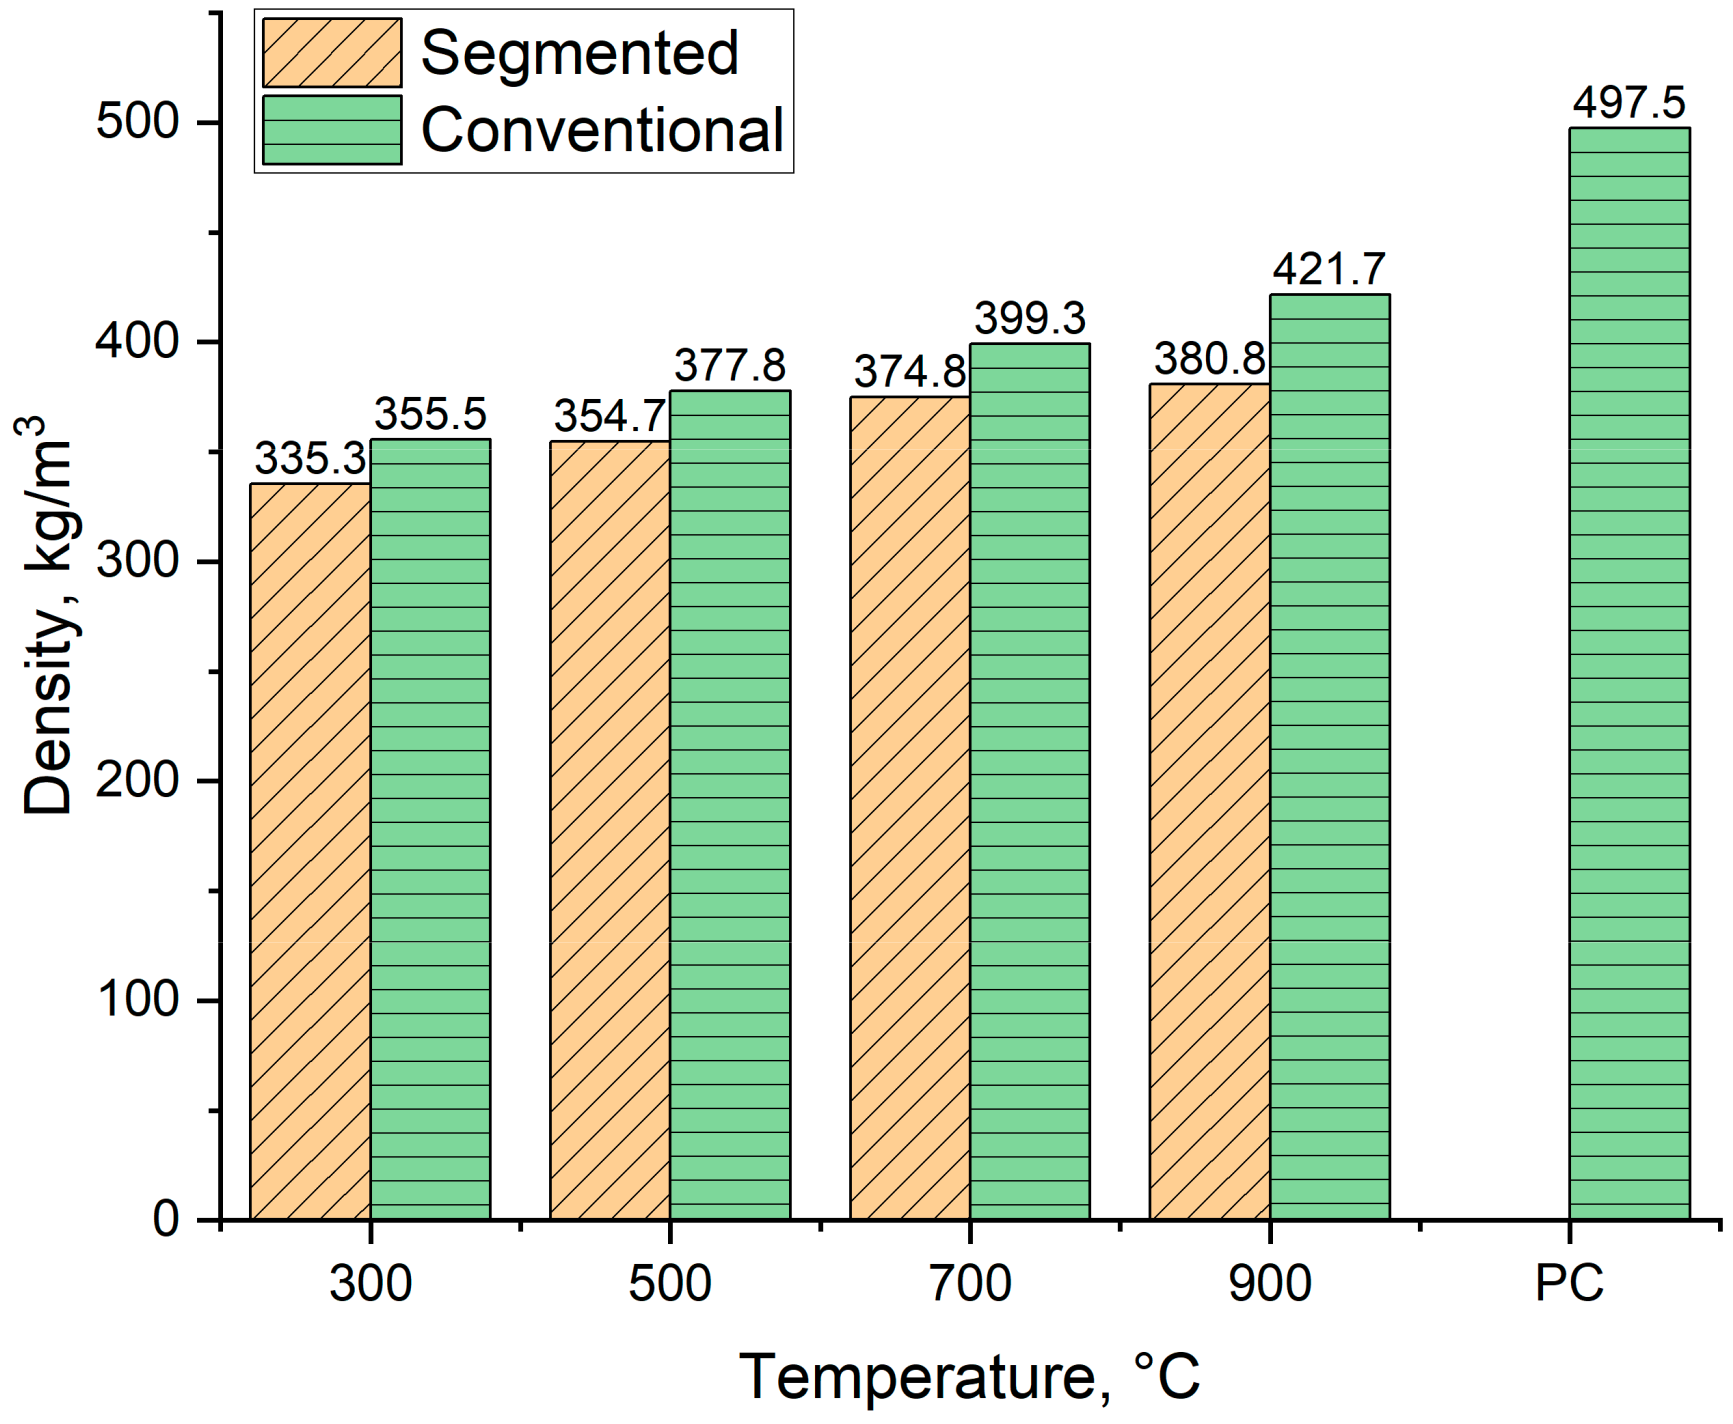
Figure 11 shows the loose density of produced biocarbons alongside the reference density for pulverized coal. As Figure 11 shows, the density of produced biocarbons varied from 355 kg/m3 to 421.7 kg/m3 for conventional pyrolysis and 335.3 kg/m3 to 380.8 kg/m3 for segmented pyrolysis. The density of the biocarbons increases when the pyrolysis temperature rises. This is because when the pyrolysis temperature rises, the proportions of denser compounds such as carbon and ash increase, and the proportions of lighter compounds such as hydrogen and oxygen decreases. These changes make the biocarbon denser [51,52]. The observed increase in biocarbon density when conventional pyrolysis is being used is in line with other studies [52,53].
During the pyrolysis, the lignin-based feedstock microstructure also undergoes changes. When the temperature is over 600 °C, amorphous carbon is formatted and structural rearrangement takes place [54,55]. In the literature, it is reported that the bulk density of pulverized coal varies highly, depending on particle size distribution. When the mean particle size is 18 µm, the density of pulverized coal is 353 kg/m3, and when the mean particle size is increased to 224 µm, the density is 727 kg/m3 [56]. Therefore, the obtained value from pulverized coal is the average value of five different particle sizes. These particle sizes were chosen based on the largest possible particle size for milled biocarbons, which in this case means that particle size does not exceed 500 µm.

Figure 11.
The density of produced biocarbons. PC = Pulverized Coal, value obtained from [56].
Figure 11.
The density of produced biocarbons. PC = Pulverized Coal, value obtained from [56].
3.7.2. Higher Heating Value
Heating value is one the key factors that defines how suitable the feedstock is to be used as a part of metallurgical applications. Low heating values mean that more of the material needs to be brought to the process compared to feedstocks which have higher heating value [57].
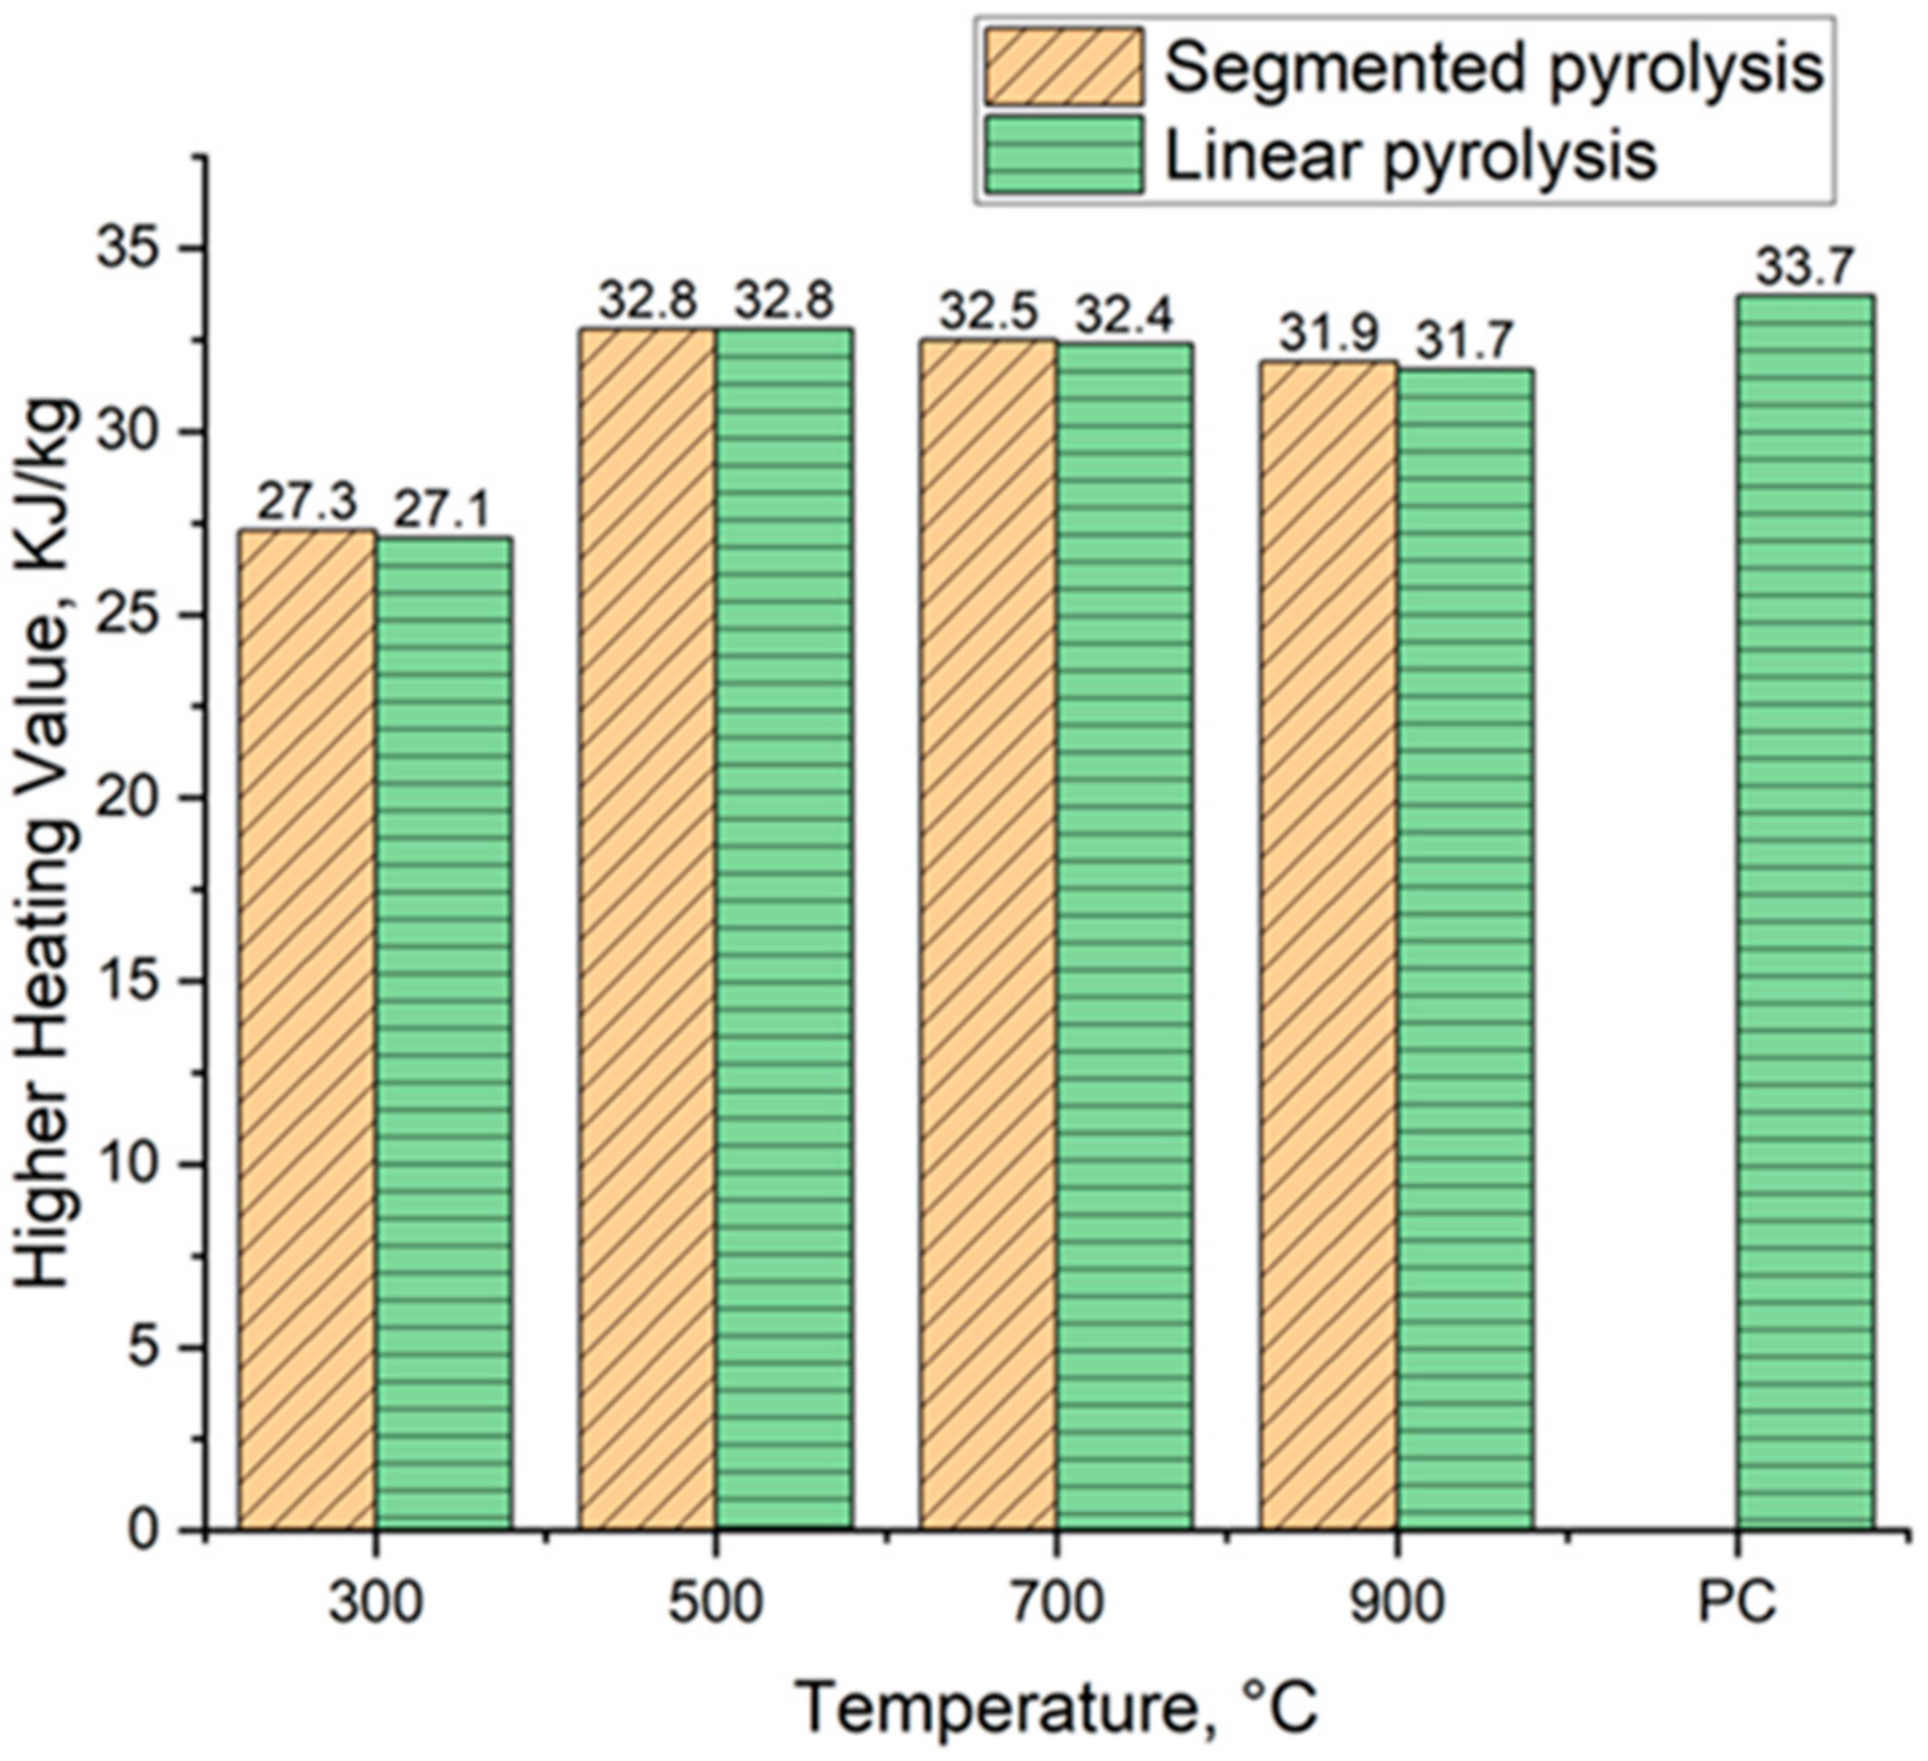
Figure 12 shows the evolution of higher heating values of biocarbons alongside the used reference heating value for pulverized coal. The heating value varied from 27.3 MJ kg−1 to 32.8 MJ kg−1 for biocarbons produced in segmented pyrolysis and from 27.1 MJ kg−1 to 32.8 MJ kg−1 for biocarbons produced conventionally. The heating value tends to decrease when the pyrolysis temperature is increased from 500 °C to 900 °C. This decrease could be caused by the increased ash content of the samples. It is reported in the literature that an increase in ash content by 1% reduces the calorific value by 0.2 MJ kg−1 [58]. The second possible explanation for this decrease is that because the samples have different carbon, hydrogen, and oxygen contents, the changes in the ratios between these substances directly affects the heating value of the biocarbons.

Figure 12.
The development of higher heating values of biocarbons. PC = Pulverized coal, value obtained from [59].
Overall, segmented pyrolysis produced biocarbons with increased heating value compared to conventional pyrolysis. The heating value reached its peak for both methods at the pyrolysis temperature of 500 °C, that being 32.8 MJ kg−1. A similar decrease in heating value when conventional pyrolysis is being used is reported by Mishra et al. [47]. The results of the heating value of biocarbons produced at the temperature of 500 °C are pretty close to the value of pulverized coal, 33.7 MJ kg−1, reported by Wang et al. [59]. However, the heating value of coals changes depending on the type of coal used. For example, Babich et al. [60] reported that the heating value of pulverized coal is 32.4 MJ/kg−1. This means that it is possible to produce biocarbon with similar heating values to pulverized coal.
3.7.3. Energy Density
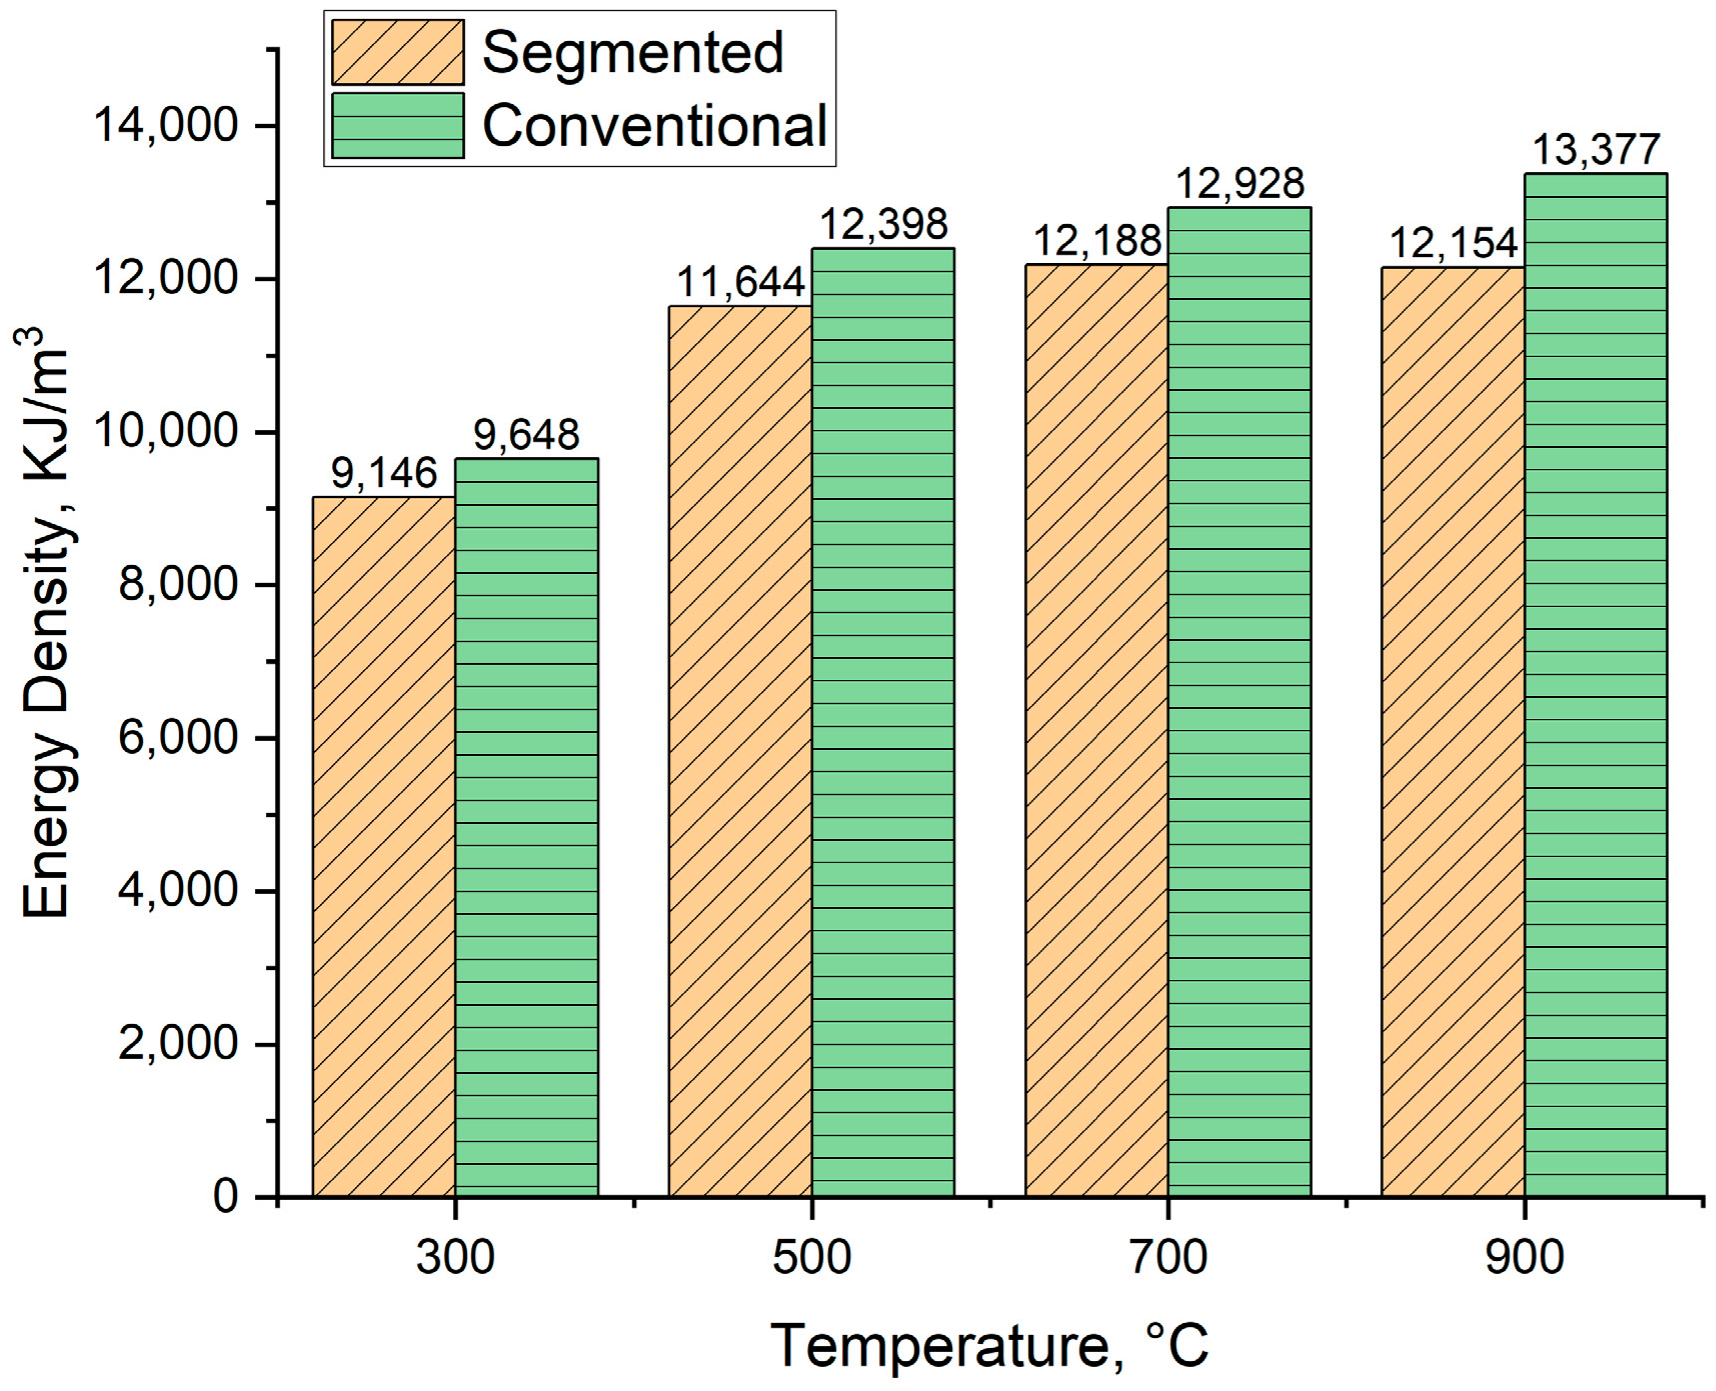
The calculated energy density of the produced biocarbons is presented in Figure 13. For segmented pyrolysis, the energy density varied from 9146 KJ/m3 to 12,188 KJ/m3, and in case of conventional pyrolysis, from 9448 KJ/m3 to 13,377 KJ/m3. In general, conventional pyrolysis produced biocarbons with higher energy density compared to segmented pyrolysis. As the pyrolysis temperature rises, so does the energy density for biocarbons produced in the conventional way. For segmented pyrolysis, the energy density tends to decrease when the pyrolysis temperature is increased from 700 °C to 900 °C. The decrease in energy density is linked to the decreased heating value in these temperatures. On the other hand, the energy density for biocarbons produced in conventional pyrolysis increases, although the heating value decreases when the pyrolysis temperature is increased from 700 °C to 900 °C. In this case, the decreased heating value is compensated by the increase in bulk density. These results show that in view of energy density, the most suitable temperature for segmented pyrolysis is 700 °C, and for conventional pyrolysis, 900 °C.

Figure 13.
Energy density of produced biocarbons.
4. Conclusions
The mechanistic pathway of carbonization of lignocellulosic biomass was taken into account to produce biocarbon at temperatures from 300 °C to 900 °C using three-stage pyrolysis. In this concept, the first stage was used to heat the feedstock close to its decomposition temperature, the second stage was used to bring uniform temperature through the feedstock, and the third phase was used to finalize the pyrolysis.
The thermogravimetric analysis of the pyrolysis showed that the optimal temperature for the first stage is around 360 °C based on the decomposition behavior of spruce. By setting a holding stage to this temperature, excessive depolymerization can be prevented while enabling secondary pyrolysis reactions to occur, thus increasing the solid biocarbon yield. After the temperature surpasses 400 °C, there is only a little mass loss to be observed, and it is mainly contributed by the decomposition of lignin. This could enable using higher heating rates when heating the samples to the second and third stages, and thus could make segmented pyrolysis faster than conventional pyrolysis without losing quality or solid yield of the produced biocarbon.
By comparing biocarbon yields between segmented and conventional, it was shown that segmented pyrolysis increases biocarbon yield up to 5.4% compared to conventional pyrolysis. The yield of fixed carbon increased 1.5% compared to conventional pyrolysis. The comparison between biocarbons produced with different temperatures and methods showed that biocarbons produced at 700 °C using segmented pyrolysis have the best properties, in view of how suitable they are in metallurgical use. This is based on the following characteristics:
- High biocarbon yield and yield of fixed carbon. Segmented pyrolysis led to 1% higher biocarbon yield compared to conventional pyrolysis with increased thermal stability and yield of fixed carbon.
- High carbon content. Carbon content was 94.55% when segmented pyrolysis took place. This was slightly lower compared to conventional pyrolysis, but still high enough to fulfill the requirements of processes in the iron and steel industry.
- Shorter process time compared to pyrolysis at higher temperatures. Biocarbons that were produced at higher temperatures showed similar characteristics to those produced at 700 °C, but because of the shorter process time and greater energy needed to heat the feedstock in higher temperatures, pyrolysis at 700 °C is more suitable.
Author Contributions
Conceptualization, M.P. and A.K.; Methodology, M.P.; Formal Analysis, M.P.; Investigation, M.P.; Writing—Original Draft, M.P.; Writing—Review and Editing, M.P., A.K., P.S. and T.F.; Supervision, A.K., P.S. and T.F.; Project administration, P.S. and T.F.; Funding acquisition, P.S. and T.F.; Visualization, M.P. All authors have read and agreed to the published version of the manuscript.
Funding
This research was funded by Business Finland as a part of the Towards Fossil-Free Steel (FFS2) research program, grant number 5534/31/2023. M.P. also received financial support for the Association of Finnish Steel and Metal Producers of the Technology Industries of Finland Centennial Foundation, the Finnish Foundation for Technology Promotion, and the Taunö Tönning Foundation.
Data Availability Statement
Data will be made available on request.
Acknowledgments
Tommi Kokkonen is acknowledged for his technical support in laboratory work at the University of Oulu.
Conflicts of Interest
The authors declare that they do not have any known competing financial interests or personal relationships that could have appeared to influence the work reported in this paper.
References
- Kieush, L.; Rieger, J.; Schenk, J.; Brondi, C.; Rovelli, D.; Echterhof, T.; Cirilli, F.; Thaler, C.; Jaeger, N.; Snaet, D.; et al. A Comprehensive Review of Secondary Carbon Bio-Carriers for Application in Metallurgical Processes: Utilization of Torrefied Biomass in Steel Production. Metals 2022, 12, 2005. [Google Scholar] [CrossRef]
- Suopajärvi, H.; Kemppainen, A.; Haapakangas, J.; Fabritius, T. Extensive Review of the Opportunities to Use Biomass-Based Fuels in Iron and Steelmaking Processes. J. Clean. Prod. 2017, 148, 709–734. [Google Scholar] [CrossRef]
- Digiovanni, C.; Li, D.; Ng, K.W.; Huang, X.; Digiovanni, C.; Li, D.; Ng, K.W.; Huang, X. Ranking of Injection Biochar for Slag Foaming Applications in Steelmaking. Metals 2023, 13, 1003. [Google Scholar] [CrossRef]
- Suopajärvi, H.; Pongrácz, E.; Fabritius, T. The Potential of Using Biomass-Based Reducing Agents in the Blast Furnace: A Review of Thermochemical Conversion Technologies and Assessments Related to Sustainability. Renew. Sustain. Energy Rev. 2013, 25, 511–528. [Google Scholar] [CrossRef]
- Sriram, N.; Shahidehpour, M. Renewable Biomass Energy. In Proceedings of the 2005 IEEE Power Engineering Society General Meeting, San Francisco, CA, USA, 16 June 2005; Volume 1, pp. 612–617. [Google Scholar] [CrossRef]
- Echterhof, T. Review on the Use of Alternative Carbon Sources in EAF Steelmaking. Metals 2021, 11, 222. [Google Scholar] [CrossRef]
- Khanna, R.; Li, K.; Wang, Z.; Sun, M.; Zhang, J.; Mukherjee, P.S. Biochars in Iron and Steel Industries. In Char and Carbon Materials Derived from Biomass: Production, Characterization and Applications; Jeguirim, M., Limousy, L., Eds.; Elsevier: Amsterdam, The Netherlands, 2019; pp. 429–446. ISBN 9780128148945. [Google Scholar]
- Mousa, E.; Wang, C.; Riesbeck, J.; Larsson, M. Biomass Applications in Iron and Steel Industry: An Overview of Challenges and Opportunities. Renew. Sustain. Energy Rev. 2016, 65, 1247–1266. [Google Scholar] [CrossRef]
- Ronsse, F.; van Hecke, S.; Dickinson, D.; Prins, W. Production and Characterization of Slow Pyrolysis Biochar: Influence of Feedstock Type and Pyrolysis Conditions. GCB Bioenergy 2013, 5, 104–115. [Google Scholar] [CrossRef]
- Al Arni, S. Comparison of Slow and Fast Pyrolysis for Converting Biomass into Fuel. Renew. Energy 2018, 124, 197–201. [Google Scholar] [CrossRef]
- Nanda, S.; Mohammad, J.; Reddy, S.N.; Kozinski, J.A.; Dalai, A.K. Pathways of Lignocellulosic Biomass Conversion to Renewable Fuels. Biomass Convers. Biorefin. 2014, 5, 157–191. [Google Scholar] [CrossRef]
- Babinszki, B.; Sebestyén, Z.; Jakab, E.; Kőhalmi, L.; Bozi, J.; Várhegyi, G.; Wang, L.; Skreiberg, Ø; Czégény, Z. Effect of Slow Pyrolysis Conditions on Biocarbon Yield and Properties: Characterization of the Volatiles. Bioresour. Technol. 2021, 338, 125567. [Google Scholar] [CrossRef]
- Patra, B.R.; Nanda, S.; Dalai, A.K.; Meda, V. Slow Pyrolysis of Agro-Food Wastes and Physicochemical Characterization of Biofuel Products. Chemosphere 2021, 285, 131431. [Google Scholar] [CrossRef]
- Qing, M.; Long, Y.; Liu, L.; Yi, Y.; Li, W.; He, R.; Yin, Y.; Tian, H.; He, J.; Cheng, S.; et al. Pyrolysis of the Food Waste Collected from Catering and Households under Different Temperatures: Assessing the Evolution of Char Structure and Bio-Oil Composition. J. Anal. Appl. Pyrolysis 2022, 164, 105543. [Google Scholar] [CrossRef]
- Cheung, K.Y.; Lee, K.L.; Lam, K.L.; Chan, T.Y.; Lee, C.W.; Hui, C.W. Operation Strategy for Multi-Stage Pyrolysis. J. Anal. Appl. Pyrolysis 2011, 91, 165–182. [Google Scholar] [CrossRef]
- Lam, K.-L.; Lee, C.-W.; Hui, C.-W. Multi-Stage Waste Tyre Pyrolysis: An Optimisation Approach. Chem. Eng. Trans. 2010, 21, 853. [Google Scholar] [CrossRef]
- Nachenius, R.W.; Ronsse, F.; Venderbosch, R.H.; Prins, W. Biomass Pyrolysis. In Advances in Chemical Engineering; Marin, G.B., West, D.H., Li, J., Narasimhan, S., Eds.; Academic Press Inc.: San Diego, CA, USA, 2013; Volume 42, pp. 75–139. ISBN 9780123865052. [Google Scholar]
- Oyedun, A.O.; Lam, K.-L.; Gebreegziabher, T.; Lee, H.K.; Hui, C.-W. Optimisation of Operating Parameters in Multi-Stage Pyrolysis. Chem. Eng. Trans. 2012, 29, 655–660. [Google Scholar] [CrossRef]
- Cai, W.; Liu, Q.; Shen, D.; Wang, J. Py-GC/MS Analysis on Product Distribution of Two-Staged Biomass Pyrolysis. J. Anal. Appl. Pyrolysis 2019, 138, 62–69. [Google Scholar] [CrossRef]
- Jian, J.; Lu, Z.; Yao, S.; Li, Y.; Liu, Z.; Lang, B.; Chen, Z. Effects of Thermal Conditions on Char Yield and Char Reactivity of Woody Biomass in Stepwise Pyrolysis. J. Anal. Appl. Pyrolysis 2019, 138, 211–217. [Google Scholar] [CrossRef]
- Oyedun, A.O.; Lam, K.L.; Hui, C.W. Charcoal Production via Multistage Pyrolysis. Chin. J. Chem. Eng. 2012, 20, 455–460. [Google Scholar] [CrossRef]
- Han, K.; Wang, Q.; Zhao, J.; Luo, K.H.; Li, H.; Chen, Y.; Lu, C. Combustion Pattern, Characteristics, and Kinetics of Biomass and Chars from Segmented Heating Carbonization. Asia-Pac. J. Chem. Eng. 2016, 11, 812–822. [Google Scholar] [CrossRef]
- Qi, J.; Zhao, J.; Xu, Y.; Wang, Y.; Han, K. Segmented Heating Carbonization of Biomass: Yields, Property and Estimation of Heating Value of Chars. Energy 2018, 144, 301–311. [Google Scholar] [CrossRef]
- Grigiante, M.; Ischia, M.; Baratieri, M.; Maschio, R.D.; Ragazzi, M. Pyrolysis Analysis and Solid Residue Stabilization of Polymers, Waste Tyres, Spruce Sawdust and Sewage Sludge. Waste Biomass Valorization 2010, 1, 381–393. [Google Scholar] [CrossRef]
- Smołka-Danielowska, D.; Jabłońska, M. Chemical and Mineral Composition of Ashes from Wood Biomass Combustion in Domestic Wood-Fired Furnaces. Int. J. Environ. Sci. Technol. 2022, 19, 5359–5372. [Google Scholar] [CrossRef]
- Cassel, B.; Menard, K. Proximate Analysis of Coal and Coke Using the STA 8000 Simultaneous Thermal Analyzer; PerkinElmer, Inc.: Shelton, CT, USA, 2012; Available online: https://resources.perkinelmer.com/lab-solutions/resources/docs/app_proximate_analysis_coal_coke.pdf (accessed on 12 October 2022).
- Ingemarsson, Å.; Nilsson, U.; Nilsson, M.; Pedersen, J.R.; Olsson, J.O. Slow Pyrolysis of Spruce and Pine Samples Studied with GC/MS and GC/FTIR/FID. Chemosphere 1998, 36, 2879–2889. [Google Scholar] [CrossRef]
- Chen, J.; Lu, Z.; Jian, J.; Bao, Z.; Cai, J.; Yao, S. Effect of Torrefaction on Yield, Reactivity and Physicochemical Properties of Pyrolyzed Char from Three Major Biomass Constituents. J. Anal. Appl. Pyrolysis 2023, 173, 106104. [Google Scholar] [CrossRef]
- Elyounssi, K.; Blin, J.; Halim, M. High-Yield Charcoal Production by Two-Step Pyrolysis. J. Anal. Appl. Pyrolysis 2010, 87, 138–143. [Google Scholar] [CrossRef]
- Abdullah, E.C.; Geldart, D. The Use of Bulk Density Measurements as Flowability Indicators. Powder Technol. 1999, 102, 151–165. [Google Scholar] [CrossRef]
- Chevanan, N.; Womac, A.R.; Bitra, V.S.P.; Igathinathane, C.; Yang, Y.T.; Miu, P.I.; Sokhansanj, S. Bulk Density and Compaction Behavior of Knife Mill Chopped Switchgrass, Wheat Straw, and Corn Stover. Bioresour. Technol. 2010, 101, 207–214. [Google Scholar] [CrossRef]
- Theegala, C.S.; Midgett, J.S. Hydrothermal Liquefaction of Separated Dairy Manure for Production of Bio-Oils with Simultaneous Waste Treatment. Bioresour. Technol. 2012, 107, 456–463. [Google Scholar] [CrossRef] [PubMed]
- Suresh Babu, K.K.B.; Nataraj, M.; Tayappa, M.; Vyas, Y.; Mishra, R.K.; Acharya, B. Production of Biochar from Waste Biomass Using Slow Pyrolysis: Studies of the Effect of Pyrolysis Temperature and Holding Time on Biochar Yield and Properties. Mater. Sci. Energy Technol. 2024, 7, 318–334. [Google Scholar] [CrossRef]
- Yang, H.; Yan, R.; Chen, H.; Lee, D.H.; Zheng, C. Characteristics of Hemicellulose, Cellulose and Lignin Pyrolysis. Fuel 2007, 86, 1781–1788. [Google Scholar] [CrossRef]
- Waters, C.L.; Janupala, R.R.; Mallinson, R.G.; Lobban, L.L. Staged Thermal Fractionation for Segregation of Lignin and Cellulose Pyrolysis Products: An Experimental Study of Residence Time and Temperature Effects. J. Anal. Appl. Pyrolysis 2017, 126, 380–389. [Google Scholar] [CrossRef]
- Zou, X.; Debiagi, P.; Amjed, M.A.; Zhai, M.; Faravelli, T. Impact of High-Temperature Biomass Pyrolysis on Biochar Formation and Composition. J. Anal. Appl. Pyrolysis 2024, 179, 106463. [Google Scholar] [CrossRef]
- Iurchenkova, A.; Kobets, A.; Ahaliabadeh, Z.; Kosir, J.; Laakso, E.; Virtanen, T.; Siipola, V.; Lahtinen, J.; Kallio, T. The Effect of the Pyrolysis Temperature and Biomass Type on the Biocarbons Characteristics. ChemSusChem 2024, 17, e202301005. [Google Scholar] [CrossRef] [PubMed]
- Suopajärvi, H.; Umeki, K.; Mousa, E.; Hedayati, A.; Romar, H.; Kemppainen, A.; Wang, C.; Phounglamcheik, A.; Tuomikoski, S.; Norberg, N.; et al. Use of Biomass in Integrated Steelmaking—Status Quo, Future Needs and Comparison to Other Low-CO2 Steel Production Technologies. Appl. Energy 2018, 213, 384–407. [Google Scholar] [CrossRef]
- Varsally, Z.B.; Tripathi, N.; Weldekidan, H.; Rodriguez-Uribe, A.; Das, O.; Mohanty, A.K.; Misra, M. A Sustainable Approach for Developing Biocarbon from Lignin and Its Utilization in Recycled Ocean Nylon Based Biocomposites. Compos. Part C Open Access 2023, 12, 100376. [Google Scholar] [CrossRef]
- Sharma, A.; Pareek, V.; Zhang, D. Biomass Pyrolysis—A Review of Modelling, Process Parameters and Catalytic Studies. Renew. Sustain. Energy Rev. 2015, 50, 1081–1096. [Google Scholar] [CrossRef]
- Wang, L.; Buvarp, F.; Skreiberg, Ø.; Khalil, R. Impact of Storage Time and Conditions on Properties of Biocarbon. Chem. Eng. Trans. 2018, 65, 715–720. [Google Scholar] [CrossRef]
- Rafiq, M.K.; Bachmann, R.T.; Rafiq, M.T.; Shang, Z.; Joseph, S.; Long, R.L. Influence of Pyrolysis Temperature on Physico-Chemical Properties of Corn Stover (Zea mays L.) Biochar and Feasibility for Carbon Capture and Energy Balance. PLoS ONE 2016, 11, e0156894. [Google Scholar] [CrossRef] [PubMed]
- Tomczyk, A.; Sokołowska, Z.; Boguta, P. Biochar Physicochemical Properties: Pyrolysis Temperature and Feedstock Kind Effects. Rev. Environ. Sci. Biotechnol. 2020, 19, 191–215. [Google Scholar] [CrossRef]
- Tripathi, N.; Rodriguez Uribe, A.; Weldekidan, H.; Misra, M.; Mohanty, A.K. Upcycling of Waste Jute Biomass to Advanced Biocarbon Materials: The Effect of Pyrolysis Temperature on Their Physicochemical and Electrical Properties. Mater. Adv. 2022, 3, 9071–9082. [Google Scholar] [CrossRef]
- Collard, F.-X.; Blin, J. A Review on Pyrolysis of Biomass Constituents: Mechanisms and composition of the Products Obtained from the Conversion of Cellulose, Hemicelluloses and Lignin. Renew. Sustain. Energy Rev. 2014, 38, 594–608. [Google Scholar] [CrossRef]
- Bamboriya, O.P.; Thakur, L.S.; Parmar, H.; Varma, A.K.; Hinge, V.K. A Review on Mechanism and Factors Affecting Pyrolysis of Biomass. Int. J. Res. Advent Technol. 2019, 7, 1014–1024. [Google Scholar]
- Nanda, S.; Dalai, A.K.; Berruti, F.; Kozinski, J.A. Biochar as an Exceptional Bioresource for Energy, Agronomy, Carbon Sequestration, Activated Carbon and Specialty Materials. Waste Biomass Valorization 2015, 7, 201–235. [Google Scholar] [CrossRef]
- Kurose, R.; Ikeda, M.; Makino, H.; Kimoto, M.; Miyazaki, T. Pulverized Coal Combustion Characteristics of High-Fuel-Ratio Coals. Fuel 2004, 83, 1777–1785. [Google Scholar] [CrossRef]
- Miller, B.G.; Tillman, D.A. Coal Characteristics. In Combustion Engineering Issues for Solid Fuel Systems; Miller, B., Tillman, D., Eds.; Academic Press: Amsterdam, The Netherlands, 2008; pp. 33–81. ISBN 9780123736116. [Google Scholar]
- Poudel, J.; Karki, S.; Oh, S.C. Valorization of Waste Wood as a Solid Fuel by Torrefaction. Energies 2018, 11, 1641. [Google Scholar] [CrossRef]
- Brewer, C.E.; Chuang, V.J.; Masiello, C.A.; Gonnermann, H.; Gao, X.; Dugan, B.; Driver, L.E.; Panzacchi, P.; Zygourakis, K.; Davies, C.A. New Approaches to Measuring Biochar Density and Porosity. Biomass Bioenergy 2014, 66, 176–185. [Google Scholar] [CrossRef]
- Farrokh, N.T.; Suopajärvi, H.; Mattila, O.; Sulasalmi, P.; Fabritius, T. Characteristics of Wood-Based Biochars for Pulverized Coal Injection. Fuel 2020, 265, 117017. [Google Scholar] [CrossRef]
- Farrokh, N.T.; Suopajärvi, H.; Mattila, O.; Umeki, K.; Phounglamcheik, A.; Romar, H.; Sulasalmi, P.; Fabritius, T. Slow Pyrolysis of By-Product Lignin from Wood-Based Ethanol Production—A Detailed Analysis of the Produced Chars. Energy 2018, 164, 112–123. [Google Scholar] [CrossRef]
- Cao, J.; Xiao, G.; Xu, X.; Shen, D.; Jin, B. Study on Carbonization of Lignin by TG-FTIR and High-Temperature Carbonization Reactor. Fuel Process. Technol. 2013, 106, 41–47. [Google Scholar] [CrossRef]
- Yao, M.; Bi, X.; Wang, Z.; Yu, P.; Dufresne, A.; Jiang, C. Recent Advances in Lignin-Based Carbon Materials and Their Applications: A Review. Int. J. Biol. Macromol. 2022, 223, 980–1014. [Google Scholar] [CrossRef] [PubMed]
- Lu, H.; Guo, X.; Liu, Y.; Gong, X. Effect of Particle Size on Flow Mode and Flow Characteristics of Pulverized Coal. KONA Powder Part. J. 2015, 32, 143–153. [Google Scholar] [CrossRef]
- Suopajärvi, H.; Fabritius, T. Towards More Sustainable Ironmaking—An Analysis of Energy Wood Availability in Finland and the Economics of Charcoal Production. Sustainability 2013, 5, 1188–1207. [Google Scholar] [CrossRef]
- Zając, G.; Szyszlak-Bargłowicz, J.; Gołębiowski, W.; Szczepanik, M. Chemical Characteristics of Biomass Ashes. Energies 2018, 11, 2885. [Google Scholar] [CrossRef]
- Wang, C.; Mellin, P.; Lövgren, J.; Nilsson, L.; Yang, W.; Salman, H.; Hultgren, A.; Larsson, M. Biomass as Blast Furnace Injectant—Considering Availability, Pretreatment and Deployment in the Swedish Steel Industry. Energy Convers. Manag. 2015, 102, 217–226. [Google Scholar] [CrossRef]
- Babich, A.; Senk, D.; Fernandez, M. Charcoal Behaviour by Its Injection into the Modern Blast Furnace. ISIJ Int. 2010, 50, 81–88. [Google Scholar] [CrossRef]

Disclaimer/Publisher’s Note: The statements, opinions and data contained in all publications are solely those of the individual author(s) and contributor(s) and not of MDPI and/or the editor(s). MDPI and/or the editor(s) disclaim responsibility for any injury to people or property resulting from any ideas, methods, instructions or products referred to in the content. |
© 2024 by the authors. Licensee MDPI, Basel, Switzerland. This article is an open access article distributed under the terms and conditions of the Creative Commons Attribution (CC BY) license (https://creativecommons.org/licenses/by/4.0/).