Abstract
Dual-mode propellers, as propulsion and turbine devices, have found widespread application in renewable energy systems for marine vehicles, particularly in sailing boats and yachts. However, the existing dual-mode propellers in these contexts are typically chosen in an off-the-shelf manner, indicating a lack of hydrodynamic optimisation to enhance both the propulsion and energy generation efficiency in the same rotor. To address this limitation and furnish scientific validation of the design of a dual-mode propeller turbine rotor optimised to achieve a balanced performance in both propulsion and energy generation, rigorous experimentation was conducted using specialised software, Rotorysics 2019, and a case study vessel, the Princess Royale. Utilising prior experimental data for this propeller turbine, code validation was undertaken to ensure accurate prediction of the effects of the pitch, blade count and expanded area ratio on the performance in both modes. With the intention of achieving optimal power generation and propulsion efficiencies in conjunction with a single rotor, the findings reveal that the optimised fixed-pitch propeller exhibits dual functionality. They serve as both propulsion and tidal/current turbines with balanced efficiency. They are particularly suitable for low-speed vessels such as yachts anchored in currents or for sailboats utilising a propeller as a towed turbine. Through thorough testing and analysis, the concept of a dual-mode propeller turbine was feasible. Analysing them separately, in terms of the propulsion, the best geometry found through numerous tests of different expanded area ratios, blade number, pitch and speed was the 3-blade, 0.6 pitch ratio, which achieved a propulsive efficiency of 54.33% (0.5433204) and a power coefficient of 0.291843. Conversely, if the focus was on power generation while maintaining excellent propulsive efficiency, the optimal geometry would be the 5-blade, 0.6 pitch ratio, which offers a power coefficient of 0.348402 and a propulsive efficiency of 48.55% (0.48547). However, when using both power generation and propulsion as the criteria, the 5-blade, 0.6 pitch ratio, with an EAR of 0.387142, is superior, with balanced optimisation, offering a propulsive efficiency of 52.53% (0.52527) and a power coefficient of 0.319718. As expected, this encompasses a higher blade number for increased power generation efficiency and a higher pitch ratio for increased propulsive efficiency.
1. Introduction
The use of electricity has been a major driving force in the evolution and rate of advance of humans driven by the extraction and utilisation of fossil fuels for past decades. As the world moves forward in technology and innovation, the objective of evolving is consistent, but the methods used are intended to be more environmentally conscious. This and preserving the planet will move humanity into a new applied science and engineering dimension. The Earth’s longevity is planned to be increased with the primary use of crude oil gradually being phased out for renewable sources. This can be seen everywhere, even in vehicles, with plans for all new cars sold after 2030 to be electrified [1].
Tidal currents are bidirectional; thus, horizontal-axis tidal turbines are designed to operate unidirectionally or bidirectionally [2]. Tidal forces are periodic variations in the gravitational attraction exerted by celestial bodies. These forces create motions or currents in the oceans. Water has greater energy density than air, so marine turbines can be built smaller than wind turbines. Additionally, tidal power is much more predictable than wind power, which makes it a better source of electrical energy for feeding the electrical grid.
Multiple renewable energy sources are apparent today with the ever-growing number of wind farms and the increase in houses with solar panels attached to the roofs. Around 1.2 million homes are powered or partly powered by solar panels [3], and there are around 11,500 wind turbines on 2467 wind farms in the United Kingdom [4].
Less visible, though, is the use of currents through tidal turbines to generate electricity. However, it is very important, with the UK government pledging GBP 20 million a year towards investing in tidal power [5]. Tidal power often originates from tidal turbines, which convert the kinetic energy harnessed from the tide/current into electric energy. This is similar to wind turbines, but they use water as the source of power rather than wind. This offers a host of benefits, which are widely praised, as the tides can be predicted, based on the Earth’s and Moon’s motion, and forecasted; thus, the electricity that can be produced through them can be estimated with high accuracy [6], unlike any other sources of renewable energy. The impact on the environment is also shallow, emitting less carbon emissions than competitors, and it is economic on a long-term scale. Furthermore, a vast 40 MW of power through new tidal capacity is expected to be commissioned by 2026–27 and The UK has the resources and coastal areas to meet 20% of the country’s needs through tidal energy [7].
The use of tidal energy has been transferred to the marine industry. The similarity of propellers and turbines is apparent, and the opportunities for their combined abilities are finally being exploited. Products combining these have been available but are not usually optimised and specialised to the vessel and water inflow velocity, meaning much of the potential is unseen.
Liu et al. [8] have delved into the world of dual-mode propeller optimisation, highlighting an optimum pitch, expanded area ratio, and blade number for a specific ship speed using software developed by Liu, formerly known as PROPELLA, now under the name Rotorysics.
Bahaj et al. [9] developed a model using the blade element momentum. They tested it in a cavitation tunnel with an 800 mm diameter propeller rotor and found it possible to predict the hydrodynamic performance through the power and thrust curves. A significant decrease in power was noticed at a higher TSR. Cavitation can be avoided using appropriate designs, but the structural fatigue due to the tidal velocity profile on the loadings of the blade was significant.
Gu et al. [10] investigated the blade pitch system of a tidal turbine, aiming to acquire bidirectional tidal energy with a blade pitch angle of 0–180 degrees. They developed a reduced variation pitch control strategy through a current velocity preview method, focusing on life extension, pitch action, and decreased seal wear. The results showed success while maintaining the high efficiency of the energy generation.
Frost et al. [11] carried out studies on the tidal flow directionality’s effect on tidal turbine performance by comparing a yaw mechanism-based device, permitting the turbine to face into the flow at all times and a turbine with rotating blades on a plane of 180 degrees, allowing the turbine to exploit the bidirectional flow. The results showed that the yaw mechanism was more proficient in terms of performance and experienced less fatigue over its life; the performance was increased at the upstream arrangement, highlighting that the use of a stanchion halted performance and contra-rotating propellers, which do not use a stanchion, are superior from a performance view. Zhu et al. [12] explored the optimisation methods of a tidal turbine blade, applying multi-objective optimisation algorithms sourced from establishing variables and their function on the objective to optimise the power coefficient through the blade’s geometry. In conclusion, the chord length and pitch angle distribution influence the angle of attack, and optimising these gains a 2% increase in the power coefficient of the turbine.
Surface panel methods using lifting surface theory have been integrated into the above design for decades. Firstly, they were explored and translated into the literature for aircraft wing propellers rather than marine propellers.
Throughout history, continuous development of the surface panel methods has been executed. Hess and Vararezo first developed the panel method for lifting bodies [13], then proposed a method that could be utilised to accurately calculate the flow and pressure distributions around the propellers by using an adaptation of the surface panel method in 1985. Boundary element methods were favoured over computational fluid dynamics, which use finite element methods, as only a surface mesh is necessary for boundary element methods. In contrast, an entire volume mesh of the fluid domain is required for finite element methods. This made the panel methods more appealing. Lee under the supervision of Kerwin developed a penal method code for marine propellers [14]. Maskew [15] also used panel methods in a study published in 1982, diving into the aerodynamic characteristics of generic configurations, widening the spectrum of use by modelling three dimensions, separated flows, and utilising vortex sheets covering separated zones. The versatility, computing times and accuracy of the predictions have favoured the panel method.
Since Hess developed the panel method, it was widely used and even adapted to marine propellers by various institutions. Hoshino [16], in 1989, computed the flow fields around a propeller using an improved surface panel method, consisting of a new wake model of trailing vortices and compared the results to that of a model’s flow fields measured in a cavitation tunnel using a laser Doppler velocimeter and found that the calculated results agreed with the measured ones.
An unsteady panel method was developed for fast marine swimmers, a fin whale, a shark and a dophin taking into account of bose the chordwise and spanwise flexibilities by Liu [17].
Knowing the importance of propeller efficiency and its contribution to the overall vessel efficiency, the code Propella was meticulously developed using panel methods. Liu coded in four different modes. Two of these, which are crucial to this study, are the propulsion mode forward and the turbine mode with forward inflow, and the other two are astern in propulsion mode and reverse inflow turbine generation mode [8].
Liu [18] published a study on using the panel method modelling to transition from propulsion to turbine energy in 2010, with the flexible and reliable code known as Propella being the tool used for the predictions. The results showed that the predictions acquired through this software agreed with the widely available measurements, reinforcing its reliability [18].
Many studies were conducted by Liu using this software. To name another, in 2012, Liu used Propella to design and optimise tidal turbine blades, focusing on strength and integrity, to solve the issue of blade failures and fractures, and successfully determined a blade thickness safety factor for turbines in the Minus Passage located in the Bay of Fundy, Canada [2].
The most relevant is Liu’s ‘development and optimisation of dual-mode propellers for renewable energy’, which explored the feasibility of using a propeller as a turbine with coupled efficiency, a dual-mode propeller [8], analysing a series of simulations run through Propella for pitch ratios of 0.29 to 0.99 for a specific geometry with a propeller of 5 m diameter, finding the optimum pitch for power generation to be 0.51, optimum EAR to be 0.5, giving a Cpow of 0.5 and propulsive efficiency of 0.27. At a 0.99 pitch ratio, the Cpow was 0.215, and the propulsive efficiency was 0.56. This meant that the studies were successful, confirming the feasibility of a dual-mode propeller [8].
This study uses a propeller with ideal propulsion characteristics from the B-Wageningen series [19] for testing. It acts as a turbine to generate renewable energy through the kinetic energy of the current, as tidal turbines do. The aim is to compromise on the propulsive ability to achieve a more significant power coefficient and, thus, energy generation ability. The main goal is to attain as much coupled efficiency as possible on a single propeller rotor that could be used on the Princess Royale.
The primary purposes of this study are the following:
- To determine the best geometry and EAR of the two presented.
- To find the optimum pitch ratio between 0.3 and 0.6 for power generation with the propeller as a tidal/current turbine, gaining the optimum power coefficient.
- To find the maximum propulsive efficiency of the propeller optimised for power generation.
- To find the optimum pitch for propulsive efficiency with its respective power coefficient.
- To compare the maximum propulsive efficiency and power coefficient at their optimum pitch ratios.
- To find a mid-point where the propulsive efficiency is acceptable and the power coefficient is ideal, aiming to create and use the propeller for a testing rig on the Princess Royale.
Designing and optimising a propeller for propulsion is a critical stage of the design process. A more efficient propeller will not only increase the performance of the propeller but also reduce the fuel costs, reduce the potential repair or replacement costs, and lengthen the life of the propeller.
The angle of attack is vital when exploring propeller performance, as it is a determinant of two of the most critical forces generated by the propeller: lift and drag. The angle of attack refers to the angle between the chord line of the blade and the inflow direction. There is an optimal range of angles of attack for a specified propeller; under this range would produce lousy efficiency, while above this range would increase drag and decrease lift. Curve and thrust/drag coefficient curves are included to indicate the efficiency of the rotors.
2. Traditional Design Process
Marine propellers have been designed and produced for decades, with John Ericsson producing the first marine screw propeller in 1839. The design of these propellers further progressed withVan Lammeren et. al [20] proposing methods in 1985, producing a design algorithm for propellers operating in open water and for wake-adapted propellers. Since then, the design of propellers has significantly innovated with methods such as the design spiral.
2.1. Marine Propeller Design
The initial design of propellers today consists of identifying the vessel type, size, necessities and characteristics of the propeller, conditions it will operate in, range of RPM, and thrust desired [18]. A design is produced using software such as AutoCAD 2023, usually based on a propeller design for similar requirements. Hydrodynamic analysis takes place, using the results to optimise the diameter, shape pitch and blade profile to maximise hydrodynamic performance and efficiency.
2.2. Tidal Turbine Design
A tidal turbine propeller or blade is produced in a very similar process, with the operating conditions, the water flow for desired operating condition characteristics, the required size and the desired output being identified [2]. A propeller, created in AutoCAD, undergoes analysis using hydrodynamic calculations to optimise the diameter, shape, pitch, and profile to acquire the highest power coefficient for the tidal currents in which it will operate [8]. A material is selected through factors including but not limited to the integrity and strength, depending on the operating conditions, corrosion resistance and feasibility [21]. The design is then either moulded and cast, undergoing the same process as a marine propeller, or 3D printed or CNC machined [21]. It is then inspected and machined to ensure smoothness and equivalence to the concept, balanced as explained for a marine propeller and analysed to guarantee it meets specifications [21].
3. Simulation Package
The package used as a tool in this study is the software Rotorysics 2019, formerly known as Propella [22]. This software has had meticulous coding and development by Liu, even though it includes skin correction factors. This software’s ability in design and optimisation is endless, allowing analysis of hydrodynamic performance induced and controlled by ice blockage, a nozzle, cavitation, and many more.
P Liu has performed various studies in the past, confirming that the results received through Rotorysics offer agreement with real-life calculations and measurements, making them reliable [2,8,23].
In 2012, A. Mason-Jones et al. [23] released studies establishing the non-dimensional scaling of tidal stream turbines, which were suitable for specific Reynolds numbers, estimating the performance, and concluding that a change in pitch would affect the characteristics and that performance graphs can be suited to the geometries. Rotorysics offers this as an advanced function, allowing geometries to be designed and optimised with simulations that offer propeller and turbine operation performance values [22]. Furthermore, Rotorysics permits the user to obtain a visual representation of the geometry, individual blade sections and the wake of the propeller through a wire frame, 3D face-rendering or transferring it to AUTOCAD where modifications can be performed, dimensions can be measured, and the geometry can even be 3D printed [22].
4. Methodology
The efficiency of the propeller for a propulsion system is an unparalleled factor. The methodology used in this study was well-calculated and executed as planned. This optimised dual-mode propeller aims to be fitted to a testing rig on the Princess Royale, a vessel housed in Blyth, Newcastle, and owned by Newcastle University. The simulations used to obtain the results were conducted through Rotorysics, created by Liu [22].
4.1. Input Data
A propeller with the geometry of preferred propulsion characteristics was chosen from the B Wageningen, Troost Series B4-5 [19], which is stored in Rotorysics [22]. The propeller’s diameter also affects the efficiency; with low- to medium-speed vessels, as per the Princess Royale, the higher the diameter, the higher the efficiency. The diameter of the propeller plays a significant role in the efficiency. Low- to medium-speed vessels have a generic trend of increasing efficiency as the diameter increases, as the maximum allowable diameter for the testing rig is 0.4 m. This was adopted and inputted into Rotorysics.
The expanded area ratio is the blade’s geometry expanded on a flat plane instead of a spiral plane.
The EAR to be utilised was extrapolated by multiplying the chord lengths provided for the chosen propeller by 1.1, 1.2, 1.28 and 1.5. The resultant chord length of each was applied to the file and tested, finding the expanded area ratio of each multiplication to be 0.45186, 0.492942, 0.5258 and 0.616178, respectively. A graph was then produced of the multiplier on the y-axis and the EAR on the x-axis. The gradient was extracted as:
Aiming to acquire an expanded area ratio of 0.4, this value was inserted into the equation above as x, leading to the required multiplier of 0.974.
Each chord length of the given propeller was multiplied by 0.974, and the new EAR was found to be 0.400019. The last two chord lengths, 0.95 and 1.0, were slowly decreased and amended to make the propeller more curved towards the tips.
As the blade geometry used was created for 4- and 5-blade designs, the thickness had to be modified for the 3-blade tests, ensuring it would handle the load exerted onto it. This was achieved using a B-series example of a set of thicknesses for 3 blades and a set of thicknesses for 4 blades; at each radial section r/R, the thickness for 3 blades was divided by the thickness for 4 blades and the resultant figures were multiplied by the respective value at each radial section of the ‘ThickLo’ section in the input file. These were then applied to the ‘ThickLo’ section.
A characteristic that affects the propulsion of a propeller is the number of blades; generally, for a given advanced speed, a smaller number of blades provides better efficiency. On the other hand, the fewer blades, the more load is exerted on each blade, promoting vibration and cavitation. Therefore, the testing range was specified as 3, 4 and 5 blades.
Furthermore, the pitch ratio has a significant impact on the performance of a propeller. The pitch ratio directly contributes to the effective angle of attack, which plays a key role in determining the lift coefficient. For propulsion, the higher the pitch, the higher the effective angle of attack, thus the better efficiency and lift. However, when the propeller is a turbine, the larger the pitch, the smaller the effective angle of attack and the less the amount of energy generation, even though it might produce a higher power generation efficiency.
The pitch ratio, PD, range that would be tested would be 0.3 to 0.6. This would be inputted into each file, respectively, using a constant pitch at each radial section, meaning the pitch at 0.7 R and the root chord would also be either 0.3, 0.4, 0.5 or 0.6, depending on the test being run. A pitch ratio of under 0.3 was not used as although the effective angle of attack for turbine mode would be more significant, the closer the pitch ratio is to 0, the more likely the generated power will be 0 or negative due to the projection of lift creating toque in the direction of the torque vector being 0 or negative.
At advanced speeds, , the tests used for each were defined using a ship speed, Va, of 8 knots, a maximum allowable requirement. This is converted to metres per second for the equations; 8 knots is 4.1156 m/s. The revolutions per second range of RPMs is divided by 60, and the diameter is the chosen diameter of 0.4 m, also a maximum limit allowable.
As shown in Table 1, the input data were arranged into tables that would be populated after each test and used for analysis. This is not the whole table; it is just a section for illustration.

Table 1.
Representation of the table section used for propulsion.
The advance coefficient, J, cannot be used in turbine analysis and thus must be converted to the tip speed ratio, TSR, for tests using the formula:
4.2. Process
The expanded area ratio that was to be tested was 0.400019. This was obtained through changes to the chord lengths. The two options for the EAR initially proposed were 0.3 and 0.400019, as Liu [8] had carried out a study on the optimum EAR on a 5 m diameter propeller, finding it to be 0.4, which presented the ideal aspirations to be used to compare to Liu’s results [8].
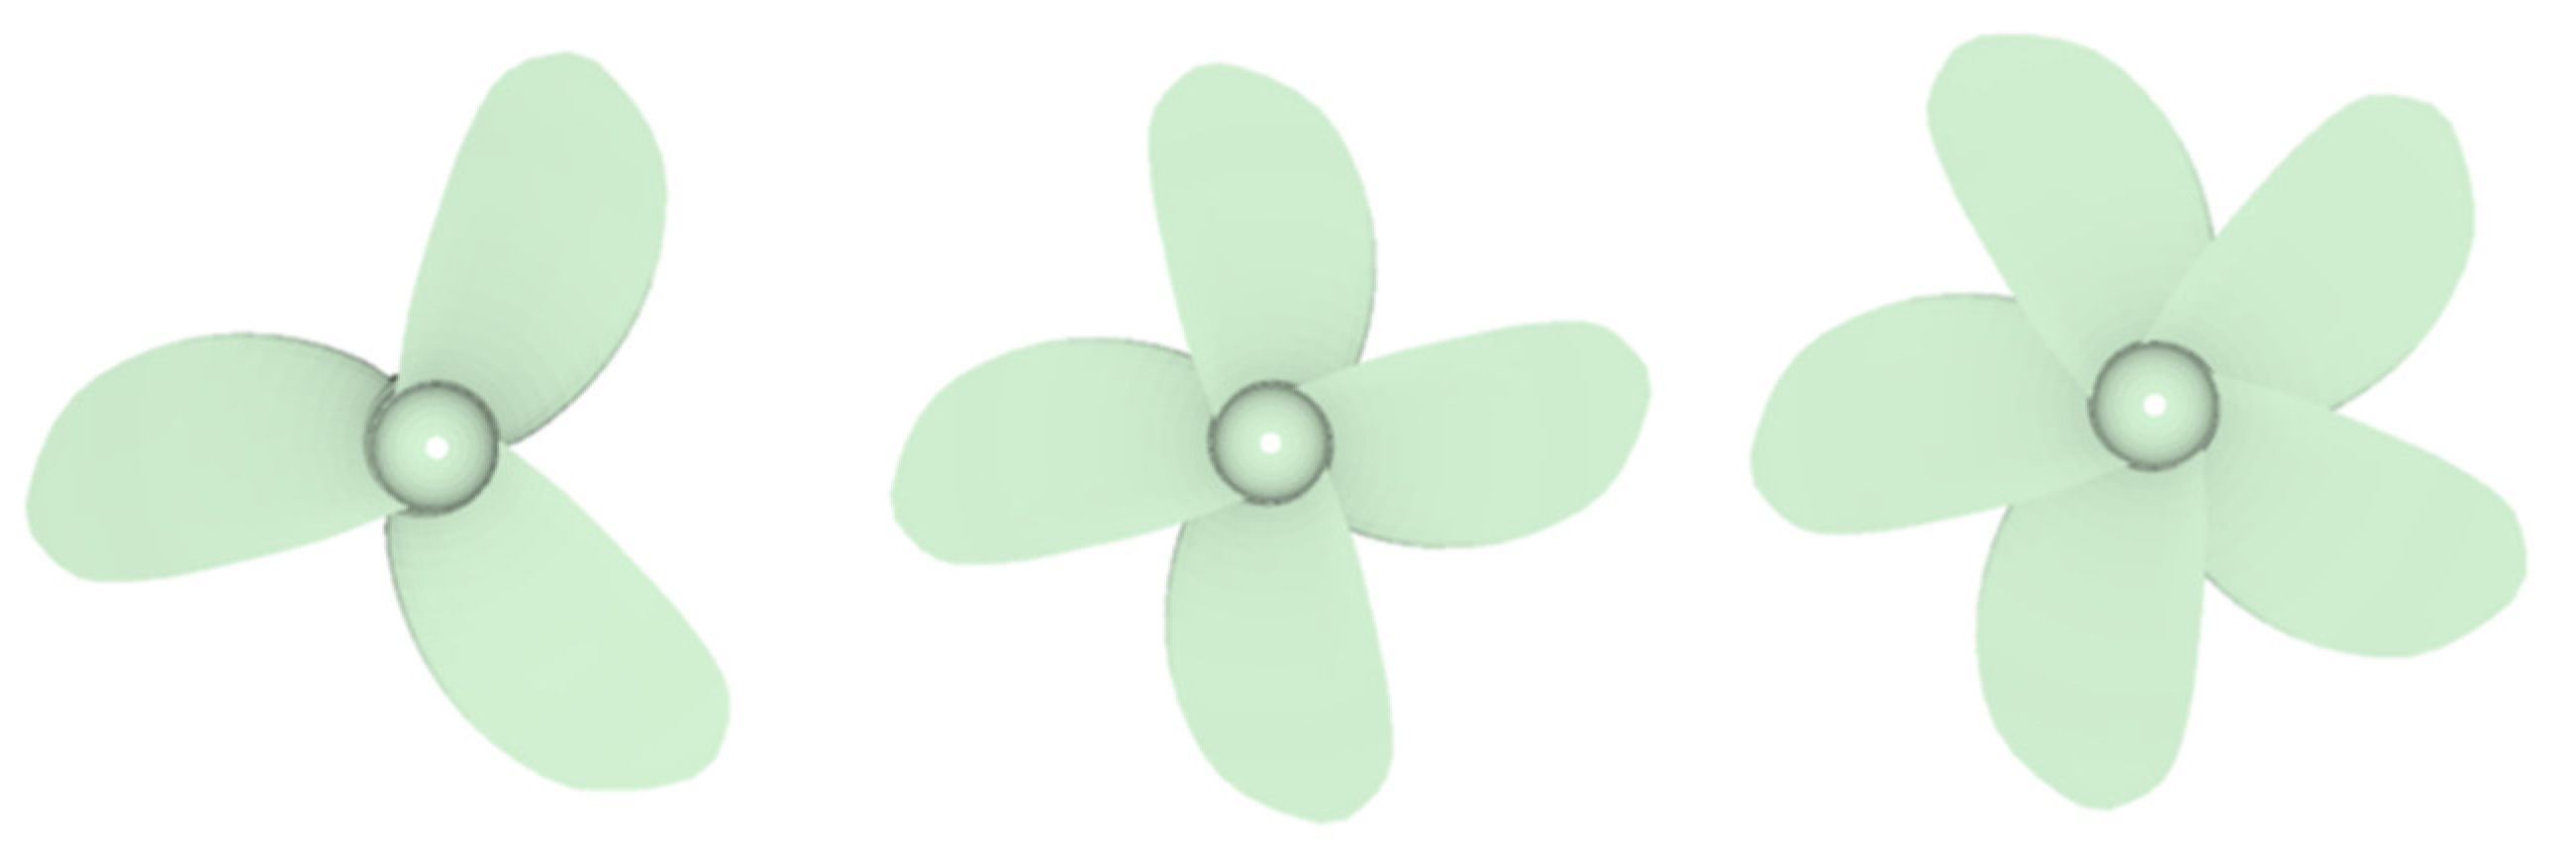
The geometries used for an EAR of 0.400019 for the 3-blade, 4-blade and 5-blade geometries are shown in Figure 1.
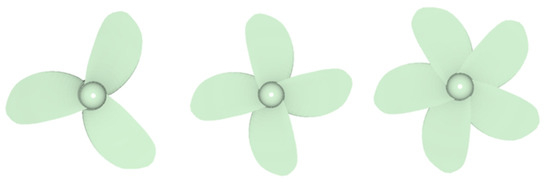
Figure 1.
The 3-blade, 4-blade, and 5-blade geometries with EAR = 0.400019.
First, the tests for the EAR of 0.400019 were set up. These propellers’ geometry is similar to conventional propellers explicitly used for propulsion, with rounded blades and a curved tip, maximising the lift and propulsive efficiency.
For each pitch ratio, eight tests were run, one in propulsive mode and one in turbine mode.
Each pitch ratio for each test consisted of 2 sets of tests. The turbine mode tested 9 different tip speed ratios at each pitch ratio, and the propulsion mode tested 19 different advance speeds at each.
The files with different numbers of blades inputted into the input, for example, Z = 3, before changing the geometry to the desired one with the pitch appropriate for that set of tests were produced with different advance speeds for propulsion and different tip speed ratios for turbine mode.
Each blade number had 8 different sets of tests, 4 pitch ratios of 0.3–0.6 in propulsion mode and 4 of 0.3–0.6.
A separate geometry was also trialled through adjustments to the chord lengths of the radial section.
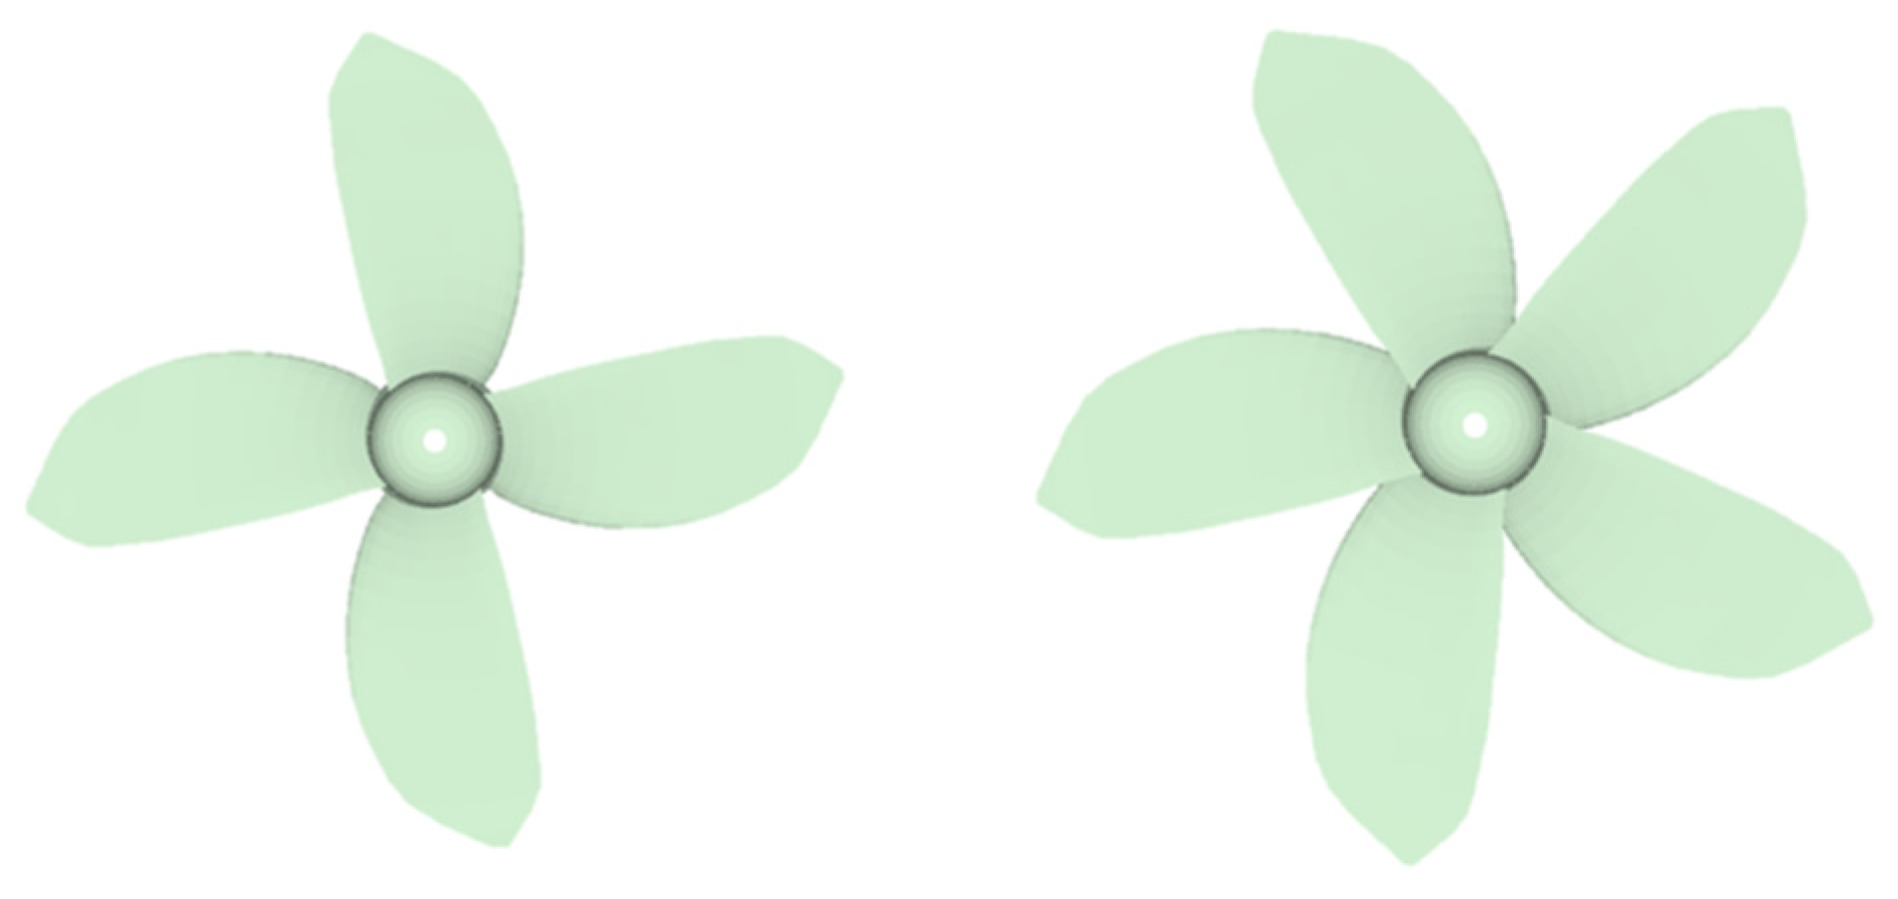
Figure 2 shows this geometry for the 4-blade and 5-blade tests. A few trials were run for 3, and it was found that the optimum mid-point would not be in the 3-blade range. This geometry has an EAR of 0.387149.
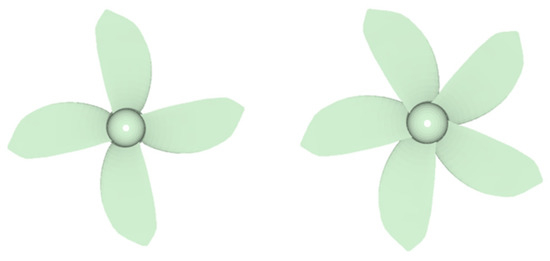
Figure 2.
The 4-blade and 5-blade geometries with EAR = 0.382179.
Compared to a traditional curved tip, the propeller’s more pointed tip was inspired by a wind and tidal turbine blade. This increased the power coefficient for the geometries with good propulsive efficiencies. The exact process of running tests at each pitch for each blade number at different J/TSR values in propulsion and turbine mode was repeated for this geometry.
This set of data was collected to analyse its effects on performance.
4.3. Output Data
Rotorysics [22] computed the code and applied surface panel methods to acquire the hydrodynamic and turbine performance results.
Each test yielded four files: a ‘PROPELLA’ file containing the results of the assessment of the hydrodynamic performance or turbine performance, an ‘STP’ file containing the propeller/turbine geometry, and a ‘PAT’ file containing a visualisation of the propeller and its wake [22]. All these files were compatible with AUTOCAD and PPP, Rotorysic’s visualisation software.
The ‘PROPELLA’ file was an output file that contained the information and details at each time step.
The propulsion mode tests received results from the thrust coefficient KT, the torque coefficient KQ, and the propulsive efficiency. The formulas for the thrust coefficient and torque coefficient can be seen below:
The turbine mode tests utilised the drag downstream, CT, and the power coefficient, Cpow. The original drag downstream and power coefficient are presented below:
Liu [2] derived this in his studies on designing and optimising a dual-mode propeller [8] for studies and incorporated it into the Rotorysics coding [18].
This can be seen below:
Drag coefficient:
Power coefficient:
The results were transferred to a processing package, Excel, where tables were created, and the results were analysed and plotted onto appropriate graphs. These graphs allowed the comparison of the results, the identification of trends, and the extraction of the optimum values and their respective geometries.
5. Varying Factors
The results investigated the effect of various factors on the performance, considering the propulsive efficiency and power coefficient.
5.1. The Number of Blades
The number of blades is critical to a propeller’s or turbine’s geometry, affecting many performance aspects.
Typically, for the blade number, a negative correlation can be deducted with propulsion. An increase in the blade number causes the maximum propulsive efficiency to decrease. This trend shows agreement with the available theories by further investigating the results of the maximum propulsive efficiencies for each blade number and pitch ratio for an EAR of 0.400019. The maximum efficiency for propulsion from the test samples is found at a J value in the three-blade propeller at a pitch ratio of 0.6. The maximum propulsive efficiency for each blade number gradually decreases as the number of blades increases. A three-blade propeller usually produces the least amount of drag and provides a smooth operation for low- to medium-speed vessels. Thus, this fits that analogy. Although the thrust generated can be higher with more blades, the balance of thrust and resistance is optimal at three blades, providing higher efficiency.
In general, the propeller/turbine’s primary purpose should be considered; for example, if it is mainly being used as a propulsion system, the propulsive efficiency should be prioritised by implementing a blade number of three. However, as the Princess Royale has a primary propulsion system, which would aid operations, or when higher speed is required, a concession on the propulsive efficiency should be accepted for a higher power generation ability.
The blade number must be balanced in a dual-mode propeller, accepting a compromise of power generation and propulsive efficiency to operate on a single propeller rotor.
The optimum blade, depending on the ship type and speed, should be acutely evaluated as it significantly influences efficiency.
5.2. Pitch Ratio
The pitch ratio significantly impacts the hydrodynamic and turbine performance oppositely.
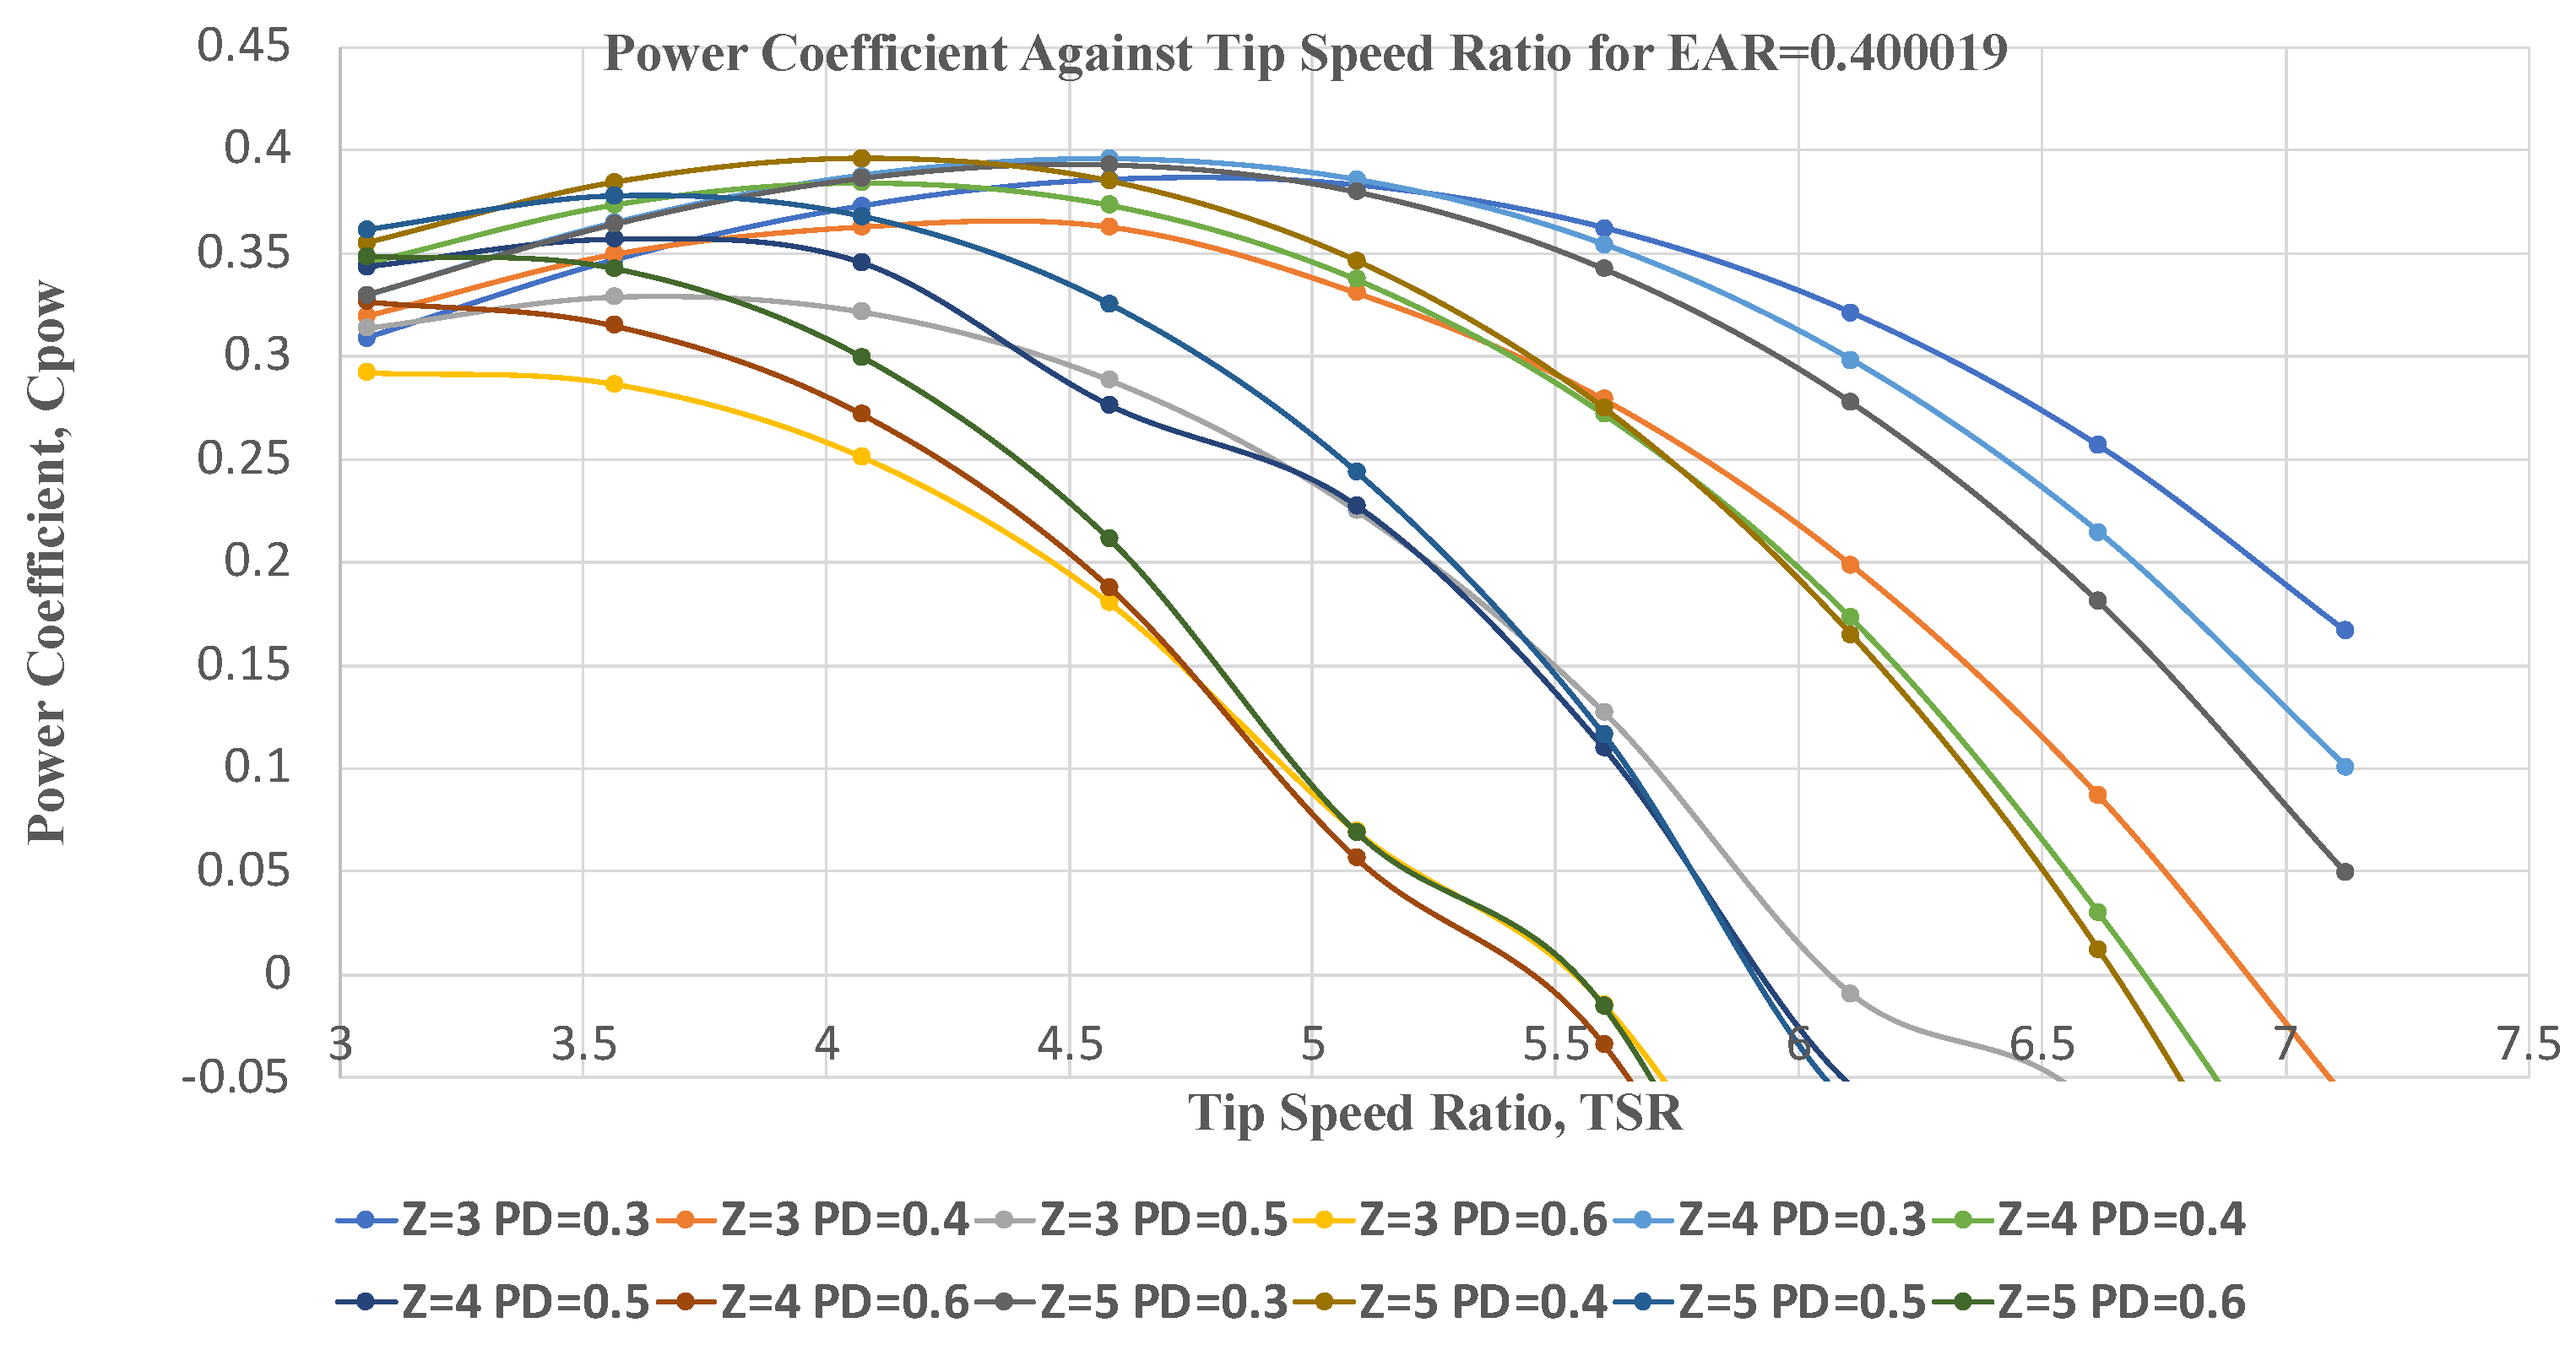
When pitch ratio is decreased, the power coefficient increases for the turbine mode. Figure 3 shows each pitch ratio of each blade and the respective power coefficient. The correlation between the pitch ratio and the efficiency of a turbine is clear: the lower the pitch ratio, the higher the efficiency. The reason for this can be inferred from the velocity and energy density of the tidal currents being shallow, meaning a smaller pitch will provide a larger effective angle of attack, increasing the capability of harnessing the kinetic energy from the current. a larger pitch ratio also means more energy is required to begin the spinning of the turbine spinning and maintain constant spinning, which is not always available and could lead to stalling.
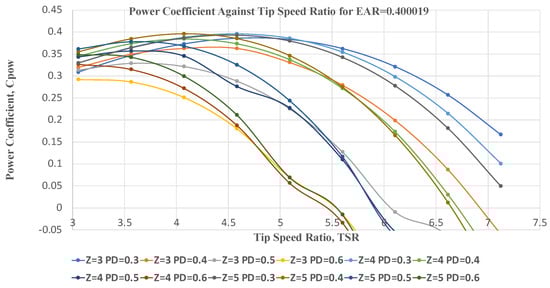
Figure 3.
Power coefficients against their tip speed ratio for the respective blade number and pitch ratio for EAR = 0.400019.
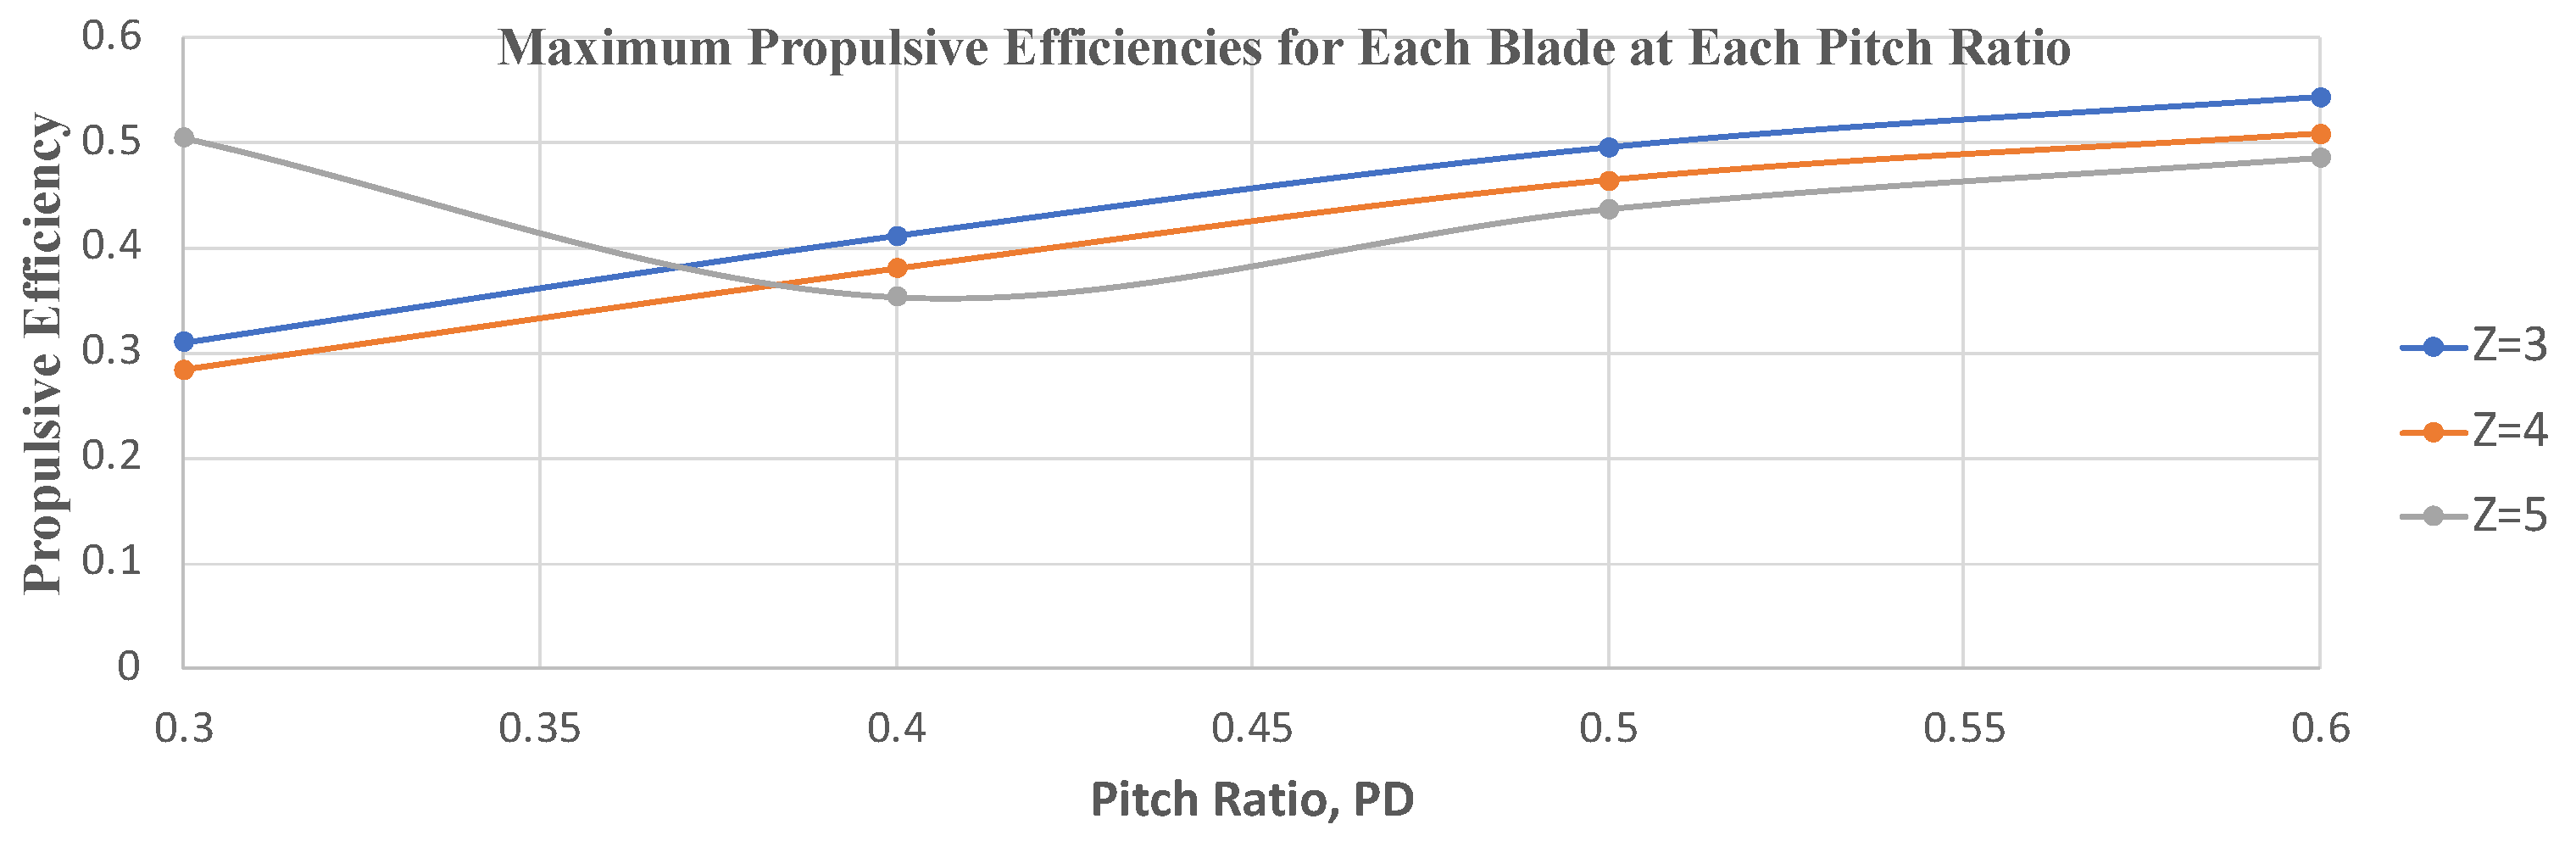
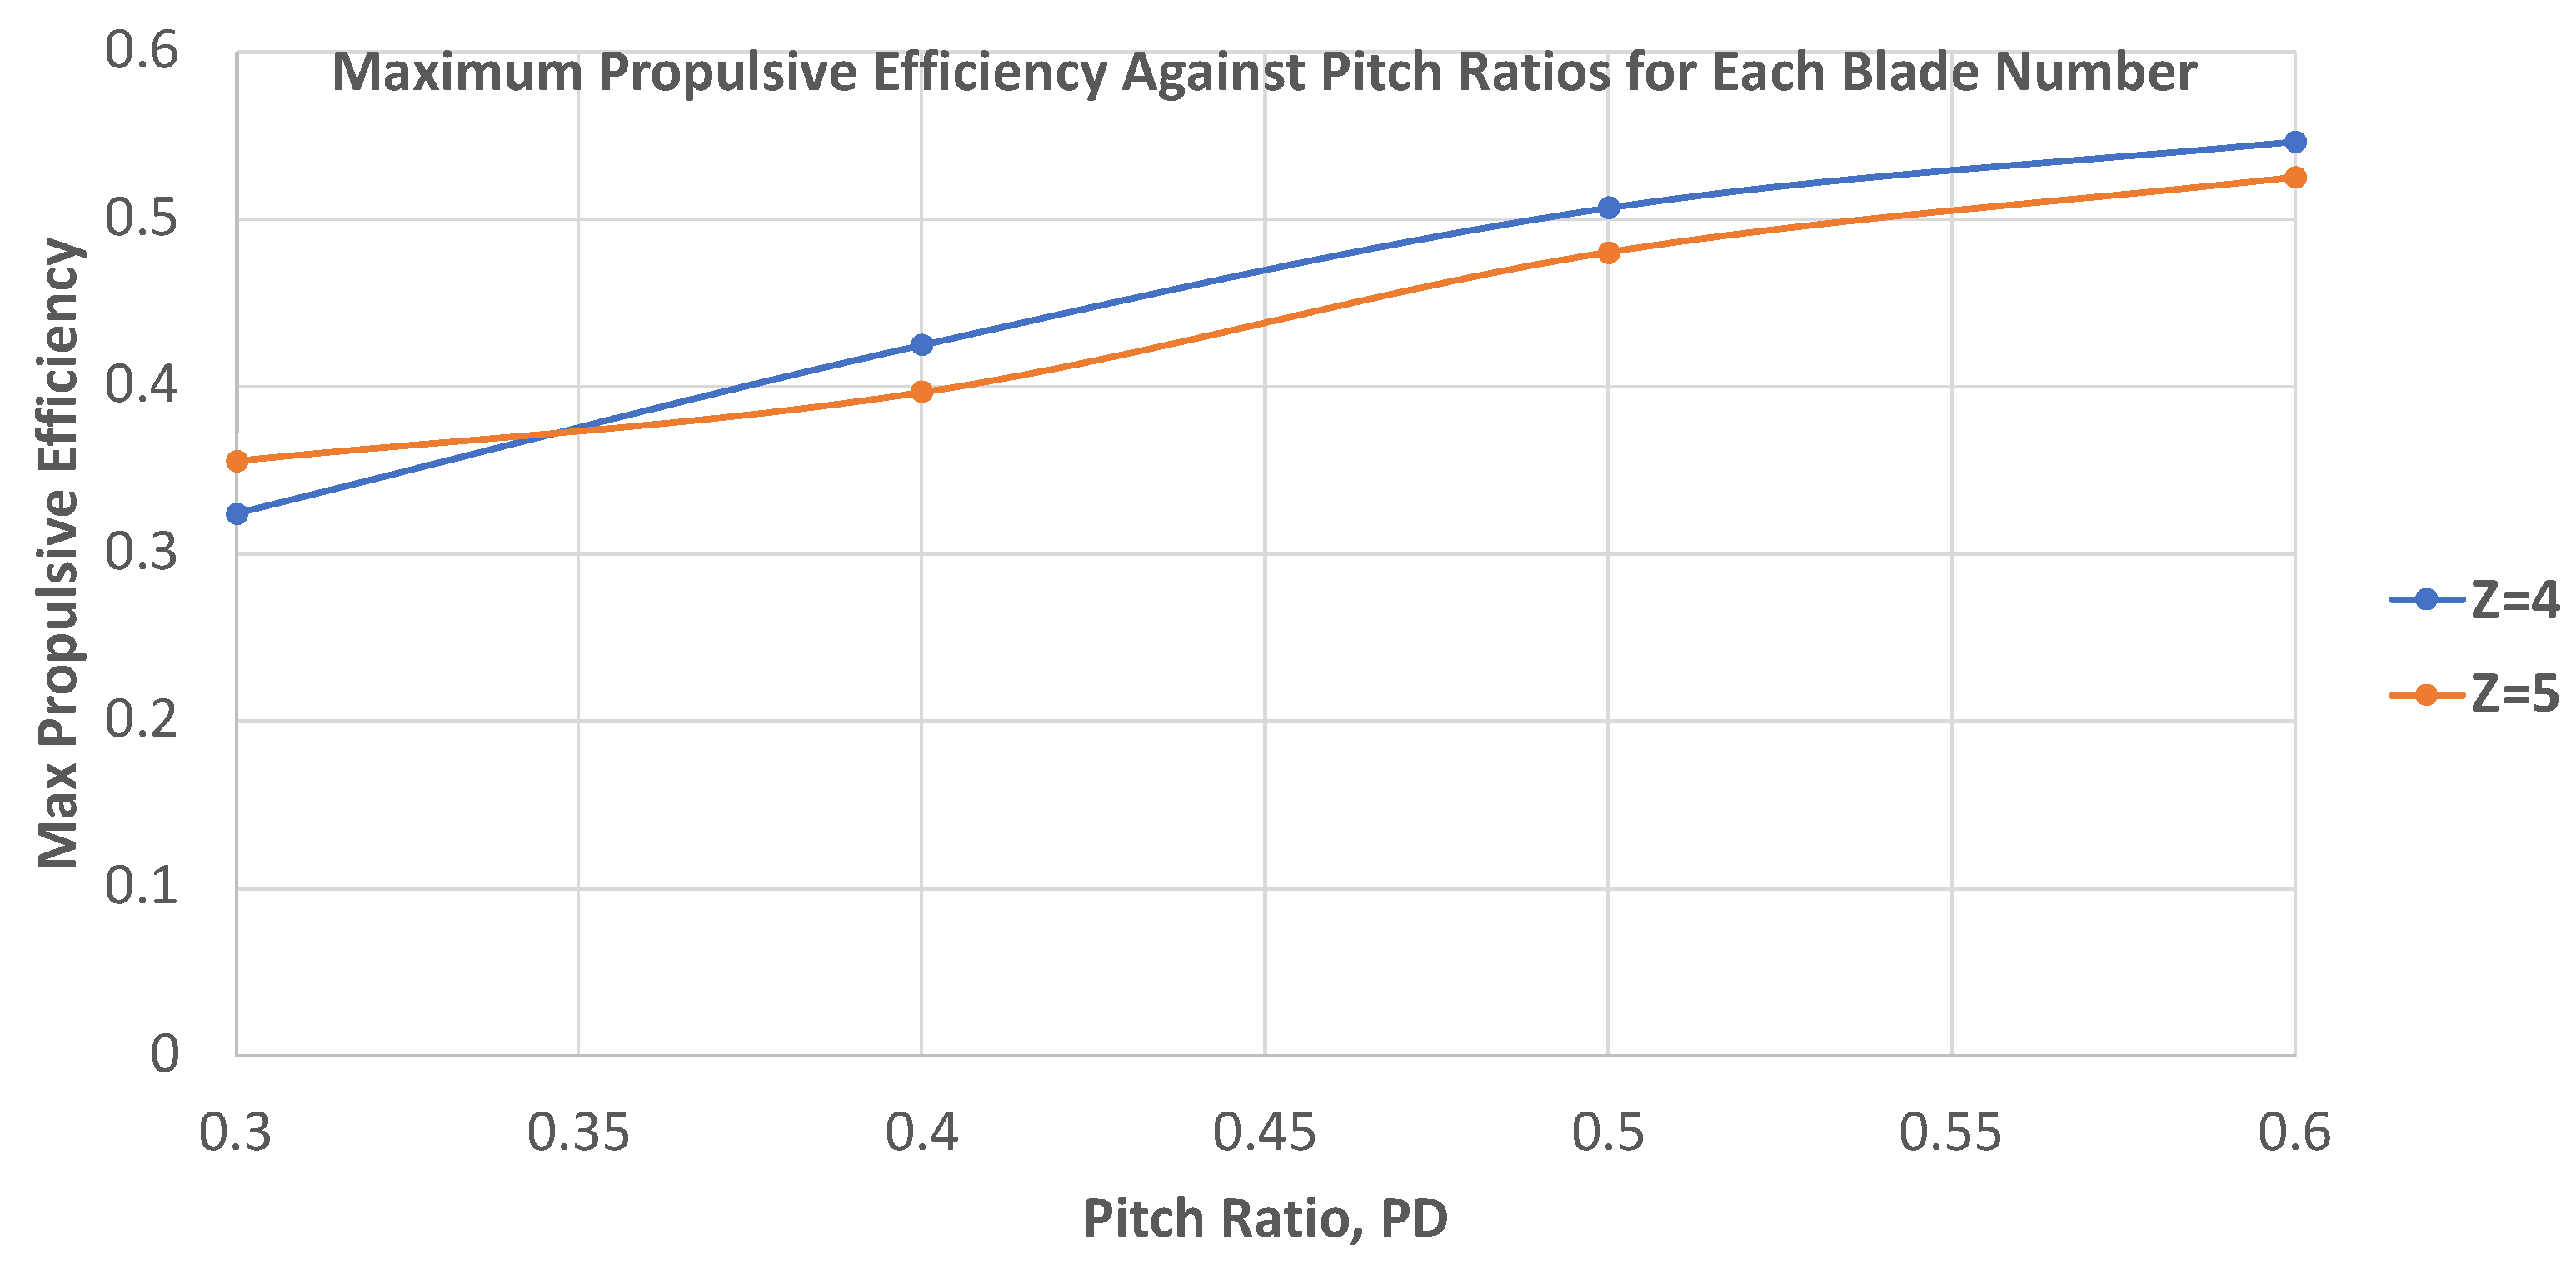
As you increase the pitch ratio, the propulsive efficiency also increases. Figure 4 is a graphical representation of the effects of the pitch ratio on the propulsive efficiency. Furthermore, the lowest values of propulsive efficiencies can be seen in the 0.3 pitch ratio geometries, whilst the highest values of propulsive efficiency can be seen in the 0.6 pitch ratio geometries. The effective angle of attack relative to the flow of the water is the foremost concern regarding the pitch ratio [24]. The purpose of a propulsive propeller is to convert the rotational energy into thrust. The smaller the pitch ratio, the smaller the angle of attack in terms of propulsion; thus, less water is driven backwards through each acceleration revolution, producing less thrust [2,8].
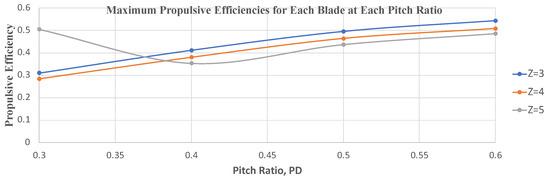
Figure 4.
Maximum propulsive efficiencies at each pitch ratio for the respective blade number for EAR = 0.400019.
A larger pitch ratio will provide a larger angle of attack, driving a larger volume of water back and generating more thrust. This means that when comparing large and low pitch ratios, less rotational speed is required for large pitch ratios, making it more efficient. This has been seen in Liu’s studies before, where the range of pitches tested was up to 0.99, finding the most optimum pitch ratio for propulsion to be 0.99. Thus, the available literature is in agreement with this.
Usually, pitch ratios are evaluated depending on the propeller/turbine’s use for a single purpose. As this is designed for a dual-mode propeller, a mid-point pitch ratio must be found that has ideal efficiencies in terms of both. Although it might not be optimal compared to a single-purpose propeller/turbine, it is an optimal dual-mode propeller.
These deductions are the principles explaining why optimising a blade for either propulsion or power generation compromises the efficiency of the other, making it complicated.
5.3. Advance Speed
The advance speed is another variable in this study. It is based on the ship’s speed, revolutions per second, and propeller diameter. Turbines use tip speed ratios rather than advance speeds, which can be altered with a simple conversion. Unsurprisingly, the advance speed and tip speed ratio also operate conflictingly.
Operating at optimal advance speed allows efficient translation of power to thrust, decreasing the fuel consumption. The advance speed defines the velocity between the water and the blades and thus accounts for how much thrust is generated from previous studies and the Kt, thrust coefficient, and Kq, torque coefficient, graphs from B Wageningen, a pattern of the thrust and torque coefficient increasing as the advance speed decreases. The efficiency also increases to a point and then decreases. This is also apparent in the results of this study.
Turbines operate using tip speed ratios rather than advance speeds. The trend can be derived from past data and data collected through this study as the power coefficient increases to the optimum and decreases past the optimum.
6. Results and Discussion
There are four optimal results, two for each geometry: the generation capability optimum efficiency and the propulsive efficiency optimum. Although these cannot be used directly, as they are ideal for each purpose, and the compromise will also be stated.
6.1. Geometry of Expanded Area Ratio 0.400019
Simulations were conducted to optimise the pitch ratio and blade number for the power coefficient and propulsive efficiency. Using an interval of 0.1, the optimal pitch ratio range for power generation was 0.3 to 0.4. This was found within both solidity EARs, 0.400019 and 0.387149.
6.1.1. Power Generation
It should be noted that the power coefficient may be negative in some cases because the turbine consumes power rather than generating it. Various reasons, including inefficient turbine geometry, operational conditions such as low flow or reverse flow, calibration issues, and measurement errors, can cause this.
Figure 3 shows the power coefficient performance characteristics for various tip speed ratios for the geometry with an EAR of 0.400019. The curves for lower pitches and blade numbers are more uniform. However, the trend accurately represents how the power coefficient increases and decreases, as seen in Liu’s studies [8].
Table 2 lists the power generation performance for the 5-blade propeller-turbine with a pitch ratio of 4.0.
Table 2.
Turbine mode power generation performance for the 5-blade propeller-turbine.
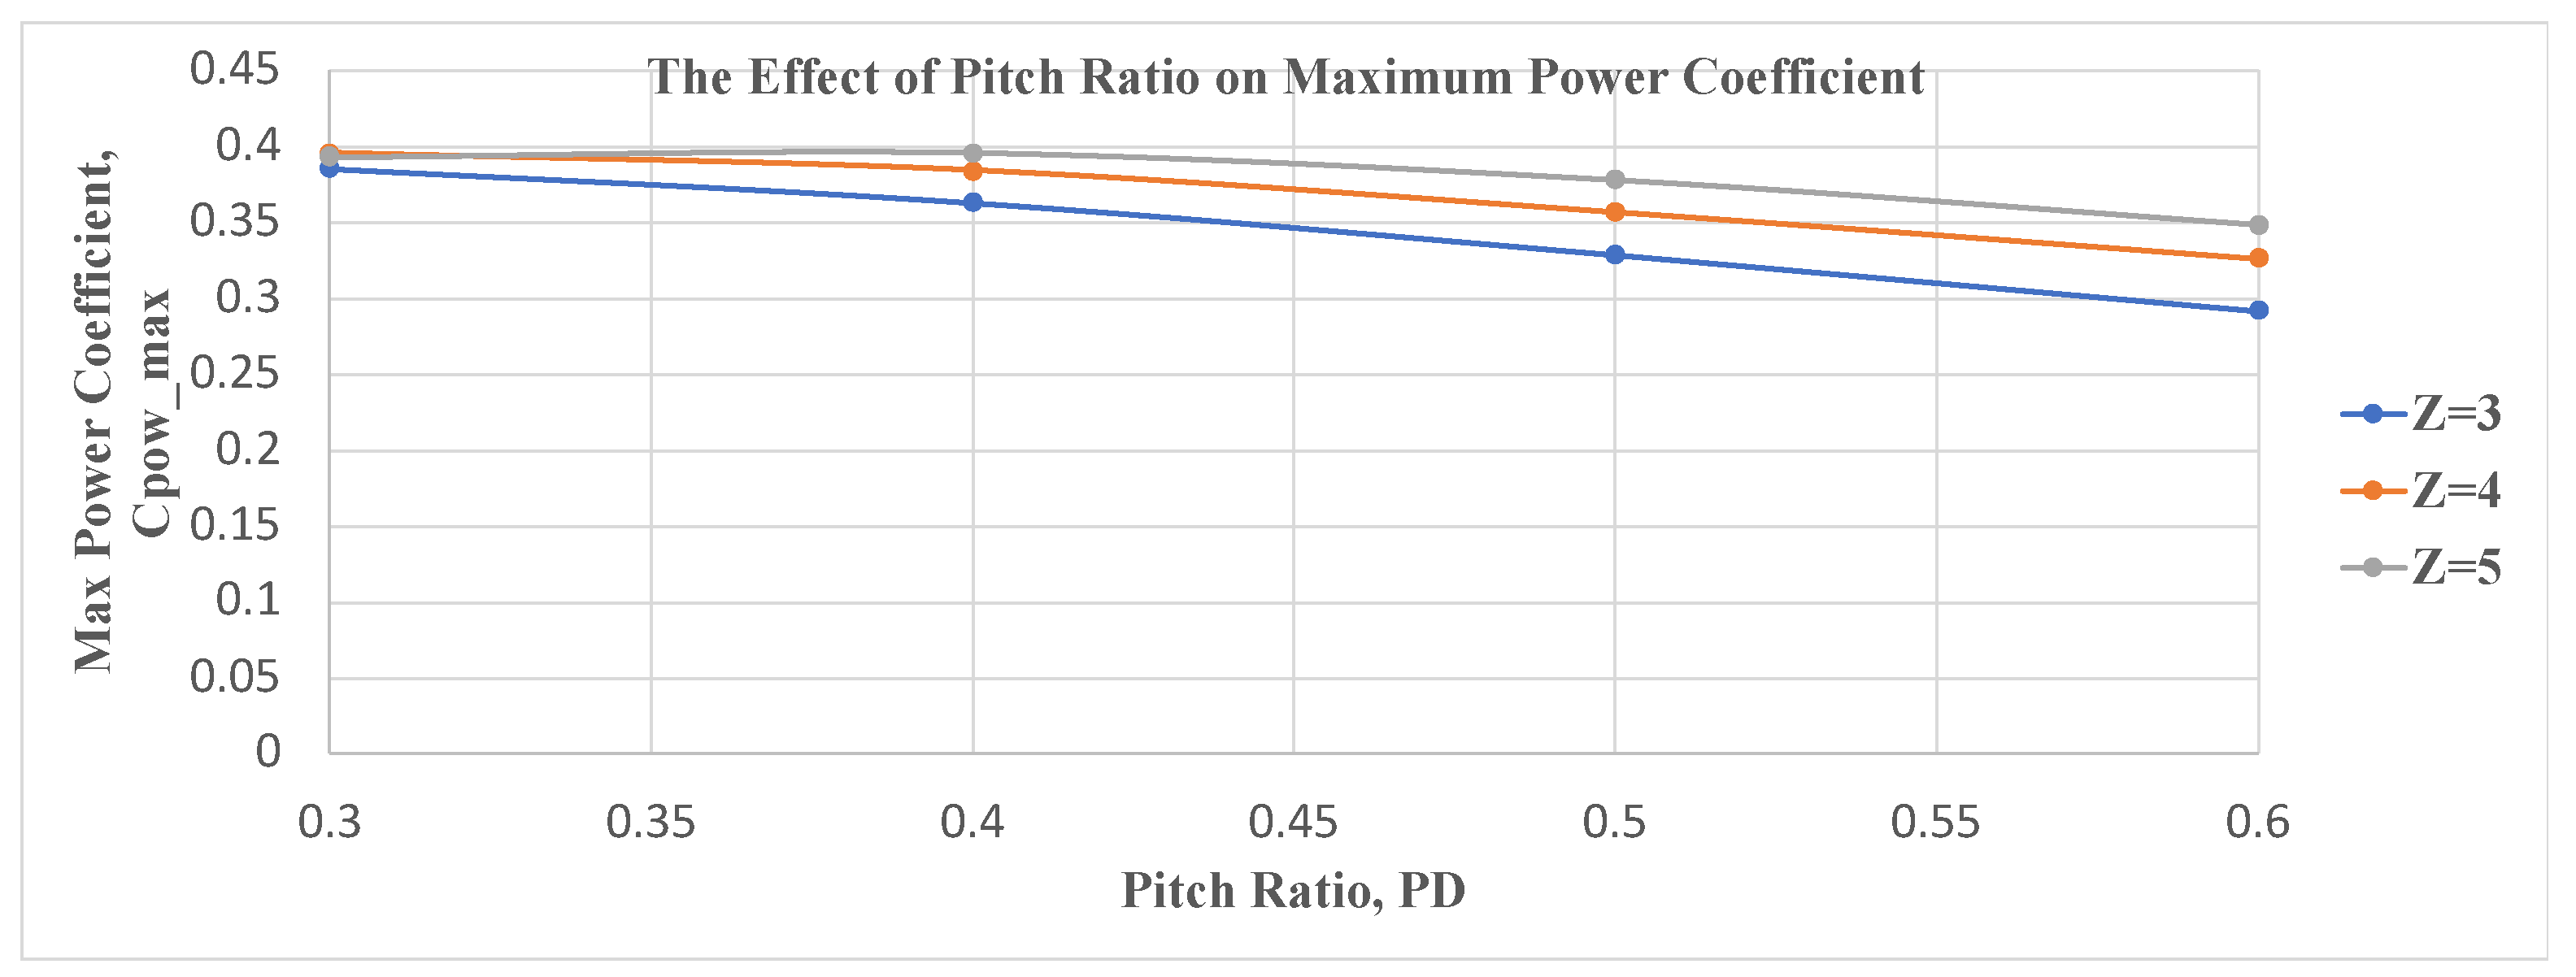
As shown in Figure 3, the maximum power coefficient occurs in the five-blade geometry; this is expected as the surface area increases with the number of blades, increasing the harnessing power and balancing the distribution of the loads over extra blades compared to a three-blade geometry. This representation also offers an insight into how the pitch ratio affects the power coefficient, with the highest values for the power coefficient of each blade number being found at lower pitch ratios, 0.3 and 0.4. This is seen in more detail in Figure 5.
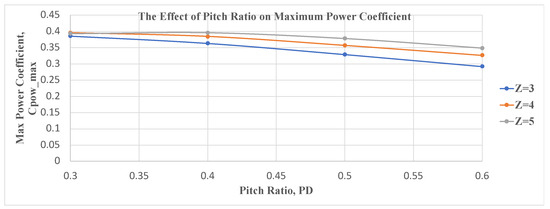
Figure 5.
Max power coefficient for each blade number at the respective pitch ratio.
Figure 4 shows the optimal pitch ratio, with the power coefficients for each pitch ratio against their respective blade number and tip speed ratio. The five-blade, 0.4 pitch ratio geometry offers the optimal characteristics for power generation. Note how the power coefficient decreases with the blade number and pitch ratio for Z = 4 and Z = 3.
Surprisingly, the worst geometry for the power coefficient is also found in the five-blade geometry, with a pitch ratio of 0.6; the power coefficient is −0.91844. The pitch ratio fits the theories, as a higher pitch ratio leads to a lower pitch coefficient. Still, the blade number is odd, as a higher blade number is usually a better power coefficient. Thus, this geometry is not expected to be the worst; more testing would need to occur at a lower tip speed ratio.
6.1.2. Propulsive Abilities
The propulsion simulations were executed similarly, although instead of using the turbine mode, which is quadrant two in Rotorysics, the propulsion mode was utilised, quadrant one. The same pitch ratio interval was used, 0.1. However, the advance speeds ranged from 0.440953 to 0.128611 through 200 RPM intervals. Diving into the propulsion characteristics of the propeller with an expanded area ratio of 0.400019, from Figure 6, ignoring the Z = 5, PD = 0.3, which seems like an outlier, it is clear that the pitch ratio increase causes the propulsive efficiency to increase. This is due to a larger effective angle of attack, as was mentioned previously. Furthermore, the propulsive efficiency decreases as the blade number increases, as stated. Thus, the experimental results agree with what would be expected. Moreover, there is usually an increase with increasing advance speed and then a decrease; this is seen in some result samples but not all. This would indicate that a more extensive range of advanced speeds should be tested to ensure the highest efficiency has been found.
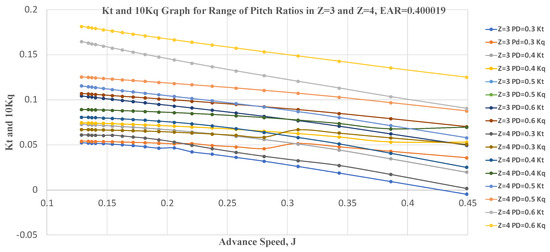
Figure 6.
Thrust and torque coefficient at each advance speed for the respective pitch ratio and blade number for EAR = 0.400019.
Table 3 lists the propulsive performance characteristics of the 3 bladed propeller-turbine in propulsion mode.
Table 3.
Propulsive performance of the 3-blade propeller-turbine in propulsion mode.
The figure above presents the thrust and torque coefficient for the Z = 3 and Z = 4 geometries at each pitch ratio. The thrust and torque increase as the advance speed decreases, which is due to the increased RPM. However, the efficiency decreases because the drag and resistance increase, so a lower RPM is preferred in slow- to medium-speed ships.
Exploring the extremities of the propulsion test, it is expected that the highest blade number tested would contain the lowest propulsive efficiency. This is confirmed in a figure, which includes a graphical representation of the maximum and minimum efficiencies for each pitch ratio for each blade number. The lowest efficiency can be found in the five-blade geometry with a pitch ratio of 0.4, having a propulsive efficiency of 0.1731502 or 17.32% at 0.128611 advance speed. Contrary to this, the highest efficiency is also apparent, with the three-blade geometry with a pitch ratio of 0.6 having a propulsive efficiency of 0.543322 or 54.33% at an advance speed, J, of 0.449053. This is a good efficiency but could be improved with adjustments to the geometry and further optimisation. However, within the sample, the results fit well with the real-life measurements and theories from past studies, with the highest pitch and lowest blade number obtaining the highest propulsive efficiency.
Furthermore, it would make sense for the highest efficiency to be at the lowest RPM tested, 1400, and the lowest efficiency to be at the highest RPM tested, 4800. This is typically the case; the efficiency decreases as the RPM increases.
6.2. Geometry of Expanded Area Ratio 0.387149
The unconventional experimental geometry with an EAR of 0.387149 also underwent evaluation. This propeller was designed by altering the chord lengths at different radial sections to acquire blades with less width and that are less rounded at the tip.
6.2.1. Power Generation
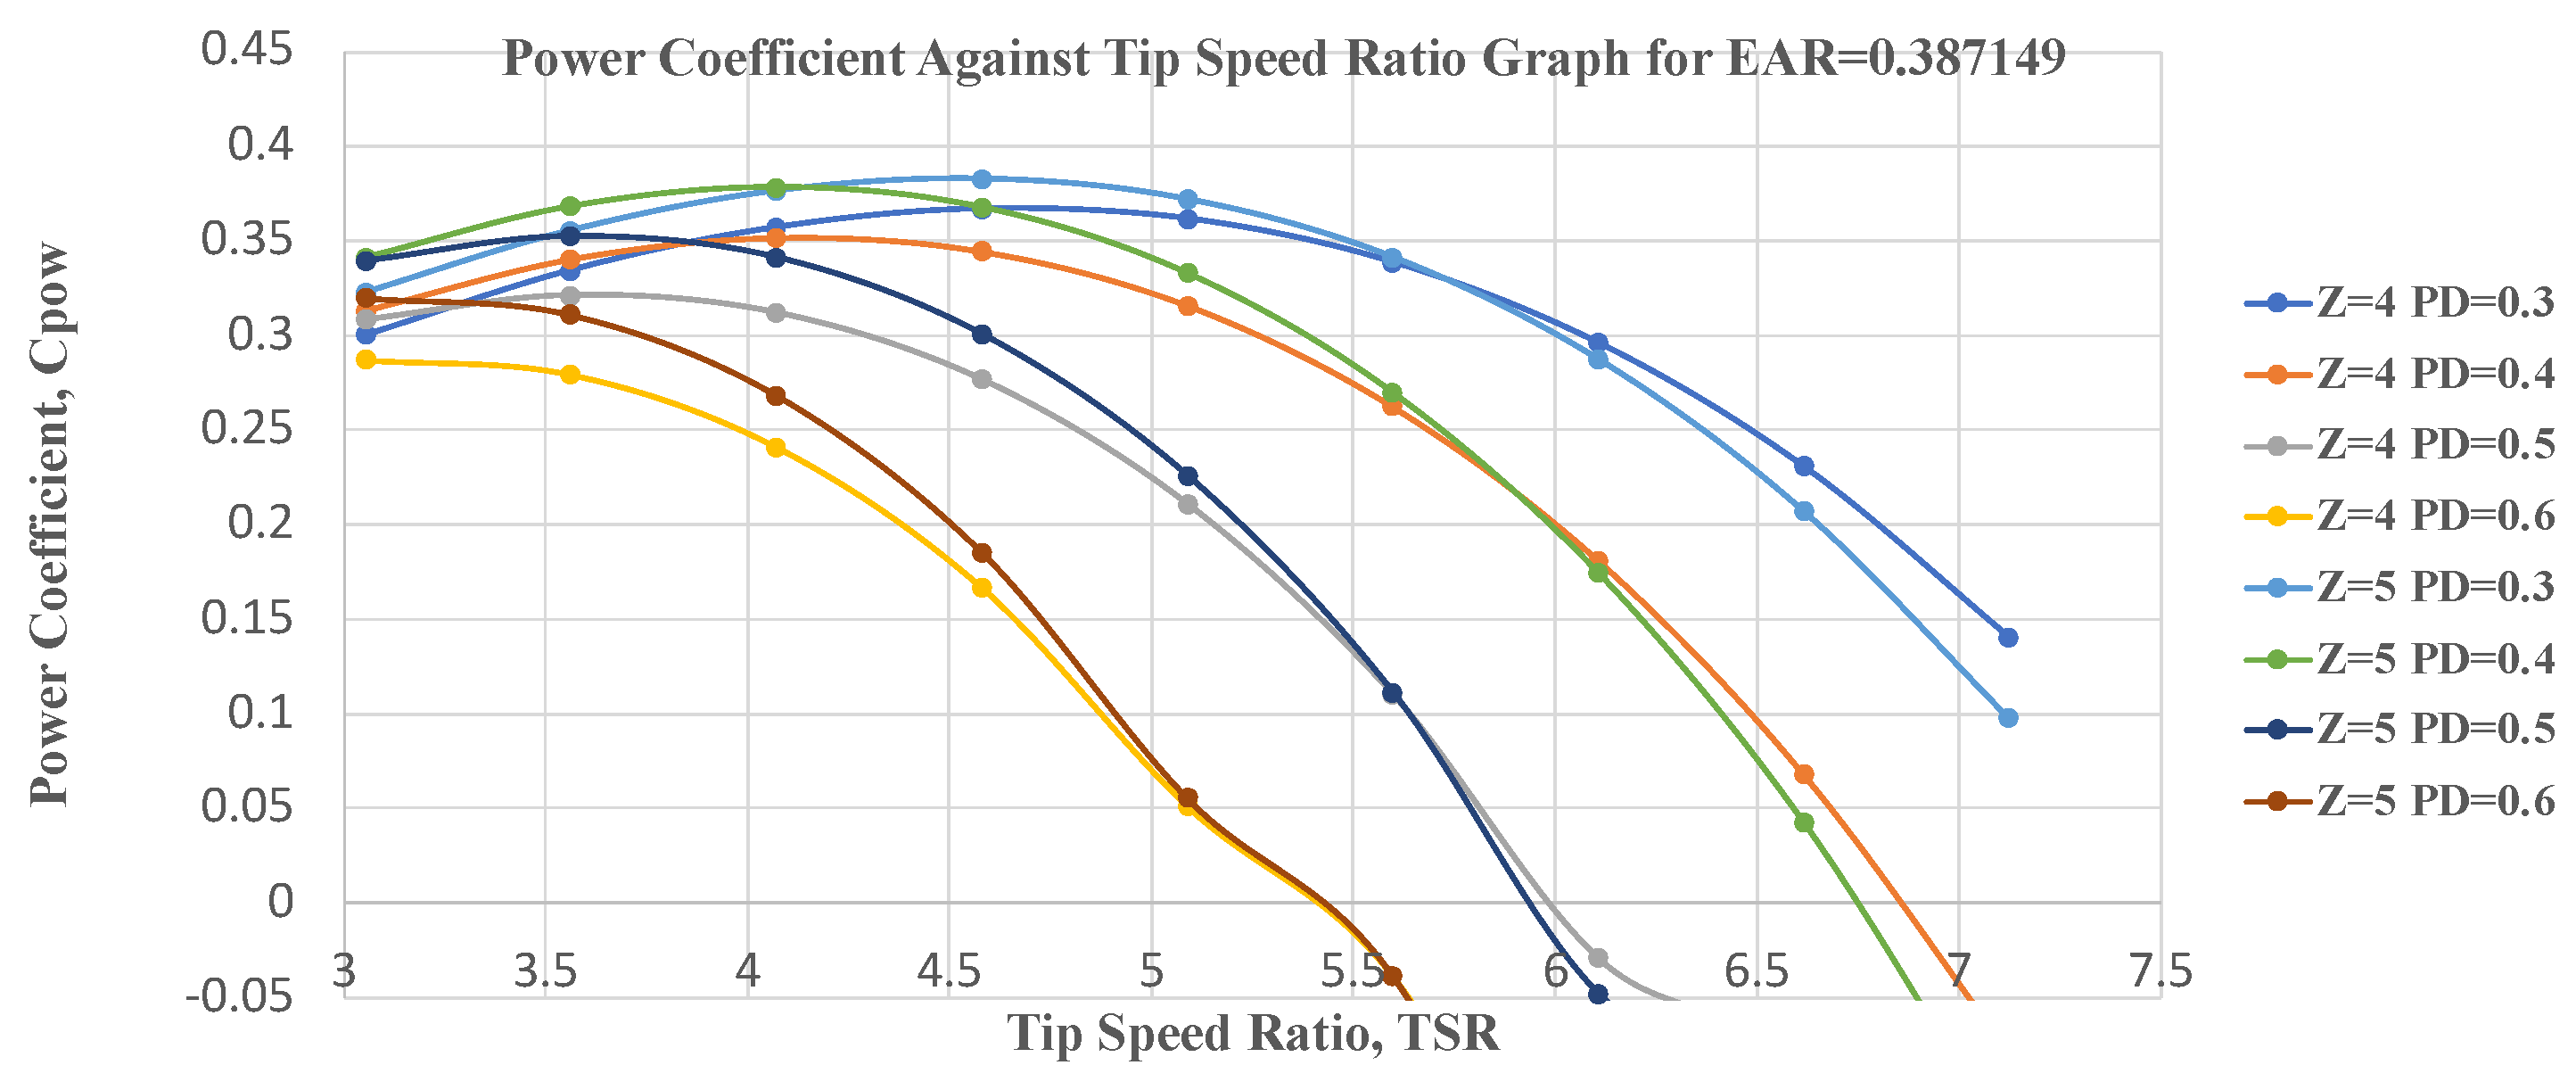
The power coefficients for each pitch ratio follow the same pattern as the graph from 0.400019 and Liu’s study [8]. The curve starts at a point that reaches a maximum and then decreases. Moreover, Figure 7 shows this trend, with all the pitch ratios for the blade numbers tested included.
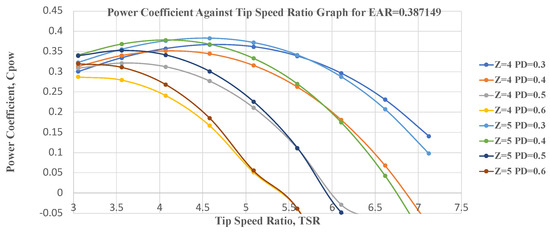
Figure 7.
Power coefficient against tip speed ratio for each pitch ratio and blade number for EAR = 0.387142.
Table 4 shows the power generation characteristics of the 5-blade propeller-turbine.
Table 4.
Power generation characteristics of the 5-blade propeller-turbine.
The optimum power coefficient in this range of tests is 0.382908, as found for a five-blade 0.3 pitch ratio propeller; this fits the theory as it is the lowest pitch ratio tested and the highest blade number tested.
6.2.2. Propulsive Abilities
When investigating the propulsive abilities of this geometry, the results proved to have a slightly higher propulsive efficiency than the EAR of 0.400019 geometry. The ideal geometry for the propeller for a stand-alone propulsion system within this study consists of a four-blade 0.6 pitch ratio propeller achieving a propulsive efficiency of 0.5465028 or 54.65% at an advance coefficient of 0.449053 at 1400 RPM with an 8 knots ship speed, the max limit. This showed a 0.032% increase in the optimal value of the 0.400019 EAR geometry. A graph stating the maximum propulsive efficiency of each pitch ratio for each blade number can be seen in Figure 8. When comparing this to the maximum propulsive efficiency graph in Figure 5, it is evident that the maximum efficiencies start higher and end higher for the EAR of 0.387142.
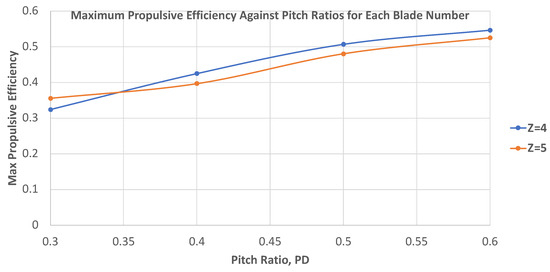
Figure 8.
Maximum propulsive efficiencies at each pitch ratio and the respective blade number for EAR = 0.387142.
Although the propulsive abilities seem positive, they would have to undergo cavitation and other strenuous tests to ensure low vibration, structural integrity, noise, and an ideal load balance. However, from these results, it can be assumed that this geometry is slightly better for propulsion, also providing a higher thrust coefficient of 0.0828683 compared to the previous geometry tested, 0.07161. The thrust and torque coefficients can be seen in Figure 9, which mostly match the trend of most thrust and torque graphs.
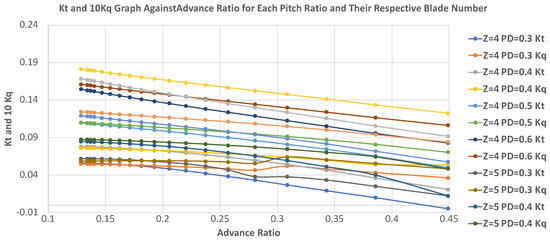
Figure 9.
Thrust and torque coefficient at each advance speed for the respective pitch ratio and blade number for EAR = 0.387142.
| Blade Number | Pitch Ratio | Advance Speed | KT | KQ | 10KQ | Propulsive Efficiency |
| 4 | 0.6 | 0.449053 | 0.0828683 | 0.01064159 | 0.1064159 | 0.54650528 |
| 0.385834 | 0.09569 | 0.01166095 | 0.1166095 | 0.50391043 | ||
| 0.342963 | 0.10520375 | 0.01240584 | 0.1240584 | 0.46288436 | ||
| 0.308667 | 0.11265709 | 0.01298079 | 0.1298079 | 0.42635141 | ||
| 0.280606 | 0.11876574 | 0.01344754 | 0.1344754 | 0.394426 | ||
| 0.257223 | 0.12388993 | 0.01383528 | 0.1383528 | 0.36658783 | ||
| 0.237436 | 0.12829973 | 0.01416717 | 0.1416717 | 0.34222312 | ||
| 0.220476 | 0.13214357 | 0.0144546 | 0.144546 | 0.32079054 | ||
| 0.205778 | 0.1355278 | 0.01470632 | 0.1470632 | 0.30181684 | ||
| 0.192917 | 0.13854512 | 0.01493014 | 0.1493014 | 0.28491681 | ||
| 0.181569 | 0.14125843 | 0.01513087 | 0.1513087 | 0.26978158 | ||
| 0.171482 | 0.14371226 | 0.01531165 | 0.1531165 | 0.25615945 | ||
| 0.162456 | 0.14594565 | 0.01547566 | 0.1547566 | 0.24383596 | ||
| 0.154334 | 0.14798795 | 0.01562516 | 0.1562516 | 0.23263951 | ||
| 0.146984 | 0.14986377 | 0.01576213 | 0.1576213 | 0.22241903 | ||
| 0.140203 | 0.15159196 | 0.0158879 | 0.158879 | 0.21305747 | ||
| 0.137185 | 0.15240553 | 0.01594698 | 0.1594698 | 0.20866468 | ||
| 0.134203 | 0.15319069 | 0.016004 | 0.16004 | 0.20444959 | ||
| 0.128611 | 0.15467401 | 0.01611149 | 0.1611149 | 0.19650787 |
Figure 10 shows an example of the shed vortex sheet from one of the blades’ trailing edge of the propeller-turbine.
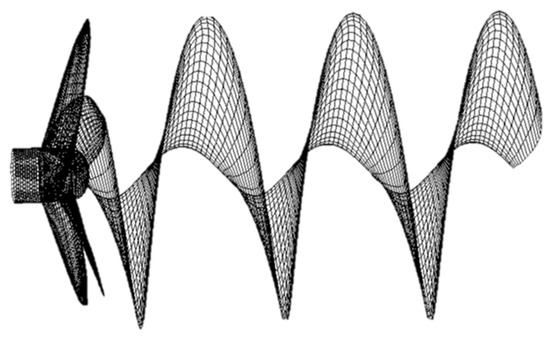
Figure 10.
The wake of the optimised propeller for an expanded area ratio of 0.387142, 5-blade, 0.6 pitch ratio. They are generated through Rotorysics.
7. Conclusions
The design process and optimisation of a propeller were carried out to be utilised for a dual-mode propeller on the Princess Royale in Blyth. The conditions and limitations were considered, and a complex and highly developed code, Rotorysics, which adopts the panel method, was used to carry out simulations exploring the effect of the pitch ratio, blade number and advanced speed on the propulsive and power generation efficiency, aiming for a balanced coupled efficiency of both on a single propeller rotor. The Rotorysics code has been validated through various investigations, and its reliability and accuracy have been verified.
Using past studies, a base EAR of 0.400019 was assumed. The initial study objectives were to test a range of pitch ratios for a blade number of three to five. However, through investigation of wind turbines, an experimental geometry was created with an EAR of 0.387142.
The values acquired and discussed are optimal for either propulsion or turbine mode; the primary use of the propeller needs to be identified. Suppose the highest priority and central purpose is to generate electricity on the Princess Royale. In that case, the optimised geometry will accept a compromise on the propulsive ability to obtain a higher generation efficiency. On the other hand, if this propeller will mainly be used as a propulsion propeller assisting the propulsion system for operations or to aid with higher speed, then the propulsion would be of higher precedence, with the optimal being ideal for propulsion and still better than the off-the-shelf alternatives for generating electricity. Although the difference from the optimal values is not significant, around 4% for the propulsion mode and around 7–9% for the turbine mode can substantially affect the fuel consumption and operating performance. Options favouring either are stated below.
For a dual-mode propeller favouring propulsion abilities, within both expanded area ratio ranges, the ultimate optimised geometry would be the three-blade 0.6 pitch ratio having a propulsive efficiency of 0.5433204, or 54.33% and a power coefficient of 0.291843 at the respective speeds. This power coefficient is still good and better than most off-the-shelf products. On the contrary, if the concentration was on power generation but still required an excellent propulsive efficiency, the best geometry would be the five-blade 0.6 pitch ratio containing a power coefficient of 0.348402 and a propulsive efficiency of 0.48547 or 48.55%.
Through thorough analysis, the most suitable geometry was found for the experimental EAR of 0.387142, the five-blade, 0.6 pitch ratio geometry, with a perfect mid-point optimised for both. It has a propulsive efficiency of 0.52527 or 52.53% at an advance speed of 0.449053 and a power coefficient of 0.319718 at 3.05.
Further analysis of this geometry would need to take place to see how it is affected by cavitation, whether it has good enough structural integrity and the noise and vibration levels when operating.
A 3D-printed propeller with this optimised geometry, although it would probably need extra chord sections and slight modification on AutoCAD, could be tested through a cavitation tunnel. Further testing should also occur for a broader range of tip speed ratios for power generation, and the real-life performance should be measured.
Theoretically, the conclusions concerning the design deduced from this study, which can serve as a foundation for a propeller, a turbine and a dual-mode propeller turbine, respectively, for a similar vessel in similar conditions are as follows: a propeller operating purely for propulsion has ideal characteristics that comprise a lower blade number, a higher pitch ratio and decreasing the advanced speed to increase the efficiency up to a certain degree, which the efficiency will then decrease at. On the contrary, for a turbine designed purely for underwater power generation with similar conditions, the design characteristics will contain a higher blade number, for a higher surface area, a lower pitch ratio and a moderate tip speed ratio, which will have to be ideally simulated or tested to find the optimum as the power coefficient will increase to a point with the tip speed ratio and then decrease.
Author Contributions
Conceptualisation: P.L., J.R.E. and S.T.; methodology: P.L. and J.R.E.; software: P.L.; validation: P.L. and J.R.E.; formal analysis: J.R.E. and P.L.; investigation: J.R.E.; resources: P.L. and S.T.; data curation: J.R.E.; writing—original draft: J.R.E.; writing—review and editing: P.L.; visualisation: J.R.E.; supervision: P.L.; project administration: P.L. and J.R.E.; funding acquisition: P.L. and S.T. All authors have read and agreed to the published version of the manuscript.
Funding
This work was supported by the UK Department for Transport as part of the UK Shipping Office for Reducing Emissions (UK SHORE) Programme and the UK Engineering and Physical Sciences Research Council (EPSRC) (grant number EP/Y024605/1).
Data Availability Statement
The data will be available upon request.
Acknowledgments
The authors are grateful for the support of Newcastle University.
Conflicts of Interest
The authors declare no conflicts of interest.
Nomenclature
| AoA | Angle of attack | Z | Blade number |
| D | Propeller diameter, m | PD | Pitch ratio |
| EAR | Expanded area ratio, m | PD0.7R | The pitch diameter ratio of the blade at r = 0.7R. |
| n | Propeller and rotor shaft speed, revolutions per second | r | Fluid density, 1025 kg/m3 |
| N | Propeller and Rotor Shaft Speed, revolutions per minute | T | Thrust of propeller, N |
| Va | Ship advance speed, m/s | CPow | Rotor power coefficient, |
| J | Advance coefficient, | Q | Torque of propeller shaft, Nm |
| KQ | Propeller shaft torque coefficient, | KT | Propeller shaft thrust coefficient, |
References
- Department for Transport. Government Takes Historic Step towards Net-Zero with the End of the Sale of New Petrol and Diesel Cars by 2030; GOV.UK. Available online: https://www.gov.uk/government/news/government-takes-historic-step-towards-net-zero-with-end-of-sale-of-new-petrol-and-diesel-cars-by-2030 (accessed on 9 May 2023).
- Liu, P.; Bose, N. Prototyping a series of bi-directional horizontal axis tidal turbines for optimum energy conversion. Appl. Energy 2012, 99, 50–66. [Google Scholar] [CrossRef]
- Gill, T. How Many People Have Solar Panels in the UK? The Eco Experts. 27 April 2023. Available online: https://www.theecoexperts.co.uk/solar-panels/popularity-of-solar-power#:~:text=There%20are%20roughly%201.2%20million,generating%20electricity%20from%20solar%20panels (accessed on 9 May 2023).
- BBC. How Many More Wind Turbines Will the UK Build? BBC News. 28 November 2022. Available online: https://www.bbc.co.uk/news/explainers-60945298# (accessed on 9 May 2023).
- Department for Business, Energy & Industrial Strategy; The Rt Hon Greg Hands; The Rt Hon Kwasi Kwarteng. UK Government Announces Biggest Investment into Britain’s Tidal Power. 2021. Available online: https://www.gov.uk/government/news/uk-government-announces-biggest-investment-into-britains-tidal-power (accessed on 9 May 2023).
- N-SCI Technologies. 2019. Available online: https://nsci.ca/2019/11/19/tidal-energy-and-how-it-works/#:~:text=Advantages%20of%20Tidal%20Energy&text=Reliable%20and%20renewable%20source%20of,and%20have%20less%20environmental%20impact (accessed on 9 May 2023).
- Department for Energy Security and Net Zero; Department for Business, Energy & Industrial Strategy. Wave and Tidal Energy: Part of the UK’s Energy Mix. 2013. Available online: https://www.gov.uk/guidance/wave-and-tidal-energy-part-of-the-uks-energy-mix (accessed on 9 May 2023).
- Liu, P.; Bose, N.; Chen, K.; Xu, Y. Development and optimization of dual-mode propellers for renewable energy. Renew. Energy 2018, 119, 566–576. [Google Scholar] [CrossRef]
- Bahaj, A.S.; Molland, A.F.; Chaplin, J.R.; Batten, W.M.J. Power and thrust measurements of marine current turbines under various hydrodynamic flow conditions in a cavitation tunnel and a towing tank. Renew. Energy 2007, 32, 407–426. [Google Scholar] [CrossRef]
- Gu, Y.-J.; Lin, Y.-G.; Xu, Q.-K.; Liu, H.-W.; Li, W. Blade-pitch system for tidal current turbines with reduced variation pitch control strategy based on tidal current velocity preview. Renew. Energy 2018, 115, 149–158. [Google Scholar] [CrossRef]
- Frost, C.; Morris, C.E.; Mason-Jones, A.; O’Doherty, D.M.; O’Doherty, T. The effect of tidal flow directionality on tidal turbine performance characteristics. Renew. Energy 2015, 78, 609–620. [Google Scholar] [CrossRef]
- Zhu, F.-W.; Ding, L.; Huang, B.; Bao, M.; Liu, J.-T. “Blade design and optimisation of a horizontal axis tidal turbine. Ocean Eng. 2020, 195, 106652. [Google Scholar] [CrossRef]
- Hess, J.I.; Vararezo, W. Calculation of Steady Flow about Propellers by Means of Surface Panel Method; Technical Report in Proceedings of Research and Technology; Douglas Aircraft Company: Long Beach, CA, USA, 1985. [Google Scholar]
- Lee, J. A Potential Based Panel Method for the Analysis of Marine Propellers in a Steady Flow. Ph.D. Thesis, Massachusetts Institute of Technology, Cambridge, MA, USA, 1987. [Google Scholar]
- Maskew, B. Prediction of subsonic aerodynamic characteristics: A case for low-order panel methods. J. Aircr. 1982, 19, 157–163. [Google Scholar] [CrossRef]
- Hoshino, T. Hydrodynamic Analysis of Propellers in Steady Flow Usinga Surface Panel Method 2nd Report: Flow Field around Propeller. J. Soc. Nav. Archit. Jpn. 1989, 1989, 79–92. [Google Scholar] [CrossRef]
- Liu, P. A Time-Domain Panel Method for Oscillating Propulsors with Both Chordwise and Spanwise Flexibility. Ph.D. Thesis, Memorial University of Newfoundland, St. John’s, NL, Canada, 1996. [Google Scholar]
- Liu, P. A computational hydrodynamics method for horizontal axis turbine–Panel method modelling migration from propulsion to turbine energy. Energy 2010, 35, 2843–2851. [Google Scholar] [CrossRef]
- Kuiper, G. The Wageningen Propeller Series; Maritime Research Institute Netherlands: Wageningen, The Netherlands, 1992. [Google Scholar]
- Van Lammeren, W.P.A.; van Manen, J.D.; Oosterveld, M.W.C. The Wageningen B-Screw Series. Trans. Sname 1969. Available online: https://www.semanticscholar.org/paper/THE-WAGENINGEN-B-SCREW-SERIES-Lammeren-Manen/29d0fcbffa4e3f2a21cbfeec9dd1d5e76f7b1678 (accessed on 9 May 2023).
- Choi, J.; Kim, H. Application of CAD/CAM/CAE for ship propeller design and manufacturing. Proc. Inst. Mech.Eng. Part M J. Eng. Marit. Environ. 2005, 219, 171–183. [Google Scholar]
- Liu, P. Rotorysics User Manual; MMC Engineering and Research: Surrey, BC, Canada, 2017; pp. 1–41. [Google Scholar]
- Mason-Jones, A.; O’Doherty, D.M.; Morris, C.E.; O’Doherty, T.; Byrne, C.B.; Prickett, P.W.; Grosvenor, R.I.; Owen, I.; Tedds, S.; Poole, R.J. Non-dimensional scaling of tidal stream turbines. Energy 2012, 44, 820–829. [Google Scholar] [CrossRef]
- Carlton, J.S. Marine Propellers and Propulsion, 4th ed.; Butterworth-Heinemann: Oxford, UK, 2019. [Google Scholar]


Disclaimer/Publisher’s Note: The statements, opinions and data contained in all publications are solely those of the individual author(s) and contributor(s) and not of MDPI and/or the editor(s). MDPI and/or the editor(s) disclaim responsibility for any injury to people or property resulting from any ideas, methods, instructions or products referred to in the content. |
© 2024 by the authors. Licensee MDPI, Basel, Switzerland. This article is an open access article distributed under the terms and conditions of the Creative Commons Attribution (CC BY) license (https://creativecommons.org/licenses/by/4.0/).