
Analysis of the Operational Reliability of Different Types of Switching Substations Using the Monte Carlo Method


Abstract
:1. Introduction
- SBS;
- SBS with auxiliary bus;
- SBS with one active incoming and outgoing field;
- SBS with two active incoming and outgoing fields;
- SBS with one active incoming and outgoing field with an auxiliary bus;
- SBS with two active incoming and outgoing fields with an auxiliary bus;
- SBS with withdrawable circuit breaker;
- SBS with withdrawable circuit breaker with one active incoming and outgoing field;
- SBS with withdrawable circuit breaker with two active incoming and outgoing fields.
- DBS;
- DBS with auxiliary bus;
- DBS with one active incoming and outgoing field;
- DBS with two active incoming and outgoing fields;
- DBS with withdrawable circuit breaker;
- DBS with withdrawable circuit breaker with one active incoming and outgoing field;
- DBS with withdrawable circuit breaker with two active incoming and outgoing fields;
- DBS with Bypass Disconnector (all configurations).
- Switchgear with ring-type power supply;
- Switchgear with ring-type power supply with one active incoming and outgoing field;
- Switchgear with ring-type power supply with two active incoming and outgoing fields.
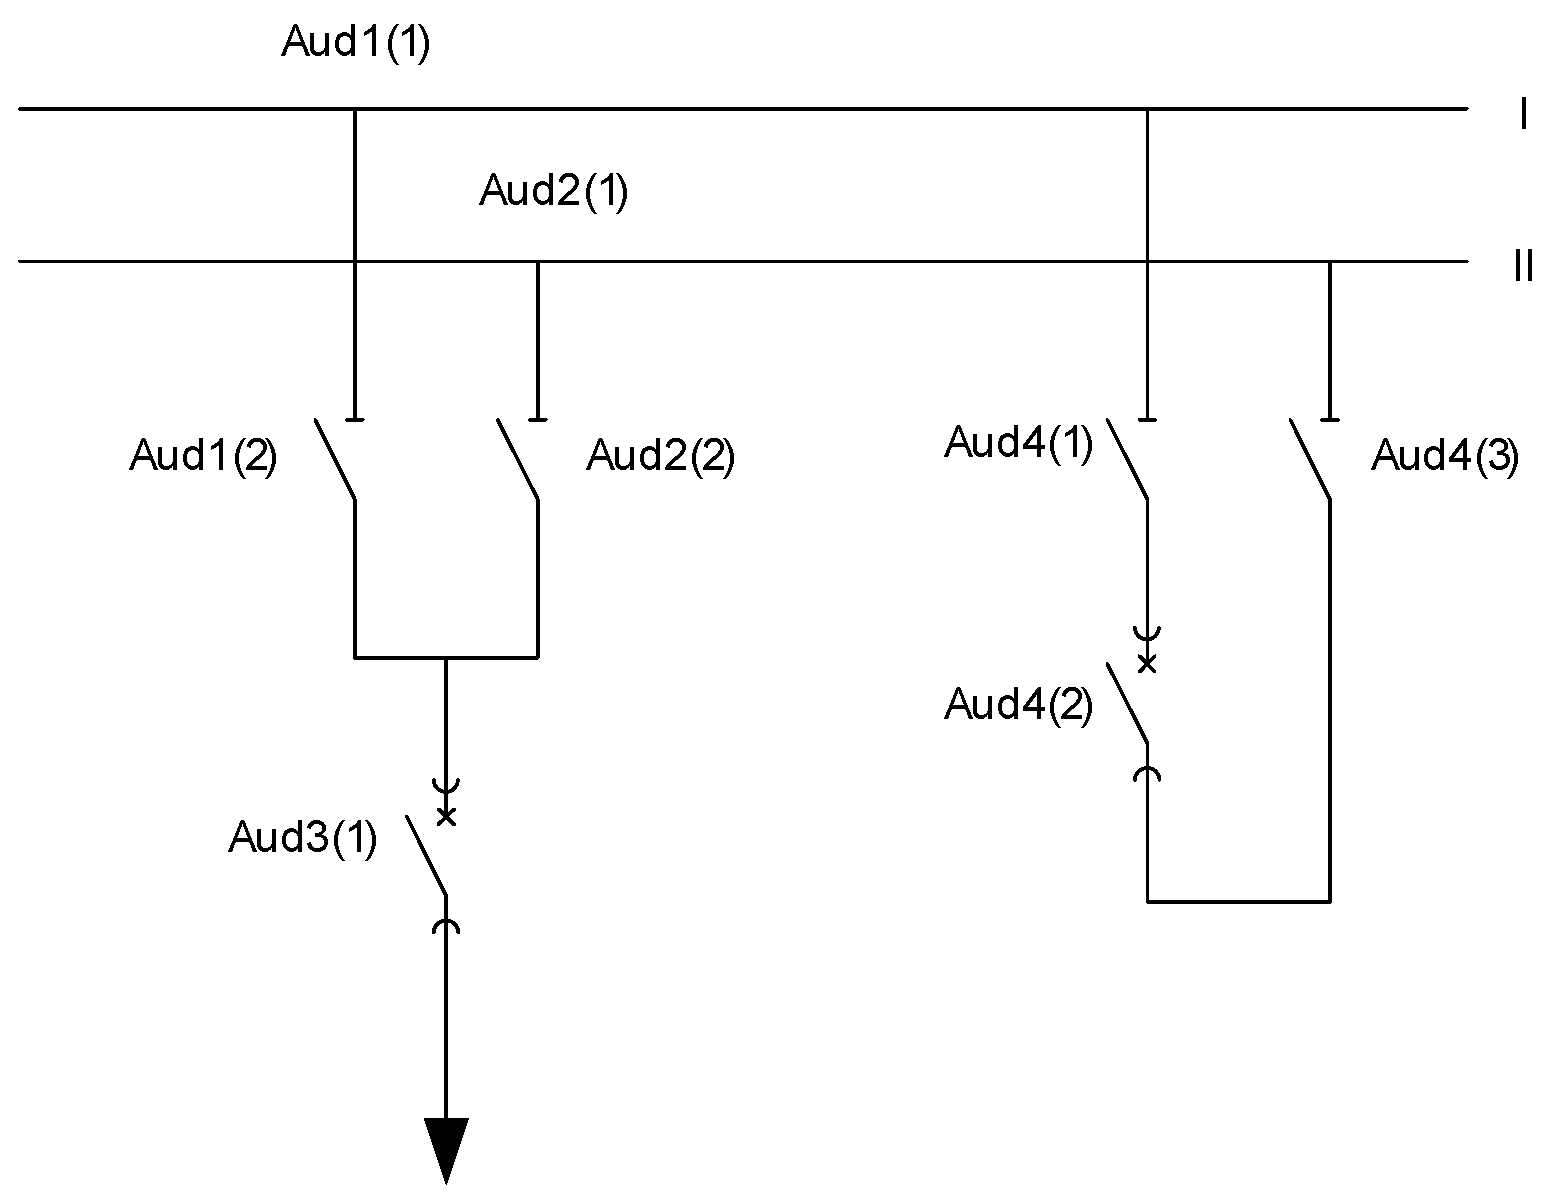
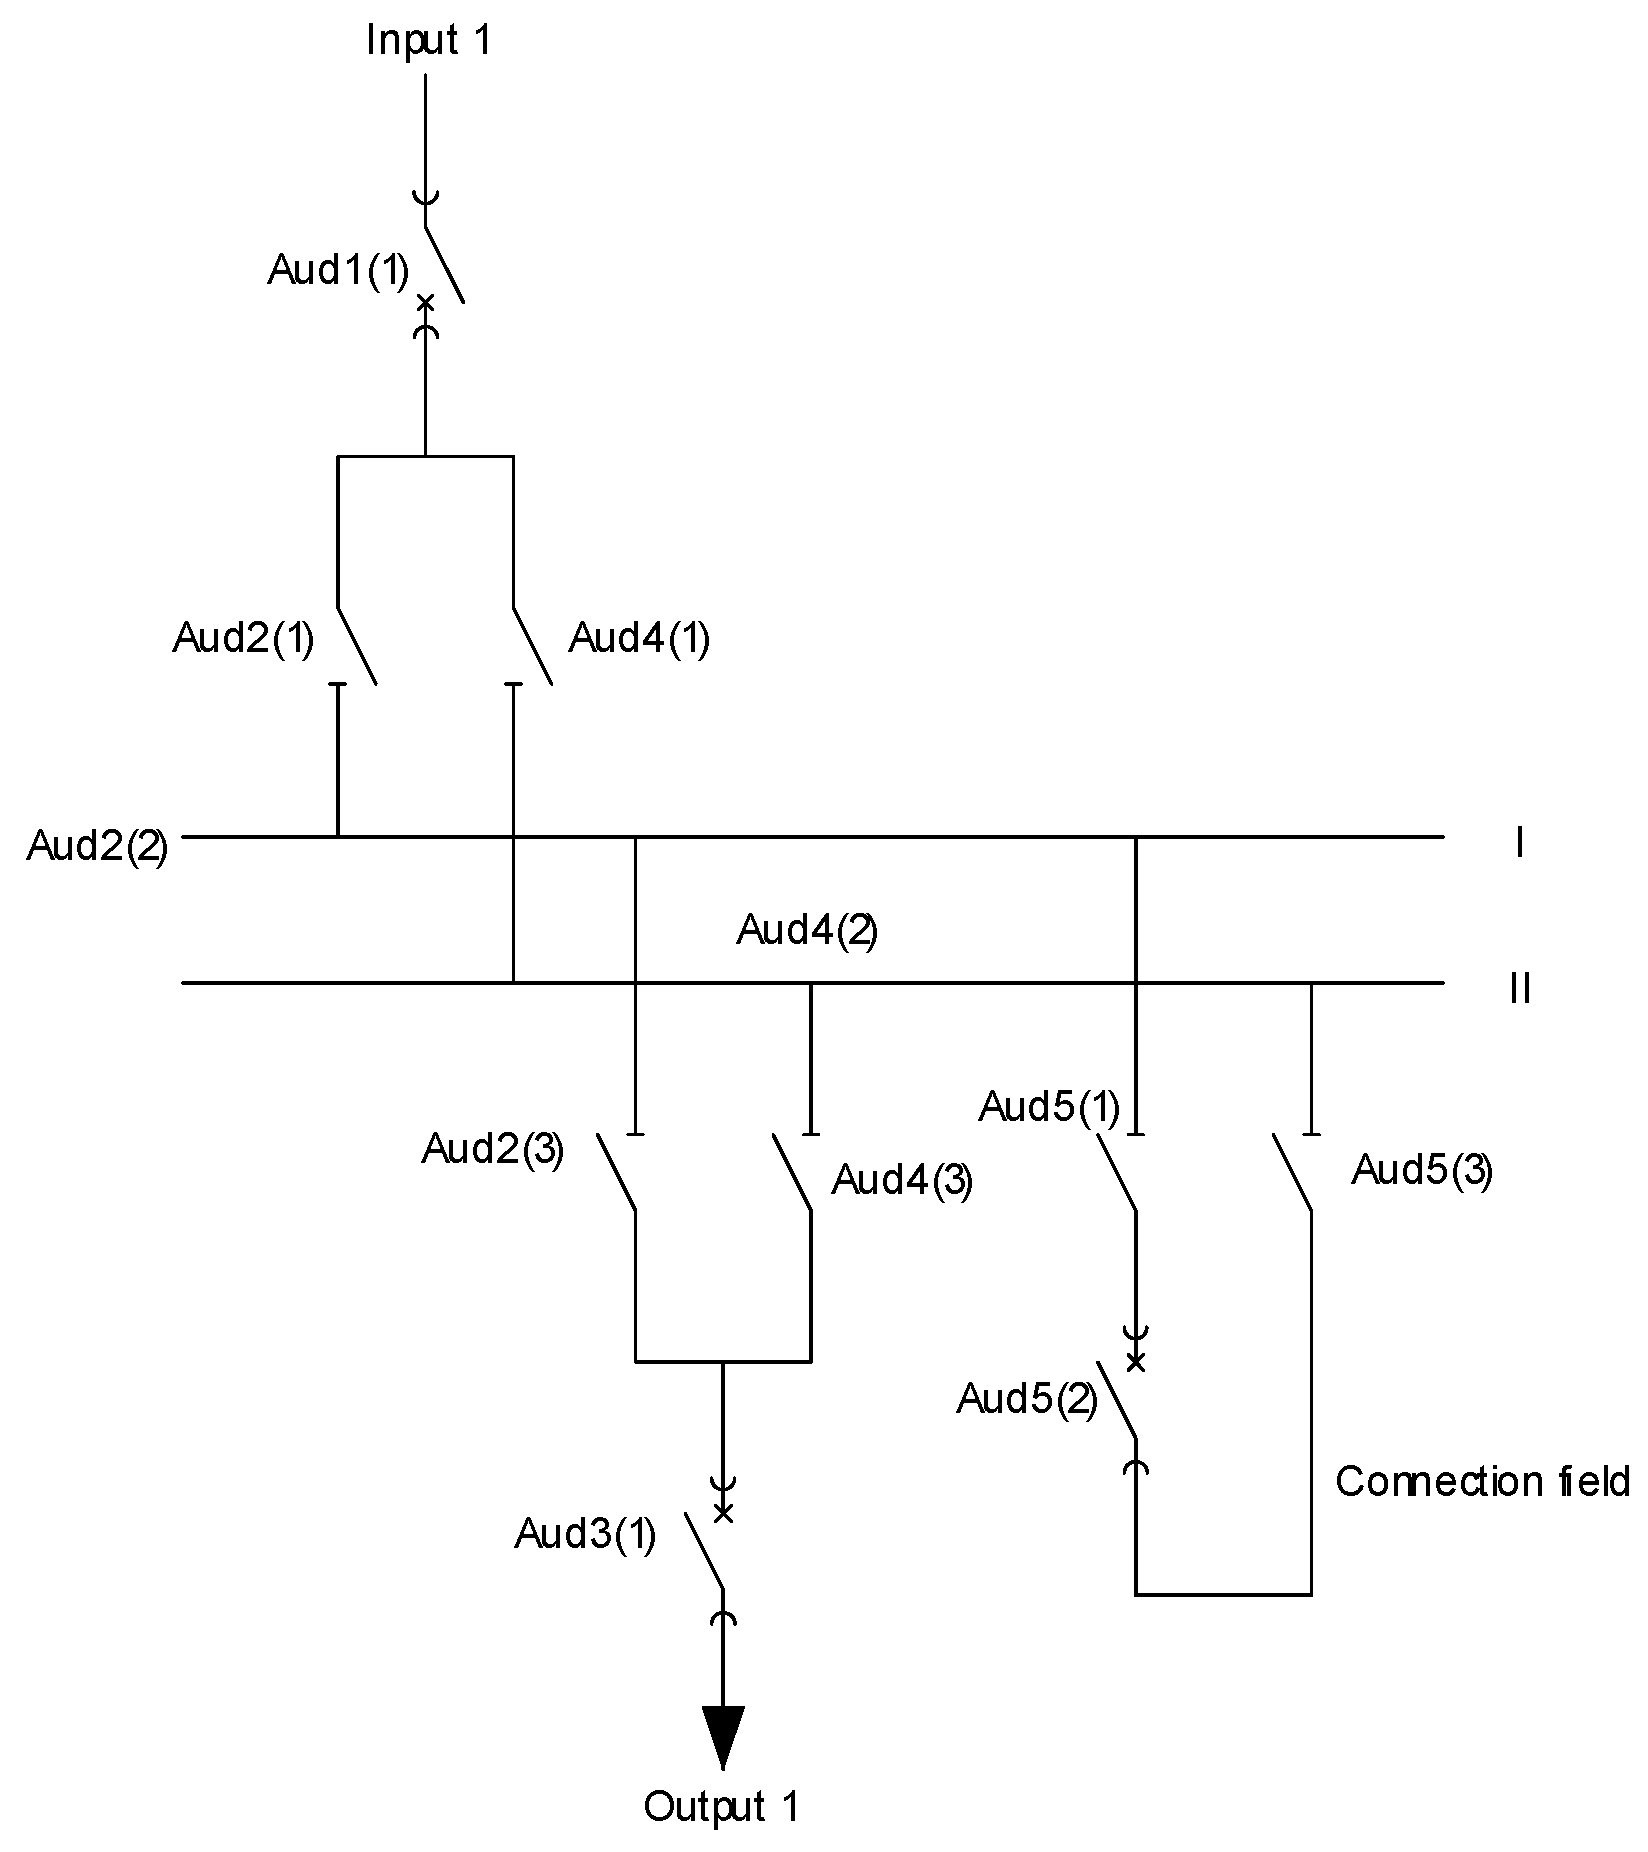
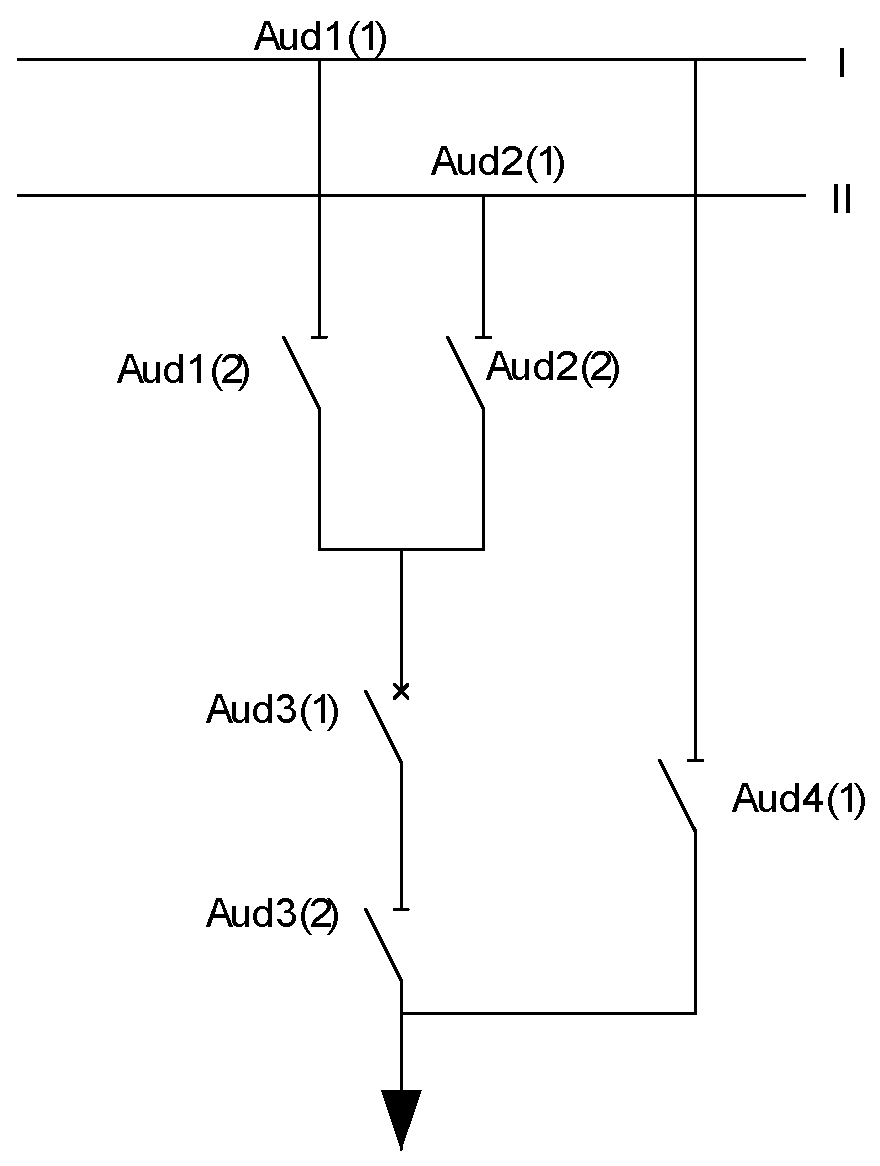
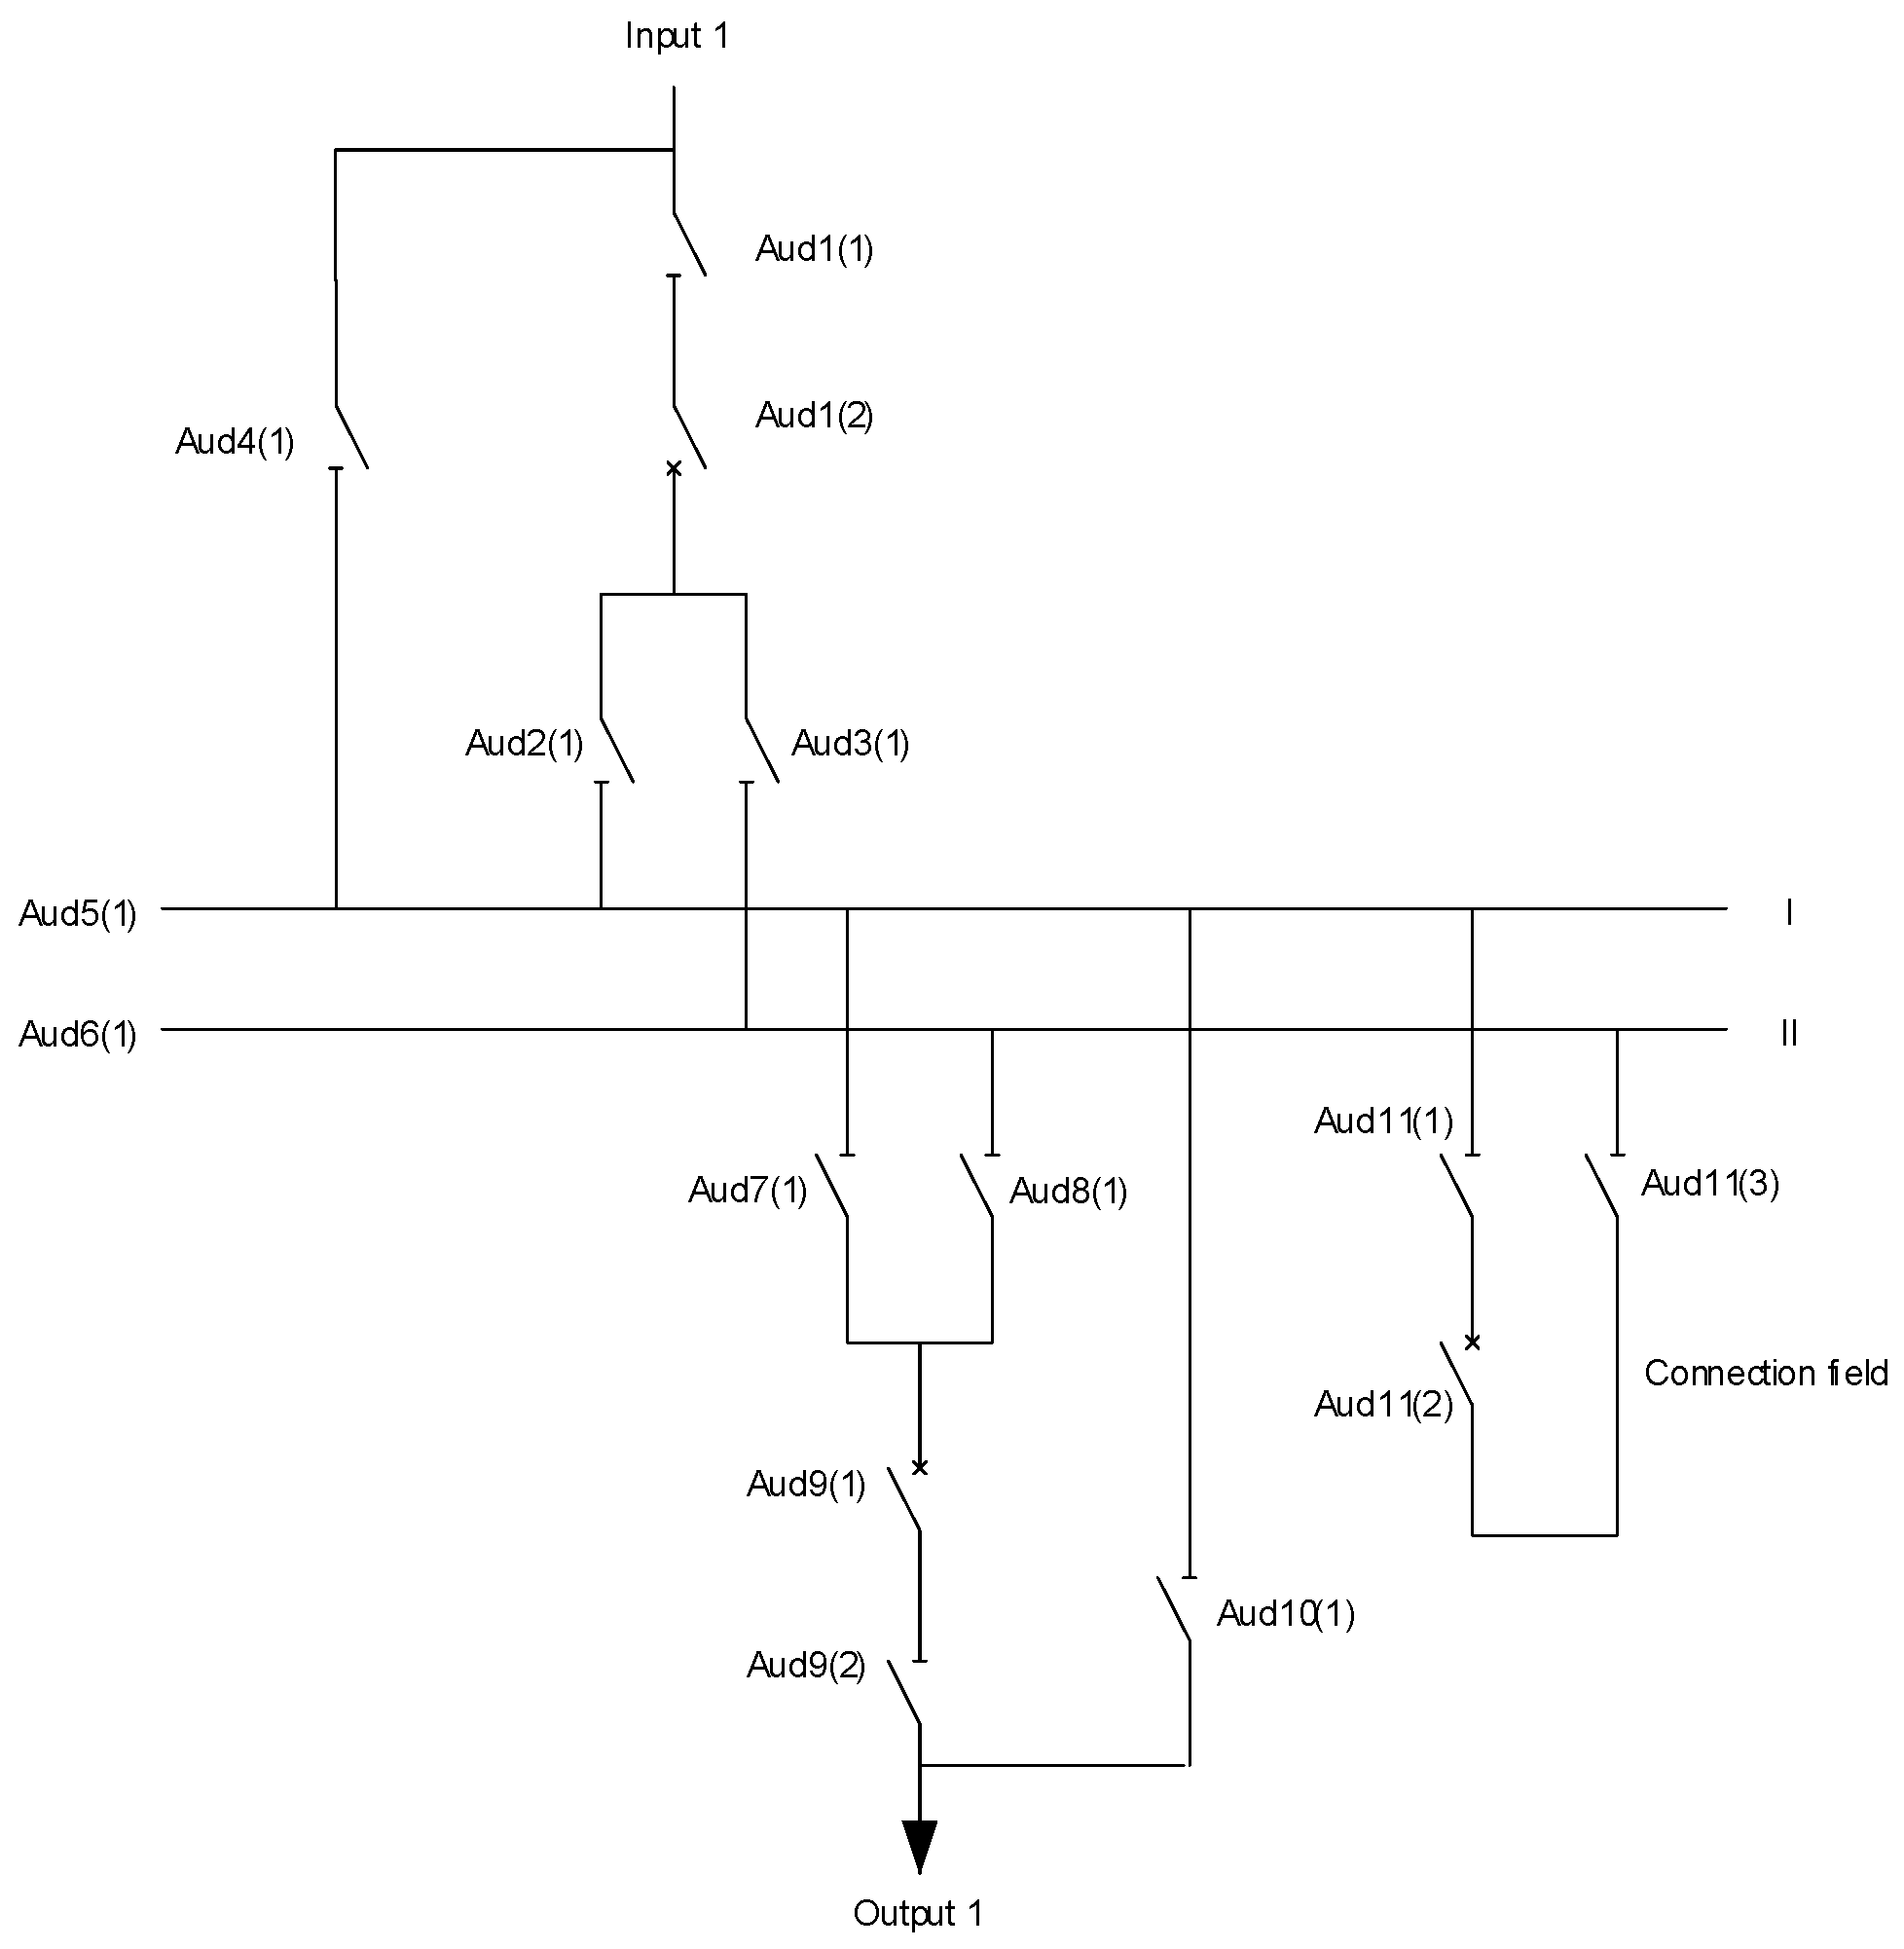
2. Switchgear
3. Materials and Methods
Operation Principle of the Program
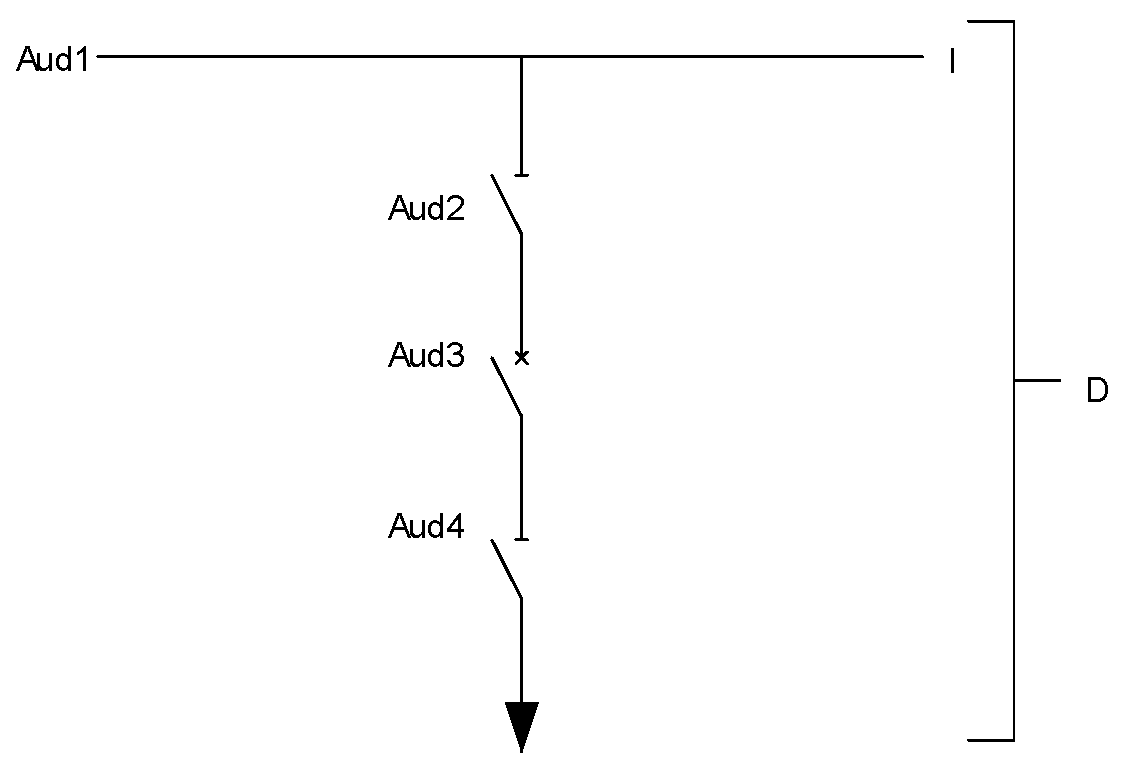
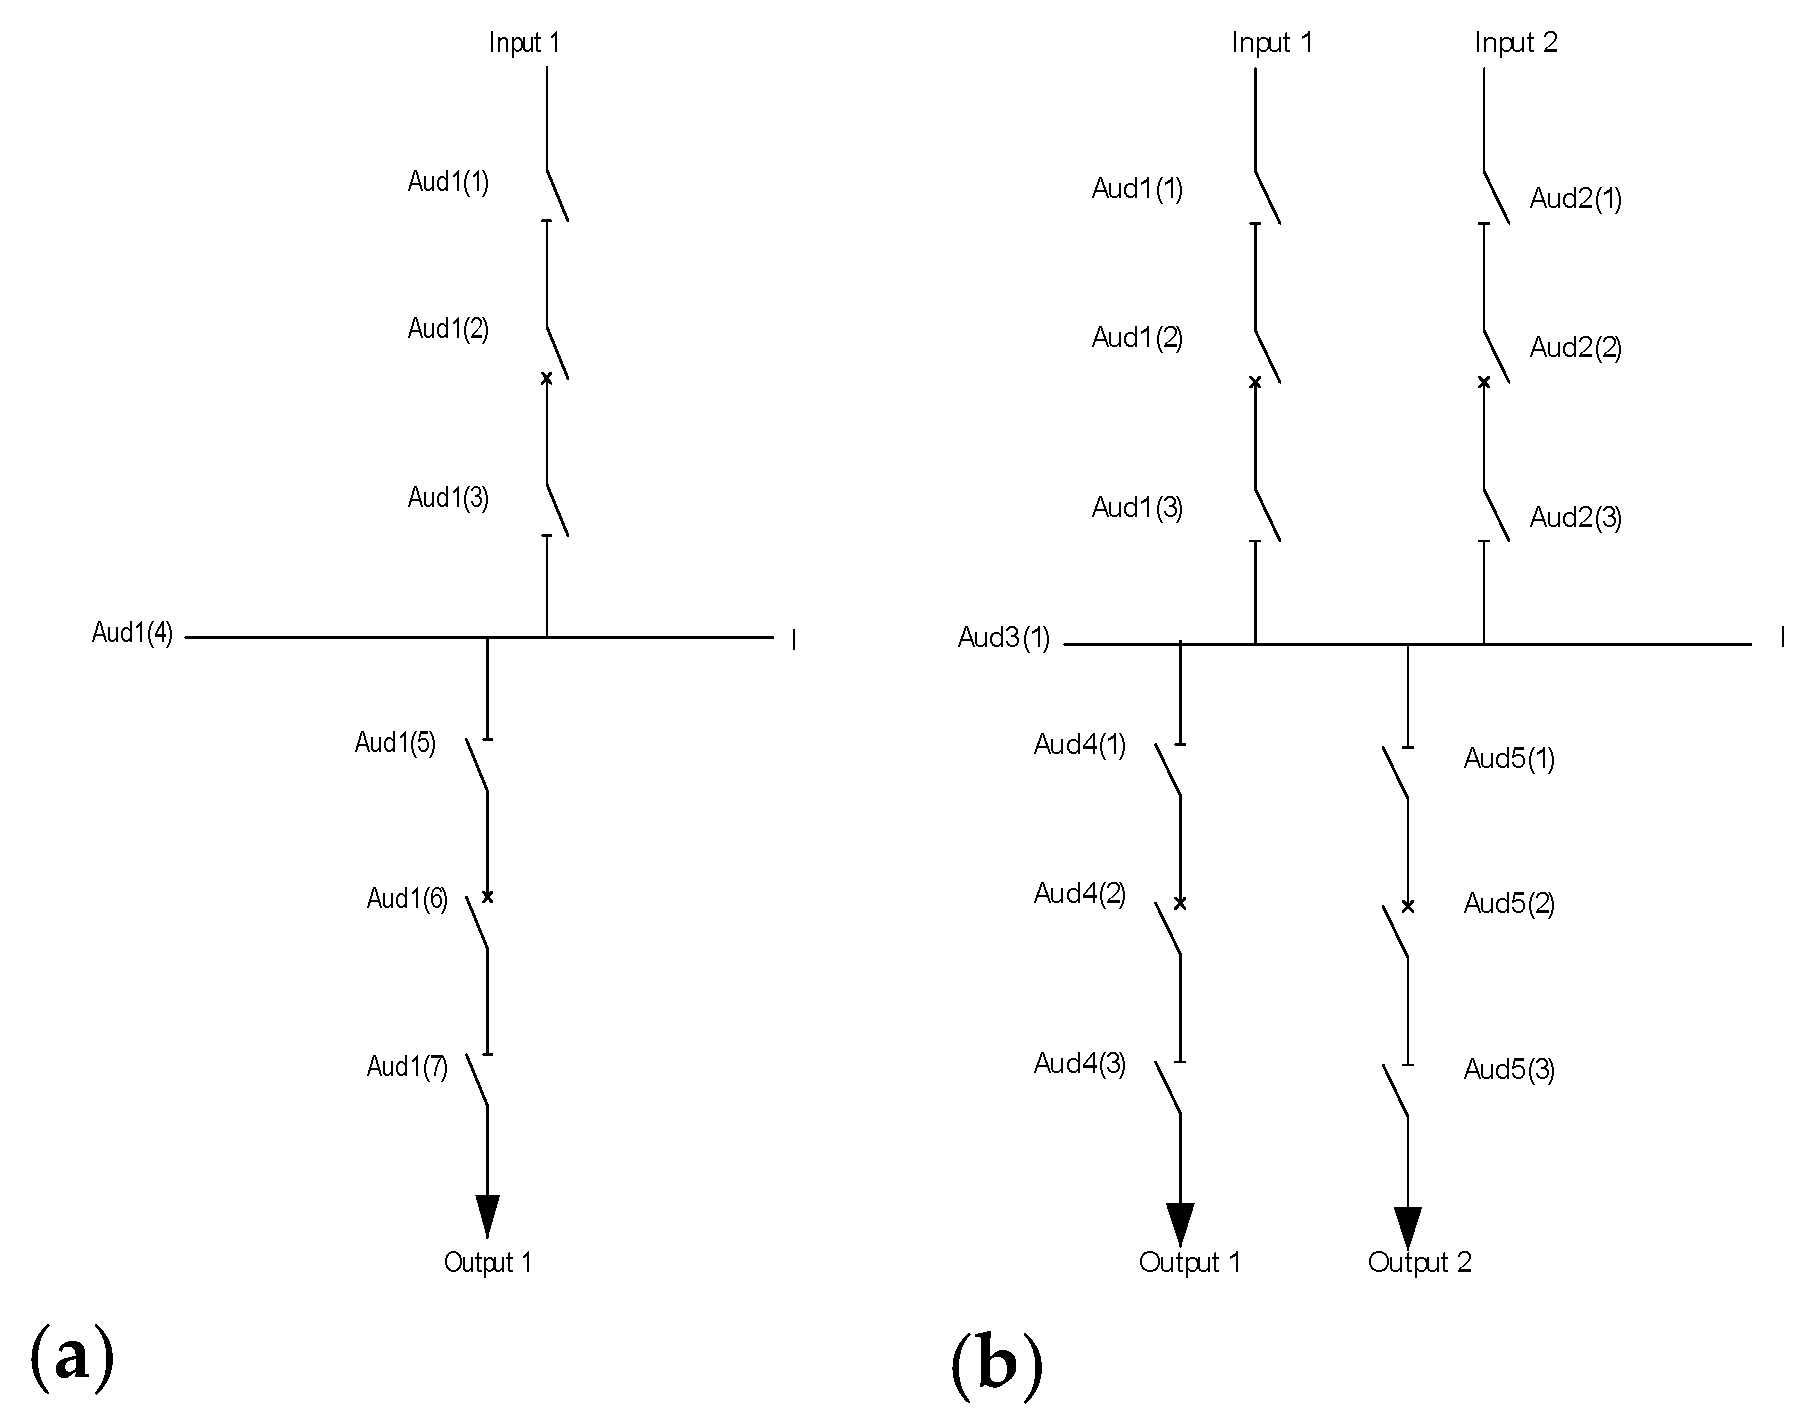
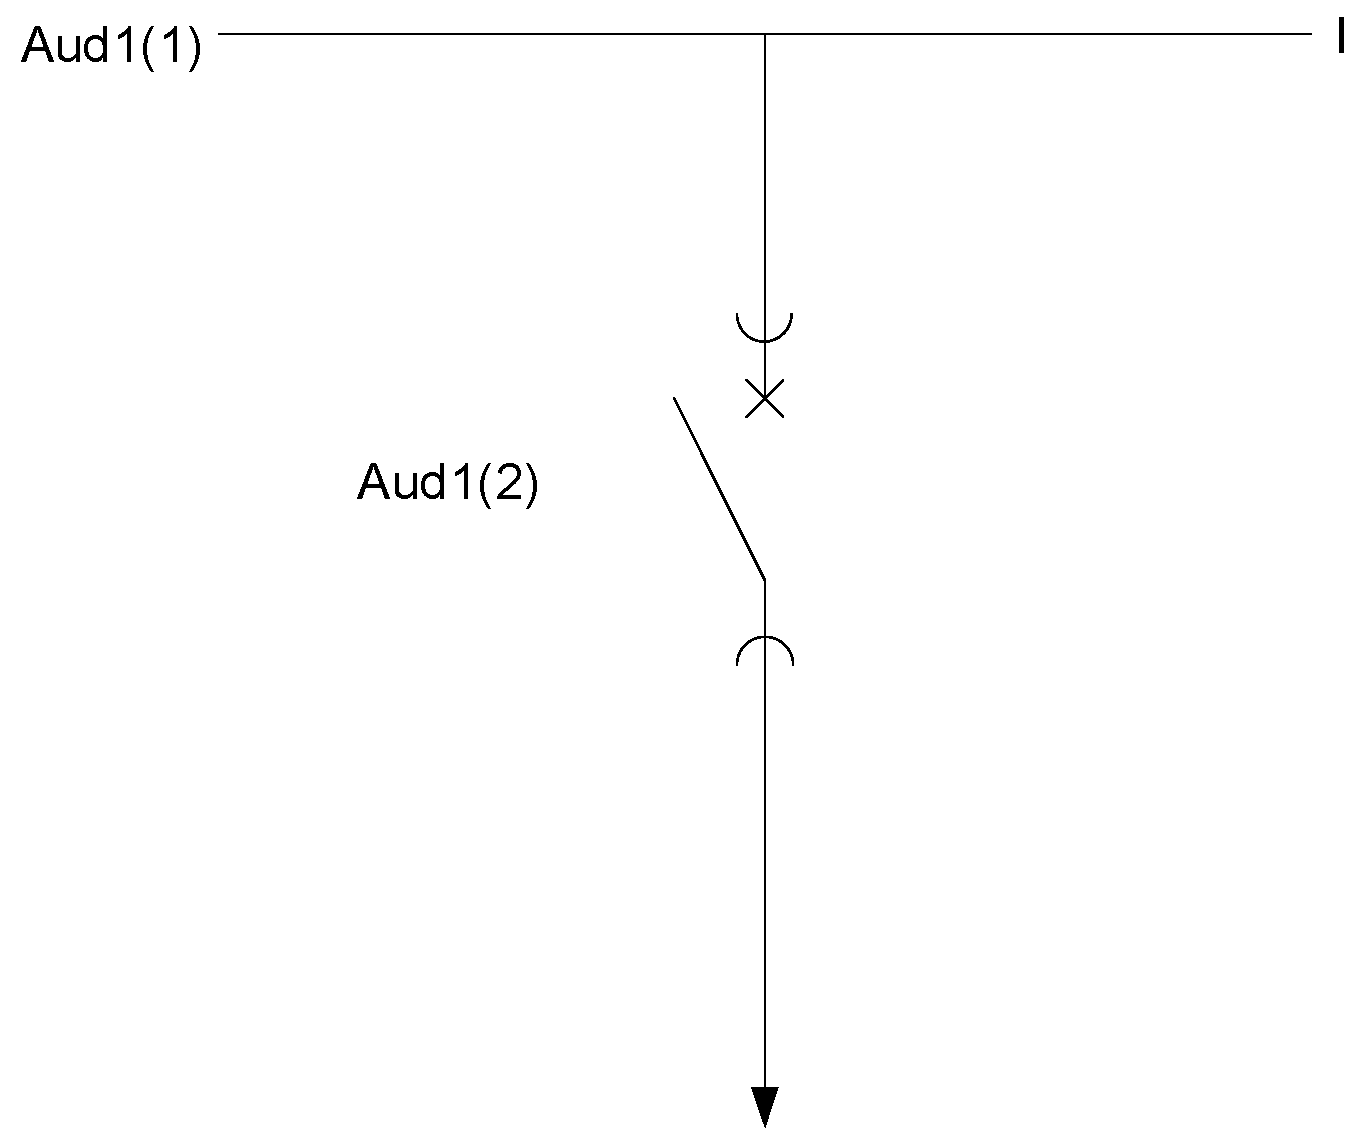
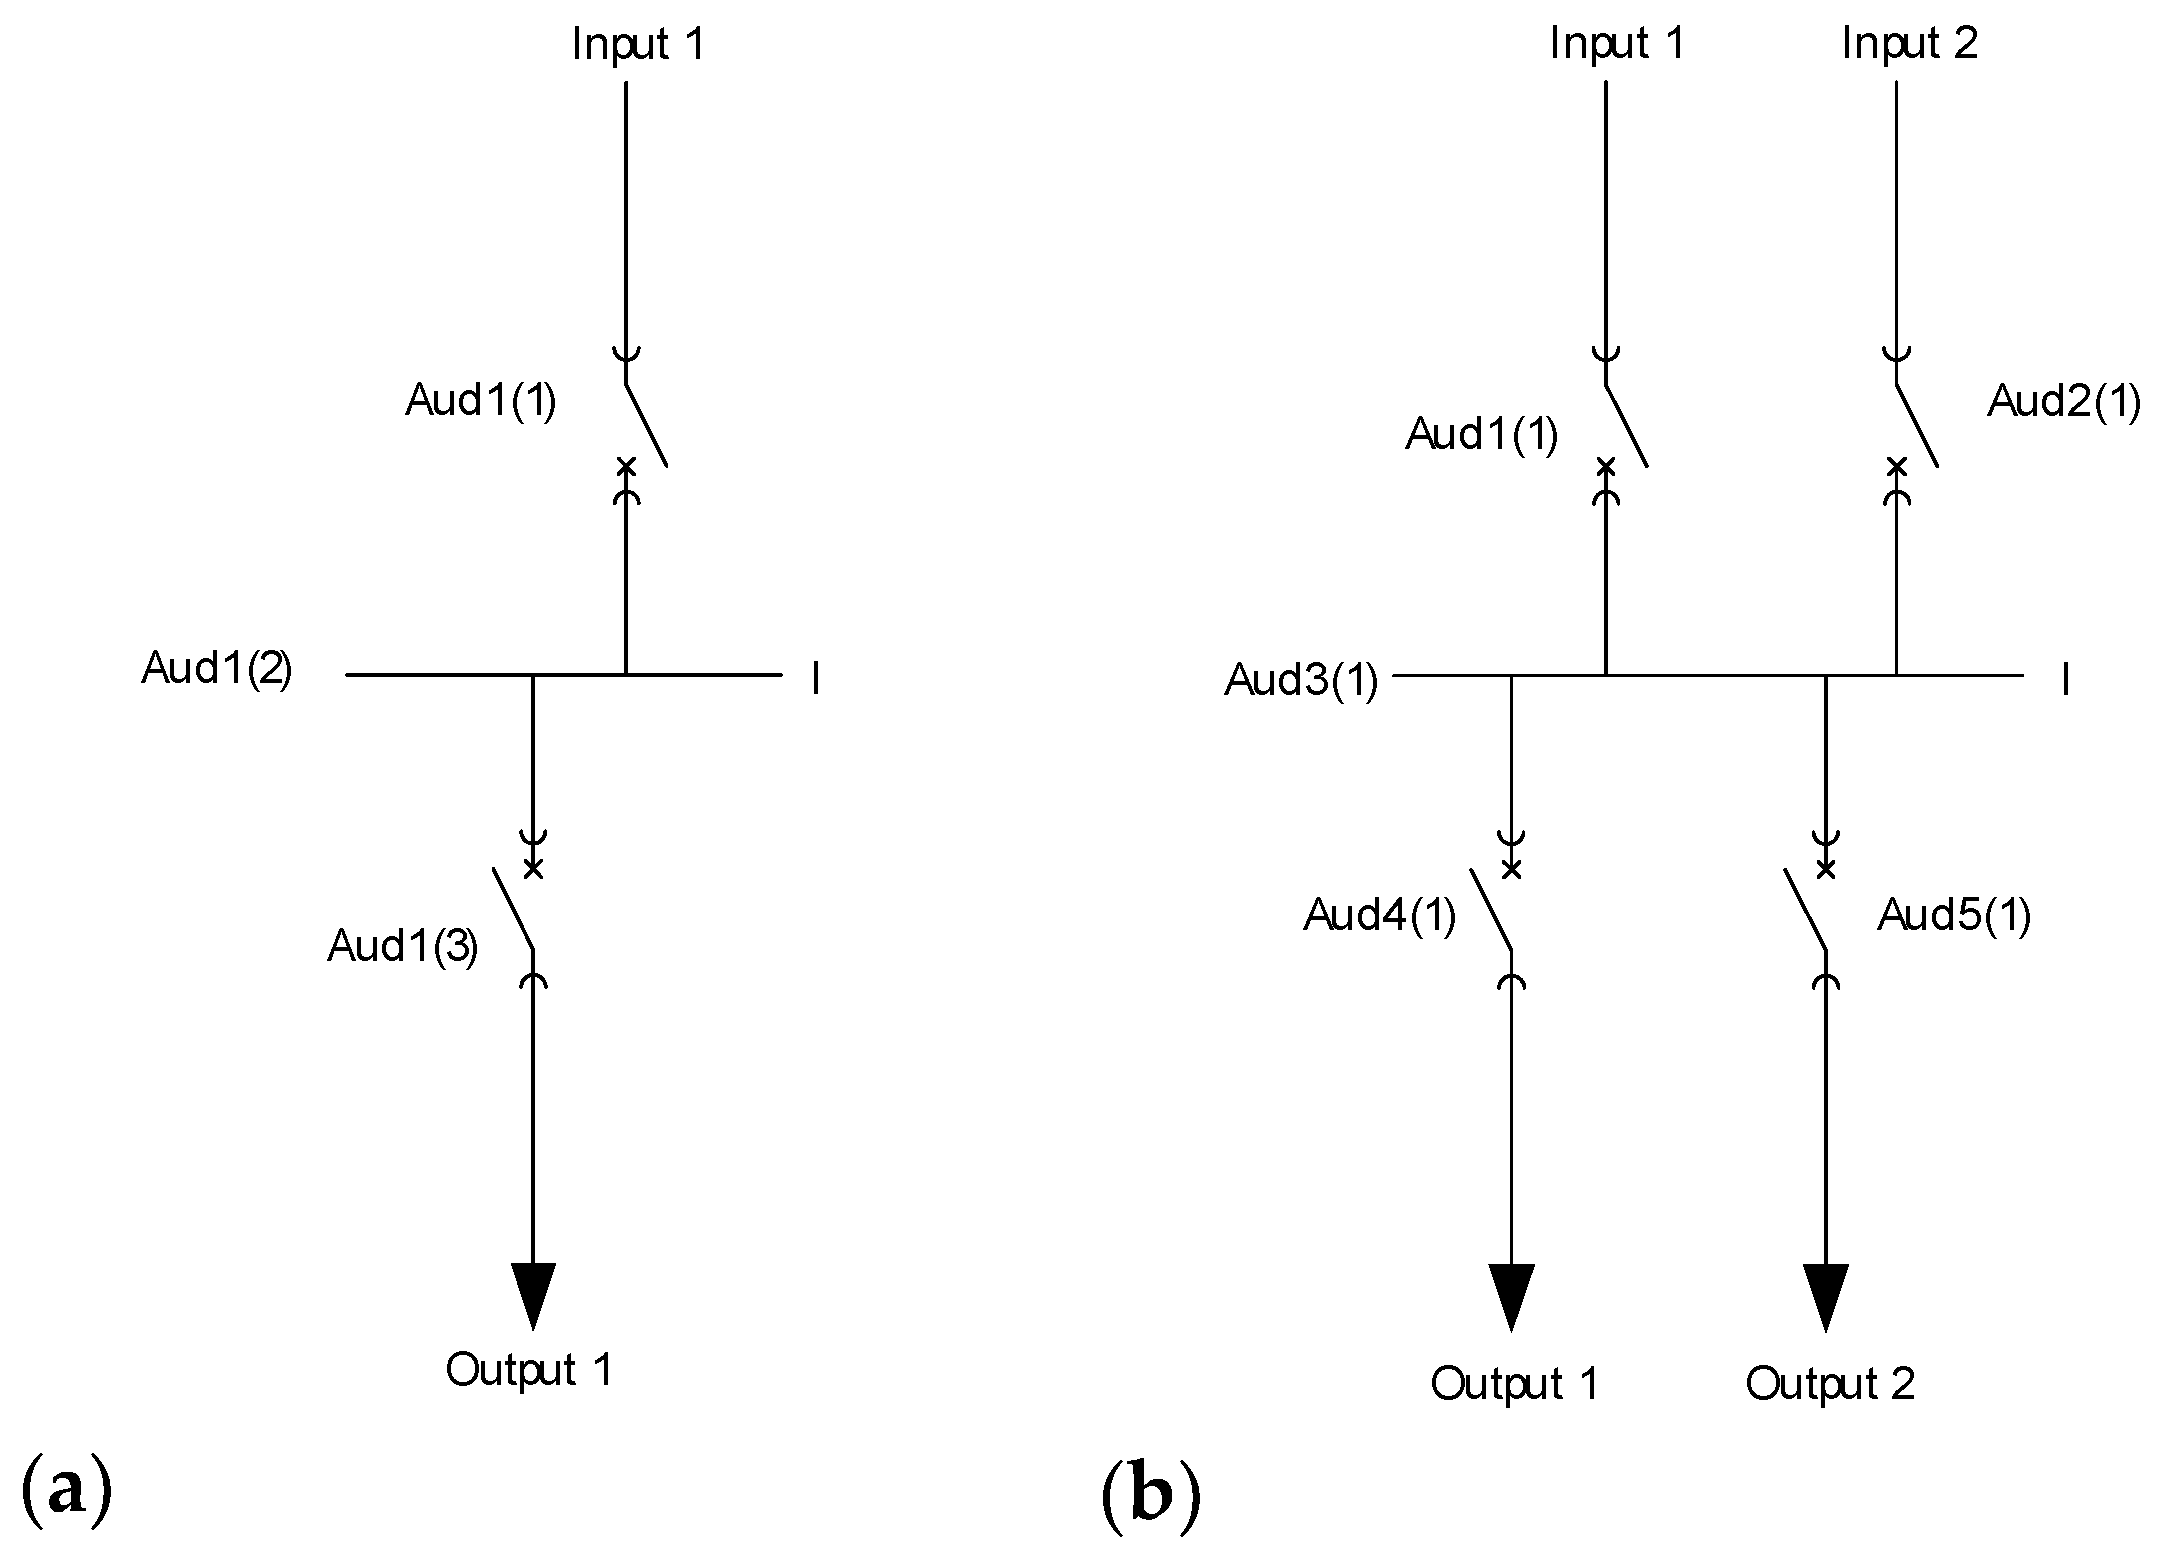
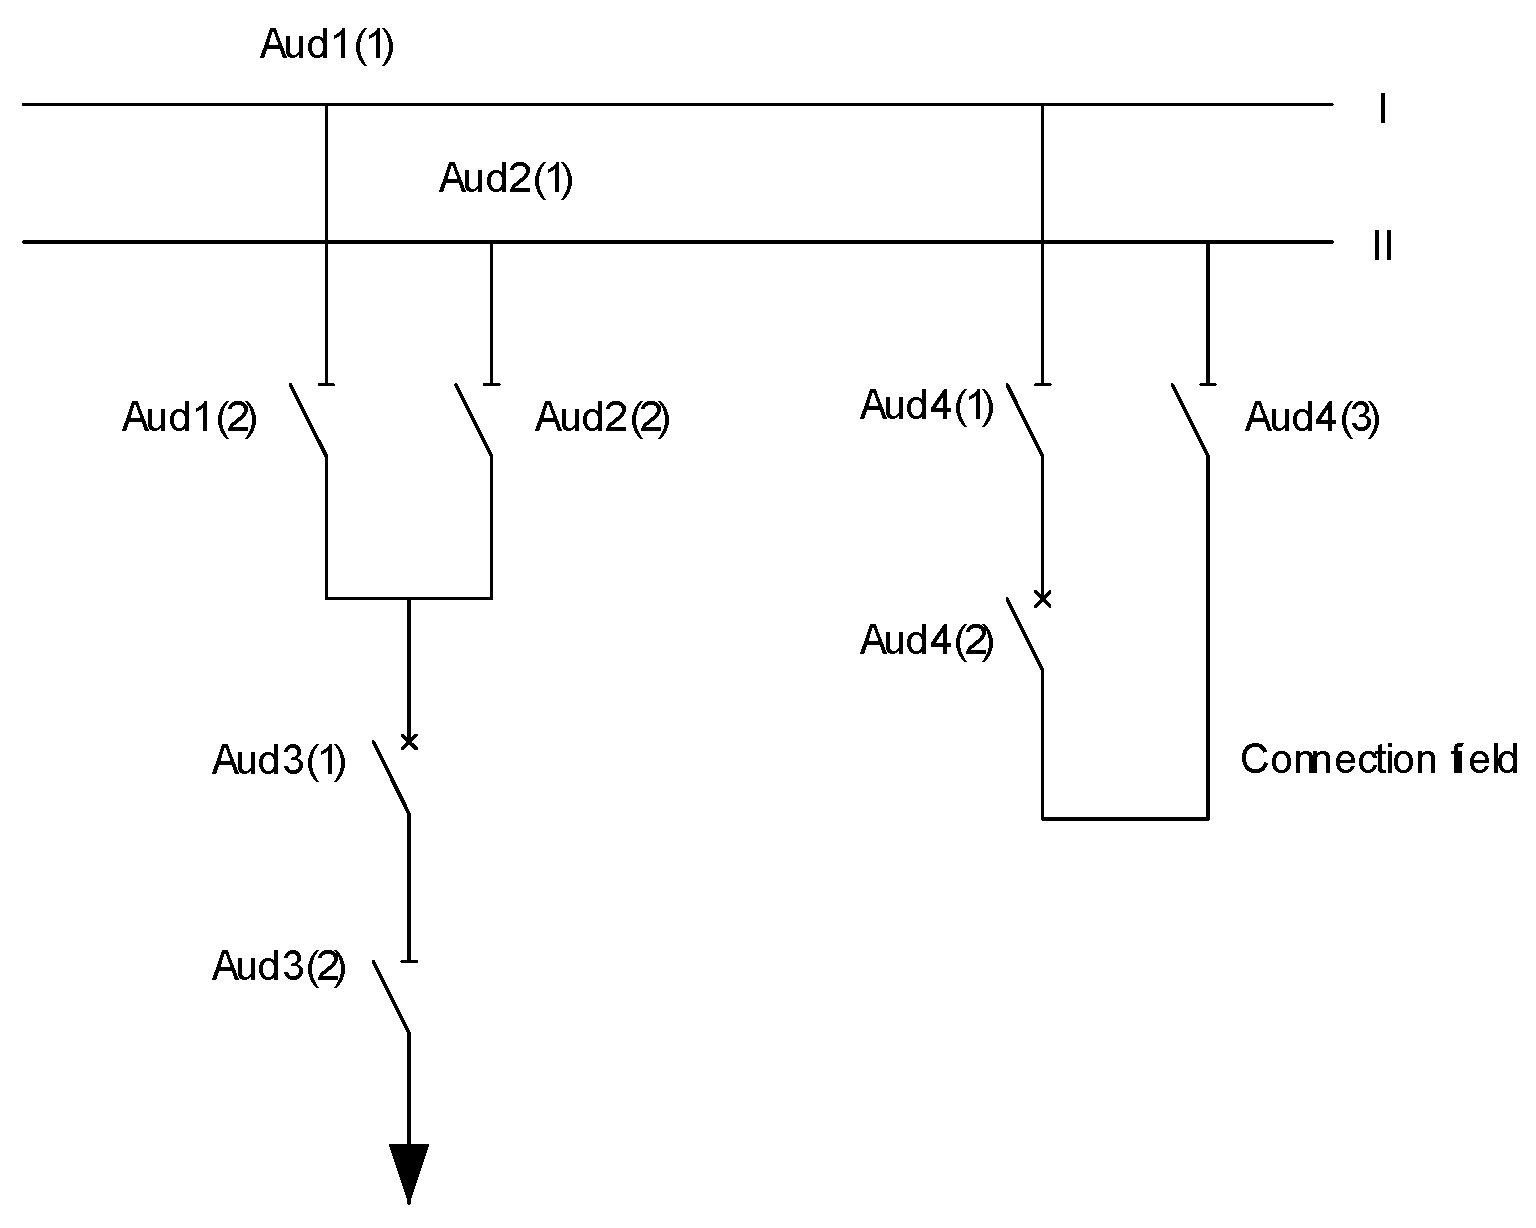
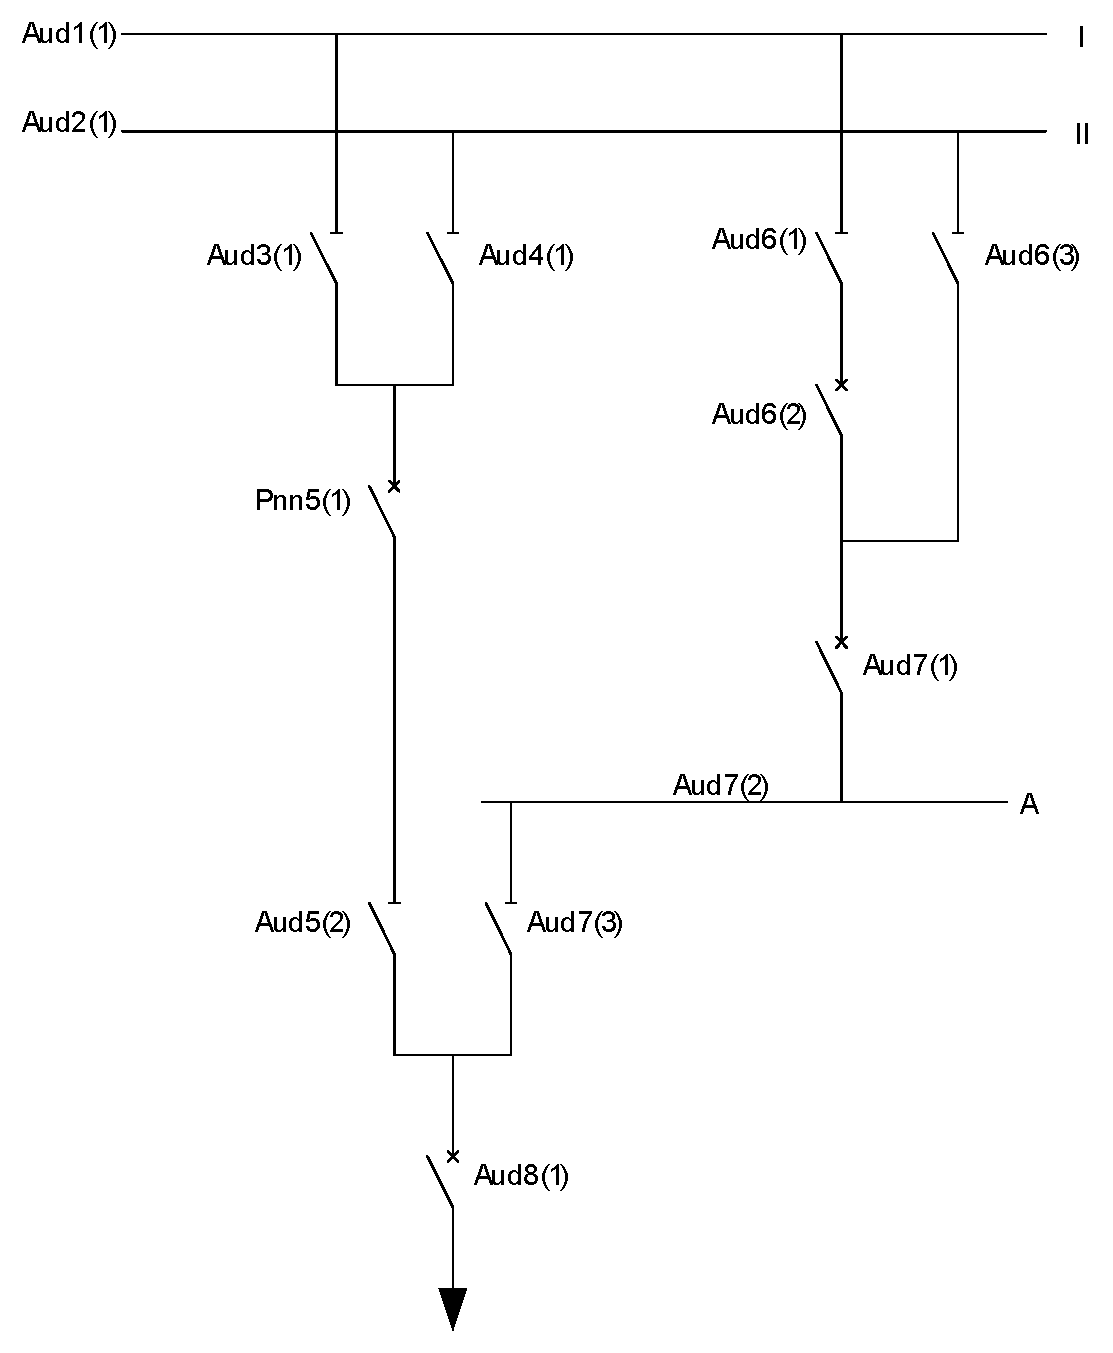
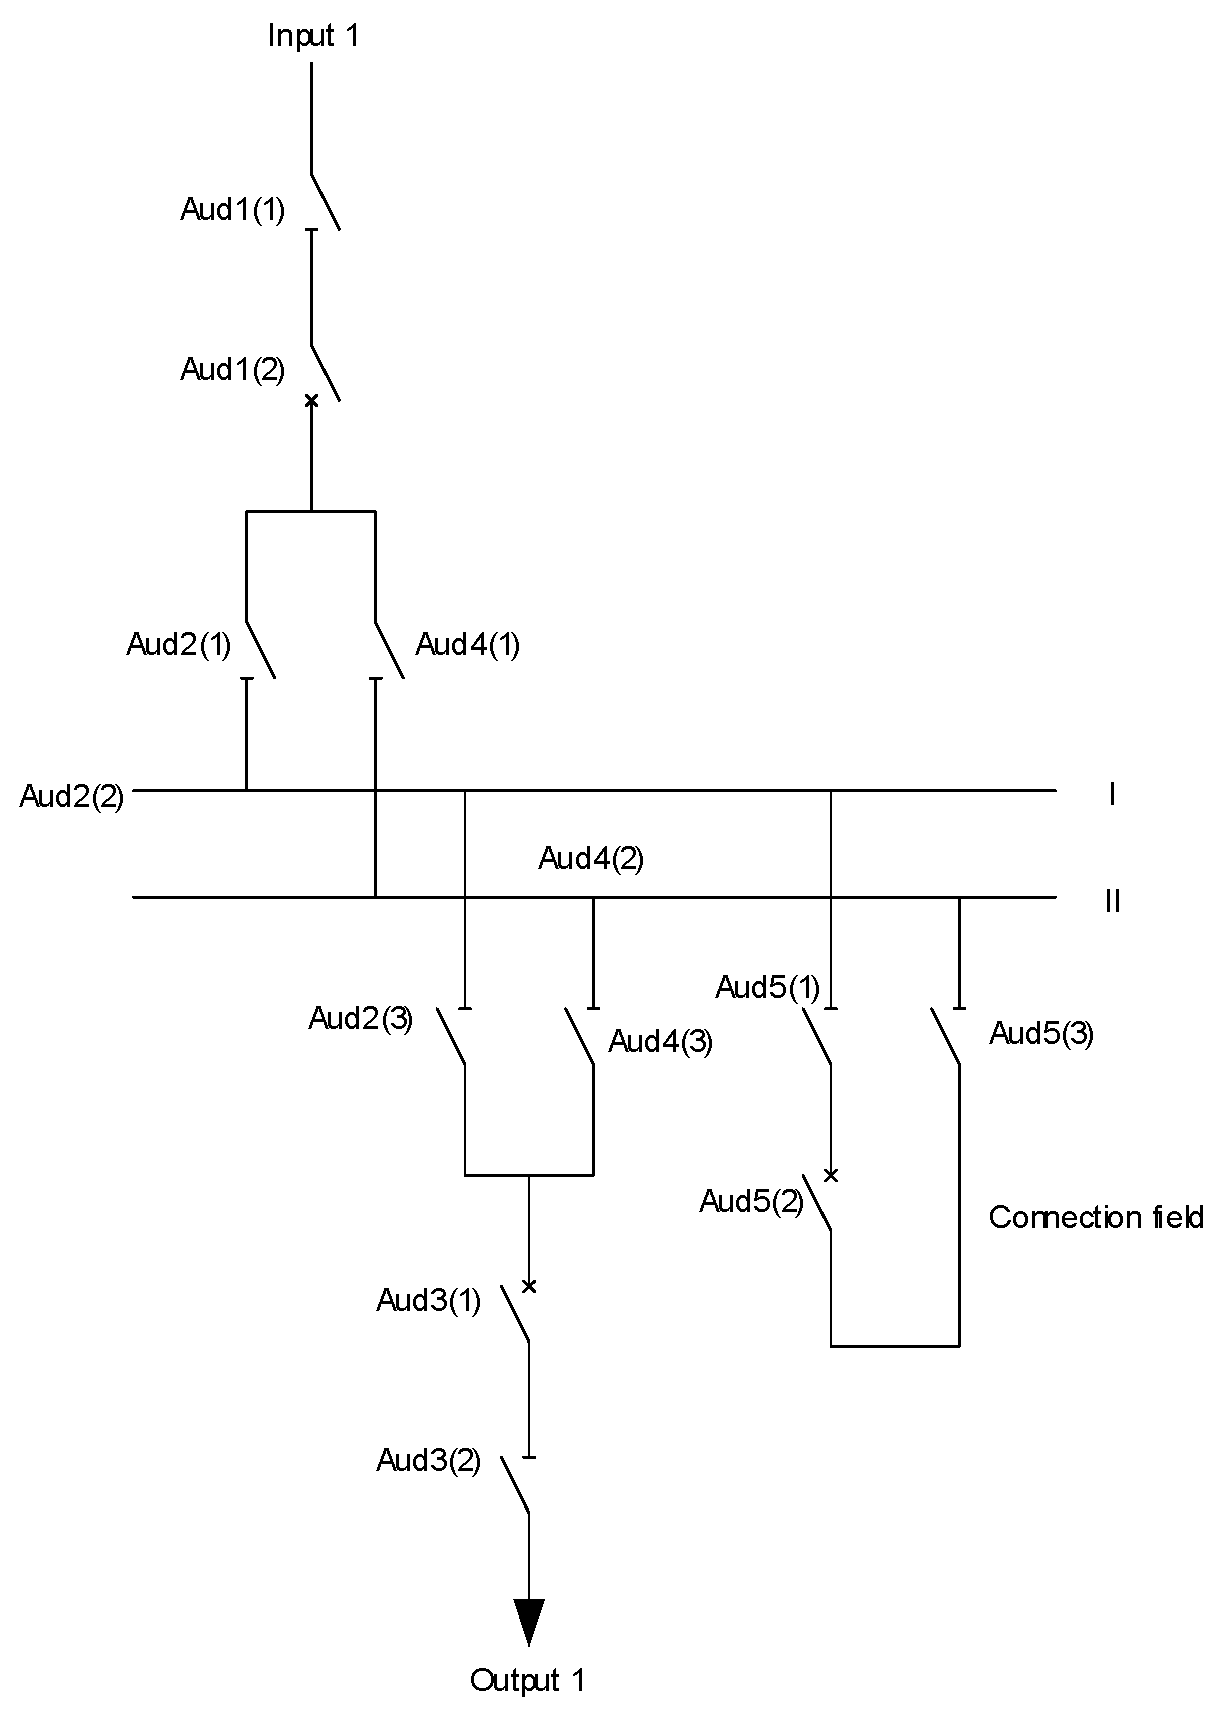
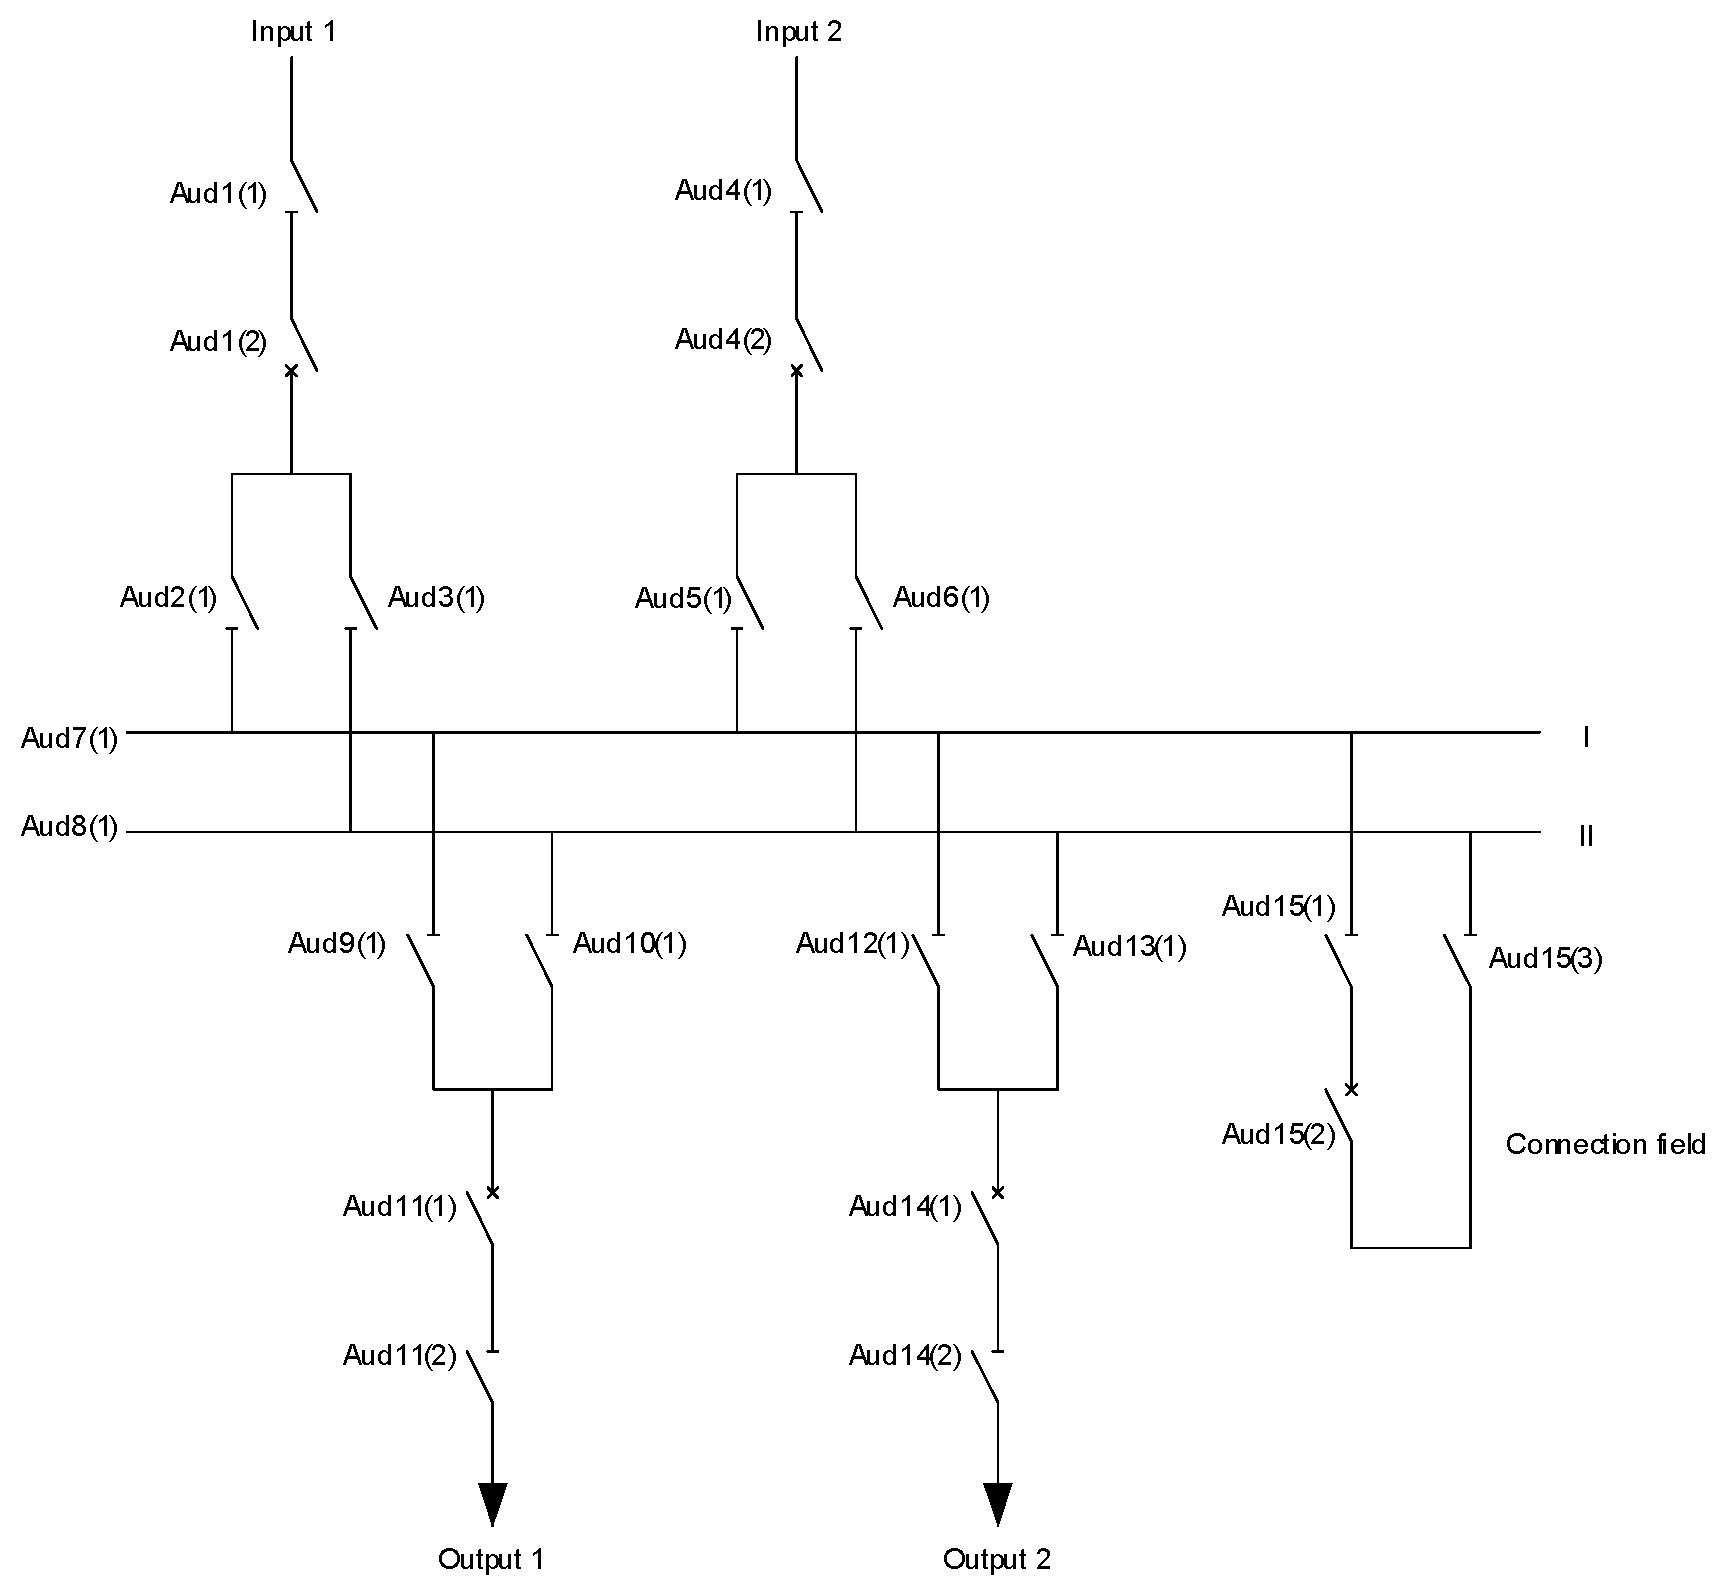
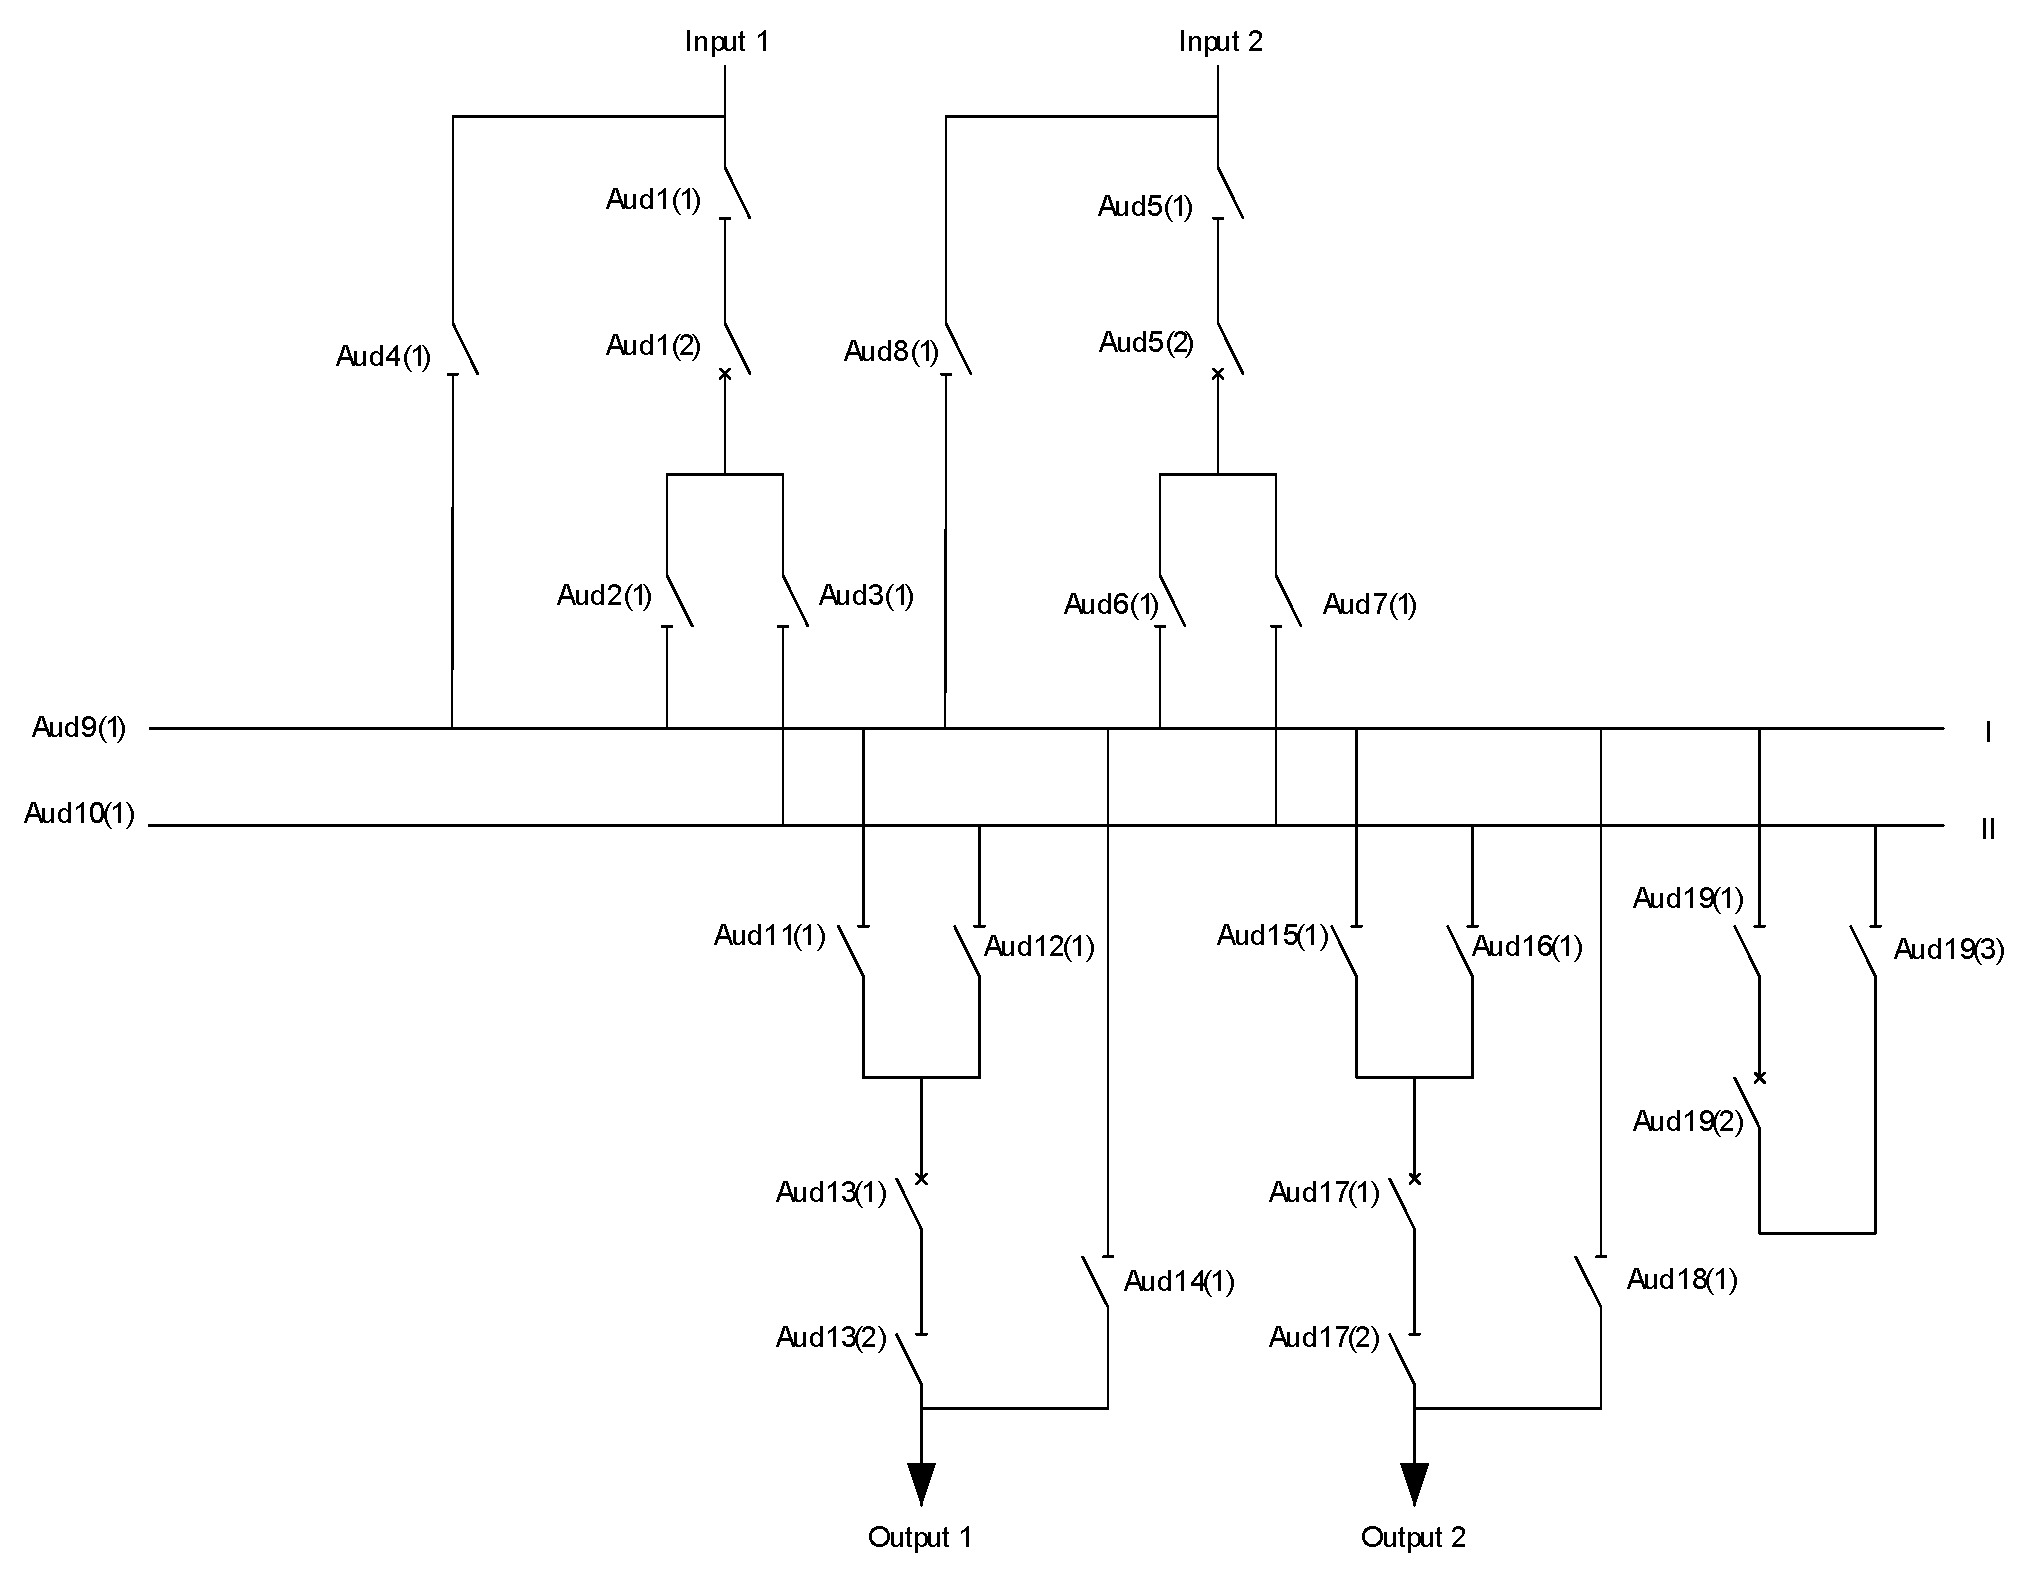
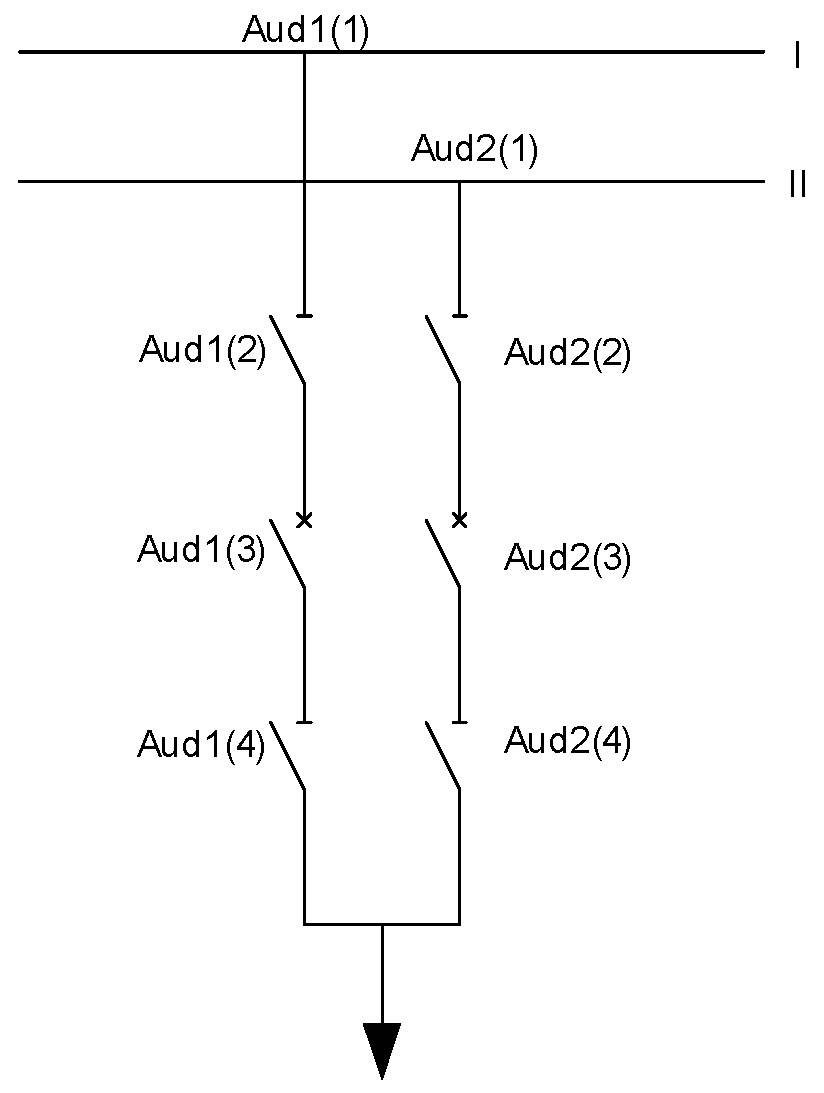
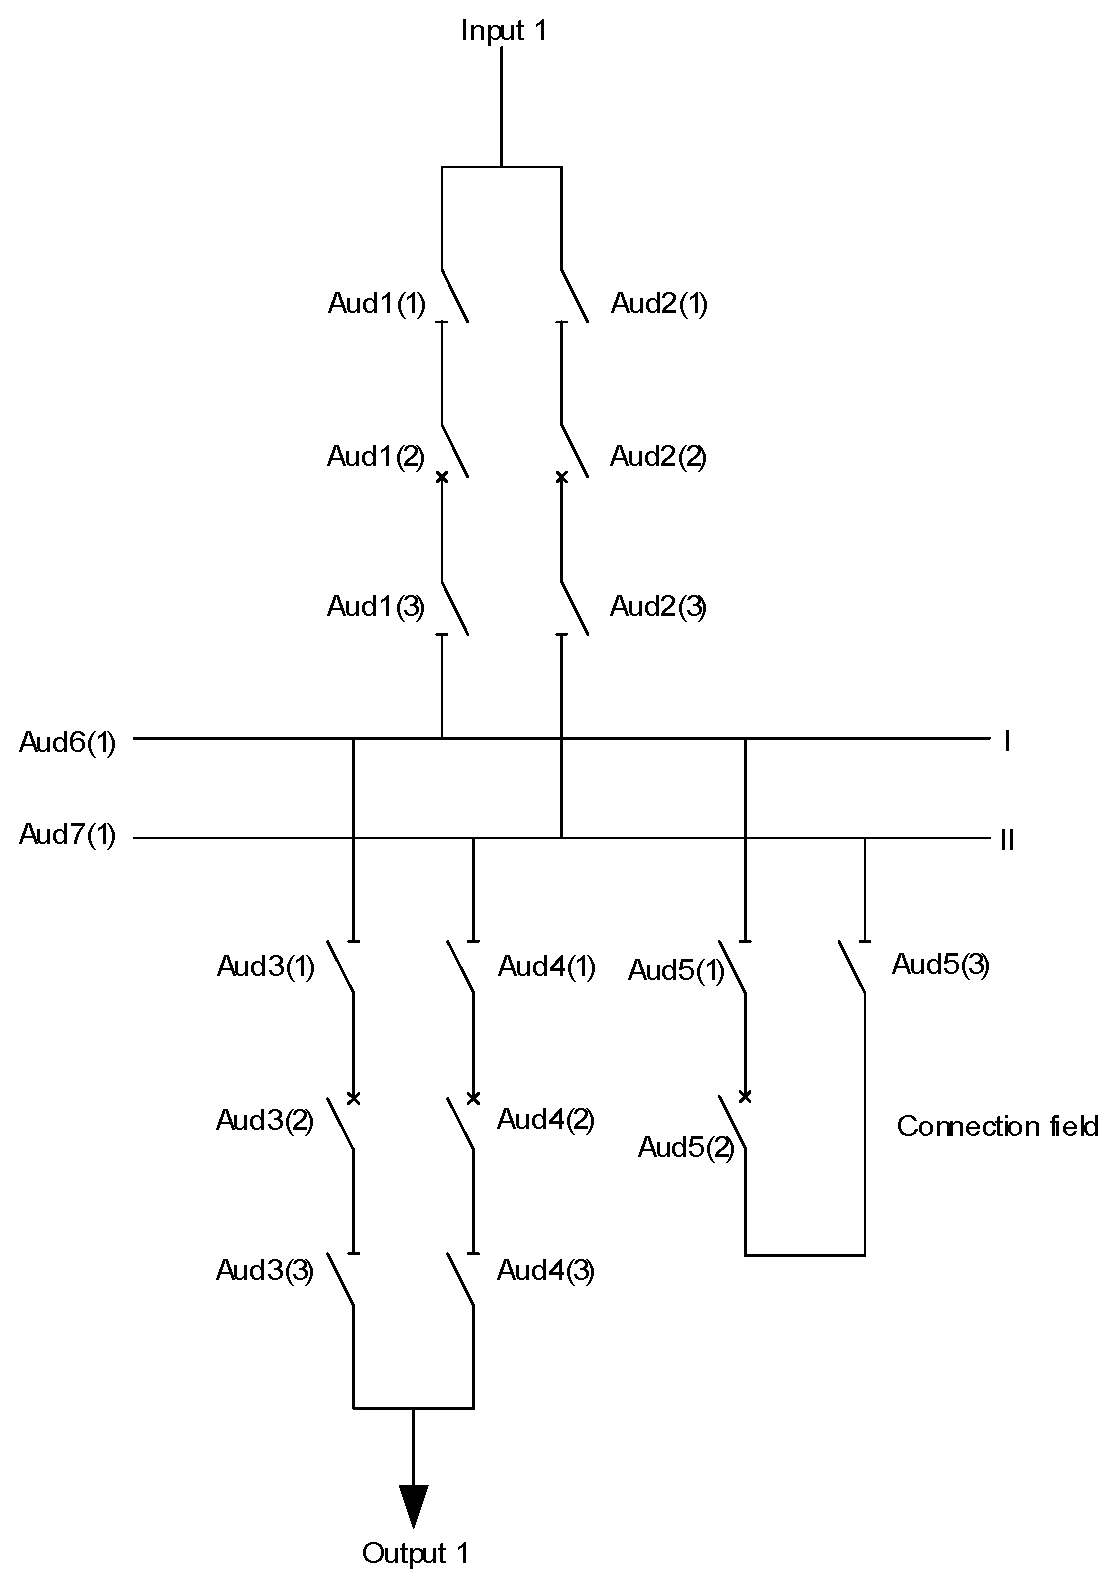
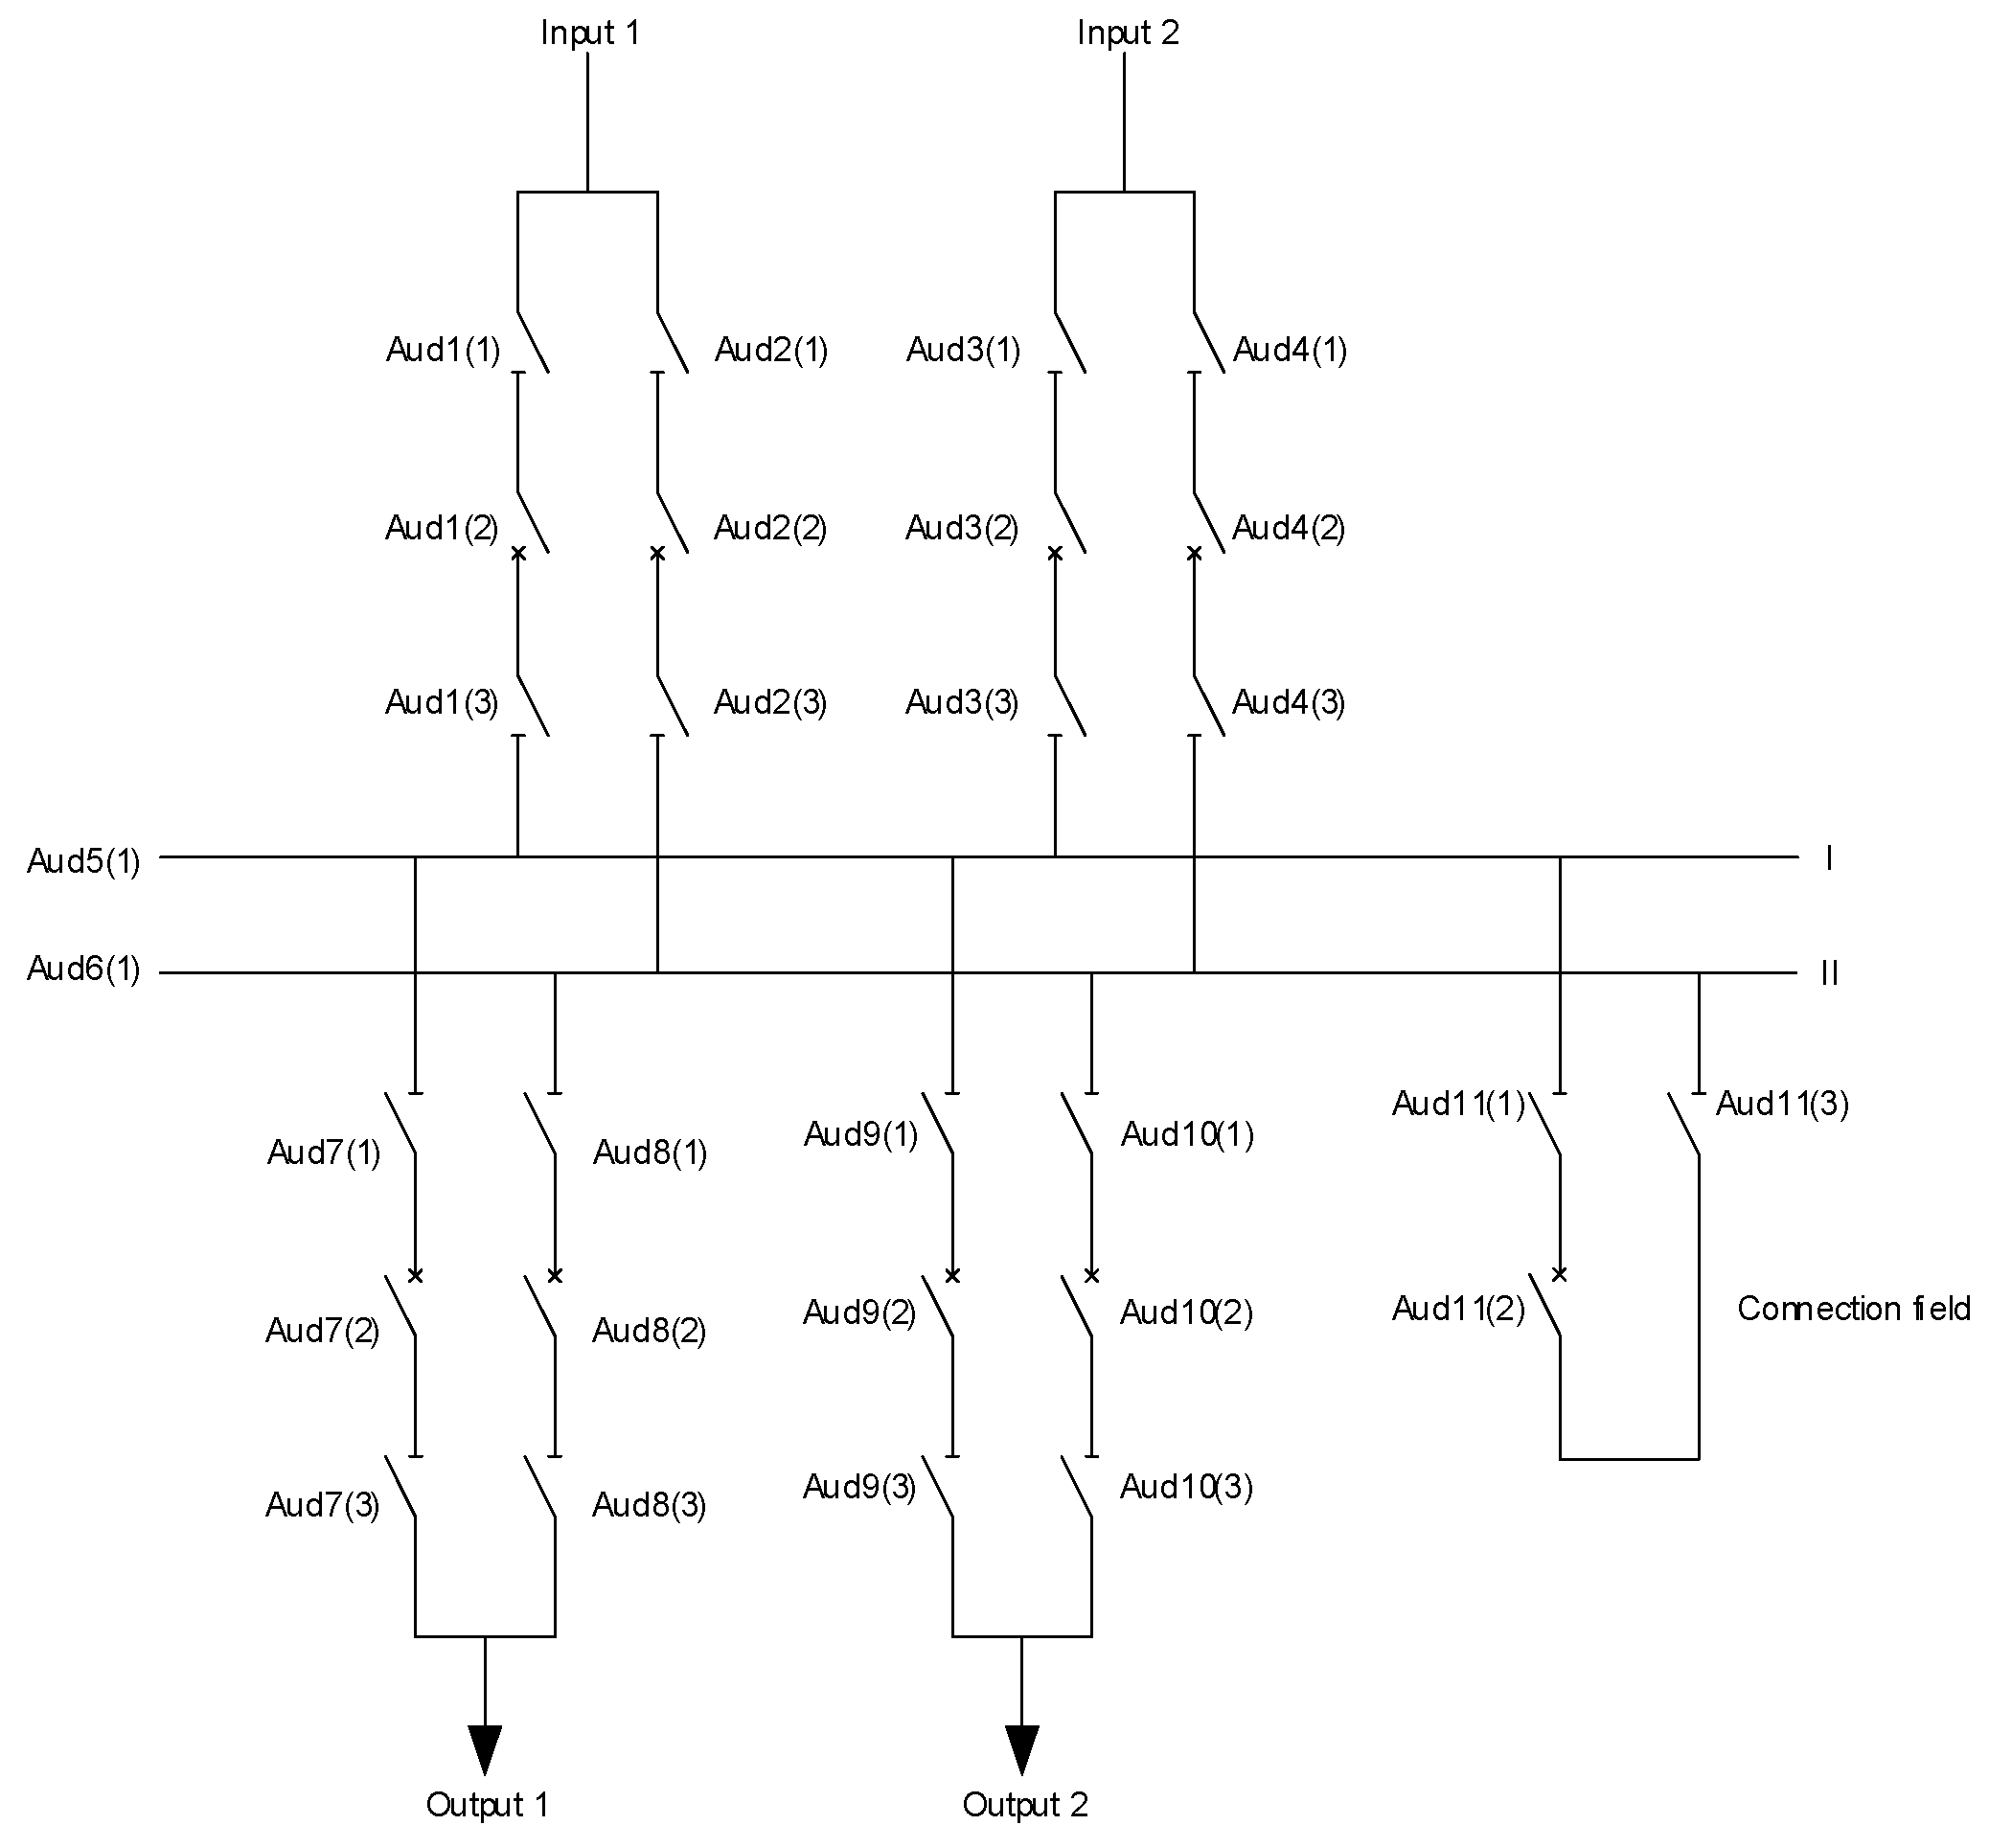
- Initialization: The program initializes by defining parameters such as the number of random attempts (n) to hit the failure interval, and the sizes of individual fields (D). It also incorporates the average unavailability of devices per field (Aud1(1)…).
- Field Creation: Each field in the switchgear system is constructed by sequentially connecting switching elements. This configuration facilitates the identification of conditions leading to power outages or partial power outages.
- Main Simulation Loop: The core simulation loop iterates over a specified number of repetitions to calculate the occurrences of power outages and partial power outages. At the start of each iteration,
- Random initial seconds of outage are generated for each field to simulate the start of potential failure intervals within the one-year timeframe.
- These initial seconds are randomized using the “rand” command to avoid bias towards specific time intervals within the year.
- The average unavailability of individual devices is added to the initial random seconds to determine the outage intervals for each field.
- Fault Interval Calculation: Using nested “for” loops, the program verifies whether the simulated outage intervals fall within the one-year period. If an outage or fault interval exceeds the one-year timeframe, it adjusts the interval accordingly to ensure accuracy.
- Probability Calculation: Upon successfully hitting the fault intervals within the specified number of attempts (n), the program calculates the probabilities of failures for each field.
- Outcome Determination: The simulation concludes by assessing whether the combination of field hits results in a complete power outage or partial power outage, depending on the switchgear configuration.
4. Results and Discussion
4.1. Single-Busbar Systems
4.2. Double-Busbar Systems
4.3. Switchgear with Ring-Type Power Supply
5. Conclusions
Author Contributions
Funding
Data Availability Statement
Conflicts of Interest
References
- Zhou, N.; Xu, Y. A Multi-Evidence Fusion Based Integrated Method for Health Assessment of Medium Voltage Switchgears in Power Grid. IEEE Trans. Power Deliv. 2023, 38, 1406–1415. [Google Scholar] [CrossRef]
- Iliev, A.; Dimitrov, D.; Dimishkovska, N. Evaluation of Reliability of Power Substations Considering the Uncertainty of the Distributed Generation. In Proceedings of the 2020 55th International Scientific Conference on Information, Communication and Energy Systems and Technologies (ICEST), Niš, Serbia, 10–12 September 2020; pp. 123–126. [Google Scholar] [CrossRef]
- Zhou, N.; Xu, Y. A Prioritization Method for Switchgear Maintenance Based on Equipment Failure Mode Analysis and Integrated Risk Assessment. IEEE Trans. Power Deliv. 2024, 39, 728–739. [Google Scholar] [CrossRef]
- Abud, T.P.; Augusto, A.A.; Fortes, M.Z.; Maciel, R.S.; Borba, B.S.M.C. State of the Art Monte Carlo Method Applied to Power System Analysis with Distributed Generation. Energies 2023, 16, 394. [Google Scholar] [CrossRef]
- Li, Z.; Wu, W.; Tai, X.; Zhang, B. Optimization model-based reliability assessment for distribution networks considering detailed placement of circuit breakers and switches. IEEE Trans. Power Syst. 2020, 35, 3991–4004. [Google Scholar] [CrossRef]
- Zhou, N.; Xu, Y.; Cho, S.; Wee, C.T. A Systematic Review for Switchgear Asset Management in Power Grids: Condition Monitoring, Health Assessment, and Maintenance Strategy. IEEE Trans. Power Deliv. 2023, 38, 3296–3311. [Google Scholar] [CrossRef]
- Khoddam, M.; Sadeh, J.; Pourmohamadiyan, P. Performance evaluation of circuit breaker electrical contact based on dynamic resistance signature and using health index. IEEE Trans. Compon. Packag. Manuf. Technol. 2016, 6, 1505–1512. [Google Scholar] [CrossRef]
- Xiong, Q.; Zhao, J.; Guo, Z.; Feng, X.; Liu, H.; Zhu, L.; Ji, S. Mechanical defects diagnosis for gas insulated switchgear using acoustic imaging approach. Appl. Acoust. 2021, 174, 107784. [Google Scholar] [CrossRef]
- Yan, Y.; Ren, S.; Lu, Y.; Yang, S.; Zhao, K.; Li, H. Efficient and low-cost PD monitoring and locating system for MV switchgears using TEV detectors. IEEE Trans. Power Deliv. 2021, 36, 3266–3269. [Google Scholar] [CrossRef]
- Xiao, X.; Guo, J.; Yang, J.; Fang, X.; Shi, M.; Liu, Y.; Guo, M.; Yang, Z.; Wu, Z. A novel switchgear state assessment framework based on improved fuzzy C-means clustering method with deep belief network. Front. Energy Res. 2023, 11, 1335184. [Google Scholar] [CrossRef]
- Urgun, D.; Singh, C. Power System Reliability Evaluation using Monte Carlo Simulation and Multi Label Classifier. In Proceedings of the 2018 20th National Power Systems Conference (NPSC), Tiruchirappalli, India, 14–16 December 2018; pp. 1–6. [Google Scholar] [CrossRef]
- Hasan, K.N.; Preece, R.; Milanović, J.V. Existing Approaches and Trends in Uncertainty Modelling and Probabilistic Stability Analysis of Power Systems with Renewable Generation. Renew. Sustain. Energy Rev. 2019, 101, 168–180. [Google Scholar] [CrossRef]
- Kalos, M.H.; Whitlock, P.A. Monte Carlo Methods; Wiley-VCH: Weinheim, Germany, 1986. [Google Scholar]
- Available online: https://www.eles.si/Portals/0/Documents/porocila/letna-porocila/Porocilo%20o%20obratovanju%202023.pdf (accessed on 20 March 2024).


| Device | Event | Average Outage Frequency (Per year) | Average Outage Duration (hours) | Average Device Unavailability (hours/year) |
|---|---|---|---|---|
| Circuit breaker | Stochastic fault/error | 2500 | 30 | 0.012 |
| Planned maintenance | 15 | 10 | 0.667 | |
| Disconnector | Stochastic fault/error | 614 | 32 | 0.052 |
| Planned maintenance | 5 | 6 | 1.2 | |
| Withdrawable circuit breaker | Stochastic fault/error | 2500 | 15 | 0.006 |
| Planned maintenance | 15 | 4 | 0.267 | |
| Time of separation of the withdrawable circuit breaker from the busbars | 0.1 | |||
| Time of separation of the circuit breaker from the busbars | 4 | |||
| Configuration | Power Outages/1,000,000 Attempts | Partial Power Outages/1,000,000 Attempts |
|---|---|---|
| Single-busbar system | 380.4 | / |
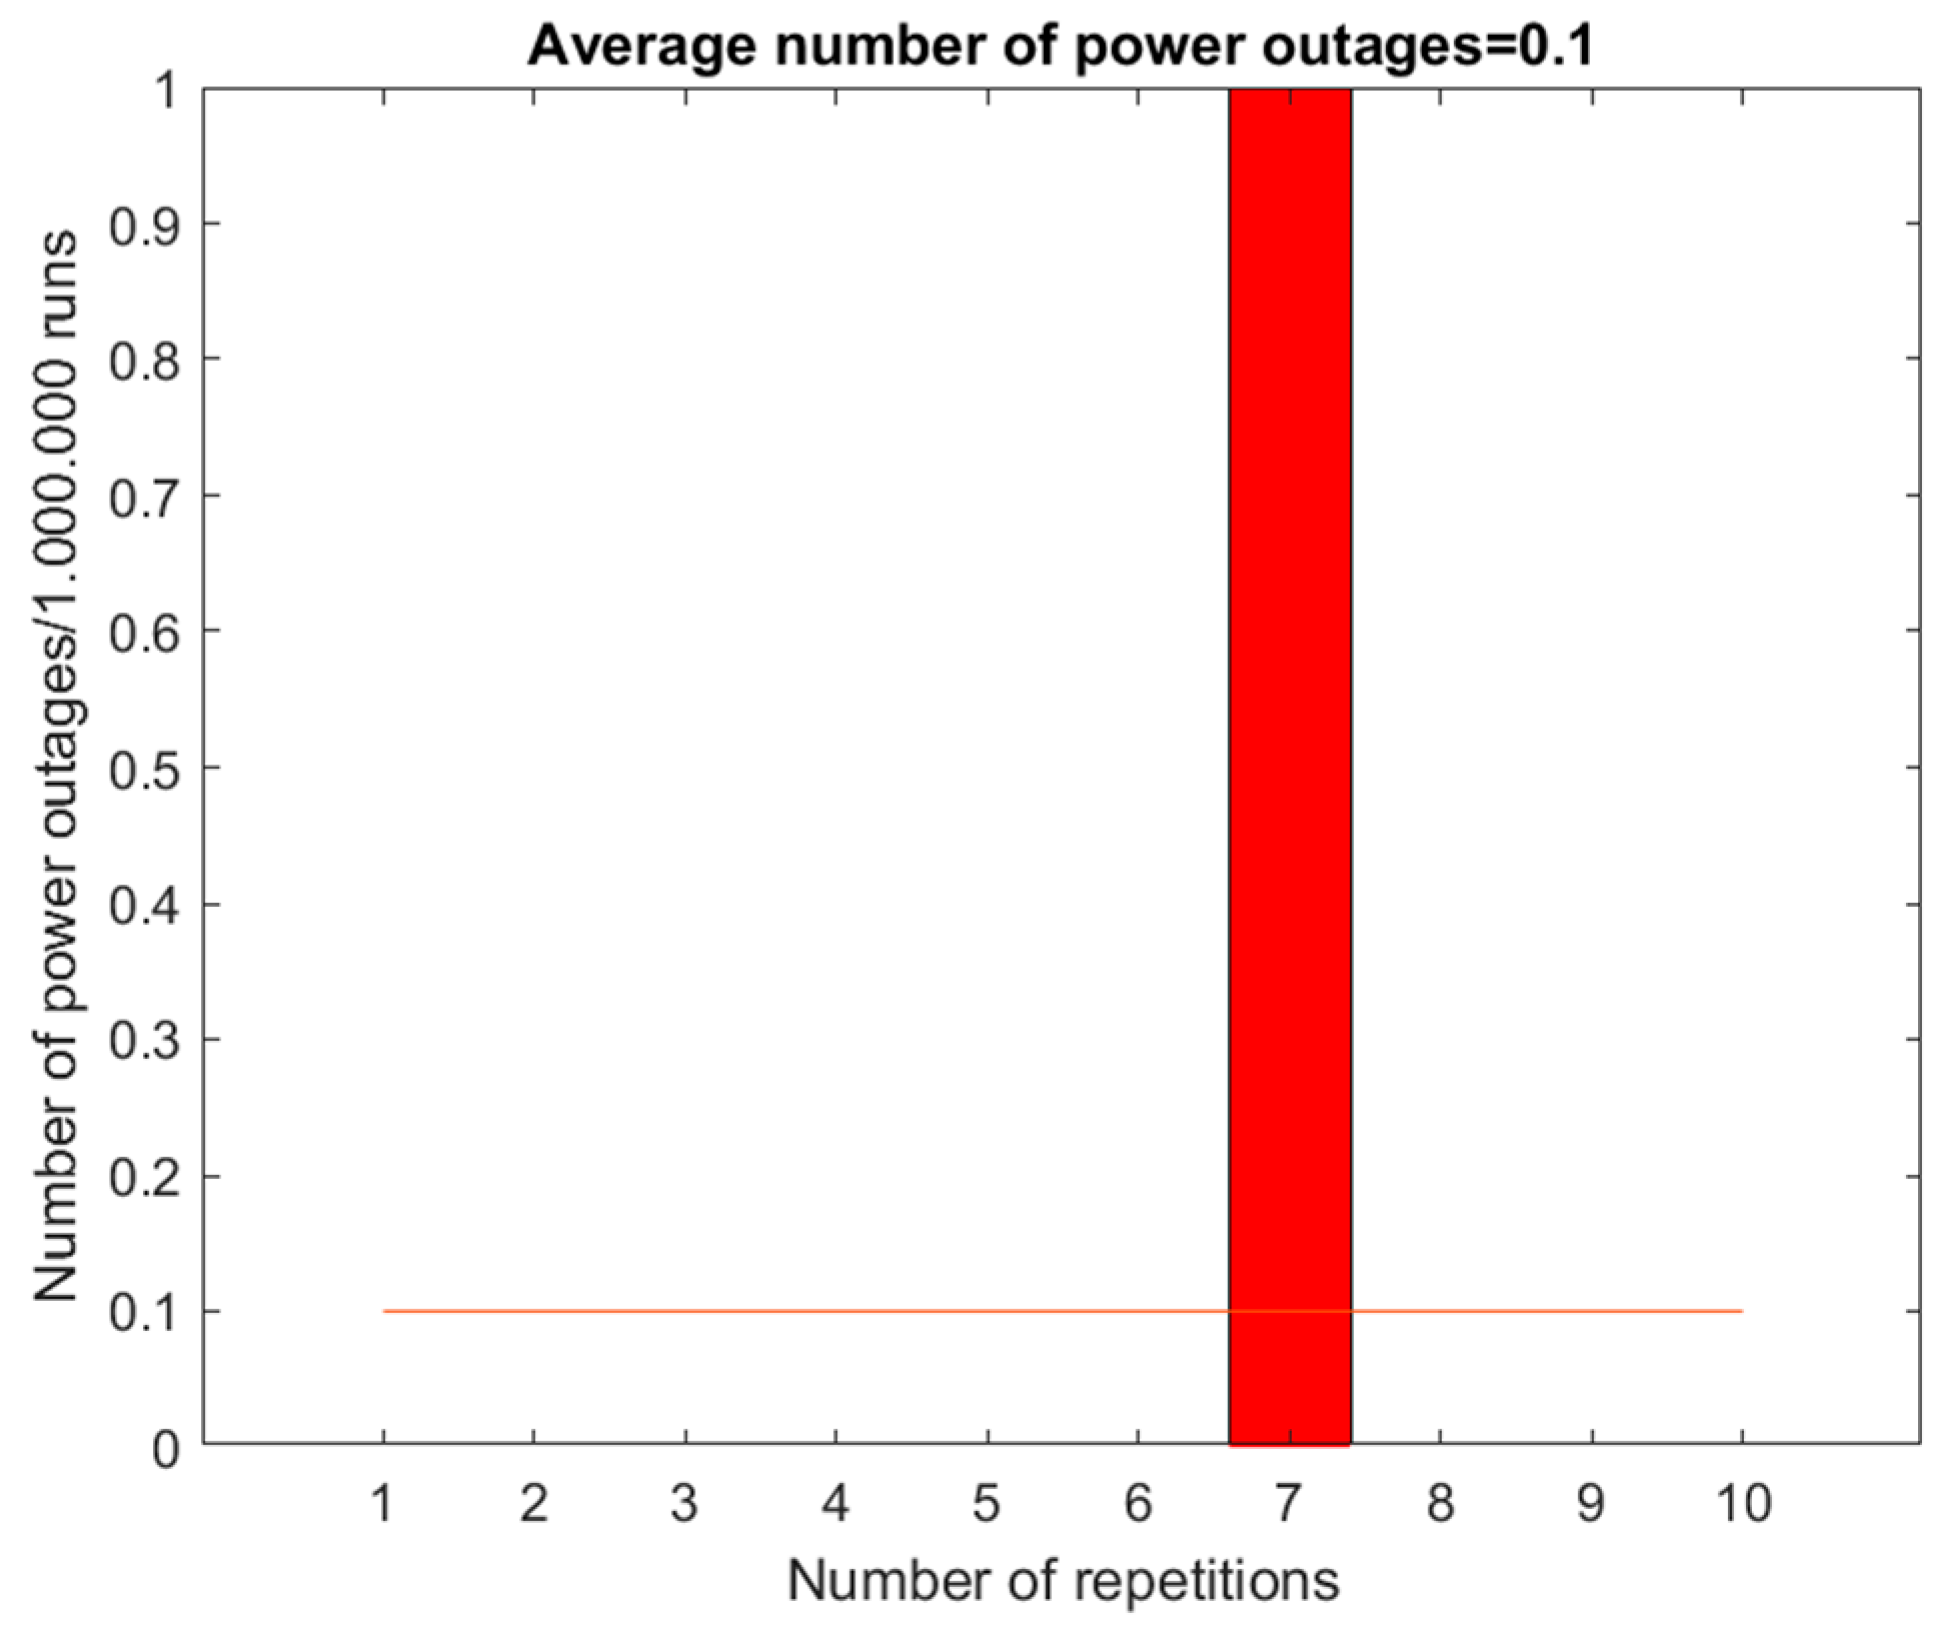
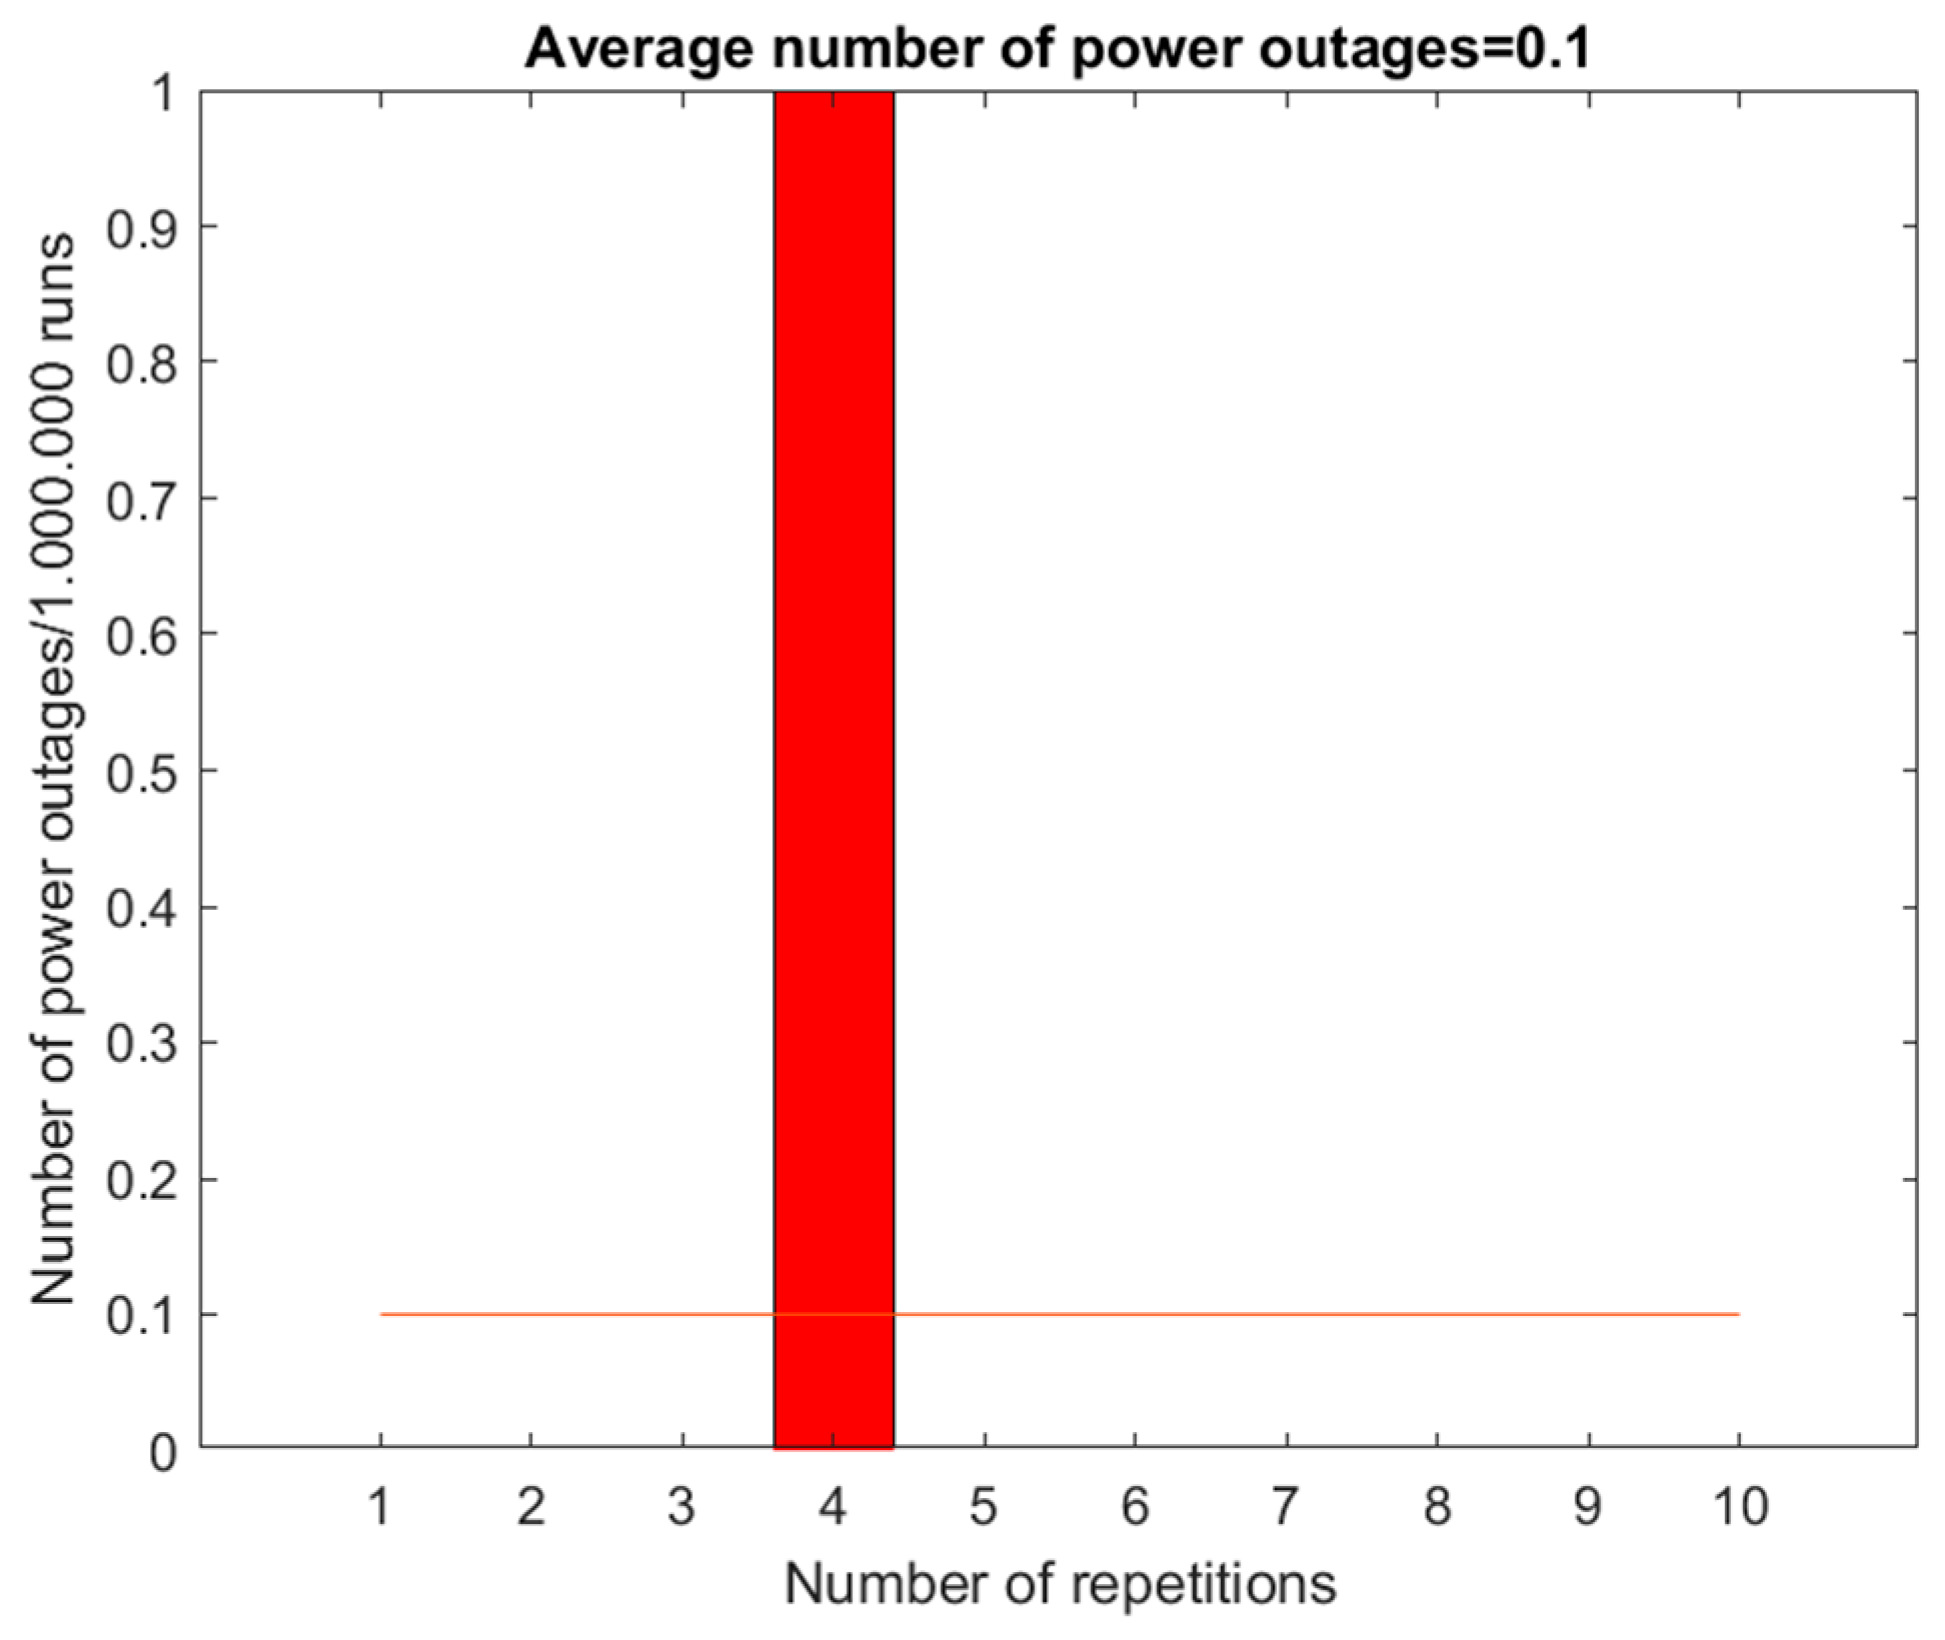
| Single-busbar system—auxiliary bus | 0.1 | / |
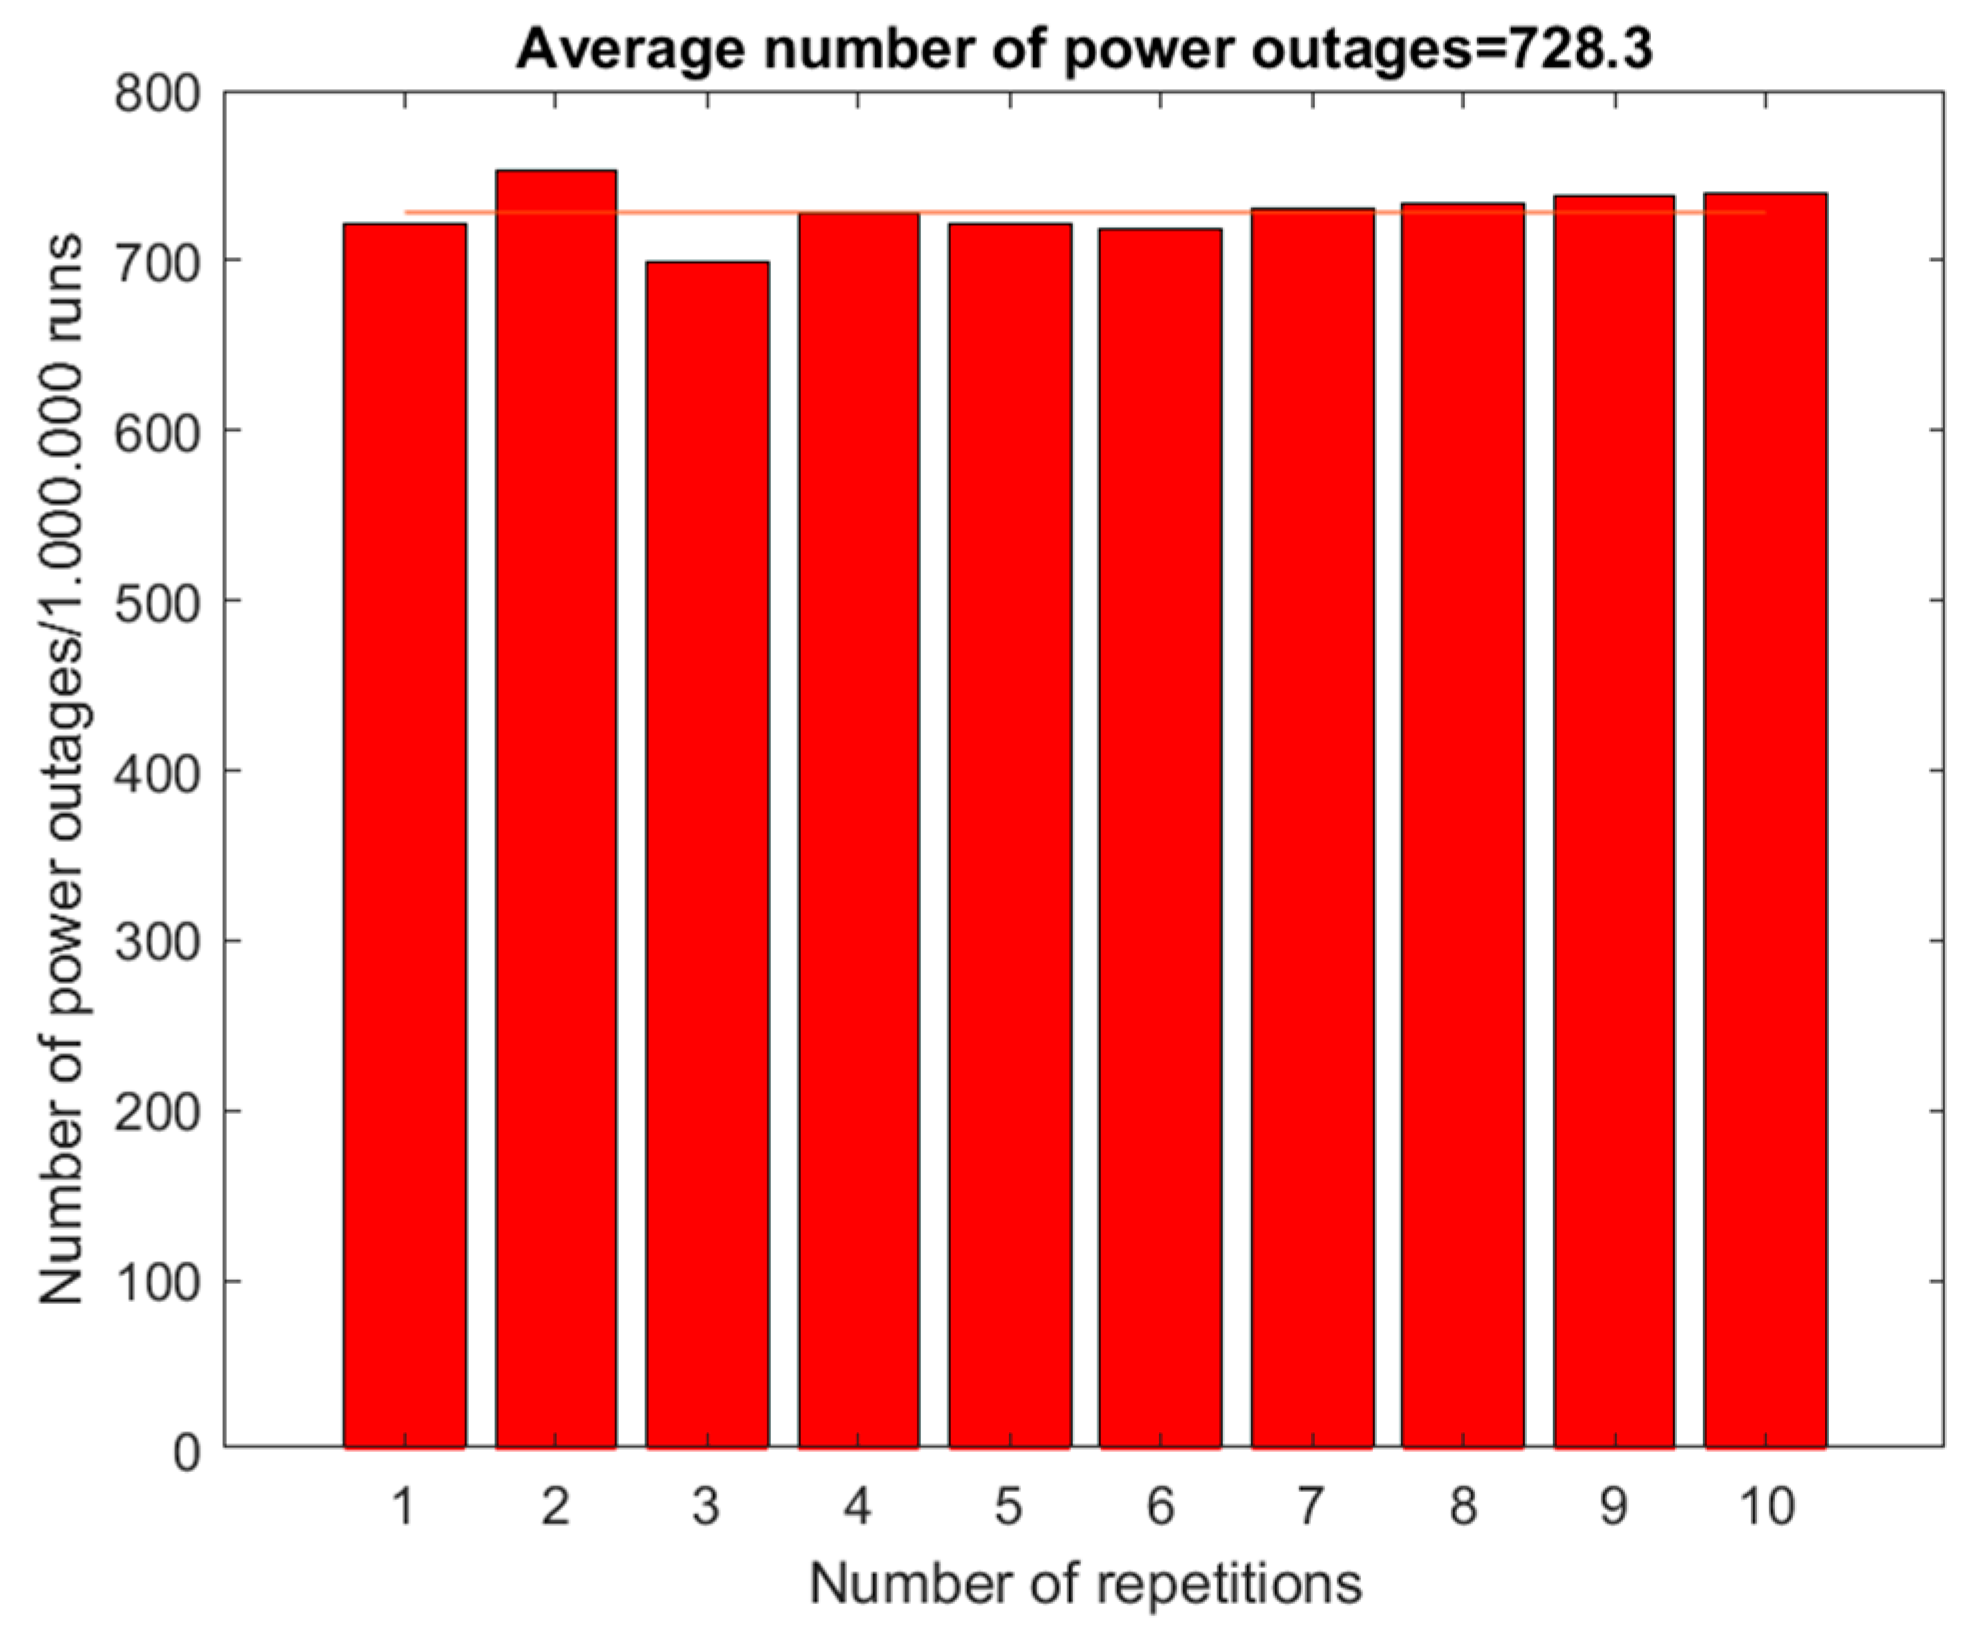
| Single-busbar system—one active incoming and outgoing field | 728.3 | / |
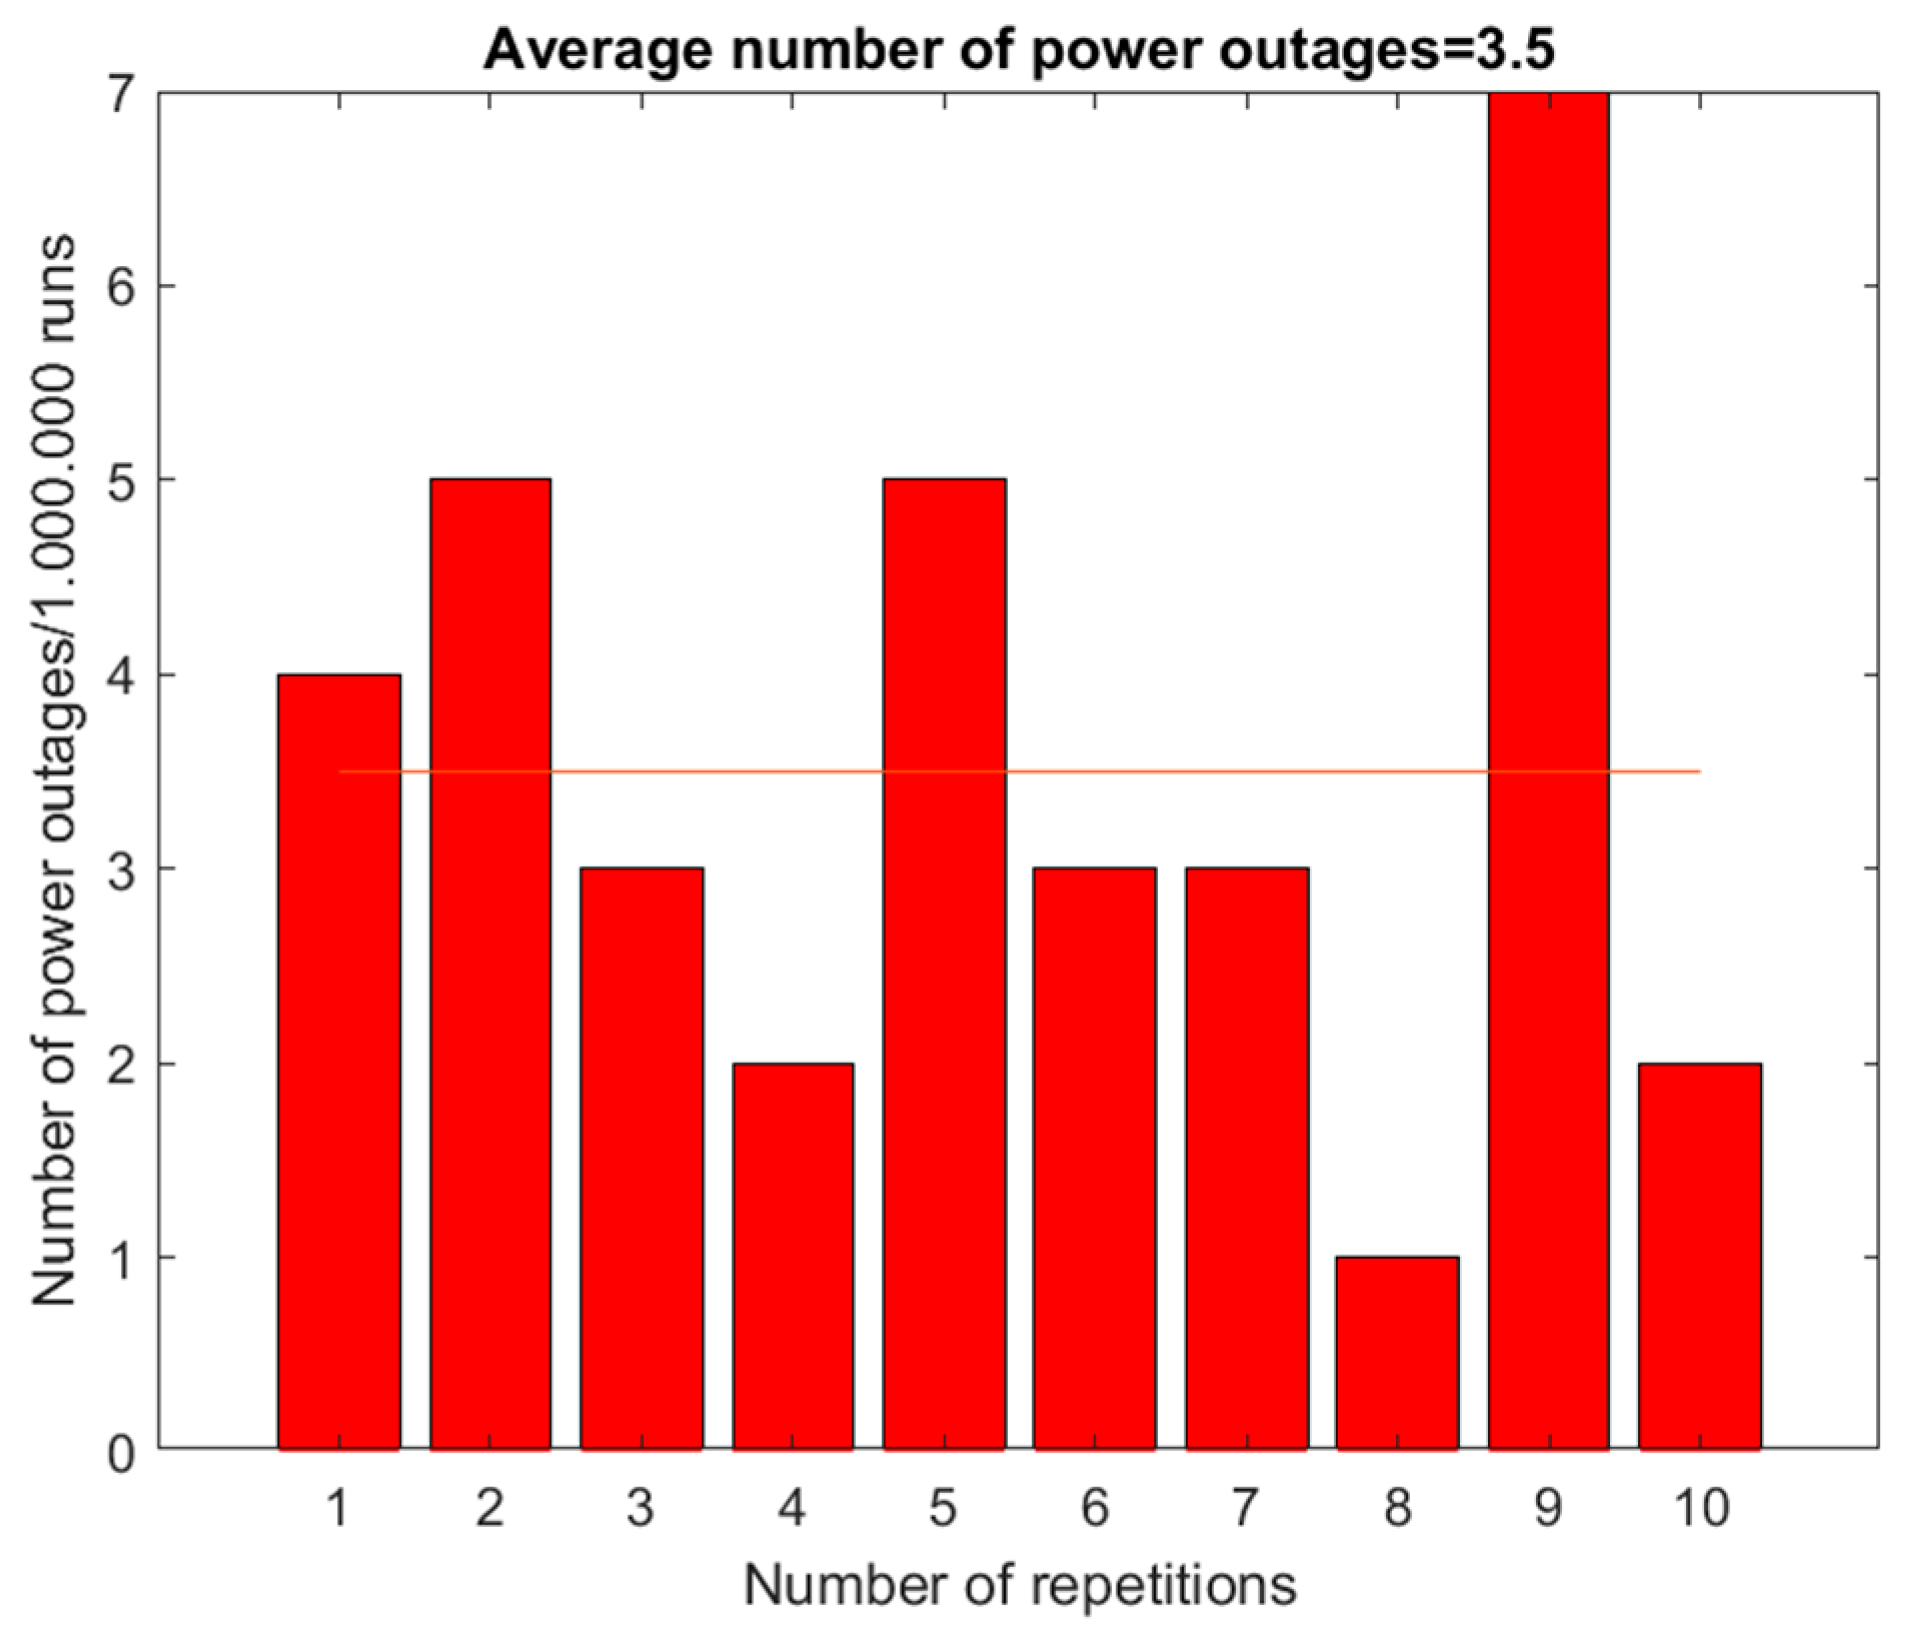
| Single-busbar system with two active incoming and outgoing fields | 3.6 | 724.9 |
| Single-busbar system with one active incoming and outgoing field with an auxiliary bus | 0.1 | / |
| Single-busbar system with two active incoming and outgoing fields with an auxiliary bus | 0 | 0 |
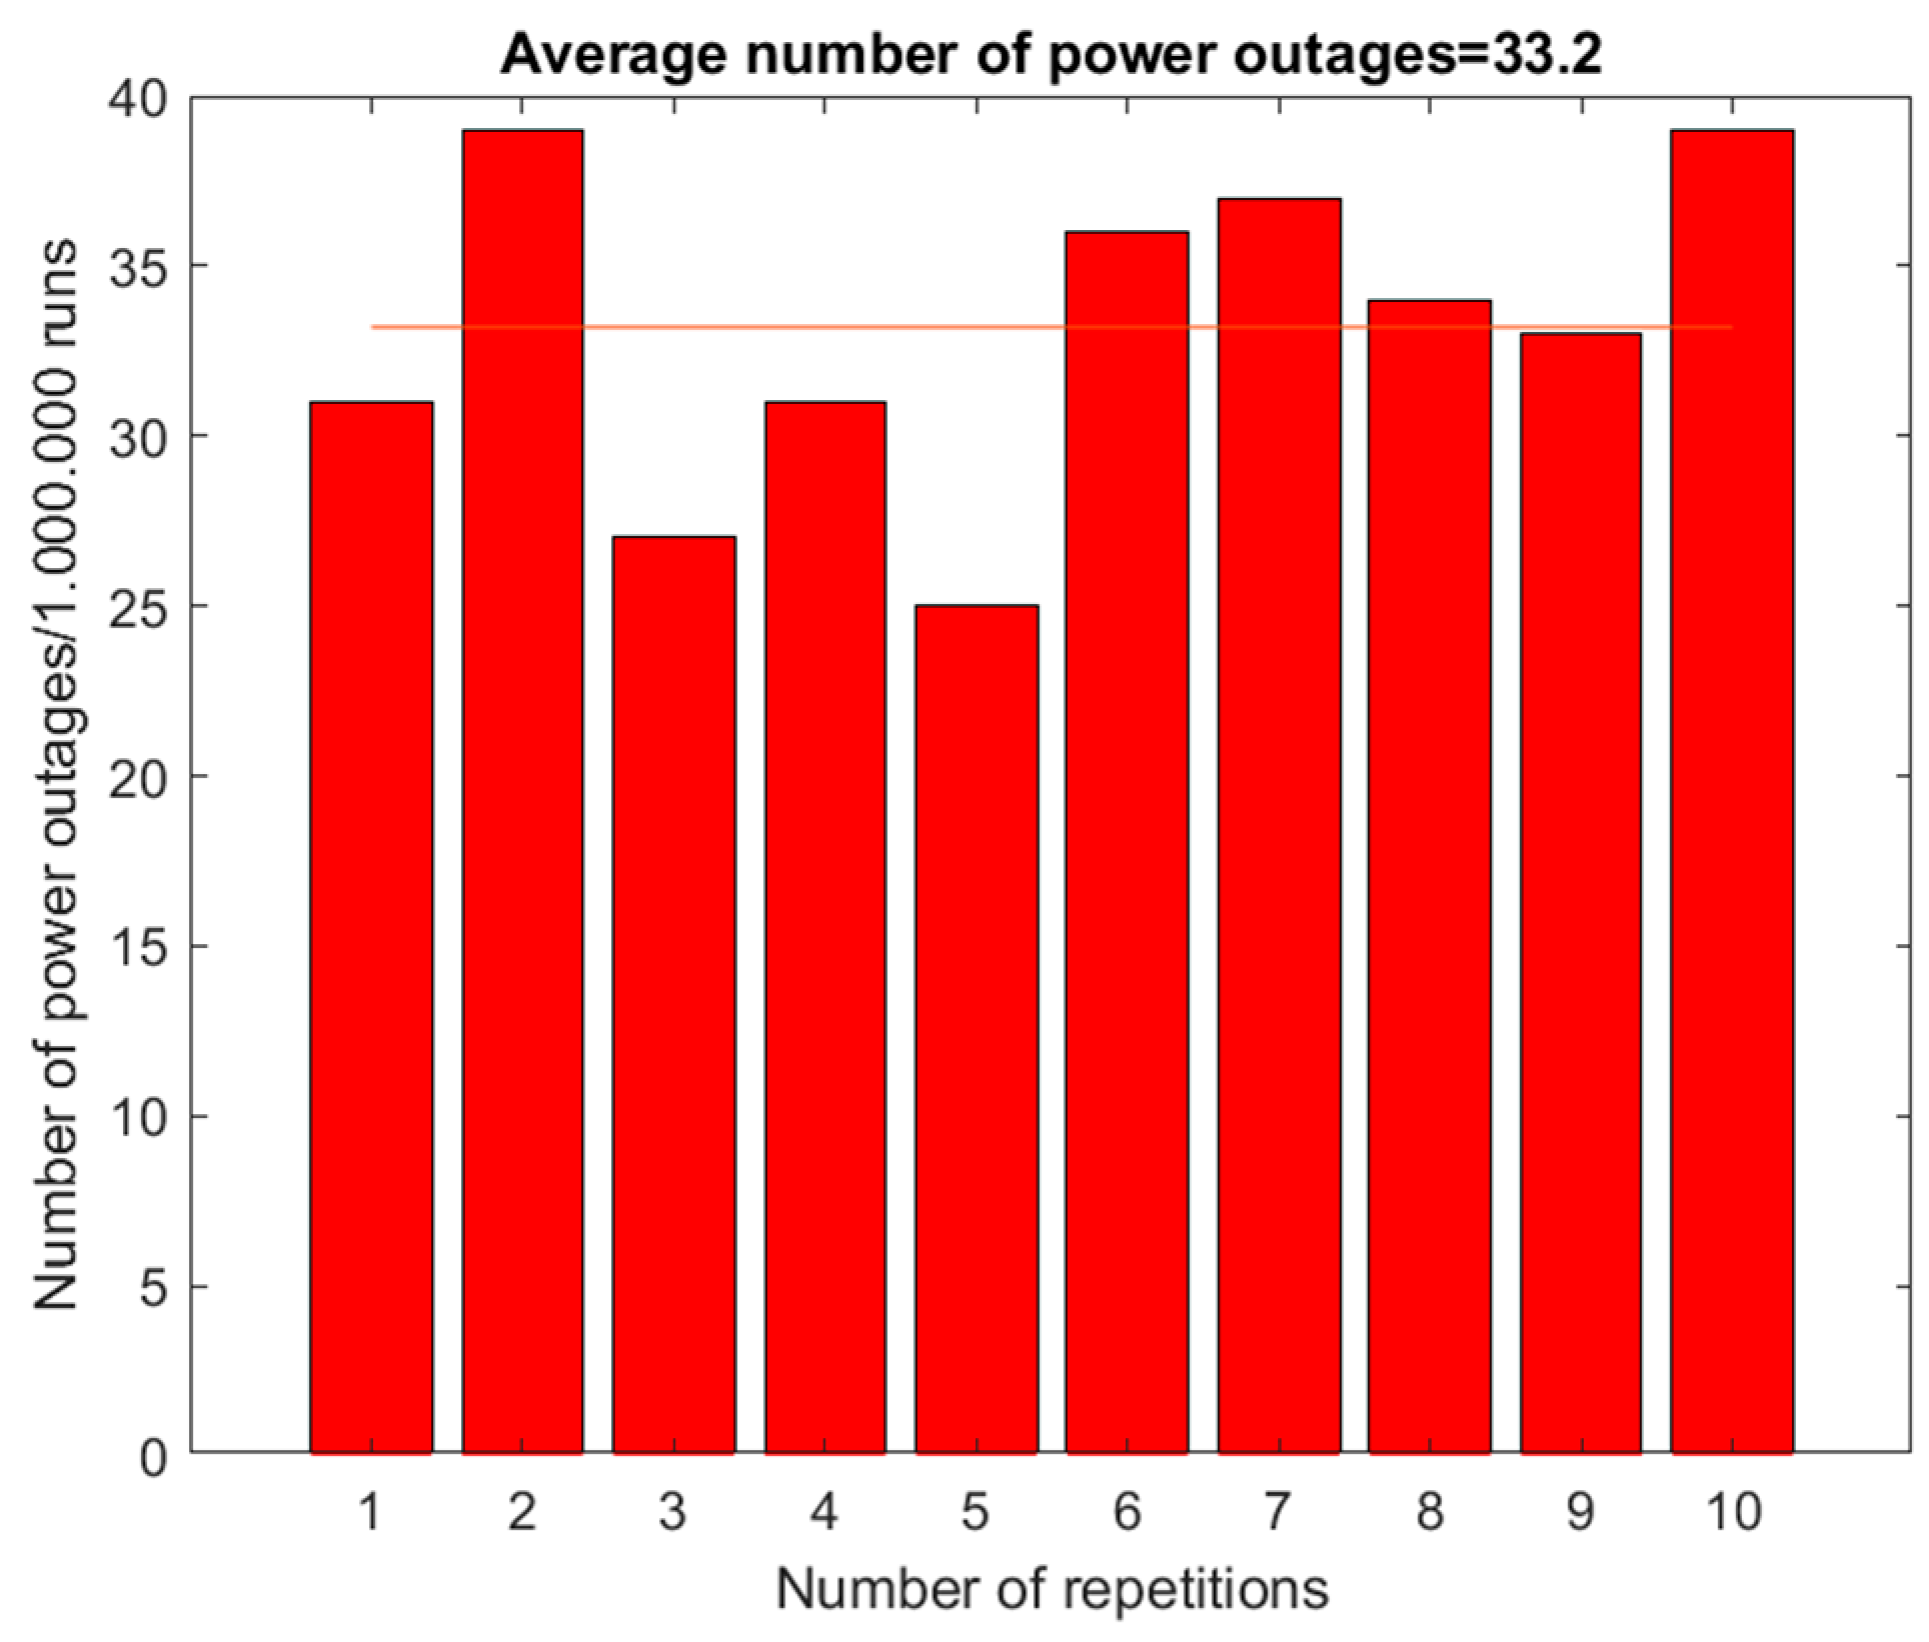
| Single-busbar system with withdrawable circuit breaker | 33.2 | / |
| Single-busbar system with withdrawable circuit breaker with one active incoming and outgoing field | 65.3 | / |
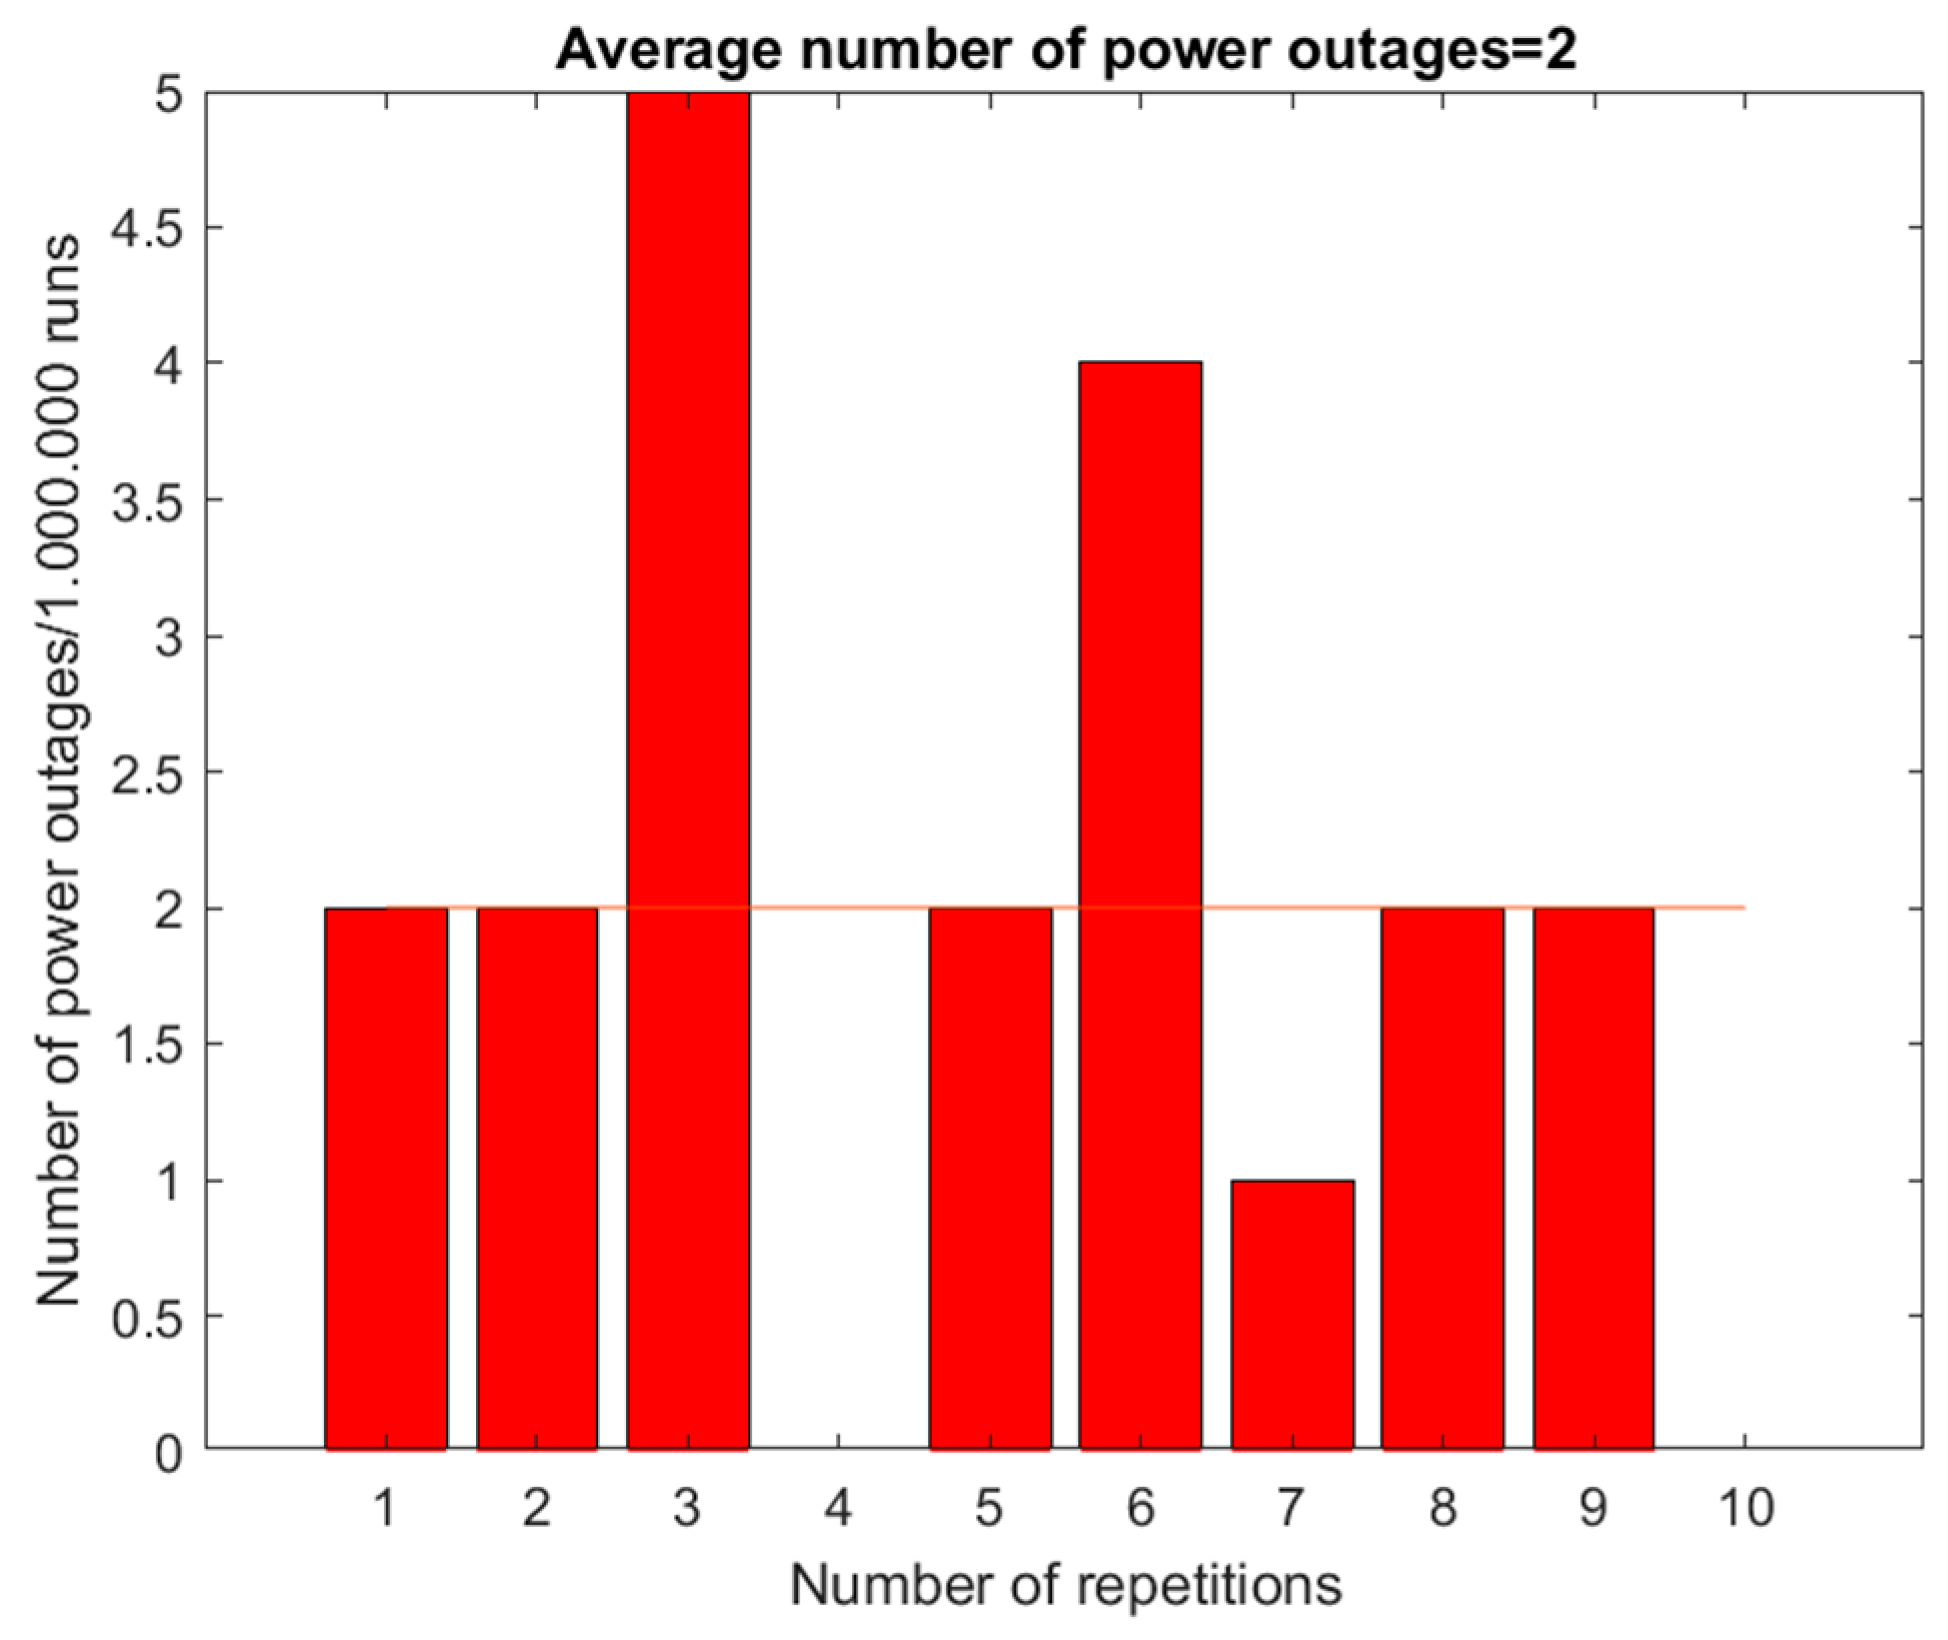
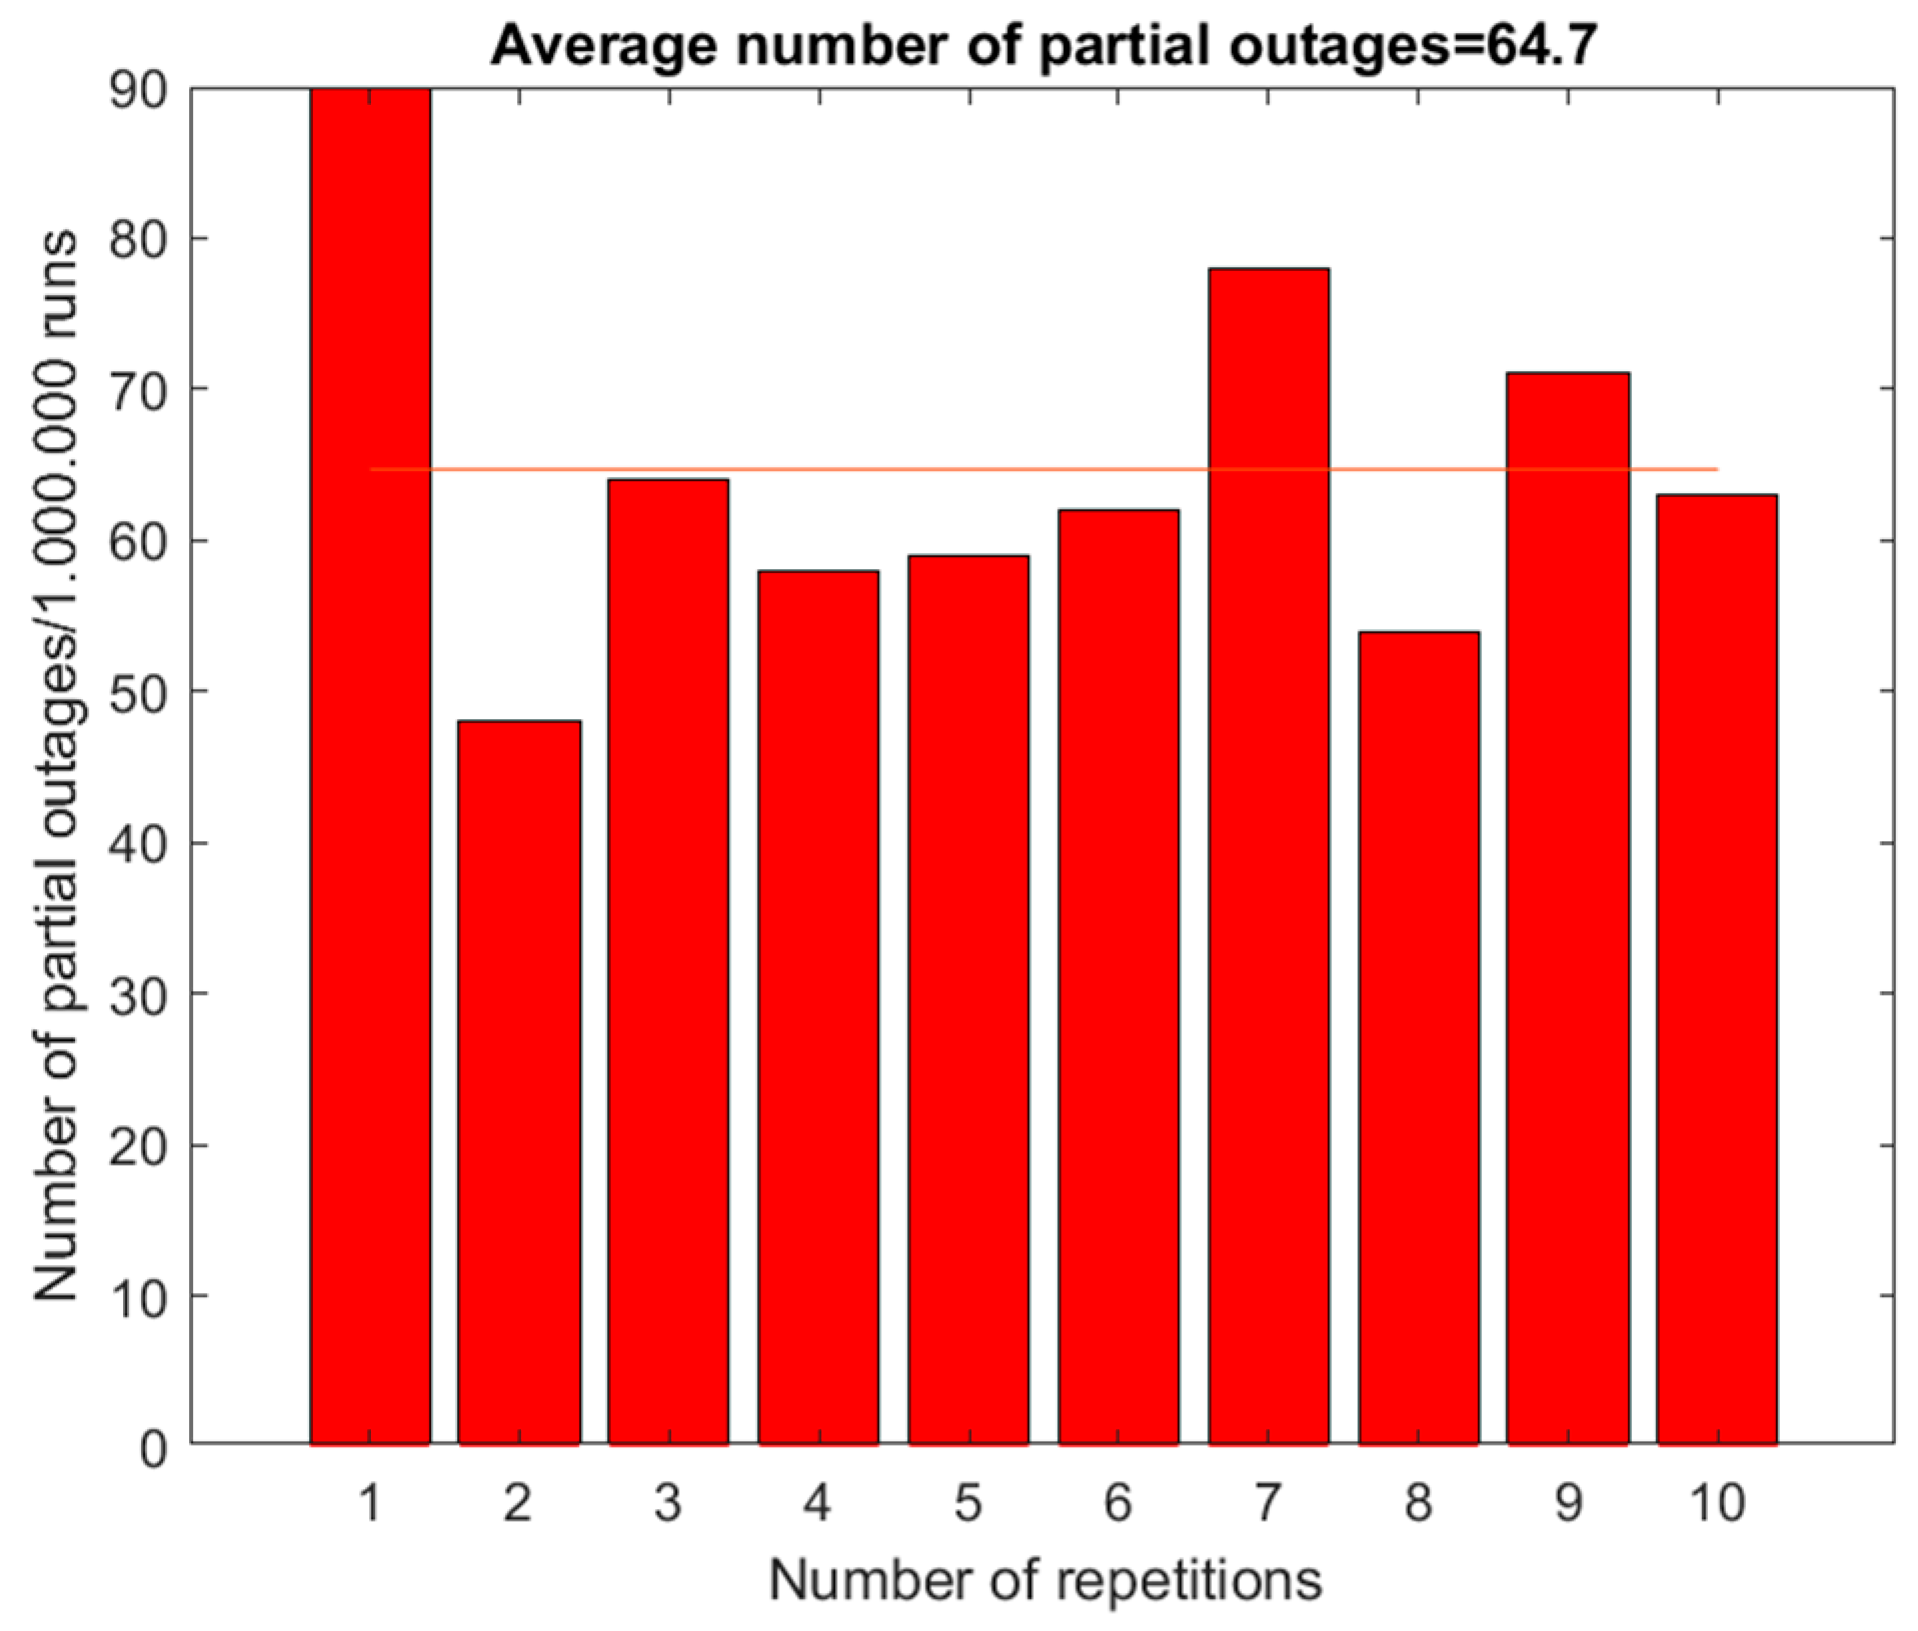
| Single-busbar system with withdrawable circuit breaker with two active incoming and outgoing fields | 2 | 64.7 |
| Configuration | Power Outages/1,000,000 Attempts | Partial Power Outages/1,000,000 Attempts |
|---|---|---|
| Double-busbar system | 222.6 | / |
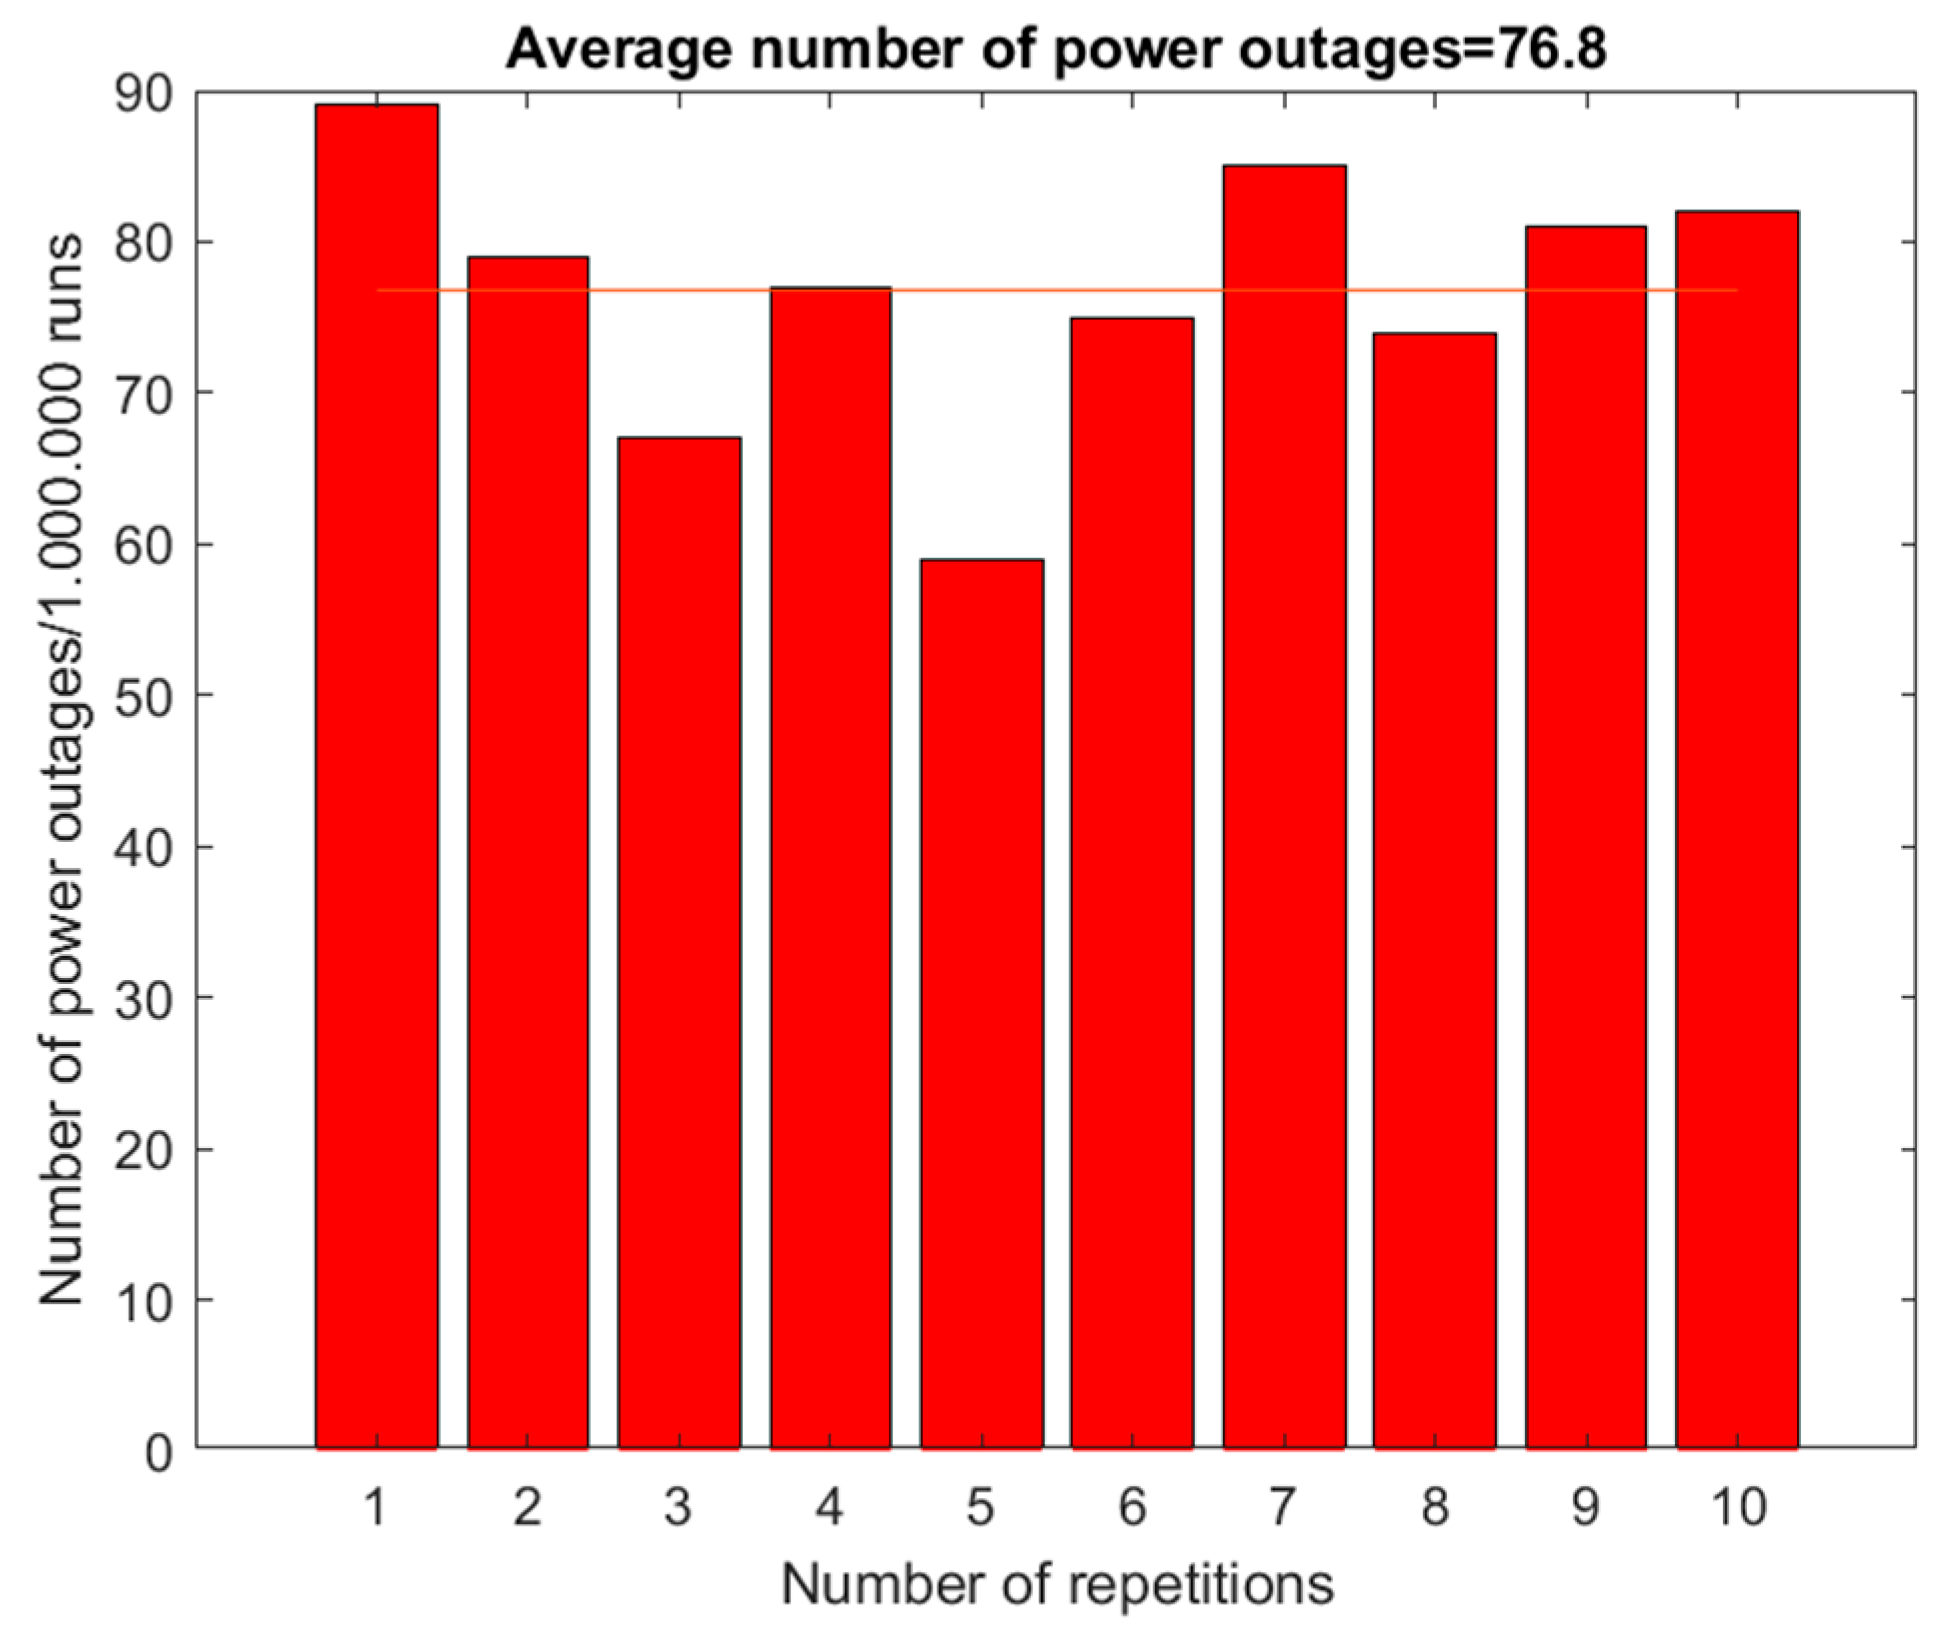
| Double-busbar system with auxiliary bus | 76.8 | / |
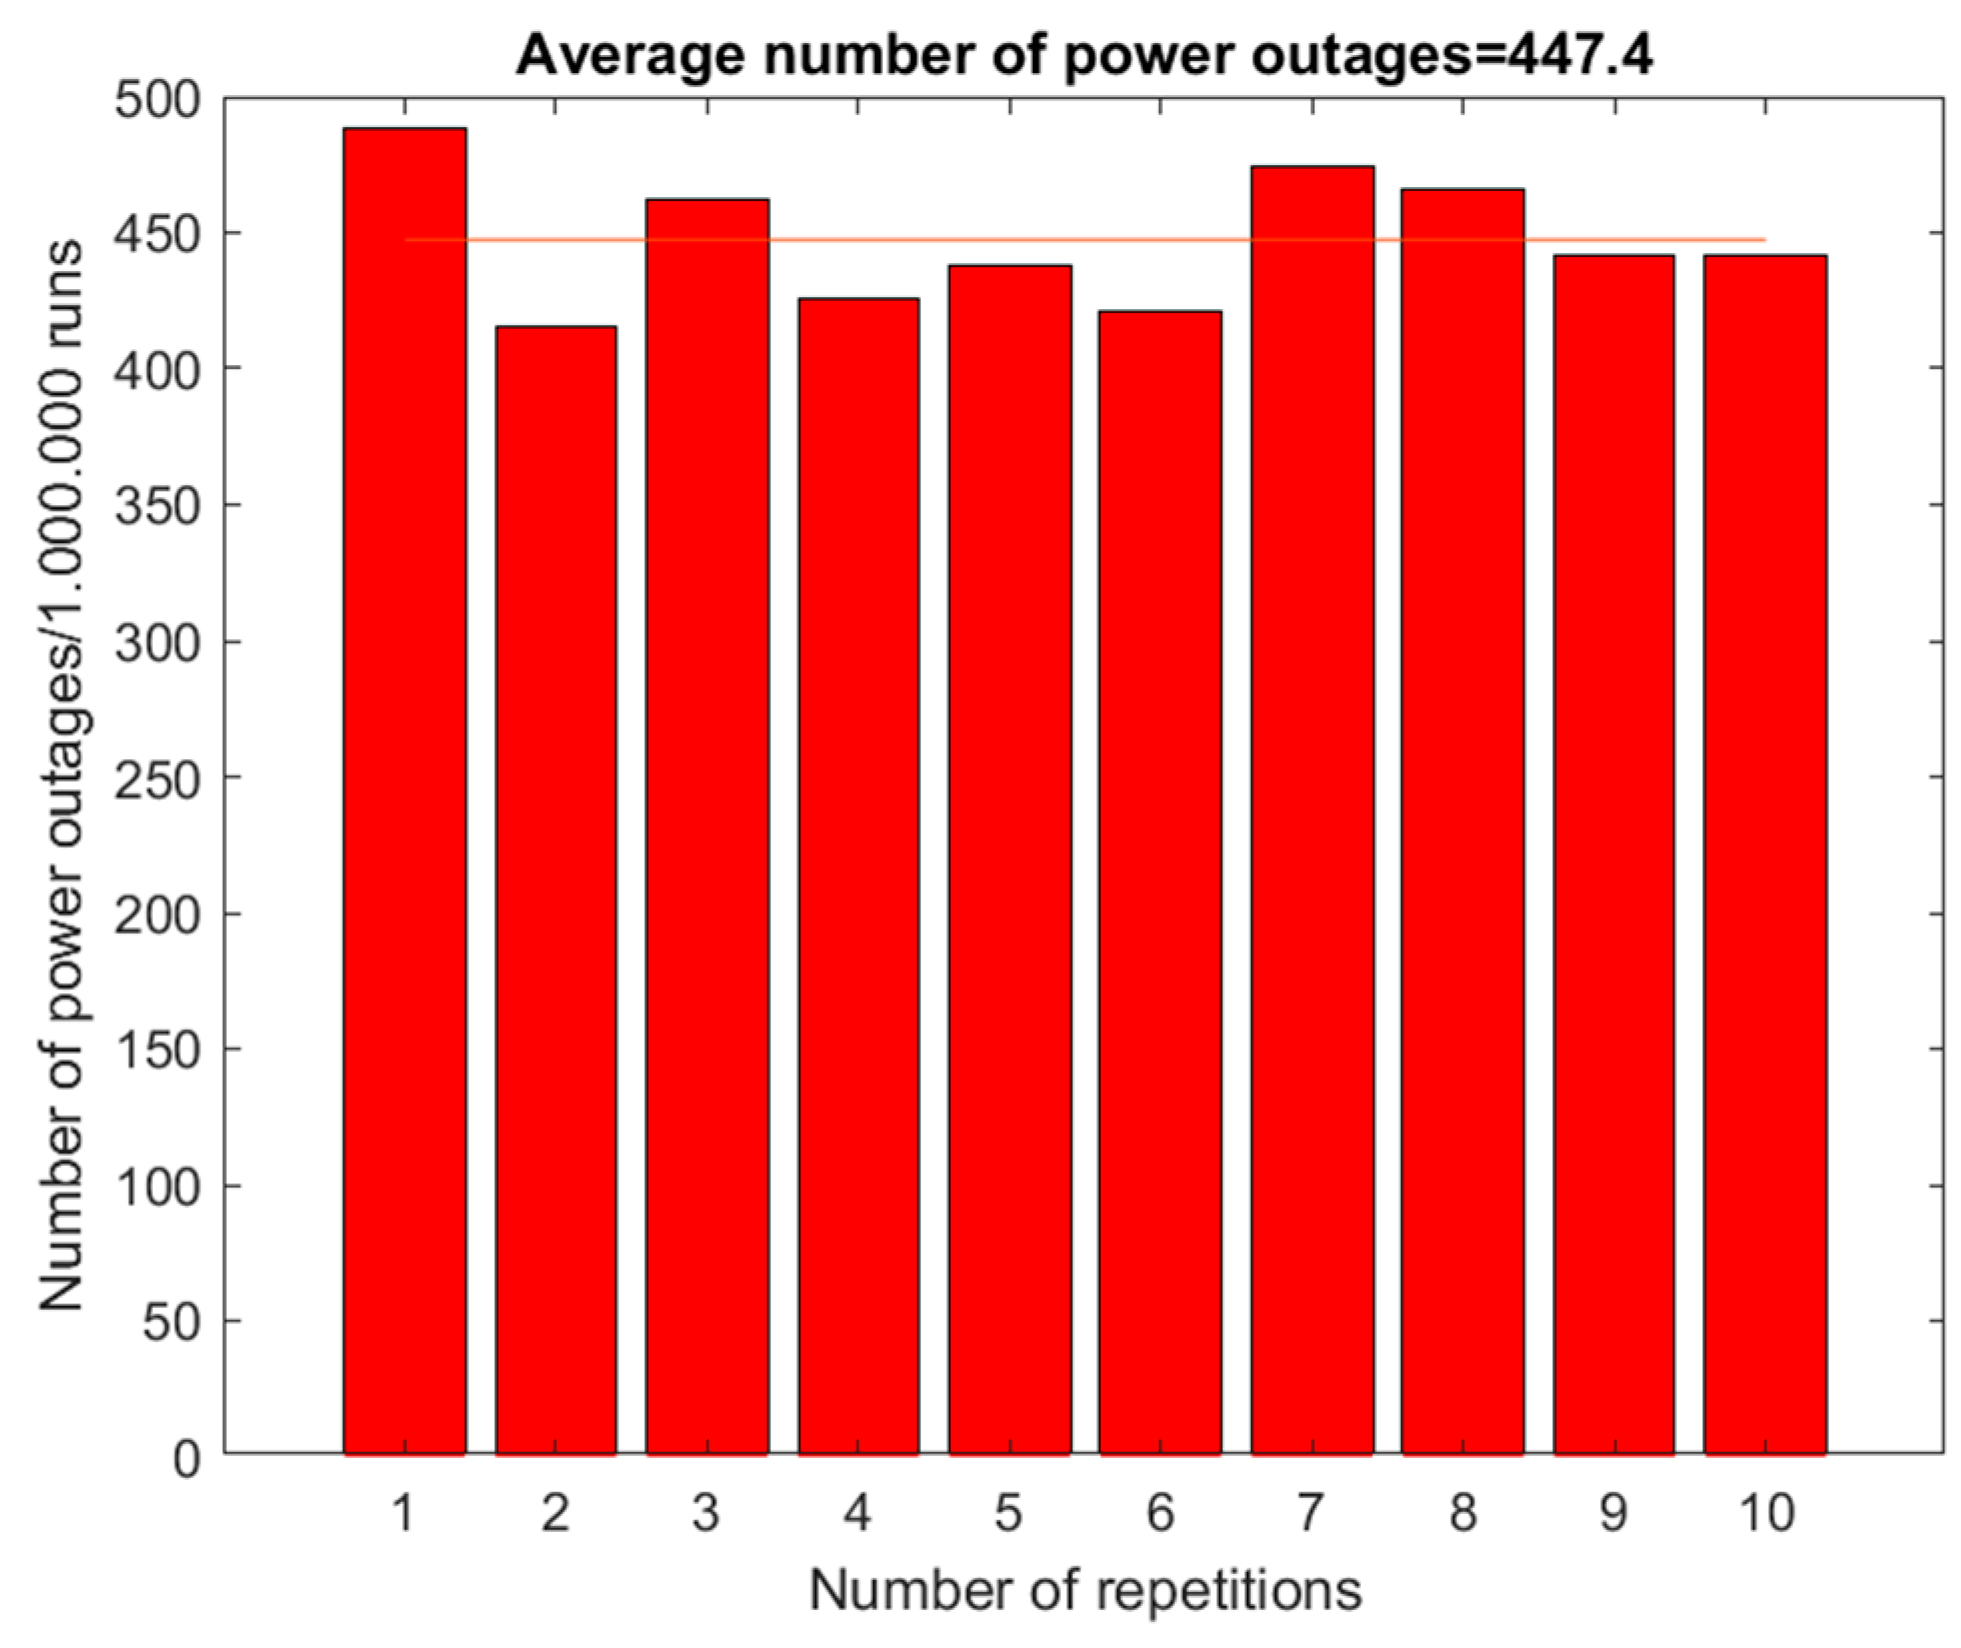
| Double-busbar system—one active incoming and outgoing field | 447.4 | / |
| Double-busbar system—two active incoming and outgoing fields | 0 | 0.1 |
| Double-busbar system—withdrawable circuit breaker | 31.3 | / |
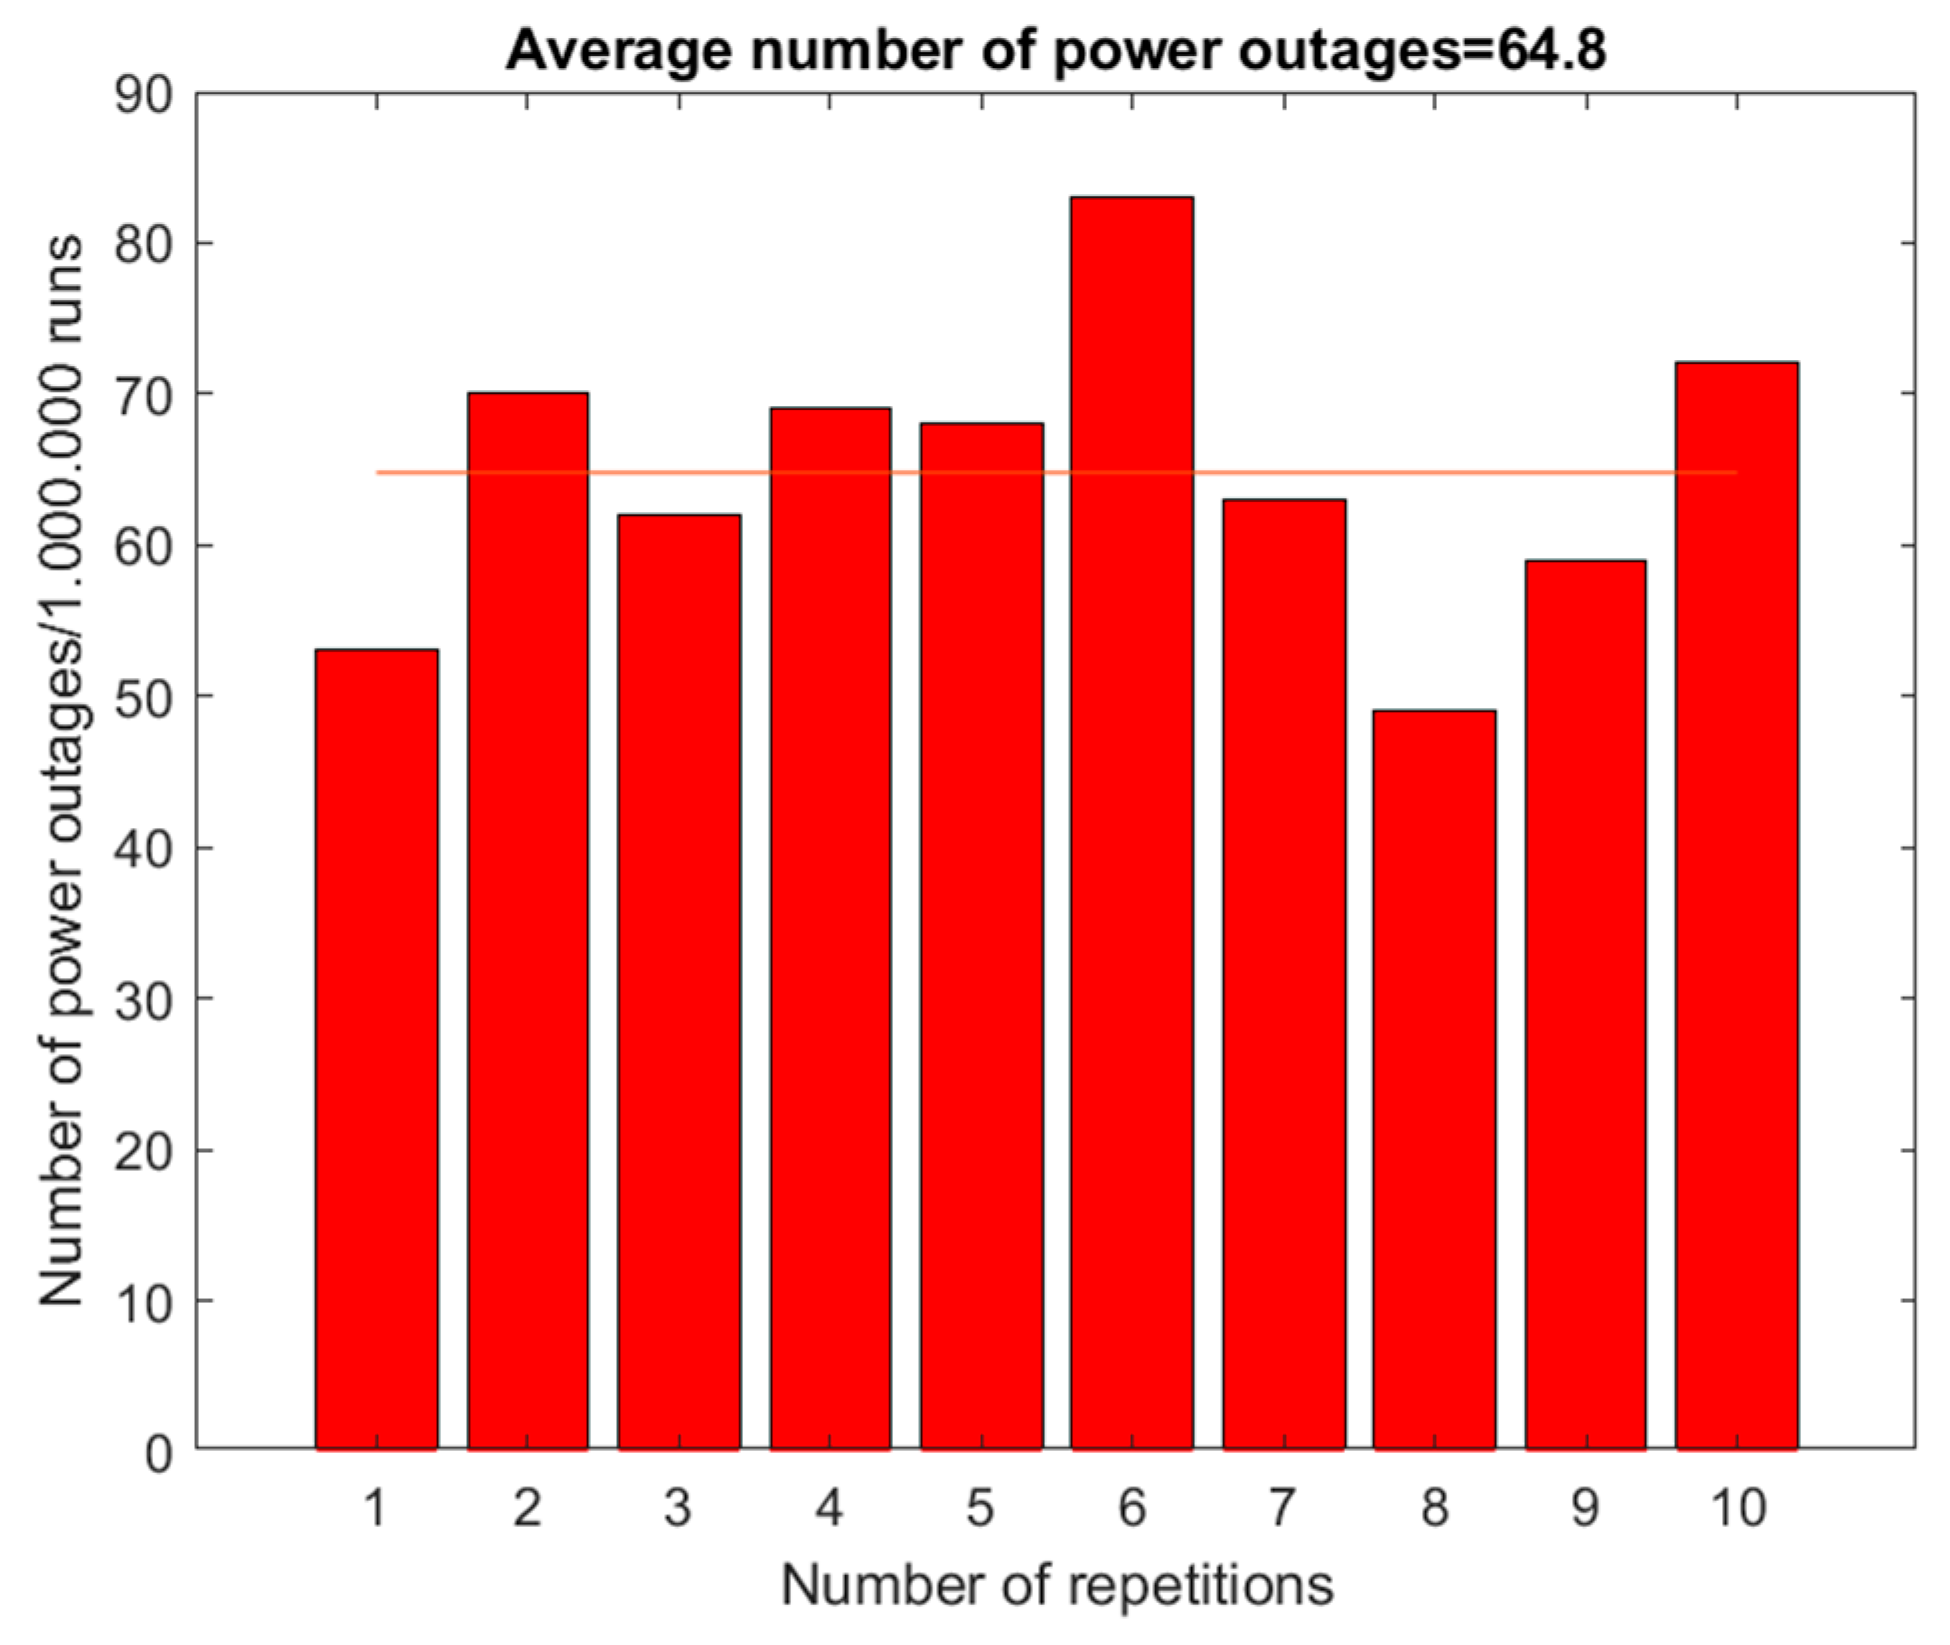
| Double-busbar system—withdrawable circuit breaker with one active incoming and outgoing field | 64.8 | / |
| Double-busbar system—withdrawable circuit breaker with two active incoming and outgoing fields | 0 | 0.1 |
| Double-busbar system—bypass disconnector (all configurations) | 0 | 0 |
| Configuration | Power Outages/1,000,000 Attempts | Partial Power Outages/1,000,000 Attempts |
|---|---|---|
| Switchgear with ring-type power supply | 0 | / |
| Switchgear with ring-type power supply with one active incoming and outgoing field | 0.2 | / |
| Switchgear with ring-type power supply with two active incoming and outgoing fields | 0 | 0.3 |
Disclaimer/Publisher’s Note: The statements, opinions and data contained in all publications are solely those of the individual author(s) and contributor(s) and not of MDPI and/or the editor(s). MDPI and/or the editor(s) disclaim responsibility for any injury to people or property resulting from any ideas, methods, instructions or products referred to in the content. |
© 2024 by the authors. Licensee MDPI, Basel, Switzerland. This article is an open access article distributed under the terms and conditions of the Creative Commons Attribution (CC BY) license (https://creativecommons.org/licenses/by/4.0/).
Share and Cite
Pranjić, F.; Virtič, P. Analysis of the Operational Reliability of Different Types of Switching Substations Using the Monte Carlo Method. Energies 2024, 17, 3142. https://doi.org/10.3390/en17133142
Pranjić F, Virtič P. Analysis of the Operational Reliability of Different Types of Switching Substations Using the Monte Carlo Method. Energies. 2024; 17(13):3142. https://doi.org/10.3390/en17133142
Chicago/Turabian StylePranjić, Franjo, and Peter Virtič. 2024. "Analysis of the Operational Reliability of Different Types of Switching Substations Using the Monte Carlo Method" Energies 17, no. 13: 3142. https://doi.org/10.3390/en17133142