Abstract
Ground source heat pump (GSHP) systems depend on the capacity for heat transfer between the system and the ground, and it is good practice to carry out an in situ thermal response test (TRT) to determine the undisturbed ground temperature, the thermal conductivity of the ground, and the thermal resistance of the borehole. Conventionally, a TRT is undertaken in a replica borehole heat exchanger (BHE); however, alternative methods have been developed that can provide continuous depth-resolved temperature recordings. The enhanced TRT (ETRT) uses a hybrid cable system which incorporates a resistance heating wire to provide a linear heat source and a fibre optic cable to measure the temperature along the length of the borehole. In this paper, a case study is presented in which a TRT and ETRT were carried out in the same BHE to evaluate its thermal response and estimate the thermal characteristics of the ground. After a brief introduction of both methods and their interpretation, a comparison between them is presented regarding their advantages and disadvantages using the results of the performed tests, which revealed an 8% difference in the soil thermal conductivity values, averaged over the length of the BHE.
1. Introduction
Shallow Geothermal Energy (SGE) is a technology that allows for renewable thermal energy at shallow depths (typically < 200 m) to be exploited, in order to satisfy the heating and cooling (H and C) needs of residential, commercial, and industrial buildings. This thermal exchange between the building and the ground is facilitated using two main types of systems:
- Open-loop systems, where the thermal exchange is achieved by the direct use of either groundwater or superficial water bodies;
- Closed-loop systems, where buried pipes form a vertical or horizontal closed circuit that transports a heat carrier fluid that exchanges heat with the surrounding ground [1,2].
Closed-loop systems, which are often referred to as Ground Coupled Heat Pumps (GCHPs), use Ground Heat Exchangers (GHEs) to transfer thermal energy between the surrounding ground and the energy system. The GHE may be installed horizontally or vertically, and borehole heat exchangers (BHEs) are the focus of this study.
The design of these SGE systems requires knowledge of the thermal behaviour and properties of the ground to be able to estimate their capacity to act as a heating/cooling sources or storage media [3]. Considering conduction as the main heat transfer process occurring in BHEs, the thermal conductivity of the ground, λ, is a key design parameter, as is the undisturbed ground temperature, T0, and the borehole thermal resistance, Rb, which is the lumped thermal resistance between the heat carrier fluid inside the BHE and the surrounding ground. To assess these key design parameters reliably, it is good practice to carry out a thermal response test (TRT), also called a Geothermal Response Test (GRT). The conventional TRT is performed in situ in a borehole that replicates the planned BHE configuration; Sanner et al., 2005 [4], report that such a test was first described by Choudary in 1976. The requirements of the TRT are specified in ISO 17628:2015 [5].
During a TRT, heated water is circulated through a closed loop of piping grouted inside a borehole, and the thermal response is evaluated from the continuously recorded inlet and outlet temperatures. Then, based on the changes in temperature within the system, λ and Rb can be estimated based on analytical or numerical models, such as the widely used Infinite Line Source (ILS) model, amongst others [6]. The estimation of these key design parameters results in integral and average values of λ and Rb for the entire length of the borehole used to perform the TRT. These parameters can, however, present significant variability in depth (and spatially, generally) due to layering and variations in, e.g., mineralogy and water content in the ground, and heat transfer mechanisms, e.g., convection due to groundwater flow within layers and/or fractures in the ground. These factors can impact the results and cannot be identified in the TRT [7]. While the TRT as proposed by Gehlin, 2002 [8], can be considered a mature field investigation technique, further improvements, such as continuous depth-resolved temperature recording, have been proposed to improve and/or complement the conventional TRT.
Continuous depth-resolved temperature recording is achieved by using wireless probes or fibre optic cables. The continuous depth-resolved recording of the temperature change can be used to identify any depth variability in the thermal properties and the occurrence of other heat transfer mechanisms.
Wireless probes have been developed that are carried by the heat exchange fluid and measure the temperature along the pipe circuit. For example, the Geoball is a spherical wireless probe with a density identical to that of the heat carrier fluid that has been developed for this purpose (Aranzabal et al., 2015) [9].
The distributed thermal response test (DTRT) is another technique that has been developed and employs fibre optic sensors to obtain temperature and thermal conductivity profiles along the length of the BHE. The fibre optic cable can be placed along the external wall of the BHE [10] or inside the heat exchanger pipes [11]. The enhanced thermal response test (ETRT) is similar to the DTRT method, but it incorporates a resistance heating element (copper wire) in the fibre optic cable to impose the required heat input selected for the test. A ETRT has been undertaken with the hybrid fibre optic cable located along the external wall [12] and the internal wall [13] of the BHE, or in a grouted stand-alone observation borehole [14], and a number of cases have been reported where this method has been able to identify hydraulic fractures and ground layers [15]. In [7], a comprehensive review of these improvements and further developments to the conventional TRT is available. Recently, these improved TRT techniques have been used in other fields, such as agriculture, to measure soil moisture, e.g., [16].
Comparisons available in the literature suggest that the thermal conductivity estimates from TRT and DTRT/ETRT show good agreement, with differences typically less than 10% [15]. Since the DTRT maintains the same heating method as the TRT, and wireless probes still have limited practical experiences [7], for the purpose of this study, the focus is on the comparison between the ETRT and the conventional TRT.
Building on the limited field data available in the literature, this article presents a case study in which a conventional TRT and ETRT were undertaken during a site investigation in Vienna, Austria. Through these results, the reliability, complementarity, and practicability of the ETRT, in comparison to a conventional TRT, are discussed.
2. Test Methods and Interpretation
Estimations of the thermal conductivity of soils can be accomplished through empirical, laboratory, and field test methods. Empirical or semi-empirical methods for calculating the thermal conductivity of soils, generally, consist of a methodology dependent on previous knowledge of the geological and geotechnical properties of the soil [17], such as the methods described in [18,19,20,21]. Laboratory methods for estimating the thermal conductivity of soils can be stationary, such as using a guarded hot plate [22], heat flow meter apparatus [23], or a guarded-comparative longitudinal heat flow technique [24]; or, in a transient state, the hot wire method [25], the transient plane source or hot disk method [26], or the laser flash method [27]. Regarding field test methods, there are the TRT and its variations, and a method that uses thermal probes [17], similar to the hot wire method but prepared for field conditions. Due to the importance of the TRT in the design of SGE applications, this paper focuses on the comparison between the conventional TRT and one of its variants, the ETRT.
2.1. Conventional TRT
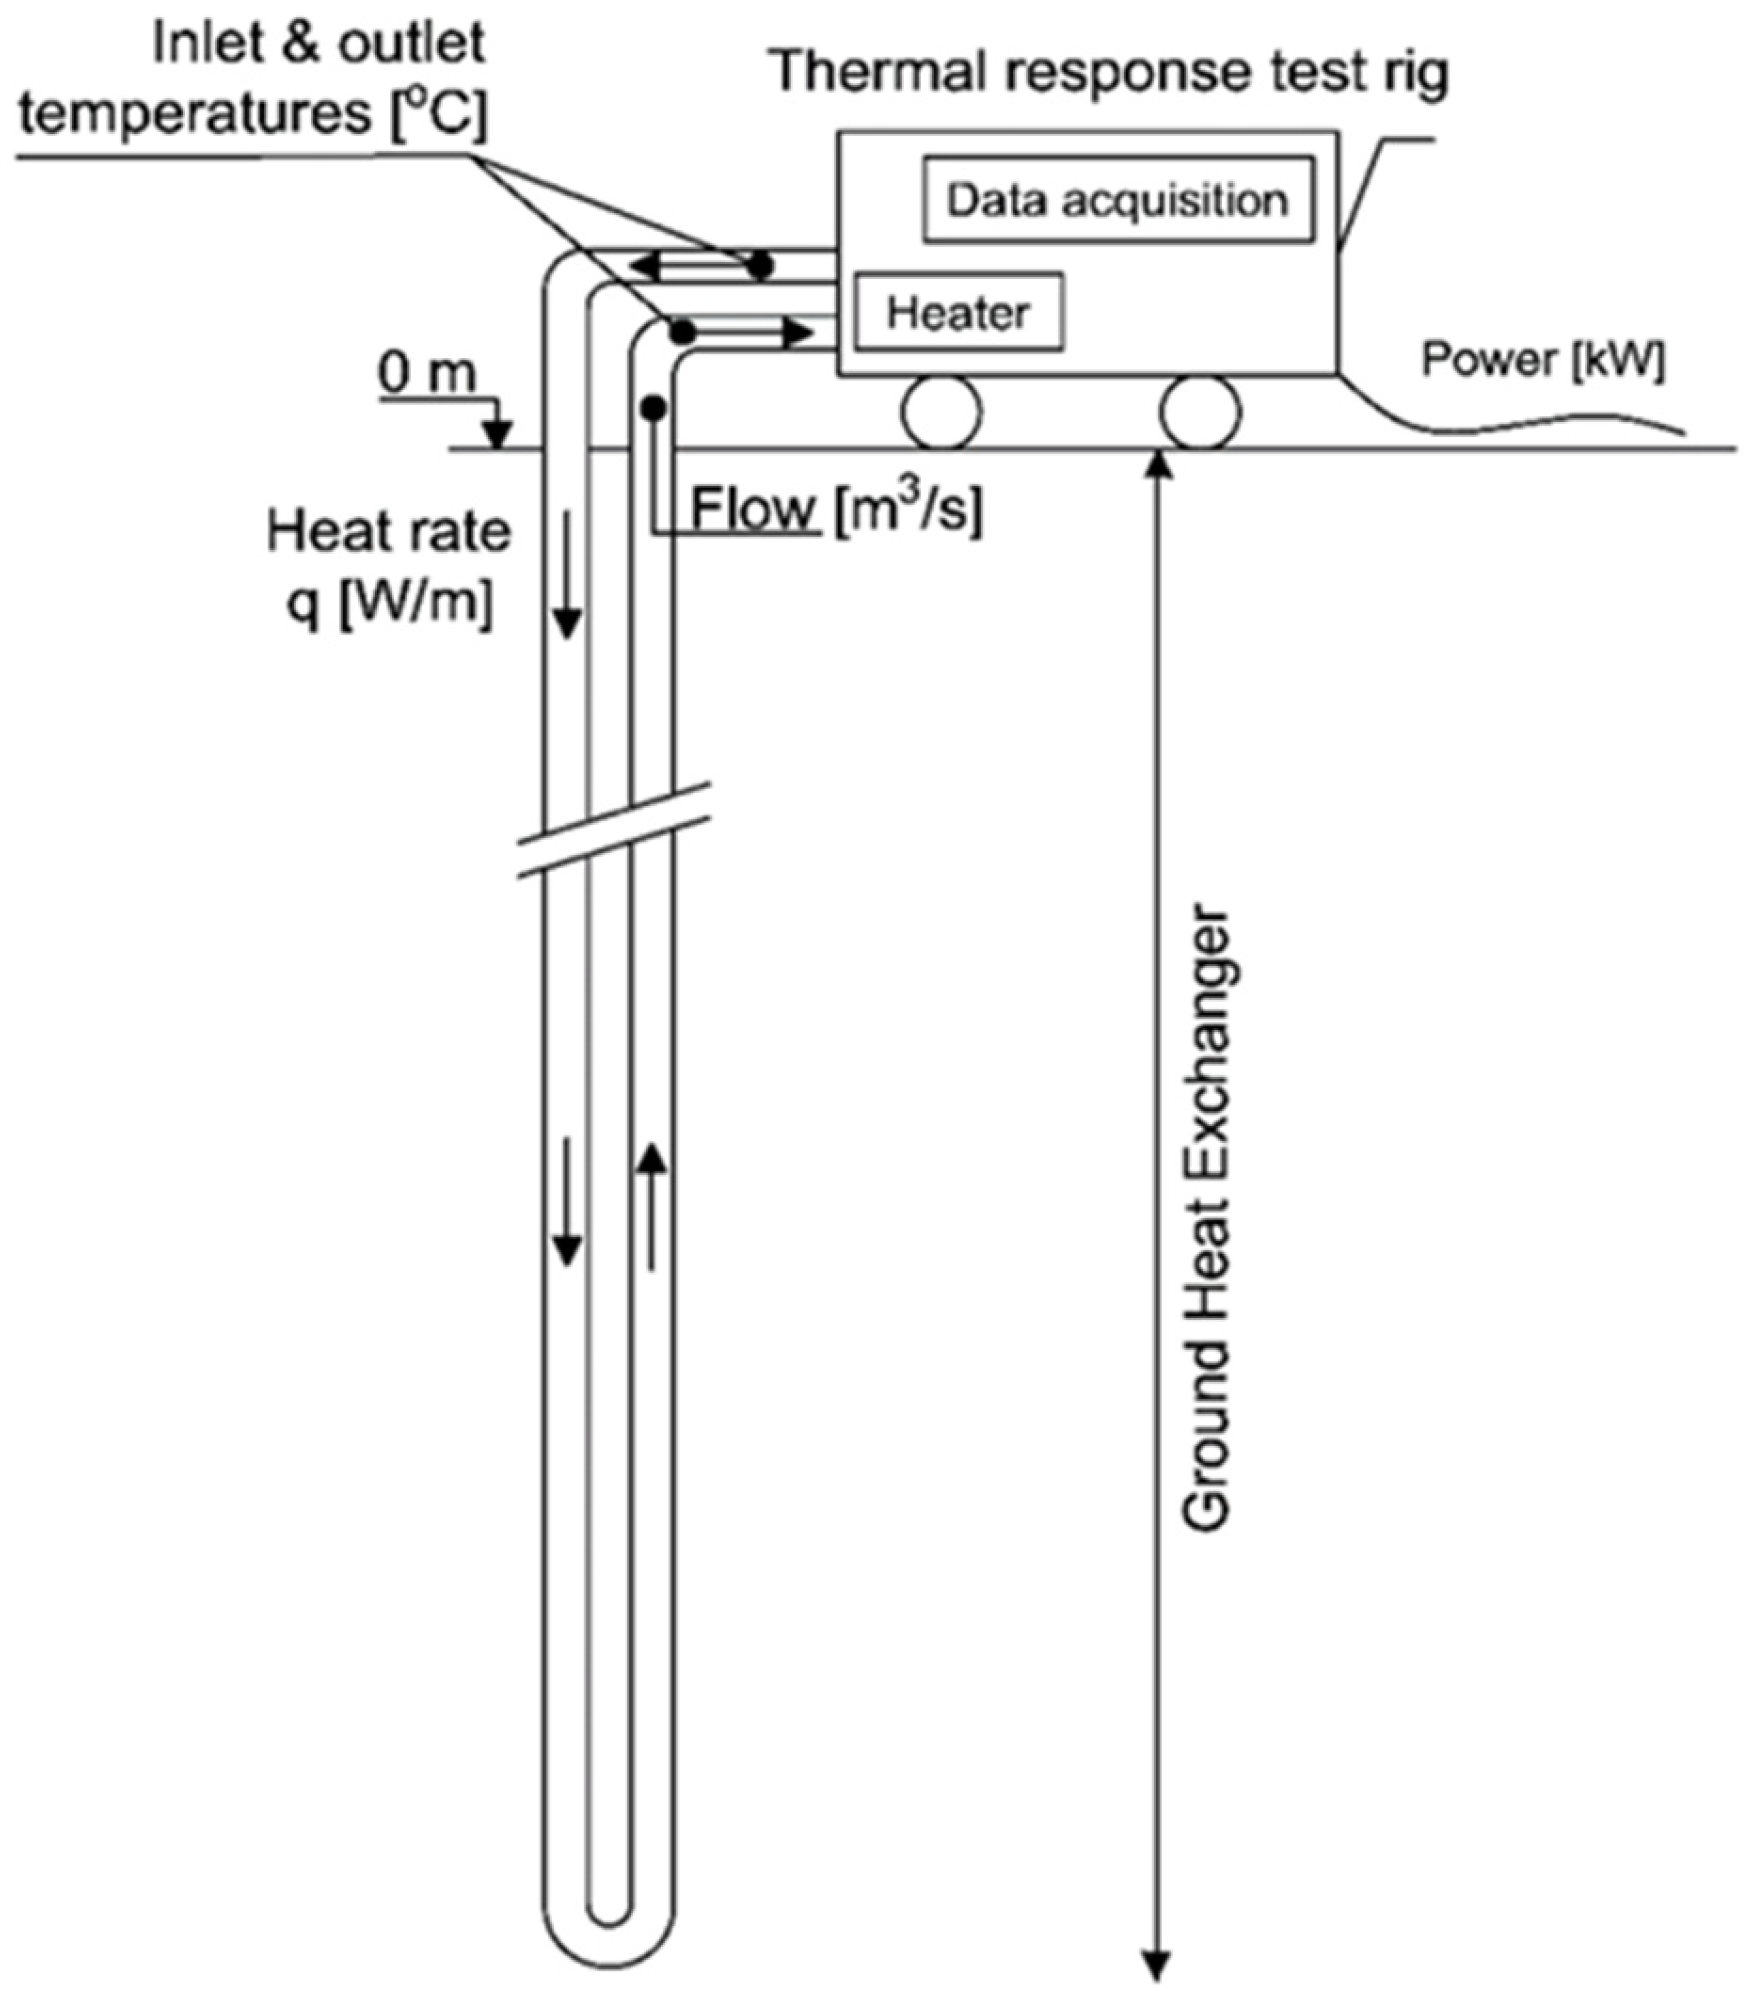
The TRT is used to measure the thermal response of a BHE during heat injection or extraction at a constant rate, which is imposed by circulating fluid within a closed-loop pipe system, with the fluid temperature controlled by heating/cooling equipment (Figure 1). The thermal response of the BHE is obtained by measuring the change in temperature of the circulating fluid between the inlet to the pipe loop and the outlet. The measured thermal response is related to the thermal characteristics of the ground and the borehole filling material through an interpretation method (see below). The conventional TRT (performed with heat injection) is carried out in three phases, e.g., [8,28]:

Figure 1.
TRT operating scheme in a BHE, based on [8].
- No heating is applied, but fluid is circulated in the BHE for a couple of hours until fluid temperature stabilises, to assess the average undisturbed temperature of the ground, T0, along the length of the BHE.
- A heating phase, typically lasting 3 to 4 days, where a fluid is heated and circulated through the heat exchange pipes in the BHE, is initiated to impose a constant heating input. Fluid temperatures at the inlet (Tin) and outlet (Tout) of the BHE are recorded (Figure 1), along with the power, Q, supplied by the heating unit.
- A recovery phase, typically lasting 3 to 4 days, is initiated, where no heating is applied and the return to the original background temperature in the circulating fluid is recorded.
For the interpretation of the results, mathematical models such as the Infinite Line Source (ILS) model or the Infinite Cylindrical Source (ICS) model are used. When utilising the ILS model to interpret the TRT data, a graph is drawn relating the average fluid temperature, Tf, calculated as the mean of the inlet (Tin) and outlet (Tout) temperature, to time on a natural logarithmic scale, i.e., ln(t). Carefully selecting the linear part of the graph, corresponding to a quasi-constant condition of the heat transfer to the ground, we can evaluate both an effective thermal conductivity of the ground, λ (W/m·K), and the thermal resistance of the borehole, Rb (m·K/W), using the following expressions [8]:
where q = Q/L is the input heat rate per unit length of the BHE(W/m), L is the length of the BHE, m is the inclination of the linear part of the plot of Tf versus ln(t), and c is the y-intercept of the Tf vs. In the ln(t) plot, α is the thermal diffusivity of the infill material of the borehole, rb is the radius of the borehole, and γ is the Euler–Mascheroni constant.
λ = q/4π·m,
Rb = (c − T0)/q − [ln(4α/rb2) − γ]/4πλ,
These expressions are valid for the conditions considered in the ILS model and for values’ test times, t > 5rb2/α, which ensures that the heat input reaches the surrounding ground, and the estimated value of thermal conductivity is related to the ground. This condition means that, typically, the first hours of the heating phase are discarded for the interpretation of the thermal properties.
2.2. Enhanced TRT
The ETRT is an enhanced version of the TRT, where, instead of using circulating fluid to impose a temperature disturbance within the ground, a hybrid cable, incorporating both a fibre optic-based temperature sensor and a copper wire heating element, is used. The hybrid cable may be installed in a standalone borehole, or it can be included in a BHE, where the hybrid cable is attached to the external or internal walls of the heat exchanger pipes, as was the case in this study. The procedure for the ETRT follows the same three phases defined for the TRT above, except that the heating and the temperature measurements are performed via the hybrid cable.
By applying a voltage to the copper wire, a defined heating power is introduced into the subsurface along the cable. Because the heating is uniformly introduced in the ground by the heating wire, a constant heat load is imposed at all depths.
The whole process is controlled by purpose-built equipment, and, in this study, GeoDTS (expert version 1.9) [29] was used to control the ETRT process. The Distributed Temperature Sensing (DTS) unit sends laser pulses through the optical cable, and some parts of the laser signal are scattered and transmitted back to the unit. This back-scatter effect is caused by the influence of temperature on lattice vibrations within the quartz molecules present in the optical fibres. Based on the arrival time, intensity, and wavelength of the returning light, the DTS unit interprets the temperature and respective location along the depth, based on Raman optical time-domain reflectometry.
The system is configured to run a fully automated measurement cycle [28]. Throughout the test and its three phases, the fibre optical cable monitors the temperature evolution with a time resolution of 2 min and in every 0.5 m along the depth of the cable/BHE. All the data collected are stored on a memory card and then transferred to a computer, where the data are analysed to produce a continuous, depth-resolved estimation of the thermal conductivity. The analysis is undertaken using the ILS model, similar to the process presented in Section 2.1, with the coefficient m in expression (1) being obtained from the temperature-ln(t) plot at each measurement point along the cable.
The interpretation of the eTRT follows a similar method to that used for the TRT, except that it is made at 0.5 m intervals along the sensor cable, i.e., the evolution of the average temperature at each position is plotted versus the logarithm of time, and the slope, m(z), of this plot, in the latter stages of the test, is used in Equation (1) to provide an estimate of the thermal conductivity of the ground at each depth position.
2.3. Test Setup Comparison
While the TRT is a mature test and is widely used in SGE applications, the ETRT has been proven to have some important advantages. Both TRT and ETRT techniques are currently used for the characterisation of ground thermal properties for use in the design of SGE systems. They involve different methodologies; they require different equipment and reproduce different type of results. Table 1 highlights the differences between both tests. In [7], a comparison is made between whether the tests (in this case, comparing DTRT’s and TRT’s possible configurations) are suitable for specific conditions and/or to obtain key design parameters.

Table 1.
Comparison of characteristics of TRT and ETRT.
The major difference between both tests is the type of results produced; now focusing on the comparison between the TRT and ETRT, the first monitors only the inlet and outlet temperatures of the fluid circulating in the BHE. From these, the TRT results in integral and average values regarding the BHE. The undisturbed temperature obtained is a single value, as is the thermal conductivity and the borehole thermal resistance, which makes them only effective values for the specific BHE used for the test. For example, the TRT is conducted in a BHE of 100 m in depth, and if the design solution consists of boreholes of a different depth, the estimated value of the effective thermal conductivity might not apply. The ETRT results in a depth-resolved temperature measurement, obtaining a profile of undisturbed temperature and thermal conductivity along the depth of the borehole. It provides much more information about the ground conditions, eventually detecting anomalies and relating them to different ground layers and hydraulic fractures. A depth-resolved estimation of the key design parameters allows for more information to feed the design process.
Other differences can be mentioned about the methodologies used. While the TRT uses a heated circulating fluid to introduce heat into the BHE, simulating the operation of the ground loop in a closed-loop SGE system, the ETRT uses the hybrid fibre optic cable with a heating wire to input it into the ground. While the first introduces heat with heated circulating fluid, where the total heat load (Q) is then distributed along the length of the ground loop, resulting in a non-uniform q, the latter introduces a uniform heat rate throughout the length of the heating wire, closely mimicking the conditions of the ILS model used for data interpretation.
Both techniques have the possibility of being used during the operation of the GSHP system, one by functioning as a regular BHE (TRT) and the other as a monitoring borehole (ETRT).
3. Field Testing
3.1. Location and Ground Conditions
The thermal testing campaign was carried out by ENERCRET at a site located in Vienna, Austria. The site development involves the construction of a private company headquarters, where a GSHP system is intended to provide its H and C needs. In order to complete the design of the GSHP system, an in situ testing campaign applying both a conventional TRT and an enhanced TRT was performed.
While drilling the borehole, it was possible to analyse the soil profile at the site, which consisted of a superficial gravel layer about 11 m thick, which was underlain by a layer of silty sand that extended to at least 200 m in depth (the depth of the borehole). No further hydrogeologic information was available.
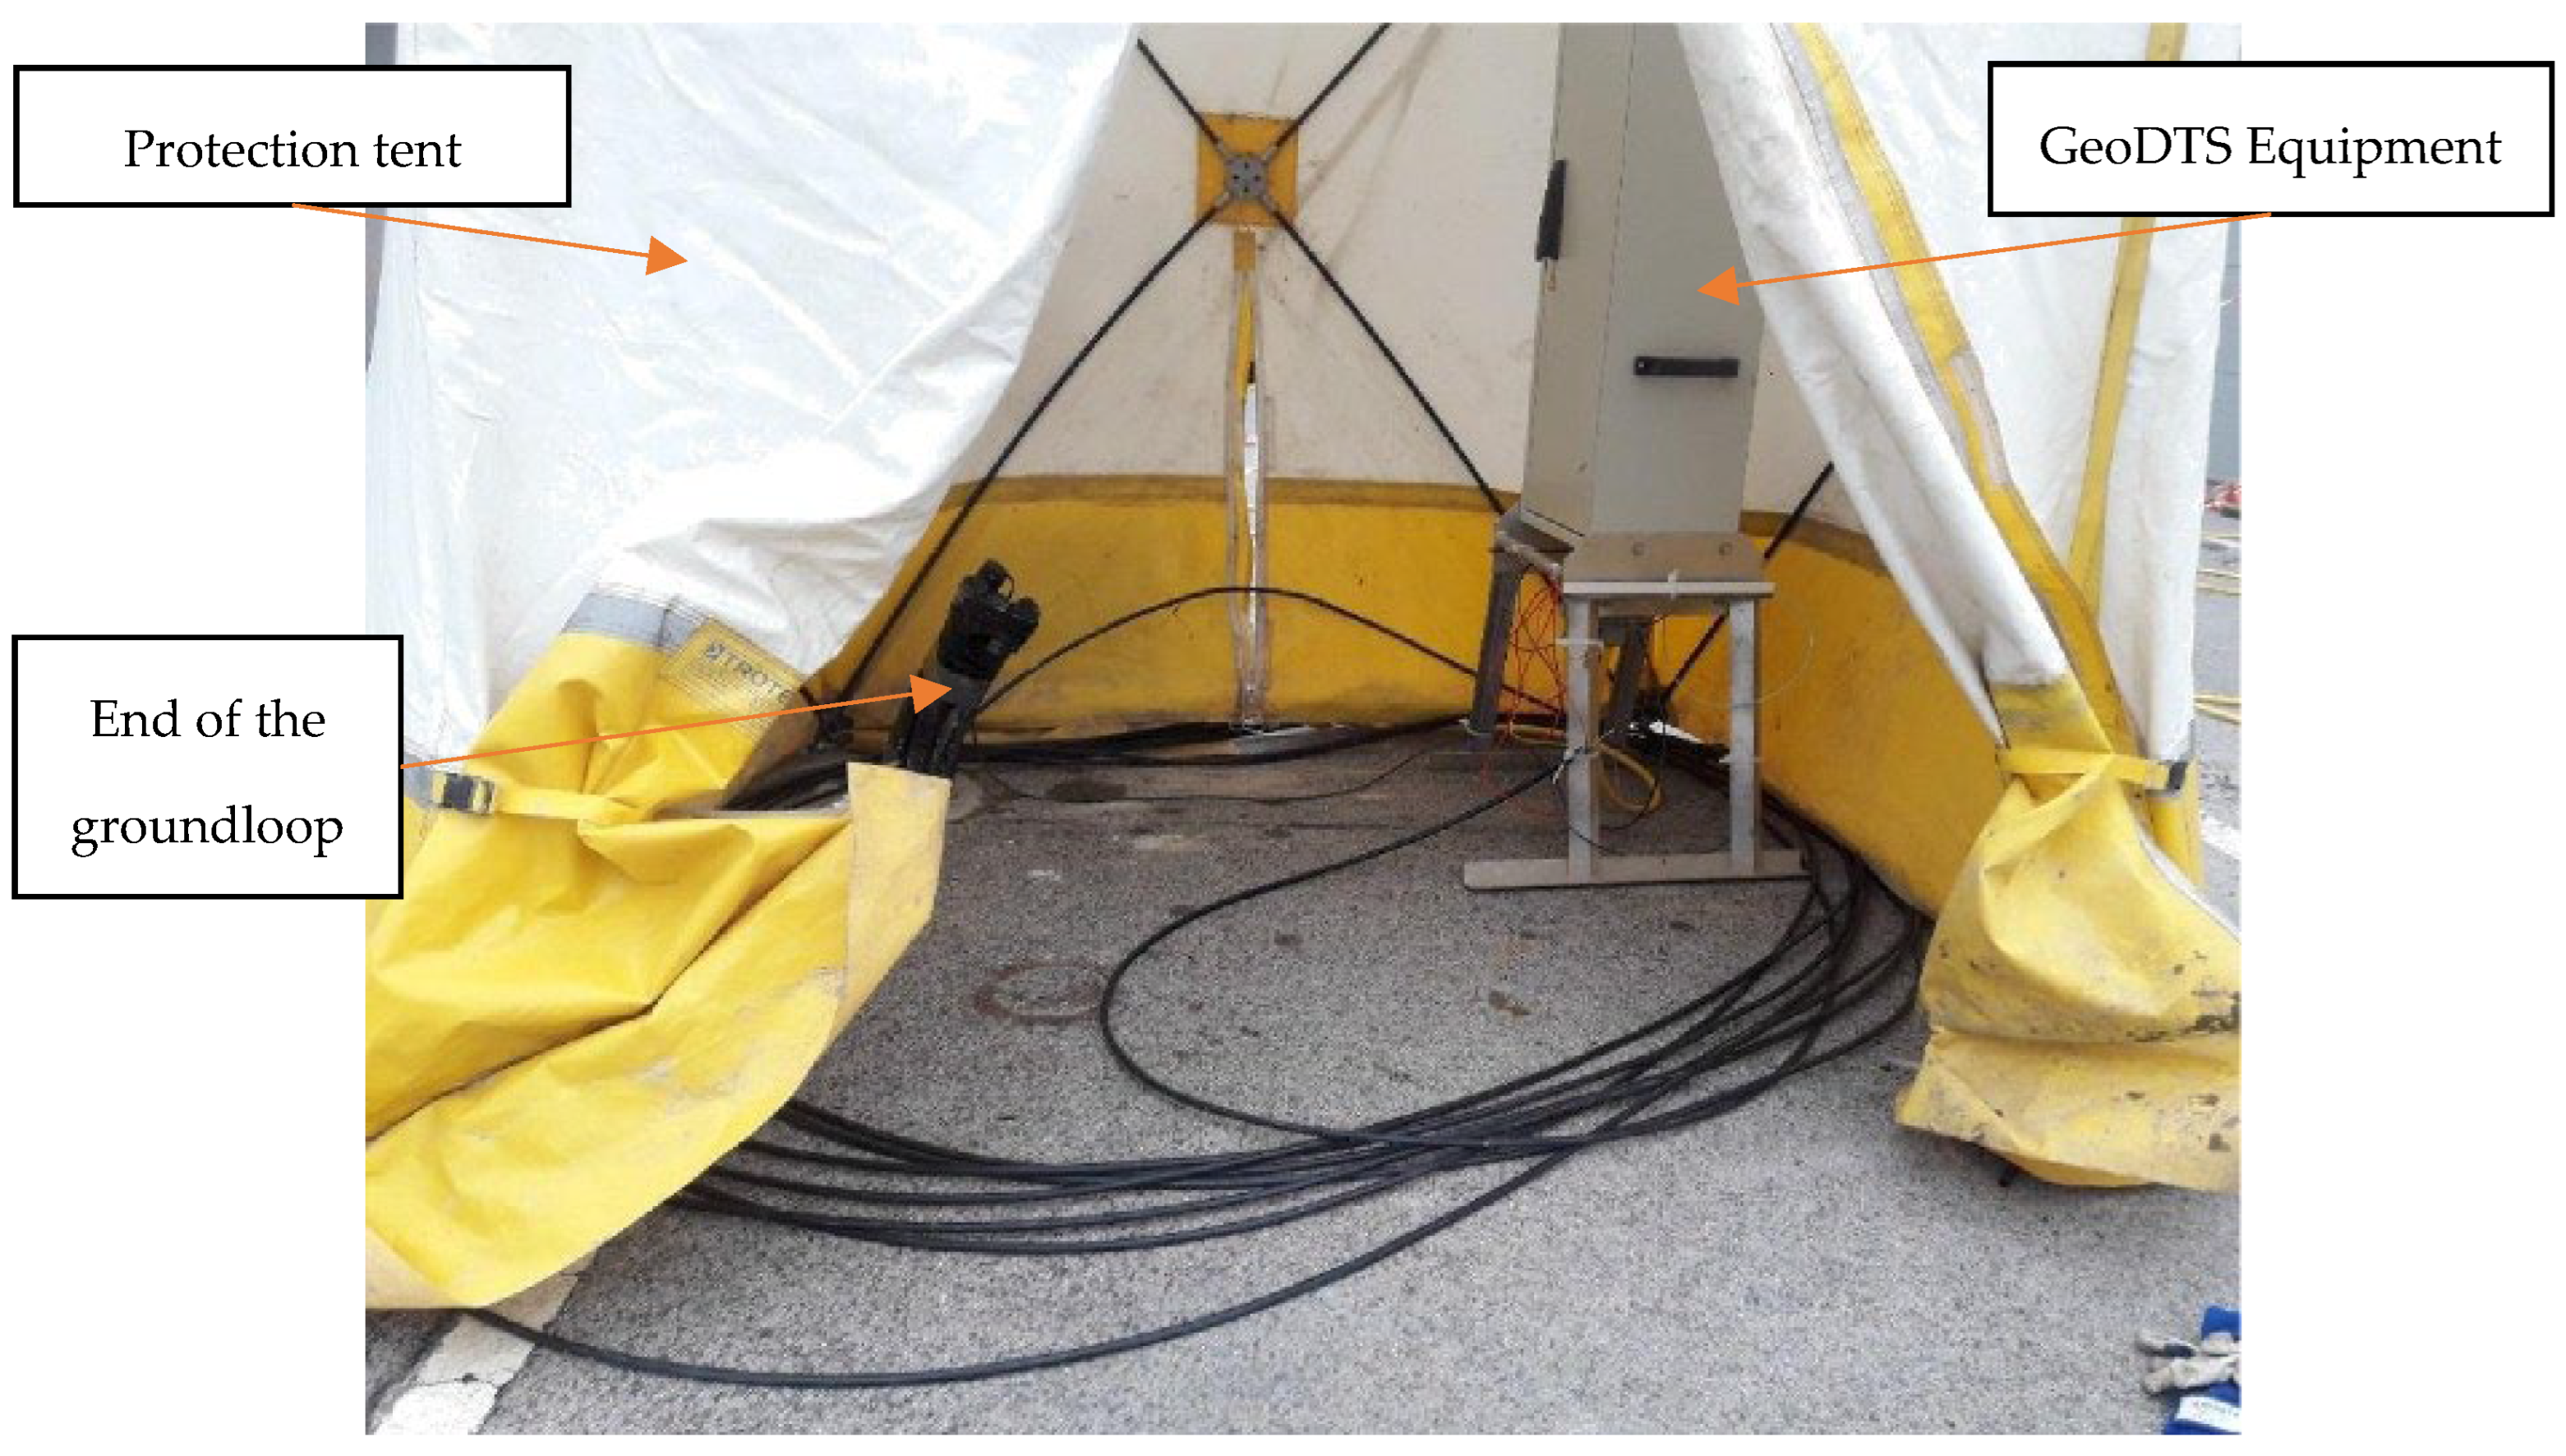
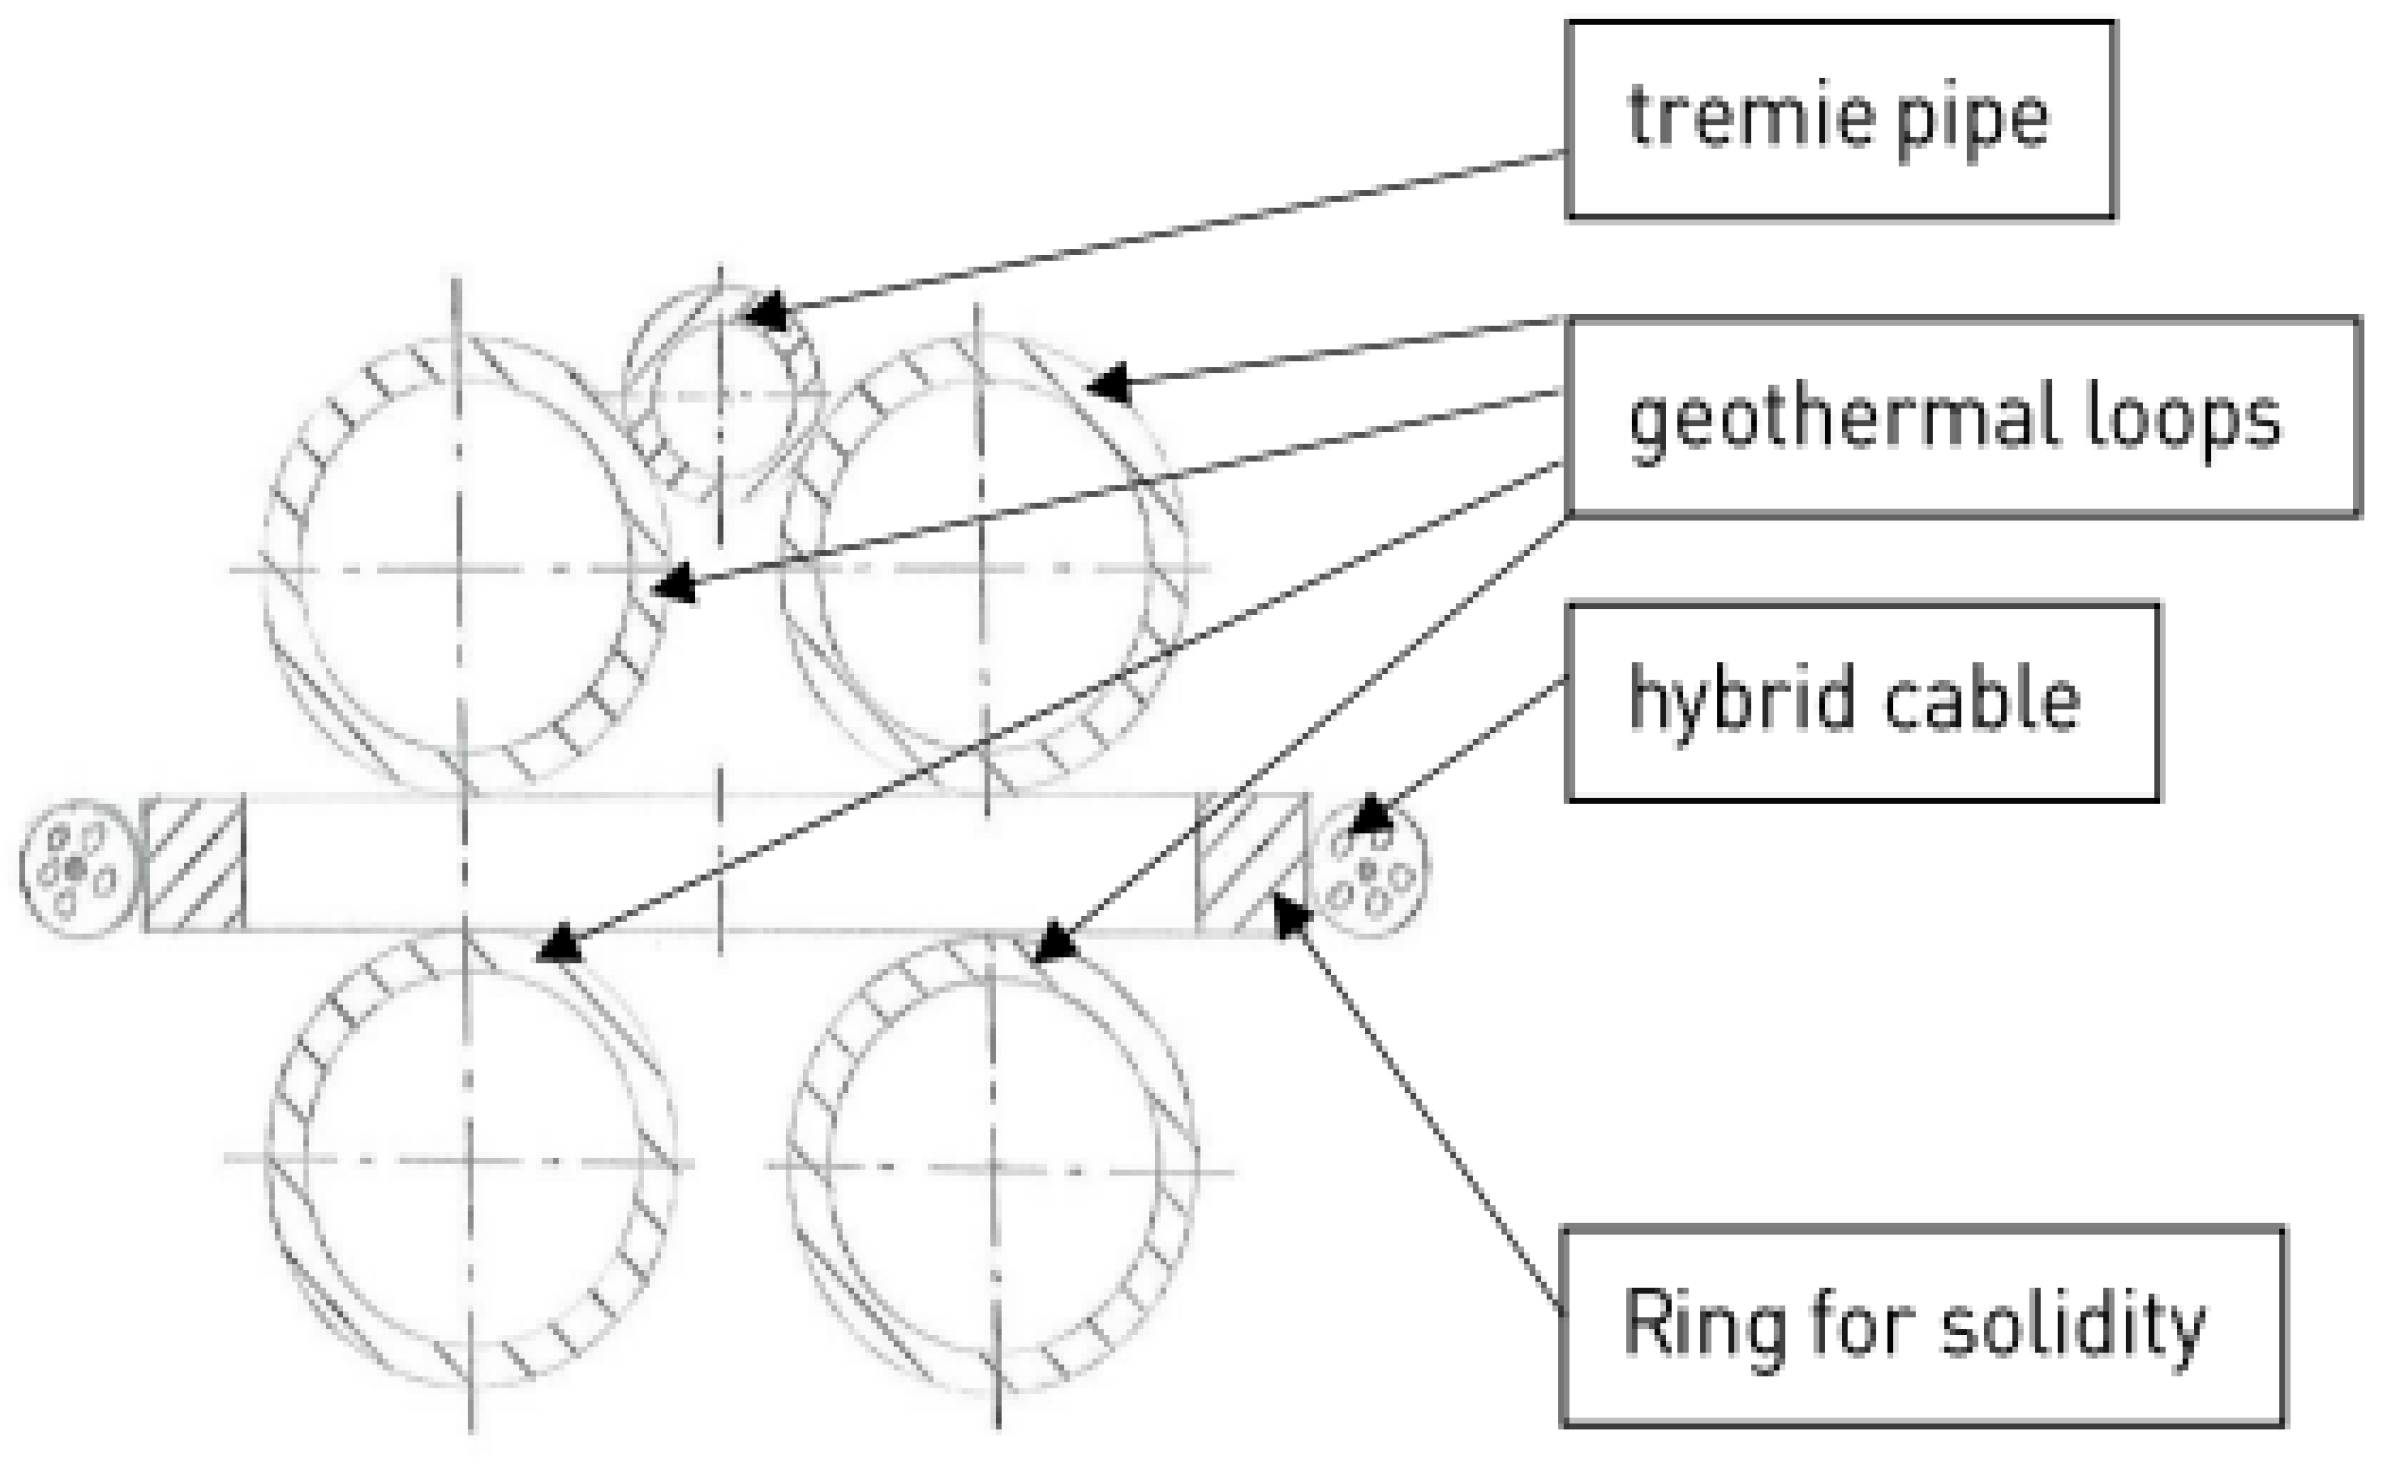
For the TRT, a double U-pipe of 20 mm outside diameter and a 2.3 mm wall thickness HDPE pipe were introduced into a 160 mm diameter, 200 m deep borehole, and then the borehole was filled with a conventional filling grout with a thermal conductivity of 1.6 W/m·K. Water was used as the heat exchange fluid inside the pipes and was circulated at a rate of about 29 L/min. For the ETRT, a hybrid optical fibre cable (S2004A) was introduced along the depth of the borehole by attaching it into the central part between both ends of the double-U pipe of the BHE. Figure 2 presents a view of the ETRT test setup from street level, where there was access to the borehole and testing equipment from inside a temporary tent structure in order to protect the equipment and minimise the influence of external conditions on the results. Figure 3 presents the cross section of the base part of the BHE used for both tests.
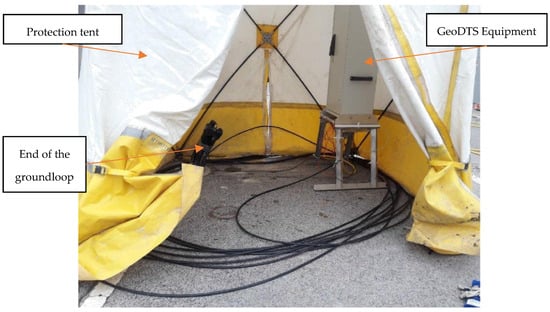
Figure 2.
The ETRT field setup with the GeoDTS.

Figure 3.
Cross section of the BHE used for both tests.
3.2. Thermal Response Testing
The ETRT was performed between 25 November and 5 December 2019, with a heating phase of 72 h taking place between 29 November and 2 December. A standardised heating input of 20.12 W/m was applied throughout the heating phase.
To allow the ground temperatures to recover, the conventional TRT was performed about two weeks after the ETRT, between 12 and 22 December 2019. The heating phase was applied between 16 and 19 December 2019 for a total of 66 h. The test was undertaken using a heating source with an average heat input of 46.98 W/m.
4. Test Results and Discussion
4.1. Conventional TRT
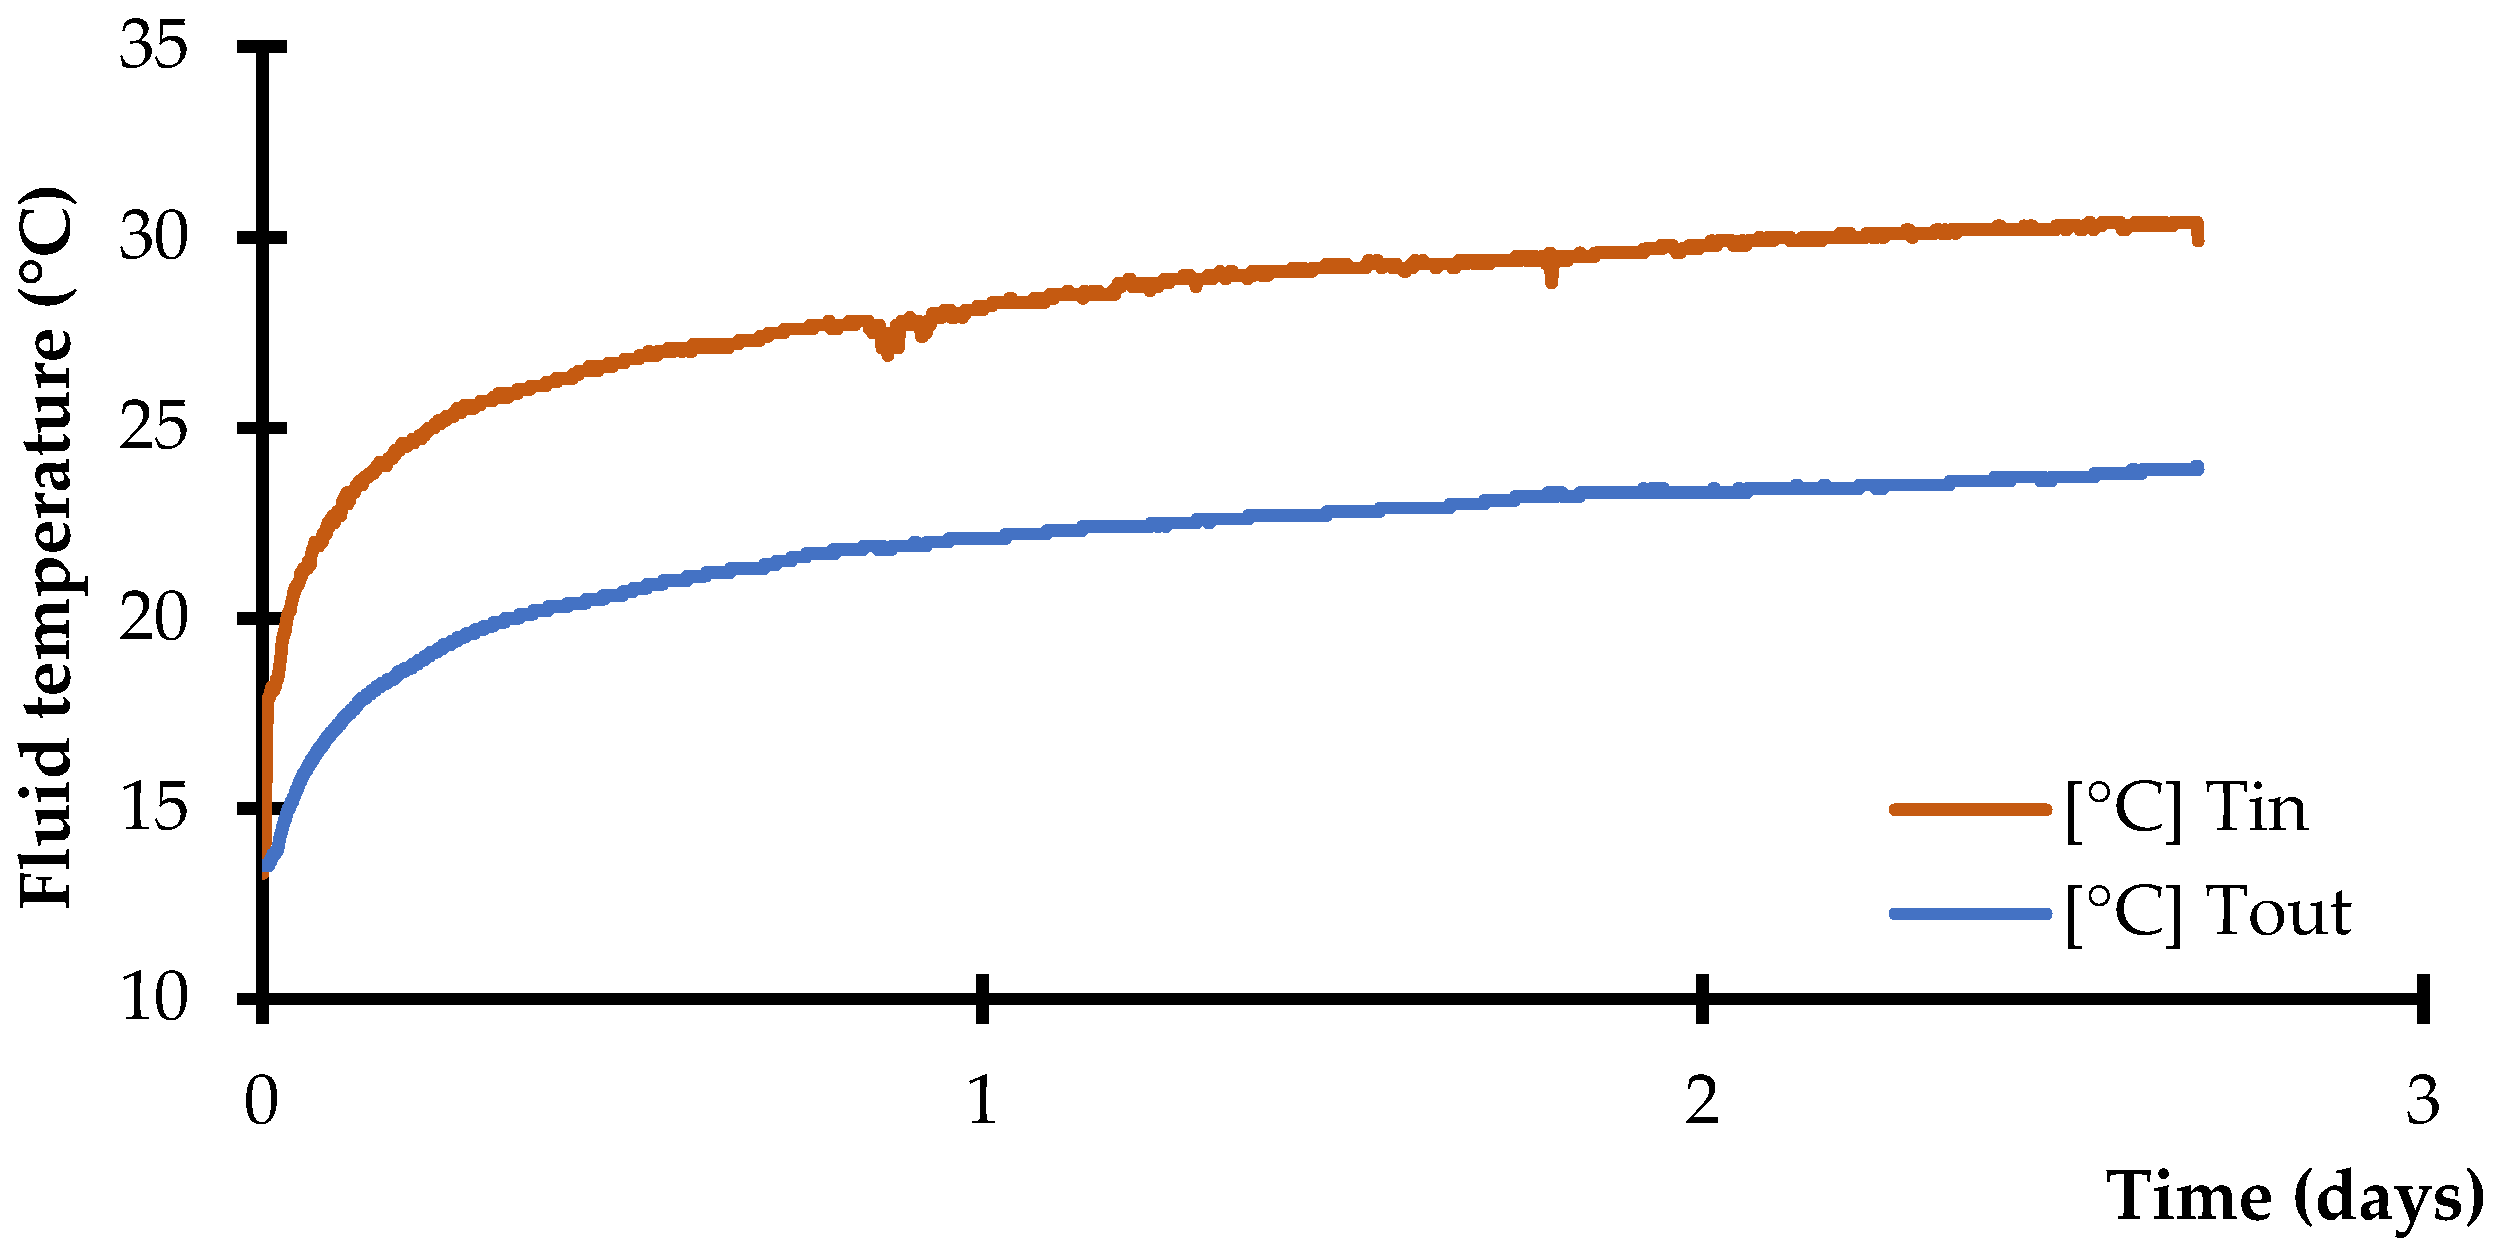
In the initial stage of the test, fluid circulated without any heat input and the measured average undisturbed temperature of the ground, T0, was 13.4 °C. In the next stage, a heating rate of 47 W/m was applied, and the recorded inlet (Tin) and outlet (Tout) fluid temperatures obtained during the heating phase are shown in Figure 4. After the first 0.25 days, the temperature difference reaches a quasi-constant condition, with an average of about 6 °C. In Figure 5, as per Section 2.1, the graph of average fluid temperature, Tf, versus ln(t) is shown, along with the equation for the interpolation of the linear part of the graph, yielding m = 2.047 and c = 1.868. Assuming a value of 9.44 × 10⁻⁷ (m2/s) for the thermal diffusivity of the grout, and taking data for times in excess of t > 5rb2/α = 0.4 days, Equations (1) and (2) yield a value for the effective thermal conductivity of the ground of 1.83 W/m·K, and the thermal resistance of the borehole is estimated to be 0.113 (m·K/W).
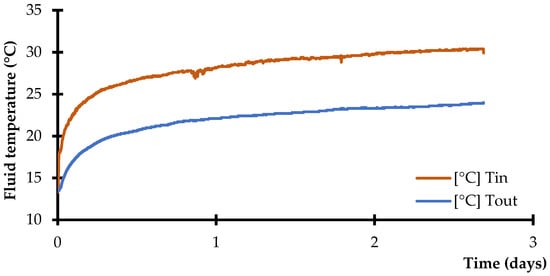
Figure 4.
Inlet (Tin) and outlet (Tout) fluid temperatures measured during the TRT.
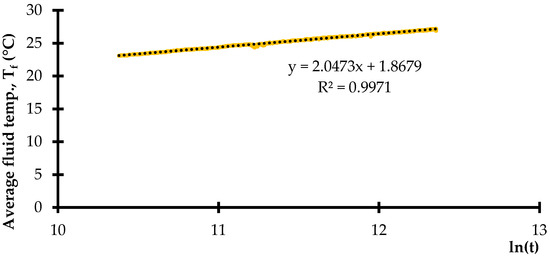
Figure 5.
Data interpretation of the TRT-measured results by applying the ILS model.
4.2. Enhanced TRT
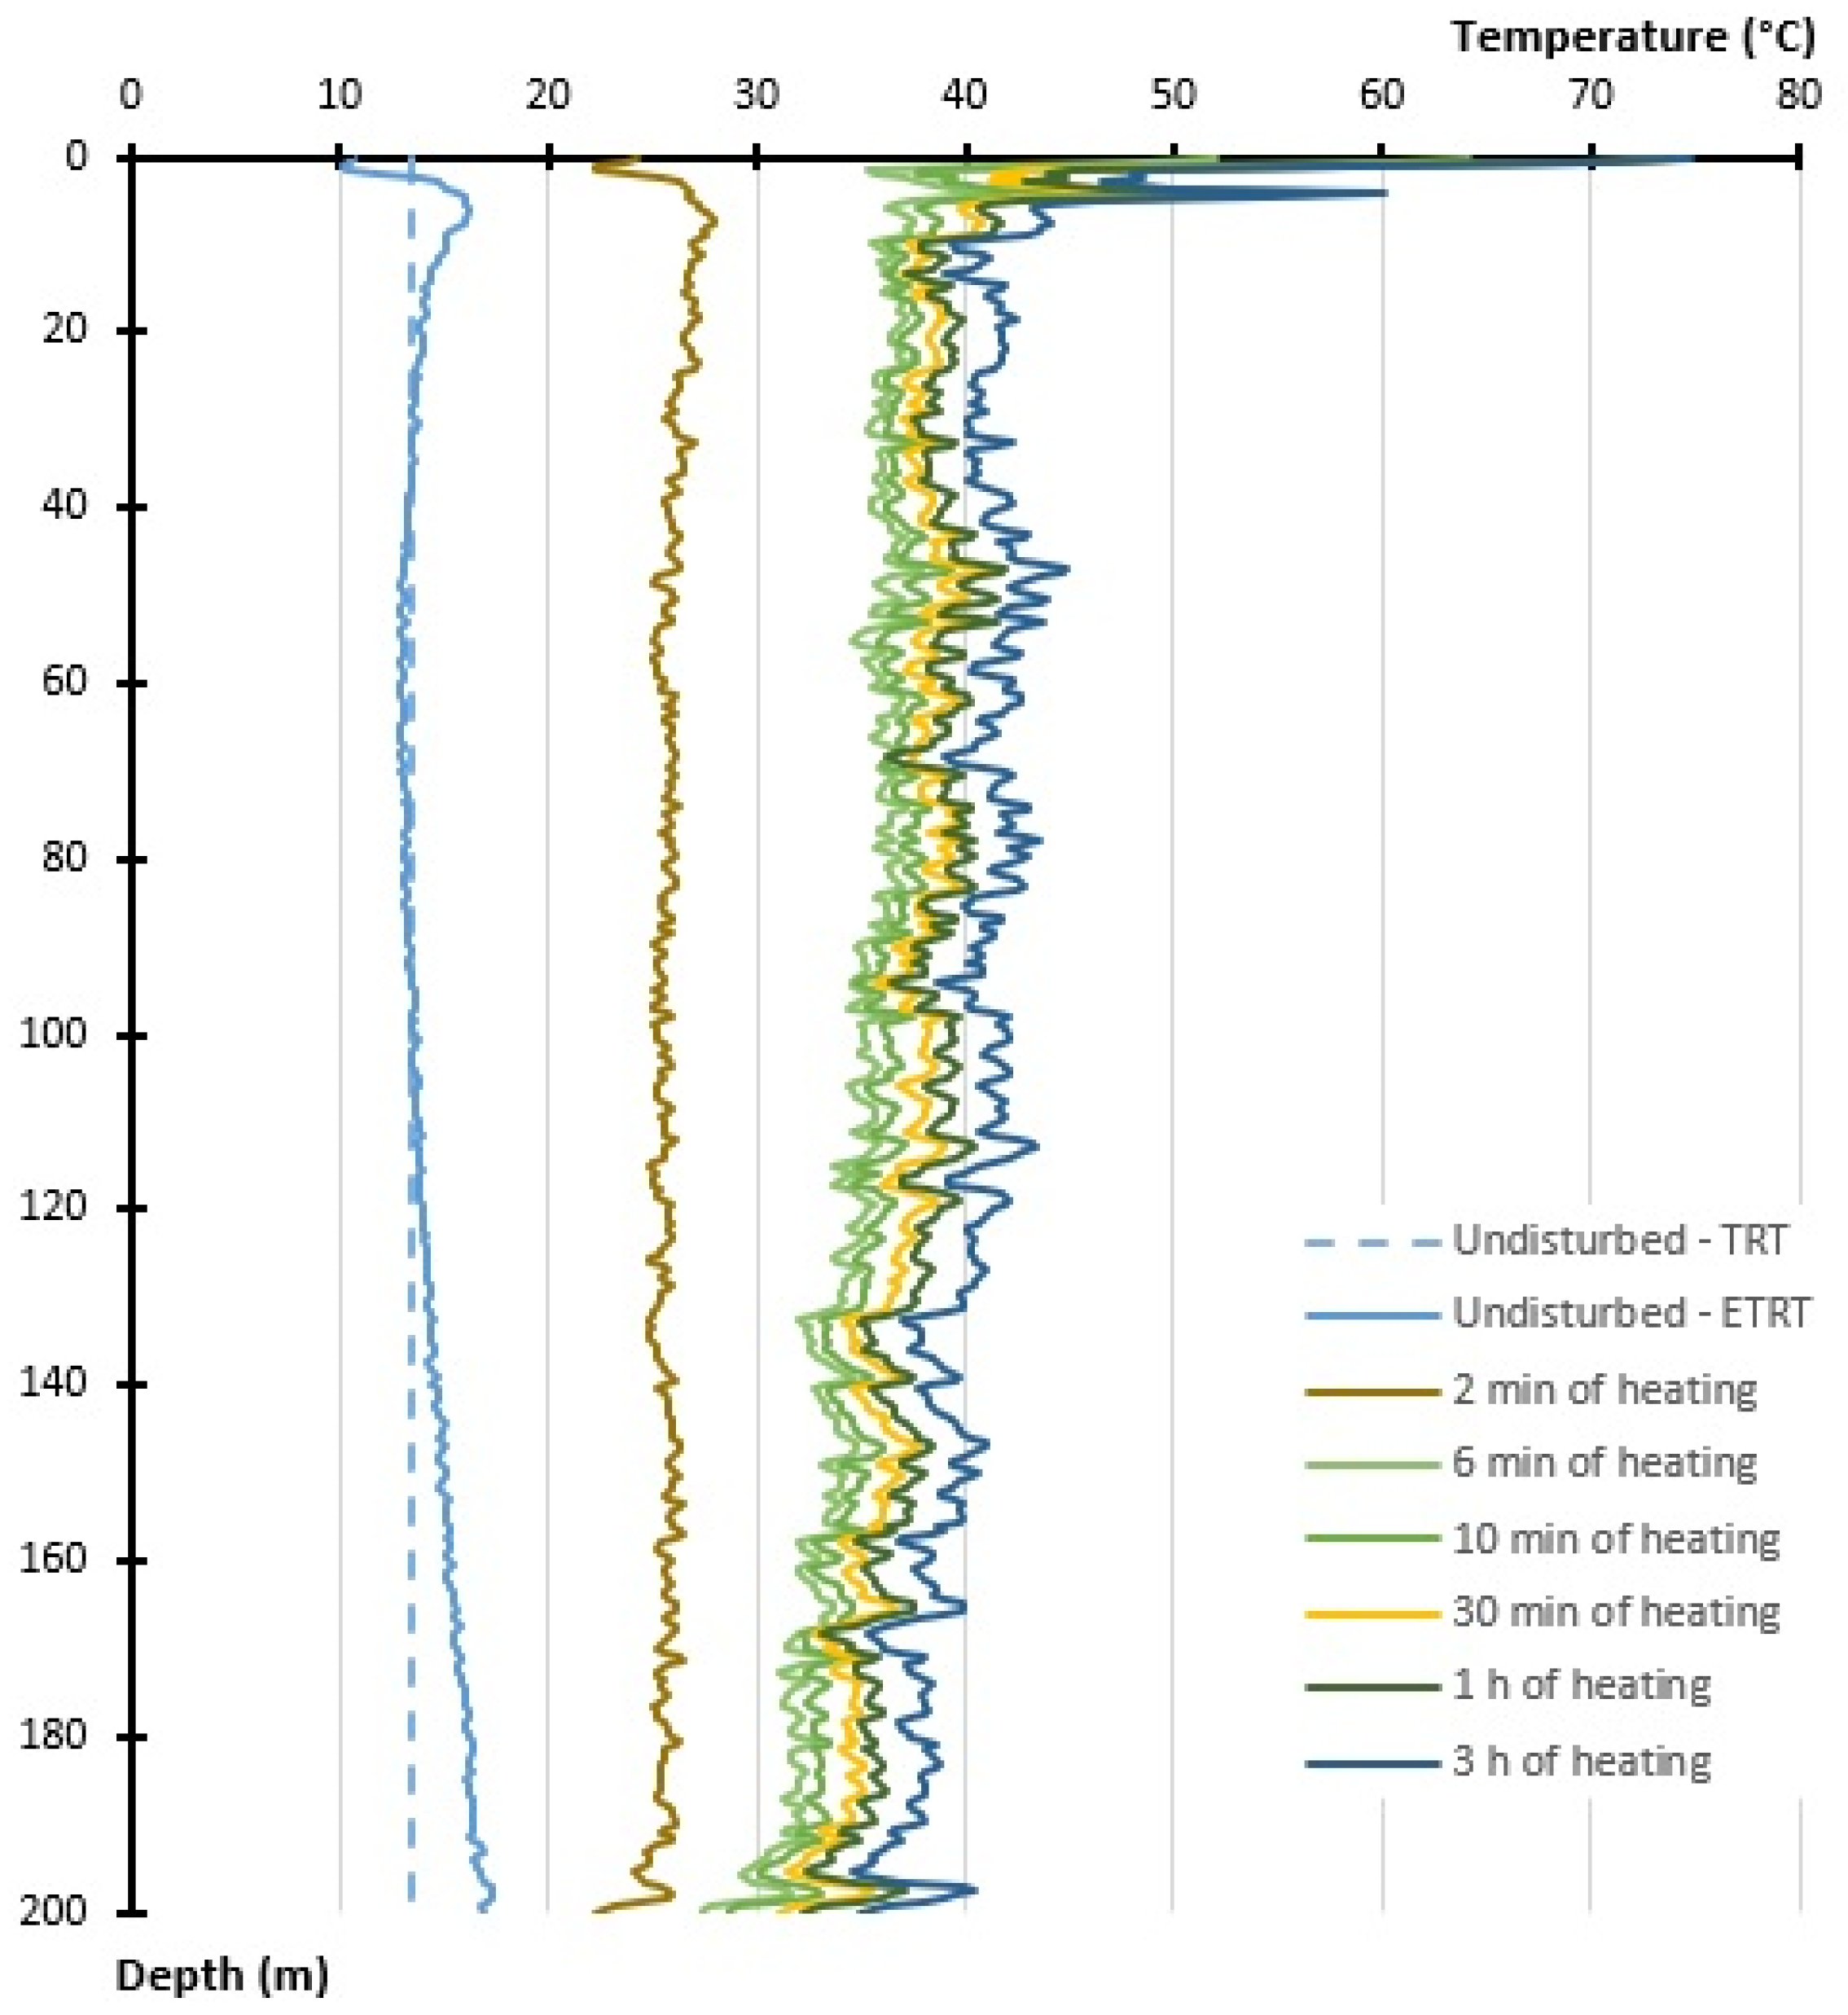
In the initial stage of the ETRT, the measurement of the undisturbed profile of temperatures took place. Figure 6 presents the temperature profiles measured along the length of the borehole, during the initial phase and the initial part of heating phase, along with the average value obtained from the TRT. Regarding the undisturbed temperature profile, it is apparent that the first few meters is significantly influenced by the ambient temperature, and the temperature quickly increases until it stabilizes. No particular evidence is shown regarding the transition from the superficial gravel layer and the layer of silty sand, at 11 m deep. After 15–20 m in depth, the temperature profile follows a different pattern, slowly decreasing, stabilizing, and then slowly increasing at a rate of 25.5 °C/km, which is considered a typical value for the temperature gradient in the crust. In the absence of any obvious temperature anomalies, the ground does not appear to have been affected by any external heat sources. Over the depth of the BHE, the average undisturbed soil temperature was inferred to be 13.9 °C. The 0.5 °C difference with respect to the conventional TRT is thought to be due to the differences in the respective methodologies.
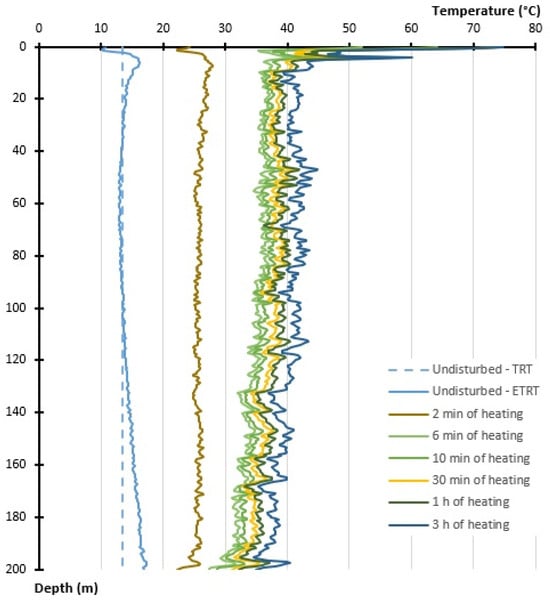
Figure 6.
Measured temperature profile during the initial part of the heating phase.
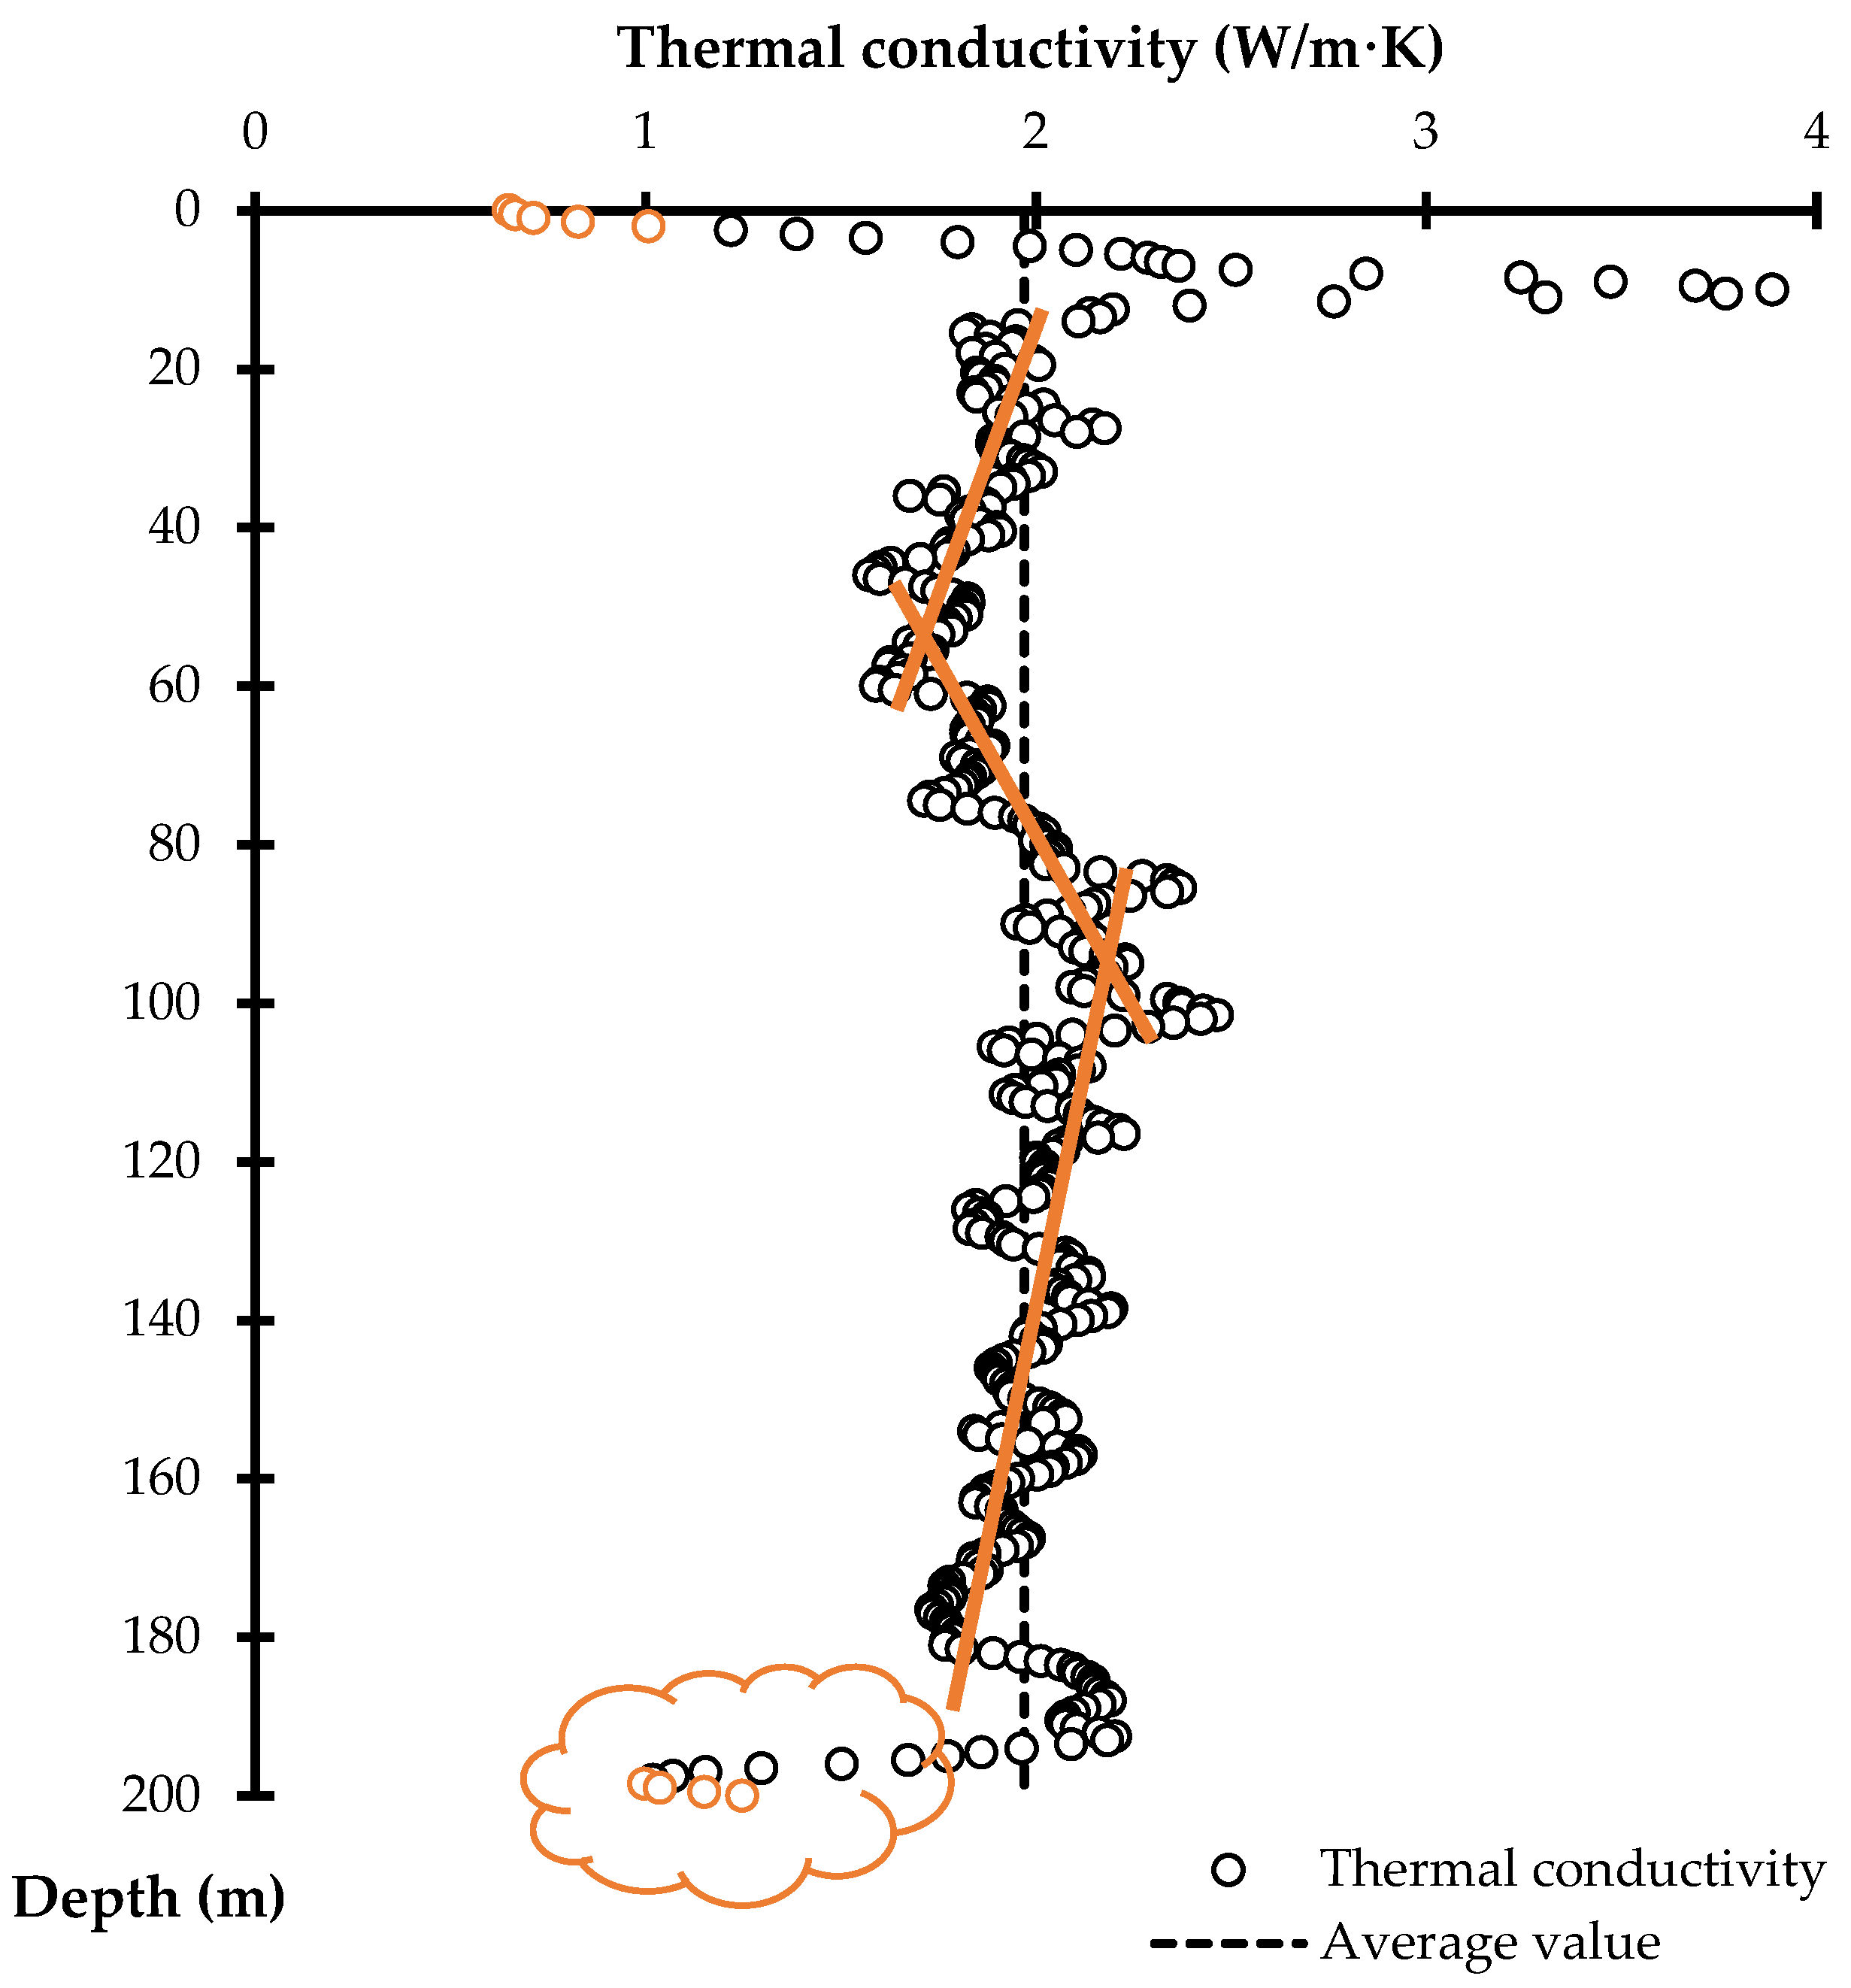
Figure 7 presents the interpreted distributed thermal conductivity profile along the borehole derived from the ETRT and the simple average of these values, given for comparison with the TRT. Several interesting features are apparent in the data:

Figure 7.
Thermal conductivity profile along the depth of the borehole, where values at the ends, indicated by orange circles, were disregarded.
- There are very low values near surface and the end of the borehole, as indicated as orange circles in Figure 7. These values are attributed to the fact that on the edges of the borehole, a radial heat flow is not obtained, since there is a heat transfer to the surface of the ground and to areas deeper than the borehole.
- Thermal conductivity values increase up to 3.9 W/m·K locally, between about 8 and 11 m depth, which is attributed to the presence of groundwater. Otherwise, due to the absence of large increases in thermal conductivity elsewhere, the profile shows no signs of groundwater flow affecting heat exchange.
- The thermal conductivity profile presents some trends of increasing and decreasing values with depth, as indicated by the orange lines in Figure 7. From 15–60 m, it reduces; from 60–100 m it increases; and from 100 m on, it reduces again. These results suggest eventual changes in the proportions of silt and sand in the silty-sand ground layer.
The average thermal conductivity was evaluated by calculating the arithmetic average value between 2 m and 198.5 m depth, and a value of 1.97 W/m·K was obtained.
4.3. Discussion
The results from both tests show quite a good agreement between them. In regard to the undisturbed ground temperature, a difference of 0.4 °C is obtained between the results from the TRT and the arithmetic average value from the ETRT. The annual mean temperature of Vienna is about 11.5 °C (data from Central Institute for Meteorology and Geodynamics), about 2 °C lower than the results obtained, which suggests some heat island effect influencing the undisturbed soil temperature. Vienna’s heat island effect has been already documented, e.g., in [30].
Regarding the thermal conductivity, from the conventional TRT, a value of 1.83 W/m·K was obtained, while the ETRT yielded an average value of 1.97 W/m·K, a difference of about 8%. This difference agrees with other available results in literature, which results in differences less than 10% [16]. There are a few possible factors for the difference between the results of both tests, including differences in the test setup, equipment, heat flow regime introduced in the ground, and method of test interpretation, as mentioned in Section 2.3.
The value of borehole thermal resistance could only be evaluated by the conventional TRT, which yielded a value of 0.113 m·K/W. From the results of the ETRT, there is no direct way to estimate the borehole thermal resistance (which by definition is the thermal resistance between the circulating fluid inside a BHE and the surrounding ground), but there are analytical methods available from which an estimate of this key design parameter can be made [31], which requires the thermal properties of all the materials involved.
Concluding on the application of these values, a difference of 8% most likely will not have a significant impact on the design solution of the SGE system to be installed.
Regarding the use of these tests for the estimation of key design parameters for SGE applications, both tests have been proven to be able to provide an estimation of the thermal conductivity of the ground upon meeting some mentioned conditions. In addition to the DTS equipment needed, one can assume that the hybrid cable is more expensive than regular piping equipment, but the ETRT does not need any heat carrier fluid or circulating pump. ETRTs can be justified, as the results provide more information about the ground conditions and the variation of the thermal conductivity with depth, allowing for more flexibility in the design process (changes in BHE length) and an eventual optimization of the energy system. So, depending on the size of the SGE system to be installed and the site conditions, it is advisable to consider the need of a depth-resolved thermal conductivity profile.
5. Conclusions
SGE has the potential to positively impact the decarbonisation of societies, and its exploitation can be facilitated using GSHP systems. The design of GSHP systems requires knowledge of ground thermal properties to determine their capacity to act as heat sources, sinks, or storage media.
Usually, the ground thermal properties are evaluated using field tests. TRTs are commonly performed to assess the thermal conductivity of the ground, but new field investigation techniques with the same overall aim have been proposed. One of these is the ETRT, which involves depth-resolved temperature monitoring, and, thus, thermal conductivity estimation.
Although the ETRT can be more expensive to implement than the TRT, in some cases, this is justified in order to have a depth-resolved thermal conductivity profile for the optimisation of the energy system. In this paper, a comparison between a conventional TRT and an ETRT is made based on a field campaign where both tests were undertaken in the same BHE for an SGE system to be installed in Vienna, Austria.
A difference of 8% in the estimation of ground thermal conductivity between the results of both techniques was obtained, and a qualitative comparison was performed. This difference agrees with other available results in the literature and is unlikely to have a significant impact on the design solution of the SGE system to be installed.
Author Contributions
Conceptualization, J.d.S.F. and P.B.-W.; methodology, J.d.S.F.; GeoDTS N4388A software, S.N.; validation, P.B.-W. and S.W.; formal analysis, J.d.S.F. and S.N.; investigation, J.d.S.F.; resources, S.W.; data curation, S.N. and J.d.S.F.; writing—original draft preparation, J.d.S.F.; writing—review and editing, J.d.S.F. and P.B.-W.; visualization, J.d.S.F.; supervision, P.B.-W.; project administration, J.d.S.F.; funding acquisition, J.d.S.F. and P.B.-W. All authors have read and agreed to the published version of the manuscript.
Funding
This research was funded by the Foundation for Science and Technology (FCT) of Portugal through an individual scholarship, grant number SFRH/BD/128845/2017 and FCT’s support of the research unit CERIS through grant no. UIDB/04625/2020.
Data Availability Statement
The data presented in this study are available on request from the corresponding author due to (specify the reason for the restriction: e.g., privacy, legal or ethical reasons).
Acknowledgments
The first author would like to thank the Foundation for Science and Technology (FCT) of Portugal for the PhD scholarship, ref. SFRH/BD/128845/2017. Also, this work was possible due to the international placement of the first author in ENERCRET Gmbh, funded by EIT InnoEnergy PhD School. FCT also supports the research unit CERIS through grant no. UIDB/04625/2020. The first author wishes to express their gratitude for the opportunity to partake in the international placement with ENERCRET Gmbh which was funded by the EIT InnoEnergy PhD School.
Conflicts of Interest
Authors Stefan Nachbaur and Stefan Wehinger are employed by the company ENERCRET Gmbh. The remaining authors declare that the research was conducted in the absence of any commercial or financial relationships that could be construed as a potential conflict of interest.
References
- Florides, G.; Kalogirou, S. Ground heat exchangers—A review of systems, models and applications. Renew. Energy 2007, 32, 2461–2478. [Google Scholar] [CrossRef]
- Sanner, B.; Karytsas, C.; Mendrinos, D.; Rybach, L. Current status of ground source heat pumps and underground thermal energy storage in Europe. Geothermics 2003, 32, 578–588. [Google Scholar] [CrossRef]
- Bayer, P.; de Paly, M.; Beck, M. Strategic optimization of borehole heat exchanger field for seasonal geothermal heating and cooling. Appl. Energy 2014, 136, 445–453. [Google Scholar] [CrossRef]
- Sanner, B.; Hellström, G.; Spitler, J.; Gehlin, S. Thermal Response Test—Current Status and World-Wide Application. In Proceedings of the World Geothermal Congress, Antalya, Turkey, 24–29 April 2005. [Google Scholar]
- ISO 17628:2015; Geotechnical Investigation and Testing—Geothermal Testing—Determination of Thermal Conductivity of Soil and Rock Using a Borehole Heat Exchanger. CEN: Brussels, Belgium, 2015.
- Gehlin, S.; Hellström, G. Comparison of four models for thermal response test evaluation. ASHRAE Trans. 2003, 109, 131–142. [Google Scholar]
- Wilke, S.; Menberg, K.; Steger, H.; Blum, P. Advanced thermal response tests: A review. Renew. Sustain. Energy Rev. 2020, 119, 109575. [Google Scholar] [CrossRef]
- Gehlin, S. Thermal Response Test—Method Development and Evaluation. Ph.D. Thesis, Lulea University of Technology, Lulea, Sweden, 2002. [Google Scholar]
- Aranzabal, N.; Martos, J.; Montero, A.; Soret, J.; García-Olcina, R.; Torres, J. Design and test of an autonomous wireless probe to measure temperature inside pipes. In Proceedings of the 28th International Conference on Efficiency, Cost, Optimization, Simulation and Environmental Impact of Energy Systems, Pau, France, 29 June–3 July 2015. [Google Scholar]
- Fujii, H.; Okubo, H.; Nishi, R.; Itoi, R.; Ohyama, K.; Shibata, K. An improved thermal Response test for U-tube ground heat exchanger based on optical fiber thermometers. Geothermics 2009, 38, 399–406. [Google Scholar] [CrossRef]
- Acuña, J.; Palm, B. Distributed thermal response test on pipe-in-pipe borehole heat exchangers. Appl. Energy 2013, 109, 312–320. [Google Scholar] [CrossRef]
- Dornstädter, J.; Heidinger, P.; Heinemann, B. Glutsch Erfahrungen aus der Praxis mit dem Enhanced Geothermal Response Test (EGRT). Geothermics 2008, 11, 271–279. [Google Scholar]
- Vélez Márquez, M.; Raymond, J.; Blessent, D.; Philippe, M.; Simon, N.; Bour, O.; Lamarche, L. Distributed thermal response tests using a heating cable and fiber optic temperature sensing. Energies 2018, 11, 3059. [Google Scholar] [CrossRef]
- Galgaro, A.; Pasquier, P.; Schenato, L.; Cultrera, M.; Dalla Santa, G. Soil Thermal Conductivity from Early TRT Logs Using an Active Hybrid Optic Fibre System. In Proceedings of the IGSHPA Research Track, Stockholm, Sweden, 18–19 September 2018. [Google Scholar] [CrossRef]
- Vieira, A.; Alberdi-Pagola, M.; Christodoulides, P.; Javed, S.; Loveridge, F.; Nguyen, F. Characterisation of ground thermal and thermo-mechanical behaviour for shallow geothermal energy applications. Energies 2017, 10, 2044. [Google Scholar] [CrossRef]
- Zhang, B.; Gu, K.; Shi, B.; Liu, C.; Bayer, P.; Wei, G.; Gong, X.; Yang, L. Actively heated fiber optics based thermal response test: A field demonstration. Renew. Sustain. Energy Rev. 2020, 134, 110336. [Google Scholar] [CrossRef]
- Figueira, J.; Vieira, A. Métodos de caracterização térmica do solo para aproveitamentos geotérmicos superficiais. In Proceedings of the 15th Geotechnics National Congress, Porto, Portugal, 19–23 June 2016. [Google Scholar]
- Vries, D. Physics of Plant Environment; van Wijk, W.R., Ed.; Technological University Eindhoven: Amsterdam, The Netherlands, 1963. [Google Scholar]
- Johansen, O. Thermal Conductivity of Soils; Cold Regions Research and Engineering Laboratory: Hanover, NH, USA, 1977. [Google Scholar]
- Usowicz, B. Statistical-Physical Model of Thermal Conductivity in Soil. Pol. J. Soil Sci. 1992, XXV, 25–34. [Google Scholar]
- Rees, S.W.; Adjali, M.H.; Zhou, Z.; Davies, M.; Thomas, H.R. Ground heat transfer effects on the thermal performance of earth-contact structures. Renew. Sustain. Energy Rev. 2000, 4, 213–265. [Google Scholar] [CrossRef]
- C177-13; Standard Test Method for Steady-State Heat Flux Measurements and Thermal Transmission Properties by Means of the Guarded-Hot-Plate Apparatus. ASTM International: West Conshohocken, PA, USA, 2013.
- C518-15; Standard Test Method for Steady-State Thermal Transmission Properties by Means of the Heat Flow Meter Apparatus. ASTM International: West Conshohocken, PA, USA, 2015.
- E1225-13; Standard Test Method for Thermal Conductivity of Solids Using the Guarded Comparative-Longitudinal Heat Flow Technique. ASTM International: West Conshohocken, PA, USA, 2013.
- D5334-14; Standard Test Method for Determination of Thermal Conductivity of Soil and Soft Rock by Thermal Needle Probe Procedure. ASTM International: West Conshohocken, PA, USA, 2014.
- D5930-16; Standard Test Method for Thermal Conductivity of Plastics by Means of a Transient Line-Source Technique. ASTM International: West Conshohocken, PA, USA, 2016.
- Tong, X.C. Advanced Materials for Thermal Management of Electronic Packaging; Springer Series in Advanced Microelectronics; Springer Science & Business Media: Berlin/Heidelberg, Germany, 2011; Volume 30. [Google Scholar]
- Chiasson, D. Geothermal Heat Pump and Heat Engine Systems: Theory and Practice, 1st ed.; Wiley: Hoboken, NJ, USA, 2016; pp. 169–175. [Google Scholar]
- AP Sensing. GeoDTS N4388A. Available online: https://www.apsensing.com/fileadmin/001___PORTAL__/001_documents/brochures/AP-Sensing_GeoDTS-geothermal-rating_0210.pdf (accessed on 26 May 2024).
- Kiesel, K.; Vuckovic, M.; Orehounig, K.; Mahdavi, A. Analysis of micro climatic variations and the urban heat island phenomenon in the city of Vienna. In Proceedings of the EURA Conference, Vienna, Austria, 20–22 September 2012. [Google Scholar]
- Javed, S.; Spitler, J.D. Calculation of borehole thermal resistance. In Advances in Ground-Source Heat Pump Systems, 1st ed.; Rees, S.J., Ed.; Woodhead Publishing: Sawston, UK, 2016; pp. 63–95. [Google Scholar] [CrossRef]

Disclaimer/Publisher’s Note: The statements, opinions and data contained in all publications are solely those of the individual author(s) and contributor(s) and not of MDPI and/or the editor(s). MDPI and/or the editor(s) disclaim responsibility for any injury to people or property resulting from any ideas, methods, instructions or products referred to in the content. |
© 2024 by the authors. Licensee MDPI, Basel, Switzerland. This article is an open access article distributed under the terms and conditions of the Creative Commons Attribution (CC BY) license (https://creativecommons.org/licenses/by/4.0/).