Article

Electromobility as a Challenge of Modern City Logistics—Indicator Analysis

by
Agnieszka Pokorska
and
Tomasz Wiśniewski
*
Institute of Management, University of Szczecin, Cukrowa 8 Street, 71-004 Szczecin, Poland
*
Author to whom correspondence should be addressed.
Energies 2024, 17(13), 3167; https://doi.org/10.3390/en17133167
Submission received: 23 May 2024 / Revised: 20 June 2024 / Accepted: 24 June 2024 / Published: 27 June 2024

Abstract

:
Electromobility is the challenge of modern cities. The following article explores this issue. The article presents the authors’ assessment of the impact of sustainable urban mobility indicators on the development of electromobility strategies in cities. The purpose of the paper is to describe which indicators of sustainable urban mobility may influence the development of electromobility strategies in cities by increasing the number of not only low-emission cars (electric and hybrid) and low-emission buses but also public bicycles. The hypothesis posited in the work is: sustainable urban mobility is an important factor in the development of electromobility in cities. Our literature analysis, expert research, and statistical analysis allowed us to prepare a possibly comprehensive set of indicators for sustainable urban mobility that have a potential impact on the development of electromobility strategies. We ran a thematic analysis of systematic literature reviews and collected around 50 specific types of indicators and measures of sustainable mobility. After consulting the indicator database with experts, we expanded a list of 21 indicators of sustainable mobility. Next, using regression analysis, it was determined which of the sustainable urban mobility indicators is the most important for the development of electromobility strategies in the three identified transport systems.

1. Introduction

The global climate and environmental crisis are leading countries and their cities to strive for a low-emission and ecological transformation of society and the economy [1,2,3,4,5,6] while also using modern technologies for this purpose [7]. Therefore, low-emission transport is considered key to the promotion of low-emission development, with the reduction and neutrality of CO2 emissions being one of the development goals of this sector [8]. A city developing in a sustainable manner strives to maintain appropriate relations between economic growth, care for the environment, and the quality of life of its inhabitants. All components of the functioning of cities, such as education, culture, transport, housing, urban infrastructure, as well as the natural environment, are subject to constant pressure due to the needs and growing expectations of residents, as well as the increasing requirements resulting from national regulations and international standards [9]. Cities on the path to sustainable development will have to face various barriers and emerging challenges. One way to achieve sustainability, although fraught with many risks, is the electromobility strategy. The choice of research topic was determined by its topicality. The analyses conducted so far and the results published have focused only on issues related to sustainable development or urban mobility; it has been noticed that there is no connection between sustainable urban mobility and the electromobility strategy in cities measured using indicators [10].
A fundamental aspect of sustainable urban mobility is the continuous creation of formal and technical frameworks for economically, socially, and ecologically balanced processes in the city, and one of the actions is to increase the share of electric vehicles in the transport services of the city, economy, and residents. The ongoing energy transformation on a global scale, caused by the development of new technologies, environmental and climate protection policies, as well as the desire to reduce import dependence on fossil fuels, has led to the transformation of economic structure, affecting subsequent industries by increasing energy efficiency and reducing external costs while at the same time improving quality of life. In the short term, countries can continue to implement, enforce, and tighten regulatory measures such as CO2 emissions and fuel consumption standards and electric vehicle mandates. Taxing gasoline and diesel oil at rates reflecting their impact on the environment and human health may increase state budget revenues, reduce the negative impact on the environment, and consequently accelerate the development of electromobility. Urban electromobility is a strategic priority of the European Union, not only in ecological but also economic aspects. Polish and EU regulations introduce high environmental standards for cities, which affects the planning of transport development and its electrification. The result of these activities, especially in the period of an unstable and dynamic global situation, is a gradual decrease in dependence on oil imports and a decrease in air pollution. However, the pluralism of local economic, social, political, and technical conditions makes it impossible to establish a common standard for implementing sustainable mobility in cities, posing numerous challenges and development barriers. In the face of a number of barriers and challenges facing city authorities, it is necessary to identify actions that will support the development of electromobility in urban areas; one of them may be the creation of a set of indicators for the development of electromobility strategies in cities.

2. Materials and Methods

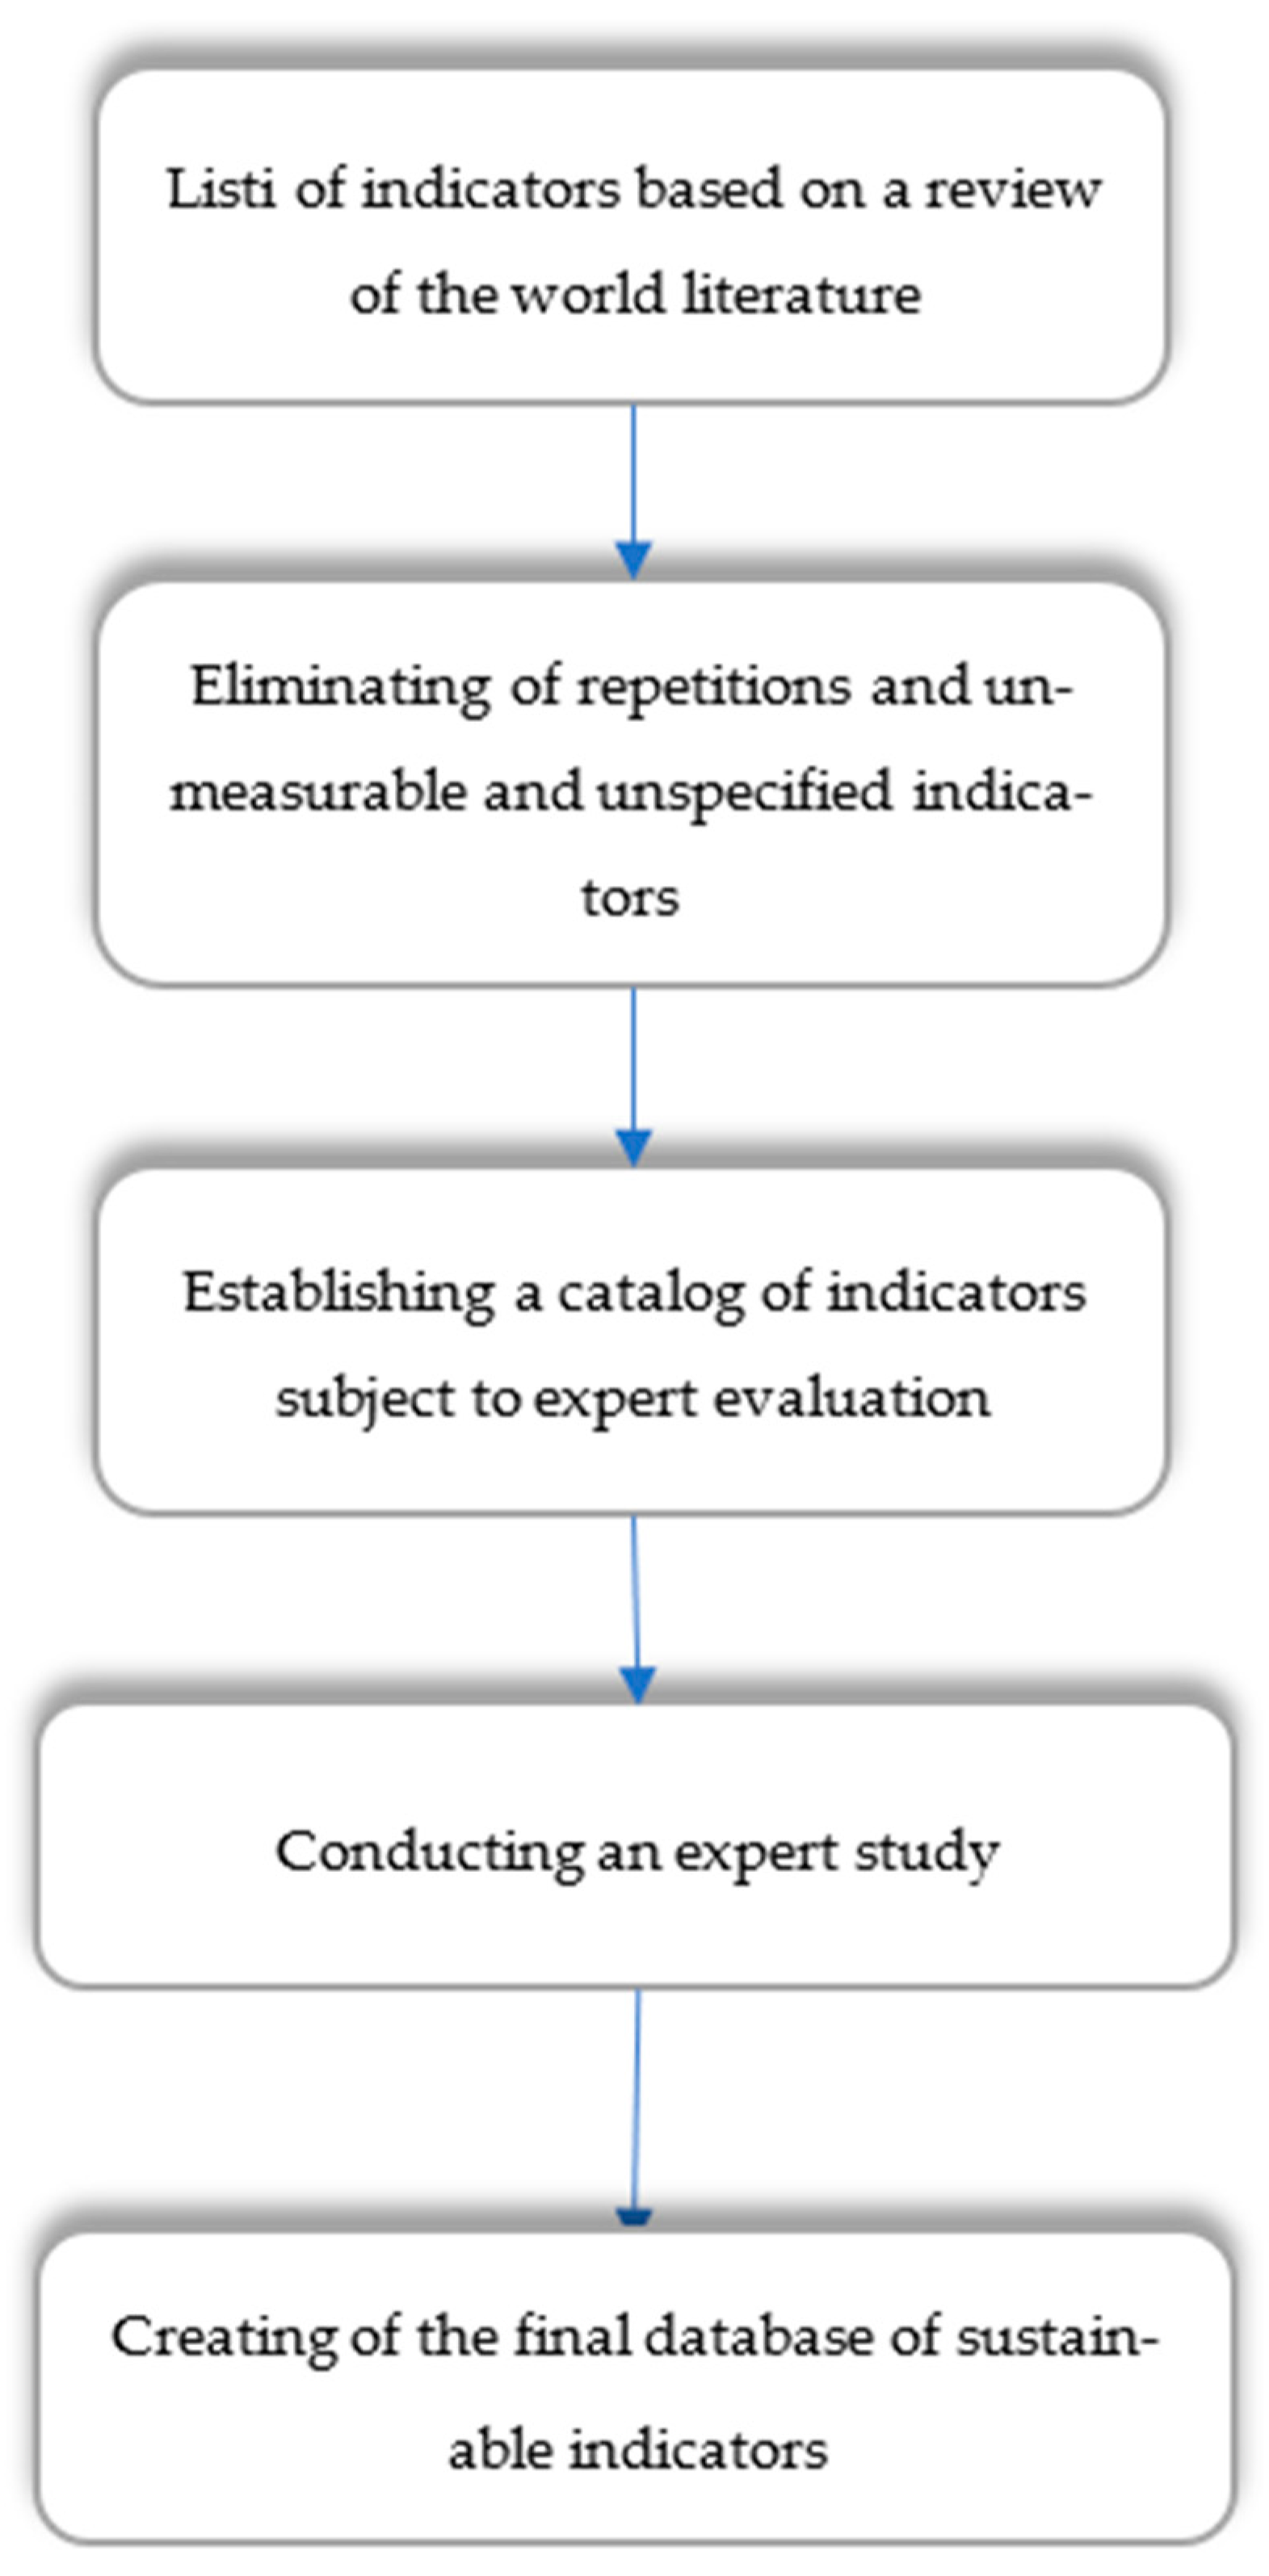
2.1. Research Procedure for Empirical Analysis

Criticism of the research problem in light of the achievements of science to date have been made continuously, throughout the writing of this work and the collection of scientific materials. The actual analysis and research covered cities in Poland in 2018–2022. The criterion for selecting cities was the population as of 31 December 2022 (Table 1) because the largest urban agglomerations face communication problems, congestion, and environmental pollution, and their greatest challenge is the pursuit of sustainable mobility and the development of electromobility strategies.
The primary research included correspondence carried out with the communication departments of city halls, selected in a targeted selection of 10 agglomerations in Poland, and public transport departments. The collected data concern the number of hybrid and electric passenger cars, the number of low-emission buses, and the price of monthly tickets (for buses) in the years 2018–2022 in a given city. In parallel, based on literature research, a database of sustainable urban mobility indicators was prepared and sent to experts in the form of an expert research questionnaire. The prepared expert research questionnaire concerned the separation of sustainable urban mobility indicators from the indicated database, including those that influence the development of electromobility strategies in cities. The questionnaire was sent to 15 experts in the field of electromobility, both practitioners—car manufacturers, mayors of the surveyed cities, and electricity distributors in Poland—and theoreticians publishing in the field of electromobility, in order to have a broad view of the studied problem. The experts’ task was to identify variables from the database of sustainable urban mobility indicators that, according to them, have a significant impact on the possibility of developing an electromobility strategy.
The analysis of the expert research questionnaire was the basis for the selection of sustainable urban mobility indicators for further statistical analysis in order to determine their significance for the development of the electromobility strategy. Statistical research, conducted after obtaining the required secondary data from cities, made it possible to identify connections between sustainable urban mobility and the electromobility strategy and to verify the main research hypothesis: sustainable urban mobility is an important factor in the development of electromobility in cities. The steps presented allowed for the selection of research methods adequate to the obtained data. To achieve the assumed goals, it was decided to choose the linear regression method, which from the created set of sustainable urban mobility indicators identified the key factors for the development of electromobility strategies in cities.

2.2. Identifying Indicators of Sustainable Urban Mobility

A search of the literature on the subject, as well as strategic documents of cities, provided knowledge about a wide set of indicators and measures of sustainable transport and urban mobility that have been accepted by international organizations in order to assess the implemented policy (Table 2).
In order to shorten and refine the set for further analysis, a procedure for selecting indicators was developed (Figure 1). First (stage 1), repetitions and unmeasurable indicators, difficult to determine and those that were not specified by the authors of the studies, were eliminated. A detailed diagram of the stages of selecting indicators for analysis is presented in Figure 1.
The indicators from stage 1 were sent in the form of a questionnaire to the experts. The experts’ task was to select and assess from the indicated database which indicators of sustainable urban mobility influence the development of the electromobility strategy. The catalog of sustainable urban mobility indicators, created on the basis of experts’ responses, is presented in Table 3.
The next step is a statistical analysis of the indicators selected in the expert study, taking into account the division into groups of transport subsystems indicated by the experts: low-emission cars (electric and hybrid), low-emission buses, and public bicycles, which are part of the cities’ electromobility strategy. Measures and indicators regarding sustainable development, sustainable transport and urban mobility used to monitor the goals set by global, international, and national strategies focus primarily on the negative impact on the natural environment; they do not or only slightly take social and economic impact into account. They lack a correlation between these aspects and a holistic view, which means that a comprehensive measurement of sustainable urban mobility is not possible based on the available indicators.

3. Results

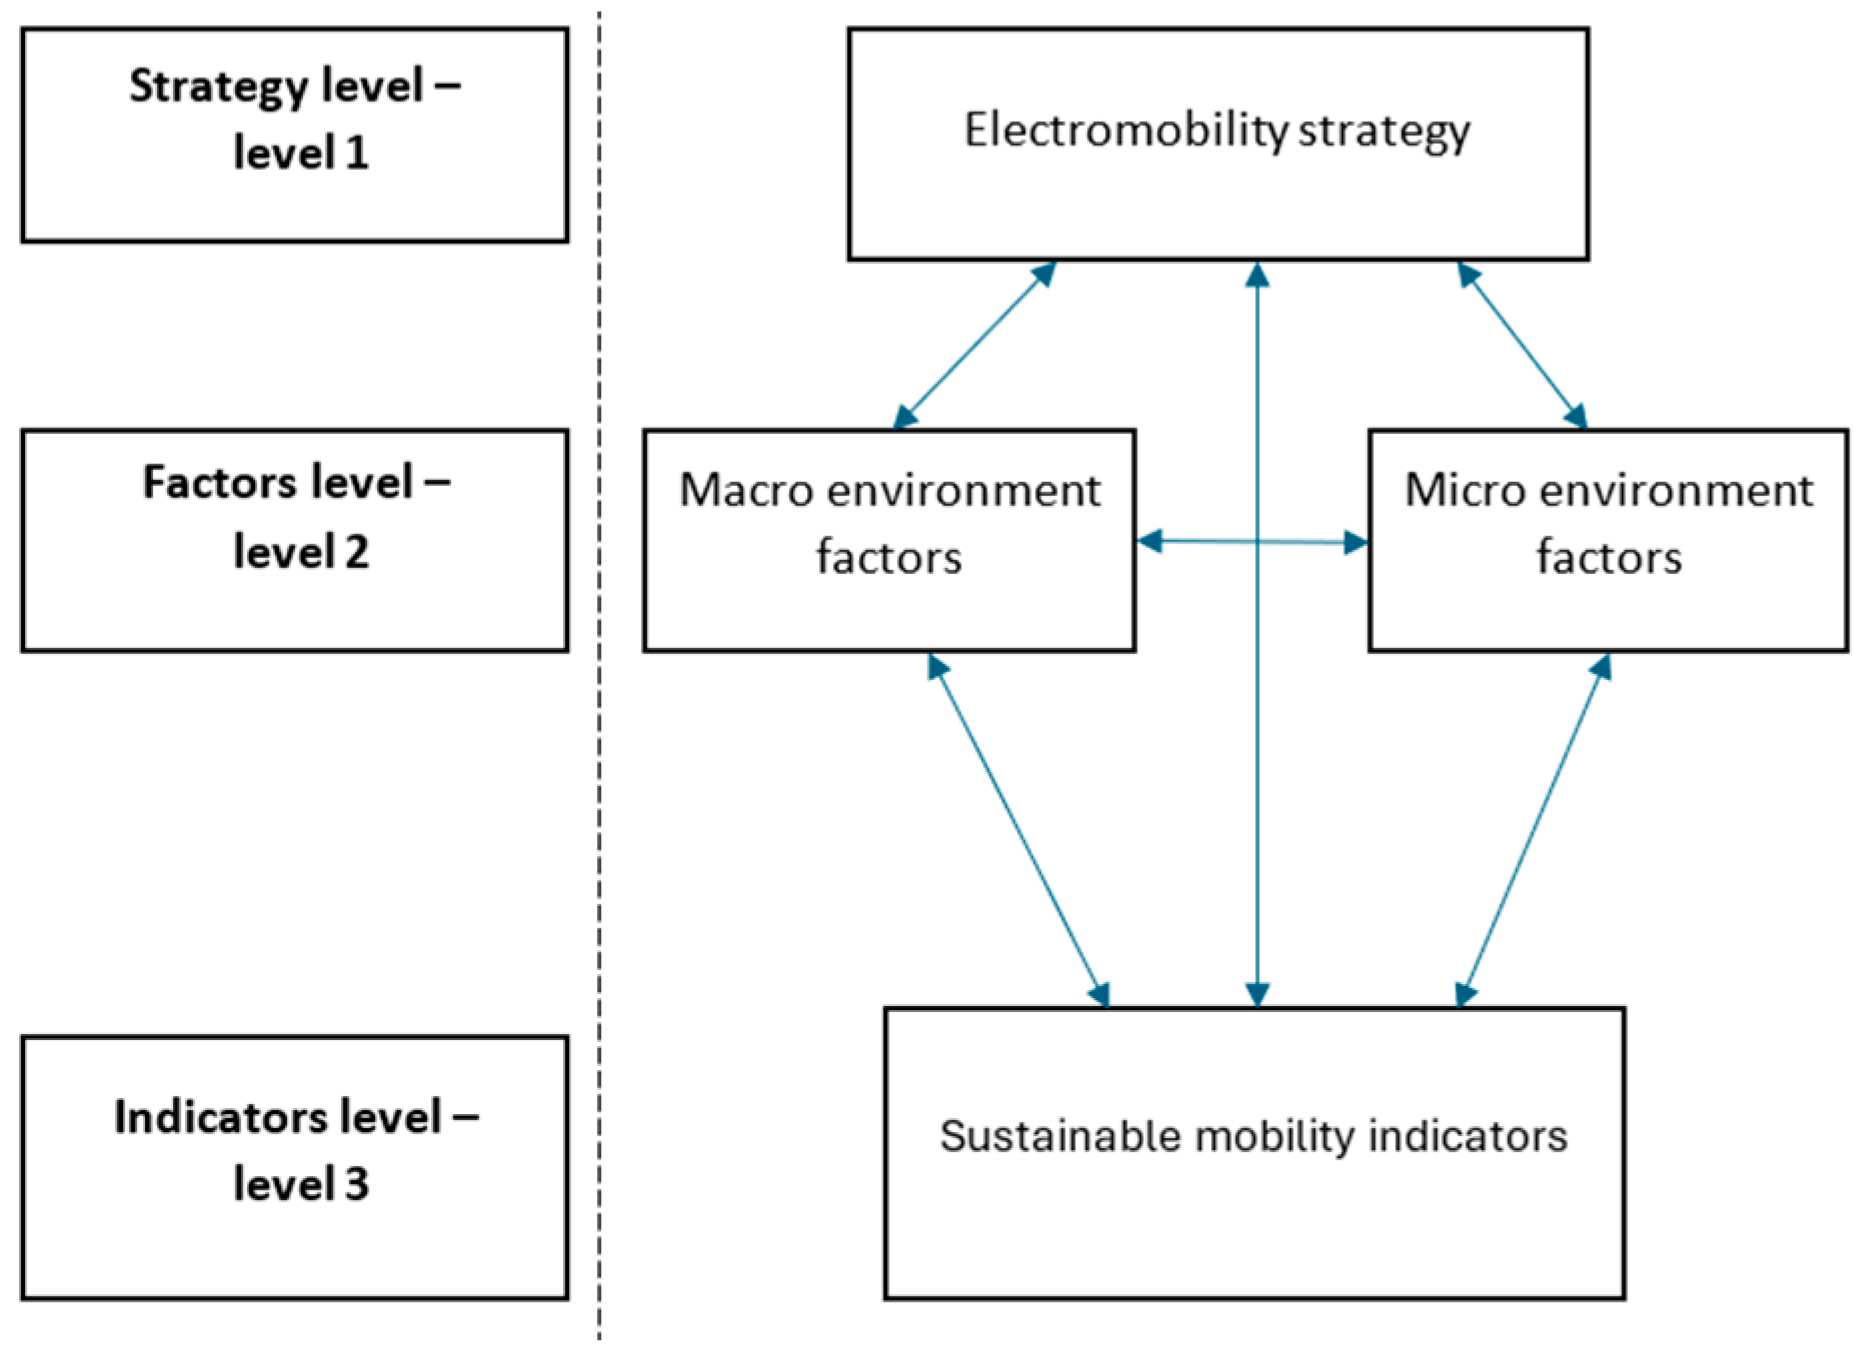
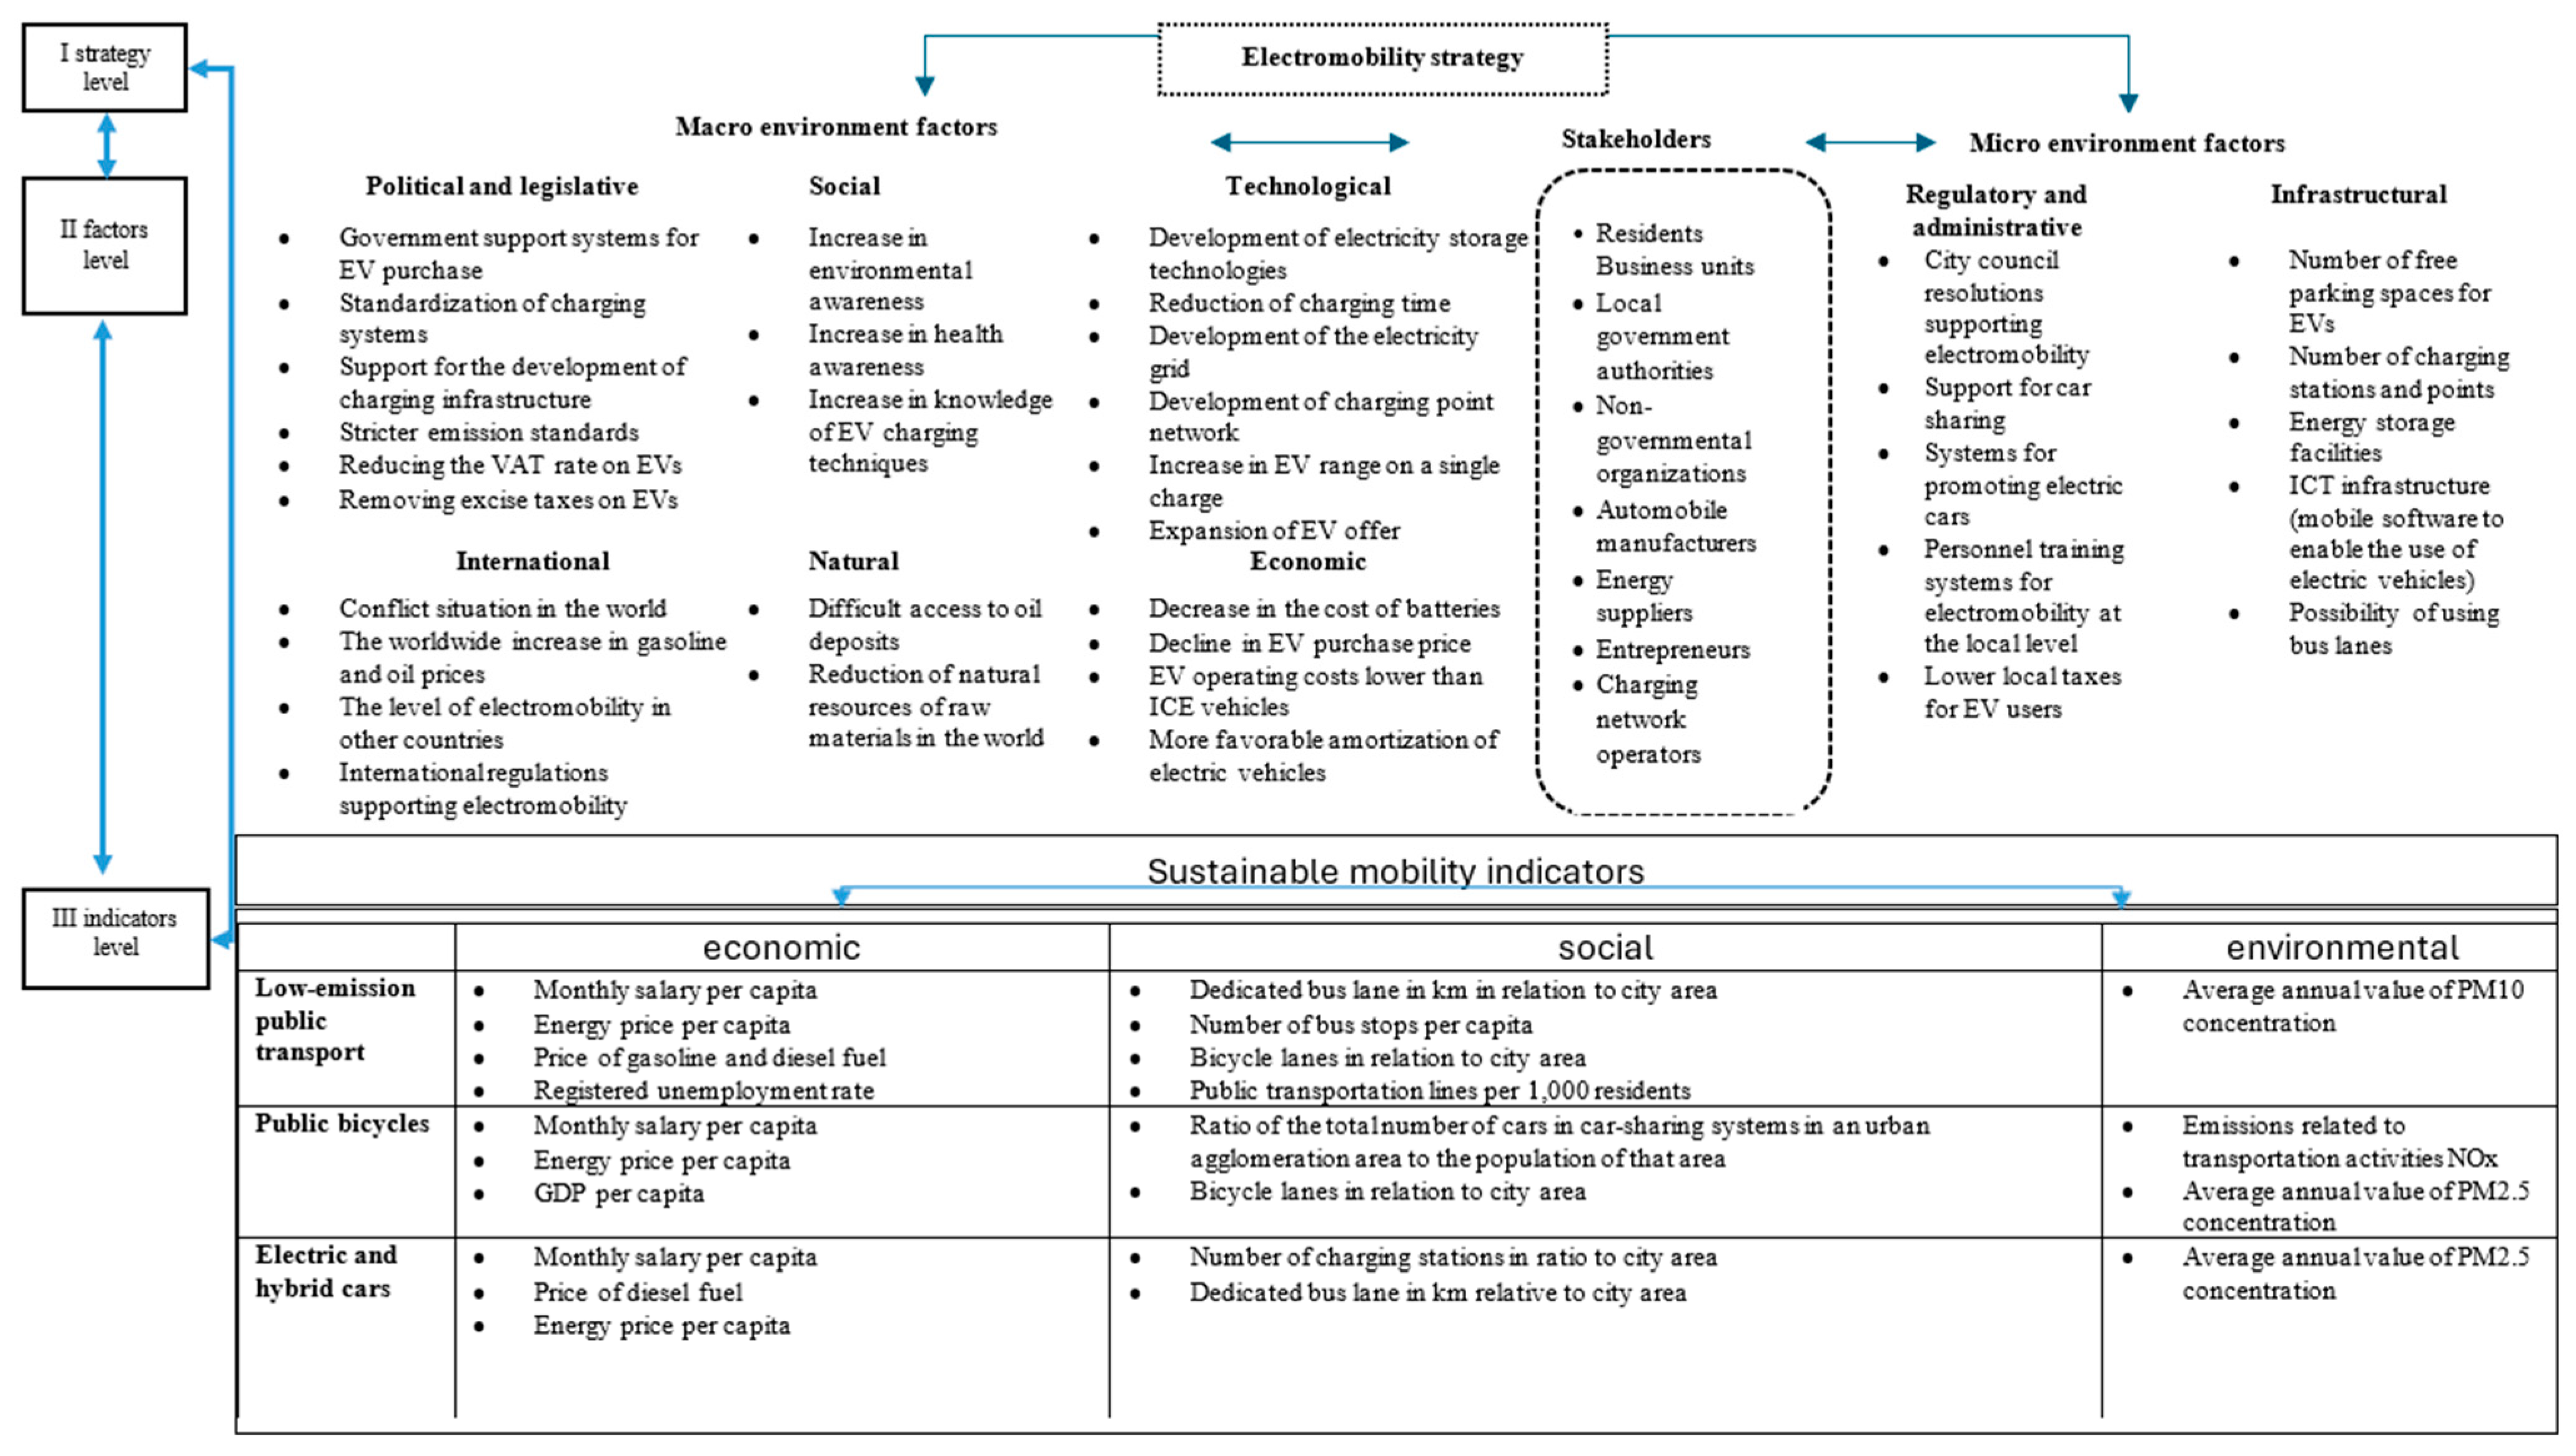
3.1. Modeling Assumptions

In accordance with the nomenclature presented in foreign literature, it is postulated that one of the possible measures of the level of electromobility is the number of electric and hybrid cars registered in a given area. Bartłomiejczyk and Kołacz [27], Połom [28], and Fernández [29] note that the introduction of electric cars is the main sign of the development of electromobility and sustainable transport in cities. The main goal of implementing the electromobility strategy in cities is to support the broadly understood electromobility policy and the sustainable development of transport and mobility, as well as ecological forms of transport. The strategy’s activities are intended to contribute to the creation of a sustainable transport system in cities, based on the development of a public transport system and alternative forms of communication within the city. The electromobility strategy aims to gradually replace the driving of conventional vehicles by residents with electric and emission-free ones. The electromobility strategy seeks to create favorable conditions for the growth of electromobility in cities by modifying current infrastructure and undertaking various initiatives to improve its effectiveness and support the expansion of the low-emission vehicle market for both private and public transportation. This strategy envisions a coherent infrastructure that facilitates the movement of low-emission vehicles, improves transport connections, and includes related enhancements like bicycle paths, parking spaces, bus stops, and bus lanes. The strategy’s primary goals are to reduce the negative environmental impact of transport, enhance travel comfort within the city, protect residents’ health, and improve overall quality of life. As a result of implementing this strategy, a partial reduction in emissions of harmful substances and noise is expected, leading to long-term improvements in quality of life, including residents’ health and the natural environment. The positive impact of the implementation of the strategy will be the result of the development of zero-emission transport in the city (zero-emission buses, a system of bicycle paths, and balancing the mobility of some residents in the form of giving up individual means of transport in favor of public transport or bicycles). The literature review, considerations, and expert research allowed us to clarify the scope of the empirical study. Therefore, the electromobility strategy examined in this work applies to the market of low-emission cars (electric and hybrid), low-emission buses, and public bicycles. The study omitted other elements of micromobility in cities, such as scooters, because these are relatively new solutions; their origin in Polish cities can be said to be in 2019. The urban electromobility strategy examined in this work is therefore based on the following transport subsystems:
  • Low-emission public transport (buses),
  • Electric and hybrid cars,
  • Micromobility means of transport (public bicycles).
The time range of 2018–2022 was adopted for the study because a period of 5 years allows for the observation of potential changes over time and is accepted as sufficient at the statistical level.

3.2. Factors for Implementing Electromobility in Cities

When analyzing real phenomena and processes, even in relatively simple situations, we cannot fully explain them. Therefore, when describing the interdependencies between them, we usually use simplified models of real interdependencies. Thus, under the term model, we can understand a useful form of presentation of empirical data. When approaching the process of building a model, it is necessary to make a certain compromise between oversimplifying reality and wanting to include overly detailed data.
A frequently used statistical analysis to find the relationship between explanatory and explanatory variables is linear regression. It takes into account the issue of modeling the interdependence of the studied characteristics and involves estimating some data on the basis of others [30].
In this article, regression analysis is used to explain the effect of changes in independent variables (x1 to x21) on dependent variables (y1, y2, and y3).
The dependent variables are:
-
y1—number of electric and hybrid cars per capita
-
y2—number of public bicycles per capita
-
y3—number of public transportation vehicles per capita
The independent variables are:
-
x1—the ratio of the total number of cars in car-sharing systems in an urban agglomeration area to the population of that area
-
x2—energy price per capita
-
x3—dedicated bus lane in km in relation to the area of the city
-
x4—number of charging stations in relation to the area of the city
-
x5—number of bus stops per capita
-
x6—bicycle lanes in relation to city area
-
x7—level of congestion
-
x8—noise and vibration levels
-
x9—public transportation lines per 1000 residents
-
x10—average annual value of PM2.5 concentration
-
x11—average annual value of PM10 concentration
-
x12—emissions related to transportation activities NOx
-
x13—ratio of the cost of a 100 km trip by private transport to the price of a monthly ticket for a public transport trip in the agglomeration area
-
x14—price of gasoline
-
x15—price of diesel fuel
-
x16—registered unemployment rate
-
x17—disposable income per capita
-
x18—monthly salary per capita
-
x19—GDP per capita
-
x20—ratio of the population of an urban agglomeration to its urbanized area
-
x21—year
The study began with the construction of a comprehensive model containing the entire set of independent variables affecting the phenomenon under consideration. The components of the built, very comprehensive model were then tested in order to identify less extensive submodels that explain the phenomenon under study. Finally, among these potential submodels, the simplest one was selected, which, on a saving basis, is treated as the best one describing the phenomenon under study. To simplify it, the backward stepwise regression method was used. Simple models are preferred for practical reasons: they are easier to retest, as well as to understand and describe. The data used, presented earlier, were city data on the number of electric and hybrid cars, low-emission buses, public bicycles, and sustainable urban mobility indicators, in such a way that the dependent variables y1, y2, and y3 and all independent variables x1 to x21 are data from each city in successive years, that is, first the 10 values (because there are so many cities) for 2018, then 10 for 2022, and so on. Then, the variable “year” is added, which will have a value of 1 in 2019, 2 in 2020, and so on.
Three analyses were conducted, separately for each of the dependent variables (y1, y2, and y3). For the number of electric and hybrid cars per capita (y1), a stepwise backward regression was performed and left seven independent variables after 15 steps:
-
x2—energy price per capita
-
x3—dedicated bus lane in km in relation to city area
-
x4—number of charging stations in relation to city area
-
x10—average annual value of PM2.5 concentration
-
x15—price of diesel fuel
-
x18—monthly salary per capita
-
x21—year (number)
Table 4 shows significance tests for the number of low-emission cars with effect sizes, p-value, and t-test. The calculations were performed in Statistica software (Statsoft v.13).
From Table 4, it can be observed that all seven parameters of the variables left after the steps in the backward regression are statistically significant—the p-values are clearly less than 0.05 (p-value is the probability of obtaining test results at least as extreme as the result actually observed, under the assumption that the null hypothesis is correct). In addition, a significance analysis of the structural parameters was carried out.
To test the significance of structural parameters b0, b1, …, b7, a t-test was used, in which the t-statistic has a Student’s t-test distribution with n-k-1 degrees of freedom.
Null and alternative hypotheses:
H0: 
bi = 0 (no linear dependence).
H1: 
bi ≠ 0 (there is a linear relationship).
The critical region is two-sided with a critical value, which we read from the t-test distribution tables for a fixed significance level a and n-k-1 degrees of freedom. If the t-value is in the critical region (calculated t-value > t-value from the table), we must reject H0 in favor of H1. Otherwise, there is no basis for rejecting H0. For the parameters in Table 4, all t values are in the critical region, so the relationship is statistically significant.
Another analysis was performed for the second dependent variable, y2—number of public bicycles (per number of residents). Table 5 shows significance tests with effect sizes. In this case, backward stepwise regression was also used, and after 14 steps, eight independent variables remained:
-
x1—the ratio of the total number of cars in car-sharing systems in a metropolitan area to the population of that area
-
x2—energy price per capita
-
x6—bicycle lanes in relation to city area
-
x10—average annual value of PM2.5 concentration
-
x12—emissions related to transportation activities NOx
-
x18—monthly salary per capita
-
x19—GDP per capita
-
x21—year (number)
From Table 5, it can be observed that all of the parameters of the variables, after 14 steps of backward regression, are statistically significant—the p-values are clearly less than 0.05. To check the significance of the structural parameters in Table 5, the values of the t-test are also shown, in each case, they are in the critical region, so statistical significance was confirmed.
Similarly, the next analysis concerned the regression model for the third dependent variable, y3—the number of low-emission buses per capita. Table 6 shows significance tests with effect sizes. This time, after 11 steps of backward regression, 11 independent variables were left:
-
x2—energy price per capita
-
x3—dedicated bus lane in km in relation to the area of the city
-
x5—number of bus stops per capita
-
x6—bicycle lanes in relation to city area
-
x9—public transportation lines per 1000 residents
-
x11—average annual value of PM10 concentration
-
x14—price of gasoline
-
x15—price of diesel fuel
-
x16—registered unemployment rate
-
x18—monthly salary per capita
-
x21—year (number)
From Table 6, it can be observed that all of the parameters of the variables, after 11 steps of backward regression, are statistically significant—the p-values are clearly less than 0.05. To check the significance of the structural parameters, Table 6 also shows the values of the t-test; in each case, they are in the critical region, so statistical significance is confirmed.
In addition, the model should be verified to see if it is acceptable [31]. A number of indicators were calculated (Table 7) to verify the presented regression model:
-
Coefficient of determination, R2—indicating what proportion of the total variability of the dependent variable—is explained by the variability of the independent variable, 0 ≤ R2 ≤ 1
-
Coefficient of variation—Vsε is a normalized measure of the dispersion of the probability or frequency distribution. The model is better the lower the value of this coefficient is.
Table 7 presents the regression model fit measures for all of the regression models presented earlier. In the case of the model describing the dependence of the number of electric and hybrid cars on indicators of sustainable urban mobility, the parameter R2 shows that 90.74% of changes in the number of electric and hybrid cars are explained by changes in the set of independent variables. For the number of public bicycles, it is very similar, with the model explaining 89.79% of the changes. For the number of public transportation vehicles, meanwhile, the found set of explanatory variables explains 96.13% of the changes. Looking at the values of the coefficient of variation parameter, we obtain the part of the standard deviation of the random component (in percent) in the average value of the dependent variables at 12.48%, 13.14%, and 7.27%, which is an acceptable level.
Summarizing the results in Table 7 and the value of the t-test from Table 4, Table 5 and Table 6, we can conclude that the regression models are statistically significant. The best fit is shown by the model for the number of public transport vehicles (especially the Vsε index). However, all models show an appropriate level of acceptability.

4. Discussion

By analyzing the results obtained in the linear regression, conclusions can be drawn regarding the significance of indicators for each of the electromobility subsystems indicated for the purposes of the article.
Table 8, Table 9 and Table 10 present a set of sustainable urban mobility indicators that have the greatest impact on the development of electromobility strategies on the studied transport subsystems in Polish cities.
The most important indicator for the development of the public bicycle subsystem seems to be the length of the infrastructure dedicated to it, i.e., bicycle paths in a given city. Moreover, the number of cars operating in the car-sharing system is important as it may indicate high ecological awareness of residents, just like the variable related to emissions from road transport.
The development of the low-emission car subsystem is dominated by indicators from the economic governance category, which indicate the wealth of residents and the price of the least ecological fuel—diesel oil and the energy necessary to “charge” an electric car. The length of bus lanes, on which electric car drivers can move without restrictions, is also important. Moreover, from the driver’s point of view, the availability and density of charging stations are extremely important.
For the development of the low-emission bus subsystem, from the point of view of society, the availability of public transport infrastructure, measured as the number of communication lines, the number of bus stops per inhabitant, and the length of the bus lane, plays an important role. Economic issues are also important, including fuel prices for all types of cars and the financial situation of residents. As in the case of the other two transport subsystems, the environmental indicator seems to be an important development variable of the electromobility strategy.
By analyzing the research results, conclusions can be drawn regarding the attributes necessary to develop an electromobility strategy. Looking at the electromobility strategy from a comprehensive perspective, we can see a balance in the hierarchy of sustainable urban mobility orders. In three groups, the indicator taking into account the price of energy and monthly wages, as well as taking into account emissions related to transport, is repeated. Therefore, these are the most important and priority ones for the development of electromobility strategies in cities. Therefore, five indicators are necessary to build the ideal, desired sustainable mobility management model in terms of the development of electromobility strategies in urban areas. The first one refers to the price of energy, which is extremely important when making decisions among residents and city authorities about the electrification of private vehicles and public transport. The second one refers to the financial situation of city residents, which is important from the point of view of the still high price of purchasing an electric car compared to a traditional one. Next, they concern care for the natural environment, which is a natural consequence of the operation of low-emission vehicles. Therefore, they can be considered the main determinants of the development of electromobility strategies in cities. The general approach, taking into account the level of factors and indicators, of the concept of electromobility strategy is shown in Figure 2.
A comprehensive approach to activities and factors from the perspective of the macro- and micro-environment and a set of indicators for sustainable urban mobility located in the area of three orders, economic, social, and environmental, influencing the development of electromobility strategies in the city, create a concept of the development of electromobility strategies taking into account sustainable mobility, are presented in Figure 3.
Coherence in the development of electromobility strategies in cities is a complex and multidimensional process. It is characterized by a multitude of entities influencing the development of electromobility (subject complexity), as well as a multifaceted multiplicity of factors that build it (factor complexity). The effectiveness of cooperation between stakeholders, determinants occurring in the micro-environment and macro-environment, and specific indicators of sustainable urban mobility requires cooperation on three levels simultaneously (strategy, factors, and indicators) so that the electromobility strategy can develop.
In the structure of the proposed concept, both micro and macro approaches have been identified at the level of factors at level II. In the first perspective, the development of electromobility strategies is influenced by administrative, legal, and infrastructural determinants. At the local level, all types of legislative and tax support seem to be extremely important, as they will provide details and development of national and international documents. Solutions reflected in the education system, mainly at the level of universities, will also play an important role. Supporting the development of car sharing at the local level will have a positive impact on the development of electromobility strategies in two ways. Firstly, the vehicles used in this solution should be mainly electric and hybrid cars. Secondly, this service reduces the external costs of transport by limiting the number of cars used. This includes as many specific infrastructure solutions as possible in a given city, making it easier for residents to use electric cars, i.e.,
  • The number of free parking spaces,
  • The number of public stations and charging points,
  • The availability of mobile programming enabling the use of electric vehicles,
  • With the ability to use bus lanes combined with appropriate promotion tailored to the target group for electric vehicles, they will facilitate the development of electromobility strategies.
Macro-environmental factors significantly influence the development of the examined strategy. In the proposed concept, these factors are categorized into six groups that interconnect. Consistency in political actions at the international, national, and local levels is crucial for implementing solutions and facilities for the electromobility market and enforcing adopted standards and limits. Additionally, when integrating electromobility into urban areas, it is essential to clearly identify the target group for each proposal. Only such action will enable the actual development of the market, in accordance with the assumed forecasts included in the Electromobility Development Plan [32]. The most important task of this plan is to achieve 1 million electric cars in Poland by 2025. Fulfillment of this assumption would allow specific environmental benefits related to the reduction in transport pollutant emissions in cities in Poland to be obtained, which would have a positive impact on the health and quality of life of residents, as well as reducing the country’s energy dependence by reducing the demand for liquid fuels and, consequently, inducing a decrease in the volume of crude oil imports, which given the current political and economic situation around the world seems to be a very important, if not the most important, determinant. At the beginning of 2023, there were 32,555 electric cars registered in Poland and 31,146 models with hybrid drive [33] and this is only 3.25% of the target plan of 1 million electric cars.

5. Conclusions

Recently, several global phenomena, including the COVID-19 pandemic, rising inflation, and armed conflicts, have disrupted daily life, diminished residents’ comfort, limited access to various services, and impacted the operations of local government institutions. The pandemic also altered how residents perceive urban spaces, which should now be designed to encourage outdoor activity, as people’s health awareness has significantly increased. The significant importance attached to health is combined with the permanently increasing ecological awareness of residents and higher standards set for local authorities in the area of the urban environment, such as air quality and air pollution. Education at the national and local level in the field of electromobility, about its usefulness and impact on important values for society, as well as about technical aspects of operation, available solutions, and facilities, also seems to be an important aspect. Coherence in the development of electromobility strategies in cities is a complex and multidimensional process. It is characterized by a multitude of entities influencing the development of electromobility (subject complexity), as well as a multifaceted multiplicity of factors that build it (factor complexity). The effectiveness of stakeholder cooperation, determinants occurring in the micro-environment and macro-environment, and specific indicators dedicated to the three transport subsystems so that the electromobility strategy can develop. The main limitation of the work was the completion of the linear regression for the year 2022 due to the lack of full available data for 2023, as well as the omission from the study of other means of urban micromobility, such as scooters, which will be included in subsequent studies.

Author Contributions

Conceptualization, A.P. and T.W.; methodology, A.P. and T.W.; software, A.P. and T.W.; validation, A.P. and T.W.; formal analysis, A.P. and T.W.; investigation, A.P. and T.W.; resources, A.P. and T.W.; data curation, A.P. and T.W.; writing—original draft preparation, A.P. and T.W.; writing—review and editing, A.P. and T.W.; visualization, A.P. and T.W. All authors have read and agreed to the published version of the manuscript.

Funding

This research was co-financed by the Minister of Science under the “Regional Excellence Initiative”.

Data Availability Statement

The data presented in this study are available on request from the corresponding author.

Conflicts of Interest

The authors declare no conflicts of interest.

References

  1. Ulewicz, R.; Siwiec, R.; Pacana, A. Sustainable Vehicle Design Considering Quality Level and Life Cycle Environmental Assessment (LCA). Energies 2023, 16, 8122. [Google Scholar] [CrossRef]
  2. Xiao, M.; Peng, X. Decomposition of Carbon Emission Influencing Factors and Research on Emission Reduction Performance of Energy Consumption in China. Front. Environ. Sci. 2023, 10, 1096650. [Google Scholar] [CrossRef]
  3. Khanam, T.; Rahman, A.; Xu, X.; Mola-Yudego, B.; Moula, M.M.E.; Pelkonen, P. Assessing the Awareness and Willingness of European Experts to Reduce Their Carbon Footprint in Everyday Consumption. Environ. Impact Assess. Rev. 2022, 97, 106889. [Google Scholar] [CrossRef]
  4. Pacana, A.; Czerwińska, K. Indicator Analysis of the Technological Position of a Manufacturing Company. Prod. Eng. Arch. 2023, 29, 162–167. [Google Scholar] [CrossRef]
  5. Wolniak, R. European Union Smart Mobility–Aspects Connected with Bike Road System’s Extension and Dissemination. Smart Cities 2023, 6, 1009–1042. [Google Scholar] [CrossRef]
  6. Kuzior, A.; Sira, M.; Brozek, P. Using Blockchain and Artificial Intelligence in Energy Management as a Tool to Achieve Energy Efficiency. Virtual Econ. 2022, 5, 69–90. [Google Scholar] [CrossRef] [PubMed]
  7. Jing, Q.-L.; Liu, H.-Z.; Yu, W.-Q.; He, X. The Impact of Public Transportation on Carbon Emissions—From the Perspective of Energy Consumption. Sustainability 2022, 14, 6248. [Google Scholar] [CrossRef]
  8. Alves, C.; Ferrão, P.M.C.; Silva, A.J.; Reis, L.G.; Freitas, M.; Rodrigues, L.B.; Alves, D.E. Ecodesign of Automotive Components Making Use of Natural Jute Fiber Composites. J. Clean. Prod. 2010, 18, 313–327. [Google Scholar] [CrossRef]
  9. Moro, A.; Lonza, L. Electricity Carbon Intensity in European Member States: Impacts on GHG Emissions of Electric Vehicles. Transp. Res. D Transp. Environ. 2018, 64, 5–14. [Google Scholar] [CrossRef] [PubMed]
  10. Kuzior, A.; Postrzednik-Lotko, K.A.; Postrzednik, S. Limiting of Carbon Dioxide Emissions through Rational Management of Pro-Ecological Activities in the Context of CSR Assumptions. Energies 2022, 15, 1825. [Google Scholar] [CrossRef]
  11. Główny Urząd Statystyczny. Available online: https://stat.gov.pl/obszary-tematyczne/ludnosc/ludnosc/powierzchnia-i-ludnosc-w-przekroju-terytorialnym-w-2020-roku,7,17.html (accessed on 5 January 2023).
  12. OECD. Indicators for the Integration of Environmental Concerns into Transport Policies. Available online: https://one.oecd.org/document/ENV/EPOC/SE(98)1/FINAL/en/pdf (accessed on 10 November 2022).
  13. European Environment Agency. Transitions Towards a More Sustainable Mobility System. TERM 2016: Transport Indicators Tracking Progress towards Environmental Targets in Europe. Available online: https://www.eea.europa.eu/publications/term-report-2016 (accessed on 7 November 2021).
  14. Transportation Research Board. A Guidebook for Developing a Transit Performance—Measurement System. Available online: https://onlinepubs.trb.org/onlinepubs/tcrp/tcrp_report_88/guidebook.pdf (accessed on 7 November 2021).
  15. United Nations. Transforming Our World: The 2030 Agenda for Sustainable Development. Available online: https://sdgs.un.org/2030agenda (accessed on 7 November 2021).
  16. Frei, F. Sampling mobility index: Case study in Assis–Brazil. Transp. Res. Part A Policy Pract. 2006, 40, 792–799. [Google Scholar] [CrossRef]
  17. Costa, P.B.; Morais Neto, G.C.; Bertolde, A.I. Urban Mobility Indexes: A Brief Review of the Literature. Transp. Res. Procedia 2017, 25, 67. [Google Scholar] [CrossRef]
  18. Travisi, C.M.; Camagni, R.; Nijkamp, P. Impacts of Urban Sprawl and Commuting: A Modelling Study for Italy. J. Transp. Geogr. 2010, 18, 3. [Google Scholar] [CrossRef]
  19. Lima, J.P.; da Silva Lima, R.; da Silva, A.N.R. Evaluation and Selection of Alternatives for the Promotion of Sustainable Urban Mobility. Procedia–Soc. Behav. Sci. 2014, 162, 408–418. [Google Scholar] [CrossRef]
  20. Silva, A.N.R.; Costa Silva, M.; Ramos, R.A.R. Development and Application of I_SUM—An Index of Sustainable Urban Mobility. In Proceedings of the 89th Transportation Research Board Annual Meeting, Washington, DC, USA, 10–14 January 2010. [Google Scholar]
  21. Lautso, K. The SPARTACUS System for Defining and Analysing Sustainable Urban Land Use and Transport Policies; Springer: Berlin/Heidelberg, Germany, 2003. [Google Scholar]
  22. Lautso, K.; Spiekermann, K.; Wegener, M.; Sheppard, I.; Steadman, P.; Martino, A.; Domingo, R.; Gayda, S. Evaluating Urban Sustainability Using Land-Use Transport Interaction Models. Eur. J. Transp. Infrastruct. Res. 2004, 4, 56–87. [Google Scholar]
  23. Litman, T. Well Measured: Developing Indicators for Comprehensive and Sustainable Transport Planning; Victoria Transport Policy Institute: Victoria, BC, Canada, 2007. [Google Scholar]
  24. Litman, T. Sustainable Transportation Indicators: A Recommended Research Program for Developing Sustainable Transportation Indicators and Data. In Proceedings of the Transportation Research Board Annual Meeting, Washington, DC, USA, 13–17 January 2008. [Google Scholar]
  25. Litman, T. Well Measured: Developing Indicators for Sustainable and Livable Transport Planning; Victoria Transport Policy Institute: Victoria, BC, Canada, 2016. [Google Scholar]
  26. Van Audenhove, F.J.; Korniichuk, O.; Dauby, L.; Pourbaix, J. The Future of Urban Mobility 2.0. Imperatives to Shape Extended Mobility Ecosystems of Tomorrow; Arthur D. Little: Boston, MA, USA, 2014; pp. 10–25. [Google Scholar]
  27. Bartłomiejczyk, M.; Kołacz, R. The reduction of auxiliaries power demand: The challenge for electromobility in public transportation. J. Clean. Prod. 2020, 252, 22. [Google Scholar] [CrossRef]
  28. Połom, E. E-revolution in post-communist country? A critical review of electric public transport development in Poland. Energy Res. Soc. Sci. 2021, 80, 9. [Google Scholar] [CrossRef]
  29. Fernández, R.A. Stochastic analysis of future scenarios for battery electric vehicle deployment and the upgrade of the electricity generation system in Spain. J. Clean. Prod. 2021, 316, 21. [Google Scholar] [CrossRef]
  30. Faraway, J.J. Practical Regression and Anova Using R; University of Bath: Bath, UK, 2002; pp. 15–77. [Google Scholar]
  31. Shmueli, G. To Explain or to Predict? Stat. Sci. 2010, 25, 289–310. [Google Scholar] [CrossRef]
  32. Biuletyn Informacji Publicznej Ministerstwa Energii. Plan Rozwoju Elektromobilności w Polsce. Available online: https://www.nik.gov.pl/plik/id,23045,vp,25751.pdf (accessed on 7 November 2021).
  33. Bechmark. Available online: https://www.benchmark.pl/aktualnosci/samochody-elektryczne-w-polsce-2021.html (accessed on 22 January 2023).
Figure 1. Stages of indicator selection. Source: Own elaboration.
Energies 17 03167 g001
Figure 2. Electromobility strategy in the city—overview. Source: Own elaboration.
Energies 17 03167 g002
Figure 3. Electromobility strategy in the city—a detailed approach taking into account macro- and micro-environmental factors and indicators of sustainable urban mobility. Source: Own elaboration.
Energies 17 03167 g003
Table 1. Number of inhabitants of cities in Poland.
CityNumber of Inhabitants
Warszawa1,792,718
Kraków780,796
Łódź667,923
Wrocław641,201
Poznań530,464
Gdańsk470,633
Szczecin396,472
Bydgoszcz341,692
Lublin337,788
Białystok296,401
Source: Own elaboration based on [11].
Table 2. Indicators and measures of sustainable urban mobility (literature review).
IndicatorAuthorTitleSourceSubject of Study
OECD indicators for the integration of environmental concerns into transport policiesWorking Group on the State of the Environment [12]Indicators for the Integration of Environmental Concerns into Transport PoliciesENV/EPOC/SE 1/FINAL, 1999The metrics are grouped into three groups reflecting the transport sector and its impact on the environment
TERM (Transport and Environment Reporting Mechanism)European Commission; European Environment Agency; Eurostat [13]Transitions Towards a More Sustainable Mobility System. TERM 2016: Transport Indicators Tracking Progress Towards Environmental Targets in EuropeEEA Report No. 34/2016, Luxemburg, 2016A set of indicators to monitor the progress of the common environment and transport policy
Community
Measure
Transportation Research Board [14]A Guidebook for Developing a Transit Performance—Measurement SystemWashington, 2003It measures the proportion of public subsidies for the development and operation of particular types of transport
Sustainable Development Goal indicatorsUnited Nations [15]Transforming our World: The 2030 Agenda for Sustainable DevelopmentA/Res/70/1, 2015A set of measures and indicators for monitoring the implementation of the 2030 Agenda for Sustainable Development
SMI—Sampling Mobility IndexFrei, F. [16]Sampling mobility index: Case study in Assis–BrazilTransportation Research Part A: Policy and Practice 40(9), 2006A model for assessing mobility in medium-sized cities in Brazil
IGEMUS—Strategic Management Index for Sustainable Urban MobilityCosta, P.B.; Morais Neto, G.C.; Bertolde, A.I. [17]Urban Mobility Indexes: A Brief Review of the LiteratureTransportation Research Procedia, 25, 2017A model for strategic management for sustainable urban mobility
Mobility Impact Index (MII)Travisi, C.M.; Camagni, R.; Nijkamp, P. [18]Impacts of Urban Sprawl and Commuting: A Modelling Study for ItalyJournal of Transport Geography, 18(3), 2010Analysis of the impact of mobility on the environment
I_SUMLima, J.P.; da Silva Lima, R.; da Silva, A.N.R. [19]Evaluation and Selection of Alternatives for the Promotion of Sustainable Urban MobilityProcedia—Social and Behavioral Sciences, 162, 2014Assessment of medium-sized centers in terms of sustainable mobility
Silva, A.N.R.; Costa Silva, M.; Ramos, R.A.R. [20]Development and Application of I_SUM—an Index of Sustainable Urban Mobility89th Transportation Research Board Annual Meeting, 2010
Measures of the PROPOLIS projectLautso K. [21]The SPARTACUS System for Defining and Analysing Sustainable Urban Land Use and Transport PoliciesSpringer, Berlin, Heidelberg, 2003Environmental, social, and economic measures of transport
Lautso, K.; Spiekermann, K.; Wegener, M.; Sheppard, I.; Steadman, Ph.; Martino, A.; Domingo, R.; Gayda, S. [22]Planning and Research of Policies for Land Use and Transport for Increasing Urban Sustainability [PROPOLIS]Brussels, 2004
Measures and indicators that should be taken into account in the process of planning and managing transport, in particular, public transportLitman T. [23]Well Measured: Developing Indicators for Comprehensive and Sustainable Transport PlanningVictoria Transport Policy Institute Canada, 2007Measures and indicators for the planning and management of transport, in particular, public transport
Litman T. [24]Litman T. [2008], Sustainable Transportation Indicators: A Recommended Research Program for Developing Sustainable Transportation Indicators and Data, Transportation Research Board Annual Meeting.Litman T. [2008]/Sustainable Transportation Indicators: A Recommended Research Program for Developing Sustainable Transportation Indicators and Data, Transportation Research Board Annual Meeting
Litman T. [2016]. Well Measured: Developing Indicators for Sustainable and Livable Transport Planning, Victoria Transport Policy Institute Canada 2016 [25]Litman T. [2016], Well Measured: Developing Indicators for Sustainable and Livable Transport Planning, Victoria Transport Policy Institute Canada 2016Litman T. [2016], Well Measured: Developing Indicators for Sustainable and Livable Transport Planning, Victoria Transport Policy Institute Canada 2016
Urban Mobility IndexVan Audenhove, F.J.; Korniichuk, O.; Dauby, L.; Pourbaix J [26]The Future of Urban Mobility 2.0. Imperatives to Shape Extended Mobility Ecosystems of TomorrowA.D. Little, 2014Determining which transport solutions are closest to becoming emission-free
Source: Own elaboration based on [12,13,14,15,16,17,18,19,20,21,22,23,24,25,26].
Table 3. Catalog of sustainable urban mobility indicators influencing the development of electromobility strategies, along with an explanation.
IndicatorExplanation
Registered unemployment rate (%)Share of the registered unemployed in the professionally active civilian population, i.e., excluding employees of budgetary units conducting activities in the field of national defense and public security in the population of a given city.
GDP per capitaThe ratio of the value of gross domestic product at current prices to the population of a given city.
Average monthly salary per inhabitant (PLN)The ratio of the sum of gross personal salaries, fees paid to certain groups of employees for work resulting from employment contracts, payments for participation in profit or balance surplus in cooperatives, and additional annual remuneration for employees of public sector units to the average number of employees in a given period, after eliminating people performing home work and those employed abroad, to the population of a given city.
Disposable income per capita (PLN)The sum of current household income from individual sources, reduced by advances on personal income tax paid by the payer on behalf of the taxpayer, taxes on income from property, taxes paid by self-employed persons, including representatives of free professions and persons using farms and individuals in agriculture, and social and health insurance contributions, depending on the population of a given city.
The ratio of the population of an urban agglomeration to its urbanized areaPopulation by actual place of residence per 1 km2.
The ratio of the cost of a 100 km trip by private means of transport to the price of a monthly ticket for public transport in the agglomerationThe ratio of the average cost of traveling by passenger car, taking into account average fuel consumption and fuel price per 100 km, to the price of a monthly ticket (for buses) in a given city.
Average annual concentration value PM2.5Suspended dust with a diameter of no more than 2.5 μm, the main source of which is road transport.
Average annual concentration value PM10PM10 suspended dust is a mixture of solid particles and liquid droplets with a diameter not exceeding 10 μm of that remaining in the air. The main source of airborne emissions is road transport, especially from diesel vehicles without particulate filters.
Average annual concentration value NOxThe average annual value of nitrogen oxide concentration is the most harmful component of car exhaust gases. Most nitrogen oxides are produced in diesel engines.
Percentage of residents exposed to excessive noise (%)Percentage of residents exposed to noise levels harmful to health, above 70 dB. Noise is sounds with a frequency above 16 Hz, undesirable and bothersome for humans, which has a negative impact on the hearing organ and other senses and often disrupts the proper functioning of the entire body. Traditionally powered passenger cars emit 74–85 dB of noise and buses emit 86–92 dB.
Number of bus stops per 1 inhabitantThe number of stopping places for public transport vehicles, marked with appropriate road signs.
Dedicated bus lane in km in relation to the city areaThe length of the part of the road designated and separated from the road by longitudinal road signs for buses and electric cars in relation to the area of a given city.
The level of congestionThe overall congestion level expressed as a percentage represents additional travel time.
Price of energy per capitaThe average sales price of electricity on the competitive market includes energy sales (sales volume and value of energy sold) carried out by producers and trading companies in competitive segments of the national wholesale electricity market in relation to the number of inhabitants of a given city.
Number of charging stations in relation to the city areaThe number of prepared stations equipped with appropriately designed chargers powered by electricity from the local power grid to which owners connect their electric vehicles to charge their batteries and are able to continue using the energy stored in them per square kilometer of a given city.
Number of low-emission buses per capitaThe number of buses refueled with other types of fuel, including mixtures (fuel–oil), compressed natural gas (CNG), liquefied natural gas (LNG), hydrogen, biodiesel, ethanol, gasoline and electricity, diesel oil and energy electricity, and electricity, in relation to the number of inhabitants of a given city.
Number of electric cars per capitaThe number of energy-powered cars per number of inhabitants of a given city.
Number of hybrid cars per capitaThe number of hybrid cars per number of inhabitants of a given city.
Cycle paths per area per 10 thousand populationThe length of roads or parts thereof intended for bicycle traffic, marked with appropriate road signs.
Number of public bicycles per capitaThe ratio of the number of public bikes operating in the bike-sharing system in a given city to the number of its inhabitants.
Public transport lines per 1000 inhabitantsThe ratio of the number of available public transport lines in a given city to the number of inhabitants.
Source: Own elaboration based on expert research.
Table 4. Significance tests, effect sizes, and powers for the variable y1—number of electric and hybrid cars per capita.
Variable—xiFModel
Coefficient bi
p-Value t-Test
x2—energy price per capita28.42−13.8301<0.001−5.33
x4—number of charging stations in relation to city area11.540.00220.0023.40
x10—average annual value of PM2.5 concentration13.44−0.0002<0.001−3.67
x15—price of diesel fuel9.630.00120.0043.10
x3—dedicated bus lane in km in relation to city area8.360.00410.0062.89
x18—monthly salary per capita6.470.00020.015−2.54
x21—year (number)30.770.0023<0.0015.55
Source: Own elaboration.
Table 5. Significance tests, effect sizes, and powers for the variable y2—number of public bicycles per capita.
Variable—xiFModel
Coefficient bi
p-Value t-Test
x1—the ratio 4.47−0.550610.041−2.11
x2—energy price per capita4.652.305610.0382.16
x10—average annual value of PM2.5 concentration4.650.006880.038−2.16
x6—bicycle lanes in relation to city area21.940.00088<0.0014.68
x12—emissions related to transportation activities NOx9.120.000090.0053.02
x18—monthly salary per capita13.58−0.000010.001−3.69
x19—GDP per capita25.84−0.00002<0.0015.08
x21—year (number)10.740.00310.0073.14
Source: Own elaboration.
Table 6. Significance tests, effect sizes, and powers for the variable y3—the number of low-emission buses per capita.
Variable—xiFModel
Coefficient bi
p-Value t-Test
x2—energy price per capita10.750.774470.0023.28
x3—dedicated bus lane in km in relation to the area of the city72.940.00413<0.001−8.54
x5—number of bus stops per capita 54.99−0.42413<0.001−7.42
x6—bicycle lanes in relation to city area22.84−0.00015<0.001−4.78
x9—public transportation lines per 1000 residents32.530.00046<0.0015.70
x11—average annual value of PM10 concentration9.57−0.000130.004−3.09
x14—price of gasoline21.770.00047<0.0014.67
x15—price of diesel fuel25.960.00061<0.001−5.10
x16—registered unemployment rate144.70−0.00021<0.001−12.03
x18—monthly salary per capita21.240.00002<0.001−4.61
x21—year (number)19.580.00019<0.0014.43
Source: Own elaboration.
Table 7. Measures of regression model goodness of fit.
ModelR2Vsε
y1—number of electric and hybrid cars per capita 0.907412.48%
y2—number of public bicycles per capita0.897913.14%
y3—number of public transportation vehicles per capita0.96137.27%
Source: Own elaboration.
Table 8. Indicators of sustainable urban mobility affecting the development of the public bicycle transport subsystem.
Sustainable Development OrdersIndicator
Social The ratio of the total number of cars in car-sharing systems in the urban agglomeration to the number of inhabitants of this area
Bicycle paths in relation to the city area
EconomicMonthly salary per inhabitant
GDP per capita
Energy price per capita
EnvironmentEmissions related to transport activities NOx
Average annual value of PM2.5 concentration
Source: Own elaboration.
Table 9. Sustainable urban mobility indicators influencing the development of the low-emission car transport subsystem.
Sustainable Development OrdersIndicator
SocialNumber of charging stations in relation to the city area
Dedicated bus lane in km in relation to the city area
EconomicMonthly salary per inhabitant
Diesel price
Energy price per capita
EnvironmentAverage annual concentration value PM2.5
Source: Own elaboration.
Table 10. Indicators of sustainable urban mobility affecting the development of the low-emission bus transport subsystem.
Sustainable Development OrdersIndicator
SocialPublic transport lines per 1000 inhabitants
Dedicated bus lane in km in relation to the city area
Number of bus stops per 1 inhabitant
Bicycle paths in relation to the city area
EconomicDiesel price
Energy price per capita
Gasoline price
Registered unemployment rate
Monthly salary per inhabitant
EnvironmentAverage annual concentration value PM10
Source: Own elaboration.
Disclaimer/Publisher’s Note: The statements, opinions and data contained in all publications are solely those of the individual author(s) and contributor(s) and not of MDPI and/or the editor(s). MDPI and/or the editor(s) disclaim responsibility for any injury to people or property resulting from any ideas, methods, instructions or products referred to in the content.

